danish ship finance annual report 2017€¦ · danish ship finance annual report 2017 danish ship...
TRANSCRIPT

1
DA
NIS
H S
HIP
FIN
AN
CE
AN
NU
AL
RE
PO
RT
20
17
CVR NO. 27 49 26 49
Danish Ship FinanceAnnual Report 2017
DANISH SHIP FINANCE A/S (DANMARKS SKIBSKREDIT A/S)
Sankt Annæ Plads 3 / DK-1250 Copenhagen K
Tel. +45 33 33 93 33 / Fax +45 33 33 96 66 / CVR no. 27 49 26 49
[email protected] / www.shipfinance.dk

2

3
Letter to stakeholders
Danish Ship Finance at a glance
Financial highlights
Trends in 2017
Income statement and balance sheet
Outlook
Capital management
Liquidity management
Internal control and risk management systems
Credit risk
Market risk
Liquidity risk
Operational risk
Bond issuance
Share capital
Organisation, governance and corporate social responsibility
Human resources
Statement by the Executive Board and the Board of Directors
Independent auditor’s report
Income statement
Balance sheet
Statement of changes in equity
List of notes
Notes
Management and directorships
Management’s Report
4
6
7
10
16
20
22
26
28
30
38
40
42
44
46
48
54
Statement and Reports
56
57
Financial Statements
62
63
64
65
66
103
Table of contents

4
Letter to stakeholders
Dear stakeholders,
Danish Ship Finance has ended its first full financial year under the new ownership, which took effect on 15 November 2016. Immediately after the change of ownership, we implemented an extensive strategic plan, setting the course for the company for the next few years. Our core business remains lending to Danish and international first-class shipping companies against ship mortgages, but we will also introduce several new initiatives, drawing on Danish Ship Finance’s unique position in ship financing.
Stable access to funding is fundamental to our business and requires a good credit rating. As expected, Standard & Poor’s (S&P) reviewed its ratings following the change in ownership, and we were pleased to see that in spring 2017 S&P affirmed its BBB+ issuer credit rating and its A rating for the issued bonds. As a result, Danish Ship Finance has been able to step up its focus on lending growth and reverse the declining trend in the loan book seen in recent years. Despite the weakening of the USD in the first few months of 2018, we expect growth in lending measured in DKK, which is the company’s reporting currency. We are experiencing strong interest in our products among both existing and new customers and were pleased to note a 10% increase in the number of customers in 2017. Competition for the most creditworthy customers remains fierce, even though several international banks’ appetite for ship financing has waned. Lending margins are largely unchanged, but it is hoped that the Basel Committee’s proposals will result in regulatory measures that will strengthen Danish Ship Finance’s competitive position, particularly with respect to increased capital requirements for our primary competitors.
Danish Ship Finance’s prudent risk profile has resulted in very moderate credit losses historically despite the volatile nature of the shipping industry. Write-offs over a ten-year period are largely on a par with the average recorded for Danish mortgage banking. A number of shipping segments remain under pressure today, leading to new loan impairment charges in 2017 – not least in the Offshore segment. Danish Ship Finance has a defined policy of work-ing closely with customers in that are challenged by the market conditions to find sustainable solutions. Given our in-depth knowledge of the industry and long-term commitment, we often succeed in finding solutions that are satisfactory to all stakeholders.
Danish Ship Finance maintains high liquidity reserves, and the return on liquid assets has exceeded the benchmark within the prescribed limits. We have also taken advantage of the relatively favourable bond markets to obtain more long-term funding, increasing the average time-to-maturity of our bonds by about two years during 2017 to approximately 7 years. We now find ourselves in the very comfortable position of our funding having a longer time-to-maturity than lending. Also, the total capital ratio is just below 20%. Danish Ship Finance is thus well-placed to maintain or increase the level of activity irrespective of any turbulence in the financial markets.
Our company has a stable and experienced group of employees, and the latest employee opinion survey conducted in December 2017 showed a high level of employee satisfaction. In 2017 and 2018, we will increase the headcount slightly to ensure that we have the right resources to implement our planned strategic initiatives.
This year will see the strategic and business development process launched in 2017 continuing. Thus, we expect to see further growth in new customers as well as increased lending and net interest income, while we will also focus on customers with whom we have developed deeper relationships over a number of years.
Eivind KoldingChairman
Erik I. LassenChief Executive Officer

5
The objective of Danish Ship Finance is to provide ship financing in Denmark. In addition, the company provides ship financing on the international market, so long as such activities do not unnecessarily limit the company’s Danish operations.
Danish Ship Finance provides short-term and long-term funding for shipowners in all stages of the shipping cycle and it endeavours to be a competent and trustworthy business partner to its customers and financial counterparties as well as other stakeholders.
Danish Ship Finance aims to obtain satisfactory financial results for its owners and is therefore dedicated to creating value based on consistent focus on high credit quality and appropriate diversification in the loan portfolio.
Danish Ship Finance is managed on the basis of the following vision:
Danish Ship Finance is to be the most recognised and stable provider of financing for reputable shipowners.
Objective and vision

6
Danish Ship Finance is a ship finance institute which uses a simple and effective business model for financing vessels against a first lien mortgage. The company is supervised by the Danish Financial Supervisory Authority (FSA).
Danish Ship Finance provides financing for selected Danish and non-Danish shipowners.
Financial performance and events during the yearNet profit for the year was DKK 334 million, up from DKK 188 million in 2016. The improvement was mainly attributable to significantly lower levels of loan impairment charges.
At 31 December 2017, loans totalled DKK 34.5 billion, total assets were DKK 58.2 billion and equity was DKK 9.3 billion, including proposed dividends for the financial year. The company had first lien mortgages on 562 vessels at the end of 2017.
The total capital ratio was 19.7% at 31 December 2017 after proposed dividends. The tier 1 capital ratio was also 19.7%. After recognition of the combined capital buffer requirement, the excess capital adequacy was 8.9 percentage points.
In 2017, bond buybacks totalled DKK 14.9 billion. New bond issues in 2017 totalled nominally DKK 19.2 billion with an average maturity of 6.7 years, increasing the average maturity of bonds by 2.3 years relative to 2016. The liquidity position thus remains robust during the financial year 2017.
The company expects to pay dividends of DKK 237 million to its shareholders, of which the Danish Maritime Fund will receive DKK 50 million.
Danish Ship Finance at a glance

7
Financial highlights
Key figures, DKK million 2017 2016 2015 2014 2013 Net interest income from lending 500 589 623 565 541Net interest income from finance activities 135 228 242 255 350Total net interest income 635 817 865 820 891Total net interest and fee income 655 849 906 934 937Market value adjustments 37 124 (177) 123 (25)Staff costs and administrative expenses (141) (120) (113) (98) (97)Loan impairment charges (122) (610) (46) 1,103 (166)Profit before tax 427 241 569 2,061 647Net profit for the year 334 188 413 1,568 477 Loans 34,492 39,811 43,171 43,347 42,383Issued bonds 42,467 42,352 45,067 45,077 48,657Equity 9,307 9,164 10,378 11,146 9,983Total assets 58,161 62,621 64,873 69,374 67,222
Key ratios 2017 2016 2015 2014 2013 Net interest and fee income from lending (DKKm) 520 621 664 679 586Return on equity after tax (%) 3.6 1.9 3.8 14.8 4.8Return on finance activities (%)* 3.1 3.0 0.3 2.8 2.9Common equity tier 1 capital (DKKm) 8,930 8,781 9,896 9,682 9,312Common equity tier 1 capital ratio (%) 19.7 17.2 17.3 16.4 17.0Internal capital adequacy requirement incl. countercyclical capital buffer (%) 10.8 10.7 8.9 8.5 8.5Cost/income ratio (%)** 19.0 11.9 15.0 9.0 10.1Equity as % of lending 27.0 23.0 24.0 25.7 23.6 Write-offs on loans as % of gross lending 0.3 0.2 0.2 0.1 0.1Total allowance account as % of loans 7.0 5.9 4.3 4.3 6.7Weighted loan-to-value ratio after loan impairment charges (%) 57 66 64 59 62Proportion of loans covered within 60% of market value (%) 95 88 91 95 92
*) Return on finance activities was calculated exclusive of return from shares and foreign currency.**) The calculation of the cost/income ratio does not include loan impairment charges.
Unless otherwise indicated, the ratios were calculated in accordance with Appendix 5 of the Danish FSA’s instructions for financial reports for credit institutions, etc.

8
NET PROFIT FOR THE YEAR
DKKm
Net profit for the year
2013 2014 2015 2016 2017
1,600
1,200
800
400
0
NET INCOME FROM LENDING
2013 2014 2015 2016 2017
DKKm
Net interest income from lending including fee
1,000
750
500
250
0
NET INCOME FROM FINANCE ACTIVITIES
DKKm
Net income from finance activities including market value adjustments and dividends on shares
2013 2014 2015 2016 2017
600
450
300
150
0

9
COST/INCOME RATIO
%
Cost/Income ratio (%)
2013 2014 2015 2016 2017
40
30
20
10
0
LOANS AND TOTAL CAPITAL RATIO
2013 2014 2015 2016 2017
DKKm
Loans (left axis)
Total capital ratio (right axis)
60,000
45,000
30,000
15,000
0
ACCUMULATED LOAN IMPAIRMENT CHARGES AND WRITE-OFFS
DKKm
Accumulated loan impairment charges
Write-offs
2013 2014 2015 2016 2017
3,200
2,400
1,600
800
0
%
20
15
10
5
0

10
The nascent upturn in the global economy accelerated in 2017. During the year, the International Monetary Fund (IMF) revised up its growth forecast for 2017 and made a final estimate of 3.7%, which was 0.5 percentage points higher than in 2016.
The improvement in the global economy was broad-based, with growth picking up across the Unit-ed States, Canada, the eurozone and Japan. The US economy is estimated to have expanded by 2.3% in 2017, against 1.5% in 2016, while growth in the EU was estimated at 2.4% in 2017, versus 1.8% in 2016. Growth in China and the emerging economies also edged up.
Following a weak 2016, world trade showed signs of a rebound in 2017, growing by an aggregate 3.6%, according to the World Trade Organisation. This was a 2.3 percentage point increase on 2016 when growth was historically low. Hence, world trade grew at the same pace as the global economy in 2017.
The growth in world trade should be seen in the context of the considerable geopolitical tensions prevailing in 2017.
Trends in 2017
11
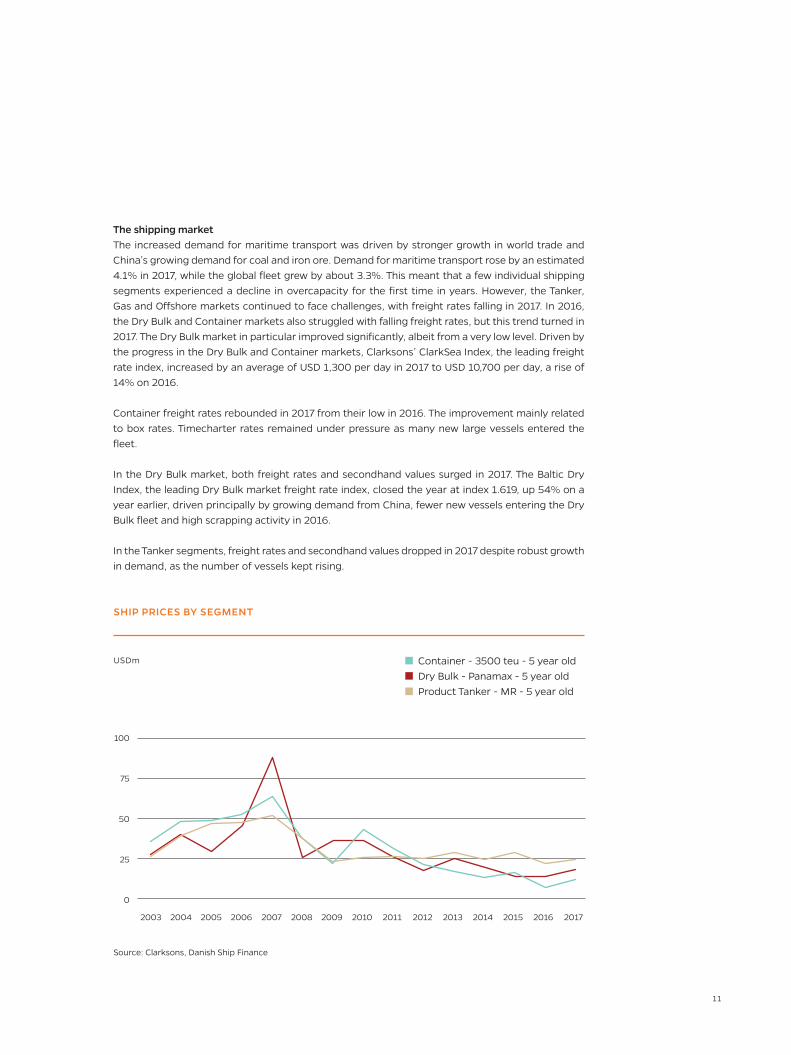
The shipping marketThe increased demand for maritime transport was driven by stronger growth in world trade and China’s growing demand for coal and iron ore. Demand for maritime transport rose by an estimated 4.1% in 2017, while the global fleet grew by about 3.3%. This meant that a few individual shipping segments experienced a decline in overcapacity for the first time in years. However, the Tanker, Gas and Offshore markets continued to face challenges, with freight rates falling in 2017. In 2016, the Dry Bulk and Container markets also struggled with falling freight rates, but this trend turned in 2017. The Dry Bulk market in particular improved significantly, albeit from a very low level. Driven by the progress in the Dry Bulk and Container markets, Clarksons’ ClarkSea Index, the leading freight rate index, increased by an average of USD 1,300 per day in 2017 to USD 10,700 per day, a rise of 14% on 2016.
Container freight rates rebounded in 2017 from their low in 2016. The improvement mainly related to box rates. Timecharter rates remained under pressure as many new large vessels entered the fleet.
In the Dry Bulk market, both freight rates and secondhand values surged in 2017. The Baltic Dry Index, the leading Dry Bulk market freight rate index, closed the year at index 1.619, up 54% on a year earlier, driven principally by growing demand from China, fewer new vessels entering the Dry Bulk fleet and high scrapping activity in 2016.
In the Tanker segments, freight rates and secondhand values dropped in 2017 despite robust growth in demand, as the number of vessels kept rising.
SHIP PRICES BY SEGMENT
USDm
Source: Clarksons, Danish Ship Finance
Container - 3500 teu - 5 year old Dry Bulk - Panamax - 5 year old Product Tanker - MR - 5 year old
2004 20052003 2006 2007 2008 2009 2010 2011 2012 2013 2014 2015 20172016
100
75
50
25
0

12
The Chemical Tanker market showed steady growth in demand, but the increasing supply of vessels put a damper on freight rates. Furthermore, the setback in the Product Tanker market made a num-ber of Product Tanker owners to turn to the lighter chemical cargoes for employment. This marginal impact on supply contributed to the more subdued development in freight rates.
In the LPG market, fleet growth increased sharply again in 2017. Consequently, the otherwise strong rise in demand could not prevent freight rates from declining further in 2017 from their already low level recorded in 2016.
The LNG market saw a significant improvement in freight rates in 2017. Demand far outpaced fleet growth, and longer distances in particular absorbed a large part of fleet capacity.
The Offshore segments continue to struggle with a dramatic decline in demand. Tumbling oil prices since 2014 have greatly reduced oil companies’ investment in new oil fields. With freight rates and secondhand values under pressure, 2017 brought a sharp increase in the number of vessels being laid up, causing a wave of restructuring among Offshore shipowners.
On balance, 2017 was yet another challenging year for international shipping, albeit with growth in two of the largest segments. Most segments in the shipping industry are still struggling to move up from the bottom of a very protracted economic cycle. On a positive note, world trade is growing in line with global GDP, and contracting for new vessels in general has declined. If scrapping activity remains high, several segments could see increasing freight rates and secondhand values in 2018.
TIMECHARTER RATE
USD PER DAY
Source: Clarksons, Danish Ship Finance
Container - 3500 teu - 1 year T/C Dry Bulk - Panamax - 1 year T/C Product Tanker - MR - 1 year T/C
60,000
45,000
30,000
15,000
0
2004 20052003 2006 2007 2008 2009 2010 2011 2012 2013 2014 2015 20172016

13
The financial marketOn the face of it, 2017 was a calm year financially. Events and information which could have affected the financial markets were quickly absorbed. The markets did not react noticeably to geopolitical events.
A major part of the explanation was central banks’ massive monetary easing programmes primarily in the United States, the eurozone and Japan, which pumped vast amounts of liquidity into the financial markets. Investment of this liquidity offset the negative price movements which would otherwise have been expected. The US Federal Reserve launched a minor sale of assets in 2017, but this was still eclipsed by purchases by the eurozone and Japan.
The Federal Reserve hiked its key policy rate three times in 2017 and is expected to do so again in 2018. However, the markets do not expect the key policy rates in the eurozone or Denmark to change in 2018. Yields were generally low in 2017 and in a tight range, with 10-year German govern-ment bond yields in the range of 0.3-0.6%. However, most yields rose slightly during 2017, driven by the higher key policy rates from the Federal Reserve.
The Danish bond market was characterised by foreign purchases of callable covered bonds in par-ticular. At the end of the year, foreign investors held about 30% of all Danish callable covered bonds. This was the largest foreign ownership share ever recorded. Japanese investors were among the largest foreign buyers of Danish covered bonds. Factors such as gains on the conversion from USD to DKK, positive yields and a high credit rating (AAA) have all contributed to making Danish covered bonds attractive to foreign investors. Purchases by foreign investors were one of the main reasons for the steadily declining credit spreads between Danish covered bonds and Danish government bonds throughout 2017.
The DKK/USD exchange rate dropped from 7.05 at the end of 2016 to 6.21 at the end of 2017. The decline was despite the key policy rate hikes from the Federal Reserve mentioned above which, viewed in isolation, would normally have strengthened the USD. The weakening of the USD in 2017 probably stemmed from the brighter growth prospects in Europe. In addition, clarification of the political situation in the Netherlands and France in particular boosted confidence in the European economy.

14
INTEREST MARGIN, LENDING
Spread to LIBOR Net margin after internal
cost allocation
%
The loan marketIn recent years, the number of active European lenders to the shipping industry has declined, while several of the remaining European lenders have reduced their lending capacity in shipping. This trend continued in 2017. The primary reason is deemed to be the loan impairments and write-offs incurred by many lenders as a result of the shipping crisis, thus rendering shipping less attractive than other industries. However increasing capital and regulatory requirements are likely to have played a part as well.
2017 was the year when it became evident that Asian lenders have become seriously involved in ship finance, particularly Chinese financial leasing companies. Hence, the trend towards ship finance in-creasingly moving from Europe to Asia is continuing.
Overall, the competitive situation is unchanged as regards the most creditworthy shipowning companies, which are still granted favourable terms. Credit margins and loan terms did not change noticeably in 2017.
2013 2014 2015 2016 2017
2.0
1.5
1.0
0.5
0,0

15
Activities during the yearIn 2017, loan offers with a counter value (year-end exchange rates) of DKK 10.3 billion were accepted, up from DKK 4.2 billion in 2016, and there was thus a significant increase in activity. Eight new customers were added, which is considered satisfactory. Income from the loans that these loan offers concern was up on 2016. The loan offers will result in loans being disbursed during the period 2017-2019.
Loans disbursed in 2017 amounted to DKK 6.9 billion, against DKK 4.6 billion in 2016.
The number of problem loans was unchanged relative to the end of 2016, but their volume measured as a percentage of total lending declined from 16.5% at the end of 2016 to 15.9% at the end of 2017.
Net write-offs for the year totalled DKK 98 million. Write-offs since the onset of the crisis in 2008 have thus remained low relative to lending.
Management changesIn June 2017, the number of members of the Board of Directors elected by the general meeting of shareholders increased from six to eight. Thor Jørgen Guttormsen, a member of the Board of Directors of Höegh Autoliners A/S, and Jacob Meldgaard, CEO of Torm A/S, joined the Board.
On 22 December 2017, it was announced that Michael Frisch had been appointed Head of Customer Relations and member of the Executive Board. He is expected to assume his position in April 2018. With the two existing Executive Board members, Erik I. Lassen, CEO, and Per Schnack, CFO, the Exec-utive Board will in future have three members.
New base prospectusIn October 2017, the company obtained permission from the Danish FSA to issue covered bonds (CB). In the same month, a new base prospectus was approved by the Danish FSA and published on Nasdaq Copenhagen. As a provision, the prospectus enables issuance of CB. This has been an op-tion under Danish law since the introduction of the rules on CB, but has only just been incorporated in the company’s base prospectus.
The company has not yet utilised the option to issue CB, but is monitoring for opportunities to di-versify its bond issuance.

16
Income statementNet profit for the year amounted to DKK 334 million, up 78% on 2016. The increase was attributable to a decline in loan impairment charges.
Net earnings from lending including fee income were DKK 520 million in 2017, down 16% on 2016. The decline in net earnings can be ascribed to reduced lending. Lending activity was relatively high, with loan offers made and accepted in excess of DKK 10 billion. However, as the majority of these loan offers were issued in the second half of 2017 and will not be disbursed until 2018 or later, their earnings impact will not be felt until then.
Ordinary repayments and loan prepayments of just under DKK 8 billion coupled with the fall in the USD/DKK exchange rate resulted in a decline in lending.
Net interest income from finance activities fell to DKK 135 million in 2017 from DKK 228 million in 2016. Net interest income from finance activities reflected the very low interest rate level still pre-vailing and the low coupon rates for the bonds that the company invests in on a continuous basis, and should be seen in the context of the market value adjustments from investing activities.
Market value adjustments of securities and foreign exchange generated income of DKK 37 million in 2017, compared with DKK 124 million in 2016. The gain was largely due to a contraction of the credit spread on the company’s portfolio of mortgage bonds. Return on the securities portfolio in 2017 was 3.1%, or DKK 358 million, which is considered satisfactory given the risks assumed and market developments.
Staff costs and administrative expenses rose to DKK 141 million in 2017, up nearly 18% on the previous year. A large part of the increase was due to expenses relating to external consultants and the introduction of incentive programmes, designed to underpin long-term value creation. The average number of employees (full-time equivalents) rose by two from 68 to 70.
Income statement and balance sheet

Loan impairment charges for the year totalled a net expense of DKK 122 million, which was 80% lower than the net expense in 2016 of DKK 610 million. The level of loan impairment charges in 2016 was exceptionally high on account of the crisis in the Offshore and Dry Bulk segments.
Net write-offs amounted to DKK 98 million in 2017, against DKK 89 million in 2016. Write-offs in absolute terms remained at a low level.
Tax for the year represented an expense of DKK 95 million against an expense of DKK 57 million in 2016. For 2017, the expense in the income statement translated into an effective tax rate of 22.3% versus 23.6% in 2016.
Balance sheet and capital structureTotal assets declined to DKK 58.2 billion from DKK 62.6 billion at the end of 2016.
Lending calculated at amortised cost less loan impairment charges fell to DKK 34.5 billion at the end of 2017 from DKK 39.8 billion at the end of 2016. Over the course of the year, there was an in-crease in new loans of DKK 6.9 billion, against an increase in 2016 of DKK 4.6 billion. In 2017, gross loan repayments and loan prepayments totalled DKK 7.9 billion, down from DKK 8.4 billion in 2016.
The allowance account increased to DKK 2,591 million from DKK 2,516 million at the end of 2016. The allowance account subsequently amounted to 7.0 % of total loans and guarantees, up from 5.9% in 2016. Collective loan impairment charges fell from DKK 540 million at the end of 2016 to DKK 211 million at the end of 2017, while individual loan impairment charges rose from DKK 1,976 million at the end of 2016 to DKK 2,380 million at the end of 2017. The changes were mainly caused by negative rating migration for a few Offshore shipping companies, resulting partly in increased loan impairment charges, and partly in migration from collective to individual loan impairment charges.
17

18
The bond portfolio rose to DKK 20.1 billion from DKK 19.7 billion at the end of 2016. The bond portfolio relates to the company’s equity, loan impairment charges, placing of funds not yet used for lending and repo activities. Of this amount, the securities portfolio represented DKK 11.9 billion, which was primarily invested in covered bonds, while the remainder was invested in Danish govern-ment bonds and bonds issued by Kommunekredit.
Issued bonds totalled DKK 42.5 billion compared with DKK 42.4 billion at the end of 2016. As part of its efforts to maintain a strong liquidity position, Danish Ship Finance issues bonds well in advance of the loan disbursements. This makes the company less sensitive to short-term fluctuations in the capital markets.
In 2017, new bond issues totalled DKK 19.2 billion, against DKK 6.3 billion in 2016. Ordinary and extraordinary redemption of issued bonds totalled DKK 18.6 billion, versus DKK 9.5 billion in 2016. The average maturity was 6.7 years compared with 4.4 years at the end of 2016.
Including net profit for the year and proposed dividends, the company’s equity was DKK 9.3 billion compared with DKK 9.2 billion at the end of 2016.
Dividends to the shareholders of DKK 237 million have been proposed for 2017, against DKK 199 million in 2016. The proposed dividends for the 2017 financial year are included in equity but are expected to be disbursed after the approval by shareholders at the annual general meeting in March 2018, and the amount has therefore been deducted from own funds in the calculation of the total capital ratio, cf. below.
Danish Ship Finance is subject to the capital requirements framework through Part 6 of the Execu-tive Order on a Ship Finance Institute. The total capital ratio was 19.7% at the end of 2017, against 17.2% at the end of 2016.
Impact of the USD/DKK on income statement, balance sheet and capital structureThe USD/DKK exchange rate was 620.77 at the end of 2017 against 705.28 at the end of 2016, down nearly 12% for the year as a whole.
In 2017, movements in the USD/DKK exchange rate, all else being equal, had a negative impact on net interest and fee income of about DKK 18 million based on average exchange rates for the year, and a positive impact on loan impairment charges of DKK 129 million because of the lower year-end exchange rate. The overall effect on profit before tax was a rise of DKK 111 million, and on net profit for the year an increase of DKK 86 million.
Compared with the USD/DKK exchange rate at the beginning of 2017, the change reduced the total risk exposure amount, which, viewed separately, resulted in a 1.8 percentage point increase in the total capital ratio.
Uncertainty as to recognition and measurementThe most significant uncertainty involved in recognition and measurement concerns impairment of loans and valuation of financial instruments. The company estimates that the uncertainty is at a level which is prudent in terms of providing a true and fair view of the financial statements. See the description in note 1 to the financial statements, Accounting policies.

19
Performance relative to expectationsThe return on the securities portfolio was expected to be lower in 2017 than in 2016 due to the low interest rate level and limited opportunities for realising capital gains. The return was marginally lower, but was higher than forecast and reached a highly satisfactory level.
Total capital gains were positive despite a negative effect of DKK 151 million from buybacks of pre-viously issued bonds at prices above the carrying amount. The early redemptions were funded by the issue of longer-dated bonds at a premium. The capital loss relating to the maturity extension will be offset by largely corresponding reductions in interest expenses recognised in the financial statements in subsequent financial years.
A minor decline in lending was expected, and it was anticipated that lending would continue to fall back for a large part of the year and then start rising again towards the end of the year. The predicted pattern in lending during the year occurred, whereas total lending was somewhat lower than expected on account of the weaker USD versus the DKK. In foreign exchange terms, however, lending maintained the level recorded at the end of 2016. Owing to the depreciation of the USD, the decline in earnings from lending was larger than anticipated.
Net profit for the year thus exceeded the expectations stated in the Annual Report for 2016.
Developments in the Offshore segment in particular were expected to result in increased loan im-pairment charges. Total loan impairment charges increased only marginally as loan impairment charges recognised as an expense were favourably affected by the fall in the USD/DKK.
The declining USD/DKK exchange rate reduced the size of the loans measured in DKK, with a result-ing positive impact on the total capital ratio.
Events since the balance sheet dateBased on International Financial Reporting Standard 9 (IFRS 9), the Danish FSA has amended the Executive Order on Financial Reports for Credit Institutions and Investment Firms, etc. (the Executive Order on Financial Reports), including the loan impairment rules, effective from 1 January 2018. The new impairment rules, which the company will implement as of the 2018 financial year, will in-troduce a more forward-looking measurement of impairment of financial assets based on expected credit losses over the expected useful life of the asset as opposed to the previous approach based on incurred losses. The new impairment rules will require the company to recognise 12-month ex-pected credit losses on initial recognition of credit exposures; the company must also recognise life-time expected credit losses on credit exposures involving increased credit risk or credit impairment. The company estimates the initial impact of the implementation of IFRS 9 into the Executive Order on Financial Reports to result in an increase in the allowance account of DKK 125-150 million before tax. Under the accounting framework, the impact, net after tax, will be recognised as a reduction in the equity at 1 January 2018 and will thus not impact the income statement. Upon implementation of the new impairment rules, the Danish FSA will establish transitional arrangements, permitting institutions to calculate an amount to be included in their common equity tier 1 capital, which will decrease over a 5-year transitional period. At the present time, the company has decided not to adopt the transitional arrangements.

20
MARKET OUTLOOK
The shipping marketThe International Monetary Fund (IMF) projects global economic growth to be 3.9% in 2018, which is 0.2 percentage points more than it was expecting in 2017. Growth prospects for emerging economies are the reason for the marginally higher growth projection for 2018. Economic growth in Europe and Japan is projected to be slightly weaker in 2018 than in 2017. The same applies to the Chinese economy, with the IMF still forecasting a gradual slowdown to 6.6% growth in 2018 from 6.8% in 2017. The World Trade Organisation also forecasts world trade growth to slow slightly to 3.2% in 2018.
The general outlook for international shipping is not quite as positive as the growth expectations might suggest. Many segments have seen extensive fleet renewal in recent years. As a result, there are fewer older vessels left in the fleet to scrap if it becomes necessary to adjust the supply of vessels. The total orderbook is at its lowest level for more than a decade and is set to continue shrinking in 2018. Nonetheless it remains at the high end, especially for the largest vessels.
Bunker prices have been on the rise since early 2016. If this trend continues, it could mean that ships start reducing speed to save fuel. Such a development could reduce the supply of vessels and would contribute to improving the balance between supply and demand.
A positive trend in freight rates hinges on stable and positive global economic growth and, it is hoped, a more moderate addition of new vessels. However, solutions still need to be found for many of the imbalances in the global economy, including increasing leverage. Geopolitical tensions are continuing to mount.
In the last couple of years, the shipping industry has encountered stricter environmental requirements, some of which apply globally, others regionally. The new Ballast Water Management Convention was ratified in 2016, and the upper limit for sulphur emissions from shipping is already set to take effect from 2020. These initiatives may have severe consequences for the industry, as shipping companies with weaker balance sheets may find it challenging to make the investments necessary to meet the increased requirements. Consequently, the environmental requirements may also partially impact prices of older vessels, because often it will not be financially viable to make the required investments to install new technology in older vessels.
Most shipowners are capable of adapting to the very changeable conditions of international shipping, including new regulation, and adjust according to the fluctuations in earnings which are inherent to the industry. Thus, the majority focus on having a capital structure which is robust and which is resilient to downturns and can foster growth when the opportunity arises. Danish Ship Finance has extensive experience in assessing the creditworthiness of shipping companies, and we use this strength to continue identifying and expanding our customer portfolio with new and attractive companies. That way, Danish Ship Finance will be a business partner to both existing and new customers by providing financing for their future development.
Competitive situationBasel IV was adopted in December 2017 and in the long term will impact the terms for ship finance as well as other lending. Although the phase-in period does not commence until 2022, the rules are likely to have an impact some time before then.
Outlook

21
Most of the company’s competitors currently apply the advanced IRB method approach to deter-mine risk-weighted assets, including shipping loans. Several of these competitors are likely to have to increase the capital charge for shipping loans, in part as a consequence of the introduction of capital floors under Basel IV. As Danish Ship Finance applies the standardised approach to calculate risk-weighted assets, the introduction of Basel IV, viewed in isolation, is expected to strengthen the company’s competitiveness. These changes cannot be quantified at the present time; in the short term, however, and thus including in 2018, the competitive situation is expected to remain relatively unchanged.
Financial guidanceThe financial performance for 2018 is expected to be impacted by a lower return on the securities portfolio than in 2017. Entering 2018, interest rates are low, and interest income is consequently expected to decrease, while the strong capital gains recorded in 2017 are not likely to be repeated.
Lending is expected to see a slight uptrend during the year, pushing up earnings from lending. On the back of the somewhat lower average lending in 2017, and based on an unchanged USD, earnings from lending are expected to increase more than indicated by developments in nominal lending from the end of 2017 to the end of 2018.
For 2018, the company plans to buy back shorter-dated bonds concurrently with the issuance of longer-dated bonds. As in 2017, this activity will result in negative value adjustments during the year, which will be offset by largely corresponding reductions in interest expenses in subsequent years.
The Tanker market was under pressure in the last few months of 2017, and conditions in the Offshore market are not set to improve noticeably during the coming year. The allowance account is expected to increase marginally in 2018, including before recognition of the impact of IFRS 9. However, favourable developments in sub-segments or settlement of problem loans may lead to a minor reversal of loan impairment charges. Also in 2018 it is expected that losses will be realized, which will in particular be related to lending in the offshore segment. Write-offs in 2018 are expected to be fully covered by loan impairment charges already made.
The company estimates the initial impact of the implementation of IFRS 9 into the Executive Order on Financial Reports to result in an increase in the allowance account of DKK 125-150 million before tax. Under the accounting framework, the impact of IFRS 9 will be recognised as a reduction in the equity at 1 January 2018 and will thus not impact the income statement.
The trend in the USD exchange rate will have an impact on net profit for the year and the total capital ratio.
On balance, net profit for 2018 is expected to be higher than for 2017.

22
Danish Ship Finance must hold sufficient capital to cover the requirement at existing and expected levels of activity. The company’s own funds meet the regulatory requirements and the targets de-termined by the company itself.
Calculation methodThe company applies the standardised approach to calculate the total risk exposure amount and the own funds requirement for credit and market risks. When using this approach, the risk weights are defined in legislation. The basic indicator approach is applied to calculate the risk exposure amount for operational risk.
Own funds, capital requirement and total capital ratioThe own funds requirement (also referred to as the Pillar I requirement) is a total capital ratio of 8%, equivalent to the statutory minimum requirement.
Own funds are calculated as the sum of common equity tier 1 (CET1) capital, additional tier 1 (AT1) capital and tier 2 capital, and the ratio of own funds to the total risk exposure amount is referred to as the total capital ratio.
Capital management
CALCULATION OF TOTAL CAPITAL RATIO
DKK million / % 2017 2016
Own funds after deductions 8,930 8,781Total risk exposure amount 45,312 50,995Total capital ratio 19.7 17.2
Own funds consist mainly of common equity tier 1 (CET1) capital in the form of share capital, tied-up reserve capital and retained earnings from previous years.

Internal capital adequacy requirement and adequate own fundsCapital management is anchored in the Internal Capital Adequacy Assessment Process (ICAAP), which leads to the determination of the internal capital adequacy requirement.
The Board of Directors and the Executive Board must ensure that the company maintains adequate own funds to meet the Pillar I requirement of 8%, plus additional capital requirements to cover “higher-than-normal” risks. Adequate own funds are the minimum amount of capital required to ensure, in the view of the Board of Directors and the Executive Board, that the bondholders are only exposed to a very low risk of suffering a loss in the event that the company becomes insolvent dur-ing the next 12 months. The ratio between adequate own funds and the total risk exposure amount is referred to as the internal capital adequacy requirement.
MethodologyThe company follows the Danish FSA Guidelines on adequate own funds and capital adequacy re-quirements for credit institutions. The guidelines provide an interpretation of Annex 1 to the Danish Executive Order on Calculation of Risk Exposures, Own Funds and Solvency Need. In the guide-lines, the Danish FSA defines benchmarks for a number of instruments with expectations of “high-er-than-normal” risks.
The Danish FSA has defined benchmarks and calculation methods within seven risk areas which are typically relevant for a credit institution to assess in determining its adequate own funds, and has listed additional factors to be included in the assessment.
The calculation is shown on the next page.
23

24
At 31 December 2017, adequate own funds and the total risk exposure amount were DKK 4,208 million and DKK 45,312 million, respectively. The internal capital adequacy requirement including the combined capital buffer requirement totalled 10.8%. Own funds after deductions totalled DKK 8,930 million at 31 December 2017, resulting in a total capital ratio of 19.7%. This corresponds to excess coverage in the amount of DKK 4,050 million, or 8.9%-point.
At the end of 2016, adequate own funds amounted to DKK 5,014 million and the internal capital ad-equacy requirement was 10.7%. The decline in adequate own funds derived from declining lending. In addition, the combined capital buffer requirement increased as a result of the phasing-in of the capital conservation buffer from 0.625% in 2016 to 1.25% in 2017.
Combined capital buffer requirementThe combined capital buffer requirement consists of three elements: - A capital conservation buffer- A systemic risk buffer- An institution-specific countercyclical capital buffer
ADEQUATE OWN FUNDS AND INTERNAL CAPITAL ADEQUACY REQUIREMENT
DKKm 2017 2016
Total risk exposure amount 45,312 50,995
Pillar I requirement (8% of total risk exposure amount) 3,625 4,080Earnings - -Growth in lending - -Credit risk - Credit risk exposure to large customers in financial difficulty 137 375- Other credit risk - -- Concentration risk 35 57Market and liquidity risk - -Operational and control risk 411 502Leverage risk - -Other risks - -
Total adequate own funds 4,208 5,014
Internal capital adequacy requirement (%) 9.3 9.8
Capital conservation buffer (%) 1.3 0.6Countercyclical capital buffer requirement (%) 0.2 0.2
Internal capital adequacy requirement incl. combined capital buffer requirement (%) 10.8 10.7

25
INSTITUTION-SPECIFIC COUNTERCYCLICAL CAPITAL BUFFER
DKKm / % 2017 2016
Total risk exposure amount 45,312 50,995Institution-specific countercyclical capital buffer requirement 105 110Institution-specific countercyclical capital buffer requirement 0.2 0.2
In 2017, the regulatory capital conservation buffer was set at 1.25% of the total risk exposure amount. As at 1 January 2018, it was up at 1.875%. When fully phased-in, at 1 January 2019, the capital conservation buffer requirement will be 2.5% of the total risk exposure amount.
All EU member states must implement a systemic risk buffer applying to domestic exposures. The requirement may apply to the entire sector or to individual sub-sectors. The systemic risk buffer is aimed at preventing and mitigating long-term, non-cyclical systemic or macroprudential risks not covered by the Capital Requirements Regulation (CRR). The systemic risk buffer rate was set at 0% in 2017.
The institution-specific countercyclical capital buffer may be applied if lending growth results in higher macroprudential risks. This buffer may be between 0% and 2.5% of the total risk exposure amount.
Based on the geographical distribution of credit risk exposures, the capital requirement for the countercyclical capital buffer was calculated at DKK 105 million at 31 December 2017. The capital requirement pertains to exposures in Norway, Sweden and Iceland, which have set the following countercyclical capital buffer rates: - Sweden 2.00% - Norway 1.50%- Iceland 1.25%
For further information on capital management, including a detailed description of the determination of adequate own funds, please refer to the Risk Report on the company’s website: www.shipfinance.dk/investor-relations/
Recovery planA recovery plan has been prepared. The recovery plan contains a catalogue of possible actions to strengthen the company’s capital and liquidity in a crisis situation.
The recovery plan will take effect if predefined triggers are activated.

26
Liquidity management is generally carried out to ensure that the cost of funding does not become disproportionately high and to avoid that a lack of funding prevents the company from supporting lending activities. The ultimate purpose of liquidity management is to ensure that the company is consistently able to meet its payment obligations.
Balance principleThe specific balance principle permits a future liquidity deficit between issued bonds and loans provided of up to 100% of own funds.
The deficit occurs if the future payments related to bonds issued by Danish Ship Finance, other funding and financial instruments exceed the future incoming payments on loans, financial instru-ments and positions.
In its internal policies, the company has defined strict requirements for any liquidity deficits be-tween issued bonds and loans provided.
FundingBonds are typically issued in DKK, whereas most of the loans are disbursed in USD. The company has sourced USD for funding of USD loans disbursed via so-called basis swaps.
A lack of access to convert DKK funding into USD entails a risk of higher financing costs or a loss of business opportunities. The opportunities for sourcing USD liquidity rely on an efficient capital market.
Internal policies govern the maximum limits for USD funding over time.
Liquidity policyThe company has formulated a policy for managing liquidity risk (liquidity policy) pursuant to the Executive Order on Management and Control of Banks, etc.
The purpose of the liquidity policy is to ensure that the liquidity risk at any time matches the overall risk profile. The liquidity policy also serves to ensure adequate handling and management of liquidity, allowing the company at any times to meet its payment obligations, applicable legislation and execute plans for future activities and growth.
Liquidity management

27
Management, monitoring and reportingThe company’s liquidity management is anchored in the Internal Liquidity Adequacy Assessment Process (ILAAP), which is a review aimed at identifying liquidity risk exposures and determining liquidity targets.
The Board of Directors determines the overall guidelines for managing liquidity risk through the liquidity policy. The Executive Board is responsible for ensuring that the guidelines established by the Board of Directors are laid down in business procedures that are regularly updated.
Compliance with the liquidity policy is monitored by the Risk Management function. A financial re-port on compliance with the policy framework is prepared and submitted to the Board of Directors on a quarterly basis.
Liquidity managementIn addition to the above, a liquidity stress test is performed comprising the following elements:- A rising USD/DKK exchange rate- Increasing interest rates- Widening credit spreads- Write-offs
The results of the liquidity stress test are used to manage and adjust internal limits. Furthermore, the stress test is used to obtain an overview of the liquidity profile in the current and stressed sce-narios.
Contingency plansIn accordance with the Executive Order on Management and Control of Banks, etc., the company has prepared a liquidity contingency plan, which contains a catalogue of possible courses of action to strengthen the liquidity position in a critical situation.
The liquidity contingency plan takes effect when predefined triggers are activated.

28
The primary responsibility for risk management and internal controls in relation to the financial reporting process rests with the Board of Directors, including compliance with applicable legislation and other financial reporting regulations.
The company’s risk management and internal controls are designed with a view to effectively mini-mising the risk of errors and omissions.
The company’s risk management and internal control systems will provide reasonable, but not ab-solute, assurance that misappropriation of assets, losses and/or significant errors and omissions, including in financial reporting, are avoided.
The Board of Directors has set up an Audit Committee charged with monitoring and controlling ac-counting and auditing matters and preparing accounting and audit-related topics for consideration by the Board of Directors.
The Board of Directors, the Audit Committee and the Executive Board regularly assess significant risks and internal controls in relation to the company’s operations and their potential impact on the financial reporting process.
Internal control and risk management systems

29
Overall control environmentThe key component of the control environment is an appropriate organisation, including adequate segregation of functions and internal policies, business processes and procedures.
In accordance with applicable legislation, the Board of Directors, including the Audit Committee, regularly assesses the need for an internal audit function. The Board of Directors sees no need for an internal audit function at present, but the company does have an internal control function.
Risk assessmentAt least once a year, the Board of Directors, the Audit Committee and the Executive Board make a general assessment of risk in relation to the financial reporting process. In addition, management regularly assesses the need for new internal controls to be implemented to reduce and/or eliminate identified risks.
In its risk assessment, the Board of Directors specifically assesses the company’s organisation for measurement and risk management, the accounting and budget organisation, internal controls, segregation of functions, IT usage and IT security. As part of the risk assessment, the Board of Directors also considers the risk of fraud.
The Board of Directors and the Executive Board assess whether the organisation has the necessary competencies to ensure that internal controls and risk management procedures are managed effectively.
Control activitiesThe company uses systems and manual resources for monitoring data that form the basis of the financial reporting process.
The purpose of the control activities is to prevent, detect and correct any errors or omissions. In the context of the financial reporting process, control activities are performed to ensure that the financial statements are presented in accordance with current legislation.
Information and communicationThe Board of Directors has adopted a number of general requirements for the presentation of the financial statements and the external financial reporting in accordance with current legislation and guidelines. The objective is to ensure that applicable disclosure requirements are met and that dis-closures are full, complete and accurate.
Monitoring and reportingMonitoring takes place by means of regular and/or periodic assessments and controls at all levels of the company. Reports on the appropriateness and/or weaknesses of the controls, control failures, cases of non-compliance with adopted policies, limits, etc. or other significant deviations are escalated in the organisation in accordance with the company’s policies and instructions.
Whistleblower schemeIn accordance with the Danish Financial Business Act, the company has implemented an internal whistleblower scheme, which enables its employees to report any instances of non-compliance with the financial legislation to an independent third party. In the event of a report being made, an independent third party will make a provisional screening of it to assess whether the instance of non-compliance falls within the scope of the whistleblower scheme. In late 2017, the company applied for permission to extend the whistleblower scheme to include economic crime, as well.

30
Credit risk is the risk of losses arising from debtors or counterparties failing to meet their payment obligations. This applies to counterparties in the form of shipowners as well as financial institutions.
LendingShip financing is provided against first lien mortgages on vessels. On a limited scale, the company also provides financing of shipowners’ payment of instalments to a shipyard. The company is a leading provider of ship financing in Denmark, and it focuses primarily on large, reputable shipown-ers in Denmark and in other countries. When considering potential loans, focus is on the financial standing of the borrower, vessel characteristics and the loan terms.
The most significant risk facing Danish Ship Finance is deemed to be the risk of loss where the value of the mortgaged vessel cannot cover the debt outstanding on the loan in case of customer default.
The credit policy contains specific guidelines for the ongoing management of risk exposures in the loan portfolio. A number of predefined procedures are followed in the ongoing credit risk manage-ment process, the most important of which are described below.
DiversificationThe composition of the loan portfolio adheres to a set of diversification rules. The purpose of the diversification rules is to ensure adequate diversification by vessel type, borrower and country.
In respect of management of large exposures, the company has defined guidelines for the extent to which and the assumptions on which the company will assume large exposures, including exposures exceeding 25% of own funds.
The five largest exposures at 31 December 2017 were secured by mortgages on 132 vessels com-prising ten vessel types. One aggregated exposure was substantially larger than the rest and repre-sented just over 20% of total loans and guarantees.
Risk diversification by borrower also takes account of diversification by vessel type within each exposure. The largest exposure was secured though mortgages on 65 vessels distributed between four different vessel types (loans for Container Liners represented the majority, and loans for Product Tankers, Offshore Units and Offshore Vessels the rest).
Loan approvalThe Board of Directors has authorised the Executive Board and the Head of Credit to grant loans up to pre-determined limits. The granting of loans must be disclosed at the subsequent ordinary board meeting.
As in previous years, the Board of Directors approved the majority of all loans granted in 2017 (85% of the cases and 94% of the loan volume).
Credit risk

31
MOVEMENTS IN THE FIVE LARGEST EXPOSURES BEFORE LOAN IMPAIRMENT CHARGES
DKKm 2017 2016
Five largest exposures 12,390 13,686
Loans and guarantees 37,412 42,699
LOAN PORTFOLIO BY MORTGAGED VESSELS
% of total lending
Bulk Carriers 16.3
Chemical Tankers 4.1
Car Carriers 5.8
Container Feeders 2.2
Container Liners 16.4
Crude Tankers 8.9Ferries/RO-RO 6.3
LNG 1.5
LPG 4.9
Offshore Units 4.3
Offshore Vessels 10.0
Others 2.8
Product Tankers 16.5

Ongoing monitoringAs part of the risk management process, all loans are assessed at least twice a year. Each loan and the current credit risk exposure are assessed on the basis of current market valuations of the financed vessels and the most recent financial information on the borrower.
In addition, the portfolio is monitored for borrowers’ fulfilment of their obligations under the indi-vidual loan agreement. This entails the following: - Half-yearly updating of the market values of all financed vessels and verification that any agreed
LTV limits are complied with- Verifying that any other collateral meets the specified minimum requirements- Verifying the existence of adequate insurance cover on financed vessels - Verifying compliance with material loan covenants
If a loan is deemed to entail an increased risk, the monitoring is intensified to safeguard the compa-ny’s interests to the greatest possible extent.
Insurance of ship mortgagesAll vessels mortgaged as security for loans must be insured. Insurance is taken out by the borrower. Borrowers’ insurances policies for financed vessels are assigned to Danish Ship Finance.
Generally, the insurance includes:- Hull and machinery insurance, which covers damage to the vessel or total loss- P&I (Protection & Indemnity) insurance, which is a third-party liability insurance to cover
damage to persons or equipment - War Risks Insurance, which covers damage to the vessel, potential total loss and retention, etc.
caused by war or war-like conditions
In addition, most of the loans are covered by Mortgage Interest Insurance and Mortgagee Additional Perils Pollution Insurance. This insurance covers the risk in most situations that the primary insurance policies do not cover, for example if the vessel was not seaworthy at the time of the claim.
Inspection of vesselsAs a supplement to the half-yearly market valuations, physical inspections of the financed vessels are made on a spot-check basis. An inspection may be performed both during the loan period or prior to submitting a loan offer.
Market valuationsThe company values each vessel semi-annually. The valuation is carried out by an external broker, which sets a price for the financed vessels based on supply and demand. The company may also assess the value itself, based on a specific independent market price or external valuations of sister vessels.
Among other things, market valuations of vessels are, among other things used to determine the loan-to-value (LTV) ratios of the company’s loans and for control purposes in connection with the company’s half-yearly loan impairment review.
32

33
Write-offs and loan impairment chargesTwice a year, all exposures are reviewed in order to re-assess the need for loan impairment charg-es. The assessment of whether any impairment on the individual loans is needed is based on the borrower’s present and expected future financial position and on the value of the mortgaged vessel and any other collateral provided.
The overall guidelines for loan impairment charges are laid down in the Executive Order on Financial Reports. The Executive Order stipulates that, in addition to individual loan impairment charges, the company must also make collective loan impairment charges.
The Danish FSA has agreed that Danish Ship Finance may refrain from making collective loan im-pairment charges provided that the assessment of the individual loans is planned in such a way that in practice it is consistent with the procedure for a collective assessment and that loan impairment charges are made accordingly for each loan. Furthermore, it is a precondition that the assessment of any impairment of the individual loans is made on the basis of a probability weighting of the ex-pected outcome in respect of payments from the borrowers.
Based on the FSA guidelines, the company reviews all loans in order to identify any objective ev-idence of impairment (OEI). It is also established whether a vessel segment contains any OEI and thus, whether there is need for collective impairment charges.
All loans are reviewed to evaluate whether the existing internal rating and probability of default still provide the best estimate of the cash flows due from the specific borrower. Where this is estimated not to be the case, the loan is reclassified.
Note 14 provides a specification of individual and collective loan impairment charges.
Objective evidence of impairmentObjective evidence of impairment (OEI) is a concept used to express that a loan entails a higher probability of default (PD). The concept is used for calculating individual loan impairment charges pursuant to the Executive Order on Financial Reports and the Danish FSA guidelines.
OEI exists if at least one of the following events occurs:- Default- The borrower is experiencing significant financial difficulty- A loan is past due/arrears, unless the problem is short-term and the amounts concerned are
small in comparison to the borrower’s financial situation, or if this is due to errors or technical problems
- Loans with more lenient repayment terms, including forbearance, which the company would not otherwise have granted.
The company applies an internal 12-point rating scale, with 12 being the weakest. If OEI is established for credit exposures, including loans without loan impairment charges, the borrower is downgraded on the company’s internal rating scale to exposure class 11 (or exposure class 12 if the credit exposure is also in default) with a PD of 100%. Loans with OEI, i.e. loans in exposure class 11 or 12, are referred to as “problem loans”.
Upon reconstruction, including agreements for composition or conversion of a loan into share cap-ital/subordinated loan capital, has been completed, the OEI period will run for at least 12 months. Subsequently, a new impairment test will be performed on the credit exposure.

34
Default A loan is deemed to be in default if the borrower is not expected to be able to meet its obligations. That is based on at least one of the following situations occurring:- A loss is deemed inevitable- Bankruptcy or other in-court reconstruction- Past due/arrears for 90 days or more- Foreclosure- Non-accrual interest
If a credit exposure is in default, the borrower is downgraded to exposure class 12 with a PD of 100%.
Accumulated loan impairment charges amounted to DKK 2,591 million at 31 December 2017, against DKK 2,516 million at 31 December 2016.
Accumulated loan impairment charges accounted for 7.0 % of total loans and guarantees, against 5.9% at the end of 2016. Danish Ship Finance recorded net write-offs in the amount of DKK 98 million in 2017, against DKK 89 million in 2016. Write-offs in absolute terms thus remained at a low level.
Accumulated write-offs since the company was established in 1961 were approximately DKK 1.2 billion at 31 December 2017. This corresponded to 3.2% of total gross lending at 31 December 2017.
ACCUMULATED LOAN IMPAIRMENT CHARGES AND NET WRITE-OFFS
DKKm Accumulated loan impairment charges Individual Collective Net write-offs
4,000
3,000
2,000
1,000
0
(1,000)
198
8
198
9
19
91
19
90
19
92
19
93
20
09
20
00
20
06
19
97
19
94
20
10
20
01
20
07
19
98
19
95
20
11
20
02
20
12
20
03
20
13
20
04
20
08
19
99
19
96
20
14
20
05
20
15
20
16
20
17

35
The chart above shows a breakdown of the loan portfolio into LTV ranges, which are calculated every six months. The LTV ranges show the proportion of the loans placed within a given range. 95% of total lending including guarantees and after loan impairment charges is secured by mort-gages within 60% of the valuations at the end of 2017.
The distribution is compared to the developments in vessel prices based on a price index from Clarksons for all vessel types.
The chart shows that even major declines in vessel prices do not materially change the collateral security behind the loan. This is due to the regular loan repayments and because a significant number of loan agreements include a minimum value clause (MVC), i.e. the company has the right to demand partial prepayment and/or additional collateral if the value of the mortgaged vessel drops below an agreed percentage.
LOAN TO VALUE RATIO VS PRICE INDEX FOR ALL VESSEL TYPES
Source: Clarksons, Danish Ship Finance
2008 2011 20122009 20132010 2014 2015 20172016
100
75
50
25
0
100
75
50
25
0
Loa
n t
o v
alu
e ra
tio
%
of
tota
l lo
an
po
rtfo
lio
Pri
ce in
de
x fo
r a
ll ve
sse
l typ
es
Jun
e 2
00
8 =
ind
ex
100
0-20% 20-40% 40-60% 60-80% 80-100% > 100%
Price index for all vessel types.

36
DISTRIBUTION OF SECURITIES PORTFOLIO
%
Financial counterpartiesThe company’s securities portfolio represents a significant part of the assets. The securities portfolio comprises government and mortgage bonds, money market transactions and interest sensitive financial instruments.
The majority of the portfolio consist of liquid mortgage bonds, which makes for a robust excess liquidity coverage of 520% well above the LCR requirement at 31 December 2017.
Mortgage bonds 71.3
Government- and local government bonds (KommuneKredit) 28.7

37
The company carries out transactions with financial counterparties when investing both the com-pany’s own funds and excess liquidity from issued bonds. These transactions involve cash deposits, securities and financial instruments.
A financial contract may entail a risk of loss if it has a positive market value and the financial coun-terparty cannot perform its part of the contract. This type of risk also includes settlement risk.
The policy for managing counterparty risk (counterparty policy) quantifies and defines limits for the exposure to individual financial counterparties and the countries in which such counterparties are residents. The counterparty policy is used in the management of market risk and liquidity risk and sets out limits on maximum receivables (lines) under loans to and guarantees from credit institu-tions, export guarantee agencies and insurance companies. The policy also contains the Executive Board’s guidelines and options for delegating approval authority.
Emphasis is on financial counterparties having high credit ratings, as a substantial proportion of business transactions with the counterparties involves long-term contracts with potentially large increases in market value. Bilateral collateral agreements (CSAs) have been signed with various bank counterparties, in order to reduce the credit risk.
Approval of linesFinancial counterparties are granted lines on the basis of defined criteria. The basis of approval may include ratings assigned by recognised international credit rating agencies if such ratings are available. The allocated lines are re-assessed twice a year and in case a counterparty’s credit rating changes.
The Board of Directors has authorised the Executive Board and the Head of Credit to approve lines to financial counterparties within predefined limits. Such approved lines within specific limits must be presented at the subsequent board meeting. Approval of lines exceeding the predefined limits is granted by the Board of Directors.
Contractual frameworkThe contractual framework for transactions with financial counterparties is based primarily on mar-ket standards such as ISDA and GMRA agreements, which allow netting in the case of default on the part of the financial counterparty. Furthermore, Danish Ship Finance has entered into agreements on market-value adjustments or collateral (CSAs) with some of its counterparties in connection with derivative trading.
Ongoing monitoringExposures to each counterparty are continuously monitored, partly to ensure that the counter-party consistently complies with the requirements, and partly to ensure compliance with the approved lines. The ongoing monitoring is carried out independently of the executing entities.
38
Market risk is the risk of loss caused by changes in the market value of assets and liabilities as a result of changing market conditions. The market risk is calculated as the sum of fixed income and foreign exchange positions. The most significant market risk is associated with the securities portfolio, as the company is governed by the limits laid down in the Bond Executive Order, which includes restrictions on interest rate, foreign exchange and liquidity risk between the bond issues (funding) and the loans.
The company’s market risk management is defined in a market risk policy approved by the Board of Directors. The policy lays down clear and measurable limits on interest rate and foreign exchange risks and builds on the Bond Executive Order and other provisions. The company’s market risk limits are in some cases stricter than such external provisions.
Market risk

39
Interest rate riskInterest rate risk is the risk that the company will incur a loss as a result of a change in interest rates. Rising interest rates have an adverse impact on the market value of the securities portfolio.
Pursuant to the Bond Executive Order, the interest rate risk between funding and lending must not exceed 1% of own funds. The company seeks to minimise the interest rate risk between funding and lending by applying conservative principles, but a loss or a gain may arise due to changes in interest rates.
Due to the balance principles, the company has only moderate exposure to interest rate risk outside the trading book the balance principle. At 31 December 2017, the interest rate exposure outside the trading book was calculated at DKK 90 million, against DKK 33 million in 2016.
The Bond Executive Order also stipulates that interest rate risk on assets, liabilities and off-balance sheet items must not exceed 8% of own funds. Using the Danish FSA guidelines for calculating in-terest rate risk in the trading book, the interest rate exposure was DKK 225 million at 31 December 2017, corresponding to 2.5% of own funds, against DKK 226 million in 2016.
Furthermore, interest rate risk is adjusted using a minimum and a maximum for the option-adjust-ed duration. The maximum option-adjusted duration of the securities portfolio, including financial instruments, is currently restricted to four years. The option-adjusted duration was approximately 1 year at 31 December 2017.
Foreign exchange riskAccording to the Bond Executive Order, the aggregate foreign exchange risk on assets, liabilities and off-balance sheet items must not exceed 2% of own funds.
The company obtains funding in DKK, however, as most of the lending are made in USD the company has an ongoing need for converting the funding from DKK to USD which is done via basis swaps. The market risk policy does not allow foreign exchange risk arising from a mismatch between funding and lending except for inevitable, limited foreign exchange risks resulting from ongoing liquidity. The company has set maximum limits for future mismatch between USD and DKK in the market risk policy. In the event that USD-funding is not obtainable in the market at a future point in time, the company will incur a currency mismatch. The currency mismatch will in this case be within the limits set by the regulation.
Equity riskApart from small holdings of sector shares and shares received in connection with the reconstruction of credit exposures, the company has no equity interests in other companies. DerivativesDanish Ship Finance uses derivatives in specific areas. The market risk policy specifies which deriva-tives the company may use and for which purposes. Financial instruments may be applied to hedge risks between funding and lending and related to investment activities.

40
The company’s liquidity management and the statutory liquidity requirements are aimed at redu-cing liquidity risk to the greatest extent possible.
Liquidity risk involves the risk of:- A disproportionate rise in the cost of funding- The company not being able to meet its payment obligations due to a lack of funding
Through bond issues and the existence of a liquid portfolio of bonds, the company has ensured sufficient liquidity coverage for all existing loans and loan offers until expiry. The company is there-fore not exposed to any refinancing risk. A potential downgrade of the company’s external rating would not change its robust liquidity position, but would presumably lead to higher funding costs for new loans.
The average maturity of issued bonds exceeds the average maturity of loans.
Liquidity risk
DEVELOPMENTS IN ISSUED BONDS RELATIVE TO LOANS
DKKbn
2018
Amortisation issued bonds Amortisation loans excluding loan offers
2018 2019 2020 2021 2022 2023 2025 2026 2027
50
40
30
20
10
0

41
Liquidity Coverage RatioAccording to the CRR, liquidity is required to be adequate for a period of 30 days in a stressed sce-nario (LCR requirement).
Shown below is the LCR requirement for 2017:
The company’s LCR at 31 December 2017 was 416%.
At least 30% of the liquid assets must be government bonds, bonds issued by Kommunekredit, cash or cash equivalents. Covered bonds may constitute the remaining 70%.
The 70% cap on covered bonds means that the company has a substantial volume of mortgage bonds which are not eligible for inclusion as liquid assets. If these mortgage bonds were sold and government bonds purchased instead, LCR would significantly increase.
LIQUIDITY COVERAGE RATIO
80%Liquidity Coverage Ratio = _>
Net liquidity outflows
over a 30-day stress period
Liquid assets

Operational risk
42

43
The Board of Directors has defined a policy for operational risk, the purpose of which is to create an overview of operational risks and minimise the number of errors with a view to reducing potential losses caused by operational errors.
Operational risk is managed across the organisation through a comprehensive system of business procedures and control measures developed to ensure a satisfactory process and control environment.
Efforts to mitigate operational risk include segregation of functions between execution and control of activities.
Operational errors are divided into three main groups by value:- Small errors (< DKK 25,000)- Medium-sized errors (DKK 25,000 – DKK 5 million)- Large errors (> DKK 5 million)
Small errors are reported to the relevant head of department. Medium-sized and large errors are reported to the Executive Board, and the Board of Directors must be notified of large errors.
The capital requirement for operational risk is calculated using the basic indicator approach. In 2017 operational risk accounted for 3.3% of the total risk exposure amount, resulting in a capital requirement of DKK 120 million.

44
FundingThe rules governing bond issuance are described in the Act on a Ship Finance Institute (the Act) and the Executive Order on a Ship Finance Institute (the Executive Order) as well as in the Bond Executive Order. Lending operations are funded through previously issued debenture bonds, issuance of ship mortgage bonds, lending of own funds and proceeds from loans raised in money markets and capital markets. Individual borrowers have no direct obligations to the bondholders.
All bonds issued by Danish Ship Finance are on the European Commission’s list of bonds meeting the gilt-edged requirements of Article 52(4) of the UCITS Directive (the “Investment Directive”).
Debenture bondsBonds issued before 1 January 2008. By definition, the bonds are covered bonds (as defined by the CRD) until maturity, even though there is no requirement for regular compliance with loan values.
Ship mortgage bondsShip mortgage bonds are issued to finance lending secured by mortgages on ships within 70% of the value of the mortgaged vessel(s).
In respect of loans funded by ship mortgage bonds, compliance with LTV limits is only required at the time of the loan offer.
Since 1 January 2008, bond issues have been in the form of ship mortgage bonds.
Covered bondsIn October 2017, Danish Ship Finance obtained permission from the Danish FSA to issue covered bonds (CB).
These bonds are issued to finance lending secured by mortgages on real estate, ships or sovereign exposures within predetermined LTV limits. In respect of loans funded by CBs, supplementary collateral must be provided to the bondholders if the LTV limit is exceeded. Compliance with this requirement is monitored continuously.
The company has not yet utilised the option to issue CB, but is waiting for opportunities to diversify its bond issuance.
Bond issuance

Additional capital chargeLoans exceeding 70% of the value of the vessel(s) may be provided subject to an additional capital charge in the form of a deduction from own funds in the calculation of the total capital ratio.
The company has not utilised this option for a number of years.
Issued bondsIssued bonds primarily fund bullet loans denominated in DKK. Issued bonds totalled DKK 42,467 million at amortised cost at 31 December 2017. About 95% of these bonds are denominated in DKK, while the remainder are CIRR bonds, most of which are issued in USD. With the exception of the CIRR bonds, all bond issues are listed and traded on Nasdaq Copenhagen.
In 2017 bond buybacks totalled DKK 14.9 billion. Total new issuance of bonds in 2017 amounted to a nominal value of DKK 19.2 billion with an average maturity of 6.7 years, increasing the average maturity of bonds by 2.3 relative to 2016.
At the end of 2017, Danish Ship Finance had no portfolio of own bonds.
Credit ratingDanish Ship Finance A/S has been assigned the following ratings by S&P Global Ratings, which regularly provides credit ratings on the company.
Issuer credit rating BBB+Bond rating AOutlook Negative
The bonds have been assigned a rating of A, with a negative outlook, and are rated on the basis of S&P’s methodology for rating covered bonds. S&P has also published an Issuer Credit Rating, as-signing a rating of BBB+, with a negative outlook.
45
CIRCULATING BONDS BY BOND TYPE
Issued before 2017 Issued in 2017
1 % 2 % 3 % 4 % 6 % Floating CIRR
30
20
10
0
DKKbn

46
Shareholders of Danish Ship FinanceThe company’s ambition is to deliver a risk-weighted return that is satisfactory to its shareholders. The Board of Directors continually assesses whether the share and capital structure is consistently aligned with the interests of the shareholders and the company. The Board of Directors believes that the share and capital structure is appropriate given the company’s level of activity.
The share capital of Danish Ship Finance A/S amounts to a nominal value of DKK 333 million, and is divided into A shares with a nominal value of DKK 300 million and B shares with a nominal value of DKK 33 million. Each A share of DKK 1 carries ten votes, and each B share of DKK 1 carries one vote. Other than that, there are no restrictions on the number of votes or shares relative to each shareholder. The shares are not listed for trading on a regulated market.
Share capital
Danish Ship Finance A/S
The Danish Maritime Fund
Danish Ship FinanceHolding A/S
Minority shareholders
AX IV HoldCo P/S(Axcel)
PKA A/S PFA A/S Members of the Board of Directors, the Executive
Board and employees

47
The ownership of Danish Ship Finance Holding A/S is as follows:- 98% of Danish Ship Finance Holding A/S is owned by Axcel, PFA and PKA. - The remaining 2% is owned by members of the Board of Directors, the Executive Board and em-
ployees of Danish Ship Finance A/S.
Danish Ship Finance Holding A/S owns 86.6% of the shares in Danish Ship Finance A/S. Further-more, the Danish Maritime Fund owns 10% of the shares (B shares), and the remaining 3.4% is owned by a small number of minority shareholders.
The following shareholders, listed in alphabetical order, hold at least 5% of the total voting rights or own at least 5% of the shares.- AX IV HoldCo P/S- The Danish Maritime Fund- The Social Workers’, Social Pedagogues’ and Office Staff Pension Fund- The Healthcare Professionals’ Pension Fund- The State Registered Nurses’ and Medical Secretaries’ Pension Fund- PFA A/S
DividendsAt the annual general meeting held on 27 March 2017, the Board of Directors’ proposal to pay dividends of DKK 199 million based on the financial statements for 2016 was adopted.
Based on the financial statements for 2017, the Board of Directors proposes that dividends of DKK 237 million be paid.
As a result of the Board’s proposal, the company’s A shareholders will receive dividends of just under DKK 187 million, while the B shareholder, the Danish Maritime Fund, will receive dividends of just over DKK 50 million.
If the shareholders approve the dividend proposal for 2017, the company will, since its conversion into a public limited company in 2005, have paid total dividends of DKK 666 million to the B share-holder, the Danish Maritime Fund. The funds are used to develop and promote Danish shipping and the Danish shipbuilding industry.

48
Management structureThe supreme authority of Danish Ship Finance A/S is the general meeting. The Board of Directors is com-posed of 11 members, eight of whom are elected by the general meeting for a term of one year each. The employees elect three employee representatives to the Board of Directors for a term of four years each. The rules on employee representatives are available on the company’s website.
The Board of Directors defines the overall principles for the company’s operations and appoints the Executive Board.
The Executive Board is in charge of the company’s day-to-day management. The Executive Board re-ports to the Board of Directors.
General meetingThe Board of Directors and the Executive Board seek to promote active ownership, including participation by the shareholders at the general meeting, and efforts are made to ensure that all members of the Board of Directors and the Executive Board are present at general meetings.
The next annual general meeting will be held at the company’s premises on 26 March 2018.
Board of DirectorsEivind Kolding is Chairman of the Board of Directors, and Peter Nyegaard is Vice Chairman.
The Board of Directors defines the overall strategies and guidelines. Each year, the Board of Directors also defines its principal duties in respect of financial and management control of the company, which helps ensure control within all key areas.
Board meetings are held whenever deemed necessary or when requested by a member of the Board of Directors or the Executive Board. Ordinary board meetings are held eight times a year. Where possible, dates and agendas for the meetings are fixed for one year in advance.
The board member attendance rate was 88% in 2017. The Executive Order on Management and Control of Banks, etc. requires the board members’ experience and competencies to be evaluated on an annual basis. The Board of Directors has assessed that the board as a whole possesses the competencies deemed necessary to ensure professional management of the company.
Organisation, governance and corporate social responsibility

49
The competency profile is as follows:• Banking and mortgage lending• Financial derivatives• International maritime industry and shipping• IT• Credit approval processes• Management experience from a relevant financial enterprise• Legislation• Macroeconomics• Bond issuance• Shipowning operations• Risk management in a financial institution• Finance and accounting
Election of new board membersThe Board of Directors operates within the framework of a shareholders’ agreement when select-ing and nominating new candidates for the board. The shareholders’ agreement contains rules on the election of board members at the annual general meeting. When new board members are elected, consideration is given to the composition of the board, including in terms of diversity.
Targets and policies for the under-represented genderThe company has defined targets and a policy for the gender composition of the Board of Directors.
The shareholders select candidates for the Board of Directors. Hence, the board has no direct influ-ence on which candidates are nominated. However, the board tries to influence the process where possible.
The Board of Directors consists of 11 members, eight of whom are elected by the general meeting and three by Danish Ship Finance employees. All board members are male. The target is for at least one female board member to be elected by the annual general meeting in 2019.
When recruiting new members of management, the company seeks to attract people with skills that may contribute to the professional management of the company.
More information on the company’s efforts for the under-represented gender is provided in the CSR report on the company’s website: www.shipfinance.dk/the-company/corporate-governance/
Senior managementSenior management consists of Erik I. Lassen, CEO, Per Schnack, CFO and member of the Executive Board, and Flemming Møller, Head of Credit, Executive Vice President.

50
Corporate governanceAs the company has no shares listed for trading on Nasdaq Copenhagen, it is not subject to cor-porate governance rules. However, the company has resolved to follow the corporate governance rules. The recommendations issued by the Committee on Corporate Governance build on a “comply or explain” principle, according to which listed Danish companies have the option of either com-plying with the recommendations or explaining the reasons for any non-compliance. The company complies with most of the recommendations.
The company also complies with the corporate governance code of Finance Denmark. This code is more comprehensive than the recommendations of the Corporate Governance Committee and also builds on a “comply or explain” principle.
Through the ownership of Danish Ship Finance Holding A/S, the company is partly owned by a private equity fund, which is a member of the Danish Venture Capital and Private Equity Association (DVCA), and the company is therefore subject to the DVCA guidelines. These guidelines build on a “comply or explain” principle and are available on DVCA’s website: www.dvca.dk. The company also complies with these guidelines.
The corporate governance reports must be published at least once a year. The reports are published on the company’s website in conjunction with the publication of the annual report.
Detailed information about corporate governance is provided in the reports on the company’s web-site: www.shipfinance.dk/investor-relations/
RemunerationThe company has drawn up a remuneration policy covering the Board of Directors, the Executive Board and all employees.
In 2017, a Remuneration Committee was set up. The Remuneration Committee undertakes the preparatory work which informs the Board of Directors’ decisions regarding remuneration, including the company’s remuneration policy and other related decisions which may affect the Group’s risk management etc. The remuneration policy is adopted at the general meeting.
No persons received a salary in excess of EUR 1 million in the financial year.
A specification of the total remuneration of the Board of Directors, the Executive Board and other employees whose activities are deemed to have a material impact on the company’s risk profile is given in note 8.
Further information on the remuneration policy is available on the company’s website: www.shipfinance.dk/investor-relations/

Audit CommitteeThe company has set up a statutory Audit Committee consisting of members of the Board of Directors. In composing the Audit Committee, the company has ensured that the Chairman of the Board of Directors does not act as the Chairman of the Audit Committee. It has also been ensured that the Committee has professional capabilities and experience in financial matters and in finance and accounting.
The Audit Committee consists of Anders Damgaard (Chairman), Peter Nyegaard and Michael N. Pedersen.
The Audit Committee is a preparatory and monitoring body. The duties of the Audit Committee are defined in the terms of reference of the Audit Committee. The Audit Committee is to inform the Board of Directors of the outcome of the statutory audit and assists the Board of Directors in monitoring the financial reporting process, monitoring the efficiency of the company’s internal control systems and risk management systems, monitoring the audit of the annual report, monitoring and verifying the independence of the auditors, and selecting and recommending new auditors.
The Audit Committee holds ordinary meetings three times a year, two of which take place prior to the presentations of the Annual Report and Interim Report, respectively. The Committee reports to the Board of Directors, and minutes of the Committee’s meetings are discussed at the first ordinary board meeting after the Audit Committee’s meeting.
Additional information on the Audit Committee is available on the company’s website: www.shipfinance.dk/the-company/executive-management/
Remuneration CommitteeThe company has set up a Remuneration Committee consisting of members of the Board of Directors.
The Remuneration Committee undertakes preparatory work and assists the Board of Directors in matters related to remuneration, with particular focus on members of the Board of Directors and the Executive Board, material risk-takers and other employees.
The Remuneration Committee monitors pay developments in the company in general. Furthermore, it ensures that the incentive programmes are designed to create sustained and long-term value and that the remuneration policy is complied with.
The Remuneration Committee consist of Eivind Kolding (Chairman), Christian Frigast, Thor Jørgen Guttormsen, Jacob Meldgaard and Henrik Sjøgreen.
Additional information on the Remuneration Committee is available on the company’s website: www.shipfinance.dk/the-company/executive-management/
51

Corporate social responsibilityThe CSR policy has been approved by the Board of Directors. It complies with the UN Global Com-pact, the UN Guiding Principles on Business and Human Rights and industry standards in Denmark. The purpose of the company’s CSR initiatives is to contribute to adding value to society at large and to the company itself. The starting point for the initiatives is that Danish Ship Finance is a financial company whose employees are all based in Denmark.
CSR is an integral part of the company’s corporate culture. The company focuses on CSR initiatives for in-house use and - where relevant - on addressing social responsibility in relation to its stake-holders. The following four focus areas have been defined:1. Human rights2. Human resources3. Environment and climate 4. Corruption and unusual gifts
The company endeavours to be an attractive workplace offering professional challenges, competency development, work-life balance, a flexible career path, senior programmes and healthcare insurance. The aim is to create high health and safety standards in the workplace, both physically and in relation to general well-being.
The company believes that respect for human rights is fundamental to our society. It is a mandatory approach internally at the company and a focus area in relation to external stakeholders.
Danish Ship Finance contributes actively to improving the environment within the areas of relevance to a financial company. With respect to customers, the company’s loan documents require them to comply with any legislation to which they are subject.
The company strongly disapproves of corruption in any form and has established internal anti-corruption guidelines, including for giving and accepting gifts.
More information on the company’s corporate social responsibility is provided in the CSR Report on the company’s website: www.shipfinance.dk/investor-relations/
52

53

54
At the end of 2017, Danish Ship Finance had 72 employees, of whom 25 were female and 47 were male.
To maintain its position as a leading provider of ship financing, it is essential that the company is able to attract and retain the most talented employees.
Our employees have high levels of education and are specialists within their areas of expertise. Resources are allocated to developing the competencies of individual employees. In 2017, courses and other training made up 1.0% of total staff costs. Training programmes are provided for both professional and personal development purposes. Employees have considerable influence over de-ciding which training programmes are relevant to them. The objectives of training are to upgrade employees’ qualifications and to motivate and challenge them.
According to an employee opinion survey conducted towards the end of 2017, employee satisfac-tion was generally high. The level has declined slightly, however, since the 2016 survey. The compa-ny will strive to maintain or increase the current level.
More information on the company’s employee opinion survey is provided in the CSR Report on the company’s website: www.shipfinance.dk/investor-relations/
Human resources
The average age of employees was unchanged at 44 years.
AGE DISTRIBUTION BY GENDER
NUMBER
20
15
10
5
0
Women Men
Years0-30 30-40 40-50 60+50-60

55
The above seniority chart shows that 52% of the employees have been with the company for
more than eight years, which accords with the high level of employee satisfaction. The average
length of service is ten years.
Employees generally have a high level of education and are specialists within their areas of
expertise.
EDUCATIONAL BACKGROUND
%
SENIORITY
60
45
30
15
0
%
Higher education 42
Bank clerk/business diploma 11
Other education 14 Higher education of medium length 10
Bank education 3
Graduate diploma in business administration 20
Years0-2 2-4 4-6 8+6-8
The Board of Directors and the Executive Board have today considered and approved the Annual Report of Danmarks Skibskredit A/S for the financial year 1 January – 31 December 2017. The Annual Report is presented in accordance with the Danish Financial Business Act. Furthermore, the Annual Report has been prepared in accordance with additional Danish disclosure requirements for annual reports of issuers of listed bonds.
In our opinion, the Management’s Report includes a fair review of developments in the activities and financial position of the company and fairly describes the principal risks and uncertainties that may affect the company.
Further, in our opinion, the financial statements give a true and fair view of the company’s assets, liabilities and financial position at 31 December 2017 and of the results of the company’s activities for the financial year 1 January – 31 December 2017.
The Annual Report is recommended for adoption by the annual general meeting on 26 March 2018.
Copenhagen, 26 February 2018
Management statement
Erik Ingvar Lassen
Chief Executive Officer
Per Schnack
Chief Financial Officer
Eivind
Drachmann Kolding
(Chairman)
Peter
Nyegaard
(Vice Chairman)
Marcus
Freuchen Christensen
Povl Christian
Lütken Frigast
Anders
Damgaard
Thor Jørgen
Guttormsen
Michael Nellemann
Pedersen
Jacob
Meldgaard
Christopher
Rex
Henrik Rohde
Søgaard
Henrik
Sjøgreen
Executive Board
Board of Directors
56

57
To the shareholders of Danish Ship Finance A/S (Danmarks Skibskredit A/S)
OpinionWe have audited the financial statements of Danish Ship Finance A/S (Danmarks Skibskredit A/S) for the financial year 1 January 2017 – 31 December 2017, comprising an income statement and statement of comprehensive income, balance sheet, statement of changes in equity and notes to the financial statements, including accounting policies. The financial statements are presented in accordance with the Danish Financial Business Act and additional Danish disclosure requirements for issuers of listed bonds.
In our opinion, the financial statements give a true and fair view of the company’s assets, liabilities and financial position at 31 December 2017 and of the results of the company’s operations for the financial year in accordance with the Danish Financial Business Act and additional Danish disclosure requirements for issuers of listed bonds.
Our opinion is consistent with our long-form audit report submitted to the Audit Committee and the Board of Directors.
Basis for opinionWe conducted our audit in accordance with International Standards on Auditing and additional requirements applicable in Denmark. Our responsibilities under those standards and requirements are further described under “Auditor’s responsibilities for the audit of the financial statements” in this auditor’s report. We are independent of the company in accordance with the IESBA Code of Ethics for Professional Accountants and additional requirements applicable in Denmark, and we have fulfilled our other ethical responsibilities in accordance with these requirements. We believe that the audit evidence we have obtained is sufficient and appropriate to provide a basis for our opinion.
To the best of our knowledge and belief, we have not provided any prohibited non-audit services as referred to in Article 5(1) of Regulation (EU) no. 537/2014.
We were elected as auditors of Danmarks Skibskredit A/S on 25 April 2005 for the financial year 2005. We have been re-elected annually by the general meeting for a consecutive assignment period of 13 years up to and including the financial year 2017.
Key audit mattersKey audit matters are those matters that, in our professional judgement, were of most significance in our audit of the financial statements for the financial year 1 January 2017 – 31 December 2017. These matters were addressed in the context of our audit of the financial statements as a whole, and in forming our opinion thereon, and we do not provide a separate opinion on these matters.
Independent auditor’s report

58
Loans amounted to DKK 34,492 million at 31 December 2017 (DKK 39,811 million at 31 December 2016), and loan impairment charges amounted to DKK 2,591 million in 2017 (DKK 2,516 million in 2016), cf. note 14 to the financial statements.
Measurement of loan impairment charges is considered a key audit matter as the determination of expected credit losses is based on management judgements and is highly subjective. Due to the significance of these judgements and the size of loans in the company, auditing loan impairment charges is considered a key audit matter. Changes in assumptions and the methodology applied may have a significant impact on the measurement of loan impairment charges.
The principles for determining loan impairment charges are described in the accounting policies, and Management has described the management of credit risks and the assessment of loan impairment charges in more detail in note 38 to the financial statements.
The matters relating to loans which are affected most significantly by management judgements and which therefore require increased attention during the audit are:· Evidence of impairment· Valuation of future cash flows, including collateral, which are included in the determination of
the need for loan impairment charges · Management judgements relating to the determination of expected credit losses.
HOW THE MATTER WAS ADDRESSED IN OUR AUDIT
Based on our risk assessment, our audit included reviewing Danish Ship Finance A/S’s relevant procedures for making loan impairment charges, testing relevant controls and analysing developments in the credit quality of loans etc., including the size of loan impairment charges.Our audit included the following elements:· Reviewing and assessing the company’s overall methodology for monitoring the risk of loan write-
offs, focusing especially on the credit monitoring function· Testing the company’s internal controls for identifying loans with objective evidence of a risk of
write-offs· Challenging the methodologies applied for the vessel types requiring the most significant
judgement by using our industry knowledge and experience, including a review of changes since last year
· Assessing the changes in the assumptions for the vessel types requiring the most significant judgement against shipping industry standards and historical data
· Performing a risk-based test of loans to ensure timely identification of impairment of loans and to ensure appropriate impairment charges
· Challenging management judgements focusing on consistency and objectivity of Management, including focusing on documentation of the adequacy of management judgements relating to vessel types in general.
LOAN IMPAIRMENT CHARGES

59
Management’s responsibilities for the financial statementsManagement is responsible for the preparation of financial statements that give a true and fair view in accordance with the Danish Financial Business Act and additional Danish disclosure requirements for issuers of listed bonds. Management is furthermore responsible for such internal control as Management determines is necessary to enable the preparation of financial statements that are free from material misstatement, whether due to fraud or error.
In preparing the financial statements, Management is responsible for assessing the company’s ability to continue as a going concern, for disclosing, as applicable, matters related to going concern, and for using the going concern basis of accounting in the preparation of the financial statements unless Management either intends to liquidate the company or to cease operations, or has no realistic alternative but to do so.
Auditor’s responsibilities for the audit of the financial statements Our objectives are to obtain reasonable assurance about whether the financial statements as a whole are free from material misstatement, whether due to fraud or error, and to issue an auditor’s report that includes our opinion. Reasonable assurance is a high level of assurance, but is not a guarantee that an audit conducted in accordance with International Standards on Auditing and additional requirements applicable in Denmark will always detect a material misstatement when it exists. Misstatements can arise from fraud or error and are considered material if, individually or in the aggregate, they could reasonably be expected to influence the economic decisions of users taken on the basis of these financial statements.
As part of an audit in accordance with International Standards on Auditing and additional re-quirements applicable in Denmark, we exercise professional judgement and maintain professional scepticism throughout the audit. We also: • Identify and assess the risks of material misstatement of the financial statements, whether due
to fraud or error, design and perform audit procedures responsive to those risks, and obtain audit evidence that is sufficient and appropriate to provide a basis for our opinion. The risk of not detecting a material misstatement resulting from fraud is higher than for one resulting from error, as fraud may involve collusion, forgery, intentional omissions, misrepresentations or the override of internal control.
• Obtain an understanding of internal control relevant to the audit in order to design audit pro-cedures that are appropriate in the circumstances, but not for the purpose of expressing an opinion on the effectiveness of the company’s internal control.

60
• Evaluate the appropriateness of accounting policies used and the reasonableness of accounting estimates and related disclosures made by Management.
• Conclude on the appropriateness of Management’s use of the going concern basis of accounting in the preparation of the financial statements, and, based on the audit evidence obtained, whether a material uncertainty exists related to events or conditions that may cast significant doubt on the company’s ability to continue as a going concern. If we conclude that a material uncertainty exists, we are required to draw attention in our auditor’s report to the related disclosures in the financial statements or, if such disclosures are inadequate, to modify our opinion. Our conclusions are based on the audit evidence obtained up to the date of our auditor’s report. However, future events or conditions may cause the company to cease to continue as a going concern.
• Evaluate the overall presentation, structure and content of the financial statements, including the disclosures in the notes, and whether the financial statements represent the underlying transactions and events in a manner that gives a true and fair view.
We communicate with those charged with governance regarding, among other matters, the planned scope and timing of the audit and significant audit findings, including any significant deficiencies in internal control that we identify during our audit.
We also provide those charged with governance with a statement that we have complied with relevant ethical requirements regarding independence, and to communicate with them all relationships and other matters that may reasonably be thought to bear on our independence, and where applicable, related safeguards.
From the matters communicated with those charged with governance, we determine those matters that were of most significance in the audit of the financial statements of the current period and are therefore the key audit matters. We describe these matters in our auditor’s report unless law or regulation precludes public disclosure about the matter or when, in extremely rare circumstances, we determine that a matter should not be communicated in our report because the adverse consequences of doing so would reasonably be expected to outweigh the public interest benefits of such communication.

61
Statement on the Management’s ReportManagement is responsible for the Management’s Report.
Our opinion on the financial statements does not cover the Management’s Report, and we do not express any form of assurance conclusion thereon.
In connection with our audit of the financial statements, our responsibility is to read the Management’s Report and, in doing so, consider whether the Management’s Report is materially inconsistent with the financial statements or our knowledge obtained in the audit or otherwise appears to be materially misstated.
Moreover, it is our responsibility to consider whether the Management’s Report provides the information required under the Danish Financial Business Act and additional Danish disclosure requirements for issuers of listed bonds.
Based on the work we have performed, we conclude that the Management’s Report is in accordance with the financial statements and has been prepared in accordance with the requirements of the Danish Financial Business Act and additional Danish disclosure requirements for issuers of listed bonds. We did not identify any material misstatement in the Management’s Report.
Copenhagen, 26 February 2018
DeloitteStatsautoriseret RevisionspartnerselskabCompany reg. (CVR) no. 33 96 35 56
Henrik Jacob Vilmann Wellejus Kasper Bruhn UdamState-Authorised Public Accountant State-Authorised Public AccountantMNE-no. 24807 MNE-no. 29421

6262
INCOME STATEMENT
NOTE 1 JANUARY - 31 DECEMBER DKK MILLION 2017 2016
3 Interest income 1,634 1,831
4 Interest expenses (998) (1.015)
5 Net interest income 635 817
Dividends on shares, etc. - 0
6 Fee and commission income 20 32
Fee and commission expenses - 0
Net interest and fee income 655 849
7 Market value adjustments 37 124
Other operating income 0 -
8, 9 Staff costs and administrative expenses (141) (120)
19,20 Depreciation and impairment of property, plant and equipment (2) (2)
14 Impairment charges on loans and receivables (122) (610)
Profit before tax 427 241
10 Tax (93) (54)
Net profit for the year 334 188
Other comprehensive income 10 15
Tax on other comprehensive income (2) (3)
Other comprehensive income after tax 8 12
Comprehensive income for the year 342 200
AMOUNT AVAILABLE FOR DISTRIBUTION
Distributable reserves 267 279
Comprehensive income for the year 342 200
Total 609 478
PROPOSED ALLOCATION OF PROFIT
Distribution 237 199
Other comprehensive income transferred to revaluation reserves 8 12
Distributable reserves 364 267
Total 609 47862

63
BALANCE SHEET
NOTE AT 31 DECEMBER DKK MILLION 2017 2016
ASSETS
11 Due from credit institutions and central banks 1,463 1,125
12,13,14 Loans and other receivables at amortised cost 34,492 39,811
15,16,17 Bonds at fair value 20,093 19,730
18 Shares, etc. 11 14
19 Land and buildings
Owner-occupied property 89 79
20 Other tangible assets 8 9
Current tax assets 51 149
25 Deferred tax assets 7 100
21 Other assets 1,947 1,603
Total assets 58,161 62,621
LIABILITIES AND EQUITY
Liabilities
22 Due to credit institutions and central banks 3,405 5,675
23 Issued bonds at amortised cost 42,467 42,352
17, 24 Other liabilities 2,981 5,430
Total liabilities 48,854 53,457
26 Equity
Share capital 333 333
Tied-up reserve capital 8,343 8,343
Revaluation reserves 29 21
Retained earnings 364 267
Proposed dividend for the financial year 237 199
Total equity 9,307 9,164
Total liabilities and equity 58,161 62,621
Total off-balance sheet items
28 Contingent liabilities 163 221
29 Other binding agreements 3,860 1,710
Total off-balance sheet items 4,024 1,931
63

64
Tied-up Revaluation Distributable Retained
DKK MILLION Share capital reserve capital reserves reserves earnings Total
Equity at 1 January 2016 333 8,343 10 1,279 413 10,378
Dividends distributed for
financial year 2015 - - - - (413) (413)
Extraordinary dividends - - - (1,000) - (1,000)
Amount for distribution - - 12 (11) 199 200
Equity at 31 December 2016 333 8,343 21 267 199 9,164
Dividends distributed - - - - (199) (199)
Amount for distribution - - 8 97 237 342
Equity at 31 December 2017 333 8,343 29 364 237 9,307
STATEMENT OF CHANGES IN EQUITY

65
LIST OF NOTES
1 ACCOUNTING POLICIES
2 KEY FIGURES
3 INTEREST INCOME
4 INTEREST EXPENSES
5 NET INTEREST INCOME
6 FEE AND COMMISSION INCOME
7 MARKET VALUE ADJUSTMENTS
8 STAFF COSTS AND ADMINISTRATIVE EXPENSES
9 AUDIT FEES
10 TAX
11 DUE FROM CREDIT INSTITUTIONS AND CENTRAL BANKS
12 LOANS AT AMORTISED COST. DEVELOPMENTS DURING THE YEAR
13 LOANS AT AMORTISED COST. SPECIFICATION OF LOANS AT YEAR-END
14 LOAN IMPAIRMENT CHARGES
15 BONDS AT FAIR VALUE
16 BOND HOLDINGS BY TIME TO MATURITY
17 CSA COLLATERAL
18 SHARES, ETC.
19 LAND AND BUILDINGS
20 OTHER TANGIBLE ASSETS
21 OTHER ASSETS
22 DUE TO CREDIT INSTITUTIONS AND CENTRAL BANKS
23 ISSUED BONDS AT AMORTISED COST
24 OTHER LIABILITIES
25 DEFERRED TAX
26 EQUITY
27 CAPITAL ADEQUACY
28 CONTINGENT LIABILITIES
29 OTHER BINDING AGREEMENTS
30 RELATED PARTIES
31 CONSOLIDATED FINANCIAL STATEMENTS
32 HEDGE ACCOUNTING
33 NOTIONAL PRINCIPALS OF OUTSTANDING DERIVATIVES
34 FAIR VALUES OF OUTSTANDING DERIVATIVES
35 EXCHANGE RATE RISK AND USE OF DERIVATIVES AT 31 DECEMBER 2017
36 MARKET RISK SENSITIVITY
37 FAIR VALUE OF FINANCIAL INSTRUMENTS MEASURED AT AMORTISED COST
38 CREDIT RISK
39 SUPPLEMENTARY NOTES WITHOUT REFERENCE
65
66
73
74
74
75
76
76
76
80
80
81
81
82
83
84
84
85
85
85
86
86
86
87
88
88
89
90
91
91
91
92
92
93
94
95
96
97
98
101

66
NOTES
ACCOUNTING POLICIES
General
The Annual Report has been prepared in accordance with the Danish Financial Business Act. Furthermore, the
financial statements have been prepared in accordance with additional Danish disclosure requirements for annual
reports of issuers of listed bonds.
The accounting policies are consistent with those applied last year.
The company is consolidated in the financial statements of Danmarks Skibskredit Holding A/S as both the
smallest and largest group entity.
Accounting estimates and assumptions
The preparation of the Annual Report is based on the management’s estimates and assumptions of future events
that will significantly affect the carrying amounts of assets and liabilities. The amounts most influenced by the
critical estimates and assumptions are:
• Valuation and loan impairment charges
• Fair value of financial instruments
The estimates and assumptions are based on premises that management finds reasonable but which are
inherently uncertain and unpredictable. The assumptions could for example be unexpected future events or
circumstances that arise. Therefore, such estimates and assumptions are difficult to make and will always entail
some degree of uncertainty, even under stable macroeconomic conditions, when they involve transactions with
customers and other counterparties. Accounting estimates and assumptions made on the balance sheet date
express management’s best estimate of such events and circumstances.
Valuation (measurement) and loan impairment charges
Individual loan impairment charges are subject to material estimates with respect to the time when objective
evidence of impairment (OEI) occurs. Individual impairment charges especially involve estimates associated with
assessing when debtors experience substantial financial difficulty.
Collective loan impairment charges especially involve estimates associated with assessing in which segments OEI
exists.
Once OEI exists, estimates are associated with estimating realisable values from ship mortgages etc. and expected
dividends from the individual loans.
Fair value of financial instruments
Measurements of financial instruments for which prices are quoted in an active market or which are based on
generally accepted models with observable market data are not subject to material estimates.
Measurements of financial instruments that are only to a limited extent based on observable market data,
are subject to estimates. This applies to unlisted shares and shares acquired through reconstruction of credit
exposures as well as certain bonds for which an active market does not exists. See Determination of fair value
below for a more detailed description.
Segment information
There is no meaningful segment information about the company’s business areas as per the definitions of the
executive order on financial reporting. Thus, the company’s internal reporting does not include any segmentation.
NOTE 1

67
Offsetting
Amounts due to and from the company are offset when the company has a legally enforceable right to set off the
recognised amounts and intends either to settle by way of netting or to realise the asset and settle the liability
simultaneously.
Translation of transactions in foreign currency
The financial statements are presented in Danish kroner, and the functional currency is Danish kroner.
On initial recognition, transactions in foreign currencies are translated into the functional currency at the
exchange rate ruling at the transaction date. Gains and losses on exchange rate differences arising between the
transaction date and the settlement date are recognised in the income statement.
Monetary assets and liabilities in foreign currency are translated at the exchange rates at the balance sheet date.
Exchange rate adjustments of monetary assets and liabilities arising as a result of differences in the exchange
rates applying at the transaction date and at the balance sheet date are recognised in the income statement.
Exchange rate adjustments are included in the fair value adjustment of the asset or liability.
Rounding
All figures in the financial statements are expressed in millions of Danish kroner with no decimals unless otherwise
stated. Figures stated as zero (0) denotes rounding off of an underlying value, and figures stated as a dash (-)
represent no value. Totals in the financial statements have been calculated on the basis of actual amounts. A
recalculation of the totals may in some cases result in rounding differences because the underlying decimals are
not disclosed in the financial statements.
Financial instruments – general
Purchases and sales of financial instruments are measured at their fair value as at the settlement date, which is
usually the same as the transaction price. See the description under the individual items. Before the settlement
date, changes in the value of financial instruments are recognised. Financial instruments are derecognised on the
settlement date when the right to receive (obligation to pay) cash flows from the financial asset or liability has
expired, or if it has been transferred, and the company has also transferred substantially all risks and rewards of
ownership.
Classification
Financial instruments are divided into financial assets and financial liabilities.
At the date of recognition, financial assets are divided into the following two categories:
• Trading book measured at fair value
• Loans and other financial receivables, measured at amortised cost
At the date of recognition, financial liabilities are divided into the following two categories:
• Trading book measured at fair value
• Other financial liabilities, measured at amortised cost
The trading book, which is measured at fair value, comprises the following financial assets and liabilities:
• Bonds at fair value
• Shares, etc.
• Derivatives (Other assets and Other liabilities)
Hedge accounting
The company uses derivatives to hedge the interest rate risk on fixed-rate liabilities measured at amortised cost.
NOTE 1
67
68
Hedged risks that meet specific criteria qualify for fair value hedge accounting and are treated accordingly. The
interest rate risk on the hedged liabilities is measured at fair value through profit or loss. The accounting treatment
of the hedged risk subsequently corresponds to the accounting treatment of the hedging instrument, which is
also recognised at fair value through profit or loss.
If the criteria for hedge accounting cease to be met, the accumulated value adjustment of the hedged item is
amortised over the remaining term to maturity.
Determination of fair value
The fair value of financial assets and liabilities is measured on the basis of quoted market prices of financial
instruments traded in active markets. If an active market exists, fair value is based on the most recently observed
market price at the balance sheet date.
If the market for one or more financial assets or liabilities is illiquid or if there is no publicly recognised price, the
institution will determine the fair value using recognised valuation techniques. Such techniques comprise the use
of similar recent transactions between independent parties, reference to other similar instruments, discounted
cash flow analyses and other models based on observable market data.
If no active market exists, the fair value of standard and simple financial instruments such as interest rate and
currency swaps and unlisted bonds, is measured according to generally accepted valuation techniques. Market-
based parameters are used for measuring fair value, and the fair value of derivatives is subject to credit valuation
adjustment (CVA) derived from changes to financial counterparty credit risk.
The fair value of more complex financial instruments, such as swaptions, interest rate caps and floors and other
OTC products and unlisted holdings is measured on the basis of internal models, many of which are based on
valuation techniques generally accepted within the industry.
The fair value of shares, etc. is measured on the basis of listed market prices at the balance sheet date.
BALANCE SHEET
Amounts due from credit institutions and central banks
Amounts due from credit institutions and central banks include amounts due from other credit institutions.
Reverse transactions, that is purchases of securities from credit institutions to be resold at a later date, are
recognised as amounts due from credit institutions and central banks. On subsequent recognition, amounts due
from credit institutions and central banks are measured at amortised cost, which corresponds to the nominal
amount.
Loans
Loans consist of credit exposures which have been disbursed directly to the borrower and credit exposures arising
through syndication. Loans comprise traditional loans against mortgages in ships and financing for building ships.
On initial recognition, loans are measured at fair value plus transaction costs less origination fees and other
charges. Subsequently, loans are measured at amortised cost according to the effective interest method, less any
impairment charges if there is objective evidence of impairment. See below. The difference between the value
at initial recognition and the nominal value is amortised over the term to maturity and recognised under Interest
income.
Loan impairment charges
The company makes impairment charges to account for any impairment that occurs after initial recognition.
Impairment charges are made both as individual charges and collective charges and rely on a number of
estimates. Irrespective of the category, loan impairment charges are made at an individual loan level.
NOTE 1

69
Individual loan impairment charges are made when objective evidence of impairment (OEI) has been ascertained
pursuant to Annex 10 of the Executive Order on Financial Reports and the Danish FSA guidelines and the
discounted value of the expected future cash flows is lower than the carrying amount of the loan. In other words,
the loan is impaired.
OEI on individual loans exists if at least one of the following events has occurred:
• Default if at least one of the following situations has occurred:
- A loss is deemed inevitable
- Bankruptcy or other in-court reconstruction
- Past due/arrears for in 90 days or more
- Foreclosure
- Non-accrual interest
• The borrower is experiencing significant financial difficulty
• Past due/arrears, unless the problem is short-term and the amounts concerned are small by comparison to the
borrower’s financial situation or if due to errors or technical problems
• Loans with more lenient repayment terms, including forbearance, which the company, for reasons relating to
the borrower’s financial difficulty, would not otherwise have granted
OEI exists for groups of loans when the outlook for a vessel segment is considered to be of such a nature that,
based on experience, it involves a higher risk of loss.
The impairment charge on the individual loan made in case of OEI either individually or collectively is determined
by multiplying the probability of default (PD), fixed on the basis of a specific assessment of the borrower’s
creditworthiness, by the loss given default (LGD) on the loan. Loss given default is calculated as the difference
between the market value of the loan and the estimated collateral value (Sx) of the mortgaged vessel(s) in a
weak market and any other collateral. In a few situations where the model is believed to either overestimate or
underestimate the impairment, an adjustment will be made on the basis of a management estimate.
The collateral value of ship mortgages is calculated by discounting the expected earnings per day in a weak
market for the specific vessel type. The calculation is made on the basis of a fixed amount used throughout the
estimated residual life of the vessel, and an expected sale within twelve months. The interest rate originally agreed
for the loan is used as the discount factor. Subsequently, the estimated selling costs are deducted. The earnings of
a vessel fall throughout the life of the vessel because of increased maintenance work, relatively poorer operating
economy etc. The value of earnings per day in a weak market is thus adjusted by an adjustment factor over the
estimated residual life of the vessel. Ongoing efforts are made to improve the calculation method for the sales
value of the ship mortgages in a weak market.
When calculating the value of the ship mortgages, a deduction is therefore made relative to the obtained or fixed
market value to reflect that the sale in such situations is typically made in a weak market. The deduction has been
adjusted and broken down on relevant sub-segments, for example according to vessel size.
Bonds at fair value
Bonds at fair value comprises financial assets in the form of debt instruments acquired or concluded with a view
to a subsequent sale or repurchase.
The bonds are measured on initial recognition at fair value excluding transaction costs and subsequently at fair
value with value adjustment through the income statement.
NOTE 1
69

70
Shares, etc.
Shares, etc. comprises investments in sector shares and shares acquired through reconstruction of loan
exposures.
The shares are measured on initial recognition at fair value excluding transaction costs and subsequently at fair
value with value adjustment through the income statement.
Shares acquired through reconstruction of credit exposures are measured at cost less impairment charges.
Land and buildings
Land and buildings consist of the company’s owner-occupied property located at Sankt Annæ Plads 3, DK-1250
Copenhagen, Denmark.
Owner-occupied property
On initial recognition, domicile properties used for the company’s own operations are measured at cost. Owner-
occupied property is subsequently measured at the revalued amount plus property improvement expenditures
and less depreciation and impairment charges. Revaluations and any reversals of previous revaluations are made
via comprehensive income, while any impairment relative to cost is made via the income statement.
The straight-line depreciation of the property is based on the expected scrap value and an estimated useful life of
100 years.
Other tangible assets
Other tangible assets consist of operating equipment, vehicles and furniture, which are recognised at cost less
accumulated depreciation and impairment charges. Depreciation is provided on a straight-line basis over the
expected useful life of the assets considering the assets’ residual values. The expected useful life is typically three
years.
Other assets
Other assets include interest and commission due, prepayments and derivatives with a positive market value.
Future payments that the company is likely to receive are recognised as amounts due at present value.
Due to credit institutions and central banks
Amounts due to credit institutions and central banks include amounts received under repo transactions, that
is, sales of securities to be repurchased at a later date. Amounts due to credit institutions and central banks are
measured at amortised cost, which corresponds to the nominal amount.
Issued bonds at amortised cost
Issued bonds comprise the ship mortgage bonds and debenture bonds issued by the company, which are
recognised at amortised cost with the addition of the fair value of the hedged interest rate risk.
Issued bonds are measured at amortised cost (i.e. including discount at issuance and any commission that is
considered an integral part of the effective rate of interest).
Pursuant to the rules on hedge accounting, the fair value of the hedged interest rate risk for fixed-rate issued
bonds is recognised.
The portfolio of own bonds is deducted from the line item “Issued bonds at amortised cost” using the amortised
cost with the addition of the value of any hedging transaction attaching thereto.
Interest income from the portfolio of own bonds is set off against interest expenses for own bonds.
NOTE 1

71
Other liabilities
Other provisions are recognised and measured as the best estimate of the costs required to settle the liabilities
at the balance sheet date. Provisions with an expected term of more than a year after the balance sheet date are
measured at discounted value. Other liabilities include accrued interest, prepayments, derivatives with a negative
market value and other provisions such as provisions relating to guarantees. The liability is recognised at the
present value of expected payments.
Deferred tax assets and deferred tax liabilities
Deferred tax is calculated in accordance with the balance sheet liability method on all temporary differences
between the tax base of the assets and liabilities and their carrying amounts. Deferred tax is recognised in the
balance sheet under Deferred tax assets and Deferred tax liabilities on the basis of the tax rates at which they are
expected to crystallise.
Deferred tax assets arising from unused tax losses are recognised to the extent that it is probable that such losses
can be offset against taxable income in the following financial year. Therefore, recognition of deferred tax assets
requires that management assesses the probability and size of future taxable income.
Equity
Equity comprises issued share capital, tied up reserve capital, retained earnings, revaluation reserves and the net
profit for the period.
Proposed dividends
The Board of Directors’ proposal for dividends for the year submitted to the general meeting is recognised in
equity as a component of the net profit for the period. Dividends are recognised as a liability when the annual
general meeting has adopted the proposal to distribute dividends.
OFF-BALANCE SHEET ITEMS
Contingent liabilities
Contingent liabilities comprise guarantee commitments made as part of the lending activities.
Owing to its business volume, the company may be a party to various lawsuits. Such lawsuits are regularly
assessed and the necessary provisions are made on the basis of an assessment of the risk of incurring a loss.
Other binding agreements
Other binding agreements comprise irrevocable credit commitments made and unutilised drawing rights on loans
with revolving credit facilities provided as part of the lending activities.
INCOME STATEMENT AND STATEMENT OF COMPREHENSIVE INCOME
Interest income and expenses
Interest income and expenses in respect of interest-bearing financial instruments measured at amortised cost
are recognised in the income statement applying the effective interest method based on the cost of the financial
instrument. Interest includes amortisation of fees which are an integral part of the effective yield of the financial
instrument, including origination fees, and amortisation of any additional difference between cost and redemption
price.
Interest income and expenses also include interest on financial instruments measured at fair value.
Recognition of interest on loans with impairment is made on the basis of the value after impairment.
NOTE 1
71

72
Fee and commission income and expenses
Fee and commission income and expenses are generated by activities. Commission for services provided over a
period of time, such as guarantee commission and commitment fees, is accrued over the period.
Market value adjustments
Market value adjustments comprise realised and unrealised market value adjustments of financial instruments at
fair value, i.e. shares, bonds and derivatives and exchange rate adjustments.
STAFF COSTS AND ADMINISTRATIVE EXPENSES
Staff costs
Salaries and other consideration expected to be paid for work carried out during the year are expensed under
Staff costs and administrative expenses. This item comprises salaries, bonuses, holiday allowances, jubilee
bonuses, pension costs, payroll tax and other consideration.
Bonuses and share-based payments
Bonuses and share-based payments are expensed as they are earned.
Pension costs
The company’s contributions to defined contribution plans are recognised in the income statement as they are
earned by the staff. The company has no defined benefit plans.
Depreciation and impairment of tangible assets
The item consists only of depreciation and impairment of the owner-occupied property and other tangible assets.
Loan impairment charges
The item includes write-offs on and impairment charges for loans, amounts due from credit institutions and
guarantees.
Tax
Current and deferred tax calculated on profit for the year adjusted for tax on the taxable income of previous years
are recognised in the income statement. Income tax for the year is recognised in the income statement on the
basis of the current income tax rate, adjusted for non-taxable income and non-deductible expenses.
NOTE 1

73
KEY FIGURES, DKK MILLION 2017 2016 2015 2014 2013
Net interest income from lending 500 589 623 565 541
Net interest income from finance activities 135 228 242 255 350
Total net interest income 635 817 865 820 891
Net interest and fee income 655 849 906 934 937
Market value adjustments 37 124 (177) 123 (25)
Staff costs and administrative expenses (141) (120) (113) (98) (97)
Loan impairment charges etc. (122) (610) (46) 1,103 (166)
Profit before tax 427 241 569 2,061 647
Net profit for the year 334 188 413 1,568 477
Loans 34,492 39,811 43,171 43,347 42,383
Bonds 20,093 19,730 19,100 18,680 21,066
Equity 9,307 9,164 10,378 11,146 9,983
Total assets 58,161 62,621 64,873 69,374 67,222
KEY RATIOS 2017 2016 2015 2014 2013
Common equity tier 1 capital ratio 19.7 17.2 17.3 16.4 17.0
Tier 1 capital ratio 19.7 17.2 17.3 16.4 17.0
Total capital ratio 19.7 17.2 17.3 16.4 17.0
Return on equity before tax (%) 4.6 2.5 5.3 19.5 6.5
Return on equity after tax (%) 3.6 1.9 3.8 14.8 4.8
Income/cost ratio (DKK) *) 2.6 1.3 4.5 (1.1) 3.4
Income/cost ratio (ex. impairment charges) 4.8 8.0 6.4 10.6 9.3
Foreign exchange position (%) 10.8 4.5 7.1 8.5 11.5
Gearing of loans 3.7 4.3 4.2 3.9 4.2
Annual growth in lending (%) (13.4) (7.8) (0.4) 2.3 (8.6)
Impairment ratio for the year 0.3 1.4 0.1 (2.4) 0.4
Accumulated impairment ratio 7.0 5.9 4.3 4.3 6.7
Rate of return on assets (%) 0.6 0.3 0.6 2.3 0.7
The key figures are calculated in accordance with Appendix 5 of the Danish FSA’s instructions for financial reports for credit institutions, etc.
*) In accordance with the instructions, the income/cost ratio must be calculated including loan impairment charges. The list of
key figures also includes a income/cost ratio in which the impairment charges are not included.
NOTE 2
73

74
DKK MILLION 2017 2016
INTEREST INCOME
Due from credit institutions and central banks 18 14
Loans and other receivables 1,279 1,349
Bonds 295 385
Other interest income 0 0
Derivatives
Interest rate contracts 36 82
Foreign exchange contracts 6 1
Total interest income 1,634 1,831
Of this amount, income from genuine purchase and resale
transactions recognised in:
Due from credit institutions and central banks 13 11
INTEREST EXPENSES
Credit institutions and central banks (13) (5)
Issued bonds (392) (578)
Other interest expenses (135) (115)
Derivatives
Interest rate contracts (458) (317)
Total interest expenses (998) (1,015)
Of this amount, interest expenses on genuine sale and repurchase
transactions recognised in:
Due to credit institutions and central banks (2) (2)
Interest from own bonds deducted in:
Issued bonds - (1)
NOTE 3
NOTE 4

75
DKK MILLION 2017 2016
NET INTEREST INCOME
Net interest income from lending
Loans and other receivables 1,279 1,349
Bonds 33 42
Due from credit institutions 8 12
Interest to credit institutions (11) (2)
Issued bonds (392) (578)
Derivatives
Interest rate contracts (423) (235)
Foreign exchange contracts 6 1
Total net interest income from lending 500 589
Net interest income from asset management
Bonds 262 343
Due from credit institutions 10 2
Other interest income 0 -
Interest to credit institutions (2) (3)
Other interest expenses (135) (115)
Total net interest income from asset management 135 228
Total net interest income 635 817
NOTE 5
75

76
DKK MILLION 2017 2016
FEE AND COMMISSION INCOME
Guarantee commission 2 4
Fee and other commission income 18 28
Total fee and commission income 20 32
MARKET VALUE ADJUSTMENTS
Market value adjustment of bonds (61) 487
Market value adjustment of shares (3) (6)
Exchange rate adjustments (30) 4
Market value adjustment of derivatives 130 (361)
Total market value adjustments 37 124
STAFF COSTS AND ADMINISTRATIVE EXPENSES
Remuneration of Board of Directors and Executive Board
Executive Board (12) (11)
Board of Directors (2) (2)
Total remuneration of Board of Directors and Executive Board (14) (13)
Staff costs
Salaries and wages (65) (57)
Pensions (6) (6)
Social security costs and financial services employer tax (19) (14)
Total staff costs (90) (77)
Other administrative expenses (37) (30)
Total staff costs and administrative expenses (141) (120)
Number of employees - full-time equivalents 71 69
Average number of employees - full-time equivalents 70 68
NOTE 6
NOTE 7
NOTE 8

77
REMUNERATION OF THE BOARD OF DIRECTORS
Ordinary Committee Total
2017 fee fee fees
Eivind Kolding (Chairman) 550 550
Peter Nyegaard (Vice Chairman) *) - -
Anders Damgaard *) - -
Christian Frigast *) - -
Michael Nellemann Pedersen *) 188 104 292
Henrik Sjøgreen *) 188 75 263
Jacob Meldgaard (member as of 16 Juni 2017) *) 100 75 175
Thor Jørgen Guttormsen (member as of 16 June 2017) *) 100 75 175
Henrik Rohde Søgaard **) 188 188
Marcus Freuchen Christensen **) 188 188
Christopher Rex **) 188 188
Total 1,688 329 2,017
Ordinary Committee Total
2016 fee fee fees
New members as of 15 November 2016
Eivind Kolding (Chairman) - -
Peter Nyegaard (Vice Chairman) *) - -
Anders Damgård *) - -
Christian Frigast - -
Michael Nellemann Pedersen *) - -
Henrik Sjøgreen - -
Continuing members as of 15 November 2016
Henrik Rohde Søgaard **) 175 175
Marcus Freuchen Christensen **) 175 175
Christopher Rex **) 175 175
Retired as of 15 November 2016
Peter Lybecker (Chairman) 350 350
Jesper Teddy Lok (Vice Chairman) 262 262
Fatiha Benali 175 58 233
Jenny N. Braat 175 175
Glenn Söderholm 175 58 233
Jan B. Kjærvik 175 58 233
Total 1,837 174 2,011
*) Member of Audit Committee or Remuneration Committee at year-end**) Employee representative
DKK ’000
NOTE 8
CONTINUED
77

78
NOTE 8
CONTINUED
DKK ’000 2017 2016
REMUNERATION OF EXECUTIVE BOARD
Erik I. Lassen
Salary 3,985 3,583
Pension 492 383
Tax value of car 128 118
Retention bonus 1,902 -
Incentive bonus - 1.804
Total 6,507 5,888
Per Schnack
Salary 3,691 3,505
Pension 455 347
Tax value of car 149 147
Retention bonus 1,777 -
Incentive bonus - 1,655
Total 6,072 5,653
The Retention bonus paid to the Executive Board is provided as equity-like instruments
(Total Shareholder Return) with a deferral period of four years and a retention period in
accordance with applicable legislation.
The Executive Board also receives a Retention bonus in Danish Ship Finance Holding A/S
in the form of Warrants. The related costs are recognised in Danish Ship Finance Holding
A/S.
The incentive bonus to the Executive Board is allocated on the basis of the sale of the
company in the previous financial year. The bonus is evenly distributed between a cash
consideration and remuneration bonds, 40% of which were granted in 2016 while
the remaining part will be acquired over the subsequent four years depending on the
company’s future financial status.
The Executive Board’s pension plan is a defined contribution plan, and the company
may terminate Executive Board members’ contracts of service by giving 18 months’
notice.
The company has no further pension obligations towards members of the Executive
Board.
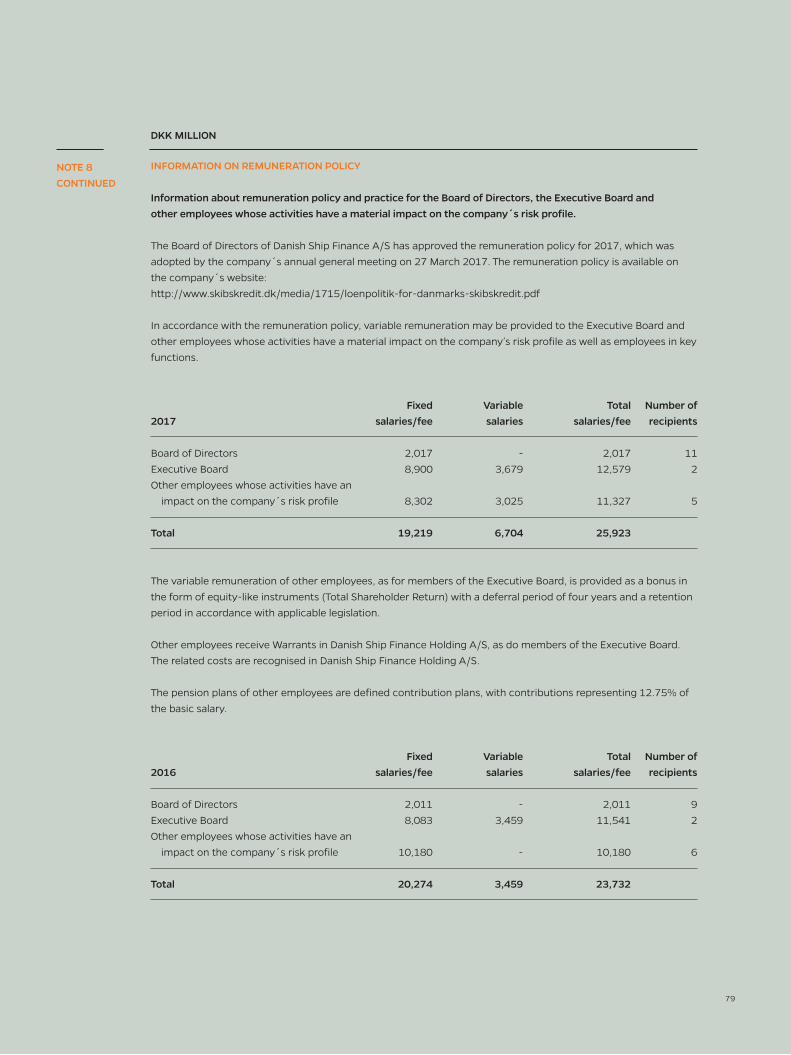
79
INFORMATION ON REMUNERATION POLICY
Information about remuneration policy and practice for the Board of Directors, the Executive Board and
other employees whose activities have a material impact on the company´s risk profile.
The Board of Directors of Danish Ship Finance A/S has approved the remuneration policy for 2017, which was
adopted by the company´s annual general meeting on 27 March 2017. The remuneration policy is available on
the company´s website:
http://www.skibskredit.dk/media/1715/loenpolitik-for-danmarks-skibskredit.pdf
In accordance with the remuneration policy, variable remuneration may be provided to the Executive Board and
other employees whose activities have a material impact on the company’s risk profile as well as employees in key
functions.
Fixed Variable Total Number of
2017 salaries/fee salaries salaries/fee recipients
Board of Directors 2,017 - 2,017 11
Executive Board 8,900 3,679 12,579 2
Other employees whose activities have an
impact on the company´s risk profile 8,302 3,025 11,327 5
Total 19,219 6,704 25,923
The variable remuneration of other employees, as for members of the Executive Board, is provided as a bonus in
the form of equity-like instruments (Total Shareholder Return) with a deferral period of four years and a retention
period in accordance with applicable legislation.
Other employees receive Warrants in Danish Ship Finance Holding A/S, as do members of the Executive Board.
The related costs are recognised in Danish Ship Finance Holding A/S.
The pension plans of other employees are defined contribution plans, with contributions representing 12.75% of
the basic salary.
Fixed Variable Total Number of
2016 salaries/fee salaries salaries/fee recipients
Board of Directors 2,011 - 2,011 9
Executive Board 8,083 3,459 11,541 2
Other employees whose activities have an
impact on the company´s risk profile 10,180 - 10,180 6
Total 20,274 3,459 23,732
NOTE 8
CONTINUED
DKK MILLION
79

80
NOTE 10 TAX
Tax on profit for the year
Estimated tax on profit for the year (3) -
Changes in deferred tax (91) (54)
Adjustment for reduction of corporation tax rate - 0
Adjustment of prior-year tax charges 1 0
Total tax (93) (54)
Tax on other comprehensive income
Deferred tax (2) (3)
Total tax (2) (3)
Effective tax rate Pct. Pct.
Tax rate in Denmark 22.0 22.0
Non-taxable income and non-deductible expenses 0.5 1.8
Adjustment of prior-year tax charges (0.2) (0.2)
Effective tax rate 22.3 23.6
DKK MILLION 2017 2016
AUDIT FEES
Fees for statutory audit of financial statements (0.6) (0.6)
Fees for tax advisory services (0.1) (0.1)
Fees for non-audit services (0.1) (0.5)
Fees for other assurance engagements (0.3) (0.2)
Total fees (1.1) (1.4)
Fees for non-audit services provided by Deloitte Statsautoriserede
Revisionspartnerselskab to Danish Ship Finance A/S cover various assurance
reports, review of the Interim Report, and VAT and tax advisory services.
NOTE 9

81
NOTE 12 LOANS AT AMORTISED COST
At 1 January 39,811 43,171
Additions 6,914 4,560
Ordinary repayments and redemptions (5,493) (5,589)
Extraordinary repayments (2,443) (2,843)
Net change concerning revolving credit facilities (100) (174)
Exchange rate adjustment of loans (4,111) 1,236
Change in amortised cost for the year (12) 11
Depreciation, amortisation and impairment for the year (74) (559)
At 31 December 34,492 39,811
DKK MILLION 2017 2016
DUE FROM CREDIT INSTITUTIONS AND CENTRAL BANKS
Genuine purchase and resale transactions (reverse repo) 1,006 391
Other receivables 457 734
Total due from credit institutions and central banks 1,463 1,125
Broken down by due date
Demand deposits 17 7
Up to 3 months 1,446 1,118
Total due from credit institutions and central banks 1,463 1,125
The company has no term deposits with central banks.
NOTE 11
81

82
DKK MILLION 2017 2016
LOANS AT AMORTISED COST
Gross loans at exchange rates at the balance sheet date 37,083 42,328
Loan impairment charges (2,591) (2,516)
Total loans 34,492 39,811
Total loans broken down by due date
Up to 3 months 1,245 2,923
From 3 months to 1 year 5,223 5,484
From 1 to 5 years 22,623 26,499
Over 5 years 5,402 4,905
Total loans 34,492 39,811
Total loans
Loans at fair value 35,387 40,340
Loans at amortised cost 34,492 39,811
Loans at fair value is an approximation based on amortised cost
with the addition of the value of fixed-rate loans.
Loans subject to individual impairment charges
Value of loans with objective evidence of impairment.
Loans with more lenient repayment terms, incl. forbearance 5,361 6,389
Impairment charges (2,234) (1,819)
Total loans with more lenient repayment terms, incl. forbearance 3,127 4,570
Other loans with objective evidence of impairment 532 608
Impairment charges (146) (157)
Total other loans with objective evidence of impairment 386 451
Total loans and receivables subject to individual impairment 3,513 5,021
Reference is made to note 38 setting out LTV ranges for the entire loan portfolioand for loans subject to individual impairment.
NOTE 13

83
DKK MILLION 2017 2016
LOAN IMPAIRMENT CHARGES
The following impairment charges were made on loans
Individual impairment charges 2,380 1,977
Impairment charges with a collective component 211 540
Total loan impairment charges 2,591 2,516
As a percentage of loans and impairment charges and guarantee commitments
Individual impairment charges 6.4 4.6
Impairment charges with a collective component 0.6 1.3
Total loan impairment charges 7.0 5.9
Distribution of loan impairment charges
Amount offset against loans 2,591 2,516
Total loan impairment charges 2,591 2,516
Movements in loan impairment charges
At 1 January 2,516 1,958
Additions 748 1,214
Reversal of impairment charges from previous years (550) (560)
Losses covered by impairment charges from previous years (124) (95)
Total impairment charges 2,591 2,516
Losses on and impairment charges on receivables
New impairment charges (748) (1,214)
Reversed impairment charges 550 560
Reclassification of interest 51 38
Received on claims previously written off 25 6
Total losses on and impairment charges on loans (122) (610)
NOTE 14
83

84
DKK MILLION 2017 2016
BONDS AT FAIR VALUE
Bond portfolio
Non-callable bonds 12,759 13,972
Callable bonds 7,334 5,758
Portfolio of bonds, total 20,093 19,730
Bond portfolio
Government bonds and bonds issued by Kommune Kredit 5,380 3,753
Mortgage bonds 14,713 15,977
Portfolio of bonds, total 20,093 19,730
BOND HOLDINGS BY TIME TO MATURITY
Bond portfolio
Bonds with a maturity up to and including 1 year 323 945
Bonds with a maturity over 1 year and up to and including 5 years 6,886 8,871
Bonds with a maturity over 5 years and up to and including 10 years 4,449 3,579
Bonds with a maturity over 10 years 8,435 6,335
Portfolio of bonds, total 20,093 19,730
NOTE 15
NOTE 16

85
DKK MILLION 2017 2016
CSA COLLATERAL
Collateral under CSA agreements
Collateral received 109 127
Collateral delivered (467) (627)
Net value of collateral under CSA agreements (359) (500)
The bonds received and delivered have been recognised in the balance
sheet so that they reduce the market values under derivatives by the
market value of the bonds at the balance sheet date, and the portfolio
of bonds at fair value has been adjusted correspondingly by the net
market value hereof.
SHARES, ETC.
Shares listed on Nasdaq Copenhagen A/S 7 10
Unlisted shares recognised at fair value 3 3
Total shares, etc. 11 14
LAND AND BUILDINGS
Owner-occupied property
Revaluation, 1 January 80 65
Revaluations 10 15
Revaluation incl. improvements, 31 December 90 80
Revaluation incl. improvements, 31 December 1 1
Depreciation for the year 0 0
Accumulated depreciation, 31 December 1 1
Total revaluation, 31 December 89 79
The owner-occupied property is the office property at Sankt Annæ Plads 3,
Copenhagen, which was valued at DKK 79 million at the most recent public
property valuation on 1 October 2016.
The owner-occupied property has been valued based on existing budgets
for property and the rent level for similar properties in the area.
Consequently, revaluations have been made to the recognised value.
External experts were not involved in valuing the owner-occupied property.
NOTE 17
NOTE 18
NOTE 19
85

86
DKK MILLION 2017 2016
OTHER TANGIBLE ASSETS
Cost, 1 January 30 28
Additions during the year 1 2
Disposals during the year (1) -
Cost, 31 December 30 30
Accumulated depreciation, 1 January 21 20
Disposals during the year (1) -
Depreciation during the year 2 2
Accumulated depreciation, 31 December 22 21
Total other tangible assets 8 9
DUE TO CREDIT INSTITUTIONS AND CENTRAL BANKS
Repo transactions 3,390 5,450
Other amounts due 15 225
Total due to credit institutions and central banks 3,405 5,675
Broken down by due date
On demand 15 225
Up to 3 months 3,390 5,450
Total due to credit institutions and central banks 3,405 5,675
OTHER ASSETS
Interest receivable 260 356
Prepayments to swap counterparties 16 18
Derivatives 1,661 1,221
Miscellaneous receivables 10 9
Total other assets 1,947 1,603
NOTE 20
NOTE 22
NOTE 21

87
DKK MILLION 2017 2016
ISSUED BONDS AT AMORTISED COST
At 1 January 42,352 45,067
Additions in connection with pre-issuance 19,161 6,337
Amortisation of cost (36) 28
Adjustment for hedge accounting 14 (163)
Exchange rate adjustment (376) 99
Own bonds - 465
Ordinary and extraordinary redemptions (18,648) (9.481)
At 31 December 42,467 42,352
Specification of issued bonds
Bonds issued in DKK
Bullet bonds 39,693 37,818
Amortising CIRR bonds 623 739
Total Danish bonds 40,316 38,557
Bonds issued in foreign currency
Amortising CIRR bonds, at year-end exchange rates 2,151 3,795
Total bonds issued in foreign currency 2,151 3,795
Own bonds - -
Total issued bonds 42,467 42,352
Broken down by term to maturity
Up to 3 months 2,610 2,439
From 3 months to 1 year 258 1,045
From 1 to 5 years 19,079 29,217
Over 5 years 20,520 9,651
Issued bonds, total before set-off against portfolio
of own bonds 42,467 42,352
Own bonds - -
Total issued bonds 42,467 42,352
NOTE 23
87

88
DKK MILLION 2017 2016
OTHER LIABILITIES
Interest payable 219 266
Derivatives 2,721 5,163
Other liabilities 41 0
Total other liabilities 2,981 5,430
DEFERRED TAX
Deferred tax, 1 January (100) (157)
Estimated deferred tax on profit for the year 93 57
Adjustment for reduction of corporation tax rate (7) (100)
2017 2017 2017 2016
Deferred Deferred Deferred Deferred
tax tax tax tax
assets liabilities net net
Property, plant and equipment 0 9 9 7
Loans (36) - (36) (34)
Shares, etc. (4) - (4) -
Issued bonds - 144 144 53
Employee obligations (1) - (1) (1)
Balance of tax losses (120) - (120) (126)
Total deferred tax (161) 154 (7) (100)
NOTE 24
NOTE 25
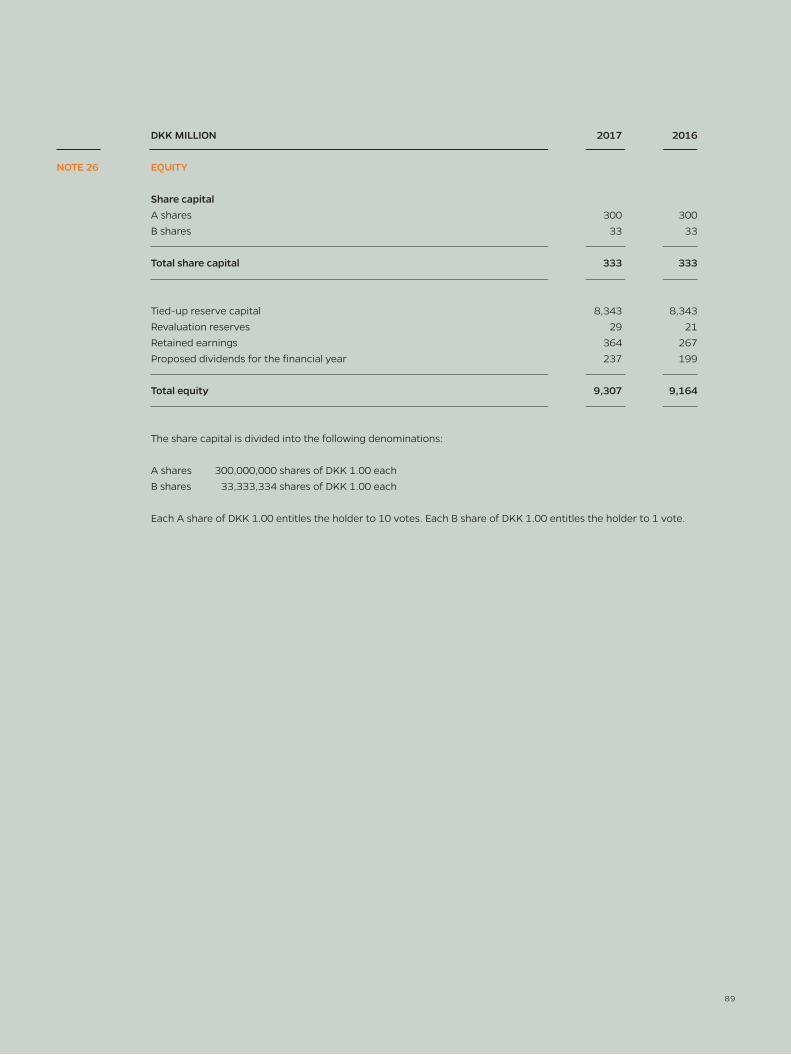
89
DKK MILLION 2017 2016
EQUITY
Share capital
A shares 300 300
B shares 33 33
Total share capital 333 333
Tied-up reserve capital 8,343 8,343
Revaluation reserves 29 21
Retained earnings 364 267
Proposed dividends for the financial year 237 199
Total equity 9,307 9,164
The share capital is divided into the following denominations:
A shares 300,000,000 shares of DKK 1.00 each
B shares 33,333,334 shares of DKK 1.00 each
Each A share of DKK 1.00 entitles the holder to 10 votes. Each B share of DKK 1.00 entitles the holder to 1 vote.
NOTE 26
89

90
DKK MILLION 2017 2016
CAPITAL ADEQUACY
Common equity tier 1 capital
Share capital A shares 300 300
Share capital B shares 33 33
Tied-up reserve capital 8,343 8,343
Proposed dividend 601 466
Revaluation reserves 29 21
Total common equity tier 1 capital 9,307 9,164
Deductions from common equity tier 1 capital
Retained earnings 237 199
Additional capital charge pursuant to the Executive Order
on a Ship Finance Institute 94 142
Prudent valuation pursuant to Article 105 of CRR 26 28
Deductions pursuant to transitional rules regarding B share capital *) 20 13
Total deductions from common equity tier 1 capital 377 383
Common equity tier 1 capital after deductions 8,930 8,781
Own funds after deductions 8,930 8,781
Risk exposure amount
Risk exposure amount for assets outside the trading book 35,458 42,153
Risk exposure amount for off-balance sheet items 2,101 1,075
Risk exposure amount for counterparty risk outside the trading book 1,639 1,659
Risk exposure amount for market risk 4,618 4,383
Risk exposure amount for operational risk 1,497 1,725
Total risk exposure amount 45,312 50,995
Common equity tier 1 capital ratio 19.7 17.2
Tier 1 capital ratio 19.7 17.2
Total capital ratio 19.7 17.2
The risk exposure amount for market risk consists of:
Position risk related to debt instruments 3,632 3,959
Position risk related to shares 21 27
Total currency position 965 397
Total risk-weighted items involving market risk 4,618 4,383
*) Recognised at 40% pursuant to transitional rules of CRR art. 484 at 31 December 2017
(January 1 to December 31 2016 recognised at 60%).
NOTE 27

91
DKK MILLION 2017 2016
CONTINGENT LIABILITIES
In the ordinary course of its lending operations,
Danish Ship Finance has undertaken guarantee commitments of 163 218
Payment guarantee provided to the Danish Securities Centre 0 2
Guarantees provided to the Danish Securities Centre 0 1
Total contingent liabilities 163 221
OTHER BINDING AGREEMENTS
In the ordinary course of its lending operations, Danish Ship Finance
has undertaken commitments in relation to unutilised drawing rights
on loans with revolving credit facilities in the amount of 553 317
In the ordinary course of its lending operations, Danish Ship Finance
has undertaken commitments relating to irrevocable credit commitments
on other loans in the amount of 3,307 1,393
Total other binding agreements 3,860 1,710
NOTE 28
NOTE 29
NOTE 30
91
RELATED PARTIES
Related parties comprise members of the company’s Executive Board and Board of
Directors.
Related parties furthermore comprise Danmarks Skibskredit Holding A/S, which holds
an ownership interest of 86.2% and more than 20% of the voting rights in the company.
Danmarks Skibskredit Holding A/S is owned by Axcel, PFA and PKA, which hold more
than 20% of the share capital each and more than 20% of the voting rights each and
are therefore also related parties of Danmarks Skibskredit A/S.
Transactions with the Executive Board and the Board of Directors only concerned remu-
neration. See note 8.
Related-party transactions concerning loans and loan offers totalled a nominal amount
of DKK 1,025 million at 31 December 2017 (at 31 December 2016: DKK 0).
Furthermore, related-party transactions included settlement of administration services
provided by Danmarks Skibskredit Holding A/S and dividends to Danmarks Skibskredit
Holding A/S.
There were no related-party transactions other than those stated above.
Other related-party transactions prior to 15 November 2016 involved deposits and
debt, transactions with financial instruments in the form of swap agreements, forward
exchange transactions, forward interest and currency agreements and forward securiti-
es transactions etc., which were settled on an arm’s length basis. In special cases, howe-
ver, the terms and conditions were made in accordance with shipyard subsidy schemes
or international rules on government participation in the financing of newbuildings.

92
DKK MILLION
CONSOLIDATED FINANCIAL STATEMENTS
Danish Ship Finance A/S is included in the consolidated financial statements of Danish Ship Finance Holding A/S.
The consolidated financial statements are available on request from Danish Ship Finance Holding A/S, Sankt
Annæ Plads 3, DK-1250 Copenhagen K.
HEDGE ACCOUNTING
The company regularly hedges the interest rate risk on fixed-rate assets and liabilities.
The effectiveness of such hedges is measured on a regular basis.
2017 NOMINAL CARRYING FAIR
VALUE AMOUNT VALUE
Commitments
Issued bonds 10,047 10,369 10,593
Total commitments 10,047 10,369 10,593
Derivatives
Interest rate swaps (10,047) (275) (275)
Total derivatives (10,047) (275) (275)
Net 0 10,095 10,319
2016 NOMINAL CARRYING FAIR
VALUE AMOUNT VALUE
Commitments
Issued bonds 9,841 10,422 10,511
Total commitments 9,841 10,422 10,511
Derivatives
Interest rate swaps (9,841) (700) (700)
Total derivatives (9,841) (700) (700)
Net 0 9,722 9,811
NOTE 31
NOTE 32

93
DKK MILLION 2017 2016
NOTIONAL PRINCIPALS OF OUTSTANDING DERIVATIVES
Swap agreements
Swap agreements have been made with the following parties
to hedge the exchange rate exposure on loans and issued bonds:
Receivables 623 1,399
Credit institutions 40,579 36,965
Swap agreements have been made with the following parties
to hedge the interest rate risk exposure on loans, bonds and issued bonds:
Receivables - 660
Credit institutions 47,537 48,140
Swap agreements, for which financial risks are not
fully hedged, have been made with the following parties:
Credit institutions 48,360 40,970
Forward interest rate and currency agreements:
Forward interest rate and currency agreements have been made with
the following parties to hedge interest rate and exchange rate risk:
Credit institutions 23,250 16,024
NOTE 33
93
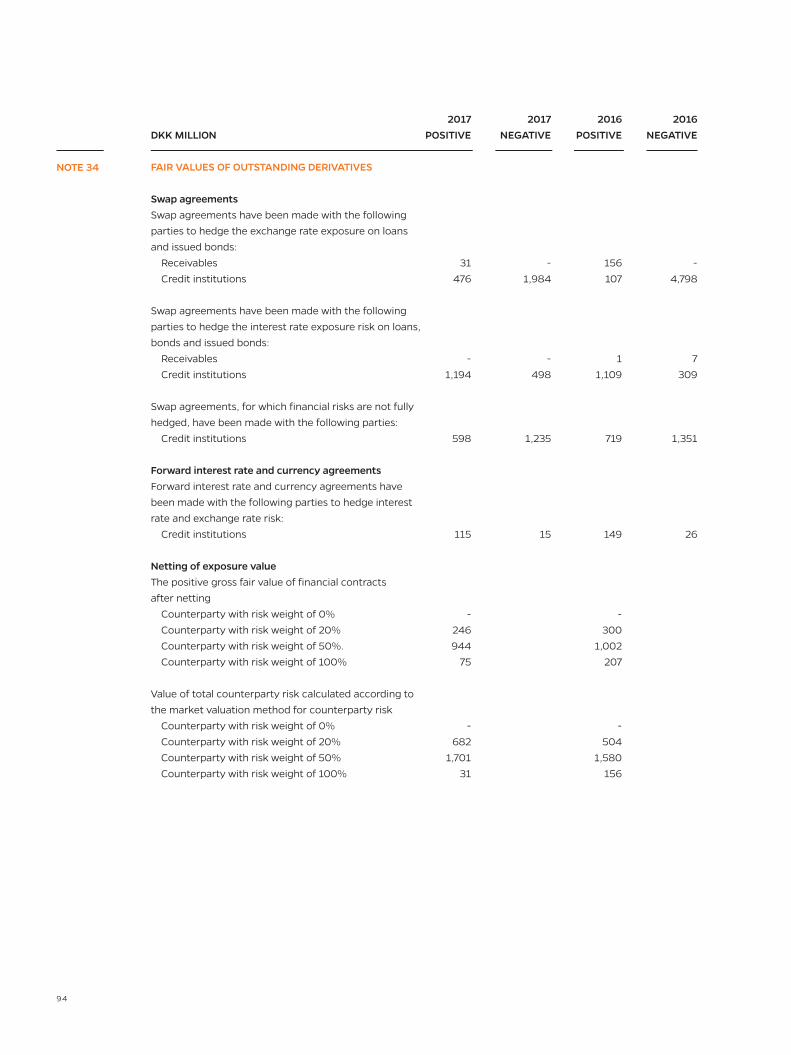
94
2017 2017 2016 2016
DKK MILLION POSITIVE NEGATIVE POSITIVE NEGATIVE
FAIR VALUES OF OUTSTANDING DERIVATIVES
Swap agreements
Swap agreements have been made with the following
parties to hedge the exchange rate exposure on loans
and issued bonds:
Receivables 31 - 156 -
Credit institutions 476 1,984 107 4,798
Swap agreements have been made with the following
parties to hedge the interest rate exposure risk on loans,
bonds and issued bonds:
Receivables - - 1 7
Credit institutions 1,194 498 1,109 309
Swap agreements, for which financial risks are not fully
hedged, have been made with the following parties:
Credit institutions 598 1,235 719 1,351
Forward interest rate and currency agreements
Forward interest rate and currency agreements have
been made with the following parties to hedge interest
rate and exchange rate risk:
Credit institutions 115 15 149 26
Netting of exposure value
The positive gross fair value of financial contracts
after netting
Counterparty with risk weight of 0% - -
Counterparty with risk weight of 20% 246 300
Counterparty with risk weight of 50%. 944 1,002
Counterparty with risk weight of 100% 75 207
Value of total counterparty risk calculated according to
the market valuation method for counterparty risk
Counterparty with risk weight of 0% - -
Counterparty with risk weight of 20% 682 504
Counterparty with risk weight of 50% 1,701 1,580
Counterparty with risk weight of 100% 31 156
NOTE 34
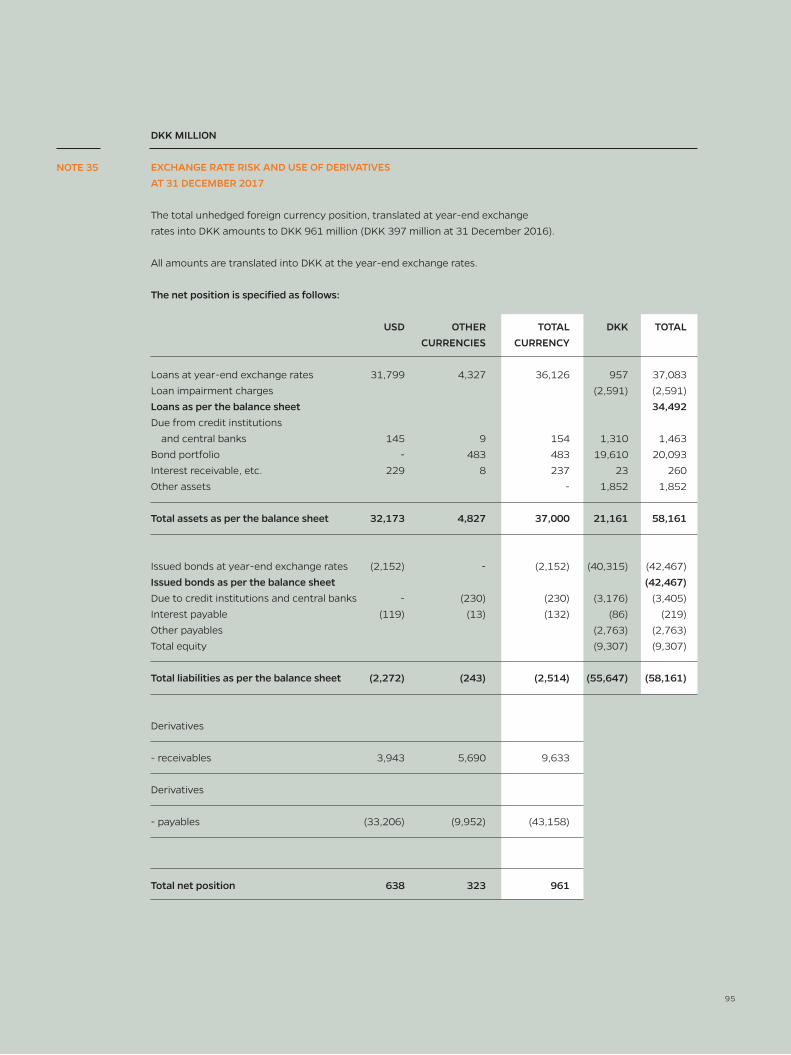
95
DKK MILLION
EXCHANGE RATE RISK AND USE OF DERIVATIVES
AT 31 DECEMBER 2017
The total unhedged foreign currency position, translated at year-end exchange
rates into DKK amounts to DKK 961 million (DKK 397 million at 31 December 2016).
All amounts are translated into DKK at the year-end exchange rates.
The net position is specified as follows:
USD OTHER TOTAL DKK TOTAL
CURRENCIES CURRENCY
Loans at year-end exchange rates 31,799 4,327 36,126 957 37,083
Loan impairment charges (2,591) (2,591)
Loans as per the balance sheet 34,492
Due from credit institutions
and central banks 145 9 154 1,310 1,463
Bond portfolio - 483 483 19,610 20,093
Interest receivable, etc. 229 8 237 23 260
Other assets - 1,852 1,852
Total assets as per the balance sheet 32,173 4,827 37,000 21,161 58,161
Issued bonds at year-end exchange rates (2,152) - (2,152) (40,315) (42,467)
Issued bonds as per the balance sheet (42,467)
Due to credit institutions and central banks - (230) (230) (3,176) (3,405)
Interest payable (119) (13) (132) (86) (219)
Other payables (2,763) (2,763)
Total equity (9,307) (9,307)
Total liabilities as per the balance sheet (2,272) (243) (2,514) (55,647) (58,161)
Derivatives
- receivables 3,943 5,690 9,633
Derivatives
- payables (33,206) (9,952) (43,158)
Total net position 638 323 961
NOTE 35
95

96
DKK MILLION 2017 2016
MARKET RISK SENSITIVITY
Interest rate risk
The company has substantial equity, which is invested primarily in
Danish government and mortgage bonds. Some of the bond
investments are in fixed-rate claims where the interest rate risk is
partly hedged using DKK or EUR interest rate swaps. In the
company’s internal calculations, EUR rates and DKK rates are
assumed to be fully correlated.
Calculated in accordance with internal calculation methods, the
interest rate risk associated with a 1 percentage point increase in
interest rates would technically lead to: (124) (114)
Calculated in accordance with internal calculation methods, the
interest rate risk associated with a 1 percentage point decrease in
interest rates would technically lead to: 93 84
Exchange rate risk
Most of the company’s loans are denominated in USD. Most of the
ship mortgages provided as collateral for the loan are also
denominated in USD. When calculating the collateral value of the
ship collateral for determining the level of impairment, a deduction
is made relative to the market value of the vessel. See note 1
Accounting policies. For loans on which loan impairment charges
have been made, there will typically be a difference in USD between
the size of the credit exposure and the mortgage values. Other things
being equal, the loan impairment charges will therefore be adversely
affected in case of an increase and positively affected by a fall in the
USD/DKK exchange rate. Since a small proportion of the loans are
denominated in currencies other than USD, while the ship mortgage
in question is valued in USD, the total positive net effect from a fall in
the USD/DKK exchange rate is reduced, and the sensitivity is thus
not symmetric in case of changes in the USD/DKK exchange rate.
Furthermore, earnings from lending is primarily denominated in USD,
which means that, other things being equal, an increase in the
USD/DKK rate would result in higher earnings from lending and vice
versa if the USD/DKK exchange rate falls.
An appreciation of the USD exchange rate vis-à-vis DKK
Change in profit for the year and equity (45) (13)
Percentage change in total capital ratio (2.1) (1.6)
A depreciation of the USD exchange rate vis-à-vis DKK
Change in profit for the year and equity 28 (8)
Percentage change in total capital ratio 2.7 1.9
NOTE 36

97
DKK MILLION 2017 2016
The impact on net profit for the year and equity from a change in
the exchange rate assumes a permanent change of DKK 1 for
an entire financial year. The impact comprises the change in the value
of ongoing net interest and fee income as well as the change in the
need for impairment charges due to the change in the exchange rate
of USD.
The impact on the total capital ratio on a change in the exchange rate of USD will
occur immediately after the exchange rate change, as most of the loans,
guarantees and loan offers are made in that currency.
FAIR VALUE OF FINANCIAL INSTRUMENTS
MEASURED AT AMORTISED COST
Financial instruments are measured in the balance sheet at fair value or
amortised cost.
The difference between carrying amounts and fair-value based values,
which are not recognised in the income statement and which are attributable
to the difference between the amortised cost and the calculated fair value is
shown below.
Loans
Measured at amortised cost 34,492 39,811
Measured at fair value 35,387 40,340
Difference between carrying amounts and fair-value based
value of loans, total 895 529
For loans, the fair value is calculated as an approximation based on
amortised cost for unmatched loans with the addition of the fair value
of fixed-rate matched loans
Issued bonds
Measured at amortised cost, incl. hedging 42,467 42,352
Measured at fair value 43,213 42,807
Difference between carrying amounts and fair-value based value
of issued bonds total 746 455
For issued bonds, the fair value is calculated on the basis of quoted
market prices. For unlisted bonds, the fair value is calculated on the
basis of observable market data.
NOTE 36
CONTINUED
NOTE 37
97

98
DKK MILLION 2017 2016
CREDIT RISK
Maximum credit risk without regard to collateral
All loans have been reviewed to identify any evidence of impairment. The company believes that the carrying
amount of loans subsequently stated best represents the maximum credit risk without regard to collateral in the
form of ship mortgages.
Credit exposure, loans and guarantees
Balance sheet
Loans at amortised cost 34,492 39,811
Other receivables 166 154
Allowance account 2,591 2,516
Total balance sheet items 37,249 42,482
Off-balance sheet items
Guarantees 163 218
Total off-balance sheet items 163 218
Total loans and guarantees 37,412 42,699
Financial exposure
Due from credit institutions and central banks 1,463 1,125
Bonds at fair value 20,093 19,730
Shares, etc. 11 14
Derivatives 1,661 1,221
Total financial exposure 23,228 22,090
CREDIT RISK IN THE LOAN PORTFOLIO
Exposures before loan impairment charges broken down by rating intervals, measured in terms of nominal
residual debt (DKKm).
RATING INTERVAL LOANS AND GUARANTEES 2017 LOANS AND GUARANTEES 2016
1 - 2 0 0
3 - 4 9,030 8,942
5 - 6 10,843 12,950
7 - 8 9,098 9,997
9 - 10 2,548 3,813
11 4,721 6,411
12 1,172 586
Total 37,412 42,699
Rating intervals 11 and 12 are loans with OEI.
NOTE 38

99
CREDIT RISK
Description of collateral
All loans are granted against a first lien mortgage in vessels, assignment in respect of the vessel’s
primary insurances and where relevant, supplementary collateral.
Percentage distribution of loans and guarantees after impairment calculated in the LTV ranges,
measured in terms of nominal residual debt.
LOAN TO VALUE RANGE SHARE OF LOANS 2017 SHARE OF LOANS 2016
0 - 20 % 37% 32%
20 - 40 % 34% 31%
40 - 60 % 24% 25%
60 - 80 % 5% 11%
80 - 90 % 0% 1%
90 - 100 % 0% 0%
Over 100 % 0% 0%
It appears from the table above that 95% (88% in 2016) of the loan amounts is secured through mortgages
within 60% of the most recently calculated market value of the mortgage, and 100% (99% in 2016) of the loans
are within 80% of the most recently calculated market value of the mortgage.
The weighted loan-to-value ratio on the loan portfolio was 57% (66% in 2016) after impairment charges.
The market value of the vessels in the loan portfolio has aggregately decreased by 14.0% since the end of
December 2016 measured in DKK and decreased by 2.2% in USD. The values are affected by developments in
the exchange rate, which resulted in a larger decline in USD than in DKK.
Credit quality on loans neither subject to default or impairment
All loans have been reviewed to identify any evidence of impairment, and the company has made the
impairment charges it considered necessary.
The credit quality of loans that are subsequently not subject to impairment or arrears, is considered strong.
Arrears
There are no loans in arrears on which the company has not made impairment charges.
NOTE 38
CONTINUE
99

100
CREDIT RISK
Percentage distribution of loans and guarantees subject to individual impairmanet charges, cf. note 13.
The distribution is made after impairment charges calculated in the LTV ranges (by nominal outstanding debt).
LOAN TO VALUE RANGE SHARE OF LOANS 2017 SHARE OF LOANS 2016
0 - 20 % 38% 34%
20 - 40 % 36% 33%
40 - 60 % 24% 27%
60 - 80 % 2% 6%
80 - 90 % 0% 0%
90 - 100 % 0% 0%
Over 100 % 0% 0%
It appears from the table above that 98% (94% in 2016) of the loan amounts is secured through mortgages
within 60% of the most recently market value of the mortgage, and 100% (100% in 2016) of the loans are
within 80% of the most recently calculated market value of the mortgage.
The weighted loan-to-value ratio on loans subject to individual charges was 54% after impairment
charges (61% in 2016).
NOTE 38
CONTINUED

101
SUPPLEMENTARY NOTES WITHOUT REFERENCE
FINANCIAL RISKS AND POLICIES FOR FINANCIAL RISK MANAGEMENT
RISK MANAGEMENT
Danish Ship Finance is exposed to different types of risk.
The most important types of risk are:
- Credit risk: The risk of loss because counterparties fail to meet all or part of their payment obligations
- Market risk: The risk of loss resulting from changes in the fair value of the Group’s assets and liabilities
as a result of changes in market conditions.
CREDIT RISK
Credit risk is the risk of loss because counterparties fail to meet all or part of their payment obligations,
including risk associated with customers in financial difficulty, large exposures, concentration risk and
risk on granted, unexercised loans.
The overall credit risk is managed on the basis of the company’s credit policy, which the Board of
Directors determines together with the overall risk management framework. The key objective of the
credit policy is to ensure that earnings and risks are balanced, and that the assumption of risk is always
quantified.
The credit process is controlled centrally. The Executive Board and the Head of Credit have been
allocated authorities by the Board of Directors allowing them to grant loans up to pre-determined limits.
Other loans are granted by the Board of Directors. The granting of loans must be disclosed at the
subsequent ordinary board meeting. Note 38 includes a more detailed description of credit risk.
Danish Ship Finance has developed IT tools for managing and monitoring credit risks. The credit
analysis system is used for monitoring purposes and it records key data regarding credit exposures and
customers’ financial standing.
This is done to detect danger signals for exposures at an early stage as well as to monitor portfolios and
organisational units.
In addition, a number of risk events have been defined as representing objective evidence of impairment.
NOTE 39
101

102
MARKET RISK
Market risk is defined as the risk of changes in the market value of the company’s financial assets and
liabilities because of changes in market conditions.
Market risk can be divided into interest rate risk, equity price risk, currency risk and liquidity risk.
The Board of Directors determines the general policies, frameworks and principles for risk management.
The policies cover the identification and calculation of various types of market risk. The frameworks
indicate specific limits on the extent of risk the company is ready to assume. The principles establish the
methods to be used in calculating the various risk targets.
The Board of Directors receives continuous reporting on risk developments and the utilisation of allocated
risk limits.
The purpose of the company’s market risk policy is to ensure that the market risk at all times is
appropriate in relation to the total capital. The objective of the market risk policy is also to ensure that the
company consistently maintains adequate and appropriate handling and management of market risk.
The Risk Management function of the Finance Department is responsible for calculating, monitoring,
controlling and reporting market risk to the Board of Directors and Executive Board. The market risks
are managed and monitored via a risk management system. The company follows up on all types of
market risk with respect to all units subject to instructions, and failure to comply with instructions are
reported upstream in the organization.
Notes 35-36 include more detailed descriptions of exchange rate risk and market risk sensitivity.
For further information, please see the unaudited Risk Report at www.shipfinance.dk
NOTE 39
CONTINUED

103
Management and directorships etc.
Directorships and executive positions – Board of DirectorsThis section lists positions, other directorships, executive positions and fiduciary positions held by board members at the date of publication of the Annual Report for 2017. The length of tenure the board members have served and their special competencies are also shown. Board members elected by the general meeting are elected for a term of one year and board mem-bers elected by the employees are elected for a term of four years.

104
Eivind Kolding
ChairmanChairman of the Remuneration CommitteeBorn on 16 November 1959Nationality: DanishConsidered to be an independent board memberJoined the Board of Directors on 15 November 2016Nominated by Danish Ship Finance Holding A/S
Directorships and executive positions:Chairman of CASA A/SMember of the Board of Directors:Leo Holding A/SBiQ ApSNNIT A/S
Competencies:Broad knowledge of shipping and the maritime industry, macroeconomics, banking, credit, insurance and finance, financial risk management, regulation and general management of international business.
Peter Nyegaard, CFO and Partner, Axcel
Vice ChairmanMember of the Audit CommitteeBorn on 16 May 1963Nationality: DanishConsidered to be an independent board memberJoined the Board of Directors on 15 November 2016Nominated by Axcel
Directorships and executive positions:Chairman of FIHMember of the Board of Directors of Øens Murerfirma A/SChairman/member of a number of boards in the Axcel Group
Competencies:Broad knowledge of general management of international companies, financial risk management, financial regulation, capital markets, credit, financing and macroeconomics.

105
Anders Damgaard, Group CFO, PFA Pension
Chairman of the Audit CommitteeBorn on 8 August 1970Nationality: DanishConsidered to be an independent board memberJoined the Board of Directors on 15 November 2016Nominated by PFA
Directorships and executive positions:Chairman of the Board of Directors: PFA Asset Management A/SPFA Ejendomme A/SPFA KapitalforeningPFA Boliger A/SPFA Kollegier ApSPFA Property Investment A/SMember of the Board of Directors:Blue Equity Management A/SDanish Ship Finance Holding A/S
Competencies:Broad knowledge of financial business (including banking), credit, investment, finance, regulation and financial risk management.
Christian Frigast, Partner, Axcel
Member of the Remuneration CommitteeBorn on 23 November 1951Nationality: DanishConsidered to be an independent board memberJoined the Board of Directors on 15 November 2016Nominated by Axcel
Directorships and executive positions:Chairman of the Board of Directors: Axcel ManagementDanish Ship Finance Holding A/SEKF (Denmark’s Export Credit Agency)Axcelfuture, Axcel’s think tankVice Chairman of the Board of Directors: PANDORADVCA (Danish Venture Capital end Private Equity Association)Axcel Advisory BoardMember of the Board of Directors: Nordic WaterproofingNissens A/SThe Board Leadership Society in DenmarkAssociate professor at CBS (Copenhagen Business School)
Competencies:Broad knowledge of banking, finance, financial risk management, management of international companies, M&A, restructuring, operational efficiency and value proposition strategies.

106
Thor Jørgen Guttormsen
Member of the Remuneration Committee Born on 5 January 1949 Nationality: Norwegian Considered to be an independent board memberJoined the Board of Directors on 16 June 2017Nominated by Danish Ship Finance Holding A/S
Other directorshipsMember of the Board of Directors: Høegh Autoliners Holdings ASHøegh LNG ASHøegh LNG Holdings Ltd (alternate)Telenor Maritime ASAequitas Ltd
Competencies:Broad knowledge of shipping, the maritime industry and general management.
Jacob Meldgaard, CEO, Torm A/S
Member of the Remuneration CommitteeBorn on 24 June 1968Nationality: DanishConsidered to be an independent board memberJoined the Board of Directors on 16 June 2017Nominated by Danish Ship Finance Holding A/S
Directorships and executive positions:Member of the Board of Directors: Danish Shipping (Danske rederier)The Danish Maritime Fund (until July 2017)SyfoglomadTORM PlcTORM A/S TORM Singapore Pte. Ltd.TORM FondenLong Range 2 A/S FR8 Holdings Pte. Ltd. OCM Holdings MRs Ltd.
Competencies:Broad knowledge of shipping and the maritime industry, general management, investment, finance and restructuring.

107
Michael N. Pedersen, Management Executive, PKA A/S
Member of the Audit CommitteeBorn on 8 July 1961Nationality: DanishConsidered to be an independent board memberJoined the Board of Directors on 15 November 2016Nominated by PKA
Directorships and executive positions:Management Executive of: Property companies owned by the three pension funds managed by PKA A/SEjendomsselskabet DronningegårdenOPP HoldCo ApSA/S Kjøbenhavns EjendomsselskabForstædernes EjendomsaktieselskabChairman/member of Advisory Board and investment committees of various foundations relating to private equity, infrastructure and micro finance due to PKA’s investment in such foundationsMember of the Board of Directors: Danish Ship Finance Holding A/SPKA Pensions Forsikringsselskab A/SRefshaleøen Holding A/SRefshaleøens Ejendomsselskab A/SPKA AIP A/SPKA Alternative Investments ApSMargretheholmen P/SKomplementarselskabet Margretheholm ApSPKA Skejby Komplementar ApSPKA Skejby P/SHotel Koldingfjord A/SPoppelstykket 12 A/SP/S PKAE EjendomPKA AE ApSInvesteringsselskabet af 24. februar 2015 A/S
Competencies:Broad knowledge of financial business (including pension fund operations), credit, investment, finance, regulation and financial risk management.

108
Henrik Sjøgreen, CEO, FIH A/S
Member of the Remuneration CommitteeBorn on 30 July 1964Nationality: DanishConsidered to be an independent board memberJoined the Board of Directors on 15 November 2016Nominated by Danish Ship Finance Holding A/S
Directorships and executive positions:Chairman of the Board of Directors: FIH Partners A/SSimon Fougner Hartmanns FundCEO of FIH A/SCEO FIH Holding A/S
Competencies:Broad knowledge of banking, credit, insurance and finance, financialrisk management, debt markets and general management.
Marcus F. Christensen, Senior Relationship Manager, Danish Ship Finance A/S
Employee representativeBorn on 20 November 1979Nationality: DanishJoined the Board of Directors on 29 March 2012
Competencies:Broad knowledge of credit, ship financing and handling of problem loans through his position as Senior Relationship Manager with Danish Ship Finance A/S.
Christopher Rex, Head of Research, Danish Ship Finance A/S
Employee representativeBorn on 28 January 1979Nationality: DanishJoined the Board of Directors on 29 March 2012
Competencies:Broad knowledge of macroeconomics, financial risk management and international shipping through his position as Head of Research with Danish Ship Finance A/S.
Senior Relationship Manager Henrik R. Søgaard, Senior Relationship ManagerDanish Ship Finance A/S
Employee representativeBorn on 9 February 1959Nationality: DanishJoined the Board of Directors on 24 April 2008
Competencies:Broad knowledge of credit, ship financing and handling of problem loans through his position as Senior Relationship Manager with Danish Ship Finance A/S.

109
Executive Board
Erik I. Lassen, CEOMember of the Executive Board since 9 April 2008Executive positions in other business enterprises:CEO of Danish Ship Finance Holding A/S
Per Schnack, CFOMember of the Executive Board since 9 April 2008Executive positions in other business enterprises:Member of the Executive Board of Danish Ship Finance Holding A/S
ATTENDANCE AT MEETINGS 2017
Attendance rate (%) Board of Audit Remuneration Directors Committee Committee (**)
Eivind Kolding 100 100Peter Nyegaard 100 100 Marcus F. Christensen 89 Anders Damgaard 89 100 Christian Frigast 89 0Thor Jørgen Guttormsen (*) 83 100Michael N. Pedersen 100 100 Jacob Meldgaard (*) 100 100Christopher Rex 89 Henrik R. Søgaard 100 Henrik Sjøgreen 67 100
(*) Joined the Board of Directors on 16 June 2017.(**) The Remuneration Committee held one meeting relating to the 2017 financial year.

Layout & production: Sylvester Hvid & Co., Illustrations: Mads Berg


1
DA
NIS
H S
HIP
FIN
AN
CE
AN
NU
AL
RE
PO
RT
20
17
CVR NO. 27 49 26 49
Danish Ship FinanceAnnual Report 2017
DANISH SHIP FINANCE A/S (DANMARKS SKIBSKREDIT A/S)
Sankt Annæ Plads 3 / DK-1250 Copenhagen K
Tel. +45 33 33 93 33 / Fax +45 33 33 96 66 / CVR no. 27 49 26 49
[email protected] / www.shipfinance.dk