danish ship finance 2020
TRANSCRIPT

Annual Report >
DANISH SHIP FINANCE2020
WWW.SHIPFINANCE.DK CVR NO. 27 49 26 49

MANAGEMENT REPORT
> Letter to our stakeholders 3
> Danish Ship Finance at a glance 5
> The year in summary 8
> Financial review by business area 9
> Summary of financials 17
> Credit risk from lending 22
> Capital, funding and liquidity 28
> Investor relations 35
> Human resources 4 1
> Internal control and risk management 42
FINANCIAL STATEMENTS
> Income statement 45
> Balance sheet 46
> Statement of changes in equity 47
> Notes 48
STATEMENTS
> Statement by Management 90
> Independent auditor’s report 9 1
MANAGEMENT AND DIRECTORSHIPS
> Management and directorships 95
> Financial calendar for 2021 1 0 0
TABLE OF CONTENTS
2 Annual Report 2020

LETTER TO OUR STAKEHOLDERS 2020 was an unusually eventful year. Our strong growth trajectory was unfortunately pushed back by the Covid-19 pandemic, which also negatively affected our result. Fortunately, credit quality remained good and no loans defaulted during the year.
The promising start to 2020 took a dramatic turn in the first quarter when the Covid-19 pandemic spread across the world. A series of health-motivated restrictions on social and economic activity, trade and travel brought consequences that we all had to deal with, not least triggering a global reces-sion that rivalled the global financial crisis of 2008-09 in severity but over a compressed period of time.
The effects of the global Covid-19 crisis directly impacted our result: severe turmoil in financial markets in March-April led to a significant full-year investment loss of DKK 99 million. This was followed by disruptions to oil markets in April-May, which led us to increase loan impairments in the Offshore segments.
A significant positive in this very challenging period was that credit quality outside Offshore held up well; no loans defaulted during the year and more clients than usual were able to prepay their loans. At the same time, vessel new-build activity was very limited, making the industry very well placed to sustain profitability while managing future changes in global trade. This resilience stems from the shipping industry’s ability to swiftly adapt to new circum-stances.
MANAGEMENT REPORT • LETTER TO OUR STAKEHOLDERS
"The promising start to 2020 took a dramatic turn in the first quarter when the Covid-19 pandemic spread across the world "
3 Annual Report 2020

In addition to lower newbuilding activity, the myriad chal-lenges and increased uncertainty due to Covid-19 tempo-rarily reduced trading in secondhand vessels and demand for sale & purchase loan financing. This led to a fall in the volume of outstanding loans, further exacerbated by the depreciation of the USD against our reporting currency of DKK.
These factors contributed to an unexpectedly low net result of DKK 117 million for the year and a loan book that stood at a lower-than-expected DKK 33.6 billion at the end of 2020. All told, the events of 2020 have delayed our growth plans by 12-18 months.
Our top strategic priority for 2021 is to re-establish the strong momentum in our lending business and resume the growth trajectory that we enjoyed before the global Covid-19 outbreak.
It is encouraging that market activity started to return to-wards the end of 2020, as evidenced by a strong pipeline of lending transactions, and we remain optimistic about the 2021 outlook.
Looking ahead, we find it reassuring for the shipping indus- try that the order book stands at only 7 %, the lowest level in this millennium. This will support a healthy supply- demand balance in the coming years and bodes well for the credit quality of our loan book.
Throughout last year, we maintained our focus on develop-ing a sustainability agenda with our clients. It was our first full year with internal client sustainability ratings, and these have proved a valuable tool in our credit decision process and our dialogue with clients. Moreover, we granted three new loans with pricing linked to carbon emissions and an-ticipate offering more such loans in the coming years.
In late November, we concluded our first Poseidon Princi-ples reporting, on 2019 CO2 emissions data. At the outset, the ships collateralising our loan portfolio reported an aver-age energy intensity slightly above the trajectory required for reaching the IMO’s 2050 decarbonisation target. We are nevertheless very pleased with our clients’ willingness to engage and provide the required data for the initiative. This will support even more productive dialogue on battling the industry’s carbon footprint going forward.
In 2020, we had to reinvent the way we interacted with our clients and other stakeholders, and how we worked togeth-er internally. Our employees remained safe and our opera-tional contingency plans held up flawlessly, enabling us to fully support our clients through a challenging year.
We would like to thank our employees for their hard work in extraordinary circumstances.
Despite unusual working conditions, we made good progress with our strategic focus on improving internal processes to optimise our business, support commercial priorities and facilitate the implementation of new regulatory require-ments during the year. In particular, we took steps to fur-ther strengthen our data, investment and risk management infrastructure.
We completed the acquisition of a new domicile property in the first half of the year and expect to relocate in 2022. We are excited about the opportunities that will arise from being in modern offices with contemporary facilities that enable better workflows but are also a little sad to be leaving our beautiful historic building at Sankt Annæ Plads 3.
Eivind Kolding Erik I. Lassen Chairman Chief Executive Officer
MANAGEMENT REPORT • LETTER TO OUR STAKEHOLDERS
" Looking ahead, we find it reassuring for the shipping industry that the order book stands at only 7 %, the lowest level in this millennium. This will support a healthy supply-demand balance in the coming years and bodes well for the credit quality of our loan book"
4 Annual Report 2020

MANAGEMENT REPORT • DANISH SHIP FINANCE AT A GLANCE
On average, our Senior Relationship Managers have more than 15 years of
shipping experience
We have in-house shipping research, as well as technical survey, marine
legal and marine insurance expertise
Our headquarters is located in Copenhagen, enabling us to tap into
strong shipping competencies
Our lean organisation enables quick decision making to the benefit of
clients
Loan book of DKK 33.6 billion, collateralised by 792 vessels
DANISH SHIP FINANCE AT A GLANCE
Danish Ship Finance was founded in 1961 and for decades financed Danish-built vessels. Since the late 1990s, we have gradually been building up a presence with select interna-tional clients while maintaining our close ties with the Danish shipping community. Today, while Danish clients account for around one-third of our loan book, we are proud to be a top 20 shipping financier globally and one of the largest dedicated lenders in ship financing. All loans are secured against first lien ship mortgages.
We are committed to conducting our business in a proper and highly professional manner, maintaining a class-leading credit performance and very robust capital and liquidity. The resil-ience of our business model is evidenced by a strong invest-ment grade ‘A (Stable)’ covered bond rating from Standard & Poor’s. Our ability to issue covered bonds on competitive terms remains a cornerstone of our business.
We are a committed long-term partner to our clients and inves- tors, with the ambition of becoming the obvious choice in ship finance.
Our business is dedicated to providing funding to reputable shipowners, many of whom are leading players in their respective sectors.
5 Annual Report 2020

VISION StrategyWe continue to focus on priorities that strengthen our position and take us closer to fulfilling our vision of becoming the obvious choice in ship finance. An essential aspect of our vision is to remain a low-risk institution, carefully adhering to our proven credit policy while optimising long-term returns from our lending business.
The strategic initiatives that we have executed over the past years have strengthened our platform and will enable us to grow sustain- ably and efficiently in the coming years. We are now increasingly turning our focus to developing and growing our core lending busi-ness and supporting the shipping industry as it migrates to environ-mentally sustainable practices based on long-term economically viable business models.
Strategic focus areas
The obvious choice in ship finance
CLIENTSSupporting reputable
shipowners across shipping cycles
OWNERS
Leveraging our unique business model to provide an attractive return
SOCIETY Working with the shipping
industry in its environmental and digital transition
EMPLOYEES
Retaining, attracting and developing talented
employees in a learning organisation
INVESTORS Utilising our strong shipping expertise to create a stable investment for bondholders
Strengthening the coreStrengthening the product offering and expanding the role we play for our clients by staying competitive in the lending and funding markets and leveraging inhouse shipping and financial expertise
Operational excellenceCreating robust and scalable business processes to ensure that we can continue to grow sustainably while deepening our engagement with clients in a changing industry
DiversificationPursuing opportunities to diversify our funding sources and income streams and allow a greater level of cooperation with clients, investors and other stakeholders, making us even more robust across shipping cycles
MANAGEMENT REPORT • VISION
6 Annual Report 2020

HIGHLIGHTS
MANAGEMENT REPORT • HIGHLIGHTS
During an eventful and sometimes challenging year for the shipping industry, we:
Supported our clients at all times
Successfully navigated the operational constraints imposed by Covid-19
Reduced the net NPL ratio to 4.2%
Saw improving credit quality in the performing loan book again this year
Maintained strong regulatory solvency of 22.3 %
Held collateral in 792 vessels
Completed our first Poseidon Principles reporting and made three new loans with margins linked to the carbon emissions of the shipowners’ fleets
This year, we will propose a DKK 18 million dividend payment to the Danish Maritime Fund and hence the ‘Blue Denmark’. Our total contribution since 2005 now stands at more than DKK 758 million.
7 Annual Report 2020

THE YEAR IN SUMMARY
Results for the financial year 2020 fell well short of our initial ambitions: the net result of DKK 117 million was some DKK 110 million, or 48 %, lower than the 2019 level. The shortfall can largely be attributed to loan impairment charges on already non-performing Offshore loans and a negative investment result of DKK 99 million. Loan impairment charges in 2020 were DKK 100 million. The loan impairment charges reflect a reversal of loan impairment charges in the non-Offshore seg-ments and an increase in loan impairment charges related to already non-performing Offshore loans.
The first few months of 2020 had promised better things, with healthy lending activity and emerging green shoots in the Offshore sector, in relatively stable markets. All this changed for the worse when the Covid-19 outbreak turned into a major global health and economic crisis.
The Offshore sector, suffering the double impacts of Covid-19 and an oil price crash, once again in 2020 stood out as a poor performer. We increased loan impairment charges as the credit outlook and financial performance of the sector worsened.
The other poor performer was our investment portfolio. Invested mainly in Danish high-grade mortgage and govern-ment bonds, the portfolio experienced sharp mark-to-market losses in the Covid-19-induced bond sell-off in March. The portfolio was rapidly de-risked and thus only benefited from the gradual market recovery over the following months to a limited extent, ending the year at a negative DKK 99 million.
Sharply reduced shipping market sale & purchase and order-ing activity late in the year, combined with a weakening USD rate and extraordinary repayments from clients unexpectedly flush with liquidity, had a measurable negative effect on the size of our loan book relative to our original trajectory and expectations. Activity finally began to come back at the end of the year, but our loan book still ended the year at a relatively modest DKK 33.6 billion.
The shipping industry responded intelligently to the many challenges posed by the pandemic and demonstrated its remarkable ability to effectively navigate treacherous waters, except in the Offshore sector. The performing loan book thus in 2020 once again proved very resilient to credit events.
We were very pleased that S&P confirmed our rating and outlook in the fourth quarter on the back of continued solid credit quality, with our performing loan book at its strongest in years. Our non-performing Offshore exposure was further reduced to approximately DKK 1.6 billion in 2020. Once again, we experienced no loan defaults. Looking ahead to the coming years, we have significant capacity to support our clients and deliver on our growth ambitions.
Moreover, our work related to sustainability continued unabated in 2020. We strengthened our work with sustainabili-ty ratings, successfully integrating them into our credit decision
MANAGEMENT REPORT • THE YEAR IN SUMMARY
process and our ongoing dialogue with clients. We reviewed and updated our sustainability rating framework from 2019 to ensure it remains relevant.
In November, we completed our first Poseidon Principles reporting. The results for this first year provide a baseline for our work to reduce the carbon footprint of our portfolio going forward. Lastly, during 2020, we closed our first three sustainability-linked loan agreements. The demand for these types of loans is increasing, and we expect to grant more such loans in the coming years.
"The performing loan book in 2020 once again proved very resilient to credit events "
8 Annual Report 2020

FINANCIAL REVIEW BY BUSINESS AREA
9 Annual Report 2020

FINANCIAL REVIEW BY BUSINESS AREA
LENDINGMaintaining a strong and competitive lending business is our key value driver. Led by our highly specialised and experienced Customer Relations and Credit teams, we work with some of the industry’s most reputable shipowners. Our prudent approach to credit risk is imbued across the organisation, ensuring a disciplined and long-term approach to engaging in new lending arrangements.
By leveraging our strong internal competencies within market research, lending, technical surveys, insurance, marine legal and, more recently, sustainability, we strive to expand the role we play for our clients and to engage with them on more than just their financing issues.
2020 in brief We are pleased that we were able to fully support our clients through a challenging year. Happily, the shipping industry weathered the storm well and many emerged from 2020 in a strong position. In fact, better-than-anticipated performance
allowed some clients to build up significant excess cash and as a result, we saw substantially higher-than-normal volumes of loan pre-payments in 2020.
With lower overall sale & purchase and newbuild activity as shipping markets adapted to temporary logistical challenges, loan repayments exceeded new loans disbursed for much of the second half of the year.
New loans of DKK 6.5 billion were disbursed during the year and new loan offers accepted equalled DKK 6.6 billion (at year-end exchange rates). Loan offers were made at slightly better net margins than the average margins achieved in 2019. As at 31 December 2020, our loan book equalled DKK 33.6 billion, 19 % lower than the loan book at year-end 2019. The decrease was primarily due to DKK 4.5 billion prepayments from clients, DKK 3.5 billion FX adjustments due to a declining USD and DKK 0.8 billion in net write-offs.
Net income from lending declined by DKK 44 million year-on-year, as loan balances decreased and non-accrual Offshore loans weighed on income, while net margins remained resil-ient. The loan book at year-end was collateralised by a total of 792 vessels.
MANAGEMENT REPORT • FINANCIAL REVIEW BY BUSINESS AREA
Income, lending
DKK MILLION 2020 2019
Net interest income 533 572
Net fees and commission 21 26
Income 554 598
DSF’s business model is focused and transparent.
Our areas of activity are as follows:
Lending to our shipowning clients
Funding the loan book and hedging financial risks
Investing the company’s funds in liquid instruments partly to meet regulatory requirements
Income by business area
DKK MILLION 2020 2019
Lending 554 598
Funding (43) (52)
Investments (99) (79)
Income 412 468
10 Annual Report 2020

MANAGEMENT REPORT • FINANCIAL REVIEW BY BUSINESS AREA
Key ratios, lending1
2020 2019
Annual loan impairment ratio (Loan impairment charges as % of average loan book) 0.3 0.0
Net write-offs on loans as % of average loan book 2.1 1.2
Weighted average loan-to-value after loan impairment charges (%) 54 51
Proportion of loans covered within 60% of market values (%) 98 99
Gross NPL ratio (%) 7.2 10.3
Net NPL ratio (%) 4.2 6.3
Accumulated loan impairment charges as % of loan book (year-end) 3.9 4.9
50.0
40.0
30.0
20.0
10.0
0
Loan book developments
DKK BILLION
2020 2019
Average loan book
Loan book at year-end
40.2 41.4
33.6
41.2
Key credit ratios
Loan impairment charges for 2020 amounted to an expense of DKK 100 million, against an income of DKK 2 million in 2019, corresponding to an annual loan impairment ratio of 0.27 % in 2020, up from 0.0 % the year before. The adverse development in loan impairment charges was attributable to the increasingly challenged Offshore segments and was only partially offset by the overall good credit quality across the conventional loan book that resulted in reversal of loan impair-ment charges, primarily in the Tanker segments.
During the past four years, default levels have normalised, coming down from the elevated level in 2016, when the Off-shore and Dry Bulk segments in particular experienced severe downturns. In 2020, there were no loan defaults.
In 2020, net write-offs debited to the ECL (expected credit losses) allowance account increased to 2.1 % of the average loan book, up from 1.2 % the year before, as a result of work-outs on existing non-performing loans (NPL) within the Off-shore segments. While the number was elevated compared to previous years, it was well within the amount previously pro-vided for on the ECL allowance account.
At year-end 2020, the weighted average loan-to-value ratio after loan impairment charges stood at healthy 54 %, and 98 % of the loan volume after loan impairment charges was secured within 60 % of the values of mortgaged ships.
In 2020, NPL decreased by DKK 1.8 billion to DKK 2.4 billion, improving the net NPL ratio to 4.2 % at year-end, down from 6.3 % the year before.
Accumulated loan impairment charges of 3.9% of the loan book at year-end 2020 continues to provide adequate protec-tion for future credit losses.
1) For definitions of key ratio calculations, see Financial trends (key ratios), note 15 and note 17.
11 Annual Report 2020

Timecharter rates
USD PER DAY
2003 20092005 20112007 20132004 20102006 20122008 2014 2015 2016 2017 2018 2019 2020
Note: 1 MR 1 year T/C 2 3,500 teu 1 year T/C 3 Panamax 1 year T/C Sources: Clarksons, Danish Ship Finance
MANAGEMENT REPORT • FINANCIAL REVIEW BY BUSINESS AREA
Competition The ship finance market in 2020 was severely impacted by the Covid-19 pandemic. During Q1-Q2, margins generally increased due to banks experiencing higher wholesale fund-ing costs. During this period, large numbers of clients sought more flexible funding such as revolving credit facilities (RCF) to ensure ample liquidity in case of a prolonged crisis. In Q3-Q4, the market stabilised and we saw more normalised competitive patterns being re-established in ship finance. Margins returned to levels only slightly above those of the pre-Covid-19 period.
European banks to a large extent provided the aforemen-tioned RCFs but continued reducing their shipping exposure in a continuation of the trend we have seen over the last ten to 12 years. We expect many banks to increase their focus on core clients in their home markets.
Chinese leasing companies were less visible during the first two quarters of 2020 but resumed their aggressive growth in the second half of the year, primarily acting as lessors in leasing transactions with ship owners.
60,000
45,000
35,000
15,000
0
Dry Bulk 3
Container 2
Product Tanker 1
Macro trends
Global GDP plunged during the global lockdown in the spring but slowly started to recover in the second half of 2020. Nevertheless, the spread of Covid-19 and the ensuing re-strictions on movement and social distancing have kept a lid on economic activity across the world. The IMF projects a global economic contraction of 3.5 % for 2020.
The Chinese economy is expected to have grown by approxi- mately 2% in 2020, while most of the other major economies are expected to have contracted. High industrial activity is driving the recovery in China; retail sales have not fully recovered.
Global GDP is not expected to return to 2019 levels until late 2021 or early 2022, possibly even later in some countries.
Energy demand has plummeted, as industrial activity has decreased, flights have been cancelled, and personal com-muting has dwindled. On the other hand, an increase in e-commerce has ensured stable consumption of consumer goods.
Therefore, the key to a return to a normal economic state seems to be a recovery in the service sector and a rebound in energy consumption. Both are difficult to stimulate through policy measures, and a recovery appears unlikely until a significant part of the global population has been vaccinated against Covid-19.
Seaborne trade volumes dropped by only 4 % in 2020, with longer travel distances mitigating the demand effect by almost one percentage point. Lower energy demand led the decline, but all vessel segments were affected at some point. Average fleet utilisation dropped accordingly. Idle capacity rose to 6 % of the fleet at its highest point, while many shipowners made increased use of slow steaming in periods of surplus vessel capacity. Trade volumes recovered strongly during the fourth quarter of 2020.
12 Annual Report 2020
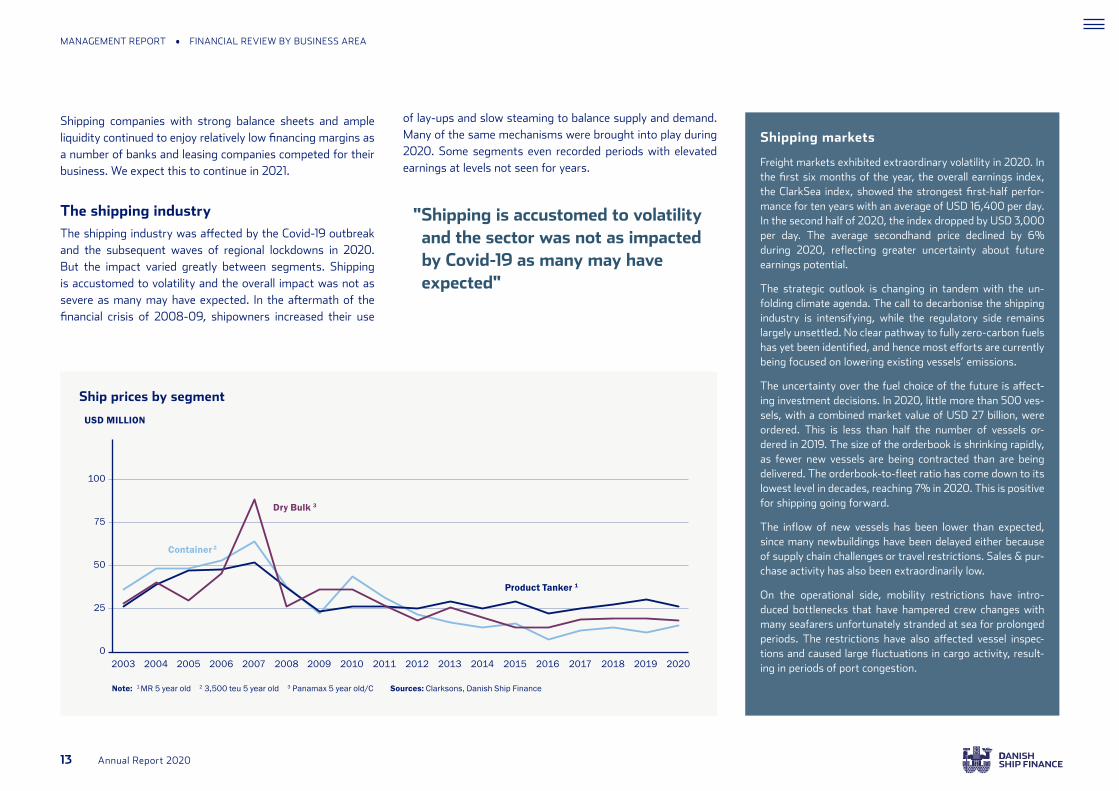
Ship prices by segment
USD MILLION
2003 20092005 20112007 20132004 20102006 20122008 2014 2015 2016 2017 2018 2019 2020
Note: 1 MR 5 year old 2 3,500 teu 5 year old 3 Panamax 5 year old/C Sources: Clarksons, Danish Ship Finance
Shipping companies with strong balance sheets and ample liquidity continued to enjoy relatively low financing margins as a number of banks and leasing companies competed for their business. We expect this to continue in 2021.
The shipping industryThe shipping industry was affected by the Covid-19 outbreak and the subsequent waves of regional lockdowns in 2020. But the impact varied greatly between segments. Shipping is accustomed to volatility and the overall impact was not as severe as many may have expected. In the aftermath of the financial crisis of 2008-09, shipowners increased their use
Shipping markets
Freight markets exhibited extraordinary volatility in 2020. In the first six months of the year, the overall earnings index, the ClarkSea index, showed the strongest first-half perfor-mance for ten years with an average of USD 16,400 per day. In the second half of 2020, the index dropped by USD 3,000 per day. The average secondhand price declined by 6 % during 2020, reflecting greater uncertainty about future earnings potential.
The strategic outlook is changing in tandem with the un-folding climate agenda. The call to decarbonise the shipping industry is intensifying, while the regulatory side remains largely unsettled. No clear pathway to fully zero-carbon fuels has yet been identified, and hence most efforts are currently being focused on lowering existing vessels’ emissions.
The uncertainty over the fuel choice of the future is affect-ing investment decisions. In 2020, little more than 500 ves-sels, with a combined market value of USD 27 billion, were ordered. This is less than half the number of vessels or-dered in 2019. The size of the orderbook is shrinking rapidly, as fewer new vessels are being contracted than are being delivered. The orderbook-to-fleet ratio has come down to its lowest level in decades, reaching 7% in 2020. This is positive for shipping going forward.
The inflow of new vessels has been lower than expected, since many newbuildings have been delayed either because of supply chain challenges or travel restrictions. Sales & pur-chase activity has also been extraordinarily low.
On the operational side, mobility restrictions have intro-duced bottlenecks that have hampered crew changes with many seafarers unfortunately stranded at sea for prolonged periods. The restrictions have also affected vessel inspec-tions and caused large fluctuations in cargo activity, result-ing in periods of port congestion.
of lay-ups and slow steaming to balance supply and demand. Many of the same mechanisms were brought into play during 2020. Some segments even recorded periods with elevated earnings at levels not seen for years.
MANAGEMENT REPORT • FINANCIAL REVIEW BY BUSINESS AREA
100
75
50
25
0
Dry Bulk 3
Container 2
Product Tanker 1
"Shipping is accustomed to volatility and the sector was not as impacted by Covid-19 as many may have expected"
13 Annual Report 2020

DRY BULK
Demand for Dry Bulk vessels came under pressure in 2020, due to a sharp decline in coal and minor bulk volumes. On the supply side, the fleet continued to expand rapidly, driven by a large inflow of Capesize vessels. The outlook for the smaller vessel segment is cautiously positive, while a large orderbook and a blurred demand picture will challenge the Capesize segment.
OFFSHORE
At the end of 2019 and in early 2020, the Offshore sector was expected to slowly recover. However, Covid-19 and the oil price shock in the first half of 2020 have delayed the recovery further into the future. Offshore projects are being postponed or cancelled, lowering
CONTAINER
Due to strict capacity management by liner operators, box rates increased in 2020 despite declining Container demand. Timecharter rates suffered accordingly but have managed to regain the lost territory in the second half of the year.
GAS CARRIERS
Market conditions for Gas Carriers weakened in 2020, with supply outpacing demand significantly as the Covid-19 pan-demic lowered consumption of gas commodities. Freight rates declined accordingly during the year but recovered strongly during the fourth quarter. Uncertainty over future demand and large fleet growth have reduced expectations for rates and values for the coming year.
OIL TANKERS
Global oil demand crashed in the first half of the year as a result of the Covid-19 restrictions, while OPEC+ embarked on a price war that flooded the market with excess oil. Vessels were used for storage, which caused freight rates to spike. While most vessels have returned to the fleet, demand re-mains low and freight rates have softened. Persistent Cov-id-19 restrictions are keeping vessels in surplus.
Shipping segments
Market conditions in the major shipping segments continue to be mixed, but the supply side is becoming more manageable with a very low orderbook and consolidation in the yard industry. Still, average fleet utilisation declined during 2020, since global sea-borne demand shrank while the fleet continued to grow. We expect 2021 to be a year of recovery with few new orders placed and more vessels scrapped.
Seaborne trade volumes are expected to regain much of the lost territory, although the outlook in some segments is shrouded in uncertainty. The impact of the second or third waves of Covid-19, geopolitical tensions, weakening macro conditions and technolo-gies transforming the underlying industries are all elements that could impact seaborne trade volumes significantly in the years to come.
RO-RO
Car carriers saw a significant drop in demand in 2020, lead-ing to extensive lay-ups of ships and increased scrapping. European ferry routes also saw a sharp drop in demand due to travel restrictions. For both segments, we expect the Covid-19 effects to be temporary. Notably, demand increased in the second half of 2020.
MANAGEMENT REPORT • FINANCIAL REVIEW BY BUSINESS AREA
"The supply side is becoming more manageable with a very low orderbook "
vessel demand and exacerbating the oversupply.
14 Annual Report 2020

We provided liquidity to domestic and international investors by buying back issued DKK and EUR bonds totalling DKK 12.0 billion.
By year-end 2020, we had DKK 42.5 billion of outstanding bonds with an average maturity of four years, of which 18 % were denominated in EUR. This represents a net reduction of DKK 5.3 billion compared to year-end 2019. Funding costs increased compared to 2019, in line with the broader Danish market.
Funding costs not covered was primarily driven by rapidly changing interest rates that led to temporary increased fund-ing and hedging costs in the second quarter. Funding costs not covered increased by DKK 25 million to DKK 29 million in 2020.
Costs relating to warehousing of temporary excess liquidity from bond issuances and hedging proceeds from bond is-suances pending loan disbursements were DKK 8 million in 2020.
In total, net income in non-business activities amounted to a negative DKK 6 million in 2020. The underlying effects were lost interest income from non-accrual loans, FX hedging of credit margins and buy-backs of issued bonds, which was par-tially offset by lower interest payments and monetisation of gains on hedges.
In total, the cost of funding decreased by DKK 9 million year-on-year to a cost of DKK 43 million.
FUNDINGWe maintain ongoing access to funding in domestic and inter-national financial markets. Our Treasury department manages our liquidity, issuance of bonds, and financial hedging trans-actions.
2020 in briefFunding market access remained good throughout the year. Liquidity was strong, and increasingly so in the second half of 2020, as loan pre-payments and the USD depreciation resulted in even higher levels of available liquidity.
We signalled a strong commitment to our outstanding bonds, supporting investors with targeted buy-backs of both DKK and EUR bonds throughout the year.
Even though traditional face-to-face investor meetings proved almost impossible to arrange for much of the year, we were delighted to see interest from existing and new investors alike. We are pleased that our extensive dialogue with investors across Europe has been able to continue and see this as proof that our strong credit story resonates well both in the Danish market and internationally.
Bond issuance in the Danish market continued to efficiently support our lending business. Domestic DKK ship covered bond issuance accounted for total gross issuance of DKK 7.9 billion in 2020. We issued no new EUR bonds during the year, having gone to market in late 2019. All bond issuances are subject to the Danish specific balance principle.
Income, funding
DKK MILLION 2020 2019
Funding costs not covered (29) (4)
Warehousing (8) (7)
Non-business activities (6) (41)
Income (43) (52)
MANAGEMENT REPORT • FINANCIAL REVIEW BY BUSINESS AREA
"We are pleased that our extensive dialogue with investors across Europe has been able to continue"
15 Annual Report 2020

MANAGEMENT REPORT • FINANCIAL REVIEW BY BUSINESS AREA
INVESTMENTSOur own funds are invested in a portfolio of high-grade fixed income instruments, predominantly Danish ‘AAA’ govern-ment bonds and mortgage covered bonds, but also, to a limited extent, other highly rated core EU government bonds. The portfolio is managed within prudent risk limits defined by the Board of Directors. While the risk of outright default is viewed as very remote, the portfolio is exposed to daily changes in market conditions, such as current and expected interest rates and pricing of Danish callable mortgage bonds. The investment portfolio is partially hedged with derivative instruments and interest rate risk sensitivity was at very low levels during 2020.
Income, investments
DKK MILLION 2020 2019
Net interest income 41 115
Market value adjustments (139) (193)
Income (99) (79)
2020 in briefThe investment result for the year was an unsatisfactory DKK -99 million. The result was dominated by mark-to-market losses incurred during the March-April financial market ruc-tions and did not fully recover subsequently, in part due to the portfolio having been significantly de-risked. Amongst the changes, holdings of Danish convertible mortgage bonds were further reduced from previous levels.
In the second half of the year, the investment portfolio was managed at historically tight risk tolerances and only small movements in profit & loss were observed.
The investment result for 2020 corresponds to a return on capital of a negative 0.9 %.
"In the second half of the year, the investment portfolio was managed to historically tight risk tolerances"
The financial marketsIn 2020, the Covid-19 pandemic undoubtedly caused the big-gest negative hit to financial markets since the global financial crisis. Amid the turmoil, February and March witnessed some of the most dramatic losses ever seen in equity and credit markets.
Subsequent issuance of record amounts of sovereign bonds to fund stimulus and aid packages in many countries triggered sharp increases in bond yields. Yields on even many of the highest rated bonds increased by more than 50 basis points over a three-week period in March.
In the Danish market, this all culminated in a rate hike by the Central Bank in March, during a period when other central banks were slicing their deposit rates. Combined with reduced liquidity, this caused the Danish bond market to react in dra-matic fashion. Mortgage bonds saw price drops similar to or worse than those experienced in the global financial crisis.
The monetary response to the global fiscal expansion was equally unprecedented. In the Eurozone, new purchasing and liquidity programmes were introduced and central bank liquidity once again flooded markets.
Central banks made the second half of 2020 a positive market story, with spreads tightening in credit and sovereign bonds, and asset values reaching close to record highs.
16 Annual Report 2020

SUMMARY OF FINANCIALS
17 Annual Report 2020

FINANCIAL TRENDS
SUMMARY OF FINANCIALS
MANAGEMENT REPORT • SUMMARY OF FINANCIALS
• The growth trajectory in the loan book that we have been following for the past several years was temporarily suspended in 2020 due to effects of the Covid-19 pandemic
• Similarly, Net interest and fee income from lending was below trend in 2020
• As expected, Staff costs and administrative charges started to plateau following a period of higher investment in upgrading the organisation and core processes
Key figures 1
DKK MILLION 2020 2019 2018 2017 2016
Net interest income from lending2 501 516 477 541 589
Net interest and fee income from lending2 522 543 509 561 621
Net interest income from financial activities 41 115 163 135 228
Total net interest income 542 631 640 676 817
Net interest and fee income 562 657 672 696 849
Market value adjustments (150) (197) (135) 37 124
Staff costs and administrative expenses (158) (166) (158) (141) (120)
Loan impairment charges (100) 2 (35) (163) (610)
Profit before tax 154 296 343 427 241
Net profit for the year 117 227 262 334 188
Loan book 33,576 41,440 39,591 37,412 42,699
Issued bonds 42,477 47,738 43,549 42,467 42,352
Equity 9,275 9,260 9,229 9,307 9,164
Total assets 59,805 66,824 62,349 58,161 62,621
Common Equity Tier 1 capital after deductions 9,156 9,065 8,972 8,930 8,781
Key ratios
DKK MILLION 2020 2019 2018 2017 2016
Return on equity after tax (%) 1.3 2.5 2.8 3.6 1.9
Return on financial activities (%)3 (0.9) (0.6) 0.5 3.1 3.0
Common Equity Tier 1 capital ratio (%) 22.3 18.5 19.0 19.7 17.2
Combined capital buffer requirement (%) 12.0 12.5 11.2 10.8 10.7
Cost/income ratio (%)4 38.3 35.5 29.1 19.0 11.9
Equity as % of loan book 27.6 22.3 23.3 24.9 21.5
Annual loan impairment ratio 5 0.3 0.0 0.1 0.4 1.5
Net write-offs on loans as % of avg. loan book5 2.1 1.2 0.7 0.2 0.2
Accumulated loan impairment charges as % of loan book (year-end) 3.9 4.9 6.3 6.9 5.9
Weighted average loan-to-value ratio after loan impairment charges (%) 54 51 52 57 66
Proportion of loans covered within 60% of market value (%) 98 99 98 95 88
1) The link between income in the income statement and the business areas can be seen in note 3.
2) The key figures are calculated in accordance with Appendix 5 of the Danish FSA's instructions for finan-cial reports for credit institutions, etc.
3) Return on financial activities is calculated exclusive of the return from shares and currency.
4) The calculation of the cost/income ratio does not include loan impair-ment charges.
5) The average balance is calculated as a simple average of the opening and closing balance.
Trends
Unless otherwise indicated, the ratios have been calculated in accordance with Appendix 5 of the Danish FSA’s instructions for financial reports for credit institutions, etc.
18 Annual Report 2020

INCOMENet profit for the year amounted to DKK 117 million, a reduc-tion of DKK 110 million (48 %) compared to 2019. The decrease was attributable to a loss on investment activities and loan impairment charges.
Net interest income from lending, including fee income of DKK 21 million, was DKK 522 million in 2020, a decrease of DKK 21 million (4 %) on 2019. The decrease can be ascribed to a lower average loan book throughout the year. New lending activity was lower than expected, with DKK 6.6 billion of loan offers made and accepted.
Net interest income from financial activities of DKK 41 mil-lion in 2020 reflected the prevailing low interest rates for high-grade bonds and compared unfavourably to net interest income of DKK 115 million in 2019.
Market value adjustments of securities, derivatives and for-eign exchange generated a loss of DKK 150 million. Market value losses were largely due to Danish callable mortgage bonds.
EXPENSES Staff costs and administrative expenses totalled DKK 158 million compared to DKK 166 million in 2019. This represents a decrease of approximately 5 %, which was due to a mix of active cost control measures and cyclical cost reductions dur-ing lockdown, such as reduced travel activity related to client meetings. In addition, performance-based variable pay was significantly lower in 2020 than in previous years.
Operating costs in 2020 included one-off expenses of approximately DKK 4 million for strategic initiatives (compared
to DKK 10 million in 2019). These initiatives will increase the scalability and robustness of our operating platform, allowing for further growth and increasing our ability to weather the complexities of continually increasing regulatory requirements without expanding the headcount significantly.
In 2020, the cost/income ratio was 38.5 %. Adjusted for one-offs, the cost/income ratio was 37.3 %, compared with 34.0 % in 2019.
LOAN IMPAIRMENT CHARGES Credit quality across the conventional shipping loan book remained overall good in 2020, whereas the Offshore seg-ments were increasingly challenged by the adverse business environment, exacerbated by the significant drop in oil prices in March-April. In total, loan impairment charges for the year amounted to an expense of DKK 100 million compared to an income of DKK 2 million in 2019.
The ECL allowance account amounted to DKK 1,330 million at year-end 2020, down from DKK 2,035 million at year-end 2019, as a result of an increase in loan impairment charges and write-offs or partial write-offs on existing non-performing loans (NPL) within the Offshore segments on the back of completed restructurings or ongoing restructurings on loans where clients are unlikely to pay in full.
TAXTax for the year represented an expense of DKK 37 million, against an expense of DKK 69 million in 2019. For 2020, this translated into an effective tax rate of 24.0 % versus 24.2 % in 2019.
EQUITYEquity stood at DKK 9,275 million at year-end 2020, against DKK 9,260 million at year-end 2019.
The Board of Directors has proposed a dividend of DKK 59 million, corresponding to 50 % of net profit for the year. The proposed dividend covers the mandatory preferred dividend to the Danish Maritime Fund, partly accrued interest charges on Group Tier II regulatory capital held in Danish Ship Finance Holding A/S, and associated minority shareholder dividends. This amount is recognised in shareholders’ equity until approval of the distribu-tion at the next general meeting.
The amount of Common Equity Tier 1 (CET1) capital, which is the most important capital concept in relation to capital ade-quacy rules, is determined exclusive of the proposed dividend, cf. note 30.
CET1 capital totalled DKK 9,156 million at year-end 2020, com-pared to DKK 9,065 million at year-end 2019. The core capital ratio was 22.3 % at year-end 2020, against 18.5 % at year-end 2019. There were no supplementary capital instruments on the balance sheet date and the total capital ratio equalled the core capital ratio.
SPECIAL ACCOUNTING CIRCUMSTANCESThere were no special accounting circumstances in 2020.
MANAGEMENT REPORT • SUMMARY OF FINANCIALS
19 Annual Report 2020

UNCERTAINTY AS TO RECOGNITION AND MEASUREMENTThe most significant uncertainty in recognition and measure-ment concerns expected credit losses and valuation of finan-cial instruments. We estimate that the uncertainty is at a level which is prudent in terms of providing a true and fair view of the financial statements. See the description in note 1.
MATERIAL RISKSThe most material risks are described in detail in note 41, to which reference is made.
EVENTS SINCE THE BALANCE SHEET DATENo events have occurred in the period up to the presentation of the Annual Report which materially affect the financial position.
OUTLOOK FOR 2021 Following a period of lower new lending activity in the spring and summer, we experienced higher sustained levels of activity again in the latter part of last year. This momentum has con-tinued into the opening months of 2021.
Our expectation now is that we will resume the positive growth trajectory that we were previously following as we deepen and expand our engagement with many existing clients while again welcoming a small number of new clients.
In our annual report a year ago, we stated that the Covid-19 virus outbreak would dampen global growth expectations. It is safe to say that this prediction played out. However, its effects in 2020 were even more severe than we anticipated.
Our financial results for 2020 were not satisfactory, even if much of the performance shortfall can be explained by effects of the Covid-19 pandemic. A challenging first half-year led, via a somewhat better second half, to a full-year net profit of only DKK 117 million. This was DKK 110 million (48 %) lower than the 2019 net profit of DKK 227 million.
The shortfall can largely be attributed to loan impairment charges of DKK 100 million pre-tax (compared to a DKK 2 mil-lion reversal in 2019) and negative net income from investments of DKK 99 million pre-tax (DKK 20 million lower than the 2019 result).
The realised 2020 result was hence significantly below the ex-pectation of DKK 275 million to DKK 350 million set out in our annual report last year. Again, the shortfall can be attributed to loan impairment charges and the investments result, both of which fell materially short of original expectations.
Additionally, net income from lending of DKK 554 million pre-tax was DKK 44 million lower than the 2019 result, mainly due to a high volume of non-interest accruing Offshore loans, but also a high level of loan pre-payments, particularly in the second half of 2020.
Notwithstanding stressed conditions in the financial markets in the first half of 2020, annual funding costs of DKK 43 million
were slightly lower (by DKK 9 million) than the 2019 level, but funding costs also suffered from the volume of non-interest accruing loans.
Operating costs of DKK 158 million were below the 2019 level (by DKK 8 million) due to effective cost containment measures, reduced travel expenses, lower strategy execution costs and lower bonus amounts.
We were very pleased that credit quality remained robust in a difficult year, with no defaults, resolution of existing prob-lem cases and a significant DKK 1.8 billion (43 %) reduction of non-performing loans to DKK 2.4 billion at year-end 2020.
Shipping markets experienced sharply reduced vessel trading and ordering activity in 2020. Lower activity combined with an extraordinary volume of prepayments from clients flush with liquidity and depreciation of the predominant lending currency (USD) relative to our home currency (DKK) meant that the pos-itive loan growth that we had been expecting in 2020 did not materialise. Rather, the loan book of DKK 33.6 billion at year-end 2020 was 19 % below the 2019 year-end figure.
In 2020, we continued to deliver as planned on our Operation-al Excellence programme, which will continue to set a robust foundation for sustainable and efficient growth to be restored in 2021 and the years ahead.
No material market impacts were observed in 2020 relating to upcoming regulations or from the continued scaling back of shipping market lending by several European competitors.
MANAGEMENT REPORT • SUMMARY OF FINANCIALS
The shipping market outlook is, in our view, reasonably sup-portive with a balanced orderbook in most segments under-pinning a generally robust supply-demand balance, which in turn will enable the credit quality of the performing loan book to remain stable.
We expect that loan growth will be efficiently supported by our strong liquidity and continued access to covered bond markets on favourable terms. Comprehensive engagement with existing and new investors will continue to be a priority in 2021.
Financial results relative to outlook
20 Annual Report 2020

Last year, we concluded a full transformation of the invest-ment management set-up, with a particular focus on enhanc-ing downside protection. As a result, we expect investment performance in 2021 and beyond to prove comparatively stable amid a wide range of potential market conditions.
We expect operating costs to remain well controlled at a normalised current level, as a significant part of our opera-tional transformation has been completed. We will continue to make smaller targeted investments in our platform, including sustainability and Operational Excellence initiatives.
We expect these factors to underpin a robust operating perfor- mance in 2021.
The credit quality of our performing loan book is at its strong-est in years. With our very robust solvency and liquidity, this gives us headroom to grow in a sustainable manner.
Our expectation in the current market environment is for a 2021 net profit in the range of DKK 235 million to DKK 305 million, significantly exceeding the result realised for 2020.
We thus continue the strategy that we laid out in 2018, of growing and diversifying core lending and funding activities in a controlled and sustainable manner while developing a robust, scalable and cost-efficient operational platform. At the same time, we will preserve an overriding focus on best-in- class credit quality to ensure long-term viability.
The business outlook remains subject to market factors and elements beyond our direct control. Uncertainties related to global politics, epidemics, macroeconomics and global trade may impact the shipping markets. Unexpected credit or market events could lead to a reassessment of the outlook. Adverse conditions in financial markets, in particular prima-ry and secondary bond markets, interest rate and foreign exchange markets, may affect the financial performance.
Although we expect a gradual reduction of the remaining non-performing loans in the Offshore segments, the healing process will be slow. While we believe that the ECL allowance account of DKK 1.3 billion provides adequate coverage for future credit losses, adverse credit performance remains a risk to our outlook for 2021.
MACRO OUTLOOK The global economy is projected to recover strongly in 2021. The IMF expects global GDP growth of 5.5 %. Emerging mar-ket economies are expected to drive the recovery, followed by the reopening of economies in the US and Europe. The outlook for 2021 is uncertain and highly dependent on policy measures and on the severity of the pandemic.
The IMF’s optimism reflects the view that widespread immu-nity will begin to emerge when large parts of the global pop-ulation become vaccinated. This, combined with accommoda-tive monetary and fiscal policy, is likely to support a continued recovery in economic activity during 2021. Still, the rising Covid-19 case numbers in the US and Europe this Winter are likely to soften economic growth numbers for the first few months of the year.
The Chinese economy has recovered strongly from the Covid-19 crisis, with stimulus, catch-up from lost production and an increase in exports boosting economic activity. The IMF expects the Chinese economy to grow by 8.1 % in 2021. There is clearly a base effect from the low economic growth in the first quarter of 2020, but economic activity is recover-ing. Monetary stimulus measures are heading for an exit, but a rise in bond defaults may postpone the expected tighten-ing. There is much to indicate that the economy will return to deleveraging efforts after a year when severe downside risks to growth forced policymakers to allow more debt to build
up. China’s new five-year plan puts more emphasis on tech-nology, self-reliance and a stronger domestic market. These trends seem unlikely to support continued growth in seaborne trade volumes and may lower China’s contribution to seaborne demand in the years to come.
We expect seaborne trade volumes to recover much of the lost territory during 2021, but shifts in the sectoral and regional composition of trade have introduced adverse effects during the pandemic. These dynamics will continue to exert an influence during the recovery and introduce a broader range of possible trajectories for individual vessel segments. Vessel profitability in the coming years will be dependent on strict ordering discipline combined with timely demolition of older vessels.
MANAGEMENT REPORT • SUMMARY OF FINANCIALS
"We thus continue the strategy that we laid out in 2018, of growing and diversifying core lending and funding activities in a controlled and sustainable manner while developing a robust, scalable and cost-efficient operational platform"
21 Annual Report 2020

CREDIT RISK FROM LENDING
22 Annual Report 2020

CREDIT RISK FROM LENDING
At Danish Ship Finance, we provide financing to large, repu-table shipowners located in Denmark and other parts of the world. When assessing a loan request, we consider the client’s credit quality through the shipping cycle along with the market outlook for the relevant shipping segment, the vessel type and age, and the terms of the loan, including initial loan-to-value, repayment schedule and financial covenants.
We offer our clients ship financing against first lien mortgages on ships.
The most significant risk we face is the risk of incurring cred-it losses in situations where the value of mortgaged vessels cannot cover the outstanding debt in the event of a client’s loan default.
Our credit policy contains specific guidelines for managing this risk and monitoring credit exposures. We follow several pre-defined procedures as part of the ongoing credit risk manage-ment and governance process, the most important of which are presented in the following sections.
DIVERSIFICATIONThe composition of the loan book adheres to a set of diver-sification requirements. The purpose of the requirements is to ensure adequate diversification by vessel type, client and country.
In order to manage large exposures, we have established a set of guidelines, outlining to what extent and under which conditions we will allow large credit exposures, including credit exposures exceeding 25 % of equity.
The five largest credit exposures as at 31 December 2020, includ- ing loans and guarantees but excluding credit exposures with financial institutions, were secured by mortgages on 101 vessels split between eight vessel types. Credit exposure to one client group accounted for about 15 % of the loan book.
Diversification of risk on a client level also takes into account diversification across vessel types within each credit exposure. Our largest credit exposure to one client group was secured by mortgages on 35 vessels split between three different vessel types: Container Liners, Product Tankers and Offshore Units.
MANAGEMENT REPORT • CREDIT RISK FROM LENDING
Movements in five largest credit exposures
DKK MILLION 2020 2019
Five largest credit exposures 10,141 13,678
Loan book 33,576 41,440
"The five largest credit exposures, including loans and guarantees but excluding financial institutions, were secured by mortgages on 101 vessels across eight vessel types "
23 Annual Report 2020

ONGOING CREDIT RISK MONITORING
A central part of managing our credit risk is monitoring all credit exposures on an ongoing basis and reviewing internal DSF Ratings of clients at least annually, upon receipt of new information or in case of risk events.
We assess the credit exposures based on the most recent fi-nancial information, such as financial statements, interim re-ports and budgets, as well as the current market valuations of the financed vessels, the current point in the shipping cycle and the shipping market outlook.
In addition, we monitor all credit exposures to ensure that clients fulfil their obligations under the individual loan agree-ments. This entails the following:
• Semi-annual updating of the market values of all financed vessels and verifying compliance with any agreed loan-to-value limits
• Verifying that any other collateral meets the specified minimum requirements
• Verifying the existence of adequate insurance cover on financed vessels
• Verifying compliance with financial covenants
If a credit exposure is considered to entail increased credit risk, monitoring is intensified to safeguard the position to the greatest possible extent.
MANAGEMENT REPORT • CREDIT RISK FROM LENDING
Container Liners
Offshore VesselsChemical Tankers
Bulk Carriers RO-RO VesselsCrude Tankers
Car Carriers Offshore Units
10.9 % Container Liners
20.5 % Bulk Carriers
5.6 % Car Carriers
7.6 % Chemical Tankers
Ferries/RO-RO 10.5 %
Offshore Units 6.0 %
LPG 6.3 %
Product Tankers 14.0%
Offshore Vessels 4.3%
1.8 % Container Feeders
10.9 % Crude Tankers
1.6% Others
Loan book broken down by mortgaged vessel type as at 31.12.2020
DKK 33,576 MILLION
24 Annual Report 2020

MARKET VALUATIONSMarket valuations on each of the financed vessels are updated semi-annually, by external brokers. In a few cases, we may assess the market values of the financed vessels internally, typically based on a specific independent market price or external valuations of sister vessels.
The market valuations of vessels are, among other things, used to determine the loan-to-value ratios of the loans and for control purposes in connection with the semi-annual loan impairment review.
LOAN-TO-VALUE INTERVALSBy year-end 2020, the loan book after loan impairment charges was on average secured by mortgages within 54 % of the market valuation of vessels. 98 % of the loans were cov-ered within 60 % of the collateral market value, as displayed in the chart.
Declines in vessel prices do not in general have a material adverse effect on the collateral coverage of the loan book. This is due to the positive effect of regular loan repayments and the benefit of minimum value clauses (MVC) in a signifi-cant number of loan agreements, which gives us the right to demand partial prepayment and/or additional collateral if the market values of the mortgaged vessels fall below an agreed threshold.
In the chart, the net LTV (loan-to-value) intervals are shown together with the developments in vessel prices based on a price index obtained from Clarksons across all the major vessel types.
The chart illustrates how MVC stabilise our portfolio loan-to-value ratio even with significant changes in the market values of vessels.
MANAGEMENT REPORT • CREDIT RISK FROM LENDING
NET
LTV
RAT
IO
ALL
SHIP
SEC
ON
DH
AND
PR
ICE
IND
EXJU
NE
2008
=IN
DEX
100
Sources: Clarksons, Danish Ship Finance
100
75
50
25
0
0-20 % 20-40 % 40-60 % 60-80 % 80-100 % >100 % %
Net LTV vs price index for all vessel types
"Declines in vessel prices do not in general have a material effect on collateral coverage, due to regular repayments and minimum value clauses (MVC)"
2008 2009 2010 2011 2012 2013 2014 2015 2016 2017 2018 2019 2020
All ship secondhand price index
25 Annual Report 2020

LOAN IMPAIRMENT CHARGES AND WRITE-OFFSWe review all credit exposures on a semi-annual basis, with the purpose of calculating loan impairment charges for expected credit losses (ECL) under the guidelines set out in the Danish FSA’s Executive Order on Financial Reports.
The IFRS 9 impairment rules form the basis for staging of credit exposure and calculating loan impairment charges for ECL, as set out in the table below.
Credit quality remained good overall across the conventional shipping loan book with a particularly strong credit perfor-mance for the Tanker segments in 2020, leading to a reversal of loan impairments for the year. However, this was more than offset by the challenged Offshore segments. In total, loan im-pairment charges for the year amounted to an expense of DKK 100 million compared to an income of DKK 2 million in 2019.
Considering the uncertainties created by the Covid-19 pan-demic and the limited visibility for the world economy, loan impairments of DKK 100 million for the year included a pru-dent charge of DKK 58 million resulting from increased man-agement judgement and larger adverse effects from macroe-conomic factors in our ECL impairment model.
In 2020, net write-offs amounted to DKK 805 million, cor-responding to 2.1 % of the average loan book, as a result of write-offs or partial write-offs on NPLs within the Offshore segments. While numbers are elevated compared to previ-ous years, they are manageable and well within the amounts previously provided for on the ECL allowance account.
Since Danish Ship Finance was established in 1961, accumu-lated net write-offs have amounted to approximately DKK 2.8 billion, corresponding to 8.2 % of the loan book at year-end 2020. As at 31 December 2020, the total ECL allowance ac-count amounted to DKK 1,330 million, and the accumulated loan impairment charges corresponded to 3.9 % of the loan book.
ARREARS/PAST-DUE DATELoans in arrears/past-due for 30 days or more (but less than 90 days) are generally showing significant signs of weakness, and they are classified as Stage 2 for calculating ECL. Loans in arrears/past due for 90 days or more are in default, and they are classified as Stage 3 for the purpose of calculating ECL.
At year-end 2020, no performing loans were in arrears/past-due. Thus, all loans recognised in Stage 2 were due to assigned DSF Ratings, reflecting significantly increased credit risk since initial recognition or showing signs of weakness, rather than arrears/past-due.
MANAGEMENT REPORT • CREDIT RISK FROM LENDING
Stages of credit exposure
STAGE RECOGNITION ECL
Stage 1 No increase in credit risk since initial recognition
12-month PD
Stage 2 The credit risk has increased significantly since initial recognition and/or is showing significant signs of weakness
Stage 3 Credit-impaired Lifetime PD
Lifetime PD
The stage migration for the purpose of calculating loan impairment charges for ECL is closely linked to the develop-ment of clients’ DSF Ratings. Note 17 provides more detailed information.
26 Annual Report 2020

LOANS SUBJECT TO FORBEARANCE MEASURESWe focus on having a credit risk management framework that ensures consistency between the credit risk profile, credit risk appetite and current legislation, and a robust capital structure. Our risk management efforts should ensure financial solutions that are viable in the short, medium and long term.
Normally, forbearance plans are adopted to assist clients in temporary financial difficulty. Given the cyclical nature of ship-ping, temporary forbearance measures are common in ship finance.
Concessions granted to clients include temporary payment deferrals, interest-only schedules and term extensions. For-bearance plans are granted solely in accordance with the credit policy with the aim of reducing the long-term risk of credit losses. At year-end 2020, forbearance measures had been granted on a limited number of loans.
The Risk Report 2020 provides more detailed information on our credit risk management.
COVID-19 CONCESSIONSDuring the first half of 2020, we updated our forbear-ance practices to cater for clients materially affected by the Covid-19 pandemic. Temporary Covid-19 concessions to clients are not considered forbearance if such clients – based on an individual credit assessment – are considered to have viable business models post-Covid-19.
In 2020, we granted Covid-19 concessions to a limited number of clients, primarily in the Car Carrier and Ro-Ro segments.
MANAGEMENT REPORT • CREDIT RISK FROM LENDING
NON-PERFORMING LOANSNPL encompass all impaired loans (DSF Rating 11) and all defaulted loans (DSF Rating 12). This includes clients with loans for which no loan impairment charges have been recognised, for example because adequate collateral has been provided. All NPL are classified as Stage 3 for the purpose of calculating ECL.
As at 31 December 2020, NPL represented 7.2 % of the loan book, compared to 10.3 % the year before, with an average loan-to-value ratio on NPL after loan impairment charges of 53 % at year-end 2020. Net NPL constituted 4.2 % of the loan book after loan impairment charges as at 31 December 2020, compared to 6.3 % the previous year. The significant improve-ment in NPL volume was driven by DKK 0.8 billion in write-offs and DKK 1.0 billion in repayments, credit performance improvements and positive currency effects.
Note 15 in the Annual Report and the Risk Report 2020 pro-vide more detailed information on NPL.
"Net NPL constituted 4.2 % of the loan book after loan impairment charges as at 31 December 2020, compared to 6.3 % the previous year"
27 Annual Report 2020

CAPITAL, FUNDING AND LIQUIDITY
28 Annual Report 2020

OWN FUNDS, TOTAL CAPITAL RATIO AND CAPITAL REQUIREMENTS Own funds after deductions were DKK 9,156 million at year-end 2020, up DKK 91 million on year-end 2019. Own funds consist mainly of share capital, tied-up reserve capital and retained earnings from previous years less deductions.
At the annual general meeting held on 26 March 2020, the Board of Directors’ proposal to pay dividends of DKK 133 million based on the 2019 result was adopted.
The Board of Directors proposes that the annual general meeting on 18 March 2021 resolves to distribute a dividend for 2020 in the amount of DKK 59 million. In the balance sheet, dividend is not deducted from equity as at 31 December 2020 but is carried for accounting purposes until approval by the annual general meeting.
It has been proposed that the A shareholders receive a divi-dend of DKK 41 million, and that the B shareholder, the Dan-ish Maritime Fund, receives a dividend of DKK 18 million.
If shareholders approve the dividend proposal for 2020, DSF will, since the conversion of the company in 2005, have made total distributions of DKK 758 million to the B shareholder, the Danish Maritime Fund. The funds are used to develop and promote the Danish maritime sector (Blue Denmark).
CAPITAL, FUNDING AND LIQUIDITY
MANAGEMENT REPORT • CAPITAL, FUNDING AND LIQUIDITY
Calculation of total capital ratio
DKK MILLION 2020 2019
Own funds after deductions 9,156 9,065
Total risk exposure amount 41,042 49,020
Total capital ratio ( %) 22.3 18.5
Adequate own funds and internal capital adequacy requirement
DKK MILLION 2020 2019
Total risk exposure amount 41,042 49,020
Pillar 1 requirement (8 % of total risk exposure amount) 3,283 3,922
Pillar 2Earnings Growth in lending Credit risk - Credit risk exposure to large clients in financial difficulty 31 50
- Other credit risk 116 75
- Concentration risk 24 32
Market and liquidity risk 361 397
Operational and control risk - 21
Leverage risk - -
Other risks - -
Total adequate own funds 3,815 4,497
Internal capital adequacy requirement ( %) 9.3 9.2
Capital conservation buffer ( %) 2.5 2.5
Countercyclical capital buffer requirement ( %) 0.2 0.8
Internal capital adequacy requirement incl. combined capital buffer requirement ( %) 12.0 12.5
The calculation is shown below.
For the calculation of capital ratios, the proposed dividend is deducted from own funds as at 31 December 2020.
The own funds requirement (also referred to as the Pillar 1 requirement) is a total capital ratio of 8 %, equivalent to the statutory minimum requirement.
Own funds are calculated as the sum of Common Equity Tier 1 capital (CET1), Additional Tier 1 capital (AT1) and Tier 2 capital, and the ratio of own funds to the total risk exposure amount is referred to as the total capital ratio. As at 31 December 2020 we had no AT1 or Tier 2 capital and own funds therefore consisted entirely of CET1.
We follow the Danish FSA guidelines on adequate own funds and capital adequacy requirements for credit institutions (the Pillar 2 requirement). The guidelines provide an interpretation of Annex 1 to the Danish Executive Order on Calculation of Risk Exposures, Own Funds and Solvency Need. The Danish FSA has defined benchmarks and calculation methods within seven risk areas which are typically relevant for a credit insti-tution to assess in determining its adequate own funds and has listed additional factors to be included in the assessment.
29 Annual Report 2020

As at 31 December 2020, our adequate own funds and the total risk exposure amount were DKK 3,815 million and DKK 41,042 million, respectively. The internal capital adequacy requirement including the combined capital buffer require-ment totalled 12.0 %. Our own funds after deductions totalled DKK 9,156 million, resulting in a total capital ratio of 22.3 %. This corresponds to excess coverage in the amount of DKK 4,249 million, or 10.3 percentage points.
We made a Pillar 2 solvency market risk reservation of DKK 361 million to cover risk exposure to Danish mortgage bond credit spreads and a reservation of DKK 100 million to cover for potential risks relating to the Covid-19 pandemic, in accor-dance with the supervisory guidelines.
The combined capital buffer requirement
The combined capital buffer requirement consists of three elements:
• A capital conservation buffer
• An institution-specific countercyclical capital buffer
• A systemic risk buffer
The regulatory capital conservation buffer is fully implemen-ted at 2.5 % of the total risk exposure amount.
The institution-specific countercyclical capital buffer may be between 0 % and 2.5 % of the total risk exposure amount. Based on the geographical distribution of credit risk exposu-res, the capital requirement for the countercyclical capital buffer was calculated at DKK 65 million as at 31 December 2020. Due to the Covid-19 pandemic the countercyclical buffer has been suspended or reduced in many countries. Therefore, the capital requirement only pertains currently to exposures in Hong Kong, Luxembourg and Norway, which have set the following countercyclical capital buffer rates:
MANAGEMENT REPORT • CAPITAL, FUNDING AND LIQUIDITY
All EU member states may implement a systemic risk buffer applying to domestic exposures. The buffer may apply to the entire sector or to individual subsectors. The systemic risk buffer is aimed at preventing and mitigating long-term, non-cyclical systemic or macroprudential risks not covered by the Capital Requirements Regulation (CRR). Since the Danish systemic risk buffer rate is applied to systemically important financial institutions, it is not relevant for us.
In accordance with the Executive Order on Management and Control of Banks, etc., a capital contingency plan has been prepared, which contains a catalogue of possible courses of action to strengthen the capital position in a critical situation. The capital contingency plan would take effect in the unlikely event of predefined triggers being activated.
For further information on capital management, including a detailed description of the determination of adequate own funds, please refer to the Risk Report on our website:
www.shipfinance.dk/investor-relations/risk-and-capital-management/
• Hong Kong 1.00 %
• Luxembourg 0.25 %
• Norway 1.00 %
Institution-specific countercyclical capital buffer 2020 2019
Total risk exposure amount (DKK million) 41,042 49,020
Institution-specific countercyclical capital buffer requirement (DKK million) 65 414
Institution-specific countercyclical capital buffer requirement ( %) 0.2 0.8
"Our total capital ratio of 22.3 % corresponds to excess coverage of 10.3 percentage points"
30 Annual Report 2020

CREDIT RATINGOur covered bonds have been assigned a rating of ‘A’ by S&P Global Ratings, with a ‘Stable’ outlook, based on S&P’s meth-odology for rating covered bonds. S&P has also issued an is-suer credit rating to Danish Ship Finance A/S of ‘BBB+’, with a ‘Stable’ outlook.
• Bond rating A
• Issuer credit rating BBB+
• Outlook Stable
S&P regularly monitors and provides instrument and issuer credit ratings.
FUNDINGOur Treasury department maintains ongoing access to bond and financial markets and manages the company’s liquidity and bond issuance and executes financial hedging.
Our bonds are typically issued in DKK and EUR, whereas most of our loans are disbursed in USD. We source USD for funding of USD loans via so-called basis swaps.
Issuing EUR ship covered bonds has been a strategic priority for us, in order to obtain a European investor base.
For this purpose, we established a new Capital Centre A in 2019, from which we issued our first EUR 500 million bench-mark ship covered bond in March 2019 and a second EUR 500 million benchmark in November 2019.
Our DKK covered bonds are issued from the Capital Centre Institute in General.
Both capital centres hold an ‘A (Stable)’ rating from S&P Global Ratings.
MANAGEMENT REPORT • CAPITAL, FUNDING AND LIQUIDITY
BALANCE PRINCIPLEMortgage lending in Denmark is regulated by the balance principle, which applies to ship mortgage lending as well as real estate mortgage lending. The balance principle limits the financial risk the issuer may assume in relation to funding and lending.
Danish mortgage institutions may apply either the specific balance principle or the general balance principle. We apply the specific balance principle. The specific balance principle per-mits a future liquidity deficit between issued bonds and loans provided of up to 100 % of own funds.
The deficit occurs if the future payments related to bonds, other funding and financial instruments exceed the future incoming payments on loans, financial instruments and positions.
In our internal policies, we have set stricter requirements for any liquidity deficits between issued bonds and disbursed loans.
A lack of opportunities to convert DKK or EUR funding into USD entails a risk of higher financing costs or a loss of business opportunities. The opportunities for sourcing USD liquidity rely on an efficient capital market. Internal policies govern the maximum USD funding requirements over time.
"The balance principle limits the financial risk the issuer may assume in relation to funding and lending"
31 Annual Report 2020

Issued bonds by type
DKK BILLION
These bonds are issued to finance lending secured by mort-gages on real estate, ships or sovereign exposures within predetermined loan-to-value limits. In respect of loans fund-ed by CB, supplementary collateral must be provided to the bondholders if a loan-to-value limit of 60 % is exceeded. Com-pliance with this requirement is monitored continuously.
We began utilising the option to issue CB in March 2019 and made a second issuance in November 2019.
Additional capital charge
Loans exceeding 70 % of the value of the vessel(s) may be provided subject to an additional capital charge in the form of a deduction from own funds in the calculation of the total capital ratio.
We have not utilised this option for a number of years and no deduction was made in 2020.
The market for covered bonds
We primarily issue in the form of bullet loans denominated in DKK. Our issued bonds totalled DKK 42.5 billion at amortised cost as at 31 December 2020. About 84 % of these bonds are denominated in DKK, 16 % are denominated in EUR, while the remainder are CIRR bonds, which in almost equal parts are issued in USD and DKK. Except for the CIRR bonds, all our bond issues are listed and traded on Nasdaq Copenhagen.
At the end of 2020, we held repurchased own bonds for DKK 1 billion.
MANAGEMENT REPORT • CAPITAL, FUNDING AND LIQUIDITY
Debenture bondsThis refers to certain bonds issued before 1 January 2008. By definition, the bonds are considered covered bonds under the CRD until maturity.
Ship mortgage covered bondsShip mortgage bonds are issued to finance lending secured by mortgages on vessels within 70 % of the market value of the mortgaged vessel(s).
In respect of loans funded by ship mortgage bonds, compli-ance with loan-to-value limits is only required at the time of the loan offer.
Interest rate risk
There is a risk that the coupon on our floating-rate bonds will be negative, in the event of which we will have a claim against the bondholders. In such case, we are entitled, but not re-quired, to redeem for settlement at par value, and an amount of bonds equivalent of up to the nominal negative interest coupon.
The procedure is stated in the final terms for each applicable floating-rate bond issue since 2017. However, it can be waived in future final terms if necessary.
Subordinated debt
DS issued no subordinated debt in 2020 and none is out-standing.
Mortgage funding through covered bonds
All bonds issued by Danish Ship Finance are on the European Commission’s list of bonds meeting the gilt-edged require-ments of Article 52(4) of the UCITS Directive.
CRR article 129 compliant covered bonds
In October 2017, permission from the Danish FSA was obtained to issue CRR article 129 compliant covered bonds (CB).
The rules governing bond issuance are described in the Act on a Ship Finance Institute and the Executive Order on a Ship Finance Institute as well as in the Bond Executive Order. Lending operations are funded through previously issued debenture bonds, issuance of ship mortgage bonds, lend-ing of own funds, and proceeds from loans raised in money markets and capital markets. Individual clients have no direct obligations to the bondholders.
30
20
10
00.13 % 0 % 1 % 2 % 4 % Floating CIRR
Issued before 2020Issued in 2020
32 Annual Report 2020

Bail-in able senior debt and senior unsecured debt
No senior resolution notes (SRN) or any other senior bailin able or senior unsecured debt were issued in 2020 or are out-standing.
Issuance schedule for 2021
We expect to issue the equivalent of DKK 10-11 billion in DKK and EUR covered bonds to maintain adequate funding to support both clients’ refinancing needs and expected growth in the loan book. We will continue to focus on maintaining a sufficiently diversified investor base and on the ability to effi-ciently manage exposure to currency markets.
LIQUIDITY Liquidity management and the statutory liquidity require-ments are aimed at reducing liquidity risk to very low levels.
Liquidity risk involves the risk of:
• A disproportionate rise in the cost of funding
• Not being able to meet payment obligations due to a lack of funding
Through bond issues and the existence of a liquid portfolio of bonds, we have ensured adequate liquidity coverage for all existing loans and loan offers until expiry. We are therefore not exposed to any refinancing risk. A potential downgrade of our external credit rating would not change the robust liquidity position but could lead to higher funding costs for new loans.
MANAGEMENT REPORT • CAPITAL, FUNDING AND LIQUIDITY
The average maturity of our issued bonds (DKK issuances) exceeds the average maturity of loans in the Capital Centre Institute in General.
The average maturity of issued bonds (EUR issuances) exceeds the average maturity of loans in Capital Centre A. Any residual loan exposure beyond the maturity of the long-est outstanding debt is covered by the capital available in the capital centre.
40
30
20
10
0
Amortisation debt
Amortisation of loans excl.
loan offers
DKK BILLION
2021 2023 2025 2027 2029 2031
8
6
4
2
02021 2022 2023 2024 2025 2026
DKK BILLION
Amortisation debt
Amortisation of loans excl.
loan offers
"We expect to issue the equivalent of DKK 10-11 billion in DKK and EUR covered bonds to maintain adequate funding to support both clients’ refinancing needs and expected growth in the loan book"
Capital centre A developments in issued bonds relative to loans
Capital centre Institute in General developments in issued bonds relative to loans
33 Annual Report 2020
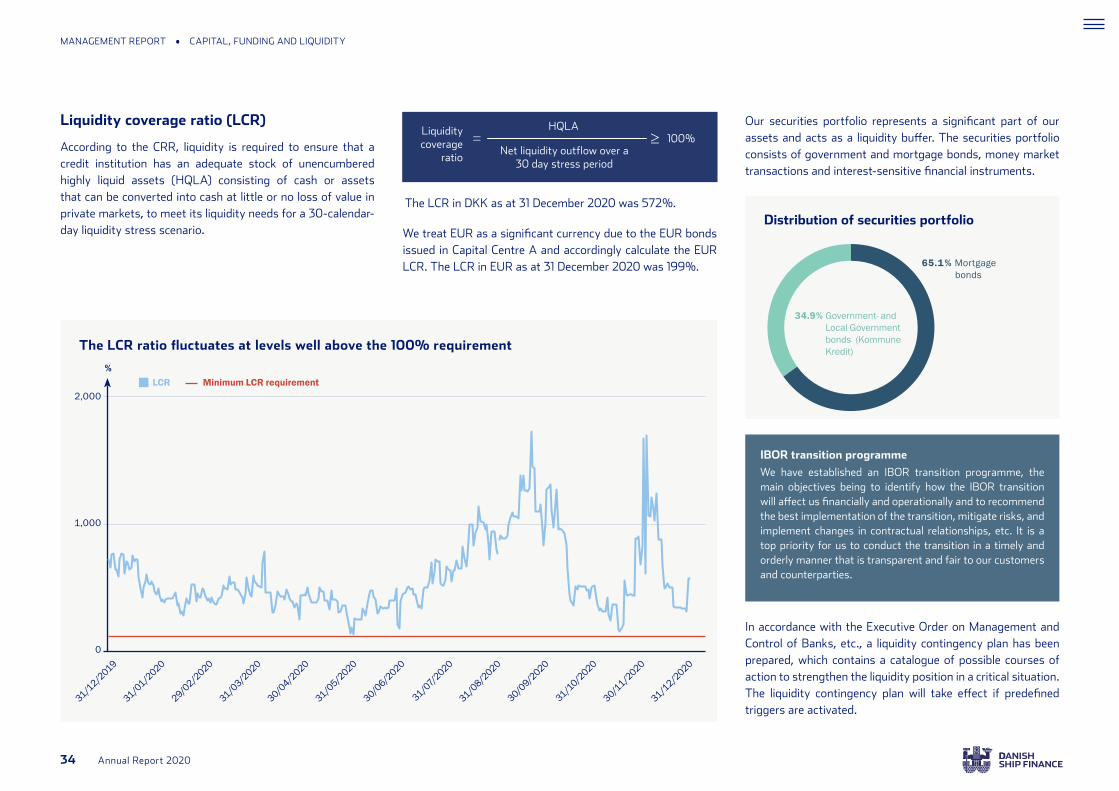
We treat EUR as a significant currency due to the EUR bonds issued in Capital Centre A and accordingly calculate the EUR LCR. The LCR in EUR as at 31 December 2020 was 199 %.
MANAGEMENT REPORT • CAPITAL, FUNDING AND LIQUIDITY
%LCR Minimum LCR requirement
2,000
1,000
0
31/12/2
019
31/01/2
020
29/02/2
020
31/03/2
020
30/04/2
020
31/05/2
020
30/06/2
020
31/07/2
020
31/08/2
020
30/09/2
020
31/10/2
020
30/11/2
020
31/12/2
020
Distribution of securities portfolio
The LCR ratio fluctuates at levels well above the 100% requirement
34.9 % Government- and Local Government bonds (Kommune Kredit)
Our securities portfolio represents a significant part of our assets and acts as a liquidity buffer. The securities portfolio consists of government and mortgage bonds, money market transactions and interest-sensitive financial instruments.
The LCR in DKK as at 31 December 2020 was 572 %.
Liquidity coverage
ratio Net liquidity outflow over a
30 day stress period
HQLA =
Liquidity coverage ratio (LCR)
According to the CRR, liquidity is required to ensure that a credit institution has an adequate stock of unencumbered highly liquid assets (HQLA) consisting of cash or assets that can be converted into cash at little or no loss of value in private markets, to meet its liquidity needs for a 30-calendar- day liquidity stress scenario.
100 % ≥
IBOR transition programme
We have established an IBOR transition programme, the main objectives being to identify how the IBOR transition will affect us financially and operationally and to recommend the best implementation of the transition, mitigate risks, and implement changes in contractual relationships, etc. It is a top priority for us to conduct the transition in a timely and orderly manner that is transparent and fair to our customers and counterparties.
In accordance with the Executive Order on Management and Control of Banks, etc., a liquidity contingency plan has been prepared, which contains a catalogue of possible courses of action to strengthen the liquidity position in a critical situation. The liquidity contingency plan will take effect if predefined triggers are activated.
65.1 % Mortgage bonds
34 Annual Report 2020

INVESTOR RELATIONS
35 Annual Report 2020

SHARE CAPITAL Our ambition is to deliver an absolute and risk-weighted return that is satisfactory to our shareholders. The Board of Directors continually assesses whether the company’s capi-tal structure is consistently aligned with the interests of the shareholders and DSF. The Board of Directors assesses that the share and capital structure are currently appropriate given the level of activity.
Our share capital amounts to a nominal value of DKK 333 million and is divided into A shares with a nominal value of DKK 300 million and B shares with a nominal value of DKK 33 million. Each A share of nominally DKK 1 carries ten votes, and each B share of nominally DKK 1 carries one vote. Other than that, there are no restrictions on the number of votes or shares for each shareholder. The shares are not listed for trading on a regulated market.
Ownership
Danish Ship Finance Holding A/S (DSH) owns 86.6 % of the shares in DSF. Furthermore, the Danish Maritime Fund owns 10 % of the shares (the B shares). The remaining 3.4 % of shares are owned by a small number of minority shareholders.
The ownership of DSH is as follows:
• 97.7 % of DSH is owned by a consortium of Axcel, PFA and PKA.
• The remaining 2.3 % is owned by members of the Board of Directors, the Executive Board and employees of DSF.
The following shareholders, listed in alphabetical order, hold at least 5 % of the total voting rights or own at least 5 % of the shares in DSF.
• AX IV HoldCo P/S (Axcel)
• The Danish Maritime Fund
• The Social Workers’, Social Pedagogues’ and Office Staff Pension Fund (PKA)
• The Healthcare Professionals’ Pension Fund (PKA)
• The State Registered Nurses’ and Medical Secretaries’ Pension Fund (PKA)
• PFA A/S
INVESTOR RELATIONS
The ownership structure is displayed in the following chart:
MANAGEMENT REPORT • INVESTOR RELATIONS
DANISH SHIP FINANCE A/S
AX HoldCo P/S (Axcel)32.5 %
PKA A/S32.6 %
PFA A/S32.6 %
Members of the Board of Directors, the Executive Board and employees
2.3 %
Danish Ship Finance Holding A/S86.6 %
The Danish Maritime Fund10 %
Minority shareholders 3.4 %
36 Annual Report 2020

SUSTAINABILITY REPORTIn the financial sector at large, the focus on sustainability is growing each year. This is also the case in Danish Ship Finance, which has established sustainability as a key focus area.
We have ramped up our efforts within sustainability, particu-larly in the last two years, and have made significant progress.
We have implemented sustainability ratings for all clients, and have made these ratings part of our credit assessment pro-cess for all clients, existing and new. After a year of working with the rating framework, we adjusted it to ensure it remains a relevant tool in the decision-making process.
In addition, Danish Ship Finance joined the Poseidon Principles in 2019, and in late 2020 we published our first annual portfo-lio climate alignment reporting. This has given us a benchmark for the performance of our portfolio, and going forward we can now use this benchmark to take action to bring our port-folio into alignment.
We have also seen growing demand from clients for sustain-ability-linked financing, and in 2020 we granted the first few loans with terms linked to sustainability targets. We see this as a focus area going forward, and will continue to develop our approach to these types of structures in the future.
The transition of the shipping industry to a sustainable future will be difficult, and it is clear that the process will be grad-ual. However, the industry continues to develop, and many shipowners are putting the issue of how to make this transi-tion a reality at the top of their agendas. At an industry level, individual shipowners will not solve the challenges alone, but with shipowners collaborating to work towards the same main goal – to eventually decarbonise shipping – we believe the industry is on the right track.
At Danish Ship Finance, we remain focused on continuously developing our approach to corporate sustainability to account for the complexity associated with being inextricably linked to the shipping industry. We will continue to work to increase the impact of the initiatives that we have implemented, while continuing to strengthen our approach in general and adding new initiatives going forward.
Read more about our sustainability performance in the Sustainability Report 2020
www.shipfinance.dk/the-company/corporate-governance/
DANISH SHIP FINANCE2020
Sustainability Report>
WWW.SHIPFINANCE.DK CVR NO. 27 49 26 49
MANAGEMENT REPORT • INVESTOR RELATIONS
ORGANISATION AND RESPONSIBILITIESOur supreme authority is the general meeting. The Board of Directors is composed of twelve members, eight of whom are elected by the general meeting for a term of one year each. Our employees elect four representatives to the Board of Directors for a term of four years each.
The rules on employee representatives are available on our website.
The Board of Directors defines the overall principles for the operations and appoints the Executive Board. The Executive Board reports to the Board of Directors and oversees the day-to-day management of the company.
General meetingThe Board of Directors and the Executive Board seek to pro-mote active ownership, including participation by the share-holders at the general meeting, and efforts are made to ensure that all members of the Board of Directors and the Executive Board are represented at general meetings.
The next ordinary annual general meeting will be held on 18 March 2021.
37 Annual Report 2020

The Board of Directors is elected within the framework of a shareholders’ agreement.
When new board members are elected, consideration is given to the composition of the board, including in terms of diversity.
Committee
Audit Committee
The Board has set up a statutory Audit Committee consisting of members of the Board of Directors. In composing the Audit Committee, we have ensured that the Chairman of the Board of Directors does not act as the Chairman of the Audit Com-mittee. We have also ensured that the Committee has profes-sional capabilities and experience in financial matters and in finance and accounting.
The Audit Committee consists of :
Anders Damgaard (Chairman), Peter Nyegaard, Michael N. Pedersen and Henrik Sjøgreen.
The Audit Committee is a preparatory and monitoring body. The duties of the Audit Committee are defined in the terms of reference of the Audit Committee. The Audit Committee is to inform the Board of Directors of the outcome of the statu-tory audit and assist the Board of Directors in monitoring the financial reporting process, monitoring the efficiency of the internal control and risk management systems, monitoring the audit of the Annual Report, monitoring and verifying the independence of the auditors, and selecting and recommend-ing new auditors.
The Audit Committee holds ordinary meetings three times a year, two of which take place prior to the presentation of the Annual Report and Interim Report, respectively. The Commit-tee reports to the Board of Directors, and minutes of the Com-mittee’s meetings are discussed at the first ordinary board meeting after the Audit Committee’s meeting.
Additional information on the Audit Committee is available on our website:
www.shipfinance.dk/the-company/board-of-directors/
Remuneration Committee
The Remuneration Committee consists of members of the Board of Directors and undertakes preparatory work and assists the Board of Directors in matters related to remuner-ation of the Board of Directors, the Executive Board, material risk takers and other employees.
The Remuneration Committee monitors pay developments in general. Furthermore, it ensures that the incentive pro-grammes are designed to create sustained and long-term value and that the remuneration policy is complied with.
The Remuneration Committee consists of:
Eivind Kolding (Chairman), Christian Frigast, Thor Jørgen Guttormsen and Jacob Meldgaard.
Additional information on the Remuneration Committee is available on our website:
www.shipfinance.dk/the-company/board-of-directors//
MANAGEMENT REPORT • INVESTOR RELATIONS
Board of Directors
Eivind Kolding is Chairman of the Board of Directors, and Peter Nyegaard is Vice Chairman.
The Board of Directors defines the overall strategy, policies and guidelines. Each year, the Board of Directors also defines its principal duties in respect of financial and management control, which helps ensure control within all key areas.
Board meetings are held whenever deemed necessary or when requested by a member of the Board of Directors or the Exec-utive Board. Ordinary board meetings are held a minimum of eight times a year. Where possible, dates and agendas for the meetings are fixed one year in advance.
The board member attendance rate for ordinary board meet-ings was 96 % in 2020.
The Executive Order on Management and Control of Banks, etc. requires the board members’ experience and competen-cies to be evaluated on an annual basis. The Board of Direc-tors has assessed that the board as a whole possesses the competencies deemed necessary to ensure a professional management.
The competency profile is as follows:
• Banking and mortgage lending
• Financial derivatives
• International maritime industry and shipping
• IT
• Credit approval processes
• Management experience from a relevant financial enterprise
• Legislation
• Macroeconomics
• Bond issuance
• Management of shipping companies
• Risk management in a financial institution
• Finance and accounting
• Cyber risk
• Sustainability
38 Annual Report 2020

Senior management
Senior management consists of:
• Erik I. Lassen, CEO
• Lars Jebjerg, CFO/CRO and member of the Executive Board
• Michael Frisch, CCO and member of the Executive Board
• Flemming Møller, Head of Credit and Executive Vice President
• Jacob Vammen, Head of Finance and Senior Vice President
TARGETS AND POLICIES FOR THE UNDERREPRESENTED GENDERWe have defined targets and a policy for the gender composi-tion of the Board of Directors.
The shareholders select eight of the candidates for the Board of Directors and the remaining four members are elected by the employees. Hence, the Board has no direct influence on which candidates are nominated. However, the Board tries to influence the process where possible.
Three employee-elected Board members are female and nine Board members are male.
More information on the efforts for the underrepresented gender is provided in the Sustainability Report 2020 on our website:
www.shipfinance.dk/the-company/corporate-governance/
CORPORATE GOVERNANCEAs our shares are not listed for trading on Nasdaq Copenhagen, we are not subject to corporate governance rules for listed entities. However, we have resolved to follow the corporate governance rules.
We also comply with the corporate governance code of the association Finance Denmark. This code is more comprehen-sive than the recommendations of the Corporate Governance Committee and also builds on a ‘comply or explain’ principle. We comply with these guidelines.
Through the ownership by DSH, we are partly owned by a private equity fund, managed by Axcel Management A/S, which is a member of the Danish Venture Capital and Private Equity Association (DVCA), and we have therefore adopted the DVCA guidelines. These guidelines build on a ‘comply or explain’ principle and are available on DVCA’s website: www.dvca.dk. We also comply with these guidelines.
The corporate governance reports must be published at least once a year. The reports are published on our website in con-junction with publication of the Annual Report.
Detailed information about corporate governance is provided in the reports on our website:
www.shipfinance.dk/investor-relations/
REMUNERATION REPORTA remuneration policy has been prepared covering the Board of Directors, the Executive Board and all other employees.
No individual received a salary in excess of EUR 1 million for the financial year.
A specification of the total remuneration of the Board of Directors, the Executive Board and other employees whose activities are deemed to have a material impact on the risk profile is presented in note 9.
The enclosed quantitative information in the Risk Report Annex 8 complies with Danish FSA and EBA Capital Require-ments Regulation article 450 on disclosure of remuneration related to material risk takers.
Further information on DSF’s remuneration policy and remu-neration report is available on our website:
www.shipfinance.dk/investor-relations/
MANAGEMENT REPORT • INVESTOR RELATIONS
"We follow corporate governance guidelines"
39 Annual Report 2020
The link between the remuneration of the Executive Board and the strategy
The remuneration of the Executive Board consists of a fixed salary and a variable part (incentive programme). The variable part is structured as a grant of a share-like instrument with future value based on a total shareholder return (TSR) index. In certain cases, compensation in the form of warrants on shares of the Holding company can be granted. The remuner-ation of the Executive Board complies with the remuneration policy laid down by the Board of Directors, which in turn com-plies with the Danish Financial Business Act.
The remuneration of the Executive Board is presented in note 9 and in further detail at:
www.shipfinance.dk/investor-relations/.
Material risk takers
At year-end 2020, a total of 22 risk takers had been identified:
• Members of the Board of Directors: 12
• Members of the Executive Board: 3
• Other material risk takers: 7
The principles for identifying ‘other material risk takers’ are approved annually by the Board of Directors in accordance with current regulation.
Details on our remuneration policy and practices are avail-able in note 9 to the financial statements, the Risk Report Annex 8 and www.shipfinance.dk/investor-relations/
MANAGEMENT REPORT • INVESTOR RELATIONS
Incentive programmes for other employees
Individual incentive programmes are offered to some mem-bers of staff in line with market standards for such positions.
Formal incentive programmes are not offered to other em-ployees, but employees may receive individual bonuses based on their performance.
"The remuneration of the Executive Board complies with the remunera-tion policy laid down by the Board of Directors"
40 Annual Report 2020

To maintain our position as a leading provider of ship financing, it is essential that we continue to be able to attract, develop and retain the most talented employees. Our employees are essen-tial to our success and the way we treat our employees is funda-mental to the way we want to do business. We are committed to creating a working environment where each employee feels valued and can prosper. During the Covid-19 pandemic, we have expanded safety measures at work to support the health and wellbeing of our employees. In addition, working from home has been necessary to reduce the risk of spread of the coronavirus. To ensure the wellbeing of our employees at home, we have organised digital social events and digital training webinars.
At the end of 2020, we had 79 employees, of whom 29 were female and 50 were male. The employees generally have high levels of education and are specialists in their respective areas. Many have long track records in the industry and with us.
To improve our employees’ development path, we nurture a culture of continuous learning. Resources are allocated to developing the competencies of individual employees and to refreshing their skills. Employees have considerable discretion in choosing relevant training programmes.
According to an employee opinion survey conducted to-wards the end of 2020, overall employee satisfaction is high and slightly higher than in 2019. We will strive to maintain or increase the level of reported employee satisfaction in 2021.
More information on the employee opinion survey is provided in DSF’s Sustainability Report on our website:
www.shipfinance.dk/investor-relations/.
HUMAN RESOURCES
MANAGEMENT REPORT • HUMAN RESOURCES
15
10
5
0<30 31-40 41-50 51-60 60+
Male Female
50
40
30
20
10
00-1 2-3 4-5 6-7 >8
49 %
11 %10 %12 %
18 %
NUMBER
AGEYEARS
Clerical background 5 %
3 % Finance clerk
19 % Graduate diploma in Business/Finance
8 % Academy profession degree programme
in financial management
Bachelors 7 %
General Certificate of Secondary education 3 %
Other education 3 % 1 % Ph. D 51 % Master degree
Seniority %
Educational background
Age distribution by gender
41 Annual Report 2020
The primary responsibility for risk management and internal
controls in relation to the financial reporting process rests
with the Board of Directors, including compliance with appli-
cable legislation and other financial reporting regulations.
Our risk management and internal controls are designed with
a view to effectively minimising the risk of errors and omis-
sions. Our processes, risk management and internal control
systems provide reasonable, but not absolute, assurance that
misappropriation of assets, losses and/or significant errors
and omissions, including in financial reporting, are avoided.
The Board of Directors has established an Audit Commit-
tee charged with monitoring and controlling accounting and
auditing matters and preparing the decision basis for account-
ing and audit-related topics for consideration by the Board of
Directors.
The Board of Directors, the Audit Committee and the
Executive Board regularly assess significant risks and the
adequacy of internal controls in relation to the operations and
their potential impact on the financial reporting processes.
Overall control environment
The key component of our control environment is an appropri-ate organisation, including adequate segregation of functions, internal policies, business processes and procedures.
In accordance with applicable legislation, the Board of Direc-tors, including the Audit Committee, regularly assesses the need for an internal audit function. We have an internal control function which performs its controls in conjunction with our external auditors. The Board of Directors finds this set-up ad-equate given the level of complexity of the organisation and therefore maintains its view that an internal audit function is not required.
Risk assessment
At least once a year, the Board of Directors, the Audit Com-mittee and the Executive Board undertake a general assess-ment of risks in relation to the financial reporting process. In addition, management regularly assesses the need for new internal controls to be implemented to reduce and/or eliminate identified risks.
In its risk assessment, the Board of Directors specifically assesses the organisation of risk measurement and risk man-agement, the accounting and budget organisation, internal controls, segregation of functions, IT usage and IT security,
including measures taken to reduce cyber risk. As part of the risk assessment, the Board of Directors also considers the risk of fraud.
The Board of Directors and the Executive Board assess whether the organisation has the necessary competencies to ensure that internal controls and risk management procedures are managed effectively.
Control activities
We use systems and manual processes for monitoring data that form the basis of the financial reporting process.
The purpose of the control activities is to prevent, detect and correct any errors or omissions. In the context of our financial reporting process, control activities are performed to ensure that the financial statements are presented in accordance with current legislation.
Information and communication
The Board of Directors has adopted a number of require-ments for the presentation of the financial statements and the external financial reporting in accordance with current legisla-tion and guidelines. The objective is to ensure that applicable disclosure requirements are met and that disclosures are full, complete and accurate.
INTERNAL CONTROL AND RISK MANAGEMENT
MANAGEMENT REPORT • INTERNAL CONTROL AND RISK MANAGEMENT
42 Annual Report 2020

Monitoring and reporting
Monitoring takes place by means of regular and/or periodic assessments and controls at all levels. Reports on the appro-priateness and/or weaknesses of the controls, control failures, cases of non-compliance with adopted policies, limits, etc. or other significant deviations are escalated in the organisation in accordance with the policies and instructions.
MANAGEMENT REPORT • INTERNAL CONTROL AND RISK MANAGEMENT
Whistleblower scheme
We have implemented a whistleblower scheme in accordance with the Danish Financial Business Act. The scheme enables employees to report any instance of non-compliance with financial legislation or economic crime to an independent third party.
In the event of a report being made, the independent third
party will undertake a provisional screening to assess whether
the instance of non-compliance falls within the scope of the
whistleblower scheme.
In March 2018, DSF was granted permission to extend the
whistleblower scheme to include economic crime.
As in previous years, no reports were made in 2020.
"No whistleblower reports were made in 2020"
43 Annual Report 2020

FINANCIAL STATEMENTS
44 Annual Report 2019

INCOME STATEMENT
1 JANUARY - 31 DECEMBER DKK MILLION 2020 2019
Interest income 1,500 2,109
Interest expenses (958) (1,478)
Net interest income 542 631
Dividends on shares, etc. - -
Fee and commission income 21 26
Fee and commission expenses - -
Net interest and fee income 562 657
Market value adjustments (150) (197)
Other operating income 1 1
Staff costs and administrative expenses (158) (166)
Depreciation and impairment of property, plant and equipment (1) (2)
Loan impairment charges (100) 2
Profit before tax 154 296
Tax (37) (69)
Net profit for the year 117 227
Other comprehensive income1 40 11
Tax on other comprehensive income (9) (2)
Other comprehensive income after tax 31 9
Comprehensive income for the year 148 236
1 JANUARY - 31 DECEMBER DKK MILLION 2020 2019
AMOUNT AVAILABLE FOR DISTRIBUTION
Distributable reserves 412 318
Comprehensive income for the year 148 236
Total 560 554
PROPOSED ALLOCATION OF PROFIT
Distribution 59 133
Other comprehensive income transferred to revaluation reserves 31 9
Distributable reserves 471 412
Total 560 554
1) Revaluation of current domicile property
NOTENOTE
4
5
6
7
8
9,10
22,23
16
11
FINANCIAL STATEMENTS • INCOME STATEMENT
45 Annual Report 2020

AT 31 DECEMBER DKK MILLION 2020 2019
ASSETS
Due from credit institutions and central banks 1,298 984
Loans and other receivables at amortised cost 31,950 39,082
Bonds at fair value 24,319 25,027
Shares, etc. - 3
Land and buildings
Owner-occupied properties 323 100
Other tangible assets 6 8
Current tax assets 10 3
Deferred tax assets 0 47
Other assets 1,898 1,570
Total assets 59,805 66,824
NOTE
12
13,14,15,16,17
18,19,20
21
22
23
28
24
NOTE
25
26
20,27
29
AT 31 DECEMBER DKK MILLION 2020 2019
LIABILITIES AND EQUITY
Liabilities Due to credit institutions and central banks 6,693 8,704
Issued bonds at amortised cost 42,477 47,738
Current tax liabilities - 3
Deferred tax liabilities 68 -
Other liabilities 1,275 1,112
Total liabilities 50,514 57,557
Provisions Other provisions 16 8
Total provisions 16 8
Equity Share capital 333 333
Tied-up reserve capital 8,343 8,343
Revaluation reserves 70 38
Retained earnings 471 412
Proposed dividend for the financial year 59 133
Total equity 9,275 9,260
Total liabilities and equity 59,805 66,824
Off-balance sheet items Contingent liabilities 116 132
Other contingent liabilities 3,723 3,168
Total off-balance sheet items 3,839 3,301
31
32
BALANCE SHEET
FINANCIAL STATEMENTS • BALANCE SHEET
28
46 Annual Report 2020

Share capital
Tied-up reserve capital
Revaluationreserves
Distributablereserves
RetainedearningsDKK MILLION TOTAL
Equity at 1 January 2019 333 8,343 29 318 205 9,229
Dividends paid for the financial year 2018 - - - - (205) (205)
Comprehensive income - - 9 94 133 236
Equity at 31 December 2019 333 8,343 38 412 133 9,260
Dividends paid for the financial year 2019 - - - - (133) (133)
Comprehensive income - - 31 59 59 148
Equity at 31 December 2020 333 8,343 70 471 59 9,275
STATEMENT OF CHANGES IN EQUITY
FINANCIAL STATEMENTS • STATEMENT OF CHANGES IN EQUITY
47 Annual Report 2020

FINANCIAL STATEMENTS • NOTES
1 ACCOUNTING POLICIES
2 KEY FIGURES
3 RECONCILIATION OF BUSINESS AREAS
4 INTEREST INCOME
5 INTEREST EXPENSES
6 NET INTEREST INCOME
7 FEE AND COMMISSION INCOME
8 MARKET VALUE ADJUSTMENTS
9 STAFF COSTS AND ADMINISTRATIVE EXPENSES
10 AUDIT FEES
11 TAX
12 DUE FROM CREDIT INSTITUTIONS AND CENTRAL BANKS
13 LOANS AT AMORTISED COST
14 LOANS AT AMORTISED COST BROKEN DOWN BY DUE DATE
15 NON-PERFORMING LOANS
16 LOAN IMPAIRMENT CHARGES
17 CREDIT RISK
18 BONDS AT FAIR VALUE
19 BONDS BY TIME TO MATURITY
20 CSA COLLATERAL
21 SHARES, ETC.
LIST OF NOTES
22 LAND AND BUILDINGS
23 OTHER TANGIBLE ASSETS
24 OTHER ASSETS
25 DUE TO CREDIT INSTITUTIONS AND CENTRAL BANKS
26 ISSUED BONDS AT AMORTISED COST
27 OTHER LIABILITIES
28 DEFERRED TAX
29 EQUITY
30 CAPITAL ADEQUACY
31 CONTINGENT LIABILITIES
32 OTHER CONTINGENT LIABILITIES
33 RELATED PARTIES
34 CONSOLIDATED FINANCIAL STATEMENTS
35 HEDGE ACCOUNTING
36 NOTIONAL PRINCIPALS OF OUTSTANDING DERIVATIVES
37 FAIR VALUES OF OUTSTANDING DERIVATIVES
38 FOREIGN EXCHANGE RISK AND USE OF DERIVATIVES
39 MARKET RISK SENSITIVITY
40 FAIR VALUE OF FINANCIAL INSTRUMENTS MEASURED AT AMORTISED COST
41 SUPPLEMENTARY NOTES WITHOUT REFERENCE
42 CAPITAL CENTRES
48 Annual Report 2020

FINANCIAL STATEMENTS • NOTES
NOTES
FINANCIAL STATEMENTS • NOTES
GENERAL
The Annual Report has been prepared in accordance with the Danish Financial Business Act and the Danish Executive Order on Financial Reports for Credit Institutions and Investment Firms, etc. (Executive Order on Financial Reports). Furthermore, the Annual Report complies with the additional Danish disclosure requirements for issuers of listed bonds.
The accounting policies are unchanged from those applied in the Annual Report 2019.
Financial statement figures are stated in Danish kroner (DKK) rounded to the nearest million, unless otherwise stated. As a result, rounding discrepancies may occur because totals have been rounded and the underlying decimals are not presented to financial statement users. Fi-gures stated as zero (0) denote rounding off an underlying value, and figures stated as a dash (-) represent no value.
The financial statements of DSF are consolidated into the financial statements of Danish Ship Finance Holding A/S (DSH), the smallest and largest group entities for which consolidated finan-cial statements are prepared.
Significant accounting estimatesThe preparation of the Annual Report is based on management’s estimates and assumptions of fu-ture events that will significantly affect the carrying amounts of assets and liabilities. The amounts most influenced by the critical estimates and assumptions are:
• Measurement of expected credit losses (ECL)
• Fair value measurement of financial instruments
The estimates and assumptions are based on premises that management finds reasonable, but which are inherently uncertain and unpredictable. The assumptions could, for example, be chal-lenged by unexpected future events or circumstances that arise. Therefore, such estimates and assumptions are difficult to make and will always entail some degree of uncertainty, even under stable macroeconomic conditions, when they involve transactions with clients and other counter-parties. Accounting estimates and assumptions made on the balance sheet date express manage-ment’s best estimate of such events and circumstances.
Measurement of expected credit lossesThe measurement of expected credit losses (ECL) on loans, guarantees and credit commitments (credit exposure) is set out in the Executive Order on Financial Reports, which is based on the three-stage (Stages, 1, 2 and 3) expected credit loss impairment model (ECL impairment model) pursuant to IFRS 9.
According to the ECL impairment model, ECL are calculated for all credit exposures measured at amortised cost. The loan impairment charge for ECL depends on the current stage of the credit risk.
If the credit risk has not increased significantly since initial recognition, the loan impairment char-ge equals ECL for the next 12 months (Stage 1). If the credit risk has increased significantly since initial recognition or is showing significant signs of weakness, or the credit exposure is in default or otherwise impaired, the loan impairment charge equals the lifetime ECL (Stages 2 and 3).
For more information, see ‘Loan impairment charges’ below.
Fair value measurement of financial instrumentsMeasurements of financial instruments for which prices are quoted in an active market or which are based on generally accepted models with observable market data are not subject to material estimates.
Measurements of financial instruments which are only to a limited extent based on observable market data are subject to estimates. This applies to unlisted shares and shares received in con-nection with financial restructuring of loans as well as certain bonds for which an active market does not exist.
For more information, see ‘Determination of fair value' below.
Segment reportingSegment reporting of the business pursuant to the definitions in the Executive Order on Financial Reports is not applicable, as DSF is solely involved in ship finance.
ACCOUNTING POLICIES NOTE 1
49 Annual Report 202049

FINANCIAL STATEMENTS • NOTES
NOTES
FINANCIAL STATEMENTS • NOTES
OffsettingAmounts due to and from DSF are offset when DSF has a legally enforceable right to offset the recognised amounts and intends either to settle by way of netting or to realise the asset and settle the liability simultaneously.
Translation of transactions in foreign currencyThe financial statements are presented in DKK, and the functional currency is DKK.
On initial recognition, transactions in foreign currencies are translated into the functional currency at the exchange rate prevailing at the transaction date. Gains and losses due to exchange rate differences arising between the transaction date and the settlement date are recognised in the income statement.
Assets and liabilities in foreign currency are translated into the functional currency at the exchan-ge rate prevailing at the balance sheet date. Exchange rate adjustments of assets and liabilities arising due to differences in the exchange rates applying at the transaction date and at the balan-ce sheet date are recognised in the income statement.
Exchange rate adjustments are included in the fair value adjustments of assets and liabilities.
Fnancial instrumentsPurchases and sales of financial instruments are measured at their fair value at the settlement date, which is usually the same as the transaction price. See the description under the individual items.
Before the settlement date, changes in the value of financial instruments are recognised. Financial instruments are derecognised on the settlement date when the right to receive (obligation to pay) cash flows from financial assets or liabilities has expired, or if it has been transferred, and DSF has transferred substantially all risks and rewards of ownership.
ClassificationFinancial instruments are divided into financial assets and financial liabilities.
At the date of recognition, financial assets are divided into the following two categories:
• Trading book assets measured at fair value
• Loans and other financial receivables measured at amortised cost
At the date of recognition, financial liabilities are divided into the following two categories:
• Trading book liabilities measured at fair value
• Other financial liabilities measured at amortised cost
The trading portfolio, which is measured at fair value, comprises the following financial assets and liabilities:
• Bonds at fair value
• Shares, etc.
• Derivatives (other assets and other liabilities)
Hedge accountingDSF uses derivatives to hedge the interest rate risk on fixed-rate liabilities measured at amortised cost.
Hedged risks that meet specific criteria qualify for fair value hedge accounting and are treated accordingly. The interest rate risk on the hedged liabilities is measured at fair value in the income statement. The accounting treatment of the hedged risk subsequently corresponds to the accoun-ting treatment of the hedging instrument, which is also recognised at fair value in the income statement.
If the criteria for hedge accounting cease to be met, the accumulated value adjustment of the hedged item is amortised over the remaining time to maturity.
Determination of fair valueThe fair value of financial assets and liabilities is measured based on quoted market prices of financial instruments traded in active markets. If an active market exists, the fair value is based on the most recently observed market price at the balance sheet date.
NOTE 1 CONTINUED
50 Annual Report 202050

FINANCIAL STATEMENTS • NOTES
NOTES
FINANCIAL STATEMENTS • NOTES
If the market for one or more financial assets or liabilities is illiquid or if there is no publicly recog-nised price, the fair value is determined using generally accepted valuation techniques. Such te-chniques comprise the use of similar recent transactions between independent parties, reference to other similar instruments, discounted cash flow analysis and other models based on observable market data.
If no active market exists, the fair value of standard and simple financial instruments, such as interest rate and currency swaps and unlisted bonds, is measured according to generally accepted valuation techniques. Market-based parameters are used for measuring the fair value, and the fair value of derivatives is subject to credit valuation adjustment (CVA), considering the possibility of a counterparty’s default.
The fair value of more complex financial instruments, such as swaptions, interest rate caps and floors and other OTC products and unlisted holdings, is measured based on internal models, many of which are based on generally accepted valuation techniques.
BALANCE SHEET
Amounts due from credit institutions and central banksAmounts due from credit institutions and central banks include amounts due from other credit institutions. Reverse transactions, that is purchases of securities from credit institutions to be resold later, are recognised as amounts due from credit institutions and central banks. On sub-sequent recognition, amounts due from credit institutions and central banks are measured at amortised cost, which corresponds to the nominal amount.
LoansLoans consist of credit exposures which have been disbursed to shipping clients either on a bi-lateral basis or as part of a syndicated transaction. Loans comprise traditional shipping loans against mortgages on vessels but may also to a limited extent comprise financing of shipping clients’ payment of instalments to shipyards under shipbuilding contracts.
On initial recognition, loans are measured at fair value plus transaction costs less origination fees and other charges. Subsequently, loans are measured at amortised cost according to the effec-tive interest rate method, less loan impairment charges for ECL, if any. The difference between
the value at initial recognition and the nominal value is amortised over the time to maturity and recognised under interest income.
Loan impairment chargesThe current impairment rules, pursuant to IFRS 9, became effective as at 1 January 2018, introdu-cing a forward-looking approach to measuring impairment of financial assets based on expected credit losses (ECL).
The loan impairment charge for ECL depends on whether the credit risk has increased significantly since initial recognition. If the credit risk has not increased significantly since initial recognition, the loan impairment charge equals ECL within the next 12 months (Stage 1). If the credit risk has increased significantly since initial recognition or is showing significant signs of weakness (e.g. a loan is more than 30 days past due), the loan impairment charge equals the lifetime ECL (Stage 2). If the credit exposure is in default (e.g. a loan is more than 90 days past due) or otherwise impai-red, the loan impairment charge equals the lifetime ECL (Stage 3).
ECL are calculated for all individual credit exposures as a function of probability of default (PD), exposure at default (EAD) and loss given default (LGD), adjusted for forward-looking information by way of a macroeconomic factor (MEF). MEF is based on management’s expectations and various scenarios (base case, best case and worst case) for each shipping segment.
ECL = PD * EAD * LGD * MEF
In a few situations where the ECL impairment model is believed to either overestimate or undere-stimate ECL, an adjustment is made based on management’s judgement.
Loan impairment charges for ECL are booked in an allowance account and offset against loans or recognised as provisions (loss allowances) for guarantees and credit commitments.
With the entry into force of the current impairment rules as at 1 January 2018, transitional ar-rangements were agreed, allowing institutions in determining own funds to add back an amount to their CET1 capital over a five-year transition period. DSF opted not to apply these transitional arrangements.
The Risk Report 2020 provides more information on the ECL impairment model.
NOTE 1 CONTINUED
51 Annual Report 202051

FINANCIAL STATEMENTS • NOTES
NOTES
FINANCIAL STATEMENTS • NOTES
Bonds at fair valueBonds at fair value comprise financial assets in the form of debt instruments acquired or conclu-ded with a view to a subsequent sale or repurchase.
The bonds are measured on initial recognition at fair value excluding transaction costs and subse-quently at fair value with value adjustments through the income statement.
Shares, etc.Shares, etc., comprise investments in sector shares and shares received in connection with finan-cial restructuring of loans.
The shares are measured on initial recognition at fair value excluding transaction costs and subse-quently at fair value with value adjustments through the income statement.
Shares received in connection with financial restructuring of loans are measured on initial re-cognition at no value and subsequently at fair value with value adjustments through the income statement, provided that the related restructured loans are no longer characterised as non-per-forming loans.
Land and buildingsLand and buildings consist of DSF's fully owned domiciles at Sankt Annæ Plads 3, Copenhagen and Langebrogade 5, Copenhagen.
Owner-occupied propertyOn initial recognition, domicile properties used for DSF’s own operations are measured at cost. The domicile property is subsequently measured at the revalued amount plus property improve-ment expenditures and less depreciation and impairment charges. Revaluations and any reversals of previous revaluations are made via other comprehensive income, while any impairment charges relative to cost are made via the income statement.
The straight-line depreciation of the domicile property is based on the expected scrap value and an estimated useful life of 100 years.
Other tangible assetsOther tangible assets consist of operating equipment, vehicles and furniture, which are recogni-sed at cost less accumulated depreciation and impairment charges. Depreciation is provided on a straight-line basis over the expected useful life of the assets considering the assets’ residual values. The expected useful life is typically three years.
Other assetsOther assets include interest and commission due, prepayments and derivatives with a positive market value. Future payments which DSF is likely to receive are recognised as amounts due at present value.
Due to credit institutions and central banksAmounts due to credit institutions and central banks include amounts received under repo transactions (sale of securities with an agreement to repurchase the same securities back later). Amounts due to credit institutions and central banks are measured at amortised cost, which cor-responds to the nominal amount.
Issued bonds at amortised costIssued bonds comprise ship mortgage bonds and debenture bonds issued by DSF, which are re-cognised at amortised cost with the addition of the fair value of the hedged interest rate risk.
Issued bonds are measured at amortised cost (i.e. including any discount at issuance and any commission that is considered an integral part of the effective rate of interest).
Pursuant to the rules on hedge accounting, the fair value of the hedged interest rate risk for fixed rate issued bonds is recognised.
The portfolio of own bonds is deducted from the line item “issued bonds at amortised cost” using the amortised cost with the addition of the value of any hedging transaction attached thereto.
Interest income from the portfolio of own bonds is offset against interest expenses for own bonds.
NOTE 1 CONTINUED
52 Annual Report 202052
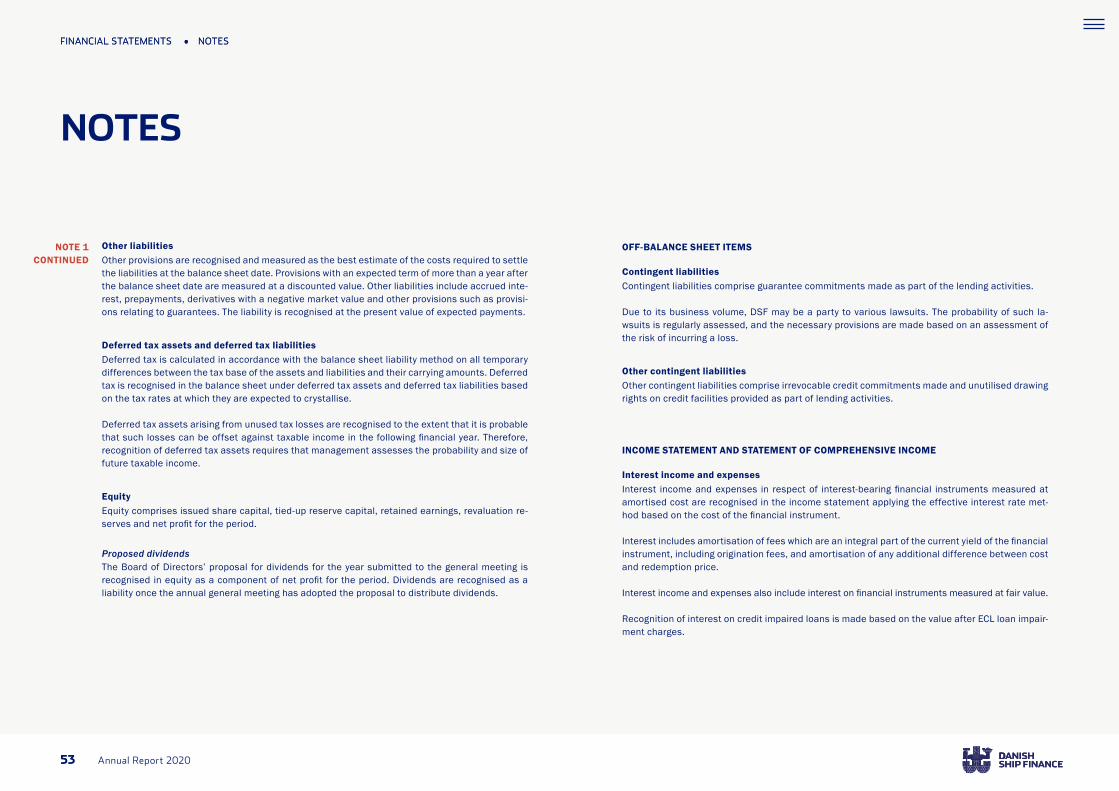
FINANCIAL STATEMENTS • NOTES
NOTES
FINANCIAL STATEMENTS • NOTES
Other liabilitiesOther provisions are recognised and measured as the best estimate of the costs required to settle the liabilities at the balance sheet date. Provisions with an expected term of more than a year after the balance sheet date are measured at a discounted value. Other liabilities include accrued inte-rest, prepayments, derivatives with a negative market value and other provisions such as provisi-ons relating to guarantees. The liability is recognised at the present value of expected payments.
Deferred tax assets and deferred tax liabilitiesDeferred tax is calculated in accordance with the balance sheet liability method on all temporary differences between the tax base of the assets and liabilities and their carrying amounts. Deferred tax is recognised in the balance sheet under deferred tax assets and deferred tax liabilities based on the tax rates at which they are expected to crystallise.
Deferred tax assets arising from unused tax losses are recognised to the extent that it is probable that such losses can be offset against taxable income in the following financial year. Therefore, recognition of deferred tax assets requires that management assesses the probability and size of future taxable income.
EquityEquity comprises issued share capital, tied-up reserve capital, retained earnings, revaluation re-serves and net profit for the period.
Proposed dividendsThe Board of Directors’ proposal for dividends for the year submitted to the general meeting is recognised in equity as a component of net profit for the period. Dividends are recognised as a liability once the annual general meeting has adopted the proposal to distribute dividends.
OFF-BALANCE SHEET ITEMS
Contingent liabilitiesContingent liabilities comprise guarantee commitments made as part of the lending activities.
Due to its business volume, DSF may be a party to various lawsuits. The probability of such la-wsuits is regularly assessed, and the necessary provisions are made based on an assessment of the risk of incurring a loss.
Other contingent liabilitiesOther contingent liabilities comprise irrevocable credit commitments made and unutilised drawing rights on credit facilities provided as part of lending activities.
INCOME STATEMENT AND STATEMENT OF COMPREHENSIVE INCOME
Interest income and expensesInterest income and expenses in respect of interest-bearing financial instruments measured at amortised cost are recognised in the income statement applying the effective interest rate met-hod based on the cost of the financial instrument.
Interest includes amortisation of fees which are an integral part of the current yield of the financial instrument, including origination fees, and amortisation of any additional difference between cost and redemption price.
Interest income and expenses also include interest on financial instruments measured at fair value.
Recognition of interest on credit impaired loans is made based on the value after ECL loan impair-ment charges.
NOTE 1 CONTINUED
53 Annual Report 202053

FINANCIAL STATEMENTS • NOTES
NOTES
FINANCIAL STATEMENTS • NOTES
NOTE 1 CONTINUED
Fee and commission income and expensesFee and commission income and expenses are generated by the lending activities. Commission for services provided over a period, such as guarantee commissions and commitment fees, is accrued over the relevant period.
Market value adjustmentsMarket value adjustments comprise realised and unrealised market value adjustments of financial instruments at fair value, i.e. shares, bonds and derivatives and exchange rate adjustments.
Staff costs and administrative expenses
Staff costsSalaries and other considerations expected to be paid for work carried out during the year are expensed under staff costs and administrative expenses. This item comprises salaries, bonuses, holiday allowances, anniversary-related bonuses, pension costs, payroll tax and other considera-tions.
Bonuses and share-based paymentsBonuses and share-based payments (including revaluations) are expensed in the period they are granted or revalued.
Pension costsDSF’s contributions to defined contribution plans are recognised in the income statement as they are earned by the staff. DSF has no defined benefit plans.
Depreciation and impairment of tangible assetsThis item consists of depreciation and impairment charges on the owner-occupied property and other tangible assets.
Loan impairment chargesThis item includes write-offs on loans and loan impairment charges for ECL on loans (including amounts due from credit institutions), guarantees and credit commitments.
TaxCurrent and deferred tax calculated on profit for the year adjusted for tax on the taxable income of previous years is recognised in the income statement. Income tax for the year is recognised in the income statement based on the current income tax rate, adjusted for non-taxable income and non-deductible expenses.
54 Annual Report 202054

FINANCIAL STATEMENTS • NOTES
NOTES
FINANCIAL STATEMENTS • NOTES
DKK MILLION 2020 2019 2018 2017 2016
KEY FIGURES
Net interest income from lending 501 516 477 541 589
Net interest income from financial activities 41 115 163 135 228
Total net interest income 542 631 640 676 817
Net interest and fee income 562 657 672 696 849
Market value adjustments (150) (197) (135) 37 124
Staff costs and administrative expenses (158) (166) (158) (141) (120)
Loan impairment charges (100) 2 (35) (163) (610)
Profit before tax 154 296 343 427 241
Net profit for the year 117 227 262 334 188
Loans 31,950 39,082 36,735 34,492 39,811
Bonds 24,319 25,027 22,470 20,093 19,730
Equity 9,275 9,260 9,229 9,307 9,164
Total assets 59,805 66,824 62,349 58,161 62,621
DKK MILLION 2020 2019 2018 2017 2016
KEY RATIOS
Common Equity Tier 1 capital ratio (%) 22.3 18.5 19.0 19.7 17.2
Tier 1 capital ratio (%) 22.3 18.5 19.0 19.7 17.2
Total capital ratio (%) 22.3 18.5 19.0 19.7 17.2
Return on equity before tax (%) 1.7 3.2 3.7 4.6 2.5
Return on equity after tax (%) 1.3 2.5 2.8 3.6 1.9
Income/cost ratio1 1.6 2.8 2.8 2.4 1.3
Income/cost ratio (excluding loan impairment charges) 2.6 2.7 3.4 5.1 8.0
Foreign exchange position (%) 2.9 2.8 4.8 10.8 4.5
Gearing of loans 3.4 4.2 4.0 3.7 4.3
Annual growth in lending (%) (18.2) 6.4 6.5 (13.4) (7.8)
Annual loan impairment ratio (%) 0.3 (0.0) 0.1 0.4 1.4
Accumulated loan impairment charges as % of loans and guarantees 3.9 4.9 6.4 7.0 5.9
Rate of return on assets (%) 0.2 0.4 0.4 0.6 0.3
The key figures are calculated in accordance with Appendix 5 of the Danish FSA's instructions for financial reports for credit institutions, etc.
1) In accordance with the instructions, the income/cost ratio must be calculated including loan impairment charges. The list of key ratios also includes the income/cost ratio excluding loan impairment charges.
NOTE 2 NOTE 2 CONTINUED
55 Annual Report 202055

FINANCIAL STATEMENTS • NOTES
NOTES
FINANCIAL STATEMENTS • NOTES
2020 DKK MILLION RECONCILIATION OF BUSINESS AREAS
Business areas lending activities income adjustments income expenses equip. charges tax
Income
Lending Net interest income 533 533 0
Net fees and commission 21 21
Funding Funding costs not covered (29) (53) 24
Warehousing (8) (21) 13
Non-business activities (6) 42 (48)
Investments Net interest income 41 41
MV adjustments (139) (139)
Total Income 412 501 41 21 (150) 0 0 0 0 0
Staff costs and adm. expenses (158) 1 (158) (1)
Loan impairment charges before reclassification of interest (100) (100)
Profit before tax 154 154
Total 501 41 21 (150) 1 (158) (1) (100) 154
NOTE 3
Net interest income,
Net interest income, financial
Income statement
Fee and commission
Market value
Other operation
Staff costs and adm.
Dep. And imp. Of property,
plant andLoan
impairmentProfit
before
56 Annual Report 202056
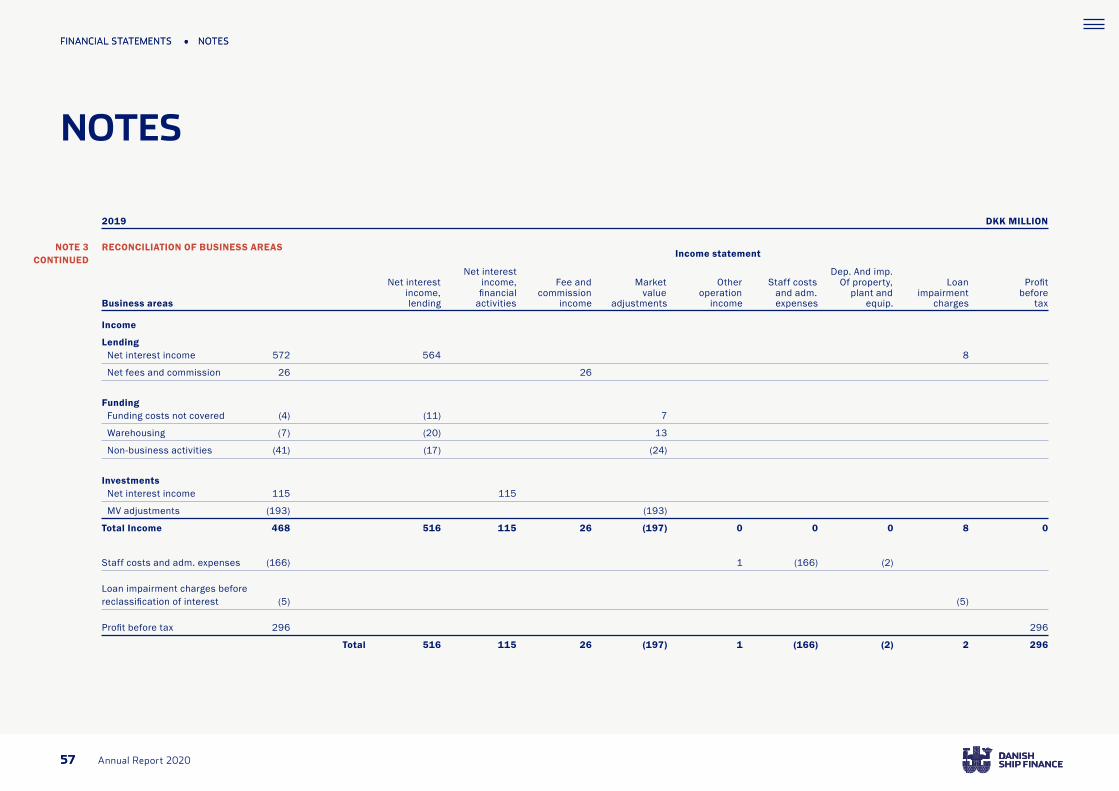
FINANCIAL STATEMENTS • NOTES
NOTES
FINANCIAL STATEMENTS • NOTES
2019 DKK MILLION RECONCILIATION OF BUSINESS AREAS
Business areas lending activities income adjustments income expenses equip. charges tax
Income
Lending Net interest income 572 564 8
Net fees and commission 26 26
Funding Funding costs not covered (4) (11) 7
Warehousing (7) (20) 13
Non-business activities (41) (17) (24)
Investments Net interest income 115 115
MV adjustments (193) (193)
Total Income 468 516 115 26 (197) 0 0 0 8 0
Staff costs and adm. expenses (166) 1 (166) (2)
Loan impairment charges before reclassification of interest (5) (5)
Profit before tax 296 296
Total 516 115 26 (197) 1 (166) (2) 2 296
NOTE 3 CONTINUED
Net interest income,
Net interest income, financial
Income statement
Fee and commission
Market value
Other operation
Staff costs and adm.
Dep. And imp. Of property,
plant andLoan
impairmentProfit
before
57 Annual Report 202057
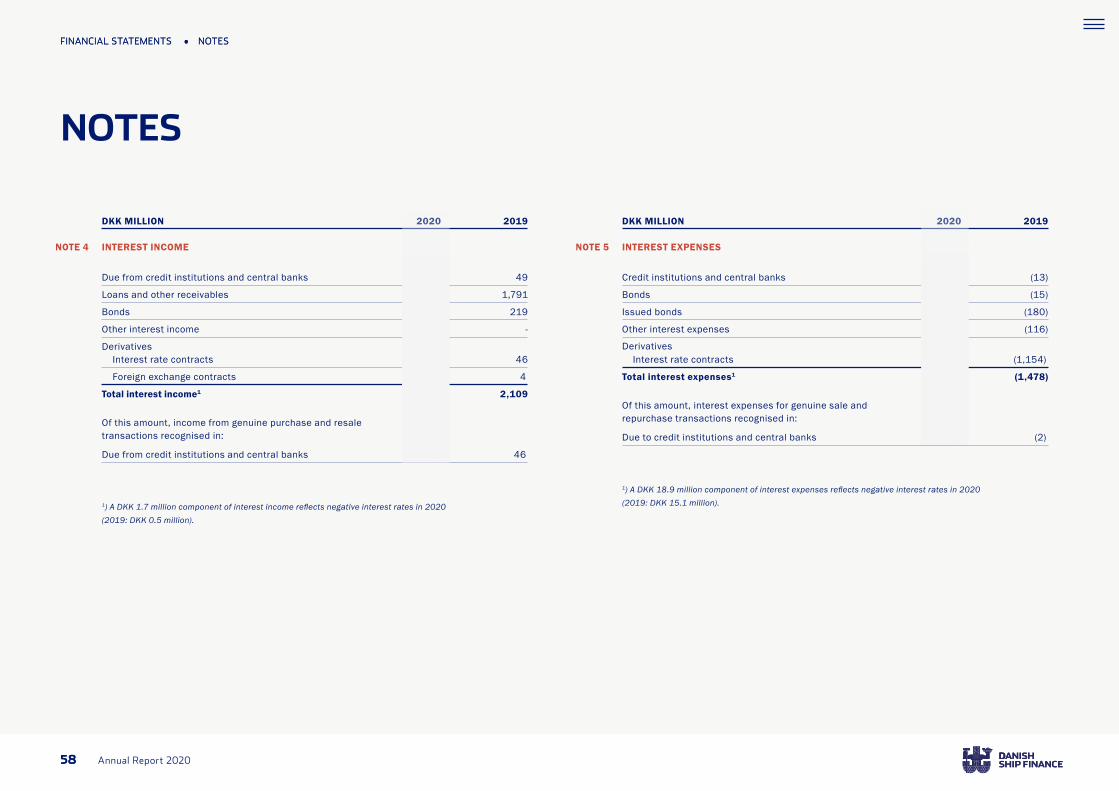
FINANCIAL STATEMENTS • NOTES
NOTES
FINANCIAL STATEMENTS • NOTES
DKK MILLION 2020 2019 INTEREST INCOME
Due from credit institutions and central banks 30 49
Loans and other receivables 1,255 1,791
Bonds 155 219
Other interest income 0 -
Derivatives Interest rate contracts 59 46
Foreign exchange contracts 2 4
Total interest income1 1,500 2,109
Of this amount, income from genuine purchase and resale transactions recognised in:
Due from credit institutions and central banks 31 46
1) A DKK 1.7 million component of interest income reflects negative interest rates in 2020 (2019: DKK 0.5 million).
DKK MILLION 2020 2019 INTEREST EXPENSES
Credit institutions and central banks (2) (13)
Bonds (18) (15)
Issued bonds (169) (180)
Other interest expenses (108) (116)
Derivatives Interest rate contracts (662) (1,154)
Total interest expenses1 (958) (1,478)
Of this amount, interest expenses for genuine sale and repurchase transactions recognised in:
Due to credit institutions and central banks (12) (2)
1) A DKK 18.9 million component of interest expenses reflects negative interest rates in 2020 (2019: DKK 15.1 million).
NOTE 4 NOTE 5
58 Annual Report 202058

FINANCIAL STATEMENTS • NOTES
NOTES
FINANCIAL STATEMENTS • NOTES
NOTE 6 NOTE 7
NOTE 8
DKK MILLION 2020 2019
NET INTEREST INCOME
Net interest income from lending
Loans and other receivables 1,255 1,791
Bonds 14 6
Due from credit institutions 4 5
Interest to credit institutions 0 (1)
Issued bonds (169) (180)
Other interest expenses (2) (1)
Derivatives Interest rate contracts (604) (1,108)
Foreign exchange contracts 2 4
Total net interest income from lending 501 516
Net interest income from financial activities
Bonds 123 199
Due from credit institutions 27 45
Other interest income 0 -
Interest to credit institutions (3) (13)
Other interest expenses (106) (116)
Total net interest income from financial activities 41 115
Total net interest income 542 631
DKK MILLION 2020 2019
FEE AND COMMISSION INCOME
Guarantee commission 2 2
Fee and other commission income 19 24
Total fee and commission income 21 26
DKK MILLION 2020 2019
MARKET VALUE ADJUSTMENTS
Market value adjustment of bonds (64) (108)
Market value adjustment of shares 6 0
Exchange rate adjustments (5) (3)
Market value adjustment of derivatives (87) (87)
Total market value adjustments (150) (197)
59 Annual Report 202059

FINANCIAL STATEMENTS • NOTES
NOTES
FINANCIAL STATEMENTS • NOTES
NOTE 9
DKK MILLION 2020 2019 STAFF COSTS AND ADMINISTRATIVE EXPENSES
Remuneration of Board of Directors and Executive Board
Board of Directors (3) (3)
Executive Board (15) (19)
Total remuneration of Board of Directors and Executive Board (18) (22)
Staff costs
Salaries and wages (73) (73)
Pensions (8) (8)
Social security costs and financial services employer tax (23) (23)
Total staff costs (105) (104)
Other administrative expenses (35) (40)
Total staff costs and administrative expenses (158) (166)
Number of employees - full-time equivalents 78 79
Average number of employees - full-time equivalents 79 79
DKK ‘000 REMUNERATION OF THE BOARD OF DIRECTORS
Eivind Kolding (Chairman) 1 750 - 94 844
Peter Nyegaard (Vice Chairman) 1 - - - -
Anders Damgård 1 - - - -
Christian Frigast 1 - - - -
Michael Nellemann Pedersen 1 200 150 44 394
Henrik Sjøgreen 1 200 150 44 394
Jacob Meldgaard 1 200 150 14 364
Thor Jørgen Guttormsen 1 200 150 14 364
Christopher Rex 2 200 - 50 250
New members as at 26 March 2020
Nanna Flint 2 100 - 50 150
Anna-Berit Koertz 2 100 - 50 150
Ninna Møller Kristensen 2 100 - 50 150
Retired as at 26 March 2020
Henrik Rohde Søgaard 2 100 - - 100
Marcus Freuchen Christensen 2 100 - - 100
Total 2,250 600 410 3,260
1) Member of Audit Committee or Remuneration Committee at year-end 2) Employee representative
2020Committee
feeOrdinary
fee
Fee moved forward due to
change in settle- ment period
Total fee
NOTE 9 CONTINUED
60 Annual Report 202060

FINANCIAL STATEMENTS • NOTES
NOTES
FINANCIAL STATEMENTS • NOTES
DKK ‘000 REMUNERATION OF THE BOARD OF DIRECTORS
Eivind Kolding (Chairman) 1 750 - 750
Peter Nyegaard (Vice Chairman) 1 - - -
Anders Damgård 1 - - -
Christian Frigast 1 - - -
Michael Nellemann Pedersen 1 200 150 350
Henrik Sjøgreen 1 200 150 350
Jacob Meldgaard 1 200 150 350
Thor Jørgen Guttormsen 1 200 150 350
Henrik Rohde Søgaard 2 200 - 200
Marcus Freuchen Christensen 2 200 - 200
Christopher Rex 2 200 - 200
Total 2,150 600 2,750
1) Member of Audit Committee or Remuneration Committee at year-end 2) Employee representative
2019
NOTE 9 CONTINUED
Ordinaryfee
Committeefee
Total fee 2020
Erik I. Lassen
Michael Frisch
Lars Jebjerg Total
NOTE 9 CONTINUED
DKK ‘000 REMUNERATION OF THE EXECUTIVE BOARD
Salary 4,345 4,125 4,125 12,595
Pension 541 514 514 1,569
Tax value of car 166 152 146 464
Incentive bonus 0 0 0 0
Total 5,052 4,791 4,785 14,628
Adjustment of variable pay for previous years (14) (6) (8) (28)
Total expenses for accounting purposes/earned income 5,038 4,785 4,777 14,600
In addition to total expenses for accounting purposes/earned income, the Executive Board members receive the following benefits: Multimedia, insurance covering critical illness, group life insurance, dental, accident and health insurance.
The Executive Board’s pension plan is a defined contribution plan with a third party. The com-pany has no pension obligations towards members of the Executive Board.
The Executive Board has received an incentive bonus in the form of warrants in Danish Ship Finance Holding A/S. The related costs are recognised in the accounts of Danish Ship Finance Holding A/S.
The company may terminate Executive Board members’ contracts of service by giving up to 18 months' notice.
61 Annual Report 202061

FINANCIAL STATEMENTS • NOTES
NOTES
FINANCIAL STATEMENTS • NOTES
2019Erik I.
LassenMichael
FrischLars
Jebjerg Total
NOTE 9 CONTINUED
DKK ‘000 REMUNERATION OF THE EXECUTIVE BOARD
Salary 4,239 4,024 4,024 12,287
Pension 523 496 496 1,515
Tax value of car 172 152 147 471
Incentive bonus 1,580 1,635 1,355 4,570
Total 6,514 6,307 6,022 18,843
Adjustment of variable pay for previous years 119 25 49 193
Total expenses for accounting purposes/earned income 6,633 6,332 6,071 19,036
Incentive bonus paid to the Executive Board is provided as equity-like instruments (Total Share-holder Return) with a deferral period of four years and a retention period of one year.
The remaining remuneration terms for 2019 are identical with the terms for 2020.
DKK ‘000 REMUNERATION OF THE EXECUTIVE BOARD
Information about remuneration policy and practice for the Board of Directors, the Executive Board and other employees whose activities have a material impact on the company’s risk profile
The remuneration policy was adopted at the company’s annual general meeting on 25 March 2019. The remuneration policy is available on the company’s website:
www.shipfinance.dk/investor-relations/
In accordance with the remuneration policy, variable remuneration may be provided to the Executive Board and other employees whose activities have a material impact on the company’s risk profile as well as employees in key functions.
Board of Directors 3,260 - 3,260 12
Executive Board 14,628 (28) 14,600 3
Other employees whose activities have a material impact on the company s risk profile 12,203 1,579 13,782 7
Total 30,091 1,551 31,642
The variable remuneration of other employees is provided as a bonus in the form of equity-like instruments (total shareholder return) with a deferral period of four years and a retention period of one year.
The pension plans of other employees are defined contribution plans.
NOTE 9 CONTINUED
2020Fixed
salary/feeVariable
salaryTotal
salary/feeNumber ofrecipients
62 Annual Report 202062

FINANCIAL STATEMENTS • NOTES
NOTES
FINANCIAL STATEMENTS • NOTES
DKK MILLION 2020 2019 AUDIT FEES
Fees for statutory audit of financial statements (0.8) (0.8)
Fees for tax advisory services (0.2) (0.3)
Fees for non-audit services (0.0) (1.6)
Fees for other assurance engagements (0.2) (0.2)
Total fees (1.2) (3.0)
Fees for non-audit services provided by Deloitte Statsautoriserede Revisionspartnerselskab to Danish Ship Finance A/S cover various assurance reports, review of the Interim Report, and VAT and tax advisory.
DKK ‘000
REMUNERATION OF THE EXECUTIVE BOARD
Board of Directors 2,750 - 2,750 11
Executive Board*) 14,273 4,763 19,036 3
Other employees whose activities have a material impact on the company s risk profile 11,362 1,529 12,891 7
Total 28,385 6,292 34,677
The variable remuneration terms and pension plans for 2019 for other employees are identical with the terms for 2020.
2019
NOTE 9 CONTINUED
NOTE 10
Fixedsalary/fee
Variablesalary
Totalsalary/fee
Number ofrecipients
63 Annual Report 202063

FINANCIAL STATEMENTS • NOTES
NOTES
FINANCIAL STATEMENTS • NOTES
NOTE 11 NOTE 12
DKK MILLION 2020 2019 TAX
Tax on profit for the year
Estimated tax on profit for the year (22) (42)
Changes in deferred tax (13) (25)
Adjustment for reduction of corporation tax rate (2) (3)
Total tax (37) (69)
Tax on other comprehensive income
Deferred tax (9) (2)
Total tax (9) (2)
Effective tax rate % %
Tax rate in Denmark 22.0 22.0
Non-taxable income and non-deductible expenses 0.6 1.3
Adjustment of prior-year tax charges 1.3 0.9
Effective tax rate 24.0 24.2
DKK MILLION 2020 2019 DUE FROM CREDIT INSTITUTIONS AND CENTRAL BANKS
Genuine purchase and resale transactions (reverse repo) 1,170 632
Other receivables 127 352
Total due from credit institutions and central banks 1,298 984
Broken down by due date
Demand deposits 24 52
Up to 3 months 1,274 931
Total due from credit institutions and central banks 1,298 984
The company has no term deposits with central banks.
64 Annual Report 202064

FINANCIAL STATEMENTS • NOTES
NOTES
FINANCIAL STATEMENTS • NOTES
NOTE 13 NOTE 14
DKK MILLION 2020 2019 LOANS AT AMORTISED COST
As at 1 January 39,082 36,735
Additions 6,472 7,327
Ordinary repayments and redemptions (5,181) (4,595)
Extraordinary repayments (4,533) (1,502)
Net change concerning revolving credit facilities (318) 362
Exchange rate adjustment of loans (4,287) 273
Change in amortised cost for the year 2 2
Depreciation, amortisation and impairment for the year 713 481
As at 31 December 31,950 39,082
DKK MILLION 2020 2019 LOANS AT AMORTISED COST BROKEN DOWN BY DUE DATE
Gross loans at exchange rates at the balance sheet date 33,264 41,109
Accumulated loan impairment charges (1,314) (2,027)
Total loans 31,950 39,082
Total loans broken down by due date
Up to 3 months 1,257 1,654
From 3 months to 1 year 2,529 3,357
From 1 to 5 years 24,140 24,742
Over 5 years 4,024 9,329
Total loans 31,950 39,082
Total loans
Loans at fair value 32,703 39,789
Loans at amortised cost 31,950 39,082
Loans at fair value are assessed using the market value of fixed-rate loans.
65 Annual Report 202065

FINANCIAL STATEMENTS • NOTES
NOTES
FINANCIAL STATEMENTS • NOTES
NOTE 15 NOTE 16
DKK MILLION 2020 2019 LOAN IMPAIRMENT CHARGES
The following loan impairment charges/loss allowances were made on loans/credit commitments
Accumulated loan impairment charges 1,314 2,027
Accumulated loss allowances for credit commitments 16 8
Total 1,330 2,035
Accumulated loan impairment charges as % of the loan book 3.9 4.9
Reconciliation of total ECL allowance account
As at 1 January 2,035 2,514
New loan impairment charges/loss allowances 760 581
Reversal of loan impairment charges/loss allowances (648) (575)
Gross write-offs debited to the allowance account (817) (486)
Total 1,330 2,035
Loan impairment charges for the period
New loan impairment charges/loss allowances (760) (581)
Reversal of loan impairment charges/loss allowances 648 575
Reclassification of interest 0 8
Recovery on loans previously written off 12 0
Loan impairment charges (100) 2
DKK MILLION 2020 2019 NON-PERFORMING LOANS
Impaired loans (DSF Rating 11)
Loans subject to forbearance or otherwise impaired, gross 650 3,161
Accumulated loan impairment charges (150) (1,169)
Impaired loans, net 500 1,993
Defaulted loans (DSF rating 12)
Loans in default, gross 1,757 1,088
Accumulated loan impairment charges (901) (609)
Defaulted loans, net 855 478
Non-performing loans, gross (NPL) 2,407 4,249
Non-performing loans, net (net NPL) 1,357 2,471
NPL ratio 7.2% 10.3%
Net NPL ratio 4.2% 6.3%
NPL ratio definition: NPL divided by loan book.
Net NPL ratio definition: Net NPL divided by loan book after loan impairment charges.
Note 17 provides detailed information on loan-to-value intervals for the total loan book and for non-performing loans.
66 Annual Report 202066

FINANCIAL STATEMENTS • NOTES
NOTES
FINANCIAL STATEMENTS • NOTES
NOTE 17
DKK MILLION 2020 2019 CREDIT RISK
Reconciliation of loans and guarantees (loan book)Balance sheet
Loans at amortised cost 31,950 39,082
Other receivables 196 198
Accumulated loan impairment charges 1,314 2,027
Total balance sheet items 33,460 41,307
Guarantees 116 132
Total guarantees 116 132
Total loans and guarantees 33,576 41,440
Reconciliation of other contingent liabilities
Credit commitments 3,723 3,168
Total other contingent liabilities 3,723 3,168
Reconciliation of financial exposure
Due from credit institutions and central banks 1,298 984
Bonds at fair value 24,319 25,027
Shares, etc. - 3
Derivatives 1,674 1,293
Total financial exposure 27,291 27,307
Total credit risk from loans, guarantees, credit commitments and financial exposures 64,590 71,915
Loan book before loan impairment charges broken down by rating category
DSF Rating
1 - 2 - -
3 - 4 5,450 7,757
5 - 6 11,710 14,560
7 - 8 12,929 13,043
9 - 10 1,080 1,831
11 (impaired) 650 3,161
12 (default) 1,757 1,088
Total 33,576 41,440
DSF RATING CATEGORY BREAKDOWN
The internal DSF Rating scale consists of 12 rating categories.
The main objective of the DSF Rating model is to rank clients according to credit risk and to estimate each client's probability of default (PD). As an integral part of the credit risk manage-ment, each client is assigned a DSF Rating, and the DSF Rating is reviewed upon receipt of new information or in case of a risk event, and at least annually.
Clients with non-performing loans are placed in DSF Rating category 11 or 12. This includes clients with loans for which no loan impairment charges have been recognised, for example because adequate collateral has been provided.
DKK MILLION
Loans andguarantees
2020
Loans andguarantees
2019
NOTE 17 CONTINUED
67 Annual Report 202067

FINANCIAL STATEMENTS • NOTES
NOTES
FINANCIAL STATEMENTS • NOTES
DKK MILLION
STAGES FOR CHANGES IN CREDIT RISKLoan book before loan impairment charges broken down by rating category and stages
DSF Rating
1 - - - -
2 - - - -
3 1,803 - - 1,803
4 3,648 - - 3,648
5 1,073 - - 1,073
6 10,637 - - 10,637
7 8,179 1,543 - 9,722
8 3,207 - - 3,207
9 - 358 - 358
10 - 722 - 722
11 (impaired) - - 650 650
12 (default) - - 1,757 1,757
Total 28,547 2,623 2,407 33,576
Stage 1 Stage 2 Stage 3
Loans andguarantees
2020
DKK MILLION
STAGES FOR CHANGES IN CREDIT RISKCredit commitments broken down by rating category and stages
DSF Rating
1 - - - -
2 - - - -
3 - - - -
4 1,221 - - 1,221
5 298 - - 298
6 1,023 - - 1,023
7 727 - - 727
8 429 - - 429
9 - 25 - 25
10 - - - -
11 (impaired) - - - -
12 (default) - - - -
Total 3,698 25 - 3,723
Stage 1 Stage 2 Stage 3
Credit Commitments
2020
NOTE 17 CONTINUED
NOTE 17 CONTINUED
68 Annual Report 202068

FINANCIAL STATEMENTS • NOTES
NOTES
FINANCIAL STATEMENTS • NOTES
DKK MILLION
STAGES FOR CHANGES IN CREDIT RISKLoan book before loan impairment charges broken down by rating category and stages
DSF Rating
1 - - - -
2 - - - -
3 3,935 - - 3,935
4 3,821 - - 3,821
5 1,959 - - 1,959
6 12,601 - - 12,601
7 8,592 374 - 8,966
8 3,898 179 - 4,077
9 - 1,181 - 1,181
10 - 649 - 649
11 (impaired) - - 3,161 3,161
12 (default) - - 1,088 1,088
Total 34,807 2,384 4,249 41,440
Stage 1 Stage 2 Stage 3
Loans andguarantees
2019
DKK MILLION
STAGES FOR CHANGES IN CREDIT RISKCredit commitments broken down by rating category and stages
DSF Rating
1 - - - -
2 - - - -
3 - - - -
4 728 - - 728
5 - - - -
6 147 - - 147
7 1,881 90 - 1,971
8 295 - - 295
9 - 27 - 27
10 - - - -
11 (impaired) - - - -
12 (default) - - - -
Total 3,051 117 - 3,168
Stage 1 Stage 2 Stage 3
NOTE 17 CONTINUED
NOTE 17 CONTINUED
Credit Commitments
2019
69 Annual Report 202069

FINANCIAL STATEMENTS • NOTES
NOTES
FINANCIAL STATEMENTS • NOTES
DKK MILLION
STAGES FOR CHANGES IN CREDIT RISKChanges in total ECL allowance account broken down by stages
As at 1 January 2020 167 90 1,778 2,035
Transferred to Stage 1 during the period - - - -
Transferred to Stage 2 during the period (9) 189 (179) 0
Transferred to Stage 3 during the period - - - -
New impairment charges/loss allowances 53 51 656 760
Reversal of loan impairment charges/loss allowances (75) (186) (386) (648)
Gross write-offs for the period - - (817) (817)Total ECL allowance account as at 31 December 2020 135 144 1,051 1,330
Of which:
- Accumulated loan impairment charges 119 144 1,051 1,314
- Acc. loss allowances for credit commitments 16 - - 16
DKK MILLION
STAGES FOR CHANGES IN CREDIT RISKChanges in total ECL allowance account broken down by stages
As at 1 January 2019 197 79 2,238 2,514
Transferred to Stage 1 during the period - - - -
Transferred to Stage 2 during the period (20) 94 (74) 0
Transferred to Stage 3 during the period - (19) 19 0
New impairment charges/loss allowances 70 3 508 581
Reversal of loan impairment charges/loss allowances (80) (67) (428) (575)
Gross write-offs for the period - - (486) (486)
Total ECL allowance account as at 31 December 2019 167 90 1,778 2,035
Of which:
- Accumulated loan impairment charges 159 90 1,778 2,027
- Acc. loss allowances for credit commitments 8 - - 8
NOTE 17 CONTINUED
NOTE 17 CONTINUED
Stage 1 Stage 1Stage 2 Stage 2Stage 3 Stage 3Total Total
70 Annual Report 202070

FINANCIAL STATEMENTS • NOTES
NOTES
FINANCIAL STATEMENTS • NOTES
Classification, stage migration and impairment charges
The classification of loans between Stages 1 and 2 for the purpose of calculating loan impair-ment charges for expected credit losses (ECL) depends on whether the credit risk has increa-sed significantly since initial recognition and/or is showing significant signs of weakness. All credit-impaired loans are placed in Stage 3.
The stage migration of a loan is closely linked to the development of the client’s DSF Rating. The assessment of whether the credit risk has increased significantly since initial recognition and/or is showing significant signs of weakness is supported by an internally developed stage migration model, which is based on a combination of DSF's rating model and the rating model used by the Danish FSA according to guidelines set out in the Executive Order on Financial Re-ports.
For loans classified as being in Stage 1, loan impairment charges for 12-month ECL are recognised, and for loans in Stages 2 and 3, loan impairment charges for lifetime ECL are recognised.
The Risk Report 2020 provides more detailed information.
Arrears/past-due loans
Loans in arrears/past-due for 30 days or more (but less than 90 days) are generally showing significant signs of weakness, and they are classified as Stage 2 for the purpose of calculating ECL. Loans in arrears/past due for 90 days or more are in default, and they are classified as Stage 3 for the purpose of calculating ECL. For all such loans, ECL arising over their remaining lifetimes have been recognised.
NOTE 17 CONTINUED
NOTE 17 CONTINUED
Covid-19 concessions
Our forbearance practices have been updated to cater for clients materially affected by the Covid-19 pandemic. Temporary Covid-19 concessions to clients are not considered forbearance if such clients - based on individual credit assessments - are considered to have viable business models post-Covid-19.
Credit risk mitigation
All loans are granted against a first lien mortgage on vessels, assignment in respect of each vessel's primary insurances and, where relevant, supplementary collateral.
The USD market value of mortgaged vessels declined by 13.8% on average in 2020. As illustra-ted on the next page, declines in vessel values do not in general have a material adverse effect on the collateral coverage of the loan book due to positive effects of regular loan repayments and benefit of minimum value clauses (MVC).
71 Annual Report 202071

FINANCIAL STATEMENTS • NOTES
NOTES
FINANCIAL STATEMENTS • NOTES
The table above shows that at year-end 2020, 98% (2019: 99%) of all loans after impairment charges were secured within 60% of the market value of the mortgage, and 100% (2019: 100%) of all loans after impairment charges were within 80% of the market value of the mortgage.
The weighted loan-to-value ratio on the loan book after loan impairment charges was 54% at year-end 2020 (2019: 51%).
Loan book after loan impairment charges broken down by loan-to-value interval
Net loan-to-value interval
0 - 20 % 39% 41%
20 - 40 % 37% 37%
40 - 60 % 22% 21%
60 - 80 % 2% 1%
80 - 90 % 0% 0%
90 - 100 % 0% 0%
Over 100 % 0% 0%
Non-performing loans after loan impairment charges broken down by loan-to-value interval
Net loan-to-value interval
0 - 20% 41% 40%
20 - 40% 35% 38%
40 - 60% 22% 21%
60 - 80% 2% 1%
80 - 90% 0% 0%
90 - 100% 0% 0%
Over 100% 0% 0%
The table above shows that at year-end 2020, 98% (2019: 99%) of non-performing loans after impairment charges were secured within 60% of the market value of the mortgage, and 100% (2019: 100%) of non-performing loans after impairment charges were within 80% of the market value of the mortgage.
The weighted average loan-to-value ratio for non-performing loans after loan impairment charges was 53% at year-end 2020 (2019: 52%).
Share of loans2020
Share of loans2020
Share of loans2019
Share of loans2019
NOTE 17 CONTINUED
NOTE 17 CONTINUED
72 Annual Report 202072

FINANCIAL STATEMENTS • NOTES
NOTES
FINANCIAL STATEMENTS • NOTES
DKK MILLION 2020 2019
BONDS AT FAIR VALUE
Bond portfolio
Own non-callable bonds 962 -
Non-callable bonds 21,697 18,036
Callable bonds 2,622 6,991
Total portfolio of bonds 25,281 25,027
Own bonds (offset against issued bonds at amortised cost) (962) -
Total bond portfolio 24,319 25,027
Bond portfolio
Own bonds 962 -
Government bonds and bonds issued by KommuneKredit 7,048 4,004
Mortgage bonds 17,271 21,023
Total portfolio of bonds 25,281 25,027
Own bonds (offset against issued bonds at amortised cost) (962) -
Total bond portfolio 24,319 25,027
NOTE 19
DKK MILLION 2020 2019 BONDS BY TIME TO MATURITY
Bond portfolio
Bonds with a maturity up to and including 1 year 1,658 1,722
Bonds with a maturity over 1 year and up to and including 5 years 17,935 13,489
Bonds with a maturity over 5 years and up to and including 10 years 1,624 889
Bonds with a maturity over 10 years 3,102 8,927
Total bonds specified by time to maturity 24,319 25,027
NOTE 20
DKK MILLION 2020 2019 CSA COLLATERAL
Collateral under CSA agreements
Collateral received 714 203
Collateral delivered (999) (808)
Net value of collateral under CSA agreements (285) (605)
The bonds received and delivered have been recognised in the balance sheet so that they redu-ce the market values of derivatives by the market value of the bonds at the balance sheet date. The portfolio of bonds at fair value has been adjusted correspondingly by the net market value hereof.
NOTE 18
73 Annual Report 202073

FINANCIAL STATEMENTS • NOTES
NOTES
FINANCIAL STATEMENTS • NOTES
NOTE 22
DKK MILLION 2020 2019 LAND AND BUILDINGS
Owner-occupied properties
Revaluation, as at 1 January 102 90
Acquisition 183 -
Property improvements during the year 0 0
Revaluation 40 11
Revaluation including improvements, as at 31 December 325 102
Accumulated depreciation, as at 1 January 2 2
Depreciation for the year 0 0
Accumulated depreciation, as at 31 December 2 2
Total revaluation, as at 31 December 323 100
The owner-occupied properties are the office properties at Sankt Annæ Plads 3, Copenhagen (public property valuation on 1 October 2019: DKK 79 million) and Langebrogade 5, Copenhagen (public property valuation on 1 October 2019: DKK 88 million). The office property at Langebro-gade 5 was purchased in 2020.
The domicile properties have been valued based on rent levels and yields for similar properties in the respective areas. Consequently, a revaluation has been made to the recognised value. External experts have not been involved in valuing the owner-occupied properties
In mid-July 2020, we entered into an agreement for the sale of our current domicile property at Sankt Annæ Plads and the property has therefore been valued based on sale price. The sale will be effected once we can move to our new offices, expected to be in the second half of 2022.
DKK MILLION 2020 2019 SHARES, ETC.
Shares listed on Nasdaq Copenhagen A/S - -
Unlisted shares recognised at fair value - 3
Total shares, etc. - 3
NOTE 21
74 Annual Report 202074

FINANCIAL STATEMENTS • NOTES
NOTES
FINANCIAL STATEMENTS • NOTES
NOTE 24
NOTE 25
DKK MILLION 2020 2019 OTHER ASSETS
Interest receivable 131 247
Prepayments to swap counterparties 12 15
Derivatives 1,674 1,293
Miscellaneous receivables 81 15
Total other assets 1,898 1,570
DKK MILLION 2020 2019
DUE TO CREDIT INSTITUTIONS AND CENTRAL BANKS
Repo transactions 6,693 8,447
Other amounts due - 256
Total due to credit institutions and central banks 6,693 8,704
Broken down by due date
On demand - 256
Up to 3 months 6,693 8,447
From 3 months to 1 year 0 0
From 1 to 5 years 0 0
Over 5 years 0 0
NOTE 23
DKK MILLION 2020 2019 OTHER TANGIBLE ASSETS
Cost, as at 1 January 23 23
Additions during the year 0 0
Disposals during the year (11) 0
Cost, as at 31 December 12 23
Accumulated depreciation, as at 1 January 16 15
Disposals during the year (11) 0
Depreciation during the year 1 1
Accumulated depreciation, as at 31 December 6 16
Total other tangible assets 6 8
75 Annual Report 202075

FINANCIAL STATEMENTS • NOTES
NOTES
FINANCIAL STATEMENTS • NOTES
NOTE 26
DKK MILLION 2020 2019 ISSUED BONDS AT AMORTISED COST
As at 1 January 47,737 43,549
Additions in connection with pre-issuance 7,935 13,969
Amortisation of cost (137) (73)
Adjustment for hedge accounting (1) 101
Exchange rate adjustment (38) 28
Own bonds (970) -
Ordinary and extraordinary redemptions (12,050) (9,836)
As at 31 December 42,477 47,738
Specification of issued bonds
Bonds issued in DKK
Bullet bonds 35,653 39,398
Amortising CIRR bonds 276 392
Total Danish bonds 35,929 39,790
Bonds issued in foreign currency
Bullet bonds 7,439 7,450
Amortising CIRR bonds, at year-end exchange rates 71 497
Total bonds issued in foreign currency 7,510 7,947
Own bonds (962) -
Total issued bonds 42,477 47,738
DKK MILLION 2020 2019 ISSUED BONDS AT AMORTISED COST
Broken down by term to maturity
Up to 3 months 1,175 1,301
From 3 months to 1 year 38 373
From 1 to 5 years 38,042 25,212
Over 5 years 4,184 20,850
Total issued bonds 43,439 47,738
Own bonds (962) -
Total issued bonds 42,477 47,738
NOTE 26 CONTINUED
76 Annual Report 202076

FINANCIAL STATEMENTS • NOTES
NOTES
FINANCIAL STATEMENTS • NOTES
NOTE 27
DKK MILLION 2020 2019 OTHER LIABILITIES
Interest payable 131 131
Derivatives 1,074 824
Other liabilities 70 158
Total other liabilities 1,275 1,112
NOTE 28
Property, plant and equipment 0 (21) (21) (10)
Loans 72 0 72 73
Shares, etc. 1 0 1 2
Issued bonds 0 (121) (121) (112)
Employee obligations 0 0 0 2
Balance of tax losses 0 0 0 91
Total deferred tax 73 (141) (68) 47
2020Deferred
tax assets
2020Deferred
tax liabilities
2020Deferred
tax net
2019Deferred
tax net
DKK MILLION 2020 2019 DEFERRED TAX
Deferred tax, as at 1 January 47 74
Adjustment of prior-year (91) 1
Estimated deferred tax on profit for the year (24) (27)
Total deferred tax (68) 47
77 Annual Report 202077

FINANCIAL STATEMENTS • NOTES
NOTES
FINANCIAL STATEMENTS • NOTES
DKK MILLION 2020 2019 EQUITY
Share capital
A shares 300 300
B shares 33 33
Total share capital 333 333
Tied-up reserve capital 8,343 8,343
Revaluation reserves 70 38
Retained earnings 471 412
Proposed dividends for the financial year 59 133
Total equity 9,275 9,260
The share capital is divided into the following denominations:
A shares 300,000,000 shares of DKK 1.00 each B shares 33,333,334 shares of DKK 1.00 each
Each A share of DKK 1.00 entitles the holder to 10 votes. Each B share of DKK 1.00 entitles the holder to 1 vote.
NOTE 29 NOTE 30
DKK MILLION 2020 2019 CAPITAL ADEQUACY
Common Equity Tier 1 capital
Share capital A shares 300 300
Share capital B shares 33 33
Tied-up reserve capital 8,343 8,343
Retained earnings 471 412
Proposed dividends for the financial year 59 133
Revaluation reserves 70 38
Total Common Equity Tier 1 capital 9,275 9,260
Deductions from Common Equity Tier 1 capital
Proposed dividends for the financial year 59 133
Additional capital charge pursuant to the Executive Order on a Ship Finance Institute - -
Prudent valuation pursuant to Article 105 of the CRR 28 28
Deductions pursuant to transitional rules regarding B share capital 33 33
Total deductions from Common Equity Tier 1 capital 119 195
Common Equity Tier 1 capital after deductions 9,156 9,065
78 Annual Report 202078

FINANCIAL STATEMENTS • NOTES
NOTES
FINANCIAL STATEMENTS • NOTES
DKK MILLION 2020 2019 CAPITAL ADEQUACY
Risk exposure amount
Assets outside the trading book 32,309 40,069
Off-balance sheet items 1,862 1,732
Counterparty risk outside the trading book 2,255 1,953
Market risk 3,736 4,211
Operational risk 880 1,056
Total risk exposure amount 41,042 49,020
Common Equity Tier 1 capital ratio 22.3 18.5
Tier 1 capital ratio 22.3 18.5
Total capital ratio 22.3 18.5
The risk exposure amount for market risk consists of:
Position risk related to debt instruments 3,454 3,952
Position risk related to shares 18 7
Total currency position 265 253
Total risk exposure amount for market risk 3,736 4,211
NOTE 30 CONTINUED
NOTE 31
NOTE 32
DKK MILLION 2020 2019 CONTINGENT LIABILITIES
In the ordinary course of its lending operations, DSF has undertaken guarantee commitments of 116 132
Payment guarantee provided to the Danish Securities Centre 0 0
Total contingent liabilities 116 132
DKK MILLION 2020 2019 OTHER CONTINGENT LIABILITIES
In the ordinary course of its lending operations, DSF has undertaken commitments in relation to unutilised drawing rights on loans with revolving credit facilities in the amount of 885 437
In the ordinary course of its lending operations, DSF has undertaken commitments relating to irrevocable credit commitments in the amount of 2,837 2,731
Total other contingent liabilities 3,723 3,168
79 Annual Report 202079

FINANCIAL STATEMENTS • NOTES
NOTES
FINANCIAL STATEMENTS • NOTES
RELATED PARTIES
Related parties furthermore comprise Danish Ship Finance Holding A/S, which holds an owners-hip interest of 86.2% and more than 20% of the voting rights in the company.
Danish Ship Finance Holding A/S is owned by Axcel, PFA and PKA, which hold more than 20% of the share capital each and more than 20% of the voting rights each and are therefore also related parties of Danish Ship Finance A/S.
Transactions with the Executive Board and the Board of Directors only concerned remuneration. See Note 9.
Related-party transactions concerning loans and loan offers totalled as at 31 December 2020 a nominal amount of DKK 1,252 million (as at 31 December 2019: DKK 1,379 million). Transa-ctions with related parties are settled on an arm’s-length basis and recognised in the financial statements according to the same accounting policy as for similar transactions with unrelated parties.
Furthermore, related-party transactions included settlement of administration services provi-ded by Danish Ship Finance Holding A/S and dividends to Danish Ship Finance Holding A/S.
There were no related-party transactions other than those stated above.
NOTE 33 NOTE 34 CONSOLIDATED FINANCIAL STATEMENTS
The financial statements of DSF are consolidated into the consolidated financial statements of Danish Ship Finance Holding A/S.
The consolidated financial statements are available on request from Danish Ship Finance Hol-ding A/S, Sankt Annæ Plads 3, DK-1250 Copenhagen K.
80 Annual Report 202080

FINANCIAL STATEMENTS • NOTES
NOTES
FINANCIAL STATEMENTS • NOTES
NOTE 35 NOTE 35 CONTINUED
HEDGE ACCOUNTING
The company in part hedges the interest rate risk on fixed-rate assets and liabilities. The effectiveness of such hedges is measured on a regular basis.
HEDGE ACCOUNTING
2020 NOMINAL VALUE CARRYING AMOUNT FAIR VALUE
Commitments Issued bonds 12,910 13,014 13,350
Total commitments 12,910 13,014 13,350
Derivatives Interest rate swaps (12,910) (101) (101)
Total derivatives (12,910) (101) (101)
Net 0 12,913 13,249
2019 NOMINAL VALUE CARRYING AMOUNT FAIR VALUE
Commitments Issued bonds 16,011 16,248 16,533
Total commitments 16,011 16,248 16,533
Derivatives Interest rate swaps (16,011) (216) (216)
Total derivatives (16,011) (216) (216)
Net 0 16,032 16,317
DKK MILLION DKK MILLION
81 Annual Report 202081

FINANCIAL STATEMENTS • NOTES
NOTES
FINANCIAL STATEMENTS • NOTES
DKK MILLION 2020 2019 NOTIONAL PRINCIPALS OF OUTSTANDING DERIVATIVES
Swap agreements
Swap agreements have been made with the following parties to hedge the foreign exchange risk on loans and issued bonds:
Receivables 279 392
Credit institutions 78,741 61,436
Swap agreements have been made with the following parties to hedge the interest rate risk on loans, bonds and issued bonds:
Receivables - -
Credit institutions 129,437 80,297
Swap agreements, for which financial risks are not fully hedged, have been made with the following parties:
Credit institutions 56,487 53,245
Forward interest rate and currency agreements
Forward interest rate and currency agreements have been made with the following parties to hedge interest rate and foreign exchange risk:
Credit institutions 34,619 29,446
NOTE 36 NOTE 37
DKK MILLION FAIR VALUES OF OUTSTANDING DERIVATIVES
Swap agreements
Swap agreements have been made with the following parties to hedge the foreign exchange risk on loans and issued bonds:
Receivables 19 - 9 -
Credit institutions 1,240 285 330 373
Swap agreements have been made with the following parties to hedge the interest rate risk on loans, bonds and issued bonds:
Receivables - - - -
Credit institutions 1,161 967 1,180 617
Swap agreements, for which financial risks are not fully hedged, have been made with the following parties:
Credit institutions 1,200 1,861 1,353 1,947
Forward interest rate and currency agreements
Forward interest rate and currency agreements have been made with the following parties to hedge interest rate and foreign exchange risk:
Credit institutions 46 258 127 0
2020Positive
2019Positive
2020Negative
2019Negative
82 Annual Report 202082

FINANCIAL STATEMENTS • NOTES
NOTES
FINANCIAL STATEMENTS • NOTES
DKK MILLION FAIR VALUES OF OUTSTANDING DERIVATIVES
Netting of exposure value
The positive gross fair value of financial contracts after netting:
Counterparty with risk weight of 0% - -
Counterparty with risk weight of 20% 539 261
Counterparty with risk weight of 50% 1,251 1,525
Counterparty with risk weight of 100% 36 94
Value of total counterparty risk calculated according to the market valuation method for counterparty risk:
Counterparty with risk weight of 0% - -
Counterparty with risk weight of 20% 881 595
Counterparty with risk weight of 50% 2,750 2,374
Counterparty with risk weight of 100% 36 31
NOTE 37 CONTINUED
2020Positive
2019Positive
83 Annual Report 202083

FINANCIAL STATEMENTS • NOTES
NOTES
FINANCIAL STATEMENTS • NOTES
DKK MILLION FOREIGN EXCHANGE RISK AND USE OF DERIVATIVES
Our total unhedged foreign currency position as at 31 December 2020, translated at year-end exchange rates into DKK, amounts to DKK 265 million (DKK 188 million as at 31 December 2019). All amounts are translated into DKK at the year-end exchange rates.
The net position is specified as follows
USD currencies currency DKK Total
Loans at year-end exchange rates 29,026 2,828 31,854 1,411 33,264
Loan impairment charges - - - (1,314) (1,314)
Loans as per the balance sheet 31,950
Due from credit institutions and central banks 4 57 61 1,237 1,298
Bond portfolio - 1,912 1,912 22,407 24,319
Interest receivable, other assets, etc. 135 47 183 2,055 2,238
Total assets as per the balance sheet 29,165 4,844 34,008 25,796 59,805
Issued bonds at year-end exchange rates (71) (6,577) (6,648) (35,829) (42,477)
Issued bonds as per the balance sheet (42,477)
Due to credit institutions and central banks (48) (190) (239) (6,455) (6,693)
Interest payable, other payables (3) (0) (3) (1,340) (1,343)
Provisions - - - (16) (16)
Total equity - - - (9,275) (9,275)
Total liabilities as per the balance sheet (122) (6,767) (6,889) (52,915) (59,805)
Derivatives
- receivables 13,277 26,312 39,590
Derivatives
- payables (42,112) (24,332) (66,443)
Total net position 209 57 265
Other
Total
NOTE 38
84 Annual Report 202084

FINANCIAL STATEMENTS • NOTES
NOTES
FINANCIAL STATEMENTS • NOTES
NOTE 39
DKK MILLION 2020 2019
An appreciation of the USD exchange rate against the DKK
Change in net profit for the year and equity (2) 38
Percentage change in total capital ratio (2.4) (1.9)
A depreciation of the USD exchange rate against the DKK
Change in net profit for the year and equity (5) (41)
Percentage change in total capital ratio 3.1 2.4
An appreciation of the GBP exchange rate against the DKK
Change in net profit for the year and equity (32) (27)
Percentage change in total capital ratio 0.0 0
A depreciation of the GBP exchange rate against the DKK
Change in net profit for the year and equity 32 27
Percentage change in total capital ratio 0.0 0
An appreciation of the NOK exchange rate against the DKK
Change in net profit for the year and equity (29) (78)
Percentage change in total capital ratio (0.3) (1)
A depreciation of the NOK exchange rate against the DKK
Change in net profit for the year and equity 22 76
Percentage change in total capital ratio (0.3) 1
NOTE 39 CONTINUED
DKK MILLION 2020 2019 MARKET RISK SENSITIVITY
Interest rate risk
Our equity is invested primarily in Danish government and mortgage bonds. Some of the bond in-vestments are in fixed-rate claims where the interest rate risk is partly hedged using DKK or EUR interest rate swaps. In our internal calculations, EUR rates and DKK rates are assumed to be fully correlated.
Calculated in accordance with internal calculation methods, the interest rate risk associated with a 1 percentage point increase in interest rates would technically lead to: (46) (92)
Calculated in accordance with internal calculation methods, the interest rate risk associated with a 1 percentage point decrease in interest rates would technically lead to:
32 62
Exchange rate risk
Most of the loans are denominated in USD, and most of the ship mortgages provided as collateral for the loans are also valued in USD. When calculating the collateral value of the ship mortgages for determining the level of loan impairment charges, a haircut is made to the market value of the vessel. For loans on which loan impairment charges have been made, there will typically be a diffe-rence in USD between the size of the credit exposure and the mortgage values. Other things being equal, the loan impairment charges will therefore be adversely affected in case of an increase and positively affected by a fall in the USD/DKK exchange rate. Since a small proportion of the loans are denominated in currencies other than the USD, while the ship mortgage in question is valued in USD, the total positive net effect from a fall in the USD/DKK exchange rate is reduced, and the sensitivity is thus not symmetric in the event of changes in the USD/DKK exchange rate.
Furthermore, earnings and loan impairment charges from lending are primarily denominated in USD, GBP and NOK which means that, other things being equal, an increase in these currencies against the DKK exchange rate would result in higher earnings from lending and vice versa if these curren-cies fall. The opposite applies to loan impairment charges.
85 Annual Report 202085

FINANCIAL STATEMENTS • NOTES
NOTES
FINANCIAL STATEMENTS • NOTES
DKK MILLION 2020 2019 FAIR VALUE OF FINANCIAL INSTRUMENTS MEASURED AT AMORTISED COST
Financial instruments are measured in the balance sheet at fair value or amortised cost.
The difference between carrying amounts and fair value-based values, which are not recognised in the income statement and which are attributable to the difference between the amortised costs and the calculated fair values, is shown below.
Loans
Measured at amortised cost 31,950 39,082
Measured at fair value 32,703 39,789
Difference between carrying amounts and fair-value based value of loans, total 753 707
Loans at fair value are assessed using the market value of fixed-rate loans.
Issued bonds
Measured at amortised cost, incl. hedging 42,477 47,738
Measured at fair value 43,034 48,246
Difference between carrying amounts and fair-value based value of issued bonds, total 557 509
For issued bonds, the fair value is calculated on the basis of quoted market prices.
For unlisted bonds, the fair value is calculated on the basis of observable market data.
MARKET RISK SENSITIVITY
The impact on net profit for the year and equity from a change in the USD, GBP and NOK exchange rates assumes a permanent change of 17% (which equals a DKK 1 change against the USD) for an entire financial year. The impact comprises the change in the value of ongoing net interest and fee income as well as the change in the need for loan impairment charges due to the change in the exchange rates in question.
The impact on the total capital ratio of a change in the currencies in question occurs immediately after the exchange rate change.
NOTE 39 CONTINUED
NOTE 40
86 Annual Report 202086

FINANCIAL STATEMENTS • NOTES
NOTES
FINANCIAL STATEMENTS • NOTES
SUPPLEMENTARY NOTES WITHOUT REFERENCE
FINANCIAL RISKS AND POLICIES FOR FINANCIAL RISK MANAGEMENT
RISK MANAGEMENT
DSF is exposed to different types of risk. The most important types of risk are:
• Credit risk: The risk of loss caused by borrowers or counterparties failing to meet all or part of their payment obligations.
• Market risk: The risk of loss resulting from changes in the fair value of the assets and liabilities as a result of changes in market conditions.
CREDIT RISK
Credit risk is the risk of loss caused by borrowers or counterparties failing to meet all or part of their payment obligations, including risk associated with clients in financial difficulty, large exposures, concentration risk and risk on offered, non-disbursed loans.
The overall credit risk is managed on the basis of our credit policy, which the Board of Directors determines together with the overall risk management framework. The key objective of the credit policy is to ensure that earnings and risks are balanced, and that the assumption of risk is always quantified.
The credit process is controlled centrally by the Credit Department. The Executive Board and the Head of Credit have been authorised by the Board of Directors to grant loans up to predetermined limits. The granting of loans must be disclosed at the subsequent ordinary board meeting. Other loans are granted by the Board of Directors. Note 16 includes a more detailed description of credit risk.
We have developed IT tools for managing and monitoring credit risks. The credit analysis system is used for monitoring purposes, and the system records key data regarding credit exposures and clients' financial standings to detect warning signals for exposures at an early stage as well as to monitor portfolios and client groups.
In addition, a number of risk events have been defined as representing credit impairment and de-fault.
MARKET RISK
Market risk is defined as the risk of changes in the market value of the company's financial assets and liabilities because of changes in market conditions.
Market risk can be divided into interest rate risk, equity price risk, foreign exchange risk and liquidity risk.
The Board of Directors determines the general policies, frameworks and principles for risk manage-ment.
The policies cover the identification and calculation of various types of market risk. The frameworks indicate specific limits on the extent of risk the company is willing to assume. The principles establish the methods to be used in the calculation of various risk targets.The Board of Directors receives con-tinuous reporting on risk developments and the utilisation of allocated risk limits.
The purpose of our market risk policy is to ensure that the market risk at all times is appropriate in relation to the total capital. The objective of the market risk policy is also to ensure that we consi-stently maintain adequate and appropriate handling and management of market risk. The Risk Management function is responsible for calculating, monitoring, controlling and reporting market risk to the Board of Directors and Executive Board. The function is independent of the front office department. The market risks are managed and monitored via a risk management system. We follow up on all material types of market risk with respect to all units subject to instructions, and failure to comply with instructions are escalated accordingly to policy.
Notes 38-39 include more detailed descriptions of foreign exchange risk and market risk sensitivity.
For further information, please see the unaudited Risk Report at:
www.shipfinance.dk
NOTE 41
87 Annual Report 202087

FINANCIAL STATEMENTS • NOTES
NOTES
FINANCIAL STATEMENTS • NOTES
DKK MILLION CAPITAL CENTRES 2020
Income statement
Interest, loans and other receivables 1,062 193 1,255
Other interest and fee income, net (586) (106) (692)
Market value adjustments (135) (15) (150)
Staff costs and administrative expenses (134) (24) (158)
Loan impairment charges (217) 117 (100)
Tax (1) (36) (37)
Net profit for the year (11) 128 117
Assets
Loans and other receivables at amortised cost 26,021 5,929 31,950
Other assets 25,373 2,482 27,855
Total assets 51,394 8,411 59,805
Liabilities
Issued bonds at amortised cost 35,857 6,620 42,477
Other liabilities 8,047 5 8,053
Equity 7,490 1,785 9,275
Total liabilities 51,394 8,411 59,805
Transferrals between capital centres (68) 68 0
DKK MILLION CAPITAL CENTRES 2019
Income statement
Interest, loans and other receivables 1,650 142 1,791
Other interest and fee income, net (1,044) (90) (1,134)
Market value adjustments (212) 15 (197)
Staff costs and administrative expenses (154) (13) (167)
Loan impairment charges 35 (32) 2
Tax (64) (5) (69)
Net profit for the year 210 17 227
Assets
Loans and other receivables at amortised cost 32,177 6,905 39,082
Other assets 25,701 2,040 27,742
Total assets 57,879 8,945 66,824
Liabilities
Issued bonds at amortised cost 40,513 7,225 47,738
Other liabilities 9,823 3 9,826
Equity 7,542 1,717 9,260
Total liabilities 57,879 8,945 66,824
Transferrals between capital centres1 (1,717) 1,717 0
1) Capital Centre A was established in 2019 and in this connection DKK 1.7 billion has been transferred to the centre.
Capital Centre
Institute in generalCapital Centre
Institute in generalCapital
Centre ACapital
Centre ATotal Total
NOTE 42 NOTE 42 CONTINUED
88 Annual Report 202088

STATEMENTS
89 Annual Report 2020

STATEMENT BY MANAGEMENT ON THE ANNUAL REPORT
The Board of Directors and the Executive Board have today considered and approved the Annual Report of Danish Ship Finance A/S (Danmarks Skibskredit A/S) for the financial year 1 January to 31 December 2020. The Annual Report is presented in accordance with the Danish Financial Business Act. Furthermore, the Annual Report has been prepared in accordance with additional Danish disclosure requirements for annual reports of issuers of listed bonds.
In our opinion, the Management Report includes a fair review of developments in the company’s activities and financial position and fairly describes the principal risks and uncertain-ties that may affect the company.
Further, in our opinion, the financial statements give a true and fair view of the company’s financial position as at 31 December 2020 and of the results of its activities for the financial year 1 January to 31 December 2020.
The Annual Report is recommended for adoption by the annual general meeting on 18 March 2021.
Erik Ingvar Lassen
Chief Executive Officer
Michael Frisch Lars Jebjerg
Chief Commercial Officer Chief Financial Officer/Chief Risk Officer
Eivind Drachmann Kolding Peter Nyegaard
(Chairman) (Vice Chairman)
Anders Damgaard Nanna Flint Povl Christian Lütken Frigast
Thor Jørgen Guttormsen Anna-Berit Koertz Ninna Møller Kristensen
Jacob Balslev Meldgaard Michael Nellemann Pedersen Christopher Rex
Henrik Sjøgreen
Board of Directors
Executive Board
STATEMENTS • STATEMENT BY MANAGEMENT ON THE ANNUAL REPORT
STATEMENT
Copenhagen, 26 February 2021
90 Annual Report 2020

OpinionWe have audited the financial statements of Danish Ship Finance A/S (Danmarks Skibskredit A/S) for the financial year 1 January 2020 to 31 December 2020, which comprise the income statement, statement of comprehensive income, balance sheet, statement of changes in equity, and notes, including a summary of significant accounting policies. The financial statements are presented in accordance with the Danish Financial Business Act and additional Danish disclosure requirements for issuers of listed bonds.
In our opinion, the financial statements give a true and fair view of the company’s financial position as at 31 December 2020 and of the results of its operations for the financial year 1 January 2020 to 31 December 2020 in accordance with the Danish Financial Business Act and additional Danish disclo-sure requirements for issuers of listed bonds.
Our opinion is consistent with our long-form audit report submitted to the Audit Committee and the Board of Directors.
Basis for opinionWe conducted our audit in accordance with International Standards on Auditing (ISAs) and additional requirements applicable in Denmark. Our responsibilities under those stand-ards and requirements are further described in the ‘Auditor’s responsibilities for the audit of the financial statements’ sec-tion of this auditor’s report. We are independent of the com-pany in accordance with the International Ethics Standards Board of Accountants’ Code of Ethics for Professional Accountants (IESBA Code) and the additional requirements applicable in Denmark, and we have fulfilled our other ethical responsibilities in accordance with these requirements. We be-lieve that the audit evidence we have obtained is sufficient and appropriate to provide a basis for our opinion.
To the best of our knowledge and belief, we have not provided any prohibited non-audit services as referred to in Article 5 (1) of Regulation (EU) no. 537/2014.
We were appointed auditors of Danish Ship Finance A/S (Danmarks Skibskredit A/S) for the first time on 25 April 2005 for the financial year 2005. We have been reappointed annually by decision of the general meeting for a total contiguous engagement period of 15 years up to and including the financial year 2019. As we were auditors of Danmarks Skibskreditfond before 2005, our last year as auditors will be 2020.
Key audit mattersKey audit matters are those matters that, in our professional judgement, were of most significance in our audit of the financial statements for the financial year 1 January 2020 to 31 December 2020. These matters were addressed in the context of our audit of the financial statements as a whole, and in forming our opinion thereon, and we do not provide a separate opinion on these mat-ters.
INDEPENDENT AUDITOR'S REPORT
TO THE SHAREHOLDERS OF DANISH SHIP FINANCE A/S (DANMARKS SKIBSKREDIT A/S)
STATEMENTS • INDEPENDENT AUDITOR'S REPORT
91 Annual Report 2020

Loan impairment charges
Loans amounted to DKK 31,950 million as at 31 December 2020 (DKK 39,082 million as at 31 December 2019), and loan impairment charges for the period amounted to an expense of DKK 100 million in 2020 (DKK 2 million income in 2019) in the financial statements.
We consider the measurement of impairment charges a key audit matter as the determination of expected losses is based on management judgement and subject to significant uncertainty. Due to the significance of such management judgement and the loan volumes of the company, auditing impairment charges for loans is a key audit matter.
The principles for determining expected credit losses are described in the Summary of significant accounting policies and in note 16 and Management has described the management of credit risks and the review for impairment in more detail in notes 16 and 17 to the financial statements.
In 2020, recognising the effects of Covid-19 has required particular focus and the areas of loans involving the highest level of management judgement, thus requiring greater audit attention, are:
• Identification of credit-impaired exposures
• Parameters and management judgements in the calculation model used to determine Stage 1 and Stage 2 expected losses
• Valuation of collateral and future cash flows, including management judgement involved in determining Stage 3 expected losses.
How the matter was addressed in our audit
Based on our risk assessment, our audit comprised a review of relevant central and decentral business procedures, test of controls and analysis of the amount of impairment charges.
Our audit procedures included testing relevant controls regarding:
• Continuous assessment of the credit risk
• Assessment and validation of input and assumptions applied in calculating stage 1 and stage 2 impairment charges
• Determining management judgements in the model and stage 3.
Furthermore, our audit procedures included:
• Performing a risk-based audit of loans to ensure timely identification of credit- impaired loans
• Challenging the procedures and meth-odologies applied for the areas involving the highest level of management judge-ment by using our industry knowledge and experience
• Challenging the parameters and signifi-cant assumptions applied in the calcula- tion models and reviewing the staging methodology and the data used
• Challenging management judgements in the calculation model used with special focus on management consistency and bias, including documentation of the ad-equacy of management judgements
• Performing a risk-based audit of credit- impaired loans to test for approprate determination of assumptions for impair- ment charges, including valuation of collateral and definition of scenarios.
STATEMENTS • INDEPENDENT AUDITOR'S REPORT
92 Annual Report 2020

Statement on the Management Report
Management is responsible for the Management’s Report.
Our opinion on the financial statements does not cover the Management’s Report, and we do not express any form of assurance conclusion thereon.
In connection with our audit of the financial statements, our responsibility is to read the Management’s Report and, in doing so, consider whether the Management’s Report is materially inconsistent with the financial statements or our knowledge obtained in the audit or otherwise appears to be materially misstated.
Moreover, it is our responsibility to consider whether the Management’s Report provides the information required under the Danish Financial Business Act and additional Danish disclosure requirements for issuers of listed bonds.
Based on the work we have performed, we conclude that the Management’s Report is in accordance with the financial statements and has been prepared in accordance with the requirements of the Danish Financial Business Act and additional Danish disclosure requirements for issuers of listed bonds. We did not identify any material misstatements in the Management’s Report.
Management’s responsibilities for the financial statements
Management is responsible for the preparation of financial statements that give a true and fair view in accordance with the Danish Financial Business Act and additional Danish dis-closure requirements for issuers of listed bonds, and for such internal control as Management determines is necessary to enable the preparation of financial statements that are free from material misstatement, whether due to fraud or error.
In preparing the financial statements, Management is respon-sible for assessing the company’s ability to continue as a going concern, for disclosing, as applicable, matters related to going concern, and for using the going concern basis of accounting in the preparation of the financial statements unless Manage-ment either intends to liquidate the company or to cease oper-ations, or has no realistic alternative but to do so.
Auditor’s responsibilities for the audit of the financial statements
Our objectives are to obtain reasonable assurance about whether the financial statements as a whole are free from material misstatement, whether due to fraud or error, and to issue an auditor’s report that includes our opinion. Reasonable assurance is a high level of assurance, but is not a guarantee that an audit conducted in accordance with ISAs and addi-tional requirements applicable in Denmark will always detect a material misstatement when it exists. Misstatements can arise from fraud or error and are considered material if, indi-vidually or in the aggregate, they could reasonably be expect-ed to influence the economic decisions of users taken on the basis of these financial statements.
As part of an audit in accordance with ISAs and additional requirements applicable in Denmark, we exercise professional judgement and maintain professional scepticism throughout the audit. We also:
• Identify and assess the risks of material misstatement of the financial statements, whether due to fraud or error, design and perform audit procedures responsive to those risks, and obtain audit evidence that is sufficient and appropriate to provide a basis for our opinion. The risk of not detecting a material misstatement resulting from fraud is higher than for one resulting from error, as fraud may involve collusion, forgery, intentional omissions, mis-representations, or the override of internal control.
• Obtain an understanding of internal control relevant to the audit in order to design audit procedures that are appropriate in the circumstances, but not for the purpose of expressing an opinion on the effectiveness of the compa-ny’s internal control.
STATEMENTS • INDEPENDENT AUDITOR'S REPORT
93 Annual Report 2020
• Evaluate the appropriateness of accounting policies used and the reasonableness of accounting estimates and related disclosures made by Management.
• Conclude on the appropriateness of Management’s use of the going concern basis of accounting in preparing the financial statements and, based on the audit evidence obtained, whether a material uncertainty exists related to events and conditions that may cast significant doubt on the company’s ability to continue as a going concern. If we conclude that a material uncertainty exists, we are required to draw attention in our auditor’s report to the related disclosures in the financial statements or, if such disclosures are inadequate, to modify our opinion. Our conclusions are based on the audit evidence obtained up to the date of our auditor’s report. However, future events or conditions may cause the company to cease to continue as a going concern.
• Evaluate the overall presentation, structure and contents of the financial statements, including the disclosures in the notes, and whether the financial statements represent the underlying transactions and events in a manner that gives a true and fair view.
We communicate with those charged with governance regard-ing, among other matters, the planned scope and timing of the audit and significant audit findings, including any signifi-cant deficiencies in internal control that we identify during our audit.
We also provide those charged with governance with a state-ment that we have complied with relevant ethical require-ments regarding independence, and to communicate with them all relationships and other matters that may reasonably be thought to bear on our independence, and, where applica-ble, related safeguards.
From the matters communicated with those charged with governance, we determine those matters that were of most significance in the audit of the financial statements of the current period and are therefore the key audit matters. We describe these matters in our auditor’s report unless law or regulation precludes public disclosure about the matter or when, in extremely rare circumstances, we determine that a matter should not be communicated in our report because the adverse consequences of doing so would reasonably be expected to outweigh the public interest benefits of such communication.
Copenhagen, 26 February 2021
Deloitte
Statsautoriseret Revisionspartnerselskab
Business Registration No 33 96 35 56
Kasper Bruhn Udam Bjørn Würtz Rosendal
State-Authorised State-Authorised
Public Accountant Public Accountant
Identification No 29421 Identification No 40039
STATEMENTS • INDEPENDENT AUDITOR'S REPORT
94 Annual Report 2020

Directorships and executive positions – Board of Directors
This section lists positions, other directorships, executive positions and fiduciary positions held by board members at the date of publication of the Annual Report 2020. The length of tenure the board members have served and their special competencies are also shown.
Board members elected by the general meeting are elected for a term of one year and board members elected by the employees are elected for a term of four years.
Eivind Kolding, Chairman
Chairman of the Remuneration Committee
Born on 16 November 1959
Nationality: Danish
Considered to be an independent board member
Joined the Board of Directors on 15 November 2016
Nominated by Danish Ship Finance Holding A/S
Directorships and executive positions:
Chairman of NTG Nordic Transport Group A/S
Chairman of CASA A/S (and one group company)
Vice Chairman of Leo Fondet (and one group company)
Member of the Board of Directors:
BiQ ApS
NNIT A/S
Altor Fund Manager AB
Competencies:
Broad knowledge of shipping and the maritime industry, macroeconomics, banking, credit, insurance and finance, financial risk management, regulation and general management of international business.
Peter Nyegaard, CFO and Partner, Axcel
Vice Chairman
Member of the Audit Committee
Born on 16 May 1963
Nationality: Danish
Considered to be an independent board member
Joined the Board of Directors on 15 November 2016
Nominated by Axcel
Directorships and executive positions:
Chairman of FIH
Member of the Board of Directors of Øens Murerfirma A/S
Chairman/member of a number of boards in the Axcel Group
Competencies:
Broad knowledge of general management of international companies, financial risk management, financial regulation, capital markets, credit, financing and macroeconomics.
MANAGEMENT AND DIRECTORSHIPS ETC.
MANAGEMENT AND DIRECTORSHIPS ETC.
95 Annual Report 2020
Christian Frigast, Partner, Axcel
Member of the Remuneration Committee
Born on 23 November 1951
Nationality: Danish
Considered to be an independent board member
Joined the Board of Directors on 15 November 2016
Nominated by Axcel
Directorships and executive positions:
Competencies:
Broad knowledge of banking, finance, financial risk management and management of international companies, M&A, restructu-ring, operational efficiency and value proposition strategies.
Anders Damgaard, Group CFO, PFA Pension
Chairman of the Audit Committee
Born on 8 August 1970
Nationality: Danish
Considered to be an independent board member
Joined the Board of Directors on 15 November 2016
Nominated by PFA
Directorships and executive positions:
Competencies:
Broad knowledge of financial business (including banking), credit, investment, finance, regulation and financial risk management.
Thor Jørgen Guttormsen
Member of the Remuneration Committee
Born on 5 January 1949
Nationality: Norwegian
Considered to be an independent board member
Joined the Board of Directors on 16 June 2017
Nominated by Danish Ship Finance Holding A/S
Directorships and executive positions:
Member of the Board of Directors:
Høegh Autoliners
Høegh LNG AS
Høegh LNG Holdings Ltd (alternate)
Telenor Maritime AS
Aequitas Ltd
Competencies:
Broad knowledge of shipping and the maritime industry, investment, finance, restructuring of operations and general management.
Member of the Board of Directors:
Blue Equity Management A/S
Danish Ship Finance Holding A/S
PFA Asset Management A/S
PFA Bank A/S
PFA DK Boliger Høj A/S
PFA DK Boliger Lav A/S
PFA Ejendomme Høj A/S
PFA Ejendomme Lav A/S
PFA Europe Real Estate High A/S
PFA Europe Real Estate Low A/S
PFA Europe Real Estate Medium A/S
PFA Kapitalforening
PFA Kollegier ApS
PFA Sommerhuse ApS
PFA US Real Estate Medium P/S
PFA Nordic Real Estate Low P/S
Chairman of the Board of Directors:
Axcel Management
Danish Ship Finance Holding A/S
EKF (Denmark’s export credit agency)
Aktive Ejere (Active Owners)
The Board Leadership Society in Denmark
Vice Chairman of the Board of Directors:
Pandora
PostNord
Axcelfuture, Axcel’s think tank
Axcel Advisory Board
Member of the Board of Direc-tors:
Nissens A/S
Associate professor at CBS (Copenhagen Business School)
MANAGEMENT AND DIRECTORSHIPS ETC.
96 Annual Report 2020

Michael N. Pedersen, Management Executive, PKA A/S
Member of the Audit Committee
Born on 8 July 1961
Nationality: Danish
Considered to be an independent board member
Joined the Board of Directors on 15 November 2016
Nominated by PKA
Directorships and executive positions:
Competencies:
Broad knowledge of financial business (including pension fund operations), credit, investment, finance, regulation and financial risk management.
Jacob Meldgaard, CEO, Torm A/S
Member of the Remuneration Committee
Born on 24 June 1968
Nationality: Danish
Considered to be an independent board member
Joined the Board of Directors on 16 June 2017
Nominated by Danish Ship Finance Holding A/S
Directorships and executive positions:
Chairman of Danish Shipping (Danske Rederier)
Chairman of Grant Compass
Member of the Board of Directors:
Syfoglomad
TORM Plc (board member in five companies under TORM)
Competencies:
Broad knowledge of shipping and the maritime industry, general management, investment, finance and restructuring of operations.
MANAGEMENT AND DIRECTORSHIPS ETC.
Management Executive of:
Property companies owned by the three pension funds managed by PKA A/S
Ejendoms- selskabet Dronnin-gegården
OPP HoldCo ApS
A/S Kjøbenhavns Ejendomsselskab
Forstædernes Ejendoms- aktieselskab
Chairman/member of the Advisory Board and invest-ment committees of various foundations relating to private equity, infrastructu-re and micro finance due to PKA’s investment in such foundations.
Member of the Board of Directors:
Danish Ship Finance Holding A/S
Refshaleøen Holding A/S
Refshaleøens Ejendomsselskab A/S
Margretheholmen P/S
Komplementar- selskabet Margretheholm ApS
PKA Skejby Komplementar ApS
PKA Skejby P/S
Hotel Koldingfjord A/S
Fonden Dansk Sygeplejehistorisk Museum
Poppelstykket 12 A/S
P/S PKAE Ejendom
Komplementar- selskabet PKA
AE ApS
SAS Pilot & Navigators Pension Fund
Investeringssel- skabet af 24. februar 2015 A/S
Tuborg Havnevej I/S
PKA Ejendomme I I/S
PKA Ejendomme af 2013 I/S
PKA Projektselskab I/S
Brokvarteret P/S
P/S Tranders Høje
Investerings- selskabet af 4. juli 2018 ApS
Institutional Holding GP ApS
Institutional Holding P/S
PKA Ejendomme af 2012 I/S
IIP Denmark P/S
Komplementar- selskabet Vilvorde-vej 70 ApS
Ejendomsselskabet Vilvordevej 70 P/S
PKA Private Funds III GP ApS
Rugårdsvej Odense A/S
PKA Venture I GP ApS
Falckgården P/S
PKA AIP A/S
PKA Private Funds IV GP ApS
IIP Denmark GP ApS
DEAS Invest I A/S
DEAS Invest I Holding A/S
PS Gjellerup
97 Annual Report 2020

Ninna Møller Kristensen, Executive Assistant, Danish Ship Finance A/S
Employee representative
Born on 2 September 1987
Nationality: Danish
Joined the Board of Directors on 26 March 2020
Competencies:
Broad knowledge of the shipping markets as well as management and execution of strategic initiatives through her position as Executive Assistant with responsibility for the Project Office of Danish Ship Finance A/S.
Nanna Flint, Controller, Danish Ship Finance A/S
Employee representative
Born on 26 September 1980
Nationality: Danish
Joined the Board of Directors on 26 March 2020
Competencies:
Broad knowledge of finance, accounting and reporting as well as capital requirements and adequacy as Controller of Danish Ship Finance A/S.
Christopher Rex, Head of Research and Innovation, Danish Ship Finance A/S
Employee representative
Born on 28 January 1979
Nationality: Danish
Joined the Board of Directors on 29 March 2012
Competencies:
Broad knowledge of macroeconomics, financial risk management, international shipping, digitalisation and decarbonisation through his position as Head of Innovation & Research at Danish Ship Finance A/S.
Berit Koertz, Senior Relationship Manager, Danish Ship Finance A/S
Employee representative
Born on 25 June 1957
Nationality: Danish
Joined the Board of Directors on 26 March 2020
Competencies:
Broad knowledge of the international banking and shipping markets, credit and ship finance through her position as Senior Relationship Manager of Danish Ship Finance A/S. She has eight years of corporate board experience.
Henrik Sjøgreen, CEO, FIH A/S
Member of the Audit Committee
Born on 30 July 1964
Nationality: Danish
Considered to be an independent board member
Joined the Board of Directors on 15 November 2016
Nominated by Danish Ship Finance Holding A/S
Directorships and executive positions:
Chairman of the Board of Directors:
Simon Fougner Hartmanns Fond
CEO of FIH A/S
CEO FIH Holding A/S
Member of the Board of Directors:
Henrik Frode Obels Fond
Spar Nord Bank A/S
Other:
Advisor to the Executive Board in PFA Pensionsselskab
Competencies:
Broad knowledge of banking, credit, insurance and finance, financial risk management, debt markets and general management.
MANAGEMENT AND DIRECTORSHIPS ETC.
98 Annual Report 2020

ATTENDANCE AT MEETINGS 2020 (excluding electronic board meetings)
Attendance rate (%) Directors Committee Committee
Eivind Kolding 100 100
Peter Nyegaard 100 100
Anders Damgaard 100 100
Christian Frigast 71 50
Thor Jørgen Guttormsen 100 100
Michael N. Pedersen 86 0
Jacob Meldgaard 100 100
Henrik Sjøgreen 100 100
Christopher Rex 100
Ninna Møller Kristensen 100
Berit Koertz 100
Nanna Flint 100
Board of Audit Remuneration
EXECUTIVE BOARD
ERIK I. LASSEN, CEO Member of the Executive Board since 9 April 2008
Executive positions in other business enterprises:
CEO of Danish Ship Finance Holding A/S
MICHAEL FRISCH, CCO Member of the Executive Board since 9 April 2018
Executive positions in other business enterprises:
Member of the Executive Board of Danish Ship Finance Holding A/S
LARS JEBJERG, CFO/CRO Member of the Executive Board since 22 May 2018
Executive positions in other business enterprises:
Member of the Executive Board of Danish Ship Finance Holding A/S
MANAGEMENT AND DIRECTORSHIPS ETC.
99 Annual Report 2020

FINANCIAL CALENDAR FOR 2021
26 February
Publication of
Annual Report 2020
18 March
Annual general meeting of
Danish Ship Finance A/S
at our premises,
Sankt Annae Plads 3,
1250 Copenhagen K
25 August
Publication of the Interim Report 2021
FINANCIAL CALENDAR FOR 2020
100 Annual Report 2020

Art Direction & Design : Lisa Lang Graphic Design
DANISH SHIP FINANCE A/S (DANMARKS SKIBSKREDIT A/S)
Sankt Annæ Plads 3 / DK-1250 Copenhagen K
Tel. +45 33 33 93 33 / Fax +45 33 33 96 66 / CVR no. 27 49 26 49
[email protected] / www.shipfinance.dk