shipping market review 2nd half 2008 - ship · pdf fileshipping market review . 2nd half 2008....
TRANSCRIPT

SHIPPING MARKET REVIEW 2ND HALF 2008
DSF/09/25

Disclaimer
The persons named as the authors of this report hereby certify that: (i) all of the views expressed in the research report accurately reflect the personal views of the authors about the subjects; and (ii) no part of their compensation was, is, or will be, directly or indirectly, related to the specific recommendations or views expressed in the research report.
This report has been prepared by Danish Ship Finance A/S (Danmarks Skibskredit A/S). This report is provided to you for information purposes only. Whilst every effort has been taken to represent as reliable information as possible, DSF does not represent the information as accurate or complete, and it should not be relied upon as such. Any opinions expressed reflect DSF’s judgment at the time this report was prepared and are subject to change without notice. DSF will not be responsible for the consequences of reliance upon any opinion or statement contained in this report. This report is based on information obtained from sources which DSF believes to be reliable, but DSF does not represent or warrants its accuracy. The information in this report is not intended to predict actual results, which may differ substantially from those reflected. This report may not be reproduced, in whole or in part, without the prior written permission of DSF. To Non-Danish residents: The contents hereof are intended for the use of non private customers and may not be issued or passed on to any person and/or institution without the prior written consent of DSF. Additional information regarding this publication will be furnished upon request.
Market ResearchChristopher Rex, Chief [email protected]
Anette Dalsgaard Jakobsen, [email protected]
Brian Thorsen, [email protected]
Copenhagen, April 2009
Danish Ship Finance I Sankt Annæ Plads 3 I DK-1250 Copenhagen K I [email protected] I www.shipfinance.dk

TABLE OF CONTENT
EXECUTIVE SUMMARY, 1
OUR APPROACH TO SHIP VALUES, 3
SHIP BUILDING, 4
CRUDE TANKER, 11
CONTAINER, 20
DRY BULK, 31
GLOSSARY, 43

Executive Summary
This report reviews the central developments in shipping markets in the period from August 2008 to April 2009 for the main shipping segments and indicates possible future market directions.
World Demand Indicators In August 2008, when we last published our Shipping Market Review, macroeconomic decoupling and credit contraction were the predominating topics for the world economic outlook. Since then, it has become clear that there exists no such thing as a decoupled world economy. China, for example, cannot generate 9% GDP growth without its primary trading partners. Thus, an economic slowdown spreads like ripples in a pond. Ultimately economic growth comes down to consumption and savings. We identify five major channels impacting seaborne trade in 2009.
1. Consumer wealth destroyed by lower asset values The international financial crisis and the related decline in world demand have provoked a drop in values in most major asset classes. For global consumers, the drop in asset values (including stock and real estate prices) has caused significant wealth destruction. The impact of the financial crisis on the international financial system in general, and the banking system in particular, has been devastating. In the years of the bull market, many banks took advantage of regulatory arbitrage and structured finance (for example asset backed securities) de facto increasing the banks’ supply of credit. As the marked reversed, these instruments accelerated the banks’ problems and hence reduced the supply of credit. Therefore, the combination of structured finance, regulatory shortcomings and an old architectural framework brought the financial infrastructure to its knees and asset prices plummeted accordingly.
2. Supply of credit in the eye of the storm Sufficient supply of credit is a crucial component to economic growth. The financial crisis has de facto caused a lower supply of credit as most banks are in the process of lowering their leverage and have adopted a more careful lending policy. The
combination of lower consumers’ creditworthiness, lower asset prices and increased risk of unemployment furthermore contributed to lower world economic growth. Governments around the world responded by initiating extensive monetary stimuli packages intended to rebuild the financial infrastructure and hence facilitate economic growth. The most basic financial infrastructure now seems back in place, but banks’ appetite for risk and leverage still seems considerable reduced.
3. Several OECD countries in recession The effects on economic growth have been profound, driving several OECD countries into recession. It is too early to judge the potential effects of the stimuli packages. For many countries, however, the current stimuli programs are the most ambitious use of taxpayer’s money launched by any government in recent history. Let us hope, that they will succeed beyond saving the financial system and hence stimulate growth and private consumption.
4. A lower oil price supports economic growth Besides the extensive governmental stimuli packages, economic growth in several OECD countries is expected to be stimulated by second round effects generated from declining commodity prices in general and the low oil price in particular: A lower oil price impacts disposable income (i.e. potential consumer spending) almost like a wage increase or a tax cut. The primary difference is, that a consumption subsidy is at the expense of the oil exporting country not the domestic taxpayers (as is the case with the fiscal stimuli packages). That is to say, that a considerably redistribution of income from oil exporting to oil importing countries takes place when the oil price declines.
5. WTO: “World trade to decline 9% in 2009” Nevertheless, the current outlook for world trade is bleak. The WTO forecasts world trade to decline 9% in 2009. Tanker and Container demand are expected to be impacted first and foremost as these segments are directly exposed to OECD consumption. Dry Bulk might find a provisional refuge if Chinese fiscal stimuli take off. In case of global recession, however, no stimuli packages can bail out seaborne trade in the long run.
Danish Ship Finance 1

Generally speaking, we see a trend towards overcapacity as global demand wanes and the capacity of the merchant fleet continues to increase. We therefore expect vessel earnings to continue the decline and ship prices to follow suit. Ship Building: Oversupply of tonnage is lowering asset values and earnings. As income from operations deteriorated short-term return on equity nosedived. Secondhand values across most segments experienced major falls accordingly. Owners’ return on equity is under pressure, why limited contracting activity is observed. To restore balance between replacement costs and asset prices, current newbuilding prices will have to decline on average 20%. Combined with significant order cancellations, newbuilding prices are under severe pressure and are expected to decline further in the coming years. Nevertheless, we do not expect contracting activity to increase in 2009 and 2010 because of overcapacity.
Crude Tanker: Turmoil on the international financial markets and lower economic growth took a firm grip on OECD oil consumption whereas non-OECD oil demand – so far – has been strong. Consequently, on a ton-miles basis, tanker demand remained strong. The high freight rates were therefore sustained in 2008. Shipowners’ appetite for new tonnage was, in the first three quarters of 2008, not impacted by high asset prices and a low short-term return on equity. However, the contracting activity dried out in the fourth quarter of 2008 when shipowners suddenly acknowledged the negative consequences of the financial crisis on global oil demand. Accordingly, secondhand prices have declined 43% whereas the newbuilding prices have fallen 23% from September 2008 to February 2009. OECD oil consumption is expected to decline 3.4% in 2009, whereas global oil consumption is expected to decline 1.5%. The tanker fleet is expected to increase by 11% in 2009 disregarding potential single-hull phase-out, scrapping and/or cancellations. Therefore, the outlook for earnings and asset values is bleak.
Container: In 2008, global Container demand waned at the same time as Container deliveries reached unprecedented levels. The container fleet grew 13% whereas demand crawled 2% in 2008. Owners were fighting overcapacity with all weapons available – scrapping, layup, service closures and cascading. Timecharter rates were approaching critical low levels accordingly. Overcapacity and declining income lowered owners’ appetite for new tonnage and sent short-term return on equity and thus asset prices southwards. The container outlook for 2009 is gloomy, with continuing waning consumer demand and a large inflow of new container tonnage. Asset values and freight rates are expected to decline accordingly. To layup vessels seems the only way to handle the extensive overcapacity. Accordingly, we expect freight rates and asset values to decline further in 2009.
Dry Bulk: Dry Bulk demand growth reached 9% on a ton-miles basis in 2008. With a supply growth of 7%, the supply-demand balance was well in favour of high freight rates. However, as the second half of 2008 unfolded, it became evident, that massive changes were about to hit harder and quicker than anticipated. The slowdown in the global economy substantially reduced the demand for Dry Bulk tonnage. By fourth quarter 2008, the golden days for Dry Bulk shipowners seemed over. Freight rates tumbled and asset values followed. Short term return-on-equity momentarily dipped into the red. The future seems bleak with lower global Dry Bulk demand in general, lower Chinese Dry Bulk demand in particular and a huge orderbook. Without significant cancellations, absorption of the orderbook in 2009 and 2010 seems unlikely. ■
Danish Ship Finance 2

OUR APPROACH TO SHIP VALUES
PRICES ARE TRADITIONALLY ESTABLISHED BETWEEEN A WILLING BUYER AND A WILLING SELLER. IN A DISTRESSED MARKET THIS MECHANISM FAILS. ASSET PRICE MOVEMENTS ARE, TO A GREAT EXTENT, DRIVING THE CONTRACTING AND SCRAPPING ACTIVITY. THEREFORE, TO EXPLAIN SUPPLY ADJUSTMENTS, IN A DISTRESSED MARKET, WE INTRODUCE A SYNTHETIC VESSEL PRICE - THE REPLACEMENT COST APPROACH TO SECONDHAND VALUES.
The international financial crisis and the related decline in world demand have provoked a drop in values in most major asset classes. Ship prices are no exception. Asset price volatility is not a new phenomenon in shipping, but it is the first time in history that asset values bottom in tandem with the major financial markets.
The international financial crisis has in effect turned off the supply of credit. The combination of lower global demand and insufficient supply of credit has reduced the sale and purchase of secondhand tonnage to a trickle.
In a normal market, asset prices are defined by a willing buyer and a willing seller. In auction theory, such a price mechanism is called the market’s reservation price. The reservation price is therefore the point that combines the maximum price a buyer is willing to pay for a vessel and the minimum price at which a seller is willing to sell. In a distressed market, the spread between a willing buyer’s reservation price and the price at which the seller is willing to sell the vessel at becomes so wide that this pricing mechanism breaks down and an equilibrium price cannot be established.
Contracting and scrapping activity (i.e. supply adjustments) are to a great extent defined by short-term movements in earnings and asset prices. Therefore, to explain supply adjustments, in a distressed market, we introduce a synthetic vessel price - the replacement cost approach to secondhand values.
The replacement cost approach to asset values The major difference between the replacement cost approach to secondhand values and the traditional “willing buyer/willing seller”
approach, is the method determining the long-term earning requirement (i.e. the terminal value).
In a normal market, the long-term earning requirement is determined without much drama: the buyer’s reservation price reflects the earnings expectation. In a distressed market, however, this mechanism breaks down. In contrast, the replacement cost approach uses newbuilding prices as an approximation for ship owners’ expectations for future earnings.
This method assumes that owners only contract a new vessel if they expect the net present value to be at least zero. In reality, this approach requires some contracting activity to ensure that newbuilding prices reflect owners’ reservation prices.
To assess the theoretical value of secondhand tonnage, the newbuilding price is translated into a daily earnings requirement using an ordinary annuity formula for the assets’ lifespan, generally, 25 years. This daily earning requirement is used as input to calculate the terminal value for secondhand tonnage. The estimated secondhand price is calculated as the net present value of the timecharter contract (after OPEX) plus the estimated terminal value. We base our calculations on 70% debt financing, 300bp in debt margin and a required return on equity of 15%.
Short-term return on equity (ROE) An important parameter measuring the dynamics for short-term movements in asset prices, and thus contracting activity is the short-term return on equity (ROE).
The short-term ROE is calculated as the accumulated earnings generated from the three-year timecharter contract after OPEX, debt amortizations and the cost of equity. If accumulated earnings are unable to yield, for example, a 15% ROE, or are negative, the secondhand price is expected to decline to balance timecharter income and owner’s reservation price. Obviously, contracting activity and asset prices are expected to increase in higher ROE and vice versa. ■
Danish Ship Finance 3

Ship Building
OVERSUPPLY OF TONNAGE IS LOWERING ASSET VALUES AND EARNINGS. OWNERS’ RETURN ON EQUITY IS UNDER PRESSURE WHY LIMITED CONTRACTING ACTIVITY IS OBSERVED. WE ESTIMATE THAT CURRENT NEWBUILDING PRICES WILL HAVE TO DECLINE 20% TO RESTORE BALANCE BETWEEN REPLACEMENT COSTS AND ASSET PRICES. COMBINED WITH SIGNIFICANT ORDER CANCELLATIONS, NEWBUILDING PRICES ARE UNDER PRESSURE AND ARE EXPECTED TO DECLINE FURTHER IN 2009 AND 2010. NEVERTHELESS, WE DO NOT EXPECT CONTRACTING ACTIVITY TO INCREASE IN 2009 AND 2010.
Figure SB.1
Newbuilding prices hit by waning demand
-
30
60
90
120
150
180
03-2
002
07-2
002
11-2
002
03-2
003
07-2
003
11-2
003
03-2
004
07-2
004
11-2
004
03-2
005
07-2
005
11-2
005
03-2
006
07-2
006
11-2
006
03-2
007
07-2
007
11-2
007
03-2
008
07-2
008
11-2
008
03-2
009
(,0
00
,00
0)
USD
-
30
60
90
120
150
180
(,0
00
,00
0)
US
D
Sources: Clarksons, Danish Ship Finance
Post-Panamax newbuilding
VLCC newbuilding
Capesize newbuilding prices
122
87
72
Figure SB.2
Still a significant drop down to 2002-levels - But is this the way newbuilding prices are heading?
65 62
35
128
98
73
152
106
93
126
91
72
-
40
80
120
160
VLCC Post-Panamax Capesize
(00
0,0
00
) U
SD
-
40
80
120
160
(00
0,0
00
) U
SD
2002-average 5-year-average
2008 average 2009 averageSources: Claksons, Danish Ship Finance
CONTRACTING PRICES
THE TIME OF RECORD-HIGH NEWBUILDING PRICES IS OVER. FOLLOWING THE TREND OF MOST OTHER MAJOR ASSET CLASSES, SHIP VALUES DECLINED THROUGHOUT THE SECOND HALF OF 2008 AND INTO THE FIRST MONTHS OF 2009.
Dry Bulk newbuilding prices declined 26% The average Capesize newbuilding price has declined 26% from August 2008 to February 2009. The current newbuilding price of USD 72 million is fairly in line with the average of the last five years. Measured against historical lows, the current newbuilding prices are still approximately USD 37 million above the low of 2002 (Fig. 1 & 2).
Tanker newbuilding prices have depreciated 25% The average VLCC newbuilding price has declined 25% from August 2008 to February 2009. The current newbuilding price of USD 122 million is slightly below the five-year average of USD 128 million. Measured against historical lows, current newbuilding prices are USD 60 million above the low of 2002 (Fig. 1 & 2).
Container newbuilding prices dropped only 20% The average newbuilding price of a 6,200 teu Post-Panamax Container vessel has dropped 19% from August 2008 to February 2009. The current newbuilding price of USD 87 million is USD 11 million below the five-year average. The distance to the 2002-low is approximately USD 25 million (Fig. 1 & 2).
Danish Ship Finance 4

Figure SB.3
The last six months contracting activity clearly reflects a strong degree of pessimism
-
50
100
150
200
250
300
1997
1998
1999
2000
2001
2002
2003
2004
2005
2006
2007
2008
2009
Con
tra
ctin
g (
,00
0,0
00
) D
wt
-
0,5
1,0
1,5
2,0
2,5
3,0
3,5
Ye
ars
fro
m C
on
tract
ing
to
de
live
ry
Container Dry Bulk
Other TankerSource: Clarkson, Danish Ship Finance
Average delivery time >>
Figure SB.4
Downward pressure on delivery time in all segments due to low contracting activity
1
1,5
2
2,5
3
3,5
401
-01-
1997
01-0
1-19
9801
-01-
1999
01-0
1-20
0001
-01-
2001
01-0
1-20
0201
-01-
2003
01-0
1-20
0401
-01-
2005
01-0
1-20
0601
-01-
2007
01-0
1-20
0801
-01-
2009
Years
fro
m c
on
tract
ing
date
to
deli
very
date
1
1,5
2
2,5
3
3,5
4
Ye
ars
fro
m c
on
tract
ing
date
to
d
elive
ry d
ate
Container Ship Dry Bulk Tanker TotalSource: Clarksons, Danish Ship Finance
IN THE AUTUMN OF 2008, THE SHIPPING INDUSTRY IN GENERAL EXPERIENCED A DRAMATIC SHIFT IN MARKET SENTIMENTS, FROM EUPHORIA TO DESPAIR. ACCORDINGLY, THE LAST FIVE YEARS’ SUPERFICIALLY HIGH CONTRACTING ACTIVITY CAME TO AN ABRUPT HALT. CONTRACTING ACTIVITY IN THE FIRST THREE MONTHS OF 2009 BOTTOMED AT 0.8 MILLION DWT, REFLECTING THE CHANGED MARKET SENTIMENTS.
Annual contracting volumes should be evaluated against expected annual fleet replacement rather than previous years’ contracting activity.
The main topic of our previous Shipping Market Review, published August 2008, was the imminent risk of a supply surplus. We therefore predicted a moderate contracting activity and declining ship values. Contracting activity did slow down, but clearly, we did not foresee the brutality with which the world demand came to a halt.
The severity of the credit crunch became clear in September 2008 when Lehman Brothers filed for bankruptcy. The financial turmoil spread into most asset classes, facilitating global wealth destruction and hence lower consumer demand. The impact on shipowners’ appetite for new tonnage was instantaneous: Almost no new contracts were reported in the fourth quarter of 2008. Still, the total annual tonnage contracted in 2008 amounted to 150 Mdwt (Fig. 3).
Dry Bulk shipowners’ appetite for new tonnage, once again, seemed to be driven by high expectations for short-term return on equity rather than expected future tonnage demand. During the first nine months of 2008, they contracted approximately 80 Mdwt of the 150 Mdwt. For Tanker owners, the long-term asset play (i.e. IMO phase-out) seemed to drive the desire for new tonnage. Tanker owners signed up for 46 Mdwt of new orders, bringing the 2008 contracting activity just below the record-high 2006. On the contrary, Container owners at last seemed to have lost their appetite for new tonnage due to oversupply of tonnage, declining freight rates and low return on equity burden their operations. A modest 11.2 Mdwt was contracted in the Container segment in 2008 (Fig 3).
CONTRACTING ACTIVITY
150 dwt contracted in 2008
Danish Ship Finance 5

In that perspective, 2008 contracting volumes were large. It is true, that the 2007 volumes were even larger, but that only emphasizes the seriousness of the current situation. The orderbook is large and seems almost impossible to absorb with a traditional scrapping scheme and the current demand outlook.
Shipowners seem to fear a significant supply surplus In the last months of 2008 and the first months of 2009, it became clear, that the impact of the credit crunch on the world economy was much more critical, than shipowners (and analysts) anticipated just a few months earlier. Combined with a sudden tightening of finance, rumours about significant cancellation took off, generating great uncertainty about whether the recorded orderbook will be delivered. It is therefore not surprising that contracting activity during the first quarter of 2009 was the lowest observed in living memory. In total, 0.8 million dwt was contracted.
ASSET VALUES AND RETURN ON EQUITY
THE FINANCIAL CRISIS CAUSED WORLD DEMAND FOR SEABORNE TRADE TO DECLINE AND FREIGHT RATES TO PLUMMET. AS INCOME FROM OPERATIONS DETERIORATED SHORT-TERM RETURN ON EQUITY NOSEDIVED. SECONDHAND VALUES ACROSS MOST SEGMENTS EXPERIENCED MAJOR FALLS ACCORDINGLY.
Return on equity explained atypical high contracting activity As discussed above, future tonnage demand appeared to have been a minor issue, when determining shipowners’ appetite for contracting activity. Short-term movements in owners’ return on equity were an essential factor explaining contracting activity trends.
Therefore, we take a closer look at current prices by 1) estimating the short-term return on equity generated from accumulated earnings, and 2) calculating the implicit replacement cost (i.e. residual required earnings after the expiry of a three-year timecharter contract). See “Our Approach to Ship Values” for an introduction to these concepts. On the margin, choosing which
vessel to purchase is a question of break-even rates (daily required earnings). Accordingly, we convert asset prices into daily earnings requirement in order to evaluate them independently of age. A prerequisite for the replacement cost approach to work properly is that current newbuilding prices reflect the prices owners are willing to pay (owners’ reservation price). If there is no contracting activity because prices quoted by yards are too high for owners reservation price, the replacement cost approach is, at best, less accurate.
Declining trend in short-term return on equity The dramatic drop in timecharter rates from September 2008 to February 2009 has depressed short-term return on equity significantly, and has brought an end to the contracting activity. The impact on secondhand prices has been great. Below all calculations are based on five-year-old vessels.
Newbuilding prices to drop 20% When comparing the daily earnings requirement for the current secondhand price with the alternative replacement cost (i.e. newbuilding price), it seems inevitable, that newbuilding prices will have to decline. We estimate that newbuilding prices will have to drop, on average, 20% across segments to restore the balance between current prices and replacement cost. Whether such a drop will cause a surge in contracting activity is a different story.
Return on equity below 15% for Crude Tankers The three-year timecharter rate for VLCC tankers dropped 35% from September 2008 to February 2009, sending the short-term return on equity further below 15%. As the five-year-old secondhand prices declined greatly in the first two months of 2009, the return on equity improved slightly, but it is still significantly below 15% (fig. 5). Despite the low short-term return on equity, Tanker owners continued to contract heavily throughout the first nine months of 2008. This might indicate, that Tanker owners expect vessel values to improve significantly after the IMO phase-out in 2010. For VLCC owners to generate a short-term return on equity of 15% at current timecharter rates, the secondhand price will have to decline 11% from the current level
Danish Ship Finance 6

of USD 93.5 million. In order to bring back the balance between the replacement cost and the secondhand price, such a drop in the secondhand price would require that the newbuilding price drops 20% from the current level of USD 122 million,
Figure SB.5
Declining timecharter rates and high five-year-old VLCC secondhand prices drove return on equity sub-15 %
6%
6%
6% 6
% 7%
10
% 12
%
12
%
12
%
9%
6%
6%
7%
11%
0%
5%
10%
15%
01-2
008
02-2
008
03-2
008
04-2
008
05-2
008
06-2
008
07-2
008
08-2
008
09-2
008
10-2
008
11-2
008
12-2
008
01-2
009
02-2
009
Re
turn
on
eq
uit
y
0%
5%
10%
15%
Retu
rn o
n e
qu
ity
Sources: Clarkson, Danish Ship Finance
Figure SB.6
High prices for five-year-old Capesize vessels temporarily drove return on equity below zero during
three-year timecharter period.
38
% 47
%
43%
44
%
43
%
44
% 49%
43
%
31
%
0%
14
%
16
%
Capesize return on equity temporarily below 15% The three-year timecharter rate for a Capesize vessel dropped 65% from September 2008 to February 2009 and sent the short-term return on equity momentarily into the red. As timecharter rates regained a bit of strength in the first months of 2009, the return on equity crawled above zero and ended at 16% in February 2009 (Fig. 6). The recent years’ historically high short-term return on equity seemed to have been the primary driver behind recent years’ contracting mania. The latest drop in five-year old Capesize prices has brought the long-term earnings requirement closer to historical earnings. Nevertheless, the estimated replacement cost is still above the current secondhand price. For the replacement cost to balance the current market price of USD 49 million, the newbuilding price will have to decline 20% from its current level of USD 72 million.
Negative short-term return on equity for Handy Containers Larger Container vessels are traditionally acquired by liner companies, or alternatively hired out to liner companies on long charter contracts. Therefore, for larger container vessels, it might not be just as transparent to see the link between short-term return on equity and contracting activity. Consequently, we use a 1,000 teu Handy Container to illustrate the relationship between asset values, return on equity and contracting activity.
As illustrated by Figure 7, the collapse in timecharter rates, from September 2008 to February 2009, sent short-term return on equity below zero for a five-year-old 1,000 teu Handy container. As timecharter rates approached OPEX-levels, it was almost impossible for owners to meet any debt payments. It is not possible to operate at such income levels for long.
-1%
-1%
-30%
-15%
0%
15%
30%
45%
60%
01-2
008
02-2
008
03-2
008
04-2
008
05-2
008
06-2
008
07-2
008
08-2
008
09-2
008
10-2
008
11-2
008
12-2
008
01-2
009
02-2
009
03-2
009
04-2
009
Retu
rn o
n e
qu
ity
-30%
-15%
0%
15%
30%
45%
60%
Re
turn
on
eq
uit
y
Sources: Clarkson, Danish Ship Finance
We do not comprehend current Handy Container price levels. At current timecharter earnings and a newbuilding price of USD 19 million, we argue that the timecharter rate has to increase 89% from the current USD 4,300 per day.
Danish Ship Finance 7

Figure SB.7
The collapse in timecharter rates sent short term return on equity below zero for 5-year-old Handy Container
vessels
16
%
15
%
14%
12
%
11
%
11
%
10
%
9%
9%
8%
7%
4%
-10
%
-24
%
-21%
-19%-1
1%
-40%
-20%
0%
20%
40%
10-2
007
11-2
007
12-2
007
01-2
008
02-2
008
03-2
008
04-2
008
05-2
008
06-2
008
07-2
008
08-2
008
09-2
008
10-2
008
11-2
008
12-2
008
01-2
009
02-2
009
Av
era
ge r
etu
rn o
n e
quit
y
-40%
-20%
0%
20%
40%
Ave
rag
e r
etu
rn o
n e
quit
y
Sources: Clarksons, Danish Ship Finance
Figure SB.8
Yard deliveries to increase with 65% compared to 2008 -
greater risk of cancellations?
-
40
80
120
160
2004
2005
2006
2007
2008
2009
2010
2011
2012
(,0
00
,00
0)
dw
t0%
80%
160%
240%
320%
Uti
liza
tion
( 2
00
5=
10
0)
China P.R. South Korea JapanSources: Clarkson, Danish Ship Finance
Yard Utilization >>
THE DROP IN TIMECHARTER RATES AND SECONDHAND PRICES HAVE BROUGHT BACK THE TRADITIONAL PRICE RELATIONSHIP BETWEEN NEW AND OLD TONNAGE. FOR 2009 AND BEYOND, WE EXPECT BOTH NEWBUILDING AND SECONDHAND PRICES TO DECLINE FURTHER. NEWBUILDING PRICES ARE EXPECTED TO DECLINE THE MOST IN 2010, AS WE EXPECT SIGNIFICANT CANCELLATION TO BRING NEWBUILDING PRICES CLOSE TO CONSTRUCTION COSTS.
In the last six months, rumours about order cancellations have dominated the debate, indicating that the combination of inadequate access to finance and lower expectations for world demand lower ship owners’ appetite for new tonnage. At the moment, no one knows, the extent of the cancellations, but rumours indicate that many vessels are expected to be cancelled one way or another.
Above we argued, that newbuilding prices, on average, should drop 20% to bring back the balance between secondhand prices and replacement cost. Most likely, newbuilding prices will decline in the second half of 2009 and beyond. The question is, whether or not lower newbuilding prices will generate renewed contracting activity. We do not expect this to be the case, as we argued that owners fighting overcapacity will be the major issue for the next couple of years.
In many ways, present times are both the best and the worst for shipyards. On the one hand, berth covers are record-high, most orders
As a new vessel is expected to have a longer operating life than a secondhand vessel, the newbuilding price is generally expected to be higher than the secondhand price. In a bull market, however, the ability to take advantage of a high market tends to facilitate that secondhand prices exceed newbuilding prices. This is what we saw from 2004 to 2008. In recent months, we have returned to normality. Secondhand prices have dropped significantly, whereas newbuilding prices have been relatively sticky.
OUTLOOK
Low contracting activity despite lower newbuilding prices
Newbuilding prices again higher than secondhand prices
Shipyard capacity is likely to undershoot current figures
Extensive cancellations are expected
Danish Ship Finance 8

are contracted on high prices and input costs have finally begun to decline. On the other hand, rumours about extensive order cancellations bring uncertainty into the game.
Shipyards and shipowners have a mutual interest in each others’ survival. Accordingly, we expect order cancellations and shipyard capacity to be closely connected, at least for 2010-deliveries.
Yard output increases 65% in 2009 The aggregated orderbook is huge by any measure. Global yard output is expected to increase 65% in 2009 and 24% in 2010. Expressed differently, the current orderbook implies that the combined capacity of the three major shipbuilding nations will have to double over the next two years (Fig. 8).
More or less independent of the short-term macroeconomic outlook, such supply growth will require extensive scrapping activity for the existing fleet, if asset values and freight rates are not to plummet.
China - the largest (Dry Bulk) shipbuilding nation by 2009 As discussed in previous Shipping Market Reviews, the Chinese shipbuilding capacity, in particular, is set to explode in 2009 and 2010. China has delivered approximately 18 Mdwt in 2008 and is expected to deliver nearly 51 Mdwt in 2009 and 69 Mdwt in 2010.
Chinese shipyards are very much exposed to the Dry Bulk segment. In 2009, 70% of the Chinese shipyard capacity is expected to be employed in building Dry Bulk vessels. If these vessels are built, China will be the world’s largest shipbuilding nation and by far the largest Dry Bulk shipbuilder. Dry Bulk exposure is not solely a Chinese phenomenon. At the aggregated level, Dry Bulk orders account for approximately 80% of the 2009 annual increase in shipyard capacity.
Incomplete capacity will not build vessels in 2010 We expect, most vessels scheduled to enter service in 2009 to be at some stage of construction. Therefore, we do not expect to see major shipyard capacity adjustments for 2009. For 2010, the outlook is different. We expect to see, shipyard capacity extensions cancelled or at best be postponed, and construction of new capacity called off. Accordingly, we expect 2010 shipyard
capacity to be significant below current estimates, as shipowners are struggling to cancel 2010 deliveries.
Inadequate finance and lower demand are expected to push shipowners into extensive cancellations For shipyards, extensive cancellations are critical to the extent that they cannot be offset against shipbuilding capacity not yet constructed, but for shipowners it seems the only way out of the current situation in - combination with postponed delivery dates. Therefore, shipowners are struggling to limit their future liabilities. Shipbuilding contracts are binding for both the shipowner and the yard, and it requires complex negotiations to change the terms. In some cases a change can and will be negotiated and in other cases the contract will stand. However, the lack of finance will add a new dimension because many shipowners will struggle to obtain financing for ships already contracted. It will put pressure on some shipowners and the problem of the shipowner may eventually also become the problem for the shipyard, if the shipowner is unable to take delivery. The shipyards have traditionally taken the risk on the shipowner’s ability to perform under the contract.
Shipyard operation is beginning to turn into the red Besides dealing with order cancellations, shipyards’ operations are burdened by currency fluctuations, component cost volatility and – paradoxically – long delivery times. Some shipyards are already reporting losses. Accelerated by the financial crisis, the low(er) profitability troubles shipyards’ access to refundment guarantees.
A quality premium to newbuilding prices A market in distress conceals the true capability of market participants. Therefore, as competition increases and the positive market sentiment dries out, we expect to see the introduction of a quality premium to newbuilding prices. We expect, Greenfield shipyards to lower prices close to their construction costs in an attempt to survive. Unsurprisingly, Greenfield yards are expected to be a lot more exposed to lower berth cover, delivery delays and insufficient refundment guarantees than their more experienced competitors, so cancellations might become a greater and more pressing matter for them than for the established yards. Established shipyards, on the contrary, are expected to sustain
Danish Ship Finance 9

some pricing power as long as they deliver according to schedule. This may speak in favour of more Dry Bulk orders being cancelled.
Can there be too many cancellations? One might ask whether there may be cancelled too much. We do not believe so. Most of the major segments are already struggling to absorb the deliveries coming out of the yards today.
The coming years might be the time of the cash-rich shipowners Every crisis has it’s winners and losers. Cash-rich shipowners will be able to take advantage of the distressed market conditions, whereas shipowners short of finance might be forced to leave projects. Accordingly, we expect to see a renewed interest in resale of newbuilding contracts as some owners struggle to cancel their contract or to raise finance.
Low contracting activity in the coming years Contracting levels far above reasonable fleet replacement requirements are expected to be issues of the past. The current aggregated world fleet is large and in many segments young. It will take many years before these vessels have to be replaced. Therefore, we expect the contracting activity to return to the levels before the last five years’ boom period, and to be more or less consistent with the annual required fleet replacement. If so, shipyards will be forced to adjust to lower demand and berth cover in the years to come.
Conclusion Extensive cancellations are expected to lower newbuilding prices. Even if the majority of the 2010 deliveries is cancelled, we expect a significant oversupply of tonnage. Therefore, we do not expect lower newbuilding prices to cause a surge in contracting activity. Secondhand prices and freight rates are expected to decline accordingly, and yard capacity will have to adjust to the new levels. ■
Danish Ship Finance 10

Crude Tanker EVEN AS OIL DEMAND TREMBLED, FREIGHT RATES HAVE SHOWN GREAT STRENGTH IN 2008. THE APPETITE FOR NEW TONNAGE WAS NOT SPOILED BY HIGH ASSET PRICES AND LOW SHORT-TERM RETURN ON EQUITY THROUGHOUT MOST OF 2008. HOWEVER, THE CONTRACTING ACTIVITY DRIED OUT IN THE FOURTH QUARTER OF 2008. IT SEEMED AS IF SHIPOWNERS SUDDENLY ACKNOWLEDGED THE NEGATIVE CONSEQUENCES OF THE FINANCIAL CRISIS ON GLOBAL OIL DEMAND. THE OUTLOOK FOR EARNINGS AND ASSET VALUES IS BLEAK ACCORDINGLY.
Figure T1
Tanker earnings on the decline during the last 6 months of 2008
-
30,000
60,000
90,000
120,000
150,000
180,000
06-2
003
03-2
004
12-2
004
09-2
005
06-2
006
03-2
007
12-2
007
09-2
008
06-2
009
03-2
010
Ea
rnin
gs
USD
/day
-
30,000
60,000
90,000
120,000
150,000
180,000
Ea
rnin
gs
USD
/day
VLCC Suezmax Aframax Sources: Clarkson, Danish Ship Finance
Figure T2
Surprisingly strong off-season VLCC earnings in 2008 but low declining peak-season earnings
-
20,000
40,000
60,000
80,000
100,000
120,000
1997
1998
1999
2000
2001
2002
2003
2004
2005
2006
2007
2008
2009
Earn
ings U
DS/
Day
-
20,000
40,000
60,000
80,000
100,000
120,000
Earn
ings
UD
S/D
ay
<< Peak-season earnin
FREIGHT RATES
FROM ONE EXTREME TO ANOTHER: CRUDE TANKER EARNINGS ARE DECLINING. YET 2008 ENDED WITH ALMOST RECORD-HIGH EARNINGS.
In August 2008, when we last published our Shipping Market Review, tanker earnings were exceptionally strong. Off-season earnings had exceeded all previous levels. Quarterly off-season average VLCC earnings were flirting with the astonishing high levels of USD 110,000 per day (fig. 2). Obviously, we expected earnings to come down from their peak. Regarding the extent of the decline, we were more puzzled. Following the usual market trend, earnings were actually expected to peak in the fourth quarter. Still, with the world economy on the brink of a recession, we expected crude tanker earnings to come down in fourth quarter 2008.
And earnings did, in fact, fall. Closing fourth quarter 2008 significantly below third quarter, albeit with fourth quarter VLCC earnings nevertheless ending at USD 68,000 per day, which is well above 10-year average earnings and higher than we expected. In the aggregate, 2008 was a year with almost record-high average earnings for all three major segments (fig.1).
Source: Clarksons, Danish Ship Finance
gs Off-season earnings >>
During the first months of 2009, however, earnings continued to decline in all three segments. For Aframax owners in particular, earnings seemed to test the lows of previous downturn periods.
Danish Ship Finance 11

SUPPLY & DEMAND Figure T3
High Crude Tanker Delivery in 2008
-
5
10
15
20
25
2005 2006 2007 2008 2009
Milli
on D
WT
-
5
10
15
20
25
Millio
n D
WT
Sources: Clarkson, Danish Ship Finance VLCC AframaxSuezmax
Figure T4 Oil supply suddently seem to outpace demand
Despite significant quota cuts oil prices remain low
-6%
-4%
-2%
0%
2%
4%
6%
2006 2007 2008 2009 2010
Ye
ar-
on
-ye
ar
gro
wth
OPEC oil supply Non-OPEC oil supply OECD oil consumption Non-OECD oil consumption
Sources: EIA, Reuters EcoWin, Danish Ship Finance
TURMOIL ON THE INTERNATIONAL FINANCIAL MARKETS AND LOWER ECONOMIC GROWTH TOOK A FIRM GRIP ON OECD OIL CONSUMPTION AND THUS CRUDE TANKER DEMAND. NEVERTHELESS, TANKER DEMAND REMAINED STRONG ON A TON-MILES BASIS AS NON-OECD OIL DEMAND – SO FAR – HAS BEEN STRONG.
Strong non-OECD oil demand has facilitated absorption of high quarterly fleet additions at relatively high earning levels. By fourth quarter 2008, tanker demand was subject to the negative consequences of the financial crisis on OECD oil consumption. The combination of lower demand for crude tankers and large quarterly fleet growth put crude tanker earnings under pressure.
OECD oil consumption below trend and deteriorating The strong demand for crude tankers was generated by non-OECD oil consumption. As illustrated by figure 4, OECD oil consumption contracted approximately 3% during 2008. The decline was mainly driven by lower North American and Japanese consumption. European oil consumption remained fairly stable. On average, North American oil consumption decreased 5.8% whereas Japanese oil consumption decreased 3.2% in 2008. North American oil consumption has now declined six quarters in a row.
Non-OECD oil consumption remained in growth territory throughout 2008. At the aggregated level, non-OECD oil consumption grew 3.8%, mainly driven by firm growth in Chinese oil consumption of 5.4%.
OPEC responded by lower production Lower OECD oil consumption now seems to be more than just a short-termed phenomenon. OPEC has responded by lowering quota targets, with OPEC production expected to drop by as much as 10-15% (4.5 million barrels per day).
The futures market reacted immediately on OPEC’s quota cuts. Since October 2008, the forward oil price has exceeded the spot price. Late in fourth quarter 2008, OPEC decided to cut production quotas further, triggering an unprecedented escalation of the forward premium (fig. 5). Accordingly, inventory stockpiling emerged as a rational option. From
Danish Ship Finance 12

October to February 2009, North American crude oil stocks increased by more than 40 million barrels. Floating storage became equally popular throughout this period. IEA reported that between 25 and 40 VLCCs were used for this purpose.
Figure T5
The WTI forward premium highly in favor of crude oil stockpilling
-20%
-13%
-7%
0%
7%
13%
20%
01-1
984
01-1
986
01-1
988
01-1
990
01-1
992
01-1
994
01-1
996
01-1
998
01-2
000
01-2
002
01-2
004
01-2
006
01-2
008
01-2
010
WT
I Fo
rwa
rd P
rem
ium
0
0.1
0.2
0.3
0.4
0.5
0.6
0.7
0.8
0.9
1
Sources: Reuters EcoWin, Danish Ship Finance
Co
nta
ng
oB
ack
ward
ati
on
Figure T6 Increasing Oil Inventories during late '08 and early '09
Despite lower oil demand US Oil Inventories are being build up
250
270
290
310
330
350
370
08-2
005
12-2
005
04-2
006
08-2
006
12-2
006
04-2
007
08-2
007
12-2
007
04-2
008
08-2
008
12-2
008
04-2
009
Milli
on
Barr
els
(excl
. SP
R)
-20%
-13%
-6%
0%
7%
13%
20%
Oil I
nven
tori
es
(% y
oy)
<< US Oil Inventory (excl. SPR)
Year-on-Year Change >>
Sources: Reuters EcoWin, Danish Ship Finance
Paradoxically, while North America were increasing its oil inventories the remaining OECD, led by Europe, were reducing theirs. For us, it remains unanswered why this has occurred. One simple answer could be that US inventory levels are managed from a days-of-import-cover target. Current European inventory levels are high compared to the seasonal trend. To some degree, this could explain why lower oil consumption has been associated with lower inventory build-up, and hence that Europe has failed to take advantage of the positive forward premium. Against this argument, North American inventories, in total stock, are just aligning the seasonal trend whereas North American inventories measured in days-of-import cover are above the trend.
Lower ton-miles demand Lower oil consumption has driven fundamental crude tanker demand into negative territory. Albeit, some more or less short-term factors supported tanker earnings.
The strong non-OECD oil consumption has in particular supported VLCC earnings. The largest VLCC trading route, based on ton-miles, the Middle East to East- and Southeast Asia, sustained its 2007 strength and thus has been the main factor behind the strong VLCC earnings in 2008. Middle East oil to US inventory build up has been the second most important factor supporting VLCC earnings in 2008. VLCC tankers, however, lost territory to Suezmax tankers shipping out of West Africa. This impacted VLCC tanker demand to such an extent that VLCC ton-miles demand ended below 2007 levels.
For Suezmax tankers, though, the newly gained territory out of West Africa was the major factor supporting earnings in 2008. Suezmax tanker demand in the Mediterranean, bound for the Americas, increased more or less enough to offset the declining demand from lower North Sea production. Thus, Suezmax tanker demand remained stable on a ton-miles basis in 2008 compared to 2007-level.
Aframax tankers was the only crude tanker segment where ton-miles demand actually increased in 2008. In volume terms, demand for
Danish Ship Finance 13

Aframax tankers increased 2%, but measured in ton-miles, the effect was significantly leveraged to 6%. The major increase came out of the Mediterranean destined for North America.
Figure T7
44.5 million dwt contracted in 2008 but merely 0.5 million dwt contracted in 4Q2008
-
5
10
15
20
25
03-2
007
06-2
007
09-2
007
12-2
007
03-2
008
06-2
008
09-2
008
12-2
008
03-2
009
Mil
lio
n D
WT
-
5
10
15
20
25
Mil
lion
DW
T
VLCC AframaxSources: Clarksons, Danish Ship Finance Suezmax
Figure T8 The drop in five-year-old VLCC tanker prices brought
prices close to replacement cost
94
163
-
50
100
150
200
06-2
007
09-2
007
12-2
007
03-2
008
06-2
008
09-2
008
12-2
008
03-2
009
06-2
009
(,0
00
,00
0)
USD
150
200
(,0
00
,00
0)
US
D
Sources: Clarkson, Danish Ship Finance << VLCC price << Estimated VLCC value
-43%
CONTRACTING & SHIP VALUES
OWNERS SEEMED TO HAVE LOST THEIR APPETITE FOR SPECULATING IN THE TANKER MARKET. VESSEL PRICES WERE DECLINING, ALBEIT ABOVE LONG TERM EARNINGS TREND. SECONDHAND PRICES HAVE DECLINED 43% WHEREAS THE NEWBUILDING PRICES HAVE FALLEN 23% FROM SEPTEMBER 2008 TO FEBRUARY 2009.
Abrupt decline in fourth quarter contracting activity The financial crisis quelled shipowners’ appetite for new tonnage as access to credit dried up. Correspondingly, fourth quarter 2008 contracting activity was low, whereas 2008 as a whole was a year of high contracting activity (fig. 7). In fact, recent years’ heavy contracting activity has outpaced the potential single-hull phase-out by a significant magnitude.
One might ask what drove the shipowners’ insatiable appetite for new tonnage for so long. The traditional answer is, of course, fleet replacement in general and the IMO phase-out regulation in particular.
Contracting activity is largely driven by the asset play Recalling the recent years’ unprecedented increase in asset values and the recent correction in prices, we find it hard to ignore the speculative component of the contracting activity.
It seems as if shipowners had placed too much trust in the expectation that asset values would continue to increase, due to the IMO regulations forcing single-hull tankers phase-out by 2010 (2015). These hopes now seem long gone.
Newbuilding prices have fallen 23% Even as shipyards are taking refuge in large orderbooks and long delivery times it is hard to neglect the impact of low or no contracting activity in a time where shipyard capacity is expected to explode. Thus, newbuilding prices declined as earnings weakened and contracting activity collapsed. However, accurate assessment of the newbuilding
Danish Ship Finance 14

Figure T9
High VLCC ship values drives return on equity below 15 % boundary
21
%
21%
19% 2
3%
28
%
16
%
22
%
18
%
12
%
12
% 15%
9%
8%
6% 7% 8%
15
%
0%
10%
20%
30%
1993
1994
1995
1996
1997
1998
1999
2000
2001
2002
2003
2004
2005
2006
2007
2008
2009
Avera
ge r
etu
rn o
n e
qu
ity
0%
10%
20%
30%
Avera
ge
re
turn
on
eq
uit
y
Sources: Clarkson, Danish Ship Finance * 2009, January and February
Figure T10 Five-year-old VLCC: Required timecharter equivalent after end charter period are still significantly above
trend but declining.
-
15,000
30,000
45,000
60,000
75,000
1993
1995
1997
1999
2001
2003
2005
2007
2009
2011
US
D/d
ay
-
15,000
30,000
45,000
60,000
75,000
US
D/d
ay<< 3-year timecharter rate, VLCC
<< Required earnings per day in the remaining 17
Sources: Clarkson, Danish Ship Finance
Likewise, the sale and purchase market entered a state of trance where little activity was registered. Five-year-old VLCC secondhand prices decreased on average 10% per month from September 2008 to February 2009. The decline in secondhand prices brought prices close to estimated replacement cost (fig. 8). For a detailed discussion of the replacement cost approach please see “Our Approach To Ship Values”.
To generate a short-term return-on-equity of 15%, at current three-year timecharter rates of USD 44,000 per day, the five-year-old VLCC secondhand price will have to drop 10.5 million (11%) from its current level of USD 93.5 million.
prices is difficult when shipowners do not contract new vessels and hence signal their reservation price. That been said, recent broker valuations estimate that the VLCC newbuilding price has dropped USD 37 million (-23%) to USD 125 million from September 2008 to February 2009.
In terms of the residual required earnings, a five-year-old secondhand vessel currently requires USD 33,500 per day for the remaining 17 years. Compared to historical three-year-timecharter rates, this level seems high (fig. 10).
Short-term ROE summarizes the balance between earnings and asset prices (debt burden). Figure 9 illustrates the short-term return on equity from 1993 to 2009 for a five-year-old VLCC tanker. The calculation is made as a one-vessel-only investment in a five-year-old ship. We do not consider changes in asset values during the timecharter period. Current five-year-old VLCC tanker prices generate a short-term return-on-equity of 8% based on the average accumulated earnings in the charter period. The sub-15% return-on-equity since 2005 illustrates that prices have increased beyond (short-term) earnings and hence that the implicit risk in secondhand prices has increased.
To facilitate such decline in the secondhand price, the newbuilding price will have to drop USD 24 million (19%) to USD 101 million.
Secondhand prices have declined 43% since September 2008
Current asset prices indicate low return on equity (ROE)
Secondhand prices to drop 11%
Newbuilding prices to drop 19%
Danish Ship Finance 15

OUTLOOK
OECD OIL CONSUMPTION IS EXPECTED TO DECLINE 3.4% IN 2009. GLOBAL OIL CONSUMPTION IS EXPECTED TO DECLINE 1.5%. SUBSTAINTIAL SINGLE-HULL PHASE-OUT, SCRAPPING AND/OR CANCELLATIONS ARE REQUIRED IN 2009 AS DEMAND DECLINES AND SUPPLY INCREASES WITH 11%. IN THE ABSENCE HEREOF, THE OUTLOOK FOR EARNINGS AND ASSET PRICES IS BLEAK.
In the recent months, global GDP growth has been revised downwards again and again as the financial turmoil has spread into most asset classes, facilitating global wealth destruction and waning consumer demand. The impact on the main engines of the world economy has been colossal. IMF expects advanced economies to contract 2% in 2009, whereas emerging and developing economies are expected to grow 3.3%. This is by far the worst macroeconomic outlook in recent history.
The outlook for crude tanker demand is accordingly bleak. EIA expects global oil demand to decline 1.5% in 2009. OECD oil consumption is expected to decline 3.4% whereas non-OECD oil consumption is expected to increase 1%.
The topic of today is therefore dominated by a possible scenario of excess crude tonnage, declining freight rates and, consequently depreciating asset values. A question remains to be answered: Are we just waiting for the crunch or is there light at the end of the tunnel?
There is light at the end of the tunnel! The low oil demand in OECD has sent the oil price downwards at an exceptional pace. That has reminded us that oil consumption is not price inelastic. Accordingly, we argue that the lower oil price will support future oil consumption, just as the high oil price was destroying oil demand in the past months. We identify two channels from where we expect oil demand and thus crude tanker demand to benefit from in the medium to long term.
Monetary and fiscal stimuli increases oil consumption The first channel is, obviously, the massive monetary and fiscal stimuli packages introduced by several governments. The packages intend to facilitate a soft landing of their economies through, for example, recapitalisation of domestic banks, as well as massive investments in various sectors. For many countries the current stimuli programs constitute the most ambitious use of taxpayer’s money launched by any government in history. Let us hope that they will succeed beyond saving the financial system and stimulate growth and hence increase oil consumption.
Low oil prices redistribute wealth to oil importers The second channel is less obvious. The low oil price works similarly to the massive monetary and fiscal stimuli packages. A low oil price lowers the expenditures and thereby increases the disposable income available for consumption. Increased consumption is expected to be the first line of defence against lower GDP growth. A lower oil price is therefore expected to stimulate economic growth – but only for oil importing countries. Thus, the current lower price of oil carries with it an important feature: A de facto redistribution of income from oil exporting to oil importing countries. Expressed in another way: The low oil price works in a similar way to an expansive fiscal stimuli except it is at the expense of oil exporting countries and not the domestic tax payers!
Consequently, a lower oil price generates economic growth “free of charge” to domestic taxpayers. That might seem too good to be true and it is in a way. Thus, the positive story is probably only a brief respite in a long haul. It is a second round effect facilitating a future recovery not a cure. Nevertheless it is important to remember these redistribution effects, as they are important contributors to a potential recovery.
Danish Ship Finance 16

How and when will this impact crude tanker demand? Figure T11
Crude tanker fleet net of scrapping and phase-outAll single-hull tankers assumed phased-out in 2010
153172 162
189 1945563 66
74 758394 97
102 103
-
80
160
240
320
400
480
2008 2009 2010 2011 2012
Mil
lio
n D
WT
-5%
0%
5%
10%
15%
20%
25%
Year-
on
-year
gro
wth
Fleet growth (VLCC, Suezmax and Aframax) >>
<< Aframax<< Suezmax<< VLCCSources: Clarkson, Danish Ship Finance
Figure T12 Crude tanker delivery and potential scrapping per year
No adjustment made for potential slippage, IMO phase-out or cancellations
22
-32
7
-5
10
-8
-60
-45
-30
-15
-
15
30
45
60
2008 2009 2010 2011 2012
Milli
on
Dw
t
Sources: Clarksons, Danish Ship Finance
Delivery
VLCC Suezmax Aframax
Pote
nti
al
Scr
ap
pin
g
The impact of this redistribution of income naturally depends on the oil price. An increasing oil price lowers the effect. While we are not in a position to forecast the oil price, we note that OPEC itself states that many oil producers require an oil price between USD 60 and 80 per barrel to balance budgets and initiate the necessary exploration and infrastructure investment to secure long-term supplies. This might indicate that oil production could be cut further to stimulate oil price increases and thus eliminate the redistribution of income effect. A lower oil production will of course lower short-term demand for crude tankers.
Still, the important message to tanker owners is that there is some sort of recovery on the horizon.
Low global crude tanker demand in 2009 Unfortunately, it seems unlikely to happen in 2009. Excess crude tanker capacity, declining asset values and waning oil consumption will most likely dominate the scene.
Annual fleet replacement amounts to 12 million dwt Before we get too much into detail about single-hull tanker phase-out, expected scrapping, potential annual delivery etc., let us take a step back and consider the underlying supply trend. First, let us consider the expected annual fleet replacement. Basically, we assume that a tanker vessel operates 25 years and is scrapped thereafter. In a scenario where the combined crude tanker fleet (VLCC, Suezmax and Aframax) amounts to 300 million dwt the annual fleet replacement of tonnage is approximately 12 million dwt. True, there is more to contracting activity than fleet replacement, but this simple scenario gives us a valuable indication of the long-term trend. Unfortunately, this approach does not take into consideration the actual age distribution of the fleet , why it remains a simple indicator.
The crude tanker fleet is expected to grow 11% in 2009 The expected delivery for 2009 amounts to 43 million dwt or approximately 3.5 times the fleet replacement mark. Estimated scrapping activity for 2009 is expected to average 3.5 to 4 million dwt. Consequently, crude tanker supply is expected to grow by 14% in 2009 (fig. 11). But the open question remains: Will yards deliver? For 2009 deliveries, we expect the lion’s share to be delivered, as most of these vessels already exist at some stage of construction. Some portion of the
Danish Ship Finance 17
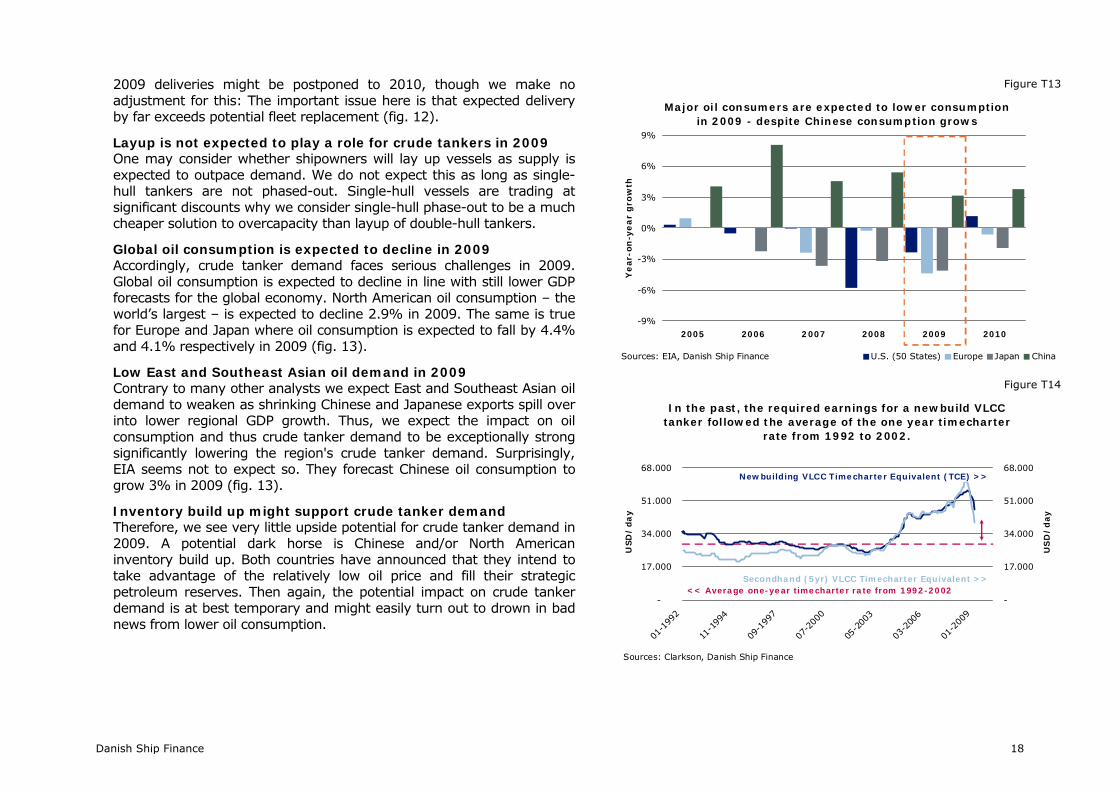
Figure T13
Major oil consumers are expected to lower consumption in 2009 - despite Chinese consumption grows
-9%
-6%
-3%
0%
3%
6%
9%
2005 2006 2007 2008 2009 2010
Year-
on
-yea
r gro
wth
U.S. (50 States) Europe Japan ChinaSources: EIA, Danish Ship Finance
Figure T14 In the past, the required earnings for a newbuild VLCC
tanker followed the average of the one year timecharter rate from 1992 to 2002.
-
17.000
34.000
51.000
68.00001
-199
2
11-1
994
09-1
997
07-2
000
05-2
003
03-2
006
01-2
009
USD
/da
y
-
17.000
34.000
51.000
68.000
US
D/d
ay
<< Average one-year timecharter rate from 1992-2002
Newbuilding VLCC Timecharter Equivalent (TCE) >>
Sources: Clarkson, Danish Ship Finance
Secondhand (5yr) VLCC Timecharter Equivalent >>
Therefore, we see very little upside potential for crude tanker demand in 2009. A potential dark horse is Chinese and/or North American inventory build up. Both countries have announced that they intend to take advantage of the relatively low oil price and fill their strategic petroleum reserves. Then again, the potential impact on crude tanker demand is at best temporary and might easily turn out to drown in bad news from lower oil consumption.
One may consider whether shipowners will lay up vessels as supply is expected to outpace demand. We do not expect this as long as single-hull tankers are not phased-out. Single-hull vessels are trading at significant discounts why we consider single-hull phase-out to be a much cheaper solution to overcapacity than layup of double-hull tankers.
2009 deliveries might be postponed to 2010, though we make no adjustment for this: The important issue here is that expected delivery by far exceeds potential fleet replacement (fig. 12).
Accordingly, crude tanker demand faces serious challenges in 2009. Global oil consumption is expected to decline in line with still lower GDP forecasts for the global economy. North American oil consumption – the world’s largest – is expected to decline 2.9% in 2009. The same is true for Europe and Japan where oil consumption is expected to fall by 4.4% and 4.1% respectively in 2009 (fig. 13).
Contrary to many other analysts we expect East and Southeast Asian oil demand to weaken as shrinking Chinese and Japanese exports spill over into lower regional GDP growth. Thus, we expect the impact on oil consumption and thus crude tanker demand to be exceptionally strong significantly lowering the region's crude tanker demand. Surprisingly, EIA seems not to expect so. They forecast Chinese oil consumption to grow 3% in 2009 (fig. 13).
Layup is not expected to play a role for crude tankers in 2009
Inventory build up might support crude tanker demand
Global oil consumption is expected to decline in 2009
Low East and Southeast Asian oil demand in 2009
Danish Ship Finance 18

Crude tanker earnings in 2009 Fundamentally, global oil consumption is expected to contract 1.4% and the crude tanker fleet is expected to increase 11% in 2009. It seems difficult not to expect earnings to decline. Single-hull phase-out is expected to intensify as rates plummet. However, whether enough single-hull tankers will be phased-out to balance lower demand is less obvious.
Asset prices expected to decline in 2009 Excessive supply of tonnage is naturally expected to lower asset values, but to which extent?
From 1992 to 2002, asset prices (translated into a daily timecharter equivalent) swung around the average one-year timecharter rate from the same period (fig. 14). From 2002 to 2008, required earnings have increased significantly. As discussed above, the combination of high contracting activity, high asset prices and lower demand growth have forced short-term return on equity below 15% and launched the first significant drops in asset prices in recent years. Will this trend continue? Will tanker asset prices test the lows of 1992-2002 or even the lows of 2002? To be completely honest we do not know. Figure 15 illustrates some milestones for asset prices.
Compared to Dry Bulk and Container vessels, five-year old crude tankers have so far lost less in value. But does this tell us anything? We believe not. The three markets are not comparable with each other in a way that justify similar asset price developments. The most important lesson we have been taught by the Dry Bulk market and the Container market in recent months is that asset values can change faster than we expect.
Large phase-out potential in 2010 2010 might show a better supply-demand balance, but much depends on actual phase-out. According to Clarkson, the crude tanker orderbook currently accounts for 39 million dwt expected to enter the fleet in 2010. We have made no adjustments for potential slippage or order cancellations not yet registered by Clarkson. The scrapping potential in 2010 is expected to be large. We assume that all non-double-hulled vessels and vessels above 25 years will be scrapped in 2010. These assumptions might seem
drastic. Nevertheless, we do not have sufficient information to estimate potential slippage, cancellations or phase-out with a reasonably degree of accuracy. This implies that the combined scrapping potential will exceed the expected delivery by a magnitude of almost 6 million dwt. Figure 12 summarises the outlook.
Low crude tanker demand in 2010 The demand outlook for 2010 is naturally dependent on the impact of the stimuli packages. Thus, the outlook is blurred as we on the one hand expect the stimuli programs to have some effect on economic growth but on the other hand doubt that, for example, OECD will present positive growth figures and hence higher oil demand in 2010. Therefore, it is too early to forecast the influence on crude tanker demand. ■
Figure T15 Current asset prices will have to have to test the lows of
2002
125
94
1992-2002 average
1992-2002 average
1998-2008 average
1998-2008 average
2002 low
2002 low
-
25
50
75
100
125
150
VLCC, Newbuilding Price VLCC, five-year old M
illi
on U
SD
Sources: Clarkson, Danish Ship Finance
Danish Ship Finance 19

Container Ship TIMECHARTER RATES WERE APPROACHING CRITICAL LEVELS AS DEMAND WANED AND SUPPLY EXPLODED. ASSET VALUES WERE DECLINING AS SHORT-TERM RETURN ON EQUITY DETERIORATED. SCRAPPING IS NO REFUGE AS YOUNG POST-PANAMAX VESSELS ARE IN THE EYE OF THE STORM. TO LAYUP VESSELS SEEMS THE ONLY WAY THROUGH THESE TOUGH TIMES. ACCORDINGLY, WE EXPECT FREIGHT RATES AND ASSET VALUES TO DECLINE FURTHER IN 2009.
Figure CS.1
Timecharter rate per teu has fallen through the floorThe Containership Timecharter Rate Index
-54%
-15%
2009USD 42 per teu
2002USD 57 per teu
-
20
40
60
80
100
120
140
160
1993
1994
1995
1996
1997
1998
1999
2000
2001
2002
2003
2004
2005
2006
2007
2008
2009
US
D/
teu
-60%
-40%
-20%
0%
20%
40%
60%
Yea
r-o
n-y
ear
gro
wth
Sources: Clarksons, Danish Ship Finance
<< Timecharter rate index
Year-on-year growth >>
Figure CS.2
2009 Container T/C averages more than 60% below 2008 for Panamax and Sub-Panamax
-
5
10
15
20
25
30
Feeder 350 teu Handy 1000 grd Sub-Panamax2750 gls
Panamax 3500 teu
(,0
00)
US
D/D
ay
6-1
2 m
onth
-
5
10
15
20
25
30
(,00
0)
US
D/
Da
y
6-1
2 m
ont
h
1992-2002 avg. 1998-2008 avg. 2007 avg.
2008 avg. 2009 avg. OPEX 2008Sources: Clarksons, Danish Ship Finance
FREIGHT RATES
FREIGHT RATES TUMBLED THROUGHOUT 2008 AND THE FIRST MONTHS OF 2009. TODAY SMALL CONTAINER VESSELS ARE OPERATING CLOSE TO OPEX LEVELS.
In our previous Shipping Market Review we predicted a modest decline in earnings for the remaining months of 2008. We were right in the direction but unfortunately way too optimistic.
Timecharter rates per teu found a new record low in 2009 The average timecharter rate per teu dropped 32% from first half 2008 to second half 2008. In relative terms 2008 ended 15% below the 2007 level and slightly in line with the 1998-2008 average.
For the first three months of 2009 the average timecharter rate per teu has fallen through the floor closing 26% below the previous all time low from 2002 (fig. 1).
Small Container ships are operating close to their OPEX-level As illustrated by figure 2, the decline in average timecharter rate per teu has facilitated a significant drop in the one-year timecharter rate.
The largest vessels have dropped the most. The one-year timecharter rate for a 3,500 teu vessel has dropped 62% from 2008 to 2009 whereas a 350 teu has lost only 31% in the same period. Unfortunately, the smallest Container vessels are already running close to OPEX levels. The larger vessels still have room for profit.
Danish Ship Finance 20

Figure CS.3
Top 10 Head-Haul Container Routes 2008(measured by teu-nautical miles)
Asia -> Europe; 30%
Asia -> North America; 20%
Asia -> Africa; 4%
Europe -> North America; 3%
Latin America and the Caribbean -> North
America; 3%
Asia -> Australia and Oceania; 3%
Europe -> Asia; 4%
Asia -> Latin America and the Caribbean;
6%
Intra-Asia(Deep Sea)
6%
Intra Asia (Short Sea)
7%
Other12%
Sources: Global Insight, Danish Ship Finance
Danish Ship Finance 21

Figure CS.4
A record 1,9 M teu is set to enter market in 2009. No adjustments made for potential slippage or cancellations
687 749 1,025 1,306 1,427
378
-2,500
-1,500
-500
500
1,500
2,500
2007 2008 2009 2010 2011 2012
(,00
0)
Teu
Sources: Clarksons, Danish Ship Finance
Delivery
Post-Panamax Panamax
Sub-Panamax
Scr
ap
pin
g
Handy
Feeder & Feedermax
+1.964.415 teu
- 557.767 teu
Figure CS.5
Head-haul demand growth bottomed in 2008 at 2% As North American imports from Asia contracted 4% and Intra-Asian trade
disappointed
2%
-4%
7%
-20%
-10%
0%
10%
20%
2007 2008 2009
Year-
on-y
ea
r gro
wth
-20%
-10%
0%
10%
20%
Year-
on-y
ea
r gro
wth
Aggregated head-haul growth Asia -> Europe
Asia -> North America Intra-Asia
Sources: Global Insight, Danish Ship Finance
SUPPLY & DEMAND
THE CONTAINER MARKET DROWNED IN CONTAINER VESSELS AS HEAD-HAUL DEMAND WANED AND ENTRY OF LARGER TONNAGE CONTINUED TO ESCALATE. OWNERS WERE FIGHTING OVERCAPACITY WITH ALL WEAPONS AVAILABLE – SCRAPPING, LAYUP, SERVICE CLOSURES AND CASCADING. THE CONTAINER FLEET GREW 13% WHEREAS DEMAND CRAWLED 2% IN 2008.
An astonishing 1,5 million teu reached the seas in 2008 The last years’ insatiable appetite for larger Container vessels and hence lower marginal costs continue to flood the containership market. In 2008 approximately 1,5 million teu entered service. Approximately half of the deliveries (98 vessels) were above 5,000 teu and expected to enter the East-West trades. Accordingly, Container supply was growing 13% in 2008 (fig. 6).
Head-haul demand growth bottomed in 2008 at 2.4% Head-haul demand bottomed in 2008 as the major head-haul importing economies – North America and Europe - were about to enter recession. Measured in teu-nautical miles global head-haul demand grew 2.4% compared to the 10-year average of 10.9% (1998-2008) (fig. 5).
North American head-haul import contracted 4% in 2008 As the financial crisis unfolded, US consumer spending plummeted and the governmental use of taxpayer’s money assisting troubled financial institutions exploded. The decline in North American Container imports was overwhelming. On an annual basis, North American head-haul import contracted 4% in 2008 (fig. 5).
European head-haul import stayed positive at 2% Lower European private consumption combined with lower investment activities caused the decline in European GDP growth to approximately 1% in 2008 (2.9% in 2007). The European housing market was in the eye of the storm. In France, United Kingdom and Spain real estate investments have supported GDP growth in the period 2001-2007. As real estate prices declined in 2008 the investment activity followed suit. This has been one of the key drivers behind lower GDP growth in these countries in 2008. Germany is a bit different. The German economy is the dominating growth locomotive in Europe. The decline in world
Danish Ship Finance 22

demand has hurt German exports significantly, impacting negatively German GDP growth and imports.
Figure CS.6
The container fleet is expected to grow 12% in 2009 after scrapping
3,492 3,7655,085 6,111
7,417
17%
14% 13% 13%12%
-
2,500
5,000
7,500
10,000
12,500
15,000
17,500
2006 2007 2008 2009 2010
(,0
00
) te
u
0%
5%
10%
15%
20%
25%
30%
35%
Ann
ua
l fl
eet
gro
wth
Post-Panamax Panamax Sub-Panamax Handy Feeder and Feedermax
Sources: Clarkson, Danish Ship Finance
Figure CS.7
The low head-haul demand growth in 2008 generated a supply surplus of 11%
13% 12%
2%
-2%
-20%
-10%
0%
10%
20%
30%
40%20
02
2003
2004
2005
2006
2007
2008
2009
2010
2011
Yea
r-o
n-y
ear
gro
wth
-20%
-10%
0%
10%
20%
Dif
fere
nce
be
twee
n d
em
an
d
an
d s
upp
ly
Sources: Clarksons, Global Insight, Danish Ship Finance
<< Supply Growth (teu-NM)
<< Demand Growth (teu-NM)
Difference between Demand and Supply >>
11% 14%
All together, the impact on European container demand was massive. European head-haul container import growth dropped from 14% in 2007 to 2% in 2008 (fig. 5).
Intra-Asian trade grew 7% in 2008 Intra-Asian trade growth reached the lowest level since 1998, growing 7% in 2008. Intra-Asian trade is dominated by trade related to Chinese exports of manufactured goods ultimately bound for North America or Europe. Therefore, as Intra-Asian trade growth to some degree reflects Chinese exports, it is not surprising that Intra-Asian trade lost momentum in tandem with Chinese exports in late 2008 (fig. 5).
Owners were fighting overcapacity with all means available Owners were fighting waning demand, surplus supply and declining freight rates with all weapons available. Accordingly, vessels were being scrapped, services are shut down, vessels were being laid up (more or less provisional) and liners were returning surplus ships to the tonnage providers.
An important feature related to laid-up vessels is that they might remove the instant pressure on freight rates, but they still exist on the owners’ balance sheets and will re-enter the active fleet when freight rates improve.
Container owners scrapped 100,000 teu in 2008 Scrapping activity reached a new peak in 2008 with the largest annual volume scrapped in recent history. Nearly four times the scrapping activity registered in 2007 was recorded in 2008 as 100,000 teu was scrapped. Sub-Panamax and the Handy Container segments were the scrapping favourites. Nevertheless, the effort seemed somewhat half-hearted as almost 440,000 teu could qualify for scrapping (i.e. was older than 25 years) but only 100,000 teu was scrapped. Owners only scrapped vessels with an average age of 28 not 25 years. So, the scrapping potential was significantly larger than actual scrapping in 2008.
Danish Ship Finance 23

Estimated overcapacity peaked in 2008 at 11% Figure CS.8
A bleak demand outlook and high newbuilding prices drained appetite for new tonnage in 2008.
-
250
500
750
1,000
1,250
1,500
03-2
006
06-2
006
09-2
006
12-2
006
03-2
007
06-2
007
09-2
007
12-2
007
03-2
008
06-2
008
09-2
008
12-2
008
(,0
00
) te
u
250
500
750
1,000
1,250
1,500
(,0
00
) te
u
Feeder
Feedermax
HandySub-Panamax
Panamax
Post Panamax
Sources: Clarkson, Danish Ship Finance
Figure CS.9
Contracting activity by far exceeds required fleet replacement
8.48.6
2.4
-
2
4
6
8
10
1996
1997
1998
1999
2000
2001
2002
2003
2004
2005
2006
2007
2008
R
ati
o (
Deli
ve
ry/
Fle
et
Repla
cem
ent)
-
2
4
6
8
10
Ra
tio (
Deli
ve
ry/
Fle
et
Repla
cem
ent)
Sources: Clarksons, Danish Ship Finance
The combination of lower head-haul demand growth and peaking tonnage supply sent the fleet utilization down to a critical 80% and resulted in an excess supply of 11% (fig. 7). Measured in teu, Howe Robinson estimated that approximately 1.1 million teu was in excess supply. In this perspective, half a million teu scrapped in 2008 would not have rescued freight rates. The oversupply was too great. Hypothetically, to restore balance between supply and demand significant Post-Panamax scrapping was required. We estimate for the sake of illustration that all Post-Panamax vessels older than 7 years would have had to be scrapped to restore balance between supply and demand.
Idle fleet now at 1.4 million teu The surplus capacity throughout 2008 and beginning of 2009 lead to an increasing number of idle container vessels. According to AXS-Alphaliner 165 ships (430,000 teu) were idle late December 2008. The number has since tripled and reached 485 ships (1,42 million teu) in March 2009. This almost amounted to the combined deliveries of 2008.
Cascaded vessels from Asia-Europe trade The lower European head-haul import growth caused a number of vessels to be moved from the Asia-Europe trade back to the Asia-North America trade, where they were reallocated from in 2007. Drewry estimates that a total of 91 vessels were identified as being moved away from the Asia-Europe trade to other trades in an attempt to redistribute the overcapacity.
CONTRACTING & SHIP VALUES
OVERCAPACITY AND DECLINING INCOME LOWERED OWNERS’ APPETITE FOR NEW TONNAGE AND SENT SHORT-TERM RETURN ON EQUITY AND THUS ASSET PRICES SOUTHWARDS.
Risk of overcapacity weakened the appetite for new tonnage The combination of overcapacity and declining timecharter rates decelerated the appetite for new tonnage. Approximately one million teu was contracted in 2008, whereas 930,000 teu was contracted during the first half of 2008 (fig. 8).
Danish Ship Finance 24

In comparison to the contracting activity in 2007 one million teu seems not a great deal. However, annual contracting activity has to be measured against expected annual fleet replacement, and not previous years’ euphoria.
Figure CS.10
Estimated value of a 5-year-old Handy Container vessel is significantly below the actual secondhand price
-
5
10
15
20
25
30
1997 1998 1999 2000 2001 2002 2003 2004 2005 2006 2007 2008 2009
Milli
on
US
D
-
5
10
15
20
25
30
Mil
lion
USD
Sources: Clarksons, Danish Ship Finance Handymax price Estimated value
Figure CS.11
The collapse in timecharter rates send short term return on equity below zero for 5-year-old Handy Container
vessels
16
%
15
%
14
%
12
%
11
%
11
%
10
%
9%
9%
8%
7%
4%
-10%
-24
%
-21
%
-19
%-11
%
-40%
-20%
0%
20%
40%
10-2
007
11-2
007
12-2
007
01-2
008
02-2
008
03-2
008
04-2
008
05-2
008
06-2
008
07-2
008
08-2
008
09-2
008
10-2
008
11-2
008
12-2
008
01-2
009
02-2
009
Av
era
ge r
etu
rn o
n e
qu
ity
-40%
-20%
0%
20%
40%
Avera
ge
retu
rn o
n e
qu
ity
Sources: Clarksons, Danish Ship Finance
Contracting activity has neglected future tonnage demand Accordingly, we introduce the “delivery / fleet replacement” ratio. Fleet replacement is calculated as the average annual tonnage required to be replaced, assuming that all vessels operate for 25 years. Figure 9 illustrates the findings. It becomes clear that the last six years of contracting activity has been ambitious. The contracting activity of, for example, 2003 and 2007 both surpassed eight times the expected annual fleet replacements. 2008 contracting activity was only 2.4 times higher than expected annual fleet replacement. Obviously, there is more to contracting activity than fleet replacement but these numbers seem large even though a new vessel size is being introduced.
Yards are reluctant to lower prices at high berth cover For yards the contracting euphoria has facilitated a situation of more than three years’ berth cover at historically high prices. Yards therefore should not in general be in a situation of desperation where they have to adjust newbuilding prices to short term movements in owners’ appetite for tonnage.
Newbuilding prices have dropped back to 2004 levels Nevertheless, newbuilding prices have dropped significantly from September 2008 to March 2009. In this period, the newbuilding price for a Post-Panamax vessel has dropped 19% whereas Handy container has dropped 32%. This brings newbuilding prices back to 2003-2004 levels. In terms of replacement costs, a lower newbuilding price is expected to lower the theoretical secondhand price (see Our Approach to Ship Values for an introduction to this methodology). Currently, the Handy container secondhand price (seller’s reservation price) is above the theoretical replacement cost (buyer’s reservation price) why very little sale and purchase activity has been registered (fig. 10).
The optimal cocktail for a deadlock is present. Plummeting timecharter rates and newbuilding prices lower potential buyer’s reservation price whereas seller’s reservation price is higher as many vessels have been purchased at historically high levels.
Danish Ship Finance 25

A wait-and-see game for larger vessels Figure CS.12
For the first time in more than 10 years the short term return on equity for a Handy Container turns below zero
effectivly destroying value
11
%
3%
17
%
12%
7%
21
% 34
%
34
%
20
%
17
%
3%
-22
%
18
%
-60%
-40%
-20%
0%
20%
40%
60%
1997 1998 1999 2000 2001 2002 2003 2004 2005 2006 2007 2008 2009
Av
era
ge r
etu
rn o
n e
qu
ity
-60%
-40%
-20%
0%
20%
40%
60%
Av
era
ge r
etu
rn o
n e
qu
ity
Sources: Clarksons, Danish Ship Finance * 2009, January and February
Figure CS.13
Handy container (1,000 teu) timecharter rates will have to increase 89% to balance current prices.
89.0%
0%
20%
40%
60%
80%
100%
02-2
008
03-2
008
04-2
008
05-2
008
06-2
008
07-2
008
08-2
008
09-2
008
10-2
008
11-2
008
12-2
008
01-2
009
02-2
009
R
eq
uir
ed
ch
an
ge i
n
tim
ech
art
er
rate
0%
20%
40%
60%
80%
100%
Req
uir
ed
ch
an
ge i
n
tim
ech
art
er
rate
Sources: Clarksons, Danish Ship Finance
Larger vessels are either purchased by liner companies or chartered out to liner companies on long charter contracts. In terms of sale and purchase activity, this means that limited activity is registered as neither owner nor charter is willing to record unrealised losses as long as they are not forced to do so. For the smaller vessels, however, some sale and purchase activity has been registered.
Lower Handy Containers asset values From September 2008 to February 2009, the one-year timecharter rate for a 1,000 teu Handy Container vessel dropped 60%. The effect on secondhand values has been dramatic. Accordingly, the average price for a five-year old secondhand vessel dropped 40% ending January 2009 at record-low USD 14 million.
Handy Containers are facing negative return on equity An essential component to short term movements in secondhand prices is the ability to cover OPEX and debt obligations from timecharter income. If timecharter income is inadequate to cover these obligations secondhand prices are expected to decline. We measure this liquidity effect as a short-term return on equity (ROE). A negative ROE is associated with equity destruction as the owner will have to come up with additional working capital to operate the vessel. For a further introduction to the methodology behind short-term return on equity see Our Approach to Ship Values.
Secondhand prices is declining in negative ROE As timecharter income declined toward OPEX-levels the short term ROE raced to the bottom and assisted the drop in secondhand values (fig. 11).
Heavily biased towards 2004 and 2005, the historical average of ROE (1997-2008) has been 17% (fig 12). If current timecharter rates are sustained, 2009 will be the first year in the period 1997-2009 where annual short-term ROE actually turns negative (fig. 12).
At current timecharter income and OPEX-levels, it seems almost impossible to service debt amortizations. Therefore, we expect extensive scrapping activity and/or continued layup activity if the timecharter rate does not improve.
Danish Ship Finance 26

Figure CS.14
The container fleet is expected to grow 12% in 2009 after scrapping
3,492 3,7655,085 6,111
7,417
17%
14% 13% 13%12%
-
2,500
5,000
7,500
10,000
12,500
15,000
17,500
2006 2007 2008 2009 2010
(,0
00
) te
u
0%
5%
10%
15%
20%
25%
30%
35%
Ann
ua
l fl
eet
gro
wth
Post-Panamax Panamax Sub-Panamax Handy Feeder and Feedermax
Sources: Clarkson, Danish Ship Finance
Figure CS.15
2 million teu is older than 15 years. Unfortunately, there are none Post-Panamax vessels among
5
-
2,000
4,000
6,000
8,000
10,000
12,000
Feeder Feeder Max Handy Sub-Panamax
Panamax Post-Panamax
(,00
0)
teu
-
4
8
12
16
20
24
Avera
ge a
ge
0-15 year 15+ year old OrderbookSources: Clarksons, Danish Ship Finance
Average age >>
Scrapping is not a cure. The scrapping candidates are smaller container vessels while the orderbook is dominated by Post-Panamax vessels. Therefore, to absorb the large inflow of Post-Panamax vessels, significant cascading activity is required. Post-Panamax vessels are
Accordingly, there is not much positive to say about the near-term outlook for container freight rates and asset prices. Therefore, the topic of this section is almost reduced to answer whether freight rates and asset prices will be sustained through extensive supply reducing initiatives such as slow steaming, scrapping, and layup.
THE CONTAINER OUTLOOK FOR 2009 IS BLEAK. WANING CONSUMER DEMAND SEEMS UNABLE TO ABSORB THE LARGE INFLOW OF NEW CONTAINER TONNAGE. ASSET VALUES AND FREIGHT RATES ARE EXPECTED TO DECLINE ACCORDINGLY.
The Container fleet is expected to grow by 1,9 million teu (12%) in 2009. This is by far the largest inflow of tonnage entering the container fleet in recent history. We do not discuss the accuracy of this figure as it is more or less trivial to the conclusions even if, for example, 25% should be cancelled or postponed to 2010. The large inflow of vessels is expected to arrive as head-haul Container demand plummets.
As far as we understand, slow steaming is mostly a question of bunker cost. Bunker costs have on average dropped 60% from third quarter of 2008 to first quarter of 2009. With the much lower bunker cost, we do not expect slow steaming to be an issue – at least not from a cost-cutting perspective. Nevertheless, in terms of fighting overcapacity slow steaming might become an issue in case it is less expensive than, for example, cold layup.
For timecharter earnings to yield a ROE of 15%, the timecharter rate will have to increase 89% from current USD 4,300 per day to USD 9,600 per day.
Timecharter rates will have to increase 89%
OUTLOOK
The scrapping potential is largest among smaller vessels
The Container fleet is expected to grow 12% in 2009
Falling from the sky with or without a parachute?
Limited potential for slow steaming
Danish Ship Finance 27

traditionally expected to enter the East-West trades, why North-South and Inter-regional trades are expected to experience cascading activity in 2009. Figure 15 illustrates the age distribution of the fleet. Notice that vessels older than 15 years are depicted as viable candidates for scrapping in order to counter the large inflow of new tonnage.
Significant layup activity is expected To the extent, that cascading is insufficient to absorb the inflow of Post-Panamax vessels there are few or no other alternatives to layup. Alternatively, young Post-Panamax vessels will have to be scrapped. We do not expect even extensive cascading activity to be sufficient to employ the large inflow of Post-Panamax vessels, why we predict significant layup activity.
Risk of deteriorating (Post-Panamax) asset values When a market is in excessive supply, rates per unit (teu) will approach all time lows. For vessels with capacity larger than the capacity in demand, economy of scale suddenly may become a liability. Charterers are not willing to pay for more capacity than they demand. Therefore, if scrapping activity, layup and/or cascading turn out to be inadequate to balance supply and demand, the outlook for Post-Panamax asset values is daunting.
Freight rate determination beyond supply and demand Some might conclude, that we are about to race to the bottom. We are in a way, but the world will still need container transportation. Therefore, we expect to see freight rate increases not supported by supply and demand but simply as a question of feasible. At current low freight rates neither tonnage providers nor liners can operate for long. In the following paragraphs, we analyse underlying fundamentals. Future freight rate movements might not necessarily reflect these tendencies for reasons discussed above.
---o0o---
Weak consumer demand in 2009 and beyond Container demand reflects global consumer demand. Global consumer demand is obviously down as the world’s two largest consuming regions (North America and EU) are fighting extensive - debt related - consumer recessions. Consumer wealth is in the eye of the storm as declining asset values (including stock and real estate prices) have lowered the value of consumers’ savings and pensions. Thus, current and future consumption is significantly impacted by lower asset values. Extensive monetary and fiscal stimuli packages are launched by several governments to support consumer spending and hence facilitate a soft landing of the economies. For many countries the current stimuli programs are the most ambitious use of taxpayer’s money launched by their government in history. Let us hope that they will succeed beyond saving the financial system and hence stimulate growth and private consumption.
Lower oil price supports consumer spending We ask ourselves if there are upside potentials for North American and European imports. From core fundamentals such as consumer spending, unemployment figures and so on, we hardly find any refuge for 2009. The most recent economic indicators for US consumer confidence fell sharply in February 2009 to its lowest level since 1967. Besides the extensive governmental stimuli packages, the second round effects from declining commodity prices in general and the low oil price in particular seem the only ingredients stimulating private consumption and hence GDP growth. A lower oil price impacts disposable income (i.e. potential consumer spending) almost like a wage increase or a tax cut. The primarily difference is that the consumption subsidy is at the expense of the oil exporting country not the domestic government (as is the case with the fiscal stimuli packages). That is to say that a considerably redistribution of income from oil exporting to oil importing countries takes place when the oil price declines.
Danish Ship Finance 28
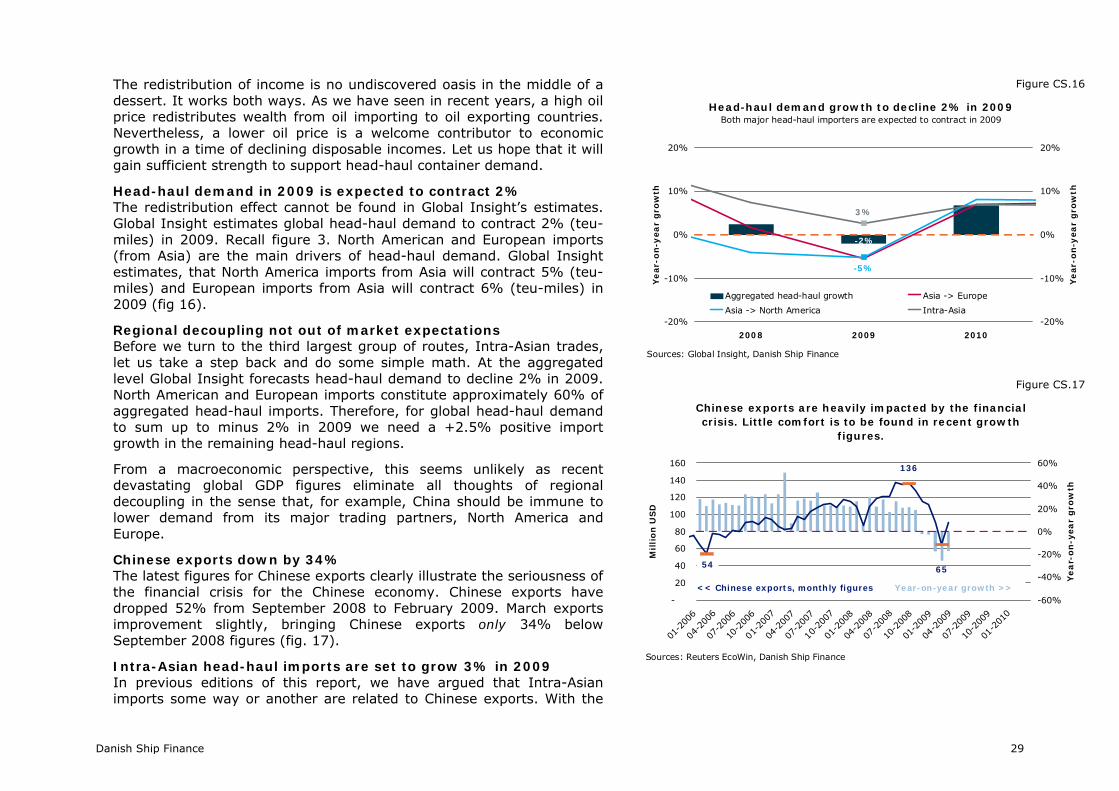
The redistribution of income is no undiscovered oasis in the middle of a dessert. It works both ways. As we have seen in recent years, a high oil price redistributes wealth from oil importing to oil exporting countries. Nevertheless, a lower oil price is a welcome contributor to economic growth in a time of declining disposable incomes. Let us hope that it will gain sufficient strength to support head-haul container demand.
Figure CS.16
Head-haul demand growth to decline 2% in 2009Both major head-haul importers are expected to contract in 2009
-5%
3%
-20%
-10%
0%
10%
20%
2008 2009 2010
Year-
on-y
ea
r gro
wth
-20%
-10%
0%
10%
20%
Year-
on-y
ea
r gro
wth
Aggregated head-haul growth Asia -> Europe
Asia -> North America Intra-Asia
Sources: Global Insight, Danish Ship Finance
-2%
Figure CS.17
Chinese exports are heavily impacted by the financial crisis. Little comfort is to be found in recent growth
figures.
54 65
136
-
20
40
60
80
100
120
140
160
01-2
006
04-2
006
07-2
006
10-2
006
01-2
007
04-2
007
07-2
007
10-2
007
01-2
008
04-2
008
07-2
008
10-2
008
01-2
009
04-2
009
07-2
009
10-2
009
01-2
010
M
illi
on U
SD
-60%
-40%
-20%
0%
20%
40%
60%
Yea
r-on
-yea
r gro
wth
Sources: Reuters EcoWin, Danish Ship Finance
<< Chinese exports, monthly figures Year-on-year growth >>
Head-haul demand in 2009 is expected to contract 2% The redistribution effect cannot be found in Global Insight’s estimates. Global Insight estimates global head-haul demand to contract 2% (teu-miles) in 2009. Recall figure 3. North American and European imports (from Asia) are the main drivers of head-haul demand. Global Insight estimates, that North America imports from Asia will contract 5% (teu-miles) and European imports from Asia will contract 6% (teu-miles) in 2009 (fig 16).
Regional decoupling not out of market expectations Before we turn to the third largest group of routes, Intra-Asian trades, let us take a step back and do some simple math. At the aggregated level Global Insight forecasts head-haul demand to decline 2% in 2009. North American and European imports constitute approximately 60% of aggregated head-haul imports. Therefore, for global head-haul demand to sum up to minus 2% in 2009 we need a +2.5% positive import growth in the remaining head-haul regions.
From a macroeconomic perspective, this seems unlikely as recent devastating global GDP figures eliminate all thoughts of regional decoupling in the sense that, for example, China should be immune to lower demand from its major trading partners, North America and Europe.
Chinese exports down by 34% The latest figures for Chinese exports clearly illustrate the seriousness of the financial crisis for the Chinese economy. Chinese exports have dropped 52% from September 2008 to February 2009. March exports improvement slightly, bringing Chinese exports only 34% below September 2008 figures (fig. 17).
Intra-Asian head-haul imports are set to grow 3% in 2009 In previous editions of this report, we have argued that Intra-Asian imports some way or another are related to Chinese exports. With the
Danish Ship Finance 29

Figure CS.18
The supply surplus is set to explode at 14% in 2009 with a negative demand growth of 2%
13% 12%
2%
-2%
-20%
-10%
0%
10%
20%
30%
40%
2002
2003
2004
2005
2006
2007
2008
2009
2010
2011
Yea
r-o
n-y
ear
gro
wth
-20%
-10%
0%
10%
20%
Dif
fere
nce
be
twee
n d
em
an
d
an
d s
upp
ly
Sources: Clarksons, Global Insight, Danish Ship Finance
<< Supply Growth (teu-NM)
<< Demand Growth (teu-NM)
Difference between Demand and Supply >>
11% 14%
Figure CS.19
Container freight rates are expected to decline in 2009Three scenarios for global head-haul demand: -2% / +5% / +10%
1,217
1,274
1,432
1,135
1,000
1,100
1,200
1,300
1,400
1,500
1,600
1,700
2000
2001
2002
2003
2004
2005
2006
2007
2008
2009
2010
2011
2012
U
SD
/d
ay
+10% growth
+5% growth
-2% growth
Sources: Global Insight, Clarkson, Danish Ship Finance
Container vessels are expected to flood the market while the outlook for Container head-haul demand is bleak. Nominal fleet capacity is expected to increase 12%, whereas head-haul demand is expected to contract 2% in 2009 (fig. 18). Thus, the supply surplus is expected to peak at 14% in 2009. In terms of nominal utilization of the container fleet, such a large supply surplus is expected to have a significant impact on rates and asset values. However, taking into account the extensive supply reducing initiatives the reality might turn out differently.
latest figures for Chinese exports we find it unlikely that China is about to drive Intra-Asian trade to +3% growth in 2009. We might be wrong. Global Insight forecasts Intra-Asian trade to grow +3% in 2009. Figure 16 summarizes Global Insight’s expectations for head-haul import growth in 2009.
Nevertheless, our forecast model is based on nominal supply growth (speed adjusted) and Global Insight’s trade statistic transformed into head-haul figures adjusted for travel distances. Besides Global Insight’s demand forecast we present two additional demand scenarios: 1) head-haul demand growth of +5% and 2) head-haul demand growth of +10%. In previous editions of this report, we have dealt with the old market convention that container demand is expected to grow three times the growth rate of world GDP (for example 3 x 4% = 12%). Back then, we estimated a different relation between global GDP growth and container demand growth namely 6% plus world GDP growth (for example 6% + 4% = 10%).
Figure 19 illustrates the expected average head-haul freight rate in the three different scenarios. It is important to notice that our freight rate forecast is a weighted average of all major head-haul routes why a certain forecast cannot be translated into expectations for a particular route or operator. The freight rate forecast is logically highly dependent on the expectations for supply and demand. As discussed above, the demand outlook might potentially undershoot these scenarios and the actual supply available will most likely undershoot nominal figures as some vessels either will be laid up, cascaded or scrapped. Nevertheless our model forecasts a drop in freight rates in the range of 10-20% in 2009. ■
Supply surplus is expected to peak at 14% in 2009
Container freight rates to drop 10-20% in 2009
Danish Ship Finance 30

Dry Bulk THE GOLDEN DAYS FOR DRY BULK SHIPOWNERS SEEM OVER. FREIGHT RATES TUMBLED IN 2008 AND ASSET VALUES FOLLOWED. SHORT TERM RETURN-ON-EQUITY MOMENTARILY DROPPED INTO THE RED. THE FUTURE SEEMS BLEAK WITH LOWER GLOBAL DEMAND IN GENERAL, LOWER CHINESE DEMAND IN PARTICULAR AND A HUGE ORDERBOOK. GOVERNMENTS ARE FIGHTING THESE NEGATIVE TENDENCIES WITH EXTENSIVE MONETARY AND FISCAL STIMULI PROGRAMS. LET US HOPE THAT THEY WILL BE SUCCESSFUL!
Figure DB.1
The Baltic Dry Index both peaked and bottomed out in 2008
11,440
2,298
715-
2,000
4,000
6,000
8,000
10,000
12,000
14,000
2000
2001
2002
2003
2004
2005
2006
2007
2008
2009
2010
Ba
ltic
Dry
In
dex
Sources: Clarkson, Danish Ship Finance
Figure DB.2
Current 3-year timecharter rates seem to have left the inflated levels of recent years
26%36%
51%61%
-14%-20% -18% -24%
-
6,000
12,000
18,000
24,000
30,000
36,000
Handysize Handymax Panamax Capesize
US
D/day
-100%
-67%
-33%
0%
33%
67%
100%
Cu
rre
nt
/ A
vera
ge
*
1992-2002 average 1998-2008 average 1999 low2009 average 2009 / 1992-2002 avg* 2009 / 1998-2008 avg*
Sources: Clarkson, Danish Ship Finance
FREIGHT RATES
THE DRY BULK MARKET COLLAPSED IN 2008
There is not much haze surrounding freight rates in 2008. They peaked in May and subsequently bottomed out (fig. 1). In May 2008, the Baltic Dry Index peaked at an astonishing 11,440. Next it seemed that an avalanche had been triggered, launching an unprecedented drop in the Index. Since May the BDI has dropped 94% and bottomed out at an all time low of 715 in November 2008 (monthly data, lowest daily Index 663). The low level was critical for Dry Bulk transportation as earnings per day temporarily dipped below the operating expenses (OPEX). Fortunately, the Dry Bulk market recovered somewhat in early 2009 and entered March above Index 2,000. Timecharter rates were racing below the 1998-2008 average Neither had timecharter rates remained unscathed. The inflated levels from the recent years are gone. Current 3-year Capesize timecharter rates are on average 24% below the 1998-2008 average, and more than 60% lower than the 1992-2002 average (fig. 2).
Danish Ship Finance 31

SUPPLY & DEMAND Figure DB.3
World Steel Production has declined from September 2008
-24%
700
800
900
1,000
1,100
1,200
1,300
01-2
005
07-2
005
01-2
006
07-2
006
01-2
007
07-2
007
01-2
008
07-2
008
01-2
009
07-2
009
01-2
010
Mil
lion
To
nne
s
-42%
-28%
-14%
0%
14%
28%
42%
Yea
r-o
n-y
ea
r gro
wth
<< World Steel Production
Sources: Reuters EcoWin, Danish Ship Finance
Figure DB.4
Current Chinese steel production significantly below production capacity
300
350
400
450
500
550
600
01-2
007
04-2
007
07-2
007
10-2
007
01-2
008
04-2
008
07-2
008
10-2
008
01-2
009
04-2
009
Mil
lio
n T
onn
es
-30%
-20%
-10%
0%
10%
20%
30%
Year-
on
-ye
ar
gro
wth
Estimated Production Capacity
Chinese Steel ProductionSources: Reuters EcoWin, Danish Ship Finance
Year-on-year growth >>
ANNUAL DRY BULK DEMAND GROWTH REACHED 9% ON A TON-MILES BASIS IN 2008. WITH A RECORDED SUPPLY GROWTH OF 7%, THE SUPPLY-DEMAND BALANCE WAS WELL IN FAVOUR OF SHIPOWNERS. HOWEVER, AS THE SECOND HALF OF 2008 UNFOLDED, IT BECAME EVIDENT THAT MASSIVE CHANGES WERE ABOUT TO HIT HARDER AND QUICKER THAN ANTICIPATED. THE SLOWDOWN IN THE GLOBAL ECONOMY SUBSTANTIALLY REDUCED THE DEMAND FOR DRY BULK TONNAGE.
In our previous Shipping Market Review, the topic for the future was that excess tonnage supply and waning demand would bring an end to the supercycle. More precisely, it was not so much a question of whether the supercycle was about to collapse, but a question of when and by how much. The orderbook was acknowledged as too large to be absorbed by demand. Nonetheless, the alarm sounded louder and earlier than we anticipated.
The world economy in meltdown The waves from the credit crunch continued to spread throughout the second half of 2008. The impact on global GDP in general and Chinese GDP growth in particular has been daunting. Fourth quarter GDP in the OECD area fell by a record-low 1.5%, whereas Chinese GDP growth fell to +6.8% - the lowest level since 2001.
Lower investment and construction activities brought Dry Bulk demand to its knees. The impact on global investment activities and construction volumes was devastating. Many resource-intensive heavy industries were brought to a halt which had an impact on commodity demand and prices. Steel production and consumption summarize the impact on Dry Bulk demand.
World steel production contracted Despite strong growth in global steel consumption during the first half of 2008, global steel production still ended 1.8% below the 2007-level. In the fourth quarter of 2008, global steel production declined 19% year-on-year. This was a remarkable shift in the trend, global steel production having on average increased 8% per year on year between 2002 and 2007 (fig. 3).
Danish Ship Finance 32

Chinese steel production down 18% Figure DB.5
Iron ore inventory withdrawls at China's major ports
-
15
30
45
60
75
90
09-2
007
12-2
007
03-2
008
06-2
008
09-2
008
12-2
008
03-2
009
Milli
on
to
nne
s
-30%
-20%
-10%
0%
10%
20%
30%
Mo
nth
-on
-month
gro
wth
Sources: Bloomberg, Danish Ship Finance
<< Chinese iron ore inventory at major ports
Monthly inventory change >>
Figure DB.6
Demolition activity has increased remarkably in fourth quarter 2008 - almost absorbing the entire inflow of
new tonnage
6.3 6.1 5.8 6.4 6.0 5.9 5.36.6
-0.2
-5.0
(9)
(6)
(3)
-
3
6
920
07-Q
1
2007
-Q2
2007
-Q3
2007
-Q4
2008
-Q1
2008
-Q2
2008
-Q3
2008
-Q4
Mil
lio
n D
wt
(9)
(6)
(3)
-
3
6
9
Mil
lion D
wt
<< Total Quarterly Dry Bulk Delivery
Total Quarterly Dry Bulk Demolition >>
Sources: Clarkson, Danish Ship Finance
The world’s largest steel exporter was of course heavily impacted by the lower global steel consumption. From September to December 2008, Chinese steel production declined 18%. Chinese steel production bottomed out in November 2008 at 423 million tonnes. With an estimated steel production capacity of 540 million tonnes, Chinese steel mills are running significantly below capacity (fig. 4).
Iron ore production turned into surplus The chain reaction continued. Global iron ore demand dropped and inventories were aggressively wound down. In China, the iron ore inventories declined 20% from September to December 2008. Figure 5 illustrates the monthly movements in the Chinese iron ore stock.
The traditional market cure to bring back the balance between supply and demand involves declining prices. Unfortunately, this medicine does not work on iron ore. Iron ore prices do not reflect short-term market movements, but are negotiated on an annual basis between iron ore miners and (Chinese) steel mills.
India is the only supplier adjusting prices to market conditions. Thus, the 60% drop in Indian iron ore spot prices clearly illustrates the seriousness of the imbalance.
Iron ore demand declined 22% in fourth quarter 2008 The combination of lower iron ore consumption and inventory withdrawals is a dangerous cocktail for Dry Bulk demand. According to SSY, global iron ore trade dropped 22% in fourth quarter compared to third quarter volumes. This is by far the single most important factor behind the collapse in freight rates.
Coal demand - a light in the dark Demand for steam coal increased approximately 8% from third to fourth quarter 2009. Steam coal is thereby the only major Dry Bulk commodity to have maintained momentum in fourth quarter 2008. Metallurgical (coking) coal demand dropped 11% from third to fourth quarter as the world steel production declined.
Danish Ship Finance 33

More than waning demand behind freight rate collapse Figure DB.7
The drop in 5-year-old Capesize prices brings price below replacement cost
-
50
100
150
06-2
007
09-2
007
12-2
007
03-2
008
06-2
008
09-2
008
12-2
008
03-2
009
06-2
009
Mil
lio
n U
SD
0
50
100
150
200
Mil
lio
n U
SD
Sources: Clarkson, Danish Ship Finance << Capesize price << Estimated value
153
49
-68%
Figure DB.8
The dramatic contracting activity suddently began to fade - close to no new contracts registered in 2009
-
5
10
15
20
25
3020
07-Q
1
2007
-Q2
2007
-Q3
2007
-Q4
2008
-Q1
2008
-Q2
2008
-Q3
2008
-Q4
2009
-Q1
Mil
lio
n D
WT
-
5
10
15
20
25
30
Mil
lio
n D
WT
Capesize Panamax Handymax HandysizeSources: Clarkson, Danish Ship Finance
For the last several quarters, port congestion has effectively lowered the Dry Bulk fleet’s cargo-carrying capacity. This has supported freight rates, even in cases of low demand growth. With the fourth quarter collapse in steel production (iron ore trade), port congestion evaporated gradually, facilitating, in effect the cargo-carrying capacity of the fleet effectively increased to nominal capacity. Fortunately, demolition activity re-entered the arena (fig. 6). It would be wrong to claim that the strong demolition activity saved the day for shipowners, but the floor for freight rates had evidently been raised as 5 million dwt left the Dry Bulk fleet in the fourth quarter of 2008.
CONTRACTING & SHIP VALUES
THE EFFECTIVE OVERSUPPLY OF TONNAGE BECAME OBVIOUS WHEN THE THREE-YEAR TIMECHARTER RATE DROPPED 66% FROM SEPTEMBER TO OCTOBER 2008. CONTRACTING ACTIVITY AND ASSET VALUES DROPPED INSTANTLY.
Asset values dropped more than 60% in six months The asset price response to lower timecharter rates was sudden and profound. The price for a five-year-old Capesize vessel dropped nearly 70 % from its high level in August 2008 to its much lower level in February 2009 (fig. 7).
Current secondhand prices reflect oversupply of tonnage The critical question to be answered is whether this drop represents an overreaction (i.e. simply a negative illiquidity premium) or core fundamentals. We argue that the lower asset values reflect lower future demand for Dry Bulk commodities and a fear of oversupply of tonnage. Here is why.
Newbuilding prices are sticky in a low market In recent Shipping Market Reviews we have argued that asset prices have a tendency to disconnect from fundamentals in a high market. Some market participants explain this through the introduction of an additional option premium generated from high volatility in earnings. In a distressed market, newbuilding prices are too sticky to call short-term movements in asset values on a timely basis. That explains why the estimated replacement cost approach to vessel
Danish Ship Finance 34

values overestimate vessel prices when the market sentiments drop below zero. This is illustrated in figure 7 where replacement cost (the orange bar) is above current prices (the blue pillar). For an introduction to the replacement cost approach please read “Our Approach to Ship Value”.
Figure DB.9
It has once again become more expensive to buy a new vessel rather than a 5-year-old Capesize vessel
-
20
40
60
80
100
120
140
1992
1993
1994
1995
1996
1997
1998
1999
2000
2001
2002
2003
2004
2005
2006
2007
2008
2009
Mil
lio
n U
SD
-
20
40
60
80
100
120
140
Millio
n U
SD Newbuilding price
5 Year Old Secondhand Price
Sources: Clarkson, Danish Ship Finance
Figure DB.10
Newbuilding prices will have to drop 20-25% for secondhand prices and replacement cost to balance
-30%
-20%
-10%
0%
10%
20%
30%
1992
1993
1994
1995
1996
1997
1998
1999
2000
2001
2002
2003
2004
2005
2006
2007
2008
2009
Ch
ang
e i
n n
ew
bu
ild
ing p
rice
-30%
-20%
-10%
0%
10%
20%
30%
Cha
ng
e i
n n
ew
bu
ild
ing p
rice
Sources: Clarkson, Danish Ship Finance
Accuracy of newbuilding prices relates to contracting activity If there is any demand expectation behind Dry Bulk contracting activity, shipowners finally seem to agree that future demand is more than covered by the current orderbook. Thus, contracting activity in fourth quarter of 2008 and first quarter of 2009 came to a hold (fig. 8). Nevertheless, the aggregated contracting activity in 2008 reached almost 85 million dwt. In any case, this number is much larger than potential fleet replacement in years to come.
An important implication of the limited contracting activity during the last quarter of 2008 and the first months of 2009 is that assessment of the newbuilding price has become highly uncertain.
Extensive cancellations might depress newbuilding prices According to Clarkson, Capesize newbuilding prices have dropped 27% from September 2008 to February 2009. The apparently long delivery time seems to make newbuilding prices sticky because most shipyards are expected to have sufficient order cover. The market rumours related to the extensive cancellations question the accuracy of these estimated delivery times. Substantial cancellations will effectively lower delivery times and hence put downward pressure on newbuilding prices. This indicates that our replacement cost approach to secondhand prices might overestimate secondhand values indicating further newbuilding price adjustments.
Newbuilding prices to drop 25% According to our estimates, the Capesize newbuilding price will have to drop a further 25% to balance current prices and replacement costs. That is to say that our estimated equilibrium Capesize newbuilding price is USD 58 million compared to the latest actual February figure of USD 72 million. Such a drop will bring the replacement cost in line with current secondhand prices and the residual required earning back to the long-term average of USD 15,000 per day (fig. 10).
Danish Ship Finance 35

Current secondhand prices reflect oversupply of tonnage We argue that current secondhand prices reflect lower demand expectations and hence a general market outlook where future tonnage supply by far exceeds future demand for Dry Bulk tonnage.
Low ROE contributed to lower secondhand values One of the essential components explaining short-term movements in secondhand values is the short-term return on equity (ROE). If the short-term ROE turns below the required return on equity (i.e. 15%) secondhand prices are expected to decline until equilibrium is re-established (see “Our Approach to Ship Values”).
The sudden reduction in timecharter earnings by the end of third quarter 2008 impacted short-term ROE significantly. From a 30% ROE in September, the lower timecharter rate in October drove ROE below zero. ROE improved during the last months of the year and the first two months of 2009 because the secondhand values adjusted to the lower earnings (fig. 11). On an annual basis, 2008 ROE averaged 32% (38% in 2007), whereas the first two months of 2009 averaged 15%. From a ROE perspective, we do not expect secondhand prices to adjust further (at current timecharter rates).
Secondhand prices seem to be in balance Long-term exposure in asset prices is measured as the residual required earnings per day after expiry of a three-year timecharter contract. That is to say, we estimate the break-even timecharter equivalent which is required to facilitate current prices. The higher the daily residual earnings requirements climb, the higher the risk attached to the asset values. The residual required earnings for a five-year-old Capesize vessel have increased substantially during the last five years. Residual required earnings peaked in 2008 at an average of almost USD 30,000 per day for the remaining 17 years (= 25-5-3 years). During the first months of 2009 this requirement has dropped more than 30% to USD 19,500 per day. This is still approximately USD 5,000 above the long term average (1992-2008), but much less inflated than the levels of 2007 and 2008 (fig. 12). Nevertheless, this does not mean that there is no risk of further asset value depreciations. If the timecharter rate declines further, asset values will most likely follow suit.
Figure DB.11
High prices for five-year-old Capesize vessels temporarily drove return on equity below zero during
three-year timecharter period.
37
% 46
%
42%
43
%
42
%
43
% 48%
42
%
30
%
0%
13
%
16
%
-2%
-2%
-30%
-15%
0%
15%
30%
45%
60%
01-2
008
02-2
008
03-2
008
04-2
008
05-2
008
06-2
008
07-2
008
08-2
008
09-2
008
10-2
008
11-2
008
12-2
008
01-2
009
02-2
009
03-2
009
04-2
009
Retu
rn o
n e
qu
ity
-30%
-15%
0%
15%
30%
45%
60%
Re
turn
on
eq
uit
y
Sources: Clarkson, Danish Ship Finance
Figure DB.12
Five-year-old Capesize: Required timecharter equivalent after end charter period are entering territory of the
historical average
-
15,000
30,000
45,000
60,000
75,000
90,000
1993
1995
1997
1999
2001
2003
2005
2007
2009
2011
USD
/da
y
-
15,000
30,000
45,000
60,000
75,000
90,000
USD
/day
3-year timecharter rate
Required earnings per day in the remaining 17 years
Sources: Clarkson, Danish Ship Finance
Danish Ship Finance 36

OUTLOOK
OVERCAPACITY AND WANING DEMAND DOMINATE THE DRY BULK OUTLOOK. THE FUTURE FOR FREIGHT RATES AND ASSET VALUES DEPEND ONCE AGAIN ON CHINA’S ABILITY TO GENERATE DRY BULK DEMAND. THE RESPONSIBILITY FOR ABSORBTION OF THE ORDERBOOK IN 2009 AND 2010 IS INSURMOUNTABLE TO BEAR, EVEN FOR CHINA.
EXECUTIVE SUMMARY The engines of the world economy sputter In recent months, global GDP growth has been reversed downwards again and again as the financial turmoil has spread into most asset classes, facilitating global wealth destruction and waning consumer demand. The impact on the main engines of the world economy has been colossal. The IMF expects advanced economies to contract 2% in 2009, whereas emerging and developing economies are expected to grow 3.3%. This is by far the worst macroeconomic outlook in many years.
Extensive monetary and fiscal stimuli programs are intended to bolster global demand Governments around the world are fighting the recessionary tendencies through ambitious stimuli programs. Certainly, these programs are the largest and most extensive uses of taxpayer’s money in memory. Currently, it is too early to incorporate them into global trade forecasts, but let us hope that they will contribute significantly to higher global growth and hence a more positive trade outlook.
Dry Bulk demand in the eye of the storm Obviously reflecting the global macroeconomic outlook, Dry Bulk demand is in the eye of the storm. The primary medium reflecting Dry Bulk demand is the global steel industry and its derivatives (i.e. iron ore and coal). As we argued in Supply and Demand above, the world steel production has declined by a great magnitude. With the current macroeconomic outlook, not much indicates a immediate recovery. Thus the 2009 demand outlook for Dry Bulk vessels is expected to be heavily impacted for some time to come.
China is not expected to save Dry Bulk demand Chinese steel production has been the primary driver behind recent years’ high market. There are no signs of a replication, even though China is expected to present high growth figures. In fact, we expect Chinese steel production capacity to decline in 2009 as inefficient steel mills are closed.
Low Dry Bulk demand in 2009 For 2009, we expect Chinese Dry Bulk demand to reach a 10-year low with an annual growth rate of 4% (compared to 22% in 2008). Chinese Capesize demand is expected to increase 3% in 2009 (compared to 23% in 2008). Global Dry Bulk demand is expected to contract 1.6% in 2009 (compared to +9.1% in 2008) whereas global Capesize demand is expected to decline 2.9% in 2009 (compared to +9% in 2008).
Potential low Dry Bulk fleet growth in 2009 The expected delivery schedule for 2009 is a bit frightening, for no less than 69.5 million dwt could potentially enter service. If scrapping activity does not increase, the combined Dry Bulk fleet is expected to grow 15% on an annual basis. Fortunately, the scrapping potential is high as 71.5 million dwt is older than 25 years and hence qualifies for scrapping. Therefore, if all vessels older than 25 years are scrapped in 2009, the combined fleet growth is expected to be negative. The age distribution is unfortunately not equally distributed. The scrapping potential for Capesize vessels is by no means a match for expected deliveries and the Capesize fleet is therefore expected to grow 15 % in 2009.
1-year timecharter rates are expected to plummet The large orderbook is expected to send timecharter rates a good way south. In our low case scenario Capesize timecharter rates are expected to average USD 15,000 per day in 2009 and could move even lower in 2010.
---o0o---
Danish Ship Finance 37

WHY WE EXPECT CHINESE DRY BULK DEMAND TO UNDERSHOOT
CURRENT FORECASTS:
Fiscal stimuli are expected to drive Chinese growth Recent devastating global GDP figures eliminate all thoughts of regional decoupling in the sense that China would be immune to lower demand from its major trading partners, North America and Europe.
Obviously, as China is partly an export-driven economy (and partly reliant on construction activity) a dramatic slowdown in exports lowers Chinese GDP growth. Consequently, GDP growth bottomed in the fourth quarter of 2008 at 6.8% (4Q07 11.7%). Annualised GDP growth for 2008 ended at 9% – the lowest level since 2001, according to official figures.
Disregarding the low fourth quarter growth, the Chinese government has announced that it will generate 8% GDP growth in 2009.
Various growth stimuli are not equally steel intensive The analysis could stop here by concluding that the Chinese Dry Bulk demand will decline slightly in 2009 because Chinese GDP growth is expected to drop 1 percentage point compared to the 2008 level. That would be a mistake! We argue that the Chinese government is about to change fuel type (and hence steel intensity) as one of the two main engine sputters. Traditionally, the Chinese growth train has been pulled by two engines: exports and fixed asset investments.
One engine is to pull the train towards 8% GDP growth As discussed above, the macroeconomic outlook in North America and Europe leaves little room for a recovery in Chinese exports for the next year or two.
This introduces a significant constraint to Chinese economic growth because it damages one of the two main engines driving the Chinese GDP growth. With only one main engine, a return to double-digit growth figures seems extremely unlikely.
A third growth engine is required for future growth China is still awash with capital and has a credit and fiscal position that is much stronger than most other countries. There is therefore plenty of room for sustained fiscal and monetary stimuli in the years to come. Nevertheless, even though government-facilitated growth may stabilize GDP growth (and the unemployment rate!), at a socially acceptable level, it cannot keep China running at 8% growth for more than a few years. A third growth engine has to be developed. The most likely engine to be turned on is private consumption. To increase private consumption, significant structural reforms are required. These structural reforms already seem initiated.
Fiscal stimuli to boost short-term domestic demand In November 2008, the Chinese government responded to the lower GDP growth by launching an Rmb 4 trillion (USD 586 billion) stimuli package. The package was intended to boost aggregated domestic demand through extensive infrastructure projects, affordable housing and more. However, as the global recession deepens, the Chinese authorities have announced an additional plan to “reinvigorate” key industrial sectors including steel, auto, shipbuilding, petrochemicals, textiles, non-ferrous metals, equipment manufacturing, light industries, and transportation and logistics. In contrast to many analysts, we do not expect this second round stimuli program to be a demand-boosting exercise, but rather a supply-cutting one.
… and adjust capacity to lower demand! Taught by history, the Chinese authorities have learned that demand-boosting measures are of little help if the negative demand shock is large and permanent. In this case, the only sustainable policy plan is to systematically downsize and consolidate the domestic production capacity, which is also what the stimuli programs are all about.
Limited impact on Dry Bulk demand of new fiscal plan Accordingly, the Chinese government has adjusted the spending composition under the original Rmb 4 trillion stimuli plan. Compared to the original plan, the revised plan
Danish Ship Finance 38

substantially reduces spending on hard infrastructure (steel intensive) projects and correspondingly increases spending on soft infrastructure such as medical, healthcare, cultural and education.
The first step in this direction was taken in January 2009 when the Chinese government announced a three-year Rmb 850 billion (USD 125 billion) plan to create a universal basic health insurance system. Without a large-scale social welfare spending program, the relevance in terms of short-term GDP growth might be minor. However, as exports-generated growth wanes, it is vital that the Chinese government invests in projects enabling private consumption to contribute further to GDP growth.
To understand the importance of this policy change, we need to take a step back and look at the Chinese transition process.
The breaking of the “iron rice bowl” A less discussed implication of the double-digit growth period is the transformation of the Chinese labour market. In the past, state-owned enterprises covered social security for employees and their families from cradle to grave. During the transition process, this was abated, because tax income was insufficient to cover public expenditures. Accordingly, healthcare and education have become a private rather than a public expenditure.
The impact on private consumption has been significant as the risk of citizens having to bear large health (and education) expenditures have driven the rise in private savings. Obviously, higher savings lower the ability to consume.
The savings rate has increased beyond the optimal point for private consumption and hence GDP growth There is a firm long-term relationship between GDP growth and consumption. If they disconnect for too long, a demand-side correction will facilitate a return to a new and lower equilibrium. This is exactly what is about to happen in China today and thus the primary reason for the urgent shift in the fiscal stimuli program; private consumption must increase in
order to generate a high and sustainable long-term GDP growth.
The banking system plays a central role Not surprisingly, the financial infrastructure facilitating private consumption is in a poor condition. Traditionally, you borrow against future income when you are young, at working age you save and pay your debts, and you spend your savings when you retire.
The undeveloped Chinese financial system lacks the ability to supply the instruments allowing consumers to borrow against future income. This is the second most important factor behind the high savings rate. Combined with a low real return on deposits and increasing expenditures, it is not surprising that the savings rate has increased beyond the optimal point for GDP growth.
Non-performing loans may re-enter the scene A well-functioning banking system is a prerequisite for adequate access to capital and hence GDP growth. This is what the major monetary stimuli programs are all about.
We have not forgotten previous concerns about the sustainability of the Chinese banks’ credit policy and hence the credit quality of the balance sheets. In a time with waning exports, a rebalance of the growth model and supply-side adjustments, we are worried about the old snake in the grass - non-performing loans. It is not more than 10 years ago that an extensive non-performing loan burden forced the Chinese government to recapitalise three out of four of the major state-owned banks. Let us hope that the Chinese banking sector, for one reason or another will go through these tough times without major problems.
To sum up, we expect a short-term demand-boosting stimuli focusing on fixed asset investment. For the medium and long-term we expect a changed growth model there is expected to lower the steel intensity of the Chinese economy and hence lower Chinese Dry Bulk demand.
Danish Ship Finance 39

DEMAND IN 2009 AND BEYOND Figure DB.13
Dry Bulk demand growth to contract 1.6% in 2009Capesize demand growth is expected to contract 2.9%
-10%
-5%
0%
5%
10%
15%
20%
1997
1998
1999
2000
2001
2002
2003
2004
2005
2006
2007
2008
2009
2010
2011
2012
Ye
ar-
on
-yea
r gro
wth
-10%
-5%
0%
5%
10%
15%
20%
Yea
r-o
n-y
ea
r gro
wth
Sources: Global Insight, Danish Ship Finance
<< Dry Bulk demand growth, all commodities
Capesize demand growth >>
2009
Figure DB.14
Chinese Dry Bulk demand to grow modest 4% in 2009. Chinese Capesize demand expected to increase 3% in 2009
0%
10%
20%
30%
40%
50%19
9719
9819
9920
0020
0120
0220
0320
0420
0520
0620
0720
0820
0920
1020
1120
12
Year-
on-y
ear
gro
wth
0%
10%
20%
30%
40%
50%
Year-
on
-yea
r gro
wth
Sources: Global Insight, Danish Ship Finance
<< Chinese Dry Bulk demand growth, all commodities
Chinese Capesize demand growth >>
THE INTERNATIONAL FINANCIAL CRISIS IS EXPECTED TO DRIVE GLOBAL DRY BULK DEMAND IN DECLINE. DRY BULK DEMAND IS EXPECTED TO DECLINE 1.6% IN 2009.
Global Dry Bulk demand to contract 1.6% in 2009 The global economic slowdown is expected to impact Dry Bulk demand significantly. According to Global Insight, global Dry Bulk demand is expected to contract 1.6% whereas global Capesize demand is expected to contract 2.9% in 2009 (ton-miles) (fig. 13).
Declining Chinese Dry Bulk demand growth in 2009 As discussed above, we expect a long-term rebalanced growth strategy in China. This is expected to lower the long-term steel intensity of the Chinese economy. In combination, these factors bode ill for Chinese Dry Bulk demand in the future.
The essential question is of course whether we have encapsulated the major trend in the Chinese economy. To be honest, we have expected these factors to lower Chinese Dry Bulk demand for some time. Clearly it has not happened yet. The critical issue is therefore if we simply cried wolf or sounded the alarm too early? Obviously, we expect the latter, but it might be that the Chinese growth paradigm – once again - takes us by surprise and expand through labour-intensive heavy industries.
For 2009 the essential question is therefore whether fixed asset investments in general and construction activity in particular will continue to be the favourite GDP boosting channel. In the name of job creation and social stability we expect so.
Chinese Dry Bulk demand hits a 10-year low in 2009 To some extent, Global Insight seems to share our expectations, as the Chinese Dry Bulk demand growth is expected positive. Nevertheless, they expect Chinese Dry Bulk demand growth to hit a 10-year low. Accordingly, Chinese Dry Bulk demand is expected to grow 4% on a ton-miles basis. This might reflect lower growth in Chinese steel consumption per capita (i.e. a weak domestic construction outlook). Demand for Capesize-borne commodities is likewise expected to hit a 10-year low with a 3% increase in 2009 (ton-miles) (fig. 14).
Danish Ship Finance 40

SUPPLY IN 2009 AND BEYOND Figure DB.15
More than four times the expected fleet replacement are scheduled for delivery in 2009
-
1
2
3
4
5
6
7
8
2007 2008 2009 2010 2011
Rati
o (
De
livery
/ F
leet
Rep
lace
me
nt)
Capesize Panamax Handymax HandysizeSources: Clarkson, Danish Ship Finance
Figure DB.16
More than 71 million dwt of the Dry Bulk fleet is older than 25 year by 2009. If every vessel is scrapped in
2009 the year will show negative fleet growth.
(150)
(100)
(50)
-
50
100
150
2007 2008 2009 2010 2011 2012
Milli
on
Dw
t
Capesize Panamax Handymax Handysize
Deli
very
Pote
nti
al S
crappin
g
Sources: Clarkson, Danish Ship Finance
- 71.5 Mdwt
+69.5 Mdwt
THE ORDERBOOK FOR 2009 AND 2010 IS ALARMING. IF 66% OF THE 2009 ORDERBOOK AND 79% OF THE 2010 ORDERBOOK NEVER REACH THE SEA, FOR ONE REASON OR ANOTHER, ANNUAL DELIVERIES WILL STILL AVERAGE THE ANNUAL DELIVERIES OF 2008.
Oversupply is looming in 2009 and 2010 To put it simple, the scheduled deliveries for 2009 are approximately four times larger than the expected fleet replacement. For 2010 this number is expected to reach 5.5 (fig. 15). Expected replacement is obviously only a rough indicator assuming 1) that all vessels are replaced by the age of 25 and 2) that the fleet is equally distributed between ages. Clearly, there is more to contracting activity than fleet replacement needs.
Potential negative fleet growth in 2009 In 2009, 69.5 million dwt is scheduled to enter service whereas 71.5 million dwt qualifies for scrapping (i.e. are older than 25 years). Thus, if all vessels older than 25 years are scrapped, the combined fleet might actually decline in 2009. As illustrated by figure 16, the scrapping potential is not equally distributed among segments. The Handysize segment accounts for approximately 48% of the scrapping potential whereas Capesize accounts for 45% of the annual inflow. Therefore, even as the aggregated numbers for 2009 seem to balance, the variety within the segments is large (fig. 16).
Risk of oversupply in 2010 at current figures For 2010 the picture is not better. The orderbook is 43 million dwt larger in 2010 (i.e. 112 million dwt) than in 2009, the scrapping potential is significantly smaller but fortunately for all agents involved in the Dry Bulk business, the cancellation potential is much larger as these newbuilding contracts are not yet under construction. The larger segments will be hurt the most as the scrapping potential is largest for the smaller segments. For example, the Capesize fleet is young and with the expected delivery in 2009 and 2010 it seems almost unfeasible to employ all the vessels. Extensive cancellations are already on the agenda. We expect layup could follow suit in the near future.
Danish Ship Finance 41

Figure DB.17
1-year Capesize timecharter rates to close 2009 at USD 14.700 per day
37,805
26,660
14,699
-
20,000
40,000
60,000
80,000
100,000
120,000
2005 2006 2007 2008 2009 2010 2011 2012
USD
/day
Historical TC-rate
Delivery 100%
Delivery 50%
Delivery 25%
Sources: Clarkson, Global insight, Danish Ship Finance
Figure DB.18
Expected trade growth versus required import growth to absorb the Capesize deliveries in 2009
-3.5% -1.8%
1.9%
-17.4%
4.5%
13.9%16.0%
20.4%23.4%
-2.4%
-30%
-15%
0%
15%
30%
Latin Americato Asia
Australia toAsia
Intra-Asia Latin Americato Europe
North Americato Asia
Year-
on-y
ear
gro
wth
Global Insight forecast
Required import growth to absorb the inflow ofnew tonnage in the Capesize segment in 2009
Sources: Global Insight, Danish Ship Finance
SHIPOWNERS ARE FIGHTING THE RISK OF OVERCAPACITY. THE OUTLOOK FOR DRY BULK DEMAND IS WORSENING MONTH AFTER MONTH. GOVERNMENTS AROUND THE WORLD ARE STRUGGLING TO STIMULATE DEMAND BY PUMPING LARGE AMOUNTS OF TAXPAYER’S MONEY INTO THE ECONOMIES. LET US HOPE THEY WILL STIMULATE GROWTH.
Asian imports to increase to balance supply and demand Figure 18 illustrates the required pick-up in Capesize commodity demand for the five major import regions in order to balance supply and demand (and freight rates!) in 2009. The required changes are large. For example, Asian imports from Latin America will have to increase 14% (yoy), compared to the current expectation of minus 3.5% from 2008 to 2009. This seems unlikely to happen.
This estimate is based on two critical assumptions. First, we assume that the entire orderbook will be delivered during 2009. Second, Capesize vessels older than 25 years will be scrapped in 2009. Combined, this gives us an estimated Capesize utilization rate of 75% in 2009, compared to 101% in 2008. Some might argue that the entire orderbook scheduled for delivery in 2009 will not be delivered. They might be right. Traditionally, a certain number of deliveries will be postponed to 2010 (fig. 16). In this case, the timecharter rate will exceed our expectation.
We expect the one-year Capesize timecharter rate to average USD 15,000 per day. Compared to the annual average of USD 111,000 per day in 2008, the forecast for 2009 is low (fig. 17).
Some analysts have argued that we are expected to see a pick-up in freight rates as for example the iron ore price negations are closed and the inventory build-up is taking off. This might be true, but has nothing to do with increased demand. It reflects nothing more than fluctuations caused by future price expectations and thus inventory adjustments. ■
Capesize 1 yr T/C rate at USD 14,500 per day in 2009
Freight rate volatility is expected to increase in 2009
FREIGHT RATE FORECAST FOR 2009 AND BEYOND
Danish Ship Finance 42

Glossary Aframax: Crude oil tanker or product tanker too
large to pass through the Panama Canal and below 120,000 dwt.
AHTS: Anchor Handling Tug Supply. Offshore vessel used for jobs such as the relocation of oil rigs and anchors of the oil rigs.
ARM: Adjustable Rate Mortgage. Mortgage loan with a variable interest rate that is being adjusted on a regular basis.
Back-haul: The leg of the trade route that has the lowest container volumes is often called ’back-haul, whereas the return leg is often referred to as ‘head-haul’.
Barrel: A volumetric unit measure for crude oil and petroleum products equivalent to 42 U.S. gallons, or approximately 159 litres.
BHP: Break Horse Power. The amount of engine horsepower.
Brent: Term used for crude oil from the North Sea. Brent oil is traded at the International Petroleum Exchange in London, and the price of Brent is used as a benchmark for several other types of European oil.
Bulk vessel: Description of vessels transporting large cargo quantities, including coal, iron ore, steel, corn, gravel, oil, gas, etc.
Bunker: Fuel for vessels. Call on OPEC: Defined as total global petroleum demand
minus non-OPEC supply minus OPEC natural gas liquid supply.
Capesize: Dry bulk carrier of more than approximately 80,000 dwt; too large to pass through the Panama Canal.
Cbm: Cubic Meter. Ceu: Car equivalent unit. Unit of measure
indicating the car carrying capacity of a vessel.
Cgt: Compensated Gross Tonnage. International unit of measure that facilitates a comparison of different shipyards’ production regardless of the types of vessel produced.
Clarkson: British ship brokering and research company. www.clarksons.net
Clean products: Refers to light, refined oil products such as jet fuel, gasoline and naphtha.
CoA: Contract of Affreightment. Contract between shipping company and shipper concerning the freight of a predetermined volume of goods within a given period of time and/or at given intervals.
CSR: Common Structural Rules. A common set of construction rules agreed by the leading international classification societies to be applied to all new construction contracts from April 1, 2006 between shipyards and shipowners for tankers of 150 m or more in length and bulk carriers of 90 m or more in length. The CSR require the ships to be built at a higher set of standards thus enabling the ships to trade for longer.
Dirty products: Refers to heavy oils such as crude oil or refined oil products such as fuel oil, diesel oil or bunker oil.
Drewry: Drewry Shipping Consultants Ltd. British shipping and transport research company. www.drewry.co.uk
Dwt: Dead Weight Tons. Indication of a vessel’s cargo carrying capacity (including bunkers, ballast, water and food supplies, crew and passengers).
Dynamic Positioning: Special instruments on board that in conjunction with bow thrusters and main propellers enable the ship to position itself
Danish Ship Finance 43

in a fixed position in relation to the seabed.
EIA: Energy Information Administration. A subsidiary of the US Department of Energy. www.eia.doe.gov
E&P: Exploration and Production. Fearnleys: Norwegian ship brokering and research
company. www.fearnleys.no Feeder: Small container carrier. FPSO: Floating Production Storage Offloading
unit. Vessel used in the offshore industry to process and store oil from an underwater (sub-sea) installation.
Geared: Indicates that a vessel is equipped with a crane or other lifting device.
Gearless: Indicates that a vessel is not equipped with a crane or other lifting device.
Global Insight: American economic consulting company. www.globalinsight.com
Gt: Gross Tons. Unit of 100 cubic feet or 2.831 cubic meters, used in arriving at the calculation of gross tonnage.
Handy, tank: Crude oil tanker, product tanker or chemical tanker of between 10,000 and 25,000 dwt.
Handymax, dry cargo: Dry bulk carrier of between approximately 40,000 and 60,000 dwt.
Handysize, dry cargo: Dry bulk carrier of between approximately 10,000 and 40,000 dwt.
Head-haul: The leg of the trade route that has the highest container volumes is often called ’head-haul, whereas the return leg is often referred to as ‘back-haul’. On routes where there is a great trading volume mismatch between head-haul and back-haul, the head-haul demand will most often determine the freight rate level.
IEA: International Energy Agency. A subsidiary of the OECD. www.iea.org
Imarex: International Maritime Exchange. www.imarex.com
IMO: International Maritime Organization. An organisation under the UN.
IMO I-III: Quality grades for tankers for the permission to transport different chemical and oil products. IMO I are the most hazardous products, IMO III the least hazardous.
Chemical tanker: Tanker with coated or stainless steel tanks (IMO I-III).
LOOP: Louisiana Offshore Oil Port. A deepwater port in the Gulf of Mexico off the coast of Louisiana. LOOP provides tanker offloading and temporary storage services for crude oil transported on some of the largest tankers in the world of which some are too large for U.S. inland ports.
LPG vessels: Liquefied Petroleum Gas. Vessels used to transport ammonia and liquid gases (ethane, ethylene, propane, propylene, butane, butylenes, isobutene and isobutylene). The gases are transported under pressure and/or refrigerated.
LR1, product tanker: Long Range 1. Product tanker with the maximum dimensions for passing through the Panama Canal (width of 32.21 metres and length of 289.5 metres) of approximately 50,000—80,000 dwt.
LR2, product tanker: Long Range 2. Product tanker too large to pass through the Panama Canal and larger than approximately 80,000 dwt.
Medium, tanker (MR): Medium Range. Product tanker of between 25,000 and 50,000 dwt.
MEW: Mortgage Equity Withdraw. Defined as equity extracted from existing homes via cash-out refinancing, home equity borrowing, and/or housing turnover.
Danish Ship Finance 44

Multi-Purpose: Dry bulk carrier with multiple applications, mainly as a feeder vessel or for special cargo.
Nautical Mile: Distance unit measure of 1,582 meters, or 6,076.12 ft.
Offshore vessel: Vessel serving the offshore oil industry. OPEC: Organisation of Petroleum Exporting
Countries. Panamax, container: Container carrier with the maximum
dimensions for passing through the Panama Canal (width of 32.21 metres, length of 291 metres) of approximately 3,000—5,000 teu.
Panamax, tanker: Crude oil tanker or product tanker with the maximum dimensions for passing through the Panama Canal (width of 32.21 metres and length of 289.5 metres) of approximately 50,000—80,000 dwt.
Panamax, dry cargo: Dry bulk vessel with the maximum dimensions for passing through the Panama Canal (width of 32.21 metres and length of 289.5 metres) of approximately 60,000—80,000 dwt.
PCC: Pure Car Carrier. Car carrier built exclusively to transport passenger cars.
Post-Panamax: Container vessel of approximately 4,000+ teu that is too large to pass through the Panama Canal.
Product tanker: Tanker vessel with coated tanks used to transport refined oil products.
PSV: Platform Supply Vessel. Offshore vessel serving the offshore oil installations.
Ro-Ro: Roll On – Roll Off. Common description of vessels on which the cargo is rolled on board and ashore.
SSY: Simpson Spence & Young, British ship brokering and research company. www.ssy.co.uk
Suezmax: Crude oil tanker with the maximum dimensions for passing through the Suez
Canal (approximately 120,000—200,000 dwt.).
TCE: Time Charter Equivalent. Teu: Twenty Feet Equivalent Unit. Container
with a length of 20 feet (about 6 metres) which forms the basis of describing the capacity of a container vessel.
Teu-knots: Unit of measure that takes account of the speed of the ships when estimating the actual supply of ships within a segment.
Teu-nautical mile: Unit of measure indicating the volume of cargo, measured in teu, and how far it has been transported, measured in nautical miles.
Ton-nautical mile: Unit of measure indicating the volume of cargo, measured in ton, and how far it has been transported, measured in nautical miles.
Tonnage: Synonymous with “vessel”. ULCC: Ultra Large Crude Carrier. Crude oil tanker
above 320,000 dwt. VLCC: Very Large Crude Carrier. Crude oil tanker
of between approximately 200,000 and 320,000 dwt.
VLGC: Very Large Gas Carrier. LPG ship with capacity above 60,000 cbm.
WTI: West Texas Intermediate. Oil price benchmark in the USA.
Danish Ship Finance 45

This page is intentionally left blank

FOR FURTHER INFORMATIONVISIT WWW.SKIBSKREDIT.DK