dairy products - european commission | choose your...
TRANSCRIPT

1
1
Product Environmental Footprint Category Rules 2
for 3
Dairy Products 4
5
6
7
Updated DRAFT for public consultation 8
July 28, 2016 9
10
11
12
13
14
Prepared by the Technical Secretariat: 15 The European Dairy Association (EDA), ACTALIA, the Alliance for Beverage Cartons and the 16
Environment (ACE), the French Environment and Energy Management Agency (ADEME), BEL group, 17 French Commissariat Général au Développement Durable (CGDD), Constantia Flexibles, Coopérative 18 Laitière de la Sèvre (CLS), Centre National Interprofessionnel de l’Economie Laitière & Association de 19
la Transformation Laitière Française (CNIEL/ATLA), Danone, DMK GROUP, the European Container 20 Glass Federation (FEVE), Fonterra, FrieslandCampina, the International Dairy Federation (IDF), the 21
Institut français de l’élevage (IDELE), REWE Group, and Quantis 22 23
24

2
PROJECT INFORMATION
Project Title Product Environmental Footprint Category Rules (PEFCR) for Dairy Products
Contracting organisation
The European Dairy Association (EDA)
Liability Statement
Information contained in this report has been compiled from and/or computed from sources believed to be credible. Application of the data is strictly at the discretion and the responsibility of the reader. Quantis is not liable for any loss or damage arising from the use of the information in this document.
Quantis Project team
Xavier Bengoa, Project manager ([email protected]), main contact Carole Dubois, Business Leader Single Market for Green Products (SMGP) ([email protected]) Sebastien Humbert, Life Cycle Assessment Expert, quality control ([email protected])
Commissioner EDA: Hélène Simonin, Richard Laxton ACE: Albane Siramy, Frank Wellenreuther ACTALIA: Pierre Barrucand ADEME: Vincent Colomb BEL Group: Noël Pallez, Vanessa Azar CGDD: Florence Scarsi, Valérie To CLS: Pierre Barrucand CNIEL/ATLA: Hélène Perennou, Pierre Barrucand Constantia Flexibles: Thomas Greigeritsch Danone: Marie-Pierre Bousquet, Nathalie Guillaume, Philippe Diercxsens DMK GROUP: Karla Lukas, Philipp Inderhees FEVE: Fabrice Rivet, Romeo Pavanello Fonterra: Francesca Eggleton, Francis Reid FrieslandCampina: Jaap Petraeus, Sanne Dekker, Mia Lafontaine, Jeroen Hospers IDF: Delanie Kellon, Nico van Belzen IDELE: Jean-Baptiste Dollé REWE Group: Félix Barth, Günther Kabbe
Associated files
See full list of Annexes
25
This report has been prepared by 26 Quantis Switzerland 27 EPFL Innovation Park, Bât. D 28 1015 Lausanne - Switzerland 29 Tel: +41 21 693 91 92 30 E-mail: [email protected] 31
Web: www.quantis-intl.com 32
33

3
Executive Summary 34
Through its initiative, “Building the Single Market for Green Products”, the European Commission (EC) 35
aims to harmonize the communication of environmental performances of products and organisations 36
for producers and consumers alike. Member States and the private sector are encouraged to test a 37
life cycle assessment (LCA)-based method developed by the European Commission's Joint Research 38
Centre (JRC) to measure the environmental performance of products throughout their life cycles, 39
known as the Product Environmental Footprint (PEF). 40
The EC launched a three-year pilot testing period for both the non-food and food sectors through a 41
multi-stakeholder process to develop product-specific rules, Product Environmental Footprint 42
Category Rules (PEFCR), as well as to test communication principles for a few specific sectors and 43
products. 44
In May 2014, the EC approved the pilot to develop Product Environmental Footprint Category Rules 45
(PEFCR) for the dairy sector. The Technical Secretariat (TS) responsible for developing the PEFCR is 46
composed of the following organisations: The European Dairy Association (EDA), ACTALIA, the 47
Alliance for Beverage Cartons and the Environment (ACE), the French Environment and Energy 48
Management Agency (ADEME), BEL group, the French Commissariat Général au Développement 49
Durable (CGDD), Constantia Flexibles, Coopérative Laitière de la Sèvre (CLS), Centre National 50
Interprofessionnel de l’Economie Laitière & Association de la Transformati on Laitière Française 51
(CNIEL/ATLA), Danone, DMK GROUP, the European Container Glass Federation (FEVE), Fonterra, 52
FrieslandCampina, the International Dairy Federation (IDF), the Institut français de l’élevage (IDELE), 53
REWE Group, and Quantis. 54
55
This PEFCR covers the full life cycle (cradle to grave) for dairy products sold on the EU market. The 56
following sub-categories are considered: liquid milk, dried whey products, cheeses, fermented milk 57
products, and butterfat products. A PEF screening study was conducted for each of these sub-58
categories, identifying hotspots and relevant impact categories. The PEFCR provides detailed guidance 59
related to the use of primary and secondary data, data quality requirements, allocation rules, impact 60
categories that shall be addressed and further environmental information to be provided when 61
assessing the PEF of dairy products. Although all dairy products could not be included in this pilot 62
project, the TS advices that the future development of PEFCRs for other dairy products complies with 63
the content of this PEFCR. Moreover, this PEFCR may be used as a guidance document for PEF studies 64
of dairy products not covered by this PEFCR. However, in that case, compliance cannot be claimed. 65

4
The PEFCR shall enable comparative assessment of different products from the same sub-category. It 66
is not meant for comparing dairy products from different subcategories or comparing dairy and non -67
dairy products. The use of the present PEFCR is optional for PEF Guide in-house applications, it is 68
recommended for external applications without comparison/comparative assertions, while it is 69
mandatory for external applications with comparisons/comparative assertions. 70
71

5
Table of contents 72
Executive Summary ...................................................................................................................... 3 73
Table of contents.......................................................................................................................... 5 74
List of figures................................................................................................................................ 8 75
List of tables ................................................................................................................................. 8 76
Abbreviations, acronyms and units .............................................................................................. 10 77
Glossary ..................................................................................................................................... 13 78
1 Introduction........................................................................................................................ 16 79
2 General information about the PEFCR .................................................................................. 17 80
2.1 Technical Secretariat .................................................................................................... 17 81
2.2 Consultation and stakeholders...................................................................................... 17 82
2.3 Date of publication and expiration ................................................................................ 19 83
2.4 Geographic region ....................................................................................................... 19 84
2.5 Language of PEFCR....................................................................................................... 19 85
3 Methodological inputs and compliance ................................................................................ 20 86
4 PEFCR review and background information........................................................................... 21 87
4.1 PEFCR review panel...................................................................................................... 21 88
4.2 Review requirements for the PEFCR document .............................................................. 21 89
4.3 Reasoning for development of PEFCR............................................................................ 21 90
4.4 Conformance with the PEFCR Guidance ........................................................................ 22 91
5 PEFCR scope........................................................................................................................ 23 92
5.1 Functional unit ............................................................................................................ 26 93
5.2 Representative products .............................................................................................. 28 94
5.3 Product classification (CPA) .......................................................................................... 29 95
5.4 System boundaries, life-cycle stages and processes ....................................................... 31 96
5.4.1 Life cycle stages .................................................................................................... 31 97
5.4.2 System boundaries ............................................................................................... 32 98

6
5.4.3 Cut-off and exclusions........................................................................................... 33 99
5.4.4 Processes per life cycle stage................................................................................. 33 100
5.4.5 Processes excluded from the system boundaries .................................................... 39 101
5.5 Selection of the EF impact categories indicators ............................................................ 40 102
5.6 Additional environmental information .......................................................................... 43 103
5.6.1 Impact on biodiversity .......................................................................................... 43 104
5.7 Assumptions/limitations............................................................................................... 45 105
6 Resource use and emission profile........................................................................................ 46 106
6.1 Screening step ............................................................................................................. 46 107
6.2 Data quality requirements ............................................................................................ 48 108
6.3 Requirements regarding foreground specific data collection .......................................... 50 109
6.3.1 Raw milk production ............................................................................................. 50 110
6.3.2 Transport from dairy farm to processing unit ......................................................... 58 111
6.3.3 Dairy processing ................................................................................................... 59 112
6.3.4 Non-dairy ingredients ........................................................................................... 61 113
6.3.5 Packaging ............................................................................................................. 62 114
6.4 Requirements regarding background generic data and data gaps ................................... 63 115
6.4.1 Raw milk production ............................................................................................. 63 116
6.4.2 Dairy processing and non-dairy ingredients ............................................................ 64 117
6.4.3 Packaging ............................................................................................................. 68 118
6.5 Data gaps .................................................................................................................... 71 119
6.6 Distribution ................................................................................................................. 71 120
6.7 Use stage .................................................................................................................... 72 121
6.8 End-of-life stage .......................................................................................................... 73 122
6.9 Food losses and waste.................................................................................................. 74 123
6.10 Requirements for multifunctional products and multiproduct processes ......................... 75 124
6.10.1 Multi-functionality decision hierarchy.................................................................... 75 125
6.10.2 Multi-functionality at the dairy farm ...................................................................... 76 126

7
6.10.3 Multi-product processes at dairy processing .......................................................... 77 127
6.10.4 Transportation of raw milk and distribution of packaged dairy products .................. 79 128
6.10.5 Transportation from retail to consumer home........................................................ 80 129
6.10.6 Materials recycling and energy recovery from waste incineration............................ 80 130
7 Benchmarks ........................................................................................................................ 81 131
8 Interpretation ..................................................................................................................... 82 132
9 Reporting, Disclosure and Communication............................................................................ 83 133
9.1 PEF external communication report .............................................................................. 85 134
9.2 PEF performance tracking report .................................................................................. 86 135
9.3 PEF Declaration ........................................................................................................... 86 136
9.4 PEF label ..................................................................................................................... 86 137
10 Verification ..................................................................................................................... 87 138
11 References ...................................................................................................................... 88 139
12 Supporting information for the PEFCR............................................................................... 90 140
13 List of annexes................................................................................................................. 91 141
13.1 Annex I – Screening study report .................................................................................. 91 142
13.2 Annex II – Supporting studies ....................................................................................... 91 143
13.3 Annex III – Benchmarks ................................................................................................ 92 144
13.4 Annex IV – Background data ......................................................................................... 96 145
13.5 Annex V - Default dry matter content for dairy products ................................................ 96 146
13.6 Annex VI – Default biodiversity-related data.................................................................. 96 147
13.7 Annex VII - Existing sectorial guidance documents ......................................................... 96 148
149
150

8
List of figures 151
152
Figure 1: Scope definition pattern chosen for the PEFCR on dairy products (option B) .................... 25 153
Figure 2: Decision tree to select appropriate functional unit in B2B and B2C contexts..................... 27 154
Figure 3: System boundaries diagram for dairy products ("traditional LCA" view) ........................... 32 155
Figure 4: Illustration of material and energy flows in dairy farming system.................................... 34 156
Figure 5: Process diagram for liquid milk ...................................................................................... 35 157
Figure 6: Process diagram for dried whey products....................................................................... 36 158
Figure 7: Process diagram for cheeses.......................................................................................... 37 159
Figure 8: Process diagram for fermented milk products ................................................................ 38 160
Figure 9: Process diagram for butterfat products .......................................................................... 39 161
162
List of tables 163
Tab. 1: Consultations and stakeholders ........................................................................................ 18 164
Tab. 2: PEFCR review panel ......................................................................................................... 21 165
Tab. 3: Sub-categories of dairy products ...................................................................................... 24 166
Tab. 4: Key aspects to determine the functional unit .................................................................... 26 167
Tab. 5: Default functional unit for each sub-category .................................................................... 28 168
Tab. 6: Representative products for each sub-category ................................................................. 29 169
Tab. 7: CPA codes covered by the PEFCR ...................................................................................... 29 170
Tab. 8: Activities included in each life cycle stage.......................................................................... 31 171
Tab. 9: Application of the data needs matrix to dairy products ...................................................... 33 172
Tab. 10: List of impact categories and related assessment methods used....................................... 41 173
Tab. 11: Rationale for selecting most relevant impact categories for dairy products ....................... 42 174
Tab. 12: Typical information to be provided on schemes related to biodiversity ............................. 44 175
Tab. 13: Most relevant processes identified in the screening study, per life cycle stage .................. 46 176
Tab. 14: Data requirements for dairy processors .......................................................................... 47 177
Tab. 15: Criteria for the data quality assessment according to the PEF Guide (2013) ....................... 49 178
Tab. 16: Included and excluded inputs on the dairy farm1 ............................................................. 50 179
Tab. 17: Included and excluded on-farm emissions ....................................................................... 51 180
Tab. 18: Allocation methods to be used for products produced on dairy farms............................... 54 181
Tab. 19: Typical foreground specific activity data for raw milk modelling ....................................... 57 182

9
Tab. 20: DQR guidance for raw milk production ............................................................................ 58 183
Tab. 21: Foreground specific activity data required for dairy processing......................................... 59 184
Tab. 22: DQR guidance for dairy processing.................................................................................. 60 185
Tab. 23: Foreground specific activity data required for packaging .................................................. 62 186
Tab. 24: DQR guidance for packaging ........................................................................................... 63 187
Tab. 25: Default list of ingredients for 1 l of liquid milk, unpackaged .............................................. 64 188
Tab. 26: Default list of ingredients for 1 kg of dried whey products, unpackaged ............................ 65 189
Tab. 27: Default list of ingredients for 1 kg of cheese, unpackaged ................................................ 66 190
Tab. 28: Default list of ingredients for 1 kg of fermented milk products, unpackaged...................... 66 191
Tab. 29: Default list of ingredients for 1 kg of butterfat products, unpackaged ............................... 67 192
Tab. 30: Default data for consumables used in dairy processing .................................................... 67 193
Tab. 31: Default data for wastewater from dairy processing.......................................................... 68 194
Tab. 32: Default bill of materials for dairy products primary packaging .......................................... 68 195
Tab. 33: Default parameters for the supply of primary packaging .................................................. 70 196
Tab. 34: Default parameters for returnable glass bottles ............................................................... 70 197
Tab. 35: Default parameters for secondary and tertiary packaging, per kg of dairy product............. 70 198
Tab. 36: Default parameters for the distribution of final dairy products ......................................... 71 199
Tab. 37: Parameters for dairy products storage in the distribution stage ........................................ 71 200
Tab. 38: Energy and refrigerants consumption at the distribution centre and at retail .................... 72 201
Tab. 39: Default parameters for dairy products storage at the consumer home.............................. 73 202
Tab. 40: Default parameters for waste packaging collection and treatment (final products) ............ 73 203
Tab. 41: End-of-life treatment of packaging materials (Eurostat 2012) ........................................... 74 204
Tab. 42: Food loss and waste rates of dairy products .................................................................... 75 205
Tab. 43: Default EOL parameters for packaging materials.............................................................. 80 206
Tab. 44: Scope and method for communication testing studies ..................................................... 83 207
208
209

10
Abbreviations, acronyms and units 210
ACE Alliance for Beverage Cartons and the Environment
ADEME Agence de l'environnement et de la maîtrise de l'énergie (French Environment and Energy Management Agency)
AFNOR Association Française de Normalisation (French national organization for standardization)
ATLA Association de la Transformation Laitière Française (French Dairy Processors Association)
B2B Business to business
B2C Business to consumer
CGDD Commissariat Général au Développement durable (French Ministry of Environment
CH4 Methane
CLS Coopérative Laitère de la Sèvre (Dairy Cooperative of the Sèvre)
CMWG Cattle model working group
CNIEL Centre National Interprofessionnel de l’Economie Laitière (French Dairy Interbranch Organization)
CO2 Carbon dioxide
COD Carbon organic demand
CPA Classification of Products by Activity
CTU Comparative toxic units
DM Dry matter
DMK Deutsches Milchkontor
DNM Data Needs Matrix
EC European Commission
EDA European Dairy Association
EF Environmental Footprint
ELCD European reference Life Cycle Database
EOL End of life
FAO Food and Agriculture Organization of the United Nations
FEVE European Container Glass Federation
FPCM Fat and protein corrected milk
FPE Flexible Packaging Europe
g Gram
HDPE High density polyethylene
IDELE Institut Français de l’Elevage (French Livestock Institute)

11
IDF International Dairy federation
ILCD International Reference Life Cycle Data System
ISO International Organization for Standardization
JRC Joint Research Centre
kg Kilogram
km Kilometre
kWh Kilowatt hour
l litre
LCA Life Cycle Assessment
LCI Life Cycle Inventory
LCIA Life Cycle Impact Assessment
LDPE Low density polyethylene
LEAP Livestock Environmental Assessment and Performance
LPB Liquid packaging board
m Metre
m2 Square metre
m3 Cubic metre
MJ mega joules
ml Millilitre
N2O Nitrous oxide
NACE Nomenclature Générale des Activités Economiques dans les Communautés Européennes
NH3 Ammonia
NOx Nitrogen oxides
OEF Organisation Environmental Footprint
OEFSR Organisation Environmental Footprint Sector Rule
PCR Product Category Rule
PE Polyethylene
PEF Product Environmental Footprint
PEFCR Product Environmental Footprint Category Rule
PET Polyethylene terephthalate
PM Particulate matter
PP Polypropylene
PWG Packaging Working Group
PYR The Environmental Register of Packaging PYR Ltd
SMGP Single Market for Green Products

12
t Tonne
TAB Technical Advisory Board
tkm Ton kilometre
TS Technical Secretariat
TSC The Sustainability Consortium
WRAP Waste and Resources Action Programme
211
212

13
Glossary 213
This glossary defines key terms used in this PEFCR. Some of the terms are based on the PEF Guide 214
(European Commission 2013). 215
216
Activity data Information that is associated with input or output processes while modelling Life Cycle Inventories. In the PEF guidelines, it is also called “non-elementary flows”. Activity data is multiplied by an LCI to derive the environmental footprint associated with a process or an operation. Examples of activity data include kilowatt-hours of electricity used, quantity of fuel used, output of a process, hours equipment is operated, distance travelled, floor area of a building, etc.
Cradle to grave An assessment, including raw material extraction, processing, distribution, storage, use, and disposal or recycling stages. All relevant inputs and outputs are considered for all of the stages of the life cycle.
Composite product Food product containing a certain fraction of milk. Typical examples of composite products are milk-based desserts, butter cookies, infant formula, edible ice, pizza, etc.
Dairy ingredient Dairy part of a composite product.
Dairy product “Dairy product” or "Milk product" defines a product derived exclusively from milk, on the understanding that substances necessary for their manufacture may be added provided that those substances are not used for the purpose of replacing, in whole or in part, any milk constituent. (Regulation (EU) No 1308/2013).
Final product Final products qualify products sold from business to consumer (B2C), for which the PEFCR provides rules from cradle-to-grave.
Functional unit The functional unit defines the qualitative and quantitative aspects of the function(s) and/or service(s) provided by the product being evaluated; the unit of analysis definition answers the questions “what?”, “how much?”, “how well?”, and “for how long?”
Input Product, material or energy flow that enters a unit process. Products and materials include raw materials, intermediate products and co-products. (International Organisation for Standardization (ISO) 14040:2006)
Intermediate product Intermediate products qualify products sold from business to business (B2B), for which the PEFCR provides rules from cradle-to-gate.
Life cycle Consecutive and interlinked stages of a product system, from raw material acquisition or generation from natural resources to final disposal. (ISO 14040:2006)
Life cycle approach Takes into consideration the spectrum of resource flows and environmental interventions associated with a product or organisation

14
from a supply chain perspective, including all stages from raw material acquisition through processing, distribution, use, and end-of-life processes, and all relevant related environmental impacts (instead of focusing on a single issue).
Life cycle assessment (LCA)
Compilation and evaluation of the inputs, outputs and the potential environmental impacts of a product system throughout its life cycle. (ISO 14040:2006)
Life cycle inventory (LCI) dataset
Document or file with life cycle information of a specified product or other reference (e.g., site, process), covering descriptive metadata and quantitative life cycle inventory. A LCI could be a unit process dataset (UPR) or an aggregated dataset (also called system process (SP)).
Milk "Milk", or "Raw milk", means exclusively the normal mammary secretion obtained from one or more milkings without either addition thereto or extraction therefrom. (Regulation (EU) No 1308/2013).
Output Product, material or energy flow that leaves a unit process. Products and materials include raw materials, intermediate products, co-products and releases. (ISO 14040:2006)
Primary data Data from specific process within the supply-chain of the company applying the PEFCR. Such data may take the form of activity data, or LCI dataset. Primary data are site-specific or producer specific (if multiple sites for a same product). Primary data may be obtained through meter readings, purchase records, utility bills, engineering models, direct monitoring, mass balance, stoichiometry, or other methods for obtaining data from specific processes in the value chain of the company applying the PEFCR. Also called "specific data".
Primary packaging Material that first envelops the product. For dairy products, primary packaging can consist either of a container (bottle, beverage carton, cup, jar, pouch) and a closure (lid, cap), or of a wrapper.
Product Any goods or service (ISO 14040:2006)
Product environmental footprint category rules (PEFCR)
Are product-type-specific, life-cycle-based rules that complement general methodological guidance for PEF studies by providing further specification at the level of a specific product category. PEFCR can help to shift the focus of the PEF study towards those aspects and parameters that matter the most, and hence contribute to increased relevance, reproducibility and consistency.
Representative product
The “representative product” may or may not be a real product that one can buy on the EU market. Especially when the market is made up of different technologies, the “representative product” can be a virtual (non-existing) product built, for example, from the average EU sales-weighted characteristics of all technologies around. A PEFCR may include more than one representative product if appropriate

15
Secondary data Data not from specific process within the supply-chain of the company applying the PEFCR. This refers to data that is not directly collected, measured, or estimated, but rather sourced from a third-party life-cycle-inventory database or other sources. Secondary data includes industry-average data (e.g., from published databases, government statistics, literature studies, and industry associations), financial data, proxy data, and other generic data. Primary data that go through a modelling or aggregation step are considered as secondary data.
Secondary packaging Package or containment of a primary package. Multipacks and labels are considered as secondary packaging.
System boundary Definition of aspects included or excluded from the study. For example, for a “cradle-to-grave” EF analysis, the system boundary should include all activities from the extraction of raw materials through the processing, distribution, storage, use, and disposal or recycling stages.
System boundary diagram
Graphical representation of the system boundary defined for the PEF study.
Tertiary packaging Packaging conceived so as to facilitate handling and transport of a number of sales units or grouped packaging in order to prevent physical handling and transport damage.
217
218

16
1 Introduction 219
The Product Environmental Footprint (PEF) Guide provides detailed and comprehensive technical 220
guidance on how to conduct a PEF study. PEF studies may be used for a variety of purposes, including 221
in-house management and participation in voluntary or mandatory programmes. This PEFCR shall be 222
used in parallel with the PEF Guide. As the requirements in this PEFCR are in line with, but at the same 223
time more specific than those of the PEF Guide, such specific requirements shall be fulfilled. 224
The use of the present PEFCR is optional for PEF guide in-house applications, it is recommended for 225
external applications without comparison/comparative assertions, while it is mandatory for external 226
applications with comparisons/comparative assertions. 227
Although all dairy products could not be included in this pilot project, the Technical Secretariat 228
considers that most of this PEFCR remains applicable. 229
230
231

17
2 General information about the PEFCR 232
2.1 Technical Secretariat 233
The Technical Secretariat (TS) responsible for the development of the PEFCR for the dairy sector is 234
composed of the following 18 organisations: 235
1. The European Dairy Association (EDA) (Coordinator) 236
2. The Alliance for Beverage Carton and the Environment (ACE) 237
3. ACTALIA 238
4. The French Environment and Energy Management Agency (ADEME) 239
5. BEL Group 240
6. The French Commissariat Général au Développement durable (CGDD) 241
7. The Cooperative Laitière de la Sèvre (CLS) 242
8. Constantia Flexibles 243
9. The Centre National Interprofessionnel de l’Economie Laitière & Association de la 244
Transformation Laitière Française (CNIEL/ATLA) 245
10. Danone 246
11. DMK GROUP 247
12. The European Container Glass Federation (FEVE) 248
13. Fonterra 249
14. FrieslandCampina 250
15. The International Dairy Federation (IDF) 251
16. The Institut français de l’élevage (IDELE) 252
17. REWE Group 253
18. Quantis 254
255
Six of these organisations (Bel Group, CLS, Danone, DMK GROUP, Fonterra and FrieslandCampina) 256
performed a supporting study. 257
2.2 Consultation and stakeholders 258
The procedure for the development of a PEFCR according to the “Guidance for the implementation of 259
the EU PEF during the EF pilot phase” considers a number of steps that have been followed by this 260
Technical Secretariat, namely: 261
- Definition of PEF product category and scope of the PEFCR 262
- Definition of the product “model” based on representative product(s) 263

18
- PEF screening study 264
- Draft PEFCR 265
- PEF supporting studies 266
- Confirmation of the benchmark(s) 267
- Final PEFCR 268
A first online consultation with stakeholders took place in October-November 2014. It was followed 269
by a physical consultation in Brussels on October 31st, 2014, where the definition of PEF product 270
category, the scope of PEFCR and the definition of the representative product were presented and 271
commented. 272
273
Following this first consultation, three additional organisations representing the packaging sector (i.e. 274
ACE, Constantia Flexibles and FEVE) joined the Technical Secretariat. After completing the PEF 275
screening study as required by the EC (including the critical review of the PEF screening report and 276
model by the European Commission and by a third party reviewer), a second draft PEFCR, was 277
submitted for virtual consultation in June-July 2015. The present document is the updated draft PEFCR 278
after completion of the PEF supporting studies, ready for a third and last public consultation to be 279
launched in the course July 2016. 280
281
Tab. 1: Consultations and stakeholders 282
1st consultation 2nd consultation 3rd consultation Type Online and physical Online Online
Start 16.10.2014 26.06.2015 29.07.2016
End 09.11.2014 26.07.2015 09.09.2016
Duration 4 weeks 4 weeks 6 weeks
Number of participating stakeholders (online)
5 5 To be completed
Number of participating stakeholders (physical)
13 Not applicable Not applicable
Number of comments 77 140 To be completed 283
After each consultation, comments were analysed and answers were provided on the EF wiki space. 284
When relevant, the PEFCR was adapted accordingly. All documents related to the work performed by 285
the Technical Secretariat as well as the stakeholder consultation are available at: 286
https://webgate.ec.europa.eu/fpfis/wikis/display/EUENVFP/Stakeholder+workspace%3A+PEFCR+pil287
ot+Dairy 288
289

19
2.3 Date of publication and expiration 290
Version number: Updated draft version for 3rd public consultation 291
Date of publication/revision: tbd 292
Date of expiration: 4 years after the date of publication 293
2.4 Geographic region 294
This PEFCR is aimed at dairy products sold in the European Union. These products can either be 295
produced within or outside the European Union. These rules could however be applied globally. 296
2.5 Language of PEFCR 297
This PEFCR has been written in English. It is not foreseen to make this document available in other 298
languages. 299
300

20
3 Methodological inputs and compliance 301
The PEFCR has been prepared in conformance with the following documents: 302
European Commission (2013). 2013/179/EU: Commission Recommendation of 9 April 2013 303
on the use of common methods to measure and communicate the life cycle environmental 304
performance of products and organisations. Also called as “Product Environmental Footprint 305
(PEF) Guide”; 306
European Commission (2014). Environmental Footprint Pilot Guidance document. Guidance 307
for the implementation of the EU Product Environmental Footprint (PEF) during the 308
Environmental Footprint (EF) Pilot Phase, v. 4.0, May 2014. Also called as “PEF Guidance 309
(2014)”. 310
EC-JRC (2015). Default approaches for cross-cutting issues for cattle related Product 311
Environmental Footprint pilots. DRAFT final report. European Commission, Joint Rese arch 312
Centre, Institute for Environment and Sustainability, Sustainability Assessment Unit. Ispra, 313
Italy. This document was the outcome of the transversal cattle model working group (CMWG) 314
held between July and December 2014. 315
International Dairy Federation (IDF) (2015). A common carbon footprint approach for Dairy. 316
The IDF guide to standard life cycle assessment methodology for the dairy sector. Brussels, 317
Belgium. 318
The Technical Secretariat identified several existing PCR, sectorial guidance documents and other 319
useful publications on dairy products. These are reported in Appendix A. The analysis of these 320
documents was carried out in order to check the similarities and differences with the above-321
mentioned reference documents. The conclusions of this analysis were presented by the TS to the PEF 322
steering committee, and were approved on the December 16, 2014. These documents represent very 323
useful sources of information and are used as references when relevant. 324
325
326
21
4 PEFCR review and background information 327
4.1 PEFCR review panel 328
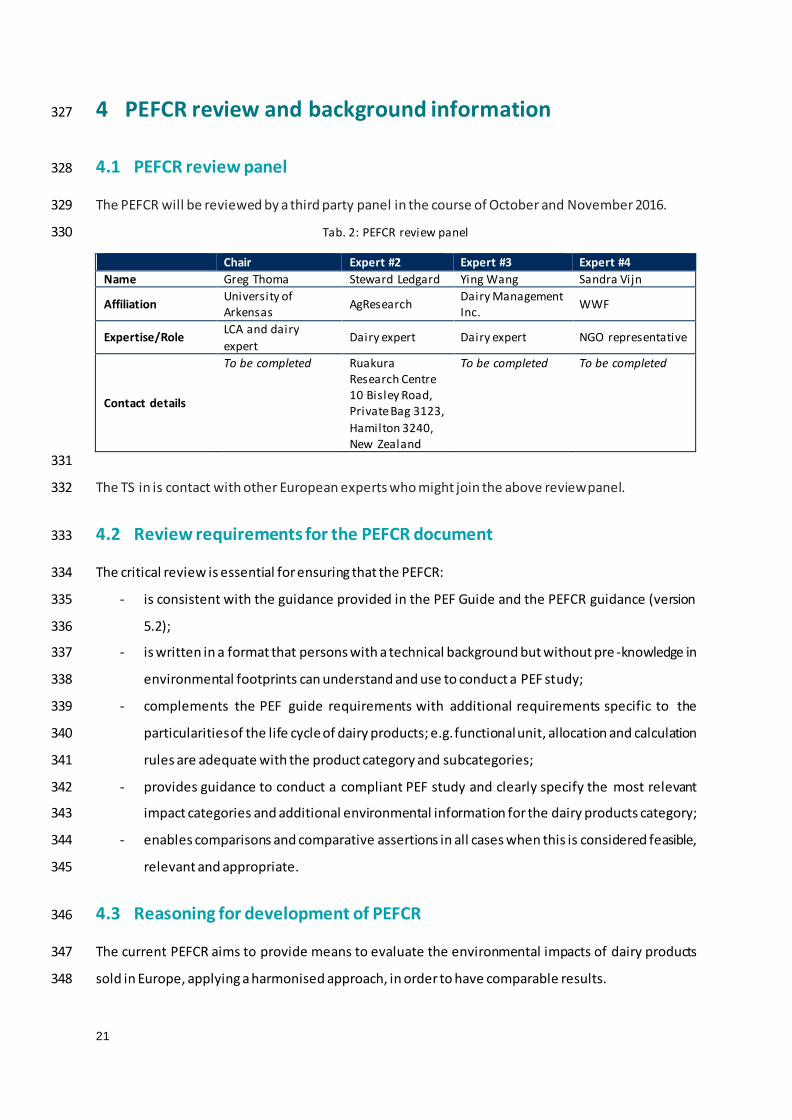
The PEFCR will be reviewed by a third party panel in the course of October and November 2016. 329
Tab. 2: PEFCR review panel 330
Chair Expert #2 Expert #3 Expert #4
Name Greg Thoma Steward Ledgard Ying Wang Sandra Vijn
Affiliation University of Arkensas
AgResearch Dairy Management Inc.
WWF
Expertise/Role LCA and dairy
expert Dairy expert Dairy expert NGO representative
Contact details
To be completed Ruakura Research Centre 10 Bisley Road, Private Bag 3123,
Hamilton 3240, New Zealand
To be completed To be completed
331
The TS in is contact with other European experts who might join the above review panel. 332
4.2 Review requirements for the PEFCR document 333
The critical review is essential for ensuring that the PEFCR: 334
- is consistent with the guidance provided in the PEF Guide and the PEFCR guidance (version 335
5.2); 336
- is written in a format that persons with a technical background but without pre -knowledge in 337
environmental footprints can understand and use to conduct a PEF study; 338
- complements the PEF guide requirements with additional requirements specific to the 339
particularities of the life cycle of dairy products; e.g. functional unit, allocation and calculation 340
rules are adequate with the product category and subcategories; 341
- provides guidance to conduct a compliant PEF study and clearly specify the most relevant 342
impact categories and additional environmental information for the dairy products category; 343
- enables comparisons and comparative assertions in all cases when this is considered feasible, 344
relevant and appropriate. 345
4.3 Reasoning for development of PEFCR 346
The current PEFCR aims to provide means to evaluate the environmental impacts of dairy products 347
sold in Europe, applying a harmonised approach, in order to have comparable results. 348

22
This PEFCR is aligned with the already existing IDF Guide (IDF 2015), which solely focuses on carbon 349
footprint, and complements the French Guidance (AFNOR 2014) as to reflect the diversity of dairy 350
products in the EU. These documents are however not totally aligned with the PEF requirements 351
because they do not fully follow a mandatory requirement for PEFCRs (e.g. some stages are excluded 352
from the product life cycle or default EF impact categories are not included). Nevertheless, these 353
documents represent very useful sources of information and are used as references when relevant. 354
355
4.4 Conformance with the PEFCR Guidance 356
The updated draft PEFCR has been prepared in conformance with the “Guidance for the 357
Implementation of the EU PEF during the Environmental Footprint (EF) pilot phase - Version 5.2” and 358
various “issue papers” published by the European Commission at the time of writing. 359
360
361
362
363

23
5 PEFCR scope 364
The product category for this PEFCR is dairy products, which includes the following: 365
Liquid milk 366
Dried whey products 367
Cheeses 368
Fermented milk products 369
Butterfat products 370
Other dairy products are not covered by this PEFCR (see section 5.3). This PEFCR could however be 371
used for calculating - the whole or part of - the PEF of other dairy products. 372
The following definitions1 apply to the product category: 373
Raw milk, or, as defined in EU regulation, “Milk means exclusively the normal mammary 374
secretion obtained from one or more milkings without either addition thereto or extraction 375
therefrom” (Regulation (EU) No 1308/2013) 376
Dairy products, or, as defined in EU regulation, “Milk products means products derived 377
exclusively from milk, on the understanding that substances necessary for their manufacture 378
may be added provided that those substances are not used for the purpose of replacing, in 379
whole or in part, any milk constituent.” (Regulation (EU) No 1308/2013). Dairy products can 380
include non-dairy ingredients such as salt, sweeteners, fruit preparations, etc. 381
Composite product means any food product containing a certain fraction of milk. Typical 382
examples of composite products are milk-based desserts, butter cookies, infant formula, 383
edible ice, pizza, etc. 384
Dairy ingredient means the dairy part of a composite product. 385
386
This PEFCR covers the dairy ingredients of composite products, when these dairy ingredients can be 387
assimilated to dairy products that are explicitly included in the scope. 388
389
Specific non-dairy ingredients added to dairy products are included in this PEFCR and are a part of the 390
product environmental footprint. However, this PEFCR does not provide detailed guidance on how to 391
model the upstream production of these ingredients. Rules on how to include those ingredients in the 392
1 The definitions from the EU Regulation No 1308/2013 are adapted from the Codex Alimentarius (WHO/FAO,
2011). It should therefore be understood that the definitions used in the PEFCR also apply to a regulatory context wider than the EU.

24
PEF of dairy products (e.g. amounts and quality grades) are provided in this PEFCR, together with 393
relevant secondary data that fulfils the required quality standard. Typical examples of non-dairy 394
ingredients added to dairy products are fruit preparation in yoghurt or salt in cheese. 395
396
The PEFCR covers raw milk produced by cattle only, and its derived dairy products. The full life cycle 397
(cradle to grave) for dairy products sold on the EU market are within the scope of this PEFCR. 398
399
The main function of dairy products is to provide nutritional and health benefits to humans or animals. 400
Nutritional benefits found in dairy products include energy (calories), proteins, carbohydrates, fat, 401
calcium, phosphorus and vitamins, among others. Several applications of dairy products are 402
distinguished, corresponding to the product sub-categories shown in Tab. 3. 403
404
Tab. 3: Sub-categories of dairy products 405
Sub-category Type Typical products
Liquid milk F Standardised milk (skimmed, semi-skimmed, whole milk)
Dried whey products I Whey powder, whey protein powder, lactose powder
Cheeses F Ripened cheese (soft and hard), unripened cheese (spoonable, spreadable, solid)
Fermented milk products F Spoonable yoghurt (set, stirred), fermented milk drinks (l iquid yoghurt, kefir)
Butterfat products F Butter (salted, unsalted), spreadable dairy fats
I = Intermediate product; F = final product2
406
These sub-categories were defined with the aim to make the complexity of the dairy sector 407
understandable for all types of stakeholders: consumers, dairy producers, retailers, food processors 408
and regulators. To ensure alignment with the PEF guidance, all dairy products could however not be 409
included in the scope of this PEFCR. For those dairy products that are covered, the following reasoning 410
was followed: 411
From a consumer perspective, each sub-category corresponds to a different type of product 412
with its own application (i.e. products from different sub-categories are not exchangeable) 413
These sub-categories correspond to different sets of process stages 414
A clear and synthetic process diagram can be made of each of these sub-categories 415
416
2 Intermediate products qualify products sold from business to business (B2B), for which the PEFCR provides
rules from cradle-to-gate. Final products qualify products sold from business to consumer (B2C), for which the PEFCR provides rules from cradle-to-grave.
25
Most dairy products can either be final or intermediate products used as ingredients into composite 417
products. In the PEFCR, only products from the sub-category “dried whey products” are considered as 418
intermediate product. Others are considered as final products. 419
420
The PEFCR shall enable comparative assessment of different products from the same sub-category. 421
The PEFCR shall not serve comparisons of products from different sub-categories, or with non-dairy 422
products in general. 423
424
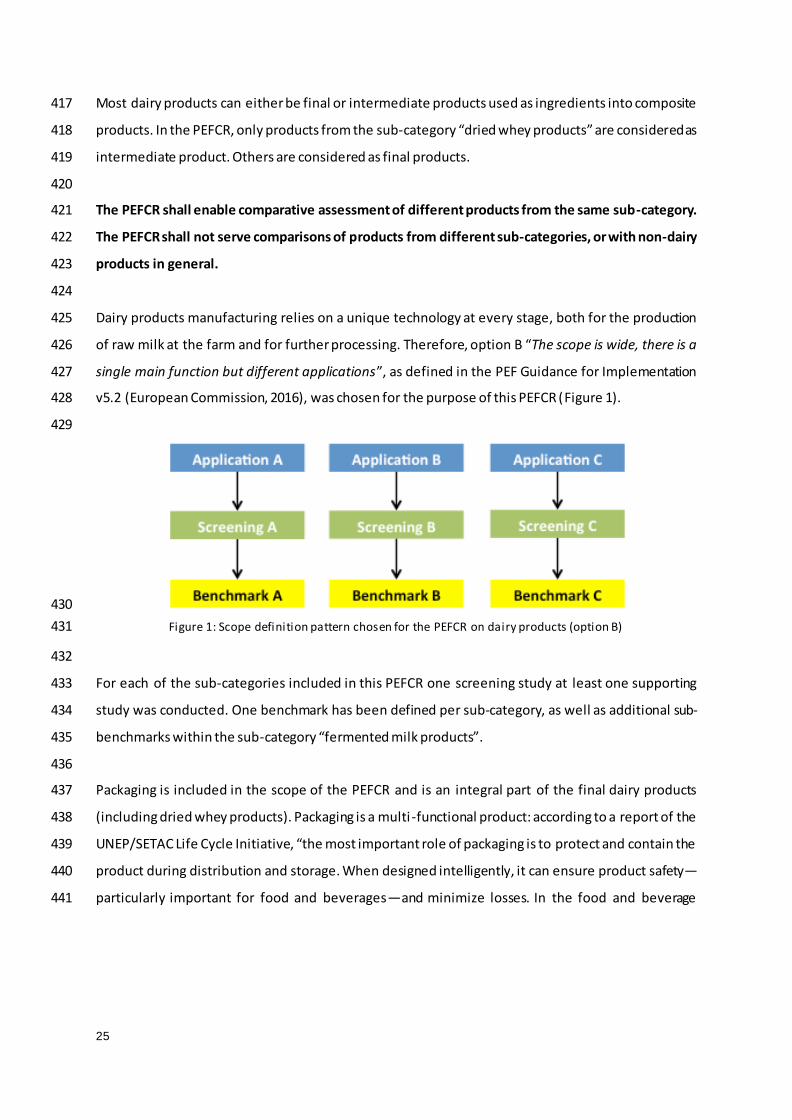
Dairy products manufacturing relies on a unique technology at every stage, both for the production 425
of raw milk at the farm and for further processing. Therefore, option B “The scope is wide, there is a 426
single main function but different applications”, as defined in the PEF Guidance for Implementation 427
v5.2 (European Commission, 2016), was chosen for the purpose of this PEFCR (Figure 1). 428
429
430
Figure 1: Scope definition pattern chosen for the PEFCR on dairy products (option B) 431
432
For each of the sub-categories included in this PEFCR one screening study at least one supporting 433
study was conducted. One benchmark has been defined per sub-category, as well as additional sub-434
benchmarks within the sub-category “fermented milk products”. 435
436
Packaging is included in the scope of the PEFCR and is an integral part of the final dairy products 437
(including dried whey products). Packaging is a multi -functional product: according to a report of the 438
UNEP/SETAC Life Cycle Initiative, “the most important role of packaging is to protect and contain the 439
product during distribution and storage. When designed intelligently, it can ensure product safety—440
particularly important for food and beverages—and minimize losses. In the food and beverage 441

26
industry, packaging also serves to preserve the product and prevent spoilage, provide i nformation, 442
provide convenience and portion control, and market to the consumer”3. 443
444
As it is recognized that the multi-functionality of packaging is not fully captured by the current LCA 445
and PEF methodology4,5, the dairy PEFCR is not meant to support specific comparison or comparative 446
assertion between packaging formats. Once this limitation is taken into account, the PEFCR can still 447
be used to compare the global environmental performance of different dairy products. Efforts should 448
be made to correctly estimate the functionality of the dairy product under study, especially regarding 449
food waste. If this is not possible due to lack of data, the results regarding packaging should be 450
interpreted with care. 451
452
5.1 Functional unit 453
Key aspects regarding “what?”, “how much?”, “how well?”, and “for how long?” are used to define 454
the function provided by dairy products, as summarized in Tab. 4 455
456
Tab. 4: Key aspects to determine the functional unit 457
Product Aspect detail Dairy products PEFCR
What? Function provided To provide nutritional and health benefits to humans or animals
How much? Magnitude of the function Mass, volume, serving size or specific nutritional aspect relevant to the study objectives
How long? Duration of the product provided
From milking to consumption: duration is related to the product conservation, which depends on multiple parameters such as type of processing, thermal treatment or packaging
How well? Expected level of quality Quality related to multiple criteria, depending on the study objectives: amount, dry mass content or nutritional content (fat, calcium, protein, etc.)
458
The PEFCR provides rules for the assessment of PEF studies conducted by various stakeholders, with 459
diverse scopes and multiple targeted audiences. The appropriate functional unit shall be chosen in 460
relation to the scope of the PEF study and the factors driving the decision-making process (e.g. buying 461
3 UNEP/SETAC Life Cycle Initiative, 2013: An Analysis of Life Cycle Assessment in Packaging for Food & Beverage
Applications 4 Technische Universität Berlin, Prof. Dr. Matthias Finkbeiner, 2016: High-Level-Analysis Of Gaps For
Comparability Of Packaging Materials In The EU Product Environmental Footprint (PEF). 5 Outcomes of the EF TAB meeting, 31st May 2016

27
product A versus product B). The following rules shall be applied when defining the functional unit for 462
dairy products: 463
By default, the functional unit shall be per mass or per volume, depending on the reference 464
used on the product packaging. 465
When justified by the study objectives, alternative functional units can be selected, such as 466
the serving size (e.g. portion, consumption unit, unit sold) or nutritional value (e.g. energy 467
content, protein content, fat content), in addition to the default functional unit. In such cases, 468
the decision tree in Figure 2 should be followed as to select the appropriate alternative 469
functional unit, in PEF studies conducted in B2B and B2C contexts. 470
471
472
Figure 2: Decision tree to select appropriate functional unit in B2B and B2C contexts 473
474
The default functional unit for each sub-category is defined in Tab. 5. 475
476

28
Tab. 5: Default functional unit for each sub-category 477
Sub-category Functional unit
Liquid milk 1000 ml l iquid milk, consumed at home as final product without heating, cooking or further transformation
Dried whey products 1000 kg dried whey product, at plant gate, for further processing
Cheeses 10 g dry matter of cheese, consumed at home as final product without cooking or further transformation
Fermented milk products 125 g fermented milk or yoghurt, consumed at home as final product without cooking or further transformation
Butterfat products 50 g butterfat product, consumed at home as final product without cooking or further transformation
478
Packaging is accounted in the functional unit described above, as it is an integral part of the final dairy 479
products (including dried whey products). Packaging is a multi-functional product as it provides 480
different functions, of which the main are: 481
To contain a certain amount of food or beverage; this function is accounted for by the “how 482
much” parameter. 483
To protect food or beverage quality (e.g., taste) and preserve it over time; these functions are 484
partially accounted for by, respectively, the “how well” and “how long” parameters. 485
It is acknowledged that the definition of the parameters “how well” and “how long” in the PEFCR is 486
not detailed enough to fully assess the packaging performance. As a result, comparison or comparative 487
assertion between different packaging materials of dairy products should be applied with care, if 488
specific data is available to support functionality characteristics of the packaging, such as adequate 489
estimates of shelf life and/or waste. 490
5.2 Representative products 491
Five different representative products are considered in this PEFCR (Tab. 6), one for each of the 492
product sub-categories. All representative products are virtual products. 493
494
These representative products characterise what is potentially sold on the European market, not what 495
is produced within the European Union. For products that are more largely exported from, or imported 496
to the EU, this nuance may have significant effects on assumptions made on transportation, storage, 497
use and end-of-life. 498
499
29
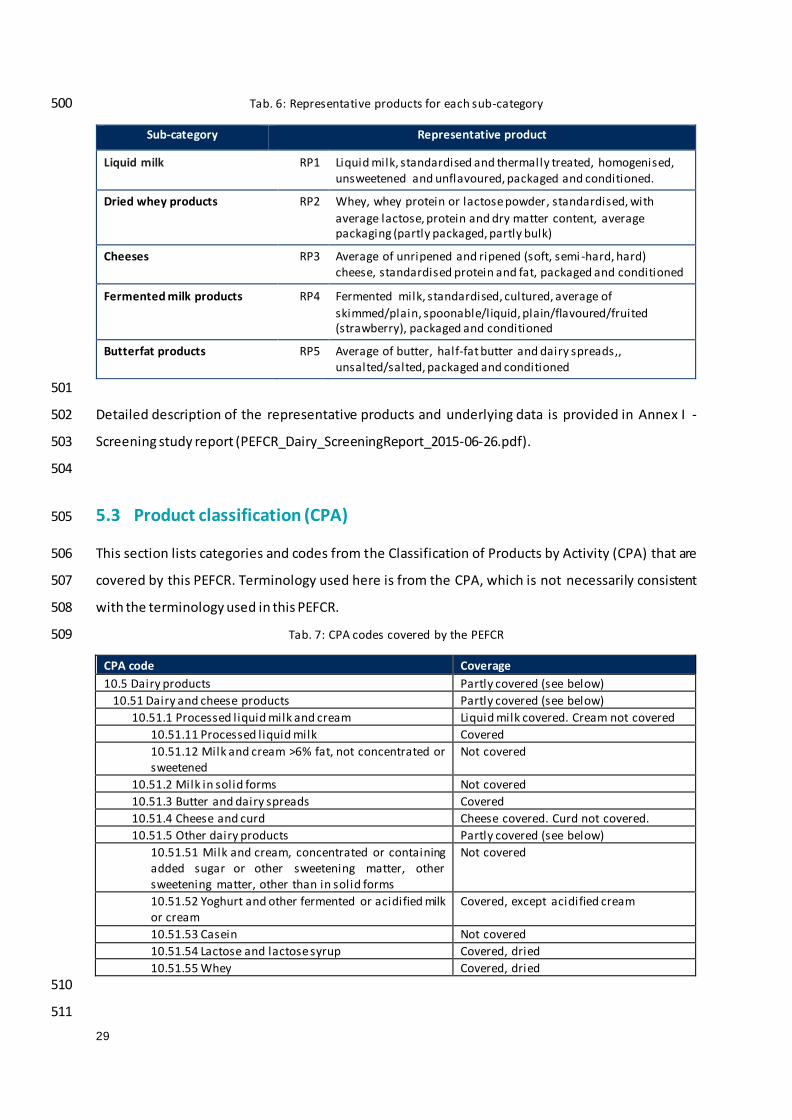
Tab. 6: Representative products for each sub-category 500
Sub-category Representative product
Liquid milk RP1 Liquid milk, standardised and thermally treated, homogenised, unsweetened and unflavoured, packaged and conditioned.
Dried whey products RP2 Whey, whey protein or lactose powder, standardised, with
average lactose, protein and dry matter content, average packaging (partly packaged, partly bulk)
Cheeses RP3 Average of unripened and ripened (soft, semi -hard, hard) cheese, standardised protein and fat, packaged and conditioned
Fermented milk products RP4 Fermented milk, standardised, cultured, average of
skimmed/plain, spoonable/liquid, plain/flavoured/fruited (strawberry), packaged and conditioned
Butterfat products RP5 Average of butter, half-fat butter and dairy spreads,, unsalted/salted, packaged and conditioned
501
Detailed description of the representative products and underlying data is provided in Annex I - 502
Screening study report (PEFCR_Dairy_ScreeningReport_2015-06-26.pdf). 503
504
5.3 Product classification (CPA) 505
This section lists categories and codes from the Classification of Products by Activity (CPA) that are 506
covered by this PEFCR. Terminology used here is from the CPA, which is not necessarily consistent 507
with the terminology used in this PEFCR. 508
Tab. 7: CPA codes covered by the PEFCR 509
CPA code Coverage
10.5 Dairy products Partly covered (see below)
10.51 Dairy and cheese products Partly covered (see below)
10.51.1 Processed liquid milk and cream Liquid milk covered. Cream not covered
10.51.11 Processed liquid milk Covered
10.51.12 Milk and cream >6% fat, not concentrated or sweetened
Not covered
10.51.2 Milk in solid forms Not covered
10.51.3 Butter and dairy spreads Covered
10.51.4 Cheese and curd Cheese covered. Curd not covered.
10.51.5 Other dairy products Partly covered (see below)
10.51.51 Milk and cream, concentrated or containing added sugar or other sweetening matter, other sweetening matter, other than in solid forms
Not covered
10.51.52 Yoghurt and other fermented or acidified milk or cream
Covered, except acidified cream
10.51.53 Casein Not covered
10.51.54 Lactose and lactose syrup Covered, dried
10.51.55 Whey Covered, dried
510
511

30
The following list (not exhaustive) of products are not covered by this PEFCR: 512
• Dried milks (powders and concentrate) 513
• Creams 514
• Sweetened or flavoured milk-based drinks 515
• Whey drinks 516
• Processed cheese 517
• Greek-style yoghurts 518
• Milk-based desserts 519
• Casein products 520
• Butteroils 521
• Composite products: dairy ingredients only are covered 522
• Edible ice or ice cream: milk, as an ingredient of edible ices, is covered. 523
• Infant formula: milk, as an ingredient of infant formula, is covered. 524
• Milk and dairy products from other mammals than cattle (e.g. water buffalo, sheep or goat). 525
526

31
5.4 System boundaries, life-cycle stages and processes 527
5.4.1 Life cycle stages 528
The entire life cycle, from cradle to grave, shall be assessed for the following sub-categories: liquid 529
milk, cheeses, fermented milk products and butterfat products. Dried whey products are considered 530
as "intermediate products", and therefore only stages 1, 2, 3 and 4 in Tab. 8 shall be included. The 531
system includes six main life cycle stages: i) "Raw milk", ii) "Dairy processing", iii) “Non-dairy 532
ingredients supply”, iv) "Packaging”, v) “Distribution”, vi) “Use” and vii) “End-of-life” (Tab. 8). 533
534
Tab. 8: Activities included in each life cycle stage 535
Life cycle stage Activities
1. Raw milk supply Feed production (incl. pesticide and fertil iser inputs and emissions, energy, irrigation water, land transformation, feed processing, etc.)
Milk production (incl. emissions from enteric fermentation, from manure management at the farm and from direct excretion on the land)
Milk collection and transport to dairy unit
2. Dairy processing Dairy products processing (incl. energy use and wastewater treatment)
Dairy ingredients processing (incl. energy use and wastewater treatment)
Dairy ingredients transport to dairy unit
Container fi l l ing or product packing
On-site warehousing (storage)
3. Non-dairy
ingredients supply
Production of non-dairy ingredients
Non-dairy ingredients packaging manufacturing
Non-dairy ingredients transport to dairy unit
4. Packaging Raw materials production
Packaging manufacturing (primary and secondary)
Packaging transport to dairy unit
5. Distribution Transport to the distribution centre
Warehousing at distribution centre (storage)
Transport to point of sale
Retail ing at point of sale (storage)
Transport to final user
6. Use Chill ing operations (at final user)
7. End-of-life Household waste: packaging and food waste transport and treatment (incineration, incineration with energy recovery, landfil ling, recycling and
composting)
536

32
5.4.2 System boundaries 537
Figure 3 illustrates the system boundaries for dairy products in the view of a traditional LCA. The 538
foreground system is greyed while the background (upstream and downstream) system is in white. 539
This distinction is made in the perspective of dairy processors, but when other stakeholders (e.g. dairy 540
farmers, retailers, restaurants, food processors) are using the current PEFCR, the actual foreground 541
and background systems may differ. 542
543 544
Figure 3: System boundaries diagram for dairy products ("traditional LCA" view) 545
546
In the PEF context, the foreground and background systems shall however be defined in relation to 547
the so-called "materiality approach", which considers a) the relevance of the processes/stages driving 548
the environmental impact, and b) the level of influence that the company performing the PEF study 549
has on them. The Data Needs Matrix (DNM) combines information on the level of relevance to the 550
environmental footprint (most-relevant or not) and the level of influence of the company performing 551
the study. In that regards, three situations can occur: 552

33
Situation 1: the process is run by the company applying the PEFCR 553
Situation 2: the process is not run by the company applying the PEFCR but it is possible to have 554
access to (company-)specific information. 555
Situation 3: the process is not run by the company applying the PEFCR and this company has 556
no possibility to have access to (company-)specific information. 557
The application of the DNM principle to dairy products, in the perspective of dairy processors, is 558
summarised in Tab. 9: 559
Tab. 9: Application of the data needs matrix to dairy products 560
Life cycle stage Level of influence Relevance to
impact
Data requirements
1. Raw milk supply Situation 2 High Company-specific datasets
2. Dairy processing Situation 1 Medium/Low Company-specific datasets
3. Non-dairy ingredients supply Situation 3 Medium/Low Secondary datasets
4. Packaging Situation 3 Medium/Low Secondary datasets
5. Distribution Situation 3 Medium/low Secondary datasets
6. Use stage Situation 3 Low Secondary datasets
7. End-of-life Situation 3 Low (*) Secondary datasets
(*) Excluding food wastage, which is assessed separately in the current PEFCR (see section 6.9) 561
562
It is acknowledged that other stakeholders using the current PEFCR (e.g. public agencies or retailers) 563
would have a different level of influence on each life cycle stage, and should therefore adapt their 564
foreground (requirement to use company-specific datasets) and background (ability to use secondary 565
datasets) systems accordingly. In some cases, the raw milk supply stage might fall into the background 566
system, despite its high relevance to the environmental impact. 567
5.4.3 Cut-off and exclusions 568
The evaluation focuses on significant contributions to the overall footprint. Small contributions do add 569
up however, so this PEFCR attempts to avoid exclusions whenever possible. Default data is provided 570
for small contributions. Anything not included in this PEFCR that seems relevant could be estimated 571
in a sensitivity analysis. 572
573
5.4.4 Processes per life cycle stage 574
The raw milk production stage is common to all dairy products. This section provides a simplified 575
overview of main inputs and outputs related to the production of raw milk. For detailed data collection 576
requirements, see section 6.3.1. 577
Inputs 578
Feed (grass, fodder, concentrate) 579

34
Mineral fertilisers and pesticides for feed production 580
Animals for dairy production 581
Bed materials (straw, paper, sand) 582
Manure 583
Fuel for machinery 584
Production of energy used at the farm 585
Outputs 586
Raw milk 587
"Meat", or live animals for slaughter or further fattening (cull cows and calves) 588
Manure 589
Renewable energy 590
Emissions from combustion of fossil fuels 591
Emissions from enteric fermentation 592
Emissions from manure storage 593
Emissions from manure application 594
Emissions from mineral fertilisers and pesticides application 595
Emissions from mineral and organic soils 596
Excluded (until default data is available): 597
Refrigerants used at farm 598
Farming equipment (capital goods) & barn 599
600
601
Figure 4: Il lustration of material and energy flows in dairy farming system 602
603
The main inputs and outputs related to the dairy processing stage can be summarised as follows: 604
Inputs 605

35
Raw milk 606
Dairy ingredients (i.e. intermediate dairy products) 607
Non-dairy ingredients (i.e. salt, sugar, fruit preparation, herbs, rennet, yeast) (treated in life 608
cycle stage “Non-dairy ingredients supply”) 609
Cleaning agents 610
Packaging (treated in life cycle stage "packaging") 611
Energy (i.e. heat and electricity) 612
Water 613
Refrigerant Gases 614
Outputs 615
Dairy products 616
Wastewater 617
Emissions to air and water 618
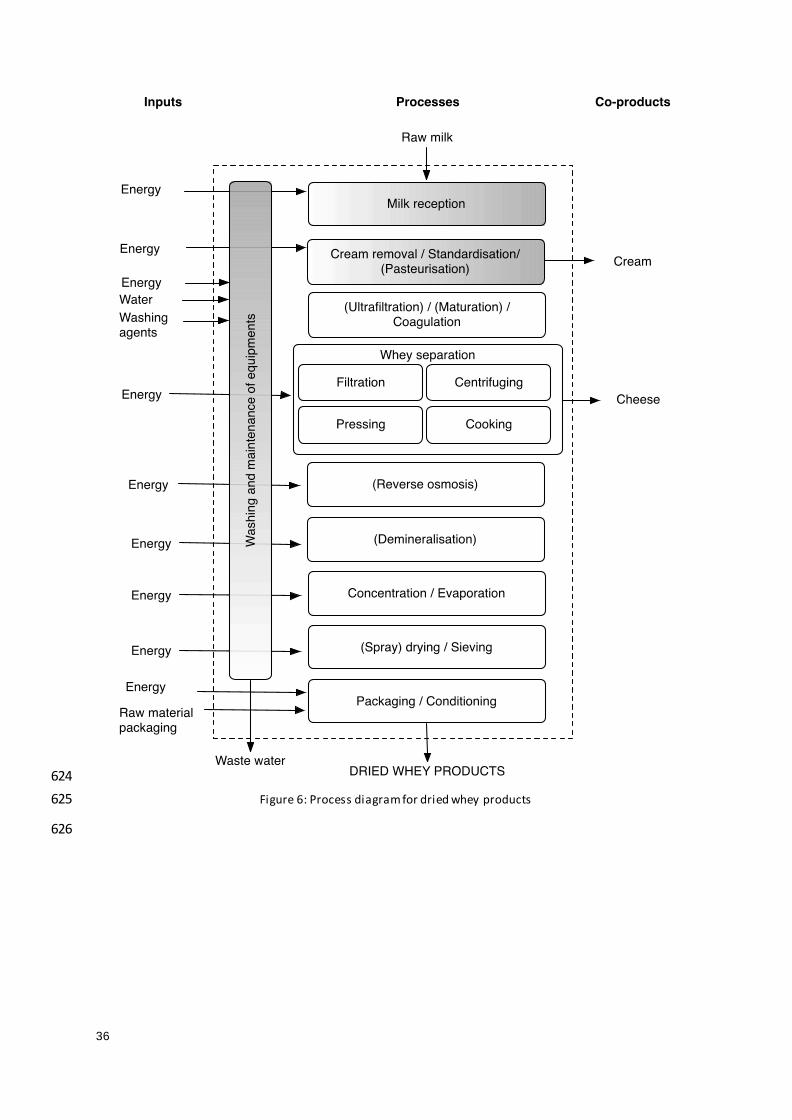
Process diagrams for the stage "Dairy processing" of every sub-category are detailed in the figures 619
below. 620
621
Figure 5: Process diagram for l iquid milk 622
623
36
624
Figure 6: Process diagram for dried whey products 625
626

37
627
Figure 7: Process diagram for cheeses 628

38
629
Figure 8: Process diagram for fermented milk products 630
631
(Fermentation)
Ingredients Enrichment
(Incubation)
Packaging / Conditioning
FERMENTED MILKS PRODUCTS
Cream removal / Standardisation (Pasteurisation)
(Pasteurisation)
Energy
CreamEnergy
Milk reception
Energy
Lactic ferments
Washing agents
Water
Energy
Waste water
Energy
(Packaging)
Raw materialpackaging
Energy
Energy
Wa
sh
ing
an
d m
ain
ten
an
ce
of e
qu
ipm
en
ts
CoolingEnergy
Raw milk
Inputs Processes Co-products
Dried milk

39
632
Figure 9: Process diagram for butterfat products 633
634
5.4.5 Processes excluded from the system boundaries 635
The following processes can be excluded from the system boundaries (see also screening report in 636
Annex I for further explanation on the exclusion): 637
Transportation of input products to the dairy plant accounting for less than 1% in mass 638
Solid waste at the dairy unit 639
Capital goods at the farm, at distribution centre and at retail 640
Refrigerant emissions from milk cooling at the farm 641
Ambient storage at the consumer home 642
Cutlery for dairy products consumption at consumer home 643
Dishwashing or hand washing at the consumer home 644

40
645
5.5 Selection of the EF impact categories indicators 646
The table below provides the list of 15 Environmental Footprint (EF) impact categories related to the 647
assessment methods that shall be used (European Commission, 2013) 6. For each impact category, the 648
following information are provided: 649
- Impact categories 650
- Impact assessment model 651
- Impact category indicator 652
- Source 653
- Classification of the methods performed in the ILCD Handbook “Recommendations for Life 654
Cycle Impact Assessment in the European context”, JRC, 2011. The recommended 655
characterisation models and associated characterisation factors are classified into three levels 656
according to their quality: 657
o Level I: recommended and satisfactory 658
o Level II: recommended, but in need of some improvements 659
o Level III: recommended, but to be applied with caution 660
661
6 The models used for some of the impact categories in Tab. 8 might stil l be reviewed by the European
Commission, e.g. Water resource depletion and Mineral, fossi l & renewable resource depletion.

41
Tab. 10: List of impact categories and related assessment methods used 662
Impact category Model Unit Source EU classi-
fication
Climate change Bern model – Global Warming potentials (GWP) over a 100
year time horizon
kg CO2 eq Intergovernmental Panel on Climate
Change, 2007
I
Ozone depletion EDIP model based on the ODPs
of the WMO over an infinite time horizon
kg CFC-11 eq WMO, 1999 I
Freshwater
ecotoxicity
USETox model CTUe Rosenbaum et al.,
2008
II/III
Human toxicity –
cancer effects
USETox model CTUh Rosenbaum et al.,
2008
II/III
Human toxicity – non-cancer effects
USETox model CTUh Rosenbaum et al., 2008
II/III
Particulate matter RiskPoll model kg PM2.5 eq Humbert, 2009 I
Ionising radiation Human Health effect model kg U235 eq Dreicer et al., 1995 II
Photochemical
ozone formation
LOTOS-EUROS model kg NMVOC eq van Zelm et al., 2008 II
Acidification Accumulated Exceedance model
mol H+ eq Seppälä et al.,2006; Posch et al., 2008
II
Terrestrial eutrophication
Accumulated Exceedance model
mol N eq Seppälä et al.,2006; Posch et al., 2008
II
Freshwater eutrophication
EUTREND model kg P eq Struijs et al., 2009 II
Marine eutrophication
EUTREND model kg N eq Struijs et al., 2009 II
Land use Soil Organic matter (SOM) model
kg C deficit Milà i Canals et al., 2007
III
Water resource depletion
Swiss Ecoscarcity model m3 water eq Frischknecht et al., 2008
III
Mineral, fossil, & renewable resource depletion
CML 2002 model kg Sb eq van Oers et al., 2002 II
663
The most relevant impact categories identified for the final products assessed in the PEF screening 664
(see Annex I - Screening study report) are the following: 665
Climate change 666
Water resource depletion 667
Freshwater eutrophication 668
Marine eutrophication 669
Terrestrial eutrophication 670
Freshwater ecotoxicity 671
Land use 672
Acidification 673
The selection of the relevant categories has been made based on expert knowledge; the screening 674
report, annexed to this PEFCR, describes in further detail the references. Comparative assertions 675

42
regarding the most relevant impact categories with a lower EU-classification should be handled with 676
much caution until calculation methods and available datasets have been further improved. For other 677
impact categories, comparative assertions are only allowed when the models to estimate these use 678
exactly the same methodology. 679
680
The rationale for the selection of these impact categories is provided in Tab. 11. 681
Tab. 11: Rationale for selecting most relevant impact categories for dairy products 682
Impact category Rationale
Climate change GHG emissions from cattle (feed production, enteric fermentation and manure) is a recognised environmental issue worldwide. The screening study showed that this is among the best known and most reliable impact category, for which key elementary flows are commonly measured or documented.
Water resource depletion Dairy products being at the top of the food pyramid, they play a role in the competition for water, through feed production and drinking needs of cattle. Use of water resources can be influenced by practices at dairy farming.
Freshwater eutrophication Use of P fertilisers (organic or mineral) for feed production is a well-known environmental issue in the agricultural sector. Eutrophication was also identified as a potential issue in the wastewater treatment of effluents
from dairy processing units.
Marine eutrophication
Terrestrial eutrophication
Use of N fertilisers (organic or mineral) for feed production is a well-known environmental issue in the agricultural sector. Proper management of the nitrogen flows, from feed intake to manure is also an
important lever for dairy farmers to improve their sustainability record. Freshwater ecotoxicity Ecotoxicity is a key issue in working towards sustainable agriculture. Dairy
farmers can act upon the use of toxic substances and influence toxic impact of dairy products on ecosystems.
Land use Dairy products being at the top of the food pyramid, they play a role in
the competition for arable land, through feed production and grazing areas. Land use and biodiversity can be influenced by practices at dairy farming.
Acidification Use of N fertilisers (organic or mineral) for feed production is a well-known environmental issue in the agricultural sector. Proper management of the nitrogen flows, from feed intake to manure is also an important lever for dairy farmers to improve their sustainability record.
683
For intermediate products (i.e. products from the sub-category "dried whey products"), all 15 impact 684
categories shall be assessed. 685
In addition to the impact categories above, biodiversity and deforestation are also key environmental 686
issues relevant to the dairy sector, but these are only partly addressed through the current life cycle 687
assessment approach. Further information biodiversity is provided in section 5.6 (Additional 688
environmental information). 689
For communication purposes, the following three impact categories shall minimally be reported: 690

43
Climate change 691
Water resource depletion 692
Land use 693
694
5.6 Additional environmental information 695
Practitioners should report additional environmental information as described in European 696
Commission (2013) PEF Guide. Additional environmental information should include (non-exhaustive 697
list): 698
a) List of ingredients (dairy products); 699
b) Bill of materials (packaging) 700
c) Recyclability, recoverability, reusability information, resource efficiency (packaging); 701
d) Information on local/site-specific impacts, e.g. local impacts on acidification, eutrophication 702
and biodiversity (see below); 703
Other relevant environmental information on the activities and/or sites involved, as well as on the 704
product output. Additionally, information regarding the company work with social/environmental 705
responsibility but also data about specific environmental characteristics of the product may be added. 706
5.6.1 Impact on biodiversity 707
Livestock production plays an important role on biodiversity with either positive or negative impact 708
depending on farming practices: grassland management, agricultural practices, land use change and 709
agro-ecological infrastructures. 710
In the European context of dairy farming, the biodiversity “hotspots” could be summarised in the three 711
following topics: 712
Maintaining pastures 713
Semi-natural habitats (hedges, trees, wild strips, river banks) 714
Deforestation in the feed supply chain (mainly soybean and palm meal) 715
Natural habitat degradation through emission of eco-toxic, eutrophiying or acidifying 716
substances (covered by LCA impact categories) 717
718
Stakeholders following this PEFCR shall therefore report on the following additional indicators, which 719
attempt to capture in a semi-quantitative way the potential impact of dairy products on biodiversity: 720
721

44
Share of grass from pasture in the feed ration, in % of total dry matter intake (DMI) 722
o When raw milk supply is part of the foreground system, the actual value 723
representative of the supply chain shall be reported. 724
o When raw milk supply is part of the background system, the default data from Annex 725
VI (yet to be provided) for each EU member State should be used for reporting. 726
Semi-natural habitats, in % of the dairy farms area 727
o When raw milk supply is part of the foreground system, the actual value 728
representative of the supply chain shall be reported. Tools such as the French CAP2ER 729
can be used for that purpose. 730
o When raw milk supply is part of the background system, the default data from from 731
Annex VI (yet to be provided) for each EU member State should be used for reporting. 732
Share of feed with possible risk of deforestation in its supply chain within the feed ration, 733
in % of total dry matter intake (DMI) 734
o When raw milk supply is part of the foreground system, this indicator shall be 735
calculated as the sum of DMI from non-certified soybean from Brazil and Argentina 736
and non-certified palm meal from Southeast Asia, divided by the total DMI in the feed 737
ration. 738
o When raw milk supply is part of the background system, the default values in the feed 739
supply chain from the official EF life cycle inventory database shall be reported. 740
Schemes related to biodiversity 741
o When raw milk supply is part of the foreground system, a description of the different 742
schemes (certified or not) in the raw milk supply chain (i.e. at the dairy farm in in 743
upstream feed production) and how they relate to biodiversity conservation shall be 744
provided. 745
o When possible, the share of raw milk in the product recipe within each scheme should 746
be reported, in % of the total raw milk supply, as per the table below. 747
748
Tab. 12: Typical information to be provided on schemes related to biodiversity 749
750
Scheme Relevance to biodiversity conservation % of total raw milk
supply in product
Name of scheme
(mandatory)
Description of the scheme (i.e. applicability, scope,
website, etc.) and of how the scheme relates to biodiversity conservation (mandatory)
(optional)
… … …

45
751
5.7 Assumptions/limitations 752
Dairy products listed in section 5.3 are not part of the scope of this PEFCR. However, as long as no 753
specific PEFCR is addressing creams, milk-based drinks, milk powders, fruited yogurts other than with 754
strawberry or milk-based desserts, companies desiring to assess the PEF of their products are invited 755
to be aligned as much as possible with this PEFCR. 756
757
Another main limitation of this PEFCR is the availability of data on land use change (LUC) and water 758
use for crop production in supplying markets, and the way these data are reflected in the impact 759
categories “land use” and “water resource depletion”. 760
761
Default data provided through this PEFCR has limited applicability to products or materials imported 762
from outside the EU. This may have significant effects on results. Default datasets can be tested 763
against geographically adequate alternatives in sensitivity analyses for nuanced results reporting. 764
765
Since the multi-functionality of packaging is not fully captured by the current PEF methodology, the 766
dairy PEFCR is not meant to support specific comparison or comparative assertion between packaging 767
formats. 768
769
770

46
6 Resource use and emission profile 771
6.1 Screening step 772
The main outcomes of the screening study are reported in Annex I - Screening study report. According 773
to the PEF screening, the most relevant life cycle stages7 are: 774
Raw milk supply 775
Distribution (except for dried whey products, since out of system boundaries) 776
Dairy processing 777
Packaging (for liquid milk and fermented milk products only) 778
While the most relevant processes in these life cycle stages are summarised in Tab. 13. 779
Tab. 13: Most relevant processes identified in the screening study, per l ife cycle stage 780
(*) Not considering food wastage, treated separately (see section 6.9) 781
The effort of data collection shall be focused on these most relevant life cycle stages and processes 782
identified in the PEF screening. In order to classify the data as specific, semi-specific or generic data, 783
the following rules shall be considered (according to the PEF Guidance (2014)): 784
7 In the screening study, the use stage was identified as a relevant l ife cycle stage for l iquid milk, in relation to
dishwashing. After the screening study was completed, the TAB recommended that non-specific use stage scenarios should not be included in the PEF. Therefore, dishwashing being excluded from the system boundaries, the use stage no longer appears in the list of relevant l ife cycle stages.
Life cycle stage Relevant processes
Raw milk supply Feed production (on- and off-farm)
Enteric fermentation
Manure storage
Dairy processing Energy carriers
Water use
Wastewater treatment
Non-dairy ingredients supply
Non-dairy ingredients production
Packaging Raw materials manufacturing, especially liquid packaging board (LPB)
and plastics
Distribution Chilled transports
Chilled storage at retail
Transport by the consumer
Use Not relevant
End-of-life Not relevant (*)

47
Primary/site-specific data are data that shall be collected specifically by each company. 785
Primary/site-specific data are significant regarding each environmental indicator and 786
accessible for companies. 787
Semi-specific data for which default values are proposed but company can replace it by better 788
ones if they have it. Semi-specific data are significant regarding each environmental indicator 789
but not easily accessible for companies. Semi-specific data can be replaced by primary data 790
when available. Semi- specific data should be based on a worst case scenario. 791
Secondary/generic data for which sources shall be defined or default data provided. 792
Ideally, primary data should be used for all stages, but in practice, only secondary data may be 793
available for some processes. In principle, primary data should at least be collected for the foreground 794
system while secondary data may be used for the background system. Based on the definition of 795
background and foreground systems in Tab. 9 the following requirements shall be followed for dairy 796
processors: 797
Tab. 14: Data requirements for dairy processors 798
Life cycle stage Foreground/Background Data requirements
1. Raw milk supply Foreground Primary or semi-specific if justified
2. Dairy processing Foreground Primary
3. Non-dairy ingredients supply
Background Semi-specific
4. Packaging Background Semi-specific
5. Distribution Background Semi-specific
6. Use stage Background Secondary
7. End-of-life Background Secondary
799
Other stakeholders (i.e. all but dairy processors) using the current PEFCR would however not have the 800
same level of influence on each life cycle stage, and would therefore have different foreground and 801
background systems. The current PEFCR therefore provides semi-specific or secondary data for raw 802
milk production and dairy processing, as to ensure that it can serve any stakeholder interested in 803
calculating the EF of dairy products or dairy ingredients. 804
805
806

48
6.2 Data quality requirements 807
Data quality assesses both background datasets and primary activity data, according to the European 808
Commission (2013) (PEF Guide). This semi-quantitative assessment shall assess the data quality of the 809
background datasets based on six criteria: 810
Five relating to the data: 811
i. Technological representativeness (TeR) 812
ii. Geographical representativeness (GR) 813
iii. Time-related representativeness (TiR) 814
iv. Completeness (C) 815
v. Parameter uncertainty (P) 816
One relating to the methodology 817
i. Methodological Appropriateness and Consistency (M) 818
Five quality levels are defined for each criterion: 819
Very good (1); 820
Good (2); 821
Fair (3); 822
Poor (4); 823
Very poor (5). 824
The overall Data Quality Rating (DQR) shall be calculated by summing up the achieved quality rating 825
for each of the quality criteria, divided by the total number of criteria (i.e. six). 826
827
Equation 1: Data quality rating calculation 828
The Data Quality Rating (DQR) shall correspond to a data quality level defined as follows: 829
Overall data quality rating (DQR) ≤ 1,6: excellent quality 830
Overall data quality rating (DQR) from 1,6 to 2,0: very good quality 831
Overall data quality rating (DQR) from 2,0 to 3,0: good quality 832
Overall data quality rating (DQR) from 3 to 4,0: fair quality 833
Overall data quality rating (DQR) > 4: poor quality 834
This semi-quantitative assessment shall be done at least for the datasets related to the most relevant 835
processes identified by the analysis. 836
Tab. 15 presents the criteria that shall be used to perform the Data Quality Assessment. 837

49
Tab. 15: Criteria for the data quality assessment according to the PEF Guide (2013) 838
Quality level
Quality rating
Technological represent. (TeR)
Geographical represent. (GR)
Time represent. (TiR)
Completeness (C)
Parameter uncertainty (P)
Methodological compliance and consistency (M)
Very good
1 The specific technology considered
Specific to the region considered in the scope of the analysis
≤ 3 year old data
≥90% of a full LCI
Very low uncertainty (≤ 10%)
Full compliance with all requirements of the PEF guide
Good 2 Average in Europe for the specific technology based on the consumption
Average of several countries in the geographical scope of the analysis
3-5 years old data
80%-90% of a full LCI
Low uncertainty (10% to 20%)
Attributional Process based approach AND: Following three method requirements of the PEF Guide (2013) met: — Dealing with multi-functionality — End of life modelling —
System boundary
Fair 3 Average in Europe for the specific technology based on the production
Referred to a different country in the same geographical scope of the analysis
5-10 years old data
70-80% of a full LCI
Fair uncertainty (20% to 30%)
Attributional process-based 1999-2005 approach AND: The following two method requirements of the PEF Guide (2013) are met: — Dealing with multi-functionality — End of life modelling However, the following method requirement of the PEF Guide (2013) is not met: — System boundary
Poor 4 Average in Europe for a similar technology based on the consumption
Referred to a different region, out from the geographical scope but with similar characteristic
10-15 years old data
50-70% of a full LCI
High uncertainty (30% to 50%)
Attributional process-based approach AND: The following method requirement of the PEF Guide (2013) met: — Dealing with multi-functionality However, the following two method requirements of the PEF Guide (2013) are not met: — End-of-life modelling — System boundary
Very poor
5 Other process or unknown
Global or unknown
≥ 15 years old data
<50% of a full LCI
Very high uncertainty (> 50%)
Attributional process-based approach BUT: None of the following three method requirements of the PEF Guide (2013) are met: — Dealing with multi-functionality — End-of-life modelling — System boundary
839
840
841
842

50
6.3 Requirements regarding foreground specific data collection 843
6.3.1 Raw milk production 844
Raw milk production at the farm is a hotspot for the majority of impact categories. Therefore, raw 845
milk shall always be included in the perimeter of the PEF study. The variability of dairy farming systems 846
(breed, feed supply and rations, grazing or non-grazing, manure management systems) is high, 847
affecting the environmental footprint of the raw milk. 848
Primary data for raw milk production shall be used whenever it is available or can be collected with 849
a reasonable cost and effort, typically when part of the dairy producer’s own supply chain (i.e. 850
whenever the commissioner of PEF study has access to raw milk suppliers). The same rule applies to 851
all dairy ingredients accounting for 5% or more of the total mass of the dairy product. 852
Modelling of raw milk production shall be based on Tab. 16, 17, and 18. Tab. 16 shall be used to 853
determine which purchased farm inputs have to be included in raw milk modelling, whereas Tab. 17 854
shall be used to calculate on farm emissions and Tab. 18 to determine which farm products have to 855
be considered including the allocation method to be used. National Inventory Reports should be used 856
as a leading document for country-specific modelling parameters. 857
858
Tab. 16: Included and excluded inputs on the dairy farm1 859
Farm inputs Subtype Comment
Included
Mineral fertil isers
Nitrogen fertil izer Including all N-containing fertil isers
Phosphorus fertil izer Including all P-containing fertil isers
Potassium fertil izer Including all K-containing fertil isers
Lime Including all Ca-containing fertil isers
Organic fertil isers
Manure Only emissions from manure application should be accounted for
Organic fertil izers Any bio-based fertil iser, such as plant-based fertil iser, manure pellets, biochar.
Dairy cattle Dairy cattle Dairy cows (dry and lactating), calves, young stock until 1 year of
age and young stock over 1 year, heifers.
Energy Electricity Country-specific (from grid) on produced on-site
Diesel All diesel use at farm
Natural gas All natural gas used at farm
Other energy Any other energy input such as propane, wood pellets, etc.
Feed Compound feed All types of compound feed
Roughage All roughage types
Other feeds All purchased other feeds, such as single ingredients, (wet) by-products from industry
Other Bedding material All types of bedding material used to house dairy cattle
Pesticides All pesticides, i .e. herbicides, insecticides, nematocides, fungicides
Silage plastic Packaging etc.
Water Irrigation On farm irrigation for feed crops . differentiate between ground, surface and tap water.

51
Farm inputs Subtype Comment
Drinking and
cleaning water
Differentiate between ground, surface and tap water.
Excluded
Capital goods Stables Excluded until representative datasets are available
Machinery Excluded until representative datasets are available
Feed production
Seeds Excluded until representative datasets are available
Refrigerants Milk cooling Excluded until representative datasets are available 1This table refers to environmental burdens of production of purchased farm inputs that shall be included in the perimeter of the study. 860
861
Tab. 17: Included and excluded on-farm emissions 862
Substance Process Minimum requirement Optional
Included
Methane (CH4) Enteric fermentation
IPCC Tier 2: Animal numbers and animal feeding type (e.g. feedlot cattle, cattle grazing) are taken into account. It is based
on emission factors (Ym) per animal types and on Gross Energy intake (GE). Emission = GE x Ym.
IPCC Tier 3 (considering national specificities): Total dry matter intake
(DMI) and digestibility of feed are added to equation used in Tier 2 or
util ize alternative estimation methods based on country-specific methodology.
Manure storage
IPCC Tier 2: Detailed information about the manure characteristics (calculated based on
gross energy intake, digestibil ity of the feed) and manure management practices (default values).
IPCC Tier 3: Country specific methodologies
and emission factors are used.
Direct nitrous oxide (N2O)
Manure storage
IPCC Tier 1: the total amount of nitrogen excretion in each type of manure management system is multiplied by an
emissions factor for that type of manure management system (default values used).
IPCC Tier 2: As tier 1 but country-specific data for some or all variables are
used. IPCC Tier 3: Util izes alternative estimation methods based on
country-specific methodology.
Manure excretion on the pasture
Manure application
IPCC Tier 1: Amount of nitrogen from manure artificial fertil izer or crop residues applied to soils is multiplied by a default emission factor.
IPCC Tier 2: As Tier 1 but with country specific emission factors. IPCC Tier 3: Util izes
alternative estimation methods based on country-specific
methodology.
Nitrogen
fertil izer application
Crop residues4
Organic soils (peat)
IPCC Tier 1: Hectares of managed or drained organic soils multiplied by a default
emission factor.
IPCC: Tier 2: As Tier 1 but with country specific
emission factors. IPCC: Tier 3: Util izes alternative estimation
methods based on

52
Substance Process Minimum requirement Optional
country-specific methodology.
Mineral soils IPCC: Tier 1: Amount of nitrogen in mineral soils that is mineralized multiplied by a default emission factor.
IPCC Tier 2: As tier 1 but with country specific emission factors.
IPCC Tier 3: Util izes alternative estimation methods based on
country-specific methodology.
Indirect
nitrous oxide due to N volatil ization
(ammonia and nitric oxides)2
Manure
storage
IPCC Tier 1: Nitrogen volatil ization
multiplied by a default emission factor.
IPCC Tier 2: As tier 1 but
country-specific emission factor used. IPCC Tier 3: Util izes
alternative estimation methods based on country-specific methodology.
Manure
application
Manure excretion in
the pasture
Nitrogen
fertil izer application
Indirect nitrous oxide due to N leaching3
Manure application
IPCC Tier 1: Nitrogen leaching multiplied by a default emission factor.
IPCC Tier 2: As tier 1 but country-specific emission factor used. IPCC Tier 3: Util izes
alternative estimation methods based on country-specific methodology.
Manure excretion in
the pasture
Nitrogen fertil izer
application
Crop residues4
Ammonia (NH3) and
nitric oxides (NOx)
Manure storage
EMEP/EEA Tier 2: based on livestock numbers; total nitrogen excretion rates
(calculated based on IPCC guidelines); proportion of nitrogen excreted in l ivestock buildings, uncovered yards and grazing; proportion of nitrogen excreted as total
ammoniacal nitrogen (TAN) and proportion of the excretion place; amount of manure handled as slurry or as solid manure; use of bedding for animals; manure storage
system; and amount of manure spread on fields
EMEP/EEA Tier 3: Util izes alternative
estimation methods based on country-specific methodology.
Manure application
Manure excretion in the pasture
Nitrogen fertil izer application
Phosphate (PO4-)
Manure application
Amount of phosphorus applied
Util izes alternative estimation methods based on country-specific methodology.
Manure
excretion in the pasture
Artificial fertil izer application

53
Substance Process Minimum requirement Optional
Particulate matter (PM2.5)
Animal housing
EMEP EAA tier 2: based on share of time animals spend in the animal house and share of population kept in slurry based
systems
EMEP EAA Tier 3: country specific emission factors or
methods.
Non-methane
volatile solids (NMVOC)
Silage feeding EMEP EAA Tier 2: based on gross feed intake
(country specific or default), time animals spend indoors during a year, fraction of silage feed during housing, volatile solid excreted (country specific if possible)
EMEP EAA Tier 3:
country specific emission factors or methods.
Housing
Grazing
Nitrate (NO3) Manure application
IPCC Tier 1: Nitrate leaching is based on multiplication of the amount of nitrogen
excreted or added to soils by a default fraction of leached nitrogen.
IPCC Tier 2: As tier 1 but country-specific leaching
factor and or nitrogen excretion. IPCC Tier 3: Util izes alternative estimation
methods based on country-specific methodology.
Manure excretion in the pasture
Artificial fertil izer
application
Crop residues4
Carbon dioxide (CO2)
Application of l ime
IPCC Tier 1: Amount of l ime (l imestone or dolomite) applied multiplied by a default emission factor.
IPCC: Tier 2: As tier 1 but with country specific emission factors.
IPCC Tier 3: Util izes alternative estimation methods based on country-specific
methodology.
Application of
urea
IPCC Tier 1: Amount of urea applied
multiplied by a default emission factor.
IPCC: Tier 2: As tier 1 but
with country specific emission factors. IPCC Tier 3: Util izes alternative estimation
methods based on country-specific methodology.
Fuel combustion
Depending on available dataset. Use fuel and country specific heating values and emission factors.
Heavy metals Application of manure
Ensure heavy metal balance, i.e. include heavy metal inputs from manure, fertil izers
and atmospheric deposition. Consider outputs from leaching, soil deposition and harvesting.
Pesticides Application of
pesticides
Country and crop specific amounts of active
component from pesticides applied. 100% of pesticides applied emitted to the soil.
Excluded
Refrigerants Milk cooling Excluded, due to lack of data.
Carbon dioxide (CO2)
Carbon sequestration
Excluded: CMWG guidelines: Changes in soil carbon levels are regarded as changes in carbon stocks, and therefore, shall not be included in the PEF impact category ‘climate change’, unless the changes are related to
land use change that happened less than 20 years before the assessment year.

54
1 If a PEF study concerns a comparative assertion, methods to calculate emissions shall be identical. 863 2 N volatilization in line with NH3 and NOx emission elsewhere in this table. 864 3 N leaching in line with nitrate leaching elsewhere in this table. 865 4 Include crop residues occurring during harvesting, meadowing, grassland renewal, crop rotation and plant fertilizers. 866 867
Tab. 18: Allocation methods to be used for products produced on dairy farms 868
Farm products Description Allocation method
Raw milk Raw milk delivered for
consumption.
Biophysical allocation (IDF, 2015)
Dairy products
produced on farm
Any dairy product directly
sold for consumption.
If both raw milk and dairy products are produced on
the farm use system subdivision for on farm dairy processing.
Sold l ive dairy cattle Dairy cattle sold for
fattening or replacement.
Biophysical allocation (IDF, 2015)
Dead dairy cattle
leaving the farm
Dairy cattle that died on
the farm.
No allocation.
Manure as residual product
Manure is exported form the farm as product with
no economic value.
No allocation: burden allocated to other products produced at farm, including pre-treatment of
manure.
Manure as co-product Manure is exported from
the farm as product with economic value.
Economic allocation of the upstream burden shall be
used for manure by using the relative economic value of manure compared to milk and live animals at the farm gate. Biophysical allocation based on IDF rules shall be applied to allocate the remaining emissions
between milk and live animals. Environmental burden form manure treatment is allocated to manure as co-product.
Manure as waste Manure is not used to produce products but treated as waste.
Apply end-of-life formula and allocate environmental burden to other products produced on the farm, including treatment of manure.
Sold non-dairy products.
Sold feed, arable products and non-dairy animal
products, non-dairy animals.
If both raw milk and non-dairy products are produced on the farm use system subdivision for non-dairy
farming activities.
Energy produced on
farm
Any type of energy
produced at farm, such as solar energy, biogas, heat-recovery and wind-
energy.
If both raw milk and energy are produced on the farm
use system subdivision for on farm energy production. Within the assessed system boundary, energy may be produced from renewable sources. If
renewable energy is produced in excess of the amount consumed for dairy production and it is provided to third parties, this may only be credited to the dairy products assessed provided that the credit
has not already been taken into account in other schemes.
869
All modelling requirements shall be aligned with the Cattle Model Working Group8 recommendations 870
(EC-JRC 2015, CMWG_final_baseline_model.pdf). 871
8 The Cattle Model Working Group (CMWG) was set up in July 2014 and consisted of a transversal group of
experts, representing the dairy PEF pilot, the meat PEF pilot, the leather PEF pilot, the animal feed PEF pilot, the

55
Moreover 872
Feed production: priority should be given to specific data, whenever possible. Feed 873
production should be handled in conformance with the requirements from the PEFCR on 874
“Feed for food producing animals” and country of origin of each feed material should be 875
specified. 876
Water use: for crops production used as feed should be regionalised whenever the origin of 877
the feed is known or can be assumed. 878
Land use change and deforestation: land use change shall be assessed in the upstream feed 879
production, in accordance with the PEF Guide (European Commission 2013) or further 880
operational recommendation from the TAB. Land use change related to cattle grazing should 881
be considered whenever robust supporting information is available (see below). The PEF guide 882
prescribes to include land use change related CO2 emissions, but allows only to separately 883
report land use emissions as ‘Additional Environmental Information’. The difference between 884
land use and land use change can be confusing. Therefore, we explain how to deal with this in 885
the case of dairy. Land use change refers to any long term change in the type of use of a plot 886
of land directly required to produce dairy. In relation to dairy there are four categories of land 887
use between which changes in use are possible: 1) land used for infrastructure or buildings, 2) 888
natural land use, 3) arable land use and 4) grassland use. Land use refers to the changes in 889
carbon stock in soils without changing between these four types of land use. For raw milk 890
production land use change due to deforestation is most relevant in relation to production of 891
certain feed ingredients (mainly soy and palm oil). On the dairy farm itself often both arable 892
(mainly maize silage production) and grassland use occur. Often the plot of land used for 893
arable production is changed between different years. The changes in carbon stock that occur 894
from these kind of crop rotations, however, should be classified as land use and not land use 895
change, since over the long term the net amount of farm land used for arable or grassland 896
does not change. Only if share of grass- and arable-based roughage in the diet of the cow is 897
actually changing over time, this should be considered to result in land use change. 898
Grassland management: As per the proposition of the CMWG, carbon sequestration and 899
release related to grassland management (i.e. land use effects) shall be considered when 900
sufficient information is available (EC-JRC 2015). This information however cannot be 901
considered in the calculation of the default EF impact categories. Moreover, the information 902
pet food PEF pilot, the European Commission Directorate-General for the Environment (EC/DG-ENV), the European Commission Joint Research Centre (EC-JRC), the Food and Agriculture Organization of the United Nations (FAO), and the European Food Sustainable Consumption and Production Round.

56
shall be included under “additional environmental information” if specified in a supporting 903
PEFCR (PEF Guide). If no primary data on the type of grass is available, no carbon sequestration 904
shall be considered (conservative approach). When research provides an average value 905
representative of the part of grass in the European feed supply for dairy systems (or at 906
national scale), this can be used. To ensure consistency between carbon sequestration and 907
the release fluxes (i.e. carbon destocking), a carbon release factor has to be considered in 908
relation with land use change and grassland management practices. As described in the FAO 909
guidelines on the "Environmental performance of animal feeds supply chains" (LEAP 2015a), 910
it is recommended to estimate land use change using the ENVIFOOD method. The 911
ENVIFOOD/PAS2050 method identifies three different situations. Applied to the French 912
context, the carbon release represents 160 kg C/ha/year for change of grassland to arable 913
land (Dollé et al., 2013). This carbon release factor can be adapted to other national or EU 914
contexts providing scientific evidence. In the future, default destocking factors for crops 915
should be proposed. Various research projects are already looking at this topic. 916
Fat and protein content: shall be documented and the corresponding amount of fat and 917
protein corrected raw milk (FPCM) shall be reported. See section 6.10 for details. 918
919
Raw milk used in dairy products generally comes from multiple dairy farms. A representative sample 920
of farms in the supply chain should be defined, in a way that properly represents the variability of the 921
dairy systems. Main aspects influencing such variability, and which should be taken considered when 922
defining the samples, are: 923
Breed; 924
Feed supply and rations; 925
Average milk production per cow 926
Grazing vs. non-grazing systems; 927
Manure management systems. 928
Given the seasonal variability, all data should be collected for a minimum of 1 year of exploitation of 929
each dairy farm. Average data collected over 4+ years is preferable, when available. Special attention 930
should be paid on the origin of feed used in the rations. Typically, maize-based meals of European 931
dairy farms are generally produced in Europe, while soy-based meals can originate from overseas 932
(United States, Brazil, Argentina). 933
Tab. 19 summarizes the data that typically have to be collected when modelling raw milk production 934
with primary data: 935
936

57
Tab. 19: Typical foreground specific activity data for raw milk modelling 937
Parameter Unit
General information
% of supply chain % (of kg FPCM)
Breed -
Number of lactating cows -
Age at first calving months
Replacement rate %
Dairy farm area ha
Manure management system -
Time spent in stable days/y
Input parameters
Feed for lactating cows as grazed grass kg/y
Feed for lactating cows as hay or haylage kg/y
Feed for lactating cows as grass silage kg/y
Feed for lactating cows as maize silage kg/y
Feed for lactating cows as wheat silage kg/y
Feed for lactating cows as soybean meal kg/y
Feed for lactating cows as compound feed kg/y
Feed for lactating cows as agricultural by-products kg/y
Feed for heifers as grazed grass kg/y
Feed for heifers as hay or haylage kg/y
Feed for heifers as grass silage kg/y
Feed for heifers as maize silage kg/y
Feed for heifers as wheat silage kg/y
Feed for heifers as soybean meal kg/y
Feed for heifers as compound feed kg/y
Feed for heifers as agricultural by-products kg/y
Milk powder for calves kg/y
Bedding materials kg/y
Drinking water m3/y
Cleaning water m3/y
Electricity used on farm kWh/y
Fuel oil used on farm MJ/y
Natural gas used on farm MJ/y
Output parameters
Milk production (total sold) kg/y
Milk fat content g/l
Milk protein content g/l
Production of cull cows sold to slaughter or further fattening kg l ive weight/y
Production of calves sold for further fattening kg l ive weight/y
NO3 from manure excreted and applied to the pasture kg/y
P from manure excreted and applied to the pasture kg/y

58
938
Guidance to assess the data quality of raw milk modelled with primary data is provided in Tab. 20. 939
Tab. 20: DQR guidance for raw milk production 940
Quality
rating
Time representativeness Technological representativeness Geographical
representativeness
1 Production average over 2+ years, in the previous 5 years,
with respect to 2016
Sample of farms representing >80% of total supply chain
All areas in supply chain
2 Production average over 2+
years, in the previous 10 years, with respect to 2016
Sample of farms representing 60-
79% of total supply chain
Selected areas
representing >50% of supply chain
3 Production average for a single year, in the previous 5 years, with respect to 2016
Sample of farms representing 40-59% of total supply chain
Single area representing 30-49% of supply chain
4 Production data for a single year, in the previous 10 years,
with respect to 2016
Sample of farms representing 20-39% of total supply chain
Single area representing <30% of supply chain
5 Production data for a an
unknown period or a period lower than 1 year
Single farm or sample of farms
representing <20% of total supply chain
Unknown or proxy
941
In situations where several raw milk supply chains are involved in the life cycle of a single dairy product 942
(e.g. raw milk is supplied from local farms but milk powder is supplied from the market) , separate DQR 943
assessment should be made for each supply chain and documented accordingly. 944
945
In cases where primary data for raw milk production cannot be used (i.e. only when the study 946
commissioner cannot access information on the raw milk supply chain(s)) , section 6.4 provides 947
guidance on semi-specific data to be used in the PEF of dairy products. 948
949
6.3.2 Transport from dairy farm to processing unit 950
Raw milk is typically collected from several farms on a daily basis. A refrigerated truck leaves the dairy 951
processing unit and gets filled up while collecting raw milk at the different dairy. When available, 952
primary data should be collected on the total fuel consumption per tonne of raw milk collected, 953
accounting for the refrigeration in the truck. Alternatively, a weighted average transport distance can 954
be calculated and an appropriate secondary dataset for refrigerated bulk transport may be used ( 0.4 955
L diesel/km travelled, or 0.0023 L diesel/kg milk transported). 956
In cases where primary data for raw milk collection is not available, section 6.4 provides guidance on 957
semi-specific data to be used in the PEF of dairy products. 958
959

59
6.3.3 Dairy processing 960
Primary data shall be used to model dairy processing whenever available. The manufacturing of dairy 961
products is typically a multi-processes activity, starting with a single common input (raw milk) and 962
resulting in numerous products with various nutritional properties. Section 6.10 details how multi-963
functionality of dairy processing shall be handled. Foreground specific data required for dairy 964
processing is presented in Tab. 21. 965
966
Tab. 21: Foreground specific activity data required for dairy processing 967
Item Complementary information Unit
Input parameters
Raw milk Mass of FPCM kg/y
Other dairy inputs
Mass and dry matter (DM) content of any other dairy input in the product's formulation (e.g. cream, skimmed milk, milk powder, whey, etc.)
kg/y
Cleaning agents Mass and types of cleaning agents used in the dairy unit kg/y
Refrigerants Mass and types of refrigerants used in the dairy unit kg/y
Energy Amount and type of fuel (natural gas, fuel oil, diesel, biogas, etc.) for heat
and electricity use (from grid, produced on-site) for all activities at the dairy unit, including storage at the local warehouse. Emissions (CO2, NOx, SO2, particles) related to fuel combustion shall also be calculated and included (not included in secondary datasets for fuel production). Country
specific values for energy content of combusted natural gas shall be used when available. IEA data can be used for that purpose.
kWh/y or
MJ/y
Water Volume of water used. A regionalized (i.e. minimally country-specific) water flow shall be used in the model.
m3/y
Output parameters
Co-products Mass and dry matter content of every co-product kg/y
Wastewater Volume and COD content of wastewater released to treatment m3/y
968
Guidance to assess the data quality of dairy processing modelled with primary data is provided in Tab. 969
22. 970
971

60
Tab. 22: DQR guidance for dairy processing 972
Quality rating
Time representativeness Technological representativeness Geographical representativeness
1 0-1.9 years (age of data) with respect to 2016
All amounts and types of inputs and outputs are known and reported. Energy and water use are attributable to specific products.
Origin of all materials and energy carriers are known and reported
2 2-4.9 years with respect to 2016
All amounts and types of inputs and outputs are known and reported. Energy
and water use are reported for an entire process l ine or the whole dairy unit.
Origin of >60% of materials and energy
carriers are known and reported
3 5-9.9 years with
respect to 2016
Amounts and types of all main inputs and
outputs (raw milk, dairy ingredients, energy, sugar, fruits, co-products, wastewater) are known and reported.
Proxys are used for other inputs or outputs. Energy and water use are attributable to specific products.
Origin of 40-60% of
materials and energy carriers are known and reported
4 10-14.9 years with respect to 2016
Amounts and types of all main inputs and outputs (raw milk, dairy ingredients, energy, sugar, fruits, co-products,
wastewater) are known and reported. Energy and water use are reported for an entire process l ine or the whole dairy unit.
Origin of 20-39% of materials and energy carriers are known and
reported
5 >15 years with respect to 2016
Only amounts and types of raw milk, dairy ingredients and co-products are
known and reported. Proxys are used for all other inputs or outputs.
Origin of materials and energy carriers are not
reported.
973
In cases where primary data for dairy processing cannot be used, section 6.4 provides guidance on 974
default data to be used in the PEF of dairy products. 975
976
Wastewater at dairy processing 977
The effluent from a dairy processing unit is essentially composed of wastewater from pre-rinse, inter-978
rinse and clean-in-place rinse-down operations together with material losses from the dairy products. 979
Dairy residues in the wastewater essentially drive an organic-rich effluent waste with a high carbon 980
organic demand (COD). Wastewater from dairies can be treated in municipal sewage treatment plants. 981
However, no life cycle inventory (LCI) data representative of such treatment is yet available in LCI 982
databases. To evaluate the surplus energy required for the treatment of dairy wastewater due to the 983
excess COD, a dilution factor should be applied. The rationale is that sewage treatment plants are 984
characterized by an input COD reduction capacity and an output COD level; therefore, treating a 985
higher-COD wastewater can be approximated by treating a higher volume of same-COD-level 986
wastewater. The dilution factor is calculated as the ratio of the effluent COD at the dairy unit and the 987
COD input in a reference LCI dataset. 988

61
989
The ecoinvent dataset "Treatment, potato starch production effluent, to wastewater treatment, class 990
2/CH U " with input COD content of 2 g/l shall be used as reference. This value fits within values 991
sampled in 18 French dairy sites, with COD content in the wastewater effluent ranging from 0.72 g/l 992
to 5.29 g/l (AFNOR 2014). 993
994
The dilution factor shall therefore be calculated as: 995
𝐶𝑂𝐷_𝐷𝑖𝑙𝑢𝑡𝑖𝑜𝑛 _𝐹𝑎𝑐𝑡𝑜𝑟 = 𝐶𝑂𝐷𝑒𝑓𝑓𝑙𝑢𝑒𝑛𝑡 (𝑔/𝑙)
𝐶𝑂𝐷𝑟𝑒𝑓 (𝑔/𝑙)=
𝐶𝑂𝐷𝑒𝑓𝑓𝑙𝑢𝑒𝑛𝑡
2 996
Equation 2: Dilution factor for modelling wastewater from dairy processing 997
with 998
CODeffluent = COD in effluent wastewater at dairy unit (g/l) 999
CODref = COD in reference dataset = 2 g/l 1000
1001
6.3.4 Non-dairy ingredients 1002
Primary data shall be used to model the supply chain of non-dairy ingredients (e.g. sugar, fruit 1003
preparation, salt, yeast, ferments, rennet, vegetal oils) whenever available. Typically, the following 1004
data should be collected: 1005
Mass of each non-dairy ingredient in the product's formulation 1006
Country of production of each non-dairy ingredient 1007
Transport mode and distance to the dairy unit 1008
Packaging type and amount of each non-dairy ingredient 1009
1010
For sugar, it shall be specified if originates from sugar beet or from sugarcane. It shall be specified 1011
when non-dairy ingredients are kept and stored under refrigerated conditions. 1012
Secondary datasets may be used to represent the production of the non-dairy ingredients, their 1013
transport and packaging. In cases where primary data cannot be used, section 6.4 provides guidance 1014
on default data to be used in the PEF of dairy products. 1015
1016

62
6.3.5 Packaging 1017
The following definitions apply and shall be used: 1018
Primary packaging: Material that first envelops the product. For dairy products, primary 1019
packaging can consist either of a container (bottle, beverage carton, cup, jar, pouch, bag) and 1020
a closure (lid, cap), or of a wrapper, and a label. 1021
Secondary packaging: Package or containment of a primary package. Multipacks and labels 1022
(on top of the secondary packaging) are considered as secondary packaging. 1023
Tertiary packaging: Packaging conceived so as to facilitate handling and transport of a number 1024
of sales units or grouped packaging in order to prevent physical handling and transport 1025
damage (i.e. pallet, intermediate sheet, shrink wrap). 1026
Dairy products are sold in a wide variety of packaging materials and formats. Some products, such as 1027
dried whey products, are also sold in bulk. Whenever possible, site-specific data should be used to 1028
model the production of dairy products primary packaging: site-specific data for packaging are 1029
presented in Tab. 23. Secondary and tertiary packaging can be modelled using secondary data (see 1030
6.4.3) 1031
Tab. 23: Foreground specific activity data required for packaging 1032
Item Complementary information Unit
Bill of materials Mass of every material contained in the packaging, including recycled content
g/unit
Capacity Volume or mass of product in each packaging unit l or g
Energy Amount and types of fuel for heat and electricity used for manufacturing the packaging
kWh/unit or MJ/unit
Water Volume of water used for manufacturing the packaging m3/unit
Transport Transport mode and distance from packaging manufacturing plant
to dairy unit
km
1033
Guidance to assess the data quality of packaging modelled with primary data is provided in Tab. 18: 1034

63
Tab. 24: DQR guidance for packaging 1035
Quality rating
Time representativeness Technological representativeness Geographical representativeness
1 0-1.9 years with respect to 2015
Complete bil l of materials is known and reported. Energy and water use for packaging manufacturing are known.
Packaging manufacturing place is known and origin of main materials is
reported.
2 2-4.9 years with
respect to 2015
Complete bil l of materials is known and
reported. Energy and water use for packaging manufacturing are estimated from published sources or extrapolated..
Packaging
manufacturing place is known and origin of main materials is estimated.
3 5-9.9 years with respect to 2015
Bill of materials is partly known and reported. Energy and water use for
packaging manufacturing are estimated from published sources or extrapolated..
Packaging manufacturing place is
unknown and origin of main materials is estimated.
4 10-14.9 years with respect to 2015
Only the main materials are known and reported. Energy and water use for packaging manufacturing are unknown.
n/a
5 >15 years with respect to 2015
Proxys are used for main materials . Energy and water use for packaging manufacturing are unknown.
n/a
1036
In cases where primary data for packaging cannot be used, section 6.4 provides guidance on default 1037
data to be used in the PEF of dairy products. 1038
For container glass, the quality rating for time representativeness between 2 and 4.9 years, with 1039
respect to 2015, is considered equivalent to 1, as current technologies for container glass production 1040
have a time representativeness of 5 years (i.e., no major technological changes are foreseen in shorter 1041
time period). 1042
1043
6.4 Requirements regarding background generic data and data gaps 1044
6.4.1 Raw milk production 1045
In cases where primary data for raw milk production cannot be used, semi-specific datasets can be 1046
used in PEF studies of dairy products, following the guidance below. 1047
Step 1: Identification of dairy systems relevant to the supply chain. If it can be determined that a 1048
specific dairy system, or combination of dairy systems is relevant to the supply chain of raw milk used 1049
in the dairy product(s) assessed, secondary data representative of such dairy systems can be used (or 1050
combined) providing they comply with all requirements from this PEFCR (e.g. emissions modelling, 1051

64
allocation, land use change. The selection of those systems should be properly justified and 1052
documented. 1053
The different dairy systems available from the PEF/OEF LCI database shall be used: 1054
Grazing (excluding organic), production mix 1055
Mixed systems (excluding organic), production mix 1056
Non-grazing (excluding organic), production mix 1057
Organic, production mix 1058
1059
Step 2: Use of national average. When the nature and specificities of the upstream dairy farming 1060
systems cannot be determined, an existing inventory dataset representative of the national average 1061
should be used. The PEF/OEF LCI database provides secondary data for the main dairy producers in 1062
the EU: France, Netherlands, Italy, Germany and the UK. National LCI datasets from other commercial 1063
LCI databases can be used for other countries providing they comply with all requirements from this 1064
PEFCR (e.g. emissions modelling, allocation, land use change). 1065
1066
Step 3: Use of EU-28 average. When no data exists from LCI databases or from published literature, 1067
representing the national average raw milk production, the EU-28+EFTA (for EU context) secondary 1068
dataset from the PEF/OEF LCI database shall be used as a placeholder. 1069
1070
6.4.2 Dairy processing and non-dairy ingredients 1071
In cases where primary data for dairy processing cannot be used, the default activity data below 1072
should be used in the PEF study. 1073
1074
Liquid milk 1075
When primary data on the production of liquid milk is not available, the default activity data from Tab. 1076
25 shall be used: 1077
Tab. 25: Default l ist of ingredients for 1 l of l iquid milk, unpackaged 1078
Whole milk Semi-skimmed milk Skimmed milk
Ingredient Amount (g) Amount (g) Amount (g)
Raw milk 1000 1000 1000
1079
For skimming of liquid milk, the following ratios of co-product shall be considered, based on an input 1080
of 1 kg raw milk: 1081

65
Skimmed milk: 900 g / kg raw milk 1082
Cream 42%: 100 g / kg raw milk 1083
1084
Dried whey products 1085
When primary data on the production of dried whey products is not available, the default activity data 1086
from Tab. 26 shall be used: 1087
1088
Tab. 26: Default l ist of ingredients for 1 kg of dried whey products, unpackaged 1089
Ingredient
Whey
powder
Lactose
powder
Whey protein
concentrate (WPC)
Whey protein
isolate powder
High fat whey
protein concentrate
powder
Amount (kg DM)
Amount (kg DM)
Amount (kg DM)
Amount (kg DM)
Amount (kg DM)
Whey (thin or thick)* 0.97 1 0.97 0.72 0.5
Fat** 0.03 0 0.03 0.28 0.5
* Whey can be thick or thin whey 1090
** Fats can be milk fat or vegetable fats such as soy bean oil or palm oil, depending on the product recipe 1091
1092
The following typical dry matter (DM) content of each input and product shall be considered: 1093
Thin whey: 4.8% 1094
Thick whey: 26.5% 1095
Whey powder: 96.5% 1096
Lactose powder: 99.8% 1097
Whey protein concentrate (WPC): 94.0% 1098
Whey protein isolate powder: 95.0% 1099
High fat whey protein concentrate powder: 98.0% 1100
The dry matter content of WPC can range between product varieties from 65% to 94%. 1101
1102

66
Cheeses 1103
When primary data on the production of cheese is not available, the default activity data from Tab. 27 1104
shall be used: 1105
Tab. 27: Default l ist of ingredients for 1 kg of cheese, unpackaged 1106
Fresh cheese Soft cheese Semi-hard cheese Hard cheese
Ingredient Amount (g) Amount (g) Amount (g) Amount (g)
Raw milk 2500 7000 9000 10000
Cream 500 0 0 0
Salt 0.2 14 12 8
Calcium chloride 0 0.2 0.2 0.2
Rennet 0 2 2.5 2
Bacteria and yeast 0.05 0.15 0.15 0.15
1107
Whey (or thin whey) is a co-product from cheese production. The following default ratios of whey per 1108
kg of cheese shall be considered: 1109
Fresh cheese: 1.5 kg whey / kg 1110
Soft cheese: 6 kg whey / kg 1111
Semi-hard cheese: 7.5 kg whey / kg 1112
Hard cheese: 9 kg whey / kg 1113
1114
Fermented milk products 1115
When primary data on the production of fermented milk products is not available, the default activity 1116
data from Tab. 28 shall be used: 1117
1118
Tab. 28: Default l ist of ingredients for 1 kg of fermented milk products, unpackaged 1119
Spoonable, plain Spoonable, flavoured Spoonable, fruited
Ingredients Amount (g) Amount (g) Amount (g)
Skimmed milk 950 860 700
Cream 42% 30 30 80
Skimmed milk powder 20 15 30
Ferments 0.15 0.15 0.15
Sugar 0 100 40
Flavours 0 4 0
Fruit preparation 0 0 150
1120

67
Butterfat products 1121
When primary data on the production of butterfat products is not available, the default activity data 1122
from Tab. 29 shall be used: 1123
1124
Tab. 29: Default l ist of ingredients for 1 kg of butterfat products, unpackaged 1125
Butter, unsalted Butter, salted Dairy spreads
Ingredient Amount (g) Amount (g) Amount (g)
Raw milk 20000 20000 0
Butter 0 0 400
Buttermilk 0 0 250
Skimmed milk 0 0 250
Salt 0 20 0
Ferments - - -
1126
Buttermilk and skimmed milk are co-products from butter production. A default ratio of 1 kg 1127
buttermilk per kg of butter and 18 kg skimmed milk per kg butter shall be considered. 1128
1129
Consumables 1130
When primary data on consumables (energy, water, cleaning agents and refrigerants) are not 1131
available, the default activity data in Tab. 30 shall be used for all subcategories. 1132
1133
Tab. 30: Default data for consumables used in dairy processing 1134
Consumable Unit Liquid
milk
Dried whey
products Cheeses
Fermented
milk products
Butterfat
products
Electricity Wh/kg product 77 430 413 137 435
Thermal energy kJ/ kg product 441 10753 1938 590 1947
Total Energy kJ/ kg product 718 12301 3425 1083 3513
Water L/ kg product 1.6 1.5 6.7 3.2 14.1
Cleaning agents (acid)
g/ kg product 30 30 30 30 30
Cleaning agents (base)
g/ kg product 60 60 60 60 60
Refrigerants g/ kg product 5.00E-6 1.00E-6 5.00E-6 5.00E-6 5.00E-6
1135
Wastewater treatment 1136
When primary data on the amount of wastewater to be treated and its COD content are not available, 1137
the default values in Tab. 31 shall be used. 1138

68
Tab. 31: Default data for wastewater from dairy processing 1139
Consumable Unit Liquid milk
Dried whey products
Cheeses Fermented
milk products Butterfat products
Wastewater to
treatment l/kg product 1.6 11.5 9.4 4.6 14.12
COD content g/ kg product 4.25 32.50 30.00 20.70 45.40
1140
The procedure described in section 6.3.3 shall be applied, for the modelling of the wastewater flow. 1141
1142
6.4.3 Packaging 1143
When primary data on packaging is not available, the default activity data in Tab. 32 shall be used. 1144
Tab. 32: Default bil l of materials for dairy products primary packaging 1145
Sub-category Packaging Amount product
Packaging material Amount (g)
Liquid milk Multilayer carton (UHT) 1000 ml LPB 21.2
Aluminium 1.38
LDPE 5.315
HDPE (closure) 1.34
PP (closure) 1.39
Multilayer carton (PAST) 1000 ml LPB 22.75
LDPE 3.24
HDPE (closure) 1.38
LDPE (closure) 1.25
Plastic (HDPE et PP) bottle 1000 ml HDPE or PP 40
Aluminium (closure) 0.04
HDPE (closure) 3
Returnable glass bottle 1000 ml Glass, white 650
Aluminium (closure) 0.04
LDPE (label) 1
Stand-up pouch 1000 ml LDPE 3.81
PP 5.82
Other (PP) 6.1
Plastic (PET) bottle 1000 ml PET 40
HDPE (closure) 1.7
Aluminium (closure) 0.04
LDPE (label) 1
Dried whey products
Big bag 1000 kg PP 1.93
Plastic (LDPE) fi lm 0.887
Kraft paper bag 25 kg Plastic (LDPE) fi lm 0.073
Kraft paper, bleached 0.256
Cheeses Plastic foil 250 g PP 5
Plastic box 250 g PET 7.32

69
Sub-category Packaging Amount
product
Packaging material Amount
(g)
Aluminium paper wrap 60 g Aluminium 0.19
Wax 0.03
Paper 0.10
Paper foil 250 g Paper 1.44
Wooden box 250 g Wood 15
Fermented milk products
Plastic cup 125 g PS 3.66
Aluminium (closure) 0.47
PP (closure) 0.25
Plastic cup 500 g PET 14.64
Aluminium (closure) 0.86
PP (closure) 0.45
Glass jar 125 g Glass 133
Aluminium (closure) 0.47
PP (closure) 0.25
Paper cup 125 g Paper 10.2
Aluminium (closure) 0.47
PP (closure) 0.25
Plastic bottle 100 ml HDPE 5.2
Board 13
Aluminium (closure) 15
Plastic bottle 1000 ml HDPE 40
PP (closure) 4
LDPE (label) 1
Multilayer carton 1000 ml LPB 22.15
Aluminium foil 0.2
LDPE 4.6
HDPE (closure) 1.38
LDPE (closure) 1.25
Butterfat products Aluminium foil laminated paper
250 g Aluminium 0.76
Lacquer 0.06
Wax 0.4
Paper 1.44
Ink 0.7
Plastic cup 250 g PET 7.32
PET (closure) 2
Aluminium foil laminated paper
10 g Aluminium 0.152
Lacquer 0.012
Wax 0.08
Paper 0.288
Ink 0.14
Preformed plastic cup 10 g PET 1
PP (closure) 0.01
Butter paper 250 g Paper 1.44
(c) = closure ; (l) = label 1146

70
1147
By default, all materials except for glass are considered 100% virgin materials. A cullet content of 52% 1148
is considered by default for glass packaging. For products which format is not listed above, a rule of 1149
three based on the most similar product should be applied to calculate the amount of different 1150
packaging materials. Tab. 33 and Tab. 34 below provide default data to be used for the supply of 1151
primary packaging and for returnable glass bottles. 1152
1153
Tab. 33: Default parameters for the supply of primary packaging 1154
Packaging Transport mode Transport distance (km)
Beverage carton Truck 500
Plastic bottle Truck 1000
Plastic cups Truck 1000
Glass bottle Truck Train Boat
350 39 87
Flexible packaging (foil, wrapper, paper) Truck 974
1155
Tab. 34: Default parameters for returnable glass bottles 1156
Parameter Amount Unit
Reuse rates (number of re-use)9 17.5 in UK context of milk delivery 20 (for company owned pools )
30 (for third party operated pools)
-
Tap water 0.8 l/bottle/washing cycle
Natural gas 0.07 MJ/bottle/washing cycle
Electricity 0.06 kWh/bottle/washing cycle
Sodium hydroxide 1 g/bottle/washing cycle
Hydrochloric acid 0.3 g/bottle/washing cycle
1157
For secondary and tertiary packaging, the default data from Tab. 35 shall be used. 1158
1159
Tab. 35: Default parameters for secondary and tertiary packaging, per kg of dairy product 1160
Material Amount Unit
Carton boxes 24 g/kg product
Separators 1.6 g/kg product
LDPE plastic wrap 1.5 g/kg product
Pallet 6 g/kg product
1161
9 Packaging Working Group guidance document, version 1.0 – May 2016

71
6.5 Data gaps 1162
In this PEFCR, the recommendations regarding default data to be used when no primary data are 1163
available are provided. Therefore, no data gaps are foreseen. According to European Commission 1164
(2013), “data gaps exist when there is no specific or generic data available that is sufficiently 1165
representative of the given process in the product’s life cycle”. 1166
1167
6.6 Distribution 1168
When primary data on distribution is not available, the default parameters below shall be used. 1169
Tab. 36: Default parameters for the distribution of final dairy products 1170
Parameter Final dairy products
Processing to distribution centre Refrigerated* truck, 16-32t, EURO4, 150 km Allocation per mass
Distribution centre to point of sale Refrigerated* truck, 7.5-16t, EURO 4, 50 km Allocation per mass
Point of sale to consumer home 65% by car, 4.8 km 35% by other means of transport, neglected Allocation per item, considering 20 items purchased (i.e. 5% of the journey is allocated to each item) with following criteria:
Liquid milk: 1 item = 1000 ml
Cheese: 1 item = 100 g dry matter
Fermented milks: 1 item = 500 ml
Butterfat products: 1 item = 250 g
*Except for UHT liquid milk where ambient transport shall be considered 1171
1172
Tab. 37: Parameters for dairy products storage in the distribution stage 1173
Parameter Liquid milk Dried whey products
Cheeses Fermented milk products
Butterfat products
Storage duration at dairy processing warehouse (*)
1 day, refrigerated or 7 days, ambient
7 days, ambient temperature
3 days, refrigerated
3 days, refrigerated
3 days, refrigerated
Storage duration at distribution centre
1 week n/a 1 week 1 week 1 week
Storage volume at distribution centre
3 times the product’s volume
n/a 3 times the product’s volume
3 times the product’s volume
3 times the product’s volume
Storage duration at point of sale
3 days, refrigerated or 14 days, ambient
n/a 5 days, refrigerated
3 days, refrigerated
5 days, refrigerated
Storage volume at point of sale
3 times the product’s volume
n/a 3 times the product’s volume
3 times the product’s volume
3 times the product’s volume
(*) Energy use for storage at the dairy processing unit is already included in the stage "dairy processing". 1174
1175

72
Default values for energy and refrigerants consumption are retrieved from the issue paper “PEF-1176
OEF_Distribution_DefaultData_Dec2015_v2.1_final.pdf”. A ceiling height of 5 m (at the distribution 1177
centre) 2 m (for refrigerators) is considered as to convert from surface to volume references. 1178
1179
Tab. 38: Energy and refrigerants consumption at the distribution centre and at retail 1180
Parameter Per surface area
(per m2.y)
Per volume
occupied (per m3.y)
General electricity consumption at distribution centre 30 kWh 6 kWh
General energy at distribution centre (natural gas burned in boiler)
360 MJ 72 MJ
Refrigerated storage at distribution centre (additional
electricity)
80 kWh 40 kWh
General electricity consumption at retail 400 kWh 200 kWh
Refrigerated storage at retail (additional electricity) 1900 kWh 950 kWh
Refrigerant gases (leaks) 0.029 kg R404A 0.0145 kg R404A
1181
Refrigerant leaks shall be modelled as input refrigerant and as direct emissions to air. Capital goods 1182
can be neglected. 1183
1184
6.7 Use stage 1185
The default use stage scenario considers that dairy products are chilled in a refrigerator, with the 1186
exception of UHT liquid milk, which is stored at ambient temperature and only chilled after being 1187
open. Washing of a glass or cutlery should not be included in the default use stage scenario, following 1188
TAB decision on May 11, 2015. It is nevertheless recommended to assess this in a sensitivity analysis. 1189
Heating, cooking or further transformation of dairy products at the consumer home may also be 1190
assessed in sensitivity analysis. Food waste at the consumer home is discussed in section 6.9. Default 1191
parameters for the use stage are retrieved from the transversal issue paper “Use stage v5.1.pdf” and 1192
are presented in Tab. 39. 1193

73
Tab. 39: Default parameters for dairy products storage at the consumer home 1194
Parameter Liquid milk Dried whey products
Cheeses Fermented milk products
Butterfat products
Storage duration at the consumer home
5 days, refrigerated (fresh or pasteurised) ;
30 days, ambient and 2 days, refrigerated (UHT)
n/a 10 days, refrigerated
7 days, refrigerated
10 days, refrigerate
d
Storage volume at the consumer home
3 times the product’s volume
n/a 3 times the product’s volume
3 times the product’s volume
3 times the product’s volume
Electricity use for chilled storage (kWh/m3.y)10
1350 n/a 1350 1350 1350
1195
Energy use for ambient storage at the consumer home can be neglected. 1196
1197
6.8 End-of-life stage 1198
The end-of-life stage includes collection and treatment of waste packaging. Default parameters for waste 1199 packaging collection and treatment after consumer use are provided in Tab. 40 and 1200
Tab. 41. 1201
The values in Tab. 34 represent the amount of material collected for recycling only. In order to apply 1202
correctly the PEF end-of-life formula, the amount of secondary material obtained from the recycling 1203
process and actually reintroduced in the supply chain is also needed. A horizontal “packaging working 1204
group” which was set up provided such information in the reference document “Packaging Working 1205
Group guidance document, version 1.0, May 2016”. These data will be added to the PEFCR once 1206
validated by the EF steering committee and the whole section updated accordingly. 1207
1208
Tab. 40: Default parameters for waste packaging collection and treatment (final products) 1209
10 0.0037 kWh/L.day (ANIA and ADEME 2012) is equivalent to 1350 kWh/m3.y
Parameter Final dairy products
Transport to disposal or composting Waste collection truck, 30 km
Transport to recycling Truck, 100 km
Treatment According to Eurostat data for packaging materials (see
Tab. 41)

74
1210
Tab. 41: End-of-life treatment of packaging materials (Eurostat 2012) 1211
Packaging material Recycling Incineration Landfill LHV (MJ/kg)
Beverage carton 42% 24.9% 33.1% 15.92
Glass 72.8% 11.5% 15.7% 0
Mixed plastics 35.3% 27.4% 37.3% 30.79
HDPE and LDPE 35.3% 27.4% 37.3% 42.47
PET 35.3% 27.4% 37.3% 22.95
Cardboard 83.8% 6.9% 9.3% 15.92
Laminated pouches and wrappers 0% 42.3% 57.7% 30.79
1212
Energy recovery shall be considered for incineration, with default recovery rates of 10% as electricity 1213
and 20% as heat. 1214
1215
6.9 Food losses and waste 1216
Food wastage throughout the distribution chain is recognised as a potentially important issue, with 1217
regards to the environmental footprint of dairy products. Losses occurring within and between the life 1218
cycle stages, from the dairy farm to retail, and at the consumer home, are however not documented 1219
at European scale. Experience from the dairy industry shows that important variations may occur from 1220
one site to another, and from one market to another. Food wastage is seen as a wider issue for the 1221
agro-food sector as a whole; the Technical Secretariat therefore encourages the European 1222
Commission to propose a consistent approach to be applied transversally by all food-related sectors. 1223
In the PEF screening study on dairy products, FAO data on food losses and waste in the Europe and 1224
Russia (FAO 2011) (Tab. 42) was used to assess the impact of food wastage in a sensitivity analysis. As 1225
long as a consistent transversal approach is not defined and endorsed by the EC, it is suggested to use 1226
this data in sensitivity analyses. 1227
Whenever available, primary data for food losses should be used, and the default factors in Tab. 35 1228
should be applied in case such data is not available. 1229
The relevant definition of food losses and waste is given by FAO: Food losses refer to the decrease in 1230
edible food mass throughout the part of the supply chain that specifically leads to edible food for 1231
human consumption. Food losses take place at production, postharvest and processing stages in the 1232
food supply chain (Parfitt et al., 2010). Food losses occurring at the end of the food chain (retail and 1233
final consumption) are rather called “food waste”, which relates to retailers’ and consumers’ 1234
behaviour (Parfitt et al., 2010). “Food” waste or loss is measured only for products that are directed 1235
to human consumption, excluding feed and parts of products which are not edible. Per definition, food 1236

75
losses or waste are the masses of food lost or wasted in the part of food chains leading to “edible 1237
products going to human consumption”. Therefore , food that was originally meant to human 1238
consumption but which fortuity gets out the human food chain is considered as food loss or waste 1239
even if it is then directed to a non-food use (feed, bioenergy…). This approach distinguishes “planned” 1240
non-food uses to “unplanned” non-food uses, which are hereby accounted under losses. With regard 1241
to food losses during processing it is important to distinguish between dairy that is waste treated and 1242
dairy of which the quality is degraded to a lower quality, but that still will be used for a different 1243
purpose than the product under study. In the case of cheese for example the cheese is cut prior to 1244
packaging which results in cutting losses that are subsequently used as pet food or cheese spreads. 1245
These type of products should not be considered as food waste, but as co-products. 1246
1247
Tab. 42: Food loss and waste rates of dairy products 1248
Parameter Liquid milk Dried whey
products
Cheeses Fermented milk
products
Butterfat
products
Food losses from
farm to retail 5% 2% (*) 5% 5% 5%
Food waste at consumer home
7% n/a 7% 7% 7%
(*) Assumed, from farm to dairy processing 1249
1250
6.10 Requirements for multifunctional products and multiproduct processes 1251
6.10.1 Multi-functionality decision hierarchy 1252
The following decision hierarchy recommended by the PEF Guide 2012 is in accordance with ISO 14044 1253
(ISO 2006a), the international reference standard for LCA. 1254
Step 1: Wherever possible, allocation should be avoided by either: 1255
Dividing the unit process to be allocated into two or more sub-processes and collecting the 1256
input and output data related to these sub-processes 1257
Expanding the product system (known as system expansion) to include the additional 1258
functions related to the co-products 1259
Step 2: Where allocation cannot be avoided, the inputs and outputs of the system should be 1260
partitioned between its different products or functions in a way that reflects the underlying physical 1261
relationships between them 1262
Step 3: Where physical relationship alone cannot be established or used as the basis for allocation, 1263
the inputs should be allocated between the products and functions in a way that reflects other 1264

76
relationships between them. For example, input and output data might be allocated between co-1265
products in proportion to the economic value of the products. 1266
1267
Stages with multifunctional products and multiproduct processes in the life cycle of dairy products 1268
The following life cycle stages involve dealing with multi-functionality: 1269
i) Raw milk production at the dairy farm 1270
ii) Dairy products processing at the dairy unit 1271
iii) Transportation from retail to consumer home 1272
iv) Materials recycling, or incineration with energy recovery at the end-of-life. 1273
1274
6.10.2 Multi-functionality at the dairy farm 1275
At the dairy farm, the following co-products are considered (for allocation, see Tab. 18): 1276
• Raw milk 1277
• Dairy products produced on farm 1278
• Live animals leaving the farm (for slaughter or further fattening or replacement of dairy 1279
cattle), including dry culled cows and calves 1280
• Dead animals leaving the farm 1281
• Manure 1282
• Sold non-dairy products (feed and arable products) 1283
• Energy produced on the farm 1284
In accordance with the outcome technical report from the Cattle Model Working Group (CMWG) (JRC 1285
2015), upstream burdens and activities are allocated to raw milk and live animals based on the IDF 1286
biophysical allocation method (IDF 2015). Manure and dead animals are considered as residues with 1287
no upstream burden allocated. 1288
The allocation factor (AF) for raw milk is calculated as follows: 1289
𝐴𝐹 = 1 − 6.04 𝑥 𝑀𝑚𝑒𝑎𝑡
𝑀𝑚𝑖𝑙𝑘 1290
Equation 3: Allocation factor between milk and meat at the dairy farm (IDF 2015) 1291
1292
Where Mmeat is the mass of live weight of all animals sold including bull calves and culled mature 1293
animals per year, and Mmilk is the mass of fat and protein corrected milk (FPCM) sold per year 1294
(corrected to 4% fat and 3.3% protein). 1295
The FPCM (corrected to 4%fat and 3.3% protein) is calculated with Equation 4: 1296

77
𝐹𝑃𝐶𝑀 (𝑘𝑔
𝑦𝑟) = 𝑃𝑟𝑜𝑑𝑢𝑐𝑡𝑖𝑜𝑛 (
𝑘𝑔
𝑦𝑟) × (0.1226 × 𝑇𝑟𝑢𝑒 𝐹𝑎𝑡% + 0.0776 × 𝑇𝑟𝑢𝑒 𝑃𝑟𝑜𝑡𝑒𝑖𝑛%1297
+ 0.2534) 1298
Equation 4: Fat and protein corrected milk (IDF 2015) 1299
1300
6.10.3 Multi-product processes at dairy processing 1301
Dairy manufacturing plants usually produce more than one product, because the fat content in raw 1302
milk exceeds the product specification for milk powders or fresh milk products (e.g. market milk, 1303
yoghurt or dairy desserts). The excess milk fat can be further processed into butter or anhydrous milk 1304
fat (AMF). Another typical example of co-production in the dairy industry is the production of cheese 1305
and whey. This creates the need to allocate the environmental impact of production and transport of 1306
raw milk and processing to different dairy co-products produced in a specific dairy production plant. 1307
In addition, many of the process units (e.g. pasteurization, separation or spray drying) are 1308
subsequently used to process different dairy product flows (e.g. skimmed milk, whey, caseinate). The 1309
data collection for each process unit within the plant is resource-intensive and in some cases 1310
impossible due to insufficient metering on a process unit level. In some cases resource use or emission 1311
data are only available on a ‘whole-of-factory’ basis. 1312
1313
Allocation of raw milk and transport from farm to processing plant 1314
Allocation of the environmental footprint embodied in the raw milk as it comes into the processing 1315
plant (i.e. including farm to processing plant transport) should be done by mass allocation using the 1316
dry weight (i.e. dry matter content) of the product under study and its co-products (IDF 2015). 1317
More concentrated products such as butter or milk powder thus get allocated a higher proportion of 1318
the processing impacts than less concentrated products, since a greater quantity of raw milk has gone 1319
through upstream processing operations. This is reasonable given that for dairy products upstream 1320
processing operations (heat treatment, skimming, etc.) are those that require the most energy. 1321
The allocation factor (AF) can be calculated for each product (i) using the following equation: 1322
1323
Equation 5: Formula for the allocation factor based on dry matter content 1324
Where: 1325
AFi allocation factor for product i; 1326

78
DMi dry matter content of product i (expressed as % dry matter or as weight by mass of 1327
dry matter/weight by mass of product i). This is semi-specific data: the values 1328
proposed are default values (see table 1 below); 1329
Qi quantity of product i output to the production site or from the unit operation (in kg of 1330
product i). 1331
1332
Example 1333
In this hypothetical example, a dairy company wants to calculate the carbon footprint of cream. The 1334
dairy company produces 25000 tonnes of cream (with 42% dry matter) and 6737 tonnes of skimmed 1335
milk powder (with 96% dry matter) using 100000 tonnes of raw milk and 273000 GJ of heat. 1336
Because data are only available for the whole dairy unit, allocation of raw milk is done based on the 1337
milk solid content of the cream and the skimmed milk powder (i.e. Equation 5). 1338
The carbon footprint of 1 tonne of raw milk is known to be 1100 kg CO2-eq and the carbon footprint 1339
of 1 GJ heat 66.9 kg CO2-eq. 1340
1341
Figure: Example of allocation of co-products during manufacturing. 1342
1343 - The allocation factor of cream using Equation 5: 1344
𝐴𝐹𝑐𝑟𝑒𝑎𝑚 ∶42 ∗25 000
42∗25 000 +96∗6735= 0.62 1345
- The calculated Carbon Footprint for cream is: 1346
𝐶𝐹𝑐𝑟𝑒𝑎𝑚 ∶ 100000 ∗ 1100 ∗ 0.62 + 273000 ∗ 66.9 ∗ 0.62
25000= 3181 𝑘𝑔 𝐶𝑂2𝑒𝑞 𝑝𝑒𝑟 𝑡𝑜𝑛𝑛𝑒 𝑐𝑟𝑒𝑎𝑚 1347
1348
Processing allocation - situation A: detailed data are available on specific processes 1349
Energy use, and materials others than raw milk and emissions at the factory shall be allocated as much 1350
as possible to specific processing stages and product flows (step 1 in ISO 14044). If several products 1351
result from a single dairy flow in a specific joint process unit (i.e. production of butter and buttermilk; 1352
production of cheese and whey; production of skimmed milk and cream), allocation shall be based on 1353
dry matter content (Equation 5). 1354
1355

79
Processing allocation - situation B: detailed data are available on some processes and co-products, 1356
while other data are available at the dairy unit level 1357
In this case, detailed process and co-product data shall be assigned to specific products first, subtract 1358
assigned detailed process and co-product data from the factory total and then allocate the remainder 1359
based on milk solids (i.e. find where the milk solids go in the various products and use the distribution 1360
of the milk solids as the basis for distribution of the environmental burdens). 1361
1362
Processing allocation - situation C: data is only available at the company or dairy unit level 1363
When data is only available at the level of a company or of a whole dairy unit, i.e. only the inputs (e.g. 1364
raw milk, energy) and the outputs (e.g. various dairy products) of the entire operation are known, all 1365
energy use shall be allocated proportionally to the dry weight (milk solids content) of the co-products. 1366
In almost all processing scenarios, energy goes primarily toward heating, cooling and drying processes. 1367
In that case, the milk solids content (dry matter) of the final products will properly reflect the share in 1368
energy use. No distinction is made regarding types of milk solids (i.e. protein, fat, lactose), since in the 1369
case of heating, cooling and drying only the amount of milk solids in the product influences the 1370
process, but not the type of milk solids. Other inputs that can generally be directly associated with a 1371
specific product (e.g. packaging, ingredients) shall not be allocated between co-products. For all other 1372
material inputs where allocation is required (e.g. water use, chemicals, cleaning agents, wastewater) 1373
allocation shall be done based on the dry matter content of all co-products. 1374
1375
Default values for the dry matter content of dairy products 1376
The exact dry matter content of the real product assessed needs to be used for the calculation of the 1377
PEFCR. In the rare cases where there is no access to the primary data of the dairy product, default 1378
values for the dry matter content of dairy products may be used. These default values for the dry 1379
matter content of dairy products are provided in Annex V. The use of a default value shall be an 1380
exceptional case, and the correct subcategory needs to be chosen. Therefore, when primary data on 1381
the actual product assessed are unavailable, information shall be provided on data unavailability and 1382
reasons for it. 1383
1384
6.10.4 Transportation of raw milk and distribution of packaged dairy products 1385
For transportation of raw milk to the dairy unit and transportation of packaged dai ry products to the 1386
sales point, allocation on mass (i.e. fresh mass) shall be applied. 1387
1388

80
6.10.5 Transportation from retail to consumer home 1389
Transportation of goods in a personal car requires allocating the journey to the different products 1390
transported. As default approach, each item purchased at the store is allocated 5% of the journey, 1391
based on the assumption that 20 products are minimally purchased at a time. This can be called a 1392
"unitary allocation". By "item", it should be understood products in their most usual sales format. 1393
Typically, the following sales formats can be considered for dairy products: 1394
1 L of liquid milk 1395
250 g of cheese 1396
4x 125 g of fermented milk products 1397
250 g of butterfat products 1398
1399
6.10.6 Materials recycling and energy recovery from waste incineration 1400
Recycling and incineration of packaging materials are multi -output processes. The EoL formula 1401
provided in Annex V to the PEF method (European Commission 2013) is used as baseline approach. 1402
The 50:50 end-of-life formula shall be applied, as illustrated in Equation 6 where elements of the 1403
formula to be considered within the life cycle stages “Packaging” and “End-of-life” are highlighted. 1404
1405
Equation 6: PEF Guide end-of-life formula with the terms grouped by life cycle stage (see PEF Guide for 1406 detailed descriptions of each term used in the equation) 1407
The default EOL parameters for packaging materials (Tab. 43) will be updated once validated by the 1408
EF steering committee. 1409
Tab. 43: Default EOL parameters for packagi ng materials 1410
Material R1 R2 R3 LHV (MJ/kg) XER,heat XER, elec Qs/Qp
PE 0% 35.30% 27.40% 42.47
20% 10% 1
PET 0% 35.30% 27.40% 22.95
Glass 83.50% 72.80% 11.50% 0
Aluminium 10.40% 72.50% 11.60% 30.8
LPB 0% 42.00% 24.90% 15.92
Paper 6.00% 83.80% 6.90% 14.12
Laminated pouch 0% 0% 42.30% 30.79
81
7 Benchmarks 1411
One benchmark was calculated for each sub-category, and additional sub-benchmarks were 1412
calculated for different products type within the sub-category “fermented milk products”. Since no 1413
detailed market study on dairy products exists at the EU level, the benchmarks were assumed to be 1414
corresponding to the representative products defined in the screening study. It should therefore be 1415
seen as a first attempt to provide sectorial and sub-sectorial benchmarks, though the dairy sector sees 1416
several limitations to the proposed approach. 1417
1418
As a matter of principle, the TS does not question the merits of a benchmark approach as a tool among 1419
others to enable final consumers to assess the Environmental Footprint (EF) of products placed on the 1420
market. However, the TS considers that, at the current stage of development of the PEF methodology, 1421
a mandatory and stringent benchmark approach would be premature and its immediate 1422
implementation might give an inaccurate perception to consumers and a wrong incent ive to the 1423
industry, at least for some of the sub-categories In fact, a number of uncertainties related to the PEF 1424
methodology have been identified by the TS and need further assessment. The results of the 1425
supporting studies tend to confirm these gaps, which is fully understandable in a pilot phase. This is 1426
why, the TS has decided to address the benchmark issue in the frame of the upcoming communication 1427
vehicle testing phase. The TS intends to explore possible alternatives to the original benchmark 1428
approach that would enable to fulfil the primary objective laid down in the PEF guidance. 1429
1430
Annex III provides the details for the calculation of each benchmark. The PEF profile of each 1431
benchmark will be calculated as part of the remodelling exercise in the end of 2016, and will be 1432
integrated in this PEFCR in 2017. No classes of performance were defined by the dairy sector. 1433
1434
1435
1436
1437

82
8 Interpretation 1438
According to the PEF Guidance (2014), the interpretation phase shall include the following steps: 1439
Assessment of the robustness of the Product Environmental Footprint model (e.g. 1440
completeness and consistency check); 1441
Identification of Hotspots; 1442
Estimation of uncertainty; 1443
Conclusions, recommendations and limitations. 1444
All impact categories having a visible impact at one or the other level shall be considered for the 1445
assessment. 1446
The limitations of the PEF shall be clearly stated and described. 1447
Main conclusions together with the hotspots analysis for dairy products can be found in the PEF 1448
screening report in Annex I. 1449
1450
1451
1452
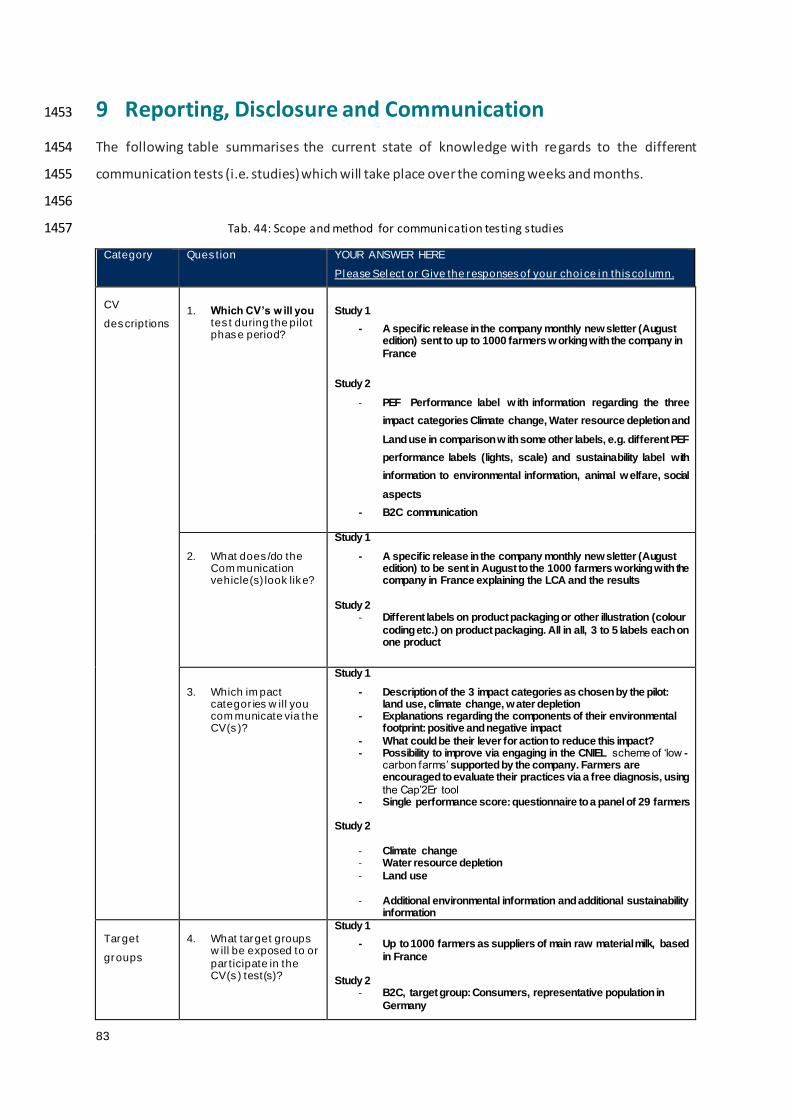
83
9 Reporting, Disclosure and Communication 1453
The following table summarises the current state of knowledge with regards to the different 1454
communication tests (i.e. studies) which will take place over the coming weeks and months. 1455
1456
Tab. 44: Scope and method for communication testing studies 1457
Category Question YOUR ANSWER HERE
Please Select or Give the responses of your choice in this column.
CV
descriptions
1. Which CV’s w ill you test during the pilot phase period?
Study 1
- A specif ic release in the company monthly new sletter (August edition) sent to up to 1000 farmers w orking with the company in
France
Study 2
- PEF Performance label w ith information regarding the three
impact categories Climate change, Water resource depletion and
Land use in comparison w ith some other labels, e.g. different PEF
performance labels (lights, scale) and sustainability label with
information to environmental information, animal w elfare, social
aspects
- B2C communication
2. What does/do the Communication vehicle(s) look like?
Study 1
- A specif ic release in the company monthly new sletter (August edition) to be sent in August to the 1000 farmers working with the company in France explaining the LCA and the results
Study 2
- Different labels on product packaging or other illustration (colour
coding etc.) on product packaging. All in all, 3 to 5 labels each on one product
3. Which impact categories w ill you communicate via the CV(s)?
Study 1
- Description of the 3 impact categories as chosen by the pilot: land use, climate change, w ater depletion
- Explanations regarding the components of their environmental footprint: positive and negative impact
- What could be their lever for action to reduce this impact? - Possibility to improve via engaging in the CNIEL scheme of ‘low -
carbon farms’ supported by the company. Farmers are encouraged to evaluate their practices via a free diagnosis, using
the Cap’2Er tool - Single performance score: questionnaire to a panel of 29 farmers
Study 2
- Climate change - Water resource depletion
- Land use
- Additional environmental information and additional sustainability information
Target
groups
4. What target groups will be exposed to or
participate in the CV(s) test(s)?
Study 1
- Up to 1000 farmers as suppliers of main raw material milk, based
in France Study 2
- B2C, target group: Consumers, representative population in
Germany

84
Category Question YOUR ANSWER HERE
Please Select or Give the responses of your choice in this column.
Please provide one answer
per CV
Methods 5. How are you going to
test the CV(s)?
Please provide one answer
per CV
Study 1
- Organise individual meetings betw een 29 farmers and company
technicians to promote the ‘low -carbon farms’ initiative including the environmental diagnosis of their farms. The results w ill enlighten their best practices and those to be improved in an action plan.
- At the end of this interview , a questionnaire w ill be addressed by the technician to each farmer, asking them questions, on the three follow ing items: 1- Understanding of his environmental footprint
2- Motivation to change behaviour 3- Levers for action
Study 2 Communication test w ith 2 phases:
1. Pre-testing to get information from consumers w hich topics they
f ind interesting and important in product communication, e.g. environment, health, animal w elfare, social conditions. Test method is a telephone interview with 500 consumers. This is the basis for the communication test in phase 2.
2. Communication test w ith different product labels (3 to 5 different
labels, e.g. environmental PEF label, sustainability label), the type of the labels depends of the results of the Pre-testing. Test
method is an online-survey with 500 consumers.
Measured
Effects
6. What are you going
to test?
Please provide one answer
per CV
Study 1
- Is the new sletter best CV to inform the farmers on this topic and
to lead change? - Is the 1 to 1 interview more eff icient to deliver this message? - Farmers’ ability to understand their environmental footprint
through impact categories
- Motivation to change behaviour and modalities, especially if the farmer w ill enrol in the CNIEL ‘low -carbon farms’ initiative supported by the company
Study 2
1. What is important for consumers in product communication?
Which information do consumers w ish to have on products? 2. Is environmental information on products “enough” for
consumers or do they w ish to have holistic information, on dairy products e.g. information regarding animal w elfare?
3. How can product information influence consumer behaviour? Attitude tow ards products?
Durations 7. When will the tests
run?
Please provide one answer
per CV
All studies
- Aug-Oct 2016
Challenges
8. What are main challenges that you foresee when testing the CV?
Please provide one answer
per CV
Study 1
- Get interest from the farmers on environmental issues and enrol them in the CNIEL initiative
- Get interest from the company technicians to promote this initiative
Study 2
- Costs of the test and personal resources

85
Category Question YOUR ANSWER HERE
Please Select or Give the responses of your choice in this column.
Expected
Biases
9. Are there any
circumstances that you expect to change (bias) the
effectiveness of the CV? e.g. unforeseen or intended communications
/events that impact the possible effectiveness of the CV.
Please provide one answer
per CV
Study 1 and 2
- No idea
Cooperations 10. Do you cooperate
w ith other pilots that participate in the CV testing phase?
Study 1 and 2
- No
11. Do you (plan to) consult external
experts for (parts of) the testing?
Study 1
- No
Study 2 - Yes, for the planning and implementation of the test
1458
9.1 PEF external communication report 1459
In case a PEF external communication report is listed among the communication options, the PEFCR 1460
shall: 1461
i) Specify and justify any deviations from the default reporting requirements presented in chapter 1462
8 of the PEF Guide, as well as specify and justify any additional reporting requirements and/or 1463
differentiate reporting requirements depending on, for example, the type of applications of the 1464
PEF study and the type of product being assessed. 1465
ii) Specify whether the PEF results shall be reported separately for each of the selected life cycle 1466
stages.] 1467
iii) Specify the format for reporting any additional environmental information.] 1468

86
9.2 PEF performance tracking report 1469
In case a PEF performance tracking report is listed among the communication options, the PEFCR shall: 1470
[Specify and describe the requirements for a PEF performance tracking report, allowing for the 1471
comparison of a PEF profile of a specific product over time with respect to its original or previous PEF 1472
profile] 1473
9.3 PEF Declaration 1474
In case a PEF declaration is listed among the communication options, the PEFCR shall specify and 1475
describe the requirements, as listed in chapter 3.10.3 of this guidance]. 1476
9.4 PEF label 1477
In case a PEF label is listed among the communication options, the PEFCR shall specify and describe 1478
the requirements for the use of the label, its content and its layout. 1479
1480
87
10 Verification 1481
According to the PEF Guidance (2014): “The verification procedure shall be transparent. The 1482
independent verifier shall generate a report documenting the verification process, while adhering to 1483
the obligations covering rules for data confidentiality. This report shall be available to any person upon 1484
request.” 1485
Additionally, the PEF Guide (2013) sates that: “Any PEF study intended for internal communication 1486
claiming to be in line with the PEF Guide and any PEF study for external communication (e.g. B2B or 1487
B2C) shall be critically reviewed in order to ensure that: 1488
The methods used to carry out the PEF study are consistent with this PEF Guide; 1489
The methods used to carry out the PEF study are scientifically and technically valid; 1490
The data used are appropriate, reasonable and meet the defined data quality requirements; 1491
The interpretation of results reflects the limitations identified; 1492
The study report is transparent, accurate and consistent.” 1493
For additional information regarding verification, please refer to the PEF Guidance (2014) and PEF 1494
Guide (2013). 1495
1496
1497
1498

88
11 References 1499
AFNOR (2014)
AFNOR (2014). General principles for an environmental communication on mass market products - Part 20: Methodology for the environmental impacts assessment of dairy products. BP X 30-323-0. DRAFT version of July 2014
DairyCo (2011) DairyCo (2014) Dairy Statistics – An insider’s guide 2014
Dollé et al. (2013) Dollé J-B., Faverdin P., Agabriel J., Sauvant D., Klumpp K. (2013) Contribution de l’élevage bovin aux émissions de GES et au stockage de carbone selon les systèmes de production. Fourrages (2013) 215, 181-191
EAL (2013) EAL (2013) Enquête Annuelle Laitière - French annual dairy survey (production data)
European Commission (2008)
European Commission (2008). Statistical Classification of Economic Activities in the European Community, Rev. 2 (2008). http://ec.europa.eu/eurostat/ramon/nomenclatures/index.cfm?TargetUrl=DSP_NOM_DTL_VIEW&StrNom=NACE_REV2&StrLanguageCode=EN&IntPcKey=18510944&IntKey=18510944&StrLayoutCode=HIERARCHIC&IntCurrentPage=1
European Commission (2013)
European Commission (2013). 2013/179/EU: Commission Recommendation of 9 April 2013 on the use of common methods to measure and communicate the life cycle environmental performance of products and organisations. Annex III: Organisation Environmental Footprint (OEF) Guide. Official Journal of the European Union, L 124, Volume 56, May 4th, 2013. http://eur-lex.europa.eu/JOHtml.do?uri=OJ:L:2013:124:SOM:EN:HTML
European Commission (2016)
European Commission (2014). Environmental Footprint Pilot Guidance document. Guidance for the implementation of the EU Product Environmental Footprint (PEF) during the Environmental Footprint (EF) Pilot Phase, v. 5.2, February 2016.
European Commission Joint Research Centre (2015)
EC-JRC (2015). Default approaches for cross-cutting issues for cattle related Product Environmental Footprint pilots. DRAFT final report. European Commission, Joint Research Centre, Institute for Environment and Sustainability, Sustainability Assessment Unit. Ispra, Italy
European Food SCP Round Table (2013)
European Food Sustainable Consumption and Production (SCP) Round Table (2013). ENVIFOOD Protocol - Environmental Assessment of Food and Drink Protocol, Version 1.0, November 20th, 2013.
European Parliament (2013)
European Parliament (2013) Regulation (EU) No 1308/2013 of the European Parliament and of the Council of 17 December 2013 establishing a common organisation of the markets in agricultural products and repealing Council Regulations (EEC) No 922/72, (EEC) No 234/79, (EC) No 1037/2001 and (EC) No 1234/2007
FAO (2011) The Food and Agriculture Organization of the United Nations (2011). Global food losses and food waste - Extent causes and prevention report. Rome

89
FAO/WHO (2011) The Food and Agriculture Organization of the United Nations and the World Health Organisation (2011). Codex Alimentarius – Milk and Milk Products, Second edition, Rome
IDF (2015) International Dairy Federation (IDF) (2015). A common carbon footprint approach for Dairy. The IDF guide to standard life cycle assessment methodology for the dairy sector. Brussels, Belgium.
IRI (2013) IRI (2013) IRI survey 2013 (France)
LEAP (2015a) LEAP (2015). Environmental performance of animal feeds supply chains: Guidelines for assessment. Livestock Environmental Assessment and Performance Partnership. FAO, Rome, Italy.
LEAP (2015b) LEAP (2015). Principles for the assessment of livestock impacts on biodiversity. Draft for public review. Livestock Environmental Assessment and Performance Partnership. FAO, Rome, Italy.
MIV (2014) Milchindustrie-Verband e. V. (2014): Geschäftsbericht 2013/2014. Teil II – Statistischer Anhang. URL: http://milchindustrie.de/fileadmin/Dokumente/Verband/ZahlenDatenFakten_2013_14.pdf
WRAP (2010) WRAP (2010) Life cycle assessment of example packing systems of milk: URL: http://www.wrap.org.uk/content/life-cycle-assessment-example-packaging-systems-milk
ZMP (2013) ZMB Zentrale Milchmarkt Berichterstattung GmbH (2013): ZMB Jahrbuch Milch 2013. Berlin.
1500
1501

90
12 Supporting information for the PEFCR 1502
Open stakeholder consultations 1503
This document is available for the 3rd consultation on this site: 1504
https://webgate.ec.europa.eu/fpfis/wikis/display/EUENVFP/ 1505
1506
PEFCR Review Report 1507
Additional requirements in standards not covered in PEFCR 1508
[If a PEFCR is designed to be compliant with more than one standard, list requirements for any claim 1509
that intends to be compliant with these standards] 1510
1511
1512

91
13 List of annexes 1513
13.1 Annex I – Screening study report 1514
Annex I is available in the following documents: 1515
PEFCR_Dairy_ScreeningReport_2015-08-07.pdf 1516
PEFCR_Dairy_ScreeningReport_AnnexII_LCI-results.xlsx 1517
1518
1519
13.2 Annex II – Supporting studies 1520
Six supporting studies were performed in the context the PEF pilot phase. Annex II is available in the 1521
following documents: 1522
PEFCR_Dairy_SupportingStudyReport_BelGroup.pdf 1523
PEFCR_Dairy_SupportingStudyReport_CLS.pdf 1524
PEFCR_Dairy_SupportingStudyReport_Danone.pdf 1525
PEFCR_Dairy_SupportingStudyReport_DMK.pdf 1526
PEFCR_Dairy_SupportingStudyReport_Fonterra.pdf 1527
PEFCR_Dairy_SupportingStudyReport_FrieslandCampina.pdf 1528
1529

92
13.3 Annex III – Benchmarks 1530
Annex III provides the details for the calculation of each benchmark. One benchmark was calculated 1531
for each sub-category, and additional sub-benchmarks were calculated for different products type 1532
within the sub-category “fermented milk products”. 1533
Since no detailed market study on dairy products exists at the EU level, the benchmarks were assumed 1534
to be corresponding to the representative products defined in the screening study. It should therefore 1535
be seen as a first attempt to provide sectorial and sub-sectorial benchmarks, though the dairy sector 1536
sees several limitations to the proposed approach. 1537
Each representative product was determined based on available data for major EU national markets, 1538
or corporate market statistics, which were then weighted or extrapolated to represent the EU market 1539
average. Expert knowledge from the Technical Secretariat was used when no market data was 1540
available. Tables III-1 to III-6 summarize the data used for the composition and packaging of each 1541
representative product. 1542
Tab. II-1: Composition of the representative product for l iquid milk 1543
Liquid milk FR DE UK Other EU EU-28
Market share (1) 11% 17% 22% 50% 100%
Fat content market data
(2)
market data
(4)
market data
(5)
expert est.
(b)
weighted
avg
Skimmed (<0.3%) 6% 2% 10% 6% 6%
Semi-skimmed (1.5-1.8%) 85% 52% 70% 61% 61%
Whole milk (3.5%) 9% 46% 20% 33% 33%
Thermal treatment market data
(2)
market data
(4)
market data
(5)
expert est.
(c)
weighted
avg
Pasteurised or filtered 2% 31% 95% 30% 41%
UHT 98% 69% 5% 70% 59%
Packaging market data
(3)
expert est.
(a)
market data
(6)
expert est.
(d)
weighted
avg
Multilayer carton 1000 ml 53% 100% 11% 70% 60%
Plastic bottle 1000 ml 47% 0% 78% 25% 35%
Glass bottle, returnable 1000
ml
0% 0% 11% 5% 5%
1 EUROSTAT (2013) – production data 1544 2 EAL (2013) Enquête Annuelle Laitière - French annual dairy survey (production data) 1545 3 IRI (2013) IRI survey 2013 1546 4 German market (DMK) 2012, ZMB 2013 1547 5 DairyCo (2014) – consumption data 1548

93
6 WRAP (2010a) Life cycle assessment of example packing systems of milk 1549 a Expert estimate from DMK GROUP 1550 b Expert estimate: weighted average from FR, DE and UK (together 50% of EU production) 1551 c Expert estimate based on 2007 data from Elliott, Valerie «The UHT route to long-life planet». London: 1552 Times Online, weighted by production shares 1553 d Expert estimate based on shares of thermal treatments and data for FR, DE and UK 1554 1555 According to WRAP (2010b), the average trippage rate (i.e. number of re -use) of returnable glass 1556
bottles in the UK is 17.5. This value is judged representative of other EU countries using similar 1557
packaging. 1558
Tab. II-2: Composition of the representative product for dried whey products 1559
Dried whey products Whey powder Whey protein powder Lactose powder EU-28
Market share (1) 70% 10% 20% 100%
Dry matter content
85-95% 100% 100% - 80%
>98% - - 100% 20%
1 Market shares are estimated based on existing data for most recent years: 2012 EU consumption of 1560 whey powder, 2005-2009 average EU production of whey protein powder (i.e. whey protein concentrates and 1561 isolates), 2011 EU production of lactose. Source: EUROSTAT (2013), confidential and ZMB (2013) 1562 1563
Tab. II-3: Packaging of the representative product for dried whey products 1564
Dried whey products
Packaging corporate data (1)
Bulk 70%
Big bag (1000 kg) 14%
Kraft paper bag (25 kg) 16%
1 Corporate data from the Netherlands - confidential 1565 1566
Tab. II-4: Composition of the representative product for cheeses 1567
Cheeses FR DE IT UK NL Other EU EU-28
Market share
(1)
20% 23% 16% 5% 4% 33% 100%
Maturation market
data (2)
market
data (3)
expert
estimate
(a)
expert
estimate
(b)
expert
estimate
(c)
expert
estimate
weighted
avg
Unripened 39% 35% 50% 10% 35% 40% 39%
Ripened 61% 65% 50% 90% 65% 60% 61%

94
Packaging default
assumptio
n
default
assumptio
n
default
assumptio
n
default
assumptio
n
default
assumptio
n
default
assumptio
n
default
assumptio
n
Plastic foil 100% 100% 100% 100% 100% 100% 100%
1 ZMB Jahrbuch MILCH (2013) 1568 2 EAL (2013) Enquête Annuelle Laitière - French annual dairy survey (production data) 1569 3 German market (DMK) 2012, BLE 2014 1570 a Expert estimate based on statement from Massimo Forino, director of Assolatte, and italian production 1571 data from Assolatte and CLAL.it 1572 b Expert estimate extrapolated from DairyCo (2011) 1573 c Expert estimate: assumed same as DE 1574 1575
Tab. II-5: Composition of the representative product for fermented milk products 1576
Fermented milk products EU-28
Fat content market data (1)
Skimmed (0-1% fat) 17%
Plain 83%
Spoonable/liquid market data (3)
Spoonable 75%
Liquid 25%
Flavours market data (3)
Plain, unsweetened 32%
Flavoured (with flavourings) 18%
Fruited (with strawberry preparation) 51%
Packaging expert estimate (a) based on market data (1)
Spoonable - plastic cup (125 g) 53%
Spoonable - plastic cup (500 g) 18%
Spoonable - glass jar (125 g) 3%
Spoonable - paper cup (125 g) 1%
Liquid - Plastic bottle (100 ml) 5%
Liquid - Plastic bottle (1000 ml) 10%
Liquid – Multilayer carton (1000 ml) 10%
1 IRI (2013) IRI survey 2013 (France) 1577 2 EAL (2013) Enquête Annuelle Laitière - French annual dairy survey (production data) 1578 3 Corporate market data (2014) - confidential 1579 a Expert estimate: extrapolation from French market data 1580
1581
In addition to the above representative product, 4 “sub-benchmarks” are provided for the following 1582
types of fermented milk products: 1583
Spoonable plain 1584

95
Spoonable flavoured (with sugar and/or fruits/ artificial flavourings/ sweeteners) 1585
Plain liquid fermented milks 1586
Liquid flavoured fermented milks 1587
See Annex I (screening study report) for detailed information on the composition of these products. 1588
1589
Tab. II-6: Composition of the representative product for butterfat products 1590
Butterfat products FR DE NL Other EU EU-28
Market share (1) 24% 25% 3% 47% 100%
Fat content market data (2)
expert estimate (a)
expert estimate (a)
expert estimate (a)
Default value
Dairy spreads (<40%) 4% 4% 4% 4% 4%
Half-fat butter (40-65%) 10% 10% 10% 10% 10%
Butter (> 65%) 86% 86% 86% 86% 86%
Salt content market data
(2)
expert
estimate (b)
corporate
data (3)
expert
estimate (b)
weighted avg
Unsalted 61% 90% 70% 90% 82%
Salted 39% 10% 30% 10% 18%
Packaging market data (2)
expert estimate (a)
expert estimate (a)
expert estimate (a)
Default value
Aluminium foil laminated
paper (250 g)
86% 86% 86% 86% 86%
Preformed plastic cup (250 g)
14% 14% 14% 14% 14%
1 ZMB Jahrbuch MILCH (2013) 1591 2 IRI (2013) IRI survey 2013 (France) 1592 3 Corporate data - confidential 1593 a Expert estimate: same as FR 1594 b Expert estimate 1595 1596 1597
1598

96
13.4 Annex IV – Background data 1599
Annex IV is available in the following document: 1600
PEFCR_Dairy_DraftPEFCR_AnnexIV_BackgroundData.xlsx 1601
1602
13.5 Annex V - Default dry matter content for dairy products 1603
Annex V is available in the following document: 1604
PEFCR_Dairy_DraftPEFCR_AnnexV_DefaultDMContents.xlsx 1605
1606
13.6 Annex VI – Default biodiversity-related data 1607
Annex VI is available in the following document: 1608
PEFCR_Dairy_DraftPEFCR_AnnexVI_DefaultBiodiversityData.xlsx (yet to be provided) 1609
1610
13.7 Annex VII - Existing sectorial guidance documents 1611
Annex VII is available in the following document: 1612
PEFCR_Dairy_DraftPEFCR_AnnexVII_ExistingGuidanceDocuments.pdf 1613
1614