product environmental footprint category...
TRANSCRIPT
PRODUCT ENVIRONMENTAL
FOOTPRINT CATEGORY RULES
Leather
De Rosa-Giglio P.1, Fontanella A.3, Gonzalez-Quijano G.2, Ioannidis I.1, Nucci B.3, Brugnoli F.4 on behalf of the Leather Pilot Technical Secretariat
1Unione Nazionale Industria Conciaria (UNIC) 2Confederation of National Associations of Tanners and Dressers of the European Community (COTANCE) 3Scuola Superiore Sant'Anna (SSSUP) 4Spin 360
Final version 25 April 2018
Valid until 31 December 2020
I
1 Index LIST OF TABLES ......................................................................................................................................... III
LIST OF FIGURES ........................................................................................................................................ V
ACRONYMS ............................................................................................................................................ VI
DEFINITIONS ............................................................................................................................................. X
1. INTRODUCTION ................................................................................................................................... 1
2. GENERAL INFORMATION ABOUT THE PEFCR .............................................................................................. 1
2.1 TECHNICAL SECRETARIAT .................................................................................................................................... 1
2.2 CONSULTATIONS AND STAKEHOLDERS .................................................................................................................. 2
2.3 REVIEW PANEL AND REVIEW REQUIREMENTS OF THE PEFCR .................................................................................... 3
2.4 REVIEW STATEMENT .......................................................................................................................................... 4
2.5 GEOGRAPHIC VALIDITY ....................................................................................................................................... 4
2.6 LANGUAGE ...................................................................................................................................................... 5
2.7 CONFORMANCE TO OTHER DOCUMENTS ............................................................................................................... 5
3. PEFCR SCOPE ..................................................................................................................................... 5
3.1 PRODUCT CLASSIFICATION .................................................................................................................................. 5
3.2 REPRESENTATIVE PRODUCT(S) ............................................................................................................................. 6
3.3 DECLARED UNIT AND REFERENCE FLOW................................................................................................................. 6
3.4 SYSTEM BOUNDARY ........................................................................................................................................... 8
3.5 EF IMPACT ASSESSMENT .................................................................................................................................. 10
3.6 LIMITATIONS .................................................................................................................................................. 12
4. MOST RELEVANT IMPACT CATEGORIES, LIFE CYCLE STAGES AND PROCESSES ...................................................... 13
5. LIFE CYCLE INVENTORY ........................................................................................................................ 23
5.1 LIST OF MANDATORY COMPANY-SPECIFIC DATA .................................................................................................... 23
5.2 LIST OF PROCESSES EXPECTED TO BE RUN BY THE COMPANY .................................................................................... 55
5.3 DATA GAPS .................................................................................................................................................... 56
5.4 DATA QUALITY REQUIREMENTS ......................................................................................................................... 56
5.4.1 COMPANY-SPECIFIC DATASETS ....................................................................................................................... 56
5.5 DATA NEEDS MATRIX (DNM) ........................................................................................................................... 59
5.5.1 PROCESSES IN SITUATION 1............................................................................................................................ 60
5.5.2 PROCESSES IN SITUATION 2............................................................................................................................ 61
5.5.3 PROCESSES IN SITUATION 3............................................................................................................................ 62
5.6 WHICH DATASETS TO USE? ............................................................................................................................... 63
5.7 HOW TO CALCULATE THE AVERAGE DQR OF THE STUDY ........................................................................................ 63
5.8 ALLOCATION RULES ......................................................................................................................................... 63
5.9 ELECTRICITY MODELLING .................................................................................................................................. 68
5.10 CLIMATE CHANGE MODELLING ........................................................................................................................ 71
5.11 MODELLING OF WASTES AND RECYCLED CONTENT .............................................................................................. 73
6. LIFE CYCLE STAGES ............................................................................................................................. 74
6.1 RAW MATERIAL ACQUISITION AND PRE-PROCESSING ............................................................................................. 74
6.2 MANUFACTURING ........................................................................................................................................... 77
II
7. PEF RESULTS .................................................................................................................................... 77
7.1 BENCHMARK VALUES ....................................................................................................................................... 77
7.2 PEF PROFILE .................................................................................................................................................. 77
7.3 ADDITIONAL TECHNICAL INFORMATION............................................................................................................... 78
7.4 ADDITIONAL ENVIRONMENTAL INFORMATION ...................................................................................................... 78
8. VERIFICATION ................................................................................................................................... 78
9. REFERENCES ..................................................................................................................................... 79
ANNEX 1 – LIST OF EF NORMALISATION AND WEIGHTING FACTORS ..................................................................... 81
ANNEX 2 - CHECK-LIST FOR THE PEF STUDY ................................................................................................... 85
ANNEX 3 - CRITICAL REVIEW REPORT OF THE PEFCR ....................................................................................... 86
ANNEX 4 - REASONING FOR DEVELOPMENT OF PEFCR................................................................................... 108
ANNEX 5 – REPRESENTATIVE PRODUCTS .................................................................................................... 109
USE AND APPLICATION MIX ................................................................................................................................. 109
TECHNOLOGICAL MIX .......................................................................................................................................... 109
ANIMAL MIX - ORIGIN OF INPUT PROCESSING ITEMS AND FINISHED LEATHER ............................................................... 110
RPS SPECIFICATION ............................................................................................................................................. 111
ANNEX 6 – DOWNSTREAM SCENARIOS....................................................................................................... 113
CALCULATIONS OF STORED CARBON CONTENT IN FINISHED LEATHER PRODUCTS .......................................................... 113
BIOGENIC STORED CARBON (BSC) ........................................................................................................................ 113
STORED CARBON FROM CHEMICALS (SCC) ............................................................................................................. 117
BIOGENIC STORED CARBON (BSC) ........................................................................................................................ 118
ANNEX 7 – DEFAULT VALUES ................................................................................................................... 119
ANNEX 8 – BACKGROUND INFORMATION ON METHODOLOGICAL CHOICES .......................................................... 131
ALLOCATION STEP-BY-STEP METHODOLOGY DESCRIPTION ........................................................................................ 131
III
List of tables
Table 1 List of the organizations in the TS ____________________________________________________ 1
Table 2 Information on public consultations __________________________________________________ 3
Table 3 Members of the review panel _______________________________________________________ 3
Table 4 Classification of Products by Activity (CPA) for the products included in this PEFCR _____________ 5
Table 5 Representative Products ___________________________________________________________ 6
Table 6 Key aspects of the DU _____________________________________________________________ 7
Table 7 Reference flows per Representative Product ___________________________________________ 8
Table 8 Life cycle stages __________________________________________________________________ 9
Table 9 List of the impact categories to be used to calculate the PEF profile ________________________ 11
Table 10 List of the most relevant processes for the product group RP1 ___________________________ 15
Table 11 List of the most relevant processes for the product group RP2 ___________________________ 17
Table 12 List of the most relevant processes for the product group RP3 ___________________________ 19
Table 13 List of the most relevant processes for the product group RP4 ___________________________ 22
Table 14 Mandatory company-specific data__________________________________________________ 25
Table 15 Mandatory company-specific emissions _____________________________________________ 55
Table 16 How to assess the value of the DQR criteria for datasets with company-specific information ___ 58
Table 17 Data Needs Matrix (DNM) . *Disaggregated datasets shall be used. _______________________ 59
Table 18 How to assess the value of the DQR criteria when secondary datasets are used. _____________ 62
Table 19 Allocation rules _________________________________________________________________ 64
Table 20 Allocation factors for bovine leather ________________________________________________ 67
Table 21 Allocation factors for caprine leather _______________________________________________ 67
Table 22 Allocation factors for ovine leather _________________________________________________ 67
Table 23 Allocation rules for electricity _____________________________________________________ 70
Table 24 Characterization Factors (CFs) in CO2-equivalents, with carbon feedbacks __________________ 71
Table 25: Default values for chromium recovery CFF ___________________________________________ 73
Table 26 Raw material acquisition and pre-processing (capitals indicate those processes expected to be run
by the company) _______________________________________________________________________ 75
Table 27 Transport (capitals indicate those processes expected to be run by the company) ____________ 75
Table 28 List of EF normalisation and weighting factors ________________________________________ 82
Table 29 Weighting factors for Environmental Footprint ________________________________________ 84
Table 30 Check-list for the PEF study _______________________________________________________ 85
Table 31 Critical review report of the PEFCR _________________________________________________ 86
Table 32 EU Leather consumption mix (Countries contribution for less than 55 million €ur have been
excluded) ____________________________________________________________________________ 111
Table 33 Hide substance content per kg of raw hide / skin _____________________________________ 114
Table 34 Calculation sheet for BSC ________________________________________________________ 116
Table 35 Assumptions for the calculation of the chemical stored carbon __________________________ 117
Table 36 Chemicals modelling ___________________________________________________________ 120
Table 37 Default LCI for slaughterhouse to be used (Data refers to 1 kg of live weight) _______________ 130
IV
Table 38 Default distances to consider for transportation ______________________________________ 130
Table 39 Chromium recovery CFF _________________________________________________________ 130
Table 40 Preliminary N-proteic and hide substance quantities for input and outputs of Leather making
process _____________________________________________________________________________ 132
Table 41 Preliminary N-proteic contents for 1 kg of raw input material ___________________________ 134
Table 42 Preliminary N-proteic and hide substance % partition for the various raw materials _________ 134
Table 43 Collagen distribution wet salted hide, finished leather and solid waste (Starting material: 1 000 kg
wet salted raw hides, splitting in chrome) __________________________________________________ 136
Table 44 Italian Tanneries input and outputs quantities _______________________________________ 138
Table 45 Calculated hide substance and N-proteic contents’ quota for bovine wet salted hides input and all
process outputs _______________________________________________________________________ 139
V
List of figures
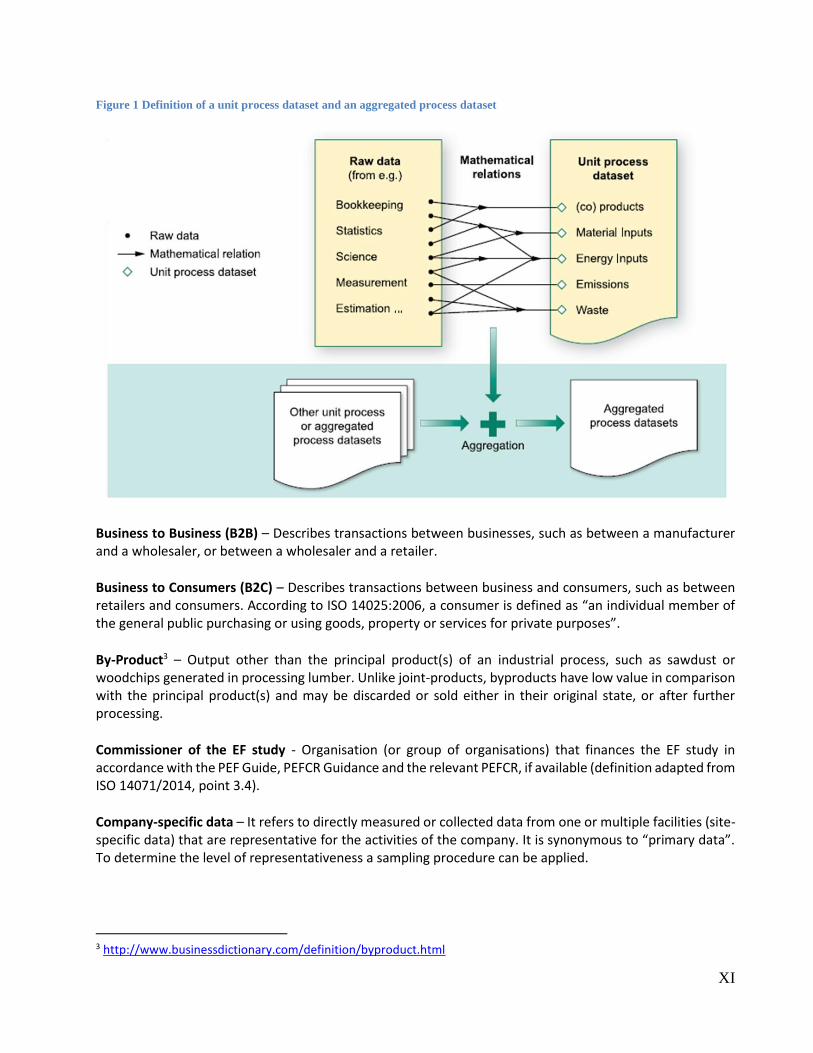
Figure 1 Definition of a unit process dataset and an aggregated process dataset_____________________ XI
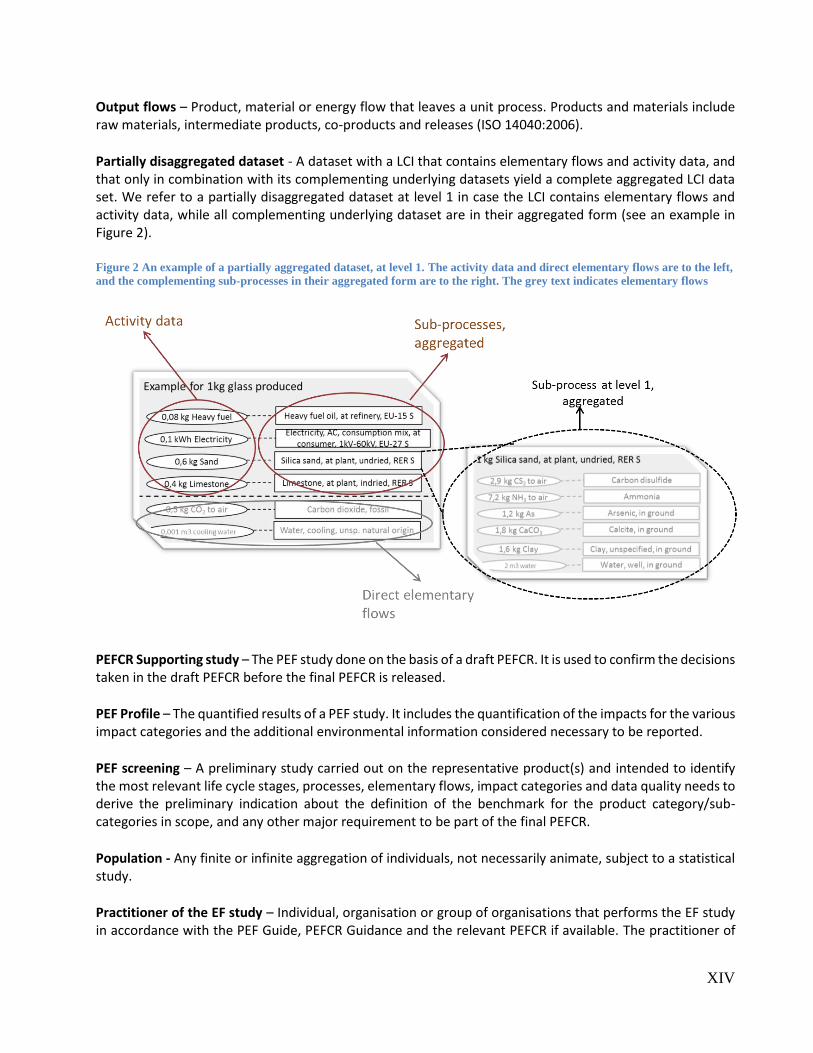
Figure 2 An example of a partially aggregated dataset, at level 1. The activity data and direct elementary
flows are to the left, and the complementing sub-processes in their aggregated form are to the right. The
grey text indicates elementary flows ______________________________________________________ XIV
Figure 3 System boundaries ______________________________________________________________ 10
Figure 4 Italian finished leather market segmentation (estimated output volume) by destination (end use)
___________________________________________________________________________________ 109
Figure 5 Finished Leather volume output partition on the basis of tanning method applied ___________ 110
Figure 6 Finished leather market segmentation (input volume) by animal origin of hides and skins _____ 111
Figure 7 Area yield of grain leather and split leather (green - raw hide, brown - grain leather, blue - split
leather) _____________________________________________________________________________ 141
VI
Acronyms
ABS Alkyl Benzene Sulfonate
ADEME Agence de l'Environnement et de la Maîtrise de l'Energie
AF Allocation Factor
AICC Associazione Italiana Chimici del Cuoio
APIC Associação Portuguesa dos Industriais de Curtumes
APPBR Asociatia Producatorilor de Piele si Blana din Romana
AR Allocation Ratio
ASTM American Society for Testing and Materials International
B2B Business to Business
B2C Business to Consumer
BAT Best Available Techniques
BLC Former British Leather Confederation, currently BLC Leather Technology Centre Ltd.
BoC Bill of Components
BoM Bill of Materials
BP Bonne Practique
BREF Best Available Techniques (BAT) Reference documents
BSC Biogenic Stored Carbon
BSI British Standards Institution
BULFFHI Branch Union of Leather, Furriers, Footwear and Haberdashery Industries
CAS Chemical Abstracts Service
CEN European Committee for Standardization
CEN TS Technical Specifications
CF Characterisation Factor
CFCs Chlorofluorocarbons
CFF Circular Footprint Formula
CFF-M Circular Footprint Formula – Modular form
CIV Centre d'Information des Viandes
CMWG Cattle Model Working Group
COD Chemical Oxygen Demand
COTANCE Confédération des Associations Nationales de Tanneurs et Mégissiers de la Communauté Européenne
CPA Classification of Products Activity
CSV Comma-Separated Values
CTC Technical Centre of Footwear and Leather
CuPc Copper Phthalocyanine
CWA Clean Water Act
DC Distribution Centre
DDS Dihydroxydiphenyl-sulfone
DG Directorate-General
DIN Deutsches Institut für Normung
DMI Dry Matter Intake
VII
DNM Data Needs Matrix
DQA Data Quality Assessment
DQR Data Quality Rating
DTI Danish Technological Institute
DU Declared unit
EDTA Ethylenediaminetetraacetic Acid
EA Economic Allocation
EC European Commission
EF Environmental Footprint
EI Environmental Impact
EIA Environmental Impact Assessment
ELCD European Reference Life Cycle Database
EMAS Eco-Management and Audit Schemes
EMS Environmental Management Schemes
EN European standards
ENV Environment
EoL End-of-Life
EPA Environmental Protection Agency
EPD Environmental Product Declaration
ETP Effluent Treatment Plant
EU European Union
EWC European Waste Catalogue
FAOSTAT Food and Agriculture Organization of the United Nations Statistics division
FFTM Fédération Française de la Tannerie-Mégisserie
FLIA Finnish Leather Industry Association
FNL Federatie van Nederlandse Lederfabrikanten
FoC Free of Chrome
GE Gross Energy Intake
GHG Greenhouse Gas
GLO Global
GR Geographical Representativeness
GRI Global Reporting Initiative
GWP Global Warming Potential
HD Helpdesk
HFC Hydrofluorocarbons
HH Human Health
ICLT Institute for Creative Leather Technologies
ICT International Council of Tanners
ID Identifier
IDF International Dairy Federation
IES Institute for Environment and Sustainability
ILCD International Reference Life Cycle Data System
INRA Institut National de la Recherche Agronomique
VIII
IPCC Intergovernmental Panel on Climate Change
IPPC Integrated Pollution Prevention and Control
ISBN International Standard Book Number
ISIC International Standard Industrial Classification
ISO International Organization for Standardization
IUCN International Union for Conservation of Nature and Natural Resources
IULTCS International Union of Leather Technologists and Chemists Societies
IULTCS/IUC Chemical Test Methods Commission
IULTCS/IUE Environment Commission
JALCA Journal of American Leather Chemists Association
JRC Joint Research Centre
JSLTC Journal of Society of Leather Technologists and Chemists
LCA Life Cycle Assessment
LCDN Life Cycle Data Network
LCI Life Cycle Inventory
LCIA Life Cycle Impact Assessment
LCT Life Cycle Thinking
LT Lifetime
LU Land Use
LW Live-Weight
NACE Nomenclature Générale des Activités Economiques dans les Communautés Européennes
NDA Non Disclosure Agreement
NGO Non-Governmental Organization
NL Netherlands
NMVOC Non-Methane Volatile Organic Compound
NPK Nitrogen-Phosphorus-Potassium
NZ New Zealand
OEF Organisation Environmental Footprint
OIT 2-Octyl-2H-isothiazol-3-one
OPP Ortho-Phenylphenol and Sodium
P Precision
PAS Public Available Specification
PERC Perchloroethylene
PCMS Polycarbamoyl Sulfonate
PCR Product Category Rule
PEF Product Environmental Footprint
PEFCR Product Environmental Footprint Category Rule
PI Province of Pisa
QR Quick Response
RER Rest of Europe
RF Reference Flow
RP Representative Product
SA Sociedad Anónima
IX
SB System Boundary
SC Steering Committee
SCC Stored Carbon from Chemicals
SDDC Sodium Dimethyldithiocarbamate
SDS-PAGE Sodium Dodecyl Sulphate - PolyAcrylamide Gel Electrophoresis
SG Svenska Garveriidkareforeningen
SLG Scottish Leather Group Ltd.
SMRS Sustainability Measurement & Reporting System
SS Supporting Study
SSIP Stazione Sperimentale per l’Industria delle Pelli e delle Materie Concianti
TAB Technical Advisory Board
TCMTB (Benzothiazol-2-ylthio)methylthiocyanat
TeR Technological Representativeness
TiR Time Representativeness
TKN Total Kjedahl Nitrogen
TS Technical Secretariat
UKLF United Kingdom Leather Federation
UNE Spanish Standard
UNI Ente Nazionale Italiano di Unificazione
UNI/TS Specifica Tecnica
UNIC Unione Nazionale Industria Conciaria
UNIDO United Nations Industrial Development Organization
UNITAN Union de la Tannerie et de la Mégisserie Belge
UNPAC Unione Nazionale Produttori Italiani Ausiliari Conciari
UPC Universitat Politècnica de Catalunya
USA United States of America
UUID Universally Unique Identifier
VDL Verband der Deutschen Lederindustrie e.V
VOC Volatile Organic Compounds
WRI World Resources Institute
WBCSD World Business Council for Sustainable Development
X
Definitions
Activity data - This term refers to information which is associated with processes while modelling Life Cycle Inventories (LCI). In the PEF Guide it is also called “non-elementary flows”. The aggregated LCI results of the process chains that represent the activities of a process are each multiplied by the corresponding activity data1 and then combined to derive the environmental footprint associated with that process (See Figure 1). Examples of activity data include quantity of kilowatt-hours of electricity used, quantity of fuel used, output of a process (e.g. waste), number of hours equipment is operated, distance travelled, floor area of a building, etc. In the context of PEF the amounts of ingredients from the bill of material (BOM) shall always be considered as activity data.
Aggregated dataset - This term is defined as a life cycle inventory of multiple unit processes (e.g. material or energy production) or life cycle stages (cradle-to-gate), but for which the inputs and outputs are provided only at the aggregated level. Aggregated datasets are also called "LCI results", “cumulative inventory” or “system processes” datasets. The aggregated dataset can have been aggregated horizontally and/or vertically. Depending on the specific situation and modelling choices a "unit process" dataset can also be aggregated. See Figure 12.
Application specific – It refers to the generic aspect of the specific application in which a material is used. For example, the average recycling rate of PET in bottles.
Benchmark – A standard or point of reference against which any comparison can be made. In the context of PEF, the term ‘benchmark’ refers to the average environmental performance of the representative product sold in the EU market. A benchmark may eventually be used, if appropriate, in the context of communicating environmental performance of a product belonging to the same category.
Bill of materials – A bill of materials or product structure (sometimes bill of material, BOM or associated list) is a list of the raw materials, sub-assemblies, intermediate assemblies, sub-components, parts and the quantities of each needed to manufacture an end product.
1 Based on GHG protocol scope 3 definition from the Corporate Accounting and Reporting Standard (World resources institute, 2011). 2 Source: UN Environment /SETAC “Global Guidance Principles for LCA Databases"
XI
Figure 1 Definition of a unit process dataset and an aggregated process dataset
Business to Business (B2B) – Describes transactions between businesses, such as between a manufacturer and a wholesaler, or between a wholesaler and a retailer.
Business to Consumers (B2C) – Describes transactions between business and consumers, such as between retailers and consumers. According to ISO 14025:2006, a consumer is defined as “an individual member of the general public purchasing or using goods, property or services for private purposes”.
By-Product3 – Output other than the principal product(s) of an industrial process, such as sawdust or woodchips generated in processing lumber. Unlike joint-products, byproducts have low value in comparison with the principal product(s) and may be discarded or sold either in their original state, or after further processing.
Commissioner of the EF study - Organisation (or group of organisations) that finances the EF study in accordance with the PEF Guide, PEFCR Guidance and the relevant PEFCR, if available (definition adapted from ISO 14071/2014, point 3.4).
Company-specific data – It refers to directly measured or collected data from one or multiple facilities (site-specific data) that are representative for the activities of the company. It is synonymous to “primary data”. To determine the level of representativeness a sampling procedure can be applied.
3 http://www.businessdictionary.com/definition/byproduct.html
XII
Comparative assertion – An environmental claim regarding the superiority or equivalence of one product versus a competing product that performs the same function (adapted from ISO 14025:2006).
Comparison – A comparison, not including a comparative assertion, (graphic or otherwise) of two or more products based on the results of a PEF study and supporting PEFCRs or the comparison of one or more products against the benchmark, based on the results of a PEF study and supporting PEFCRs.
Co-Product4– Product manufactured along with a different product, in a process in which both are required in the production of another product. In comparison, a by-product is usually an undesirable product.
Data Quality Rating (DQR) - Semi-quantitative assessment of the quality criteria of a dataset based on Technological representativeness, Geographical representativeness, Time-related representativeness, and Precision. The data quality shall be considered as the quality of the dataset as documented.
Direct elementary flows (also named elementary flows) – All output emissions and input resource use that arise directly in the context of a process. Examples are emissions from a chemical process, or fugitive emissions from a boiler directly onsite. See Figure 2.
Disaggregation – The process that breaks down an aggregated dataset into smaller unit process datasets (horizontal or vertical). The disaggregation can help making data more specific. The process of disaggregation should never compromise or threat to compromise the quality and consistency of the original aggregated dataset
Edible - Products which are covered by EU food legislation and comply with all relevant regulatory requirements for being placed on the market as suitable or fit for human consumption, notably with regard to the corresponding sanitary certification.
EF communication vehicles – It includes all the possible ways that can be used to communicate the results of the EF study to the stakeholders. The list of EF communication vehicles includes, but it is not limited to, labels, environmental product declarations, green claims, websites, infographics, etc.
EF report – Document that summarises the results of the EF study. For the EF report the template provided as annex to the PECFR Guidance shall be used. In case the commissioner of the EF study decides to communicate the results of the EF study (independently from the communication vehicle used), the EF report shall be made available for free through the commissioner’s website. The EF report shall not contain any information that is considered as confidential by the commissioner, however the confidential information shall be provided to the verifier(s).
EF study – Term used to identify the totality of actions needed to calculate the EF results. It includes the modelisation, the data collection, and the analysis of the results.
Electricity tracking5 – Electricity tracking is the process of assigning electricity generation attributes to electricity consumption.
4 http://www.businessdictionary.com/definition/coproduct.html 5 https://ec.europa.eu/energy/intelligent/projects/en/projects/e-track-ii
XIII
Elementary flow - Material or energy entering the system being studied that has been drawn from the environment without previous human transformation, or material or energy leaving the system being studied that is released into the environment without subsequent human transformation.
Environmental aspect – Element of an organization’s activities or products or services that interacts or can interact with the environment (ISO 14001:2015)
External Communication – Communication to any interested party other than the commissioner or the practitioner of the study.
Foreground elementary flows - Direct elementary flows (emissions and resources) for which access to primary data (or company-specific information) is available.
Grain - The surface of a hide or skin exposed by removal of the hair or wool and epidermis.
Hide - The outer covering of a mature, or fully grown, animal of the larger kind.
Independent external expert – Competent person, not employed in a full-time or part-time role by the commissioner of the EF study or the practitioner of the EF study, and not involved in defining the scope or conducting the EF study (adapted from ISO 14071/2014, point 3.2).
Input flows – Product, material or energy flow that enters a unit process. Products and materials include raw materials, intermediate products and co-products (ISO 14040:2006).
Intermediate product - An intermediate product is a product that requires further processing before it is saleable to the final consumer.
Lead verifier – Verifier taking part in a verification team with additional responsibilities compared to the other verifiers in the team.
Leather - hide or skin with its original fibrous structure more or less intact, tanned to be imputrescible, where the hair or wool may or may not have been removed, whether or not the hide or skin has been split into layers or segmented either before or after tanning and where any surface coating or surface layer, however applied, is not thicker than 0.15 mm.
Life Cycle Inventory (LCI) - The combined set of exchanges of elementary, waste and product flows in a LCI dataset.
Life Cycle Inventory (LCI) dataset - A document or file with life cycle information of a specified product or other reference (e.g., site, process), covering descriptive metadata and quantitative life cycle inventory. A LCI dataset could be a unit process dataset, partially aggregated or an aggregated dataset.
Material-specific – It refers to a generic aspect of a material. For example, the recycling rate of PET.
https://ec.europa.eu/energy/intelligent/projects/en/projects/e-track-ii
XIV
Output flows – Product, material or energy flow that leaves a unit process. Products and materials include raw materials, intermediate products, co-products and releases (ISO 14040:2006).
Partially disaggregated dataset - A dataset with a LCI that contains elementary flows and activity data, and that only in combination with its complementing underlying datasets yield a complete aggregated LCI data set. We refer to a partially disaggregated dataset at level 1 in case the LCI contains elementary flows and activity data, while all complementing underlying dataset are in their aggregated form (see an example in Figure 2).
Figure 2 An example of a partially aggregated dataset, at level 1. The activity data and direct elementary flows are to the left,
and the complementing sub-processes in their aggregated form are to the right. The grey text indicates elementary flows
PEFCR Supporting study – The PEF study done on the basis of a draft PEFCR. It is used to confirm the decisions taken in the draft PEFCR before the final PEFCR is released.
PEF Profile – The quantified results of a PEF study. It includes the quantification of the impacts for the various impact categories and the additional environmental information considered necessary to be reported.
PEF screening – A preliminary study carried out on the representative product(s) and intended to identify the most relevant life cycle stages, processes, elementary flows, impact categories and data quality needs to derive the preliminary indication about the definition of the benchmark for the product category/sub-categories in scope, and any other major requirement to be part of the final PEFCR.
Population - Any finite or infinite aggregation of individuals, not necessarily animate, subject to a statistical study.
Practitioner of the EF study – Individual, organisation or group of organisations that performs the EF study in accordance with the PEF Guide, PEFCR Guidance and the relevant PEFCR if available. The practitioner of
XV
the EF study can belong to the same organisation as the commissioner of the EF study (adapted from ISO 14071/2014, point 3.6).
Primary data6 - This term refers to data from specific processes within the supply-chain of the company applying the PEFCR. Such data may take the form of activity data, or foreground elementary flows (life cycle inventory). Primary data are site-specific, company-specific (if multiple sites for the same product) or supply-chain-specific. Primary data may be obtained through meter readings, purchase records, utility bills, engineering models, direct monitoring, material/product balances, stoichiometry, or other methods for obtaining data from specific processes in the value chain of the company applying the PEFCR. In this Guidance, primary data is synonym of "company-specific data" or "supply-chain specific data".
Product category – Group of products (or services) that can fulfil equivalent functions (ISO 14025:2006).
Product Category Rules (PCR) – Set of specific rules, requirements and guidelines for developing Type III environmental declarations for one or more product categories (ISO 14025:2006).
Product Environmental Footprint Category Rules (PEFCRs) – Product category-specific, life-cycle-based rules that complement general methodological guidance for PEF studies by providing further specification at the level of a specific product category. PEFCRs help to shift the focus of the PEF study towards those aspects and parameters that matter the most, and hence contribute to increased relevance, reproducibility and consistency of the results by reducing costs versus a study based on the comprehensive requirements of the PEF guide.
Refurbishment – It is the process of restoring components to a functional and/or satisfactory state to the original specification (providing the same function), using methods such as resurfacing, repainting, etc. Refurbished products may have been tested and verified to function properly.
Representative product (model) - The “representative product” may or may not be a real product that one can buy on the EU market. Especially when the market is made up of different technologies, the “representative product” can be a virtual (non-existing) product built, for example, from the average EU sales-weighted characteristics of all technologies around. A PEFCR may include more than one representative product if appropriate.
Representative sample – A representative sample with respect to one or more variables is a sample in which the distribution of these variables is exactly the same (or similar) as in the population from which the sample is a subset
Sample – A sample is a subset containing the characteristics of a larger population. Samples are used in statistical testing when population sizes are too large for the test to include all possible members or observations. A sample should represent the whole population and not reflect bias toward a specific attribute.
6 Based on GHG protocol scope 3 definition from the Corporate Accounting and Reporting Standard (World resources
institute, 20011).
XVI
Secondary data7 - It refers to data not from specific process within the supply-chain of the company applying the PEFCR. This refers to data that is not directly collected, measured, or estimated by the company, but sourced from a third party life-cycle-inventory database or other sources. Secondary data includes industry-average data (e.g., from published production data, government statistics, and industry associations), literature studies, engineering studies and patents, and can also be based on financial data, and contain proxy data, and other generic data. Primary data that go through a horizontal aggregation step are considered as secondary data.
Site-specific data – It refers to directly measured or collected data from one facility (production site). It is synonymous to “primary data”.
Skin - The more or less thick, tough, flexible covering of human and other animal bodies.
Split - Leather made from the middle or under layer split from a hide or skin.
Sub-population – In this document this term indicates any finite or infinite aggregation of individuals, not necessarily animate, subject to a statistical study that constitutes a homogenous sub-set of the whole population. Sometimes the word "stratum" can be used as well.
Sub-processes - Those processes used to represent the activities of the level 1 processes (=building blocks). Sub-processes can be presented in their (partially) aggregated form (see Figure 2).
Sub-sample - In this document this term indicates a sample of a sub-population.
Supply-chain – It refers to all of the upstream and downstream activities associated with the operations of the company applying the PEFCR, including the use of sold products by consumers and the end-of-life treatment of sold products after consumer use.
Supply-chain specific – It refers to a specific aspect of the specific supply-chain of a company. For example the recycled content value of an aluminium can produced by a specific company.
Type III environmental declaration – An environmental declaration providing quantified environmental data using predetermined parameters and, where relevant, additional environmental information (ISO 14025:2006). The predetermined parameters are based on the ISO 14040 series of standards, which is made up of ISO 14040 and ISO 14044.
Unit process dataset - Smallest element considered in the life cycle inventory analysis for which input and output data are quantified (ISO 14040:2006). In LCA practice, both physically not further separable processes (such as unit operations in production plants, then called “unit process single operation”) and also whole production sites are covered under "unit process", then called “unit process, black box” (ILCD Handbook).
Validation statement – Conclusive document aggregating the conclusions from the verifiers or the verification team regarding the EF study. This document is mandatory and shall be electronically or physically
7 Based on GHG protocol scope 3 definition from the Corporate Accounting and Reporting Standard (World resources institute, 20011)
XVII
signed by the verifier or in case of a verification panel, by the lead verifier. The minimum content of the validation statement is provided in this document.
Verification report – Documentation of the verification process and findings, including detailed comments from the Verifier(s), as well as the corresponding responses. This document is mandatory, but it can be confidential. However, it shall be signed, electronically or physically, by the verifier or in case of a verification panel, by the lead verifier.
Verification team – Team of verifiers that will perform the verification of the EF study, of the EF report and the EF communication vehicles.
Verifier – Independent external expert performing a verification of the EF study and eventually taking part in a verification team.
1
1. Introduction 1
The Product Environmental Footprint (PEF) Guide provides detailed and comprehensive technical guidance 2 on how to conduct a PEF study. PEF studies may be used for a variety of purposes, including in-house 3 management and participation in voluntary or mandatory programmes. 4
For all requirements not specified in this PEFCR the applicant shall refer to the documents this PEFCR is in 5 conformance with (see chapter 2.7 Conformance to other documents). 6
The compliance with the present PEFCR is optional for PEF in-house applications, whilst it is mandatory 7 whenever the results of a PEF study or any of its content is intended to be communicated. 8
Terminology: shall, should and may 9
This PEFCR uses precise terminology to indicate the requirements, the recommendations and options that 10 could be chosen when a PEF study is conducted. 11
● The term “shall” is used to indicate what is required in order for a PEF study to be in conformance 12 with this PEFCR. 13
● The term “should” is used to indicate a recommendation rather than a requirement. Any deviation 14 from a “should” requirement has to be justified when developing the PEF study and made 15 transparent. 16
● The term “may” is used to indicate an option that is permissible. Whenever options are available, 17 the PEF study shall include adequate argumentation to justify the chosen option. 18
2. General information about the PEFCR 19
2.1 Technical secretariat 20
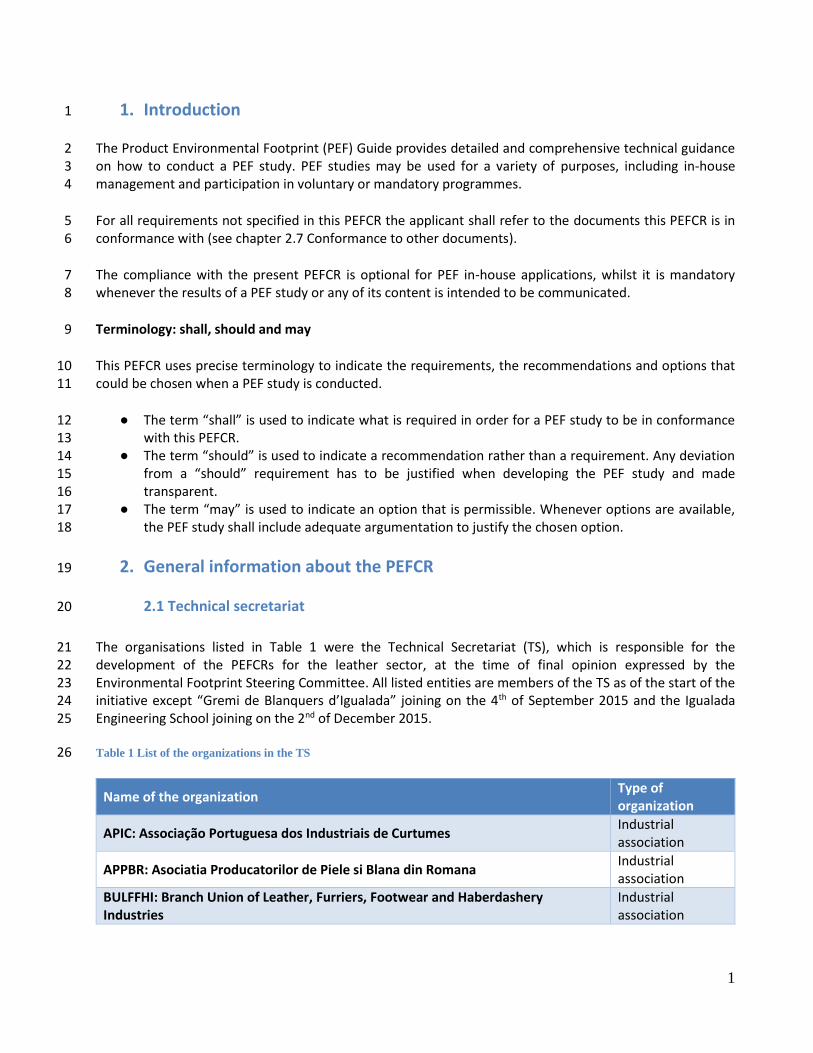
The organisations listed in Table 1 were the Technical Secretariat (TS), which is responsible for the 21 development of the PEFCRs for the leather sector, at the time of final opinion expressed by the 22 Environmental Footprint Steering Committee. All listed entities are members of the TS as of the start of the 23 initiative except “Gremi de Blanquers d’Igualada” joining on the 4th of September 2015 and the Igualada 24 Engineering School joining on the 2nd of December 2015. 25
Table 1 List of the organizations in the TS 26
Name of the organization Type of organization
APIC: Associação Portuguesa dos Industriais de Curtumes Industrial association
APPBR: Asociatia Producatorilor de Piele si Blana din Romana Industrial association
BULFFHI: Branch Union of Leather, Furriers, Footwear and Haberdashery Industries
Industrial association
2
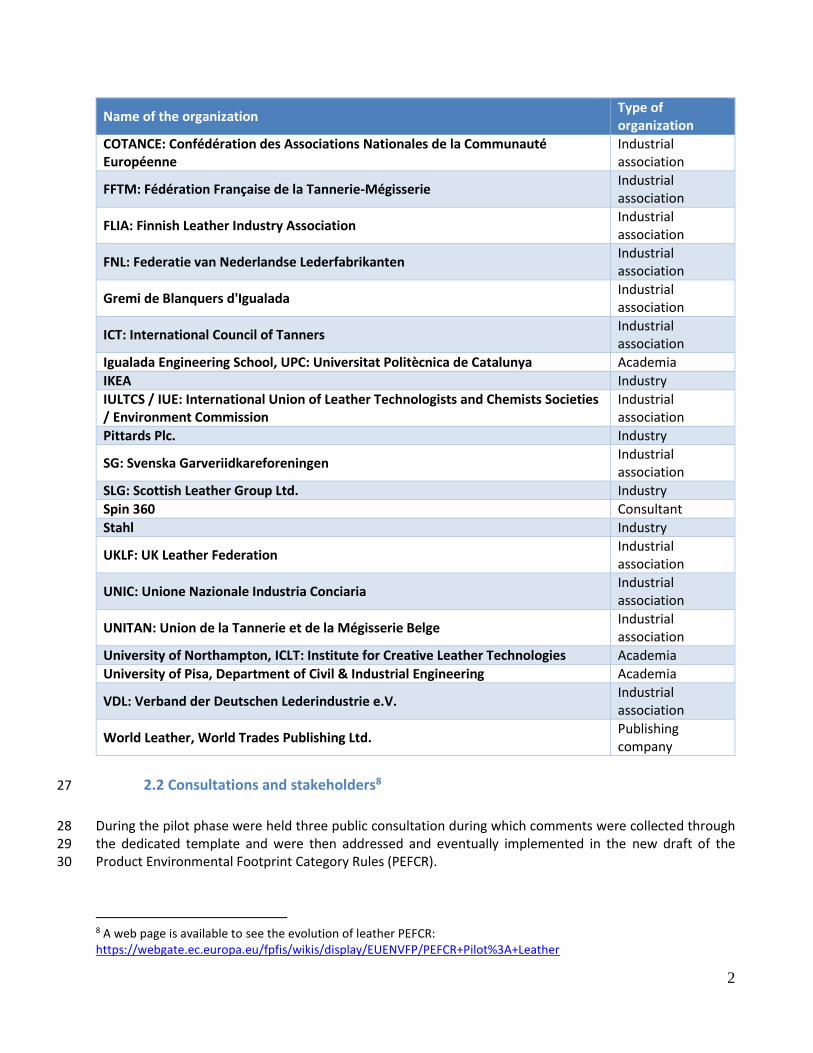
Name of the organization Type of organization
COTANCE: Confédération des Associations Nationales de la Communauté Européenne
Industrial association
FFTM: Fédération Française de la Tannerie-Mégisserie Industrial association
FLIA: Finnish Leather Industry Association Industrial association
FNL: Federatie van Nederlandse Lederfabrikanten Industrial association
Gremi de Blanquers d'Igualada Industrial association
ICT: International Council of Tanners Industrial association
Igualada Engineering School, UPC: Universitat Politècnica de Catalunya Academia
IKEA Industry
IULTCS / IUE: International Union of Leather Technologists and Chemists Societies / Environment Commission
Industrial association
Pittards Plc. Industry
SG: Svenska Garveriidkareforeningen Industrial association
SLG: Scottish Leather Group Ltd. Industry
Spin 360 Consultant
Stahl Industry
UKLF: UK Leather Federation Industrial association
UNIC: Unione Nazionale Industria Conciaria Industrial association
UNITAN: Union de la Tannerie et de la Mégisserie Belge Industrial association
University of Northampton, ICLT: Institute for Creative Leather Technologies Academia
University of Pisa, Department of Civil & Industrial Engineering Academia
VDL: Verband der Deutschen Lederindustrie e.V. Industrial association
World Leather, World Trades Publishing Ltd. Publishing company
2.2 Consultations and stakeholders8 27
During the pilot phase were held three public consultation during which comments were collected through 28 the dedicated template and were then addressed and eventually implemented in the new draft of the 29 Product Environmental Footprint Category Rules (PEFCR). 30
8 A web page is available to see the evolution of leather PEFCR: https://webgate.ec.europa.eu/fpfis/wikis/display/EUENVFP/PEFCR+Pilot%3A+Leather
3
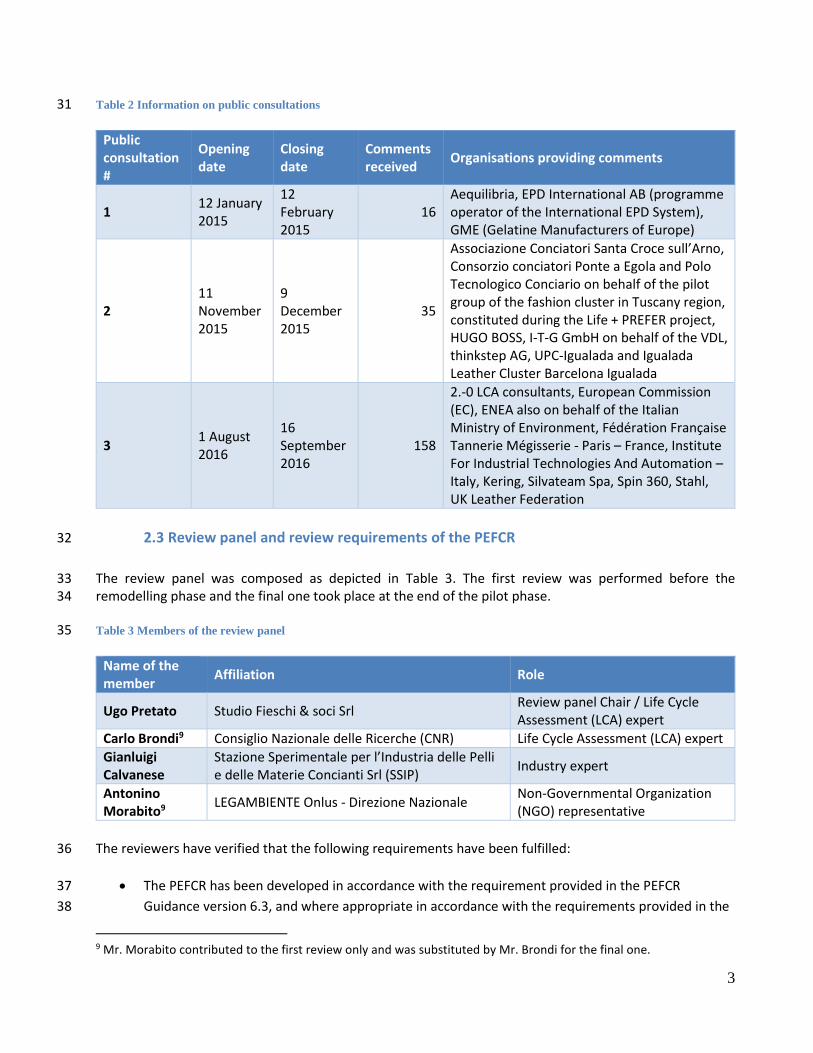
Table 2 Information on public consultations 31
Public consultation #
Opening date
Closing date
Comments received
Organisations providing comments
1 12 January 2015
12 February 2015
16 Aequilibria, EPD International AB (programme operator of the International EPD System), GME (Gelatine Manufacturers of Europe)
2 11 November 2015
9 December 2015
35
Associazione Conciatori Santa Croce sull’Arno, Consorzio conciatori Ponte a Egola and Polo Tecnologico Conciario on behalf of the pilot group of the fashion cluster in Tuscany region, constituted during the Life + PREFER project, HUGO BOSS, I-T-G GmbH on behalf of the VDL, thinkstep AG, UPC-Igualada and Igualada Leather Cluster Barcelona Igualada
3 1 August 2016
16 September 2016
158
2.-0 LCA consultants, European Commission (EC), ENEA also on behalf of the Italian Ministry of Environment, Fédération Française Tannerie Mégisserie - Paris – France, Institute For Industrial Technologies And Automation – Italy, Kering, Silvateam Spa, Spin 360, Stahl, UK Leather Federation
2.3 Review panel and review requirements of the PEFCR 32
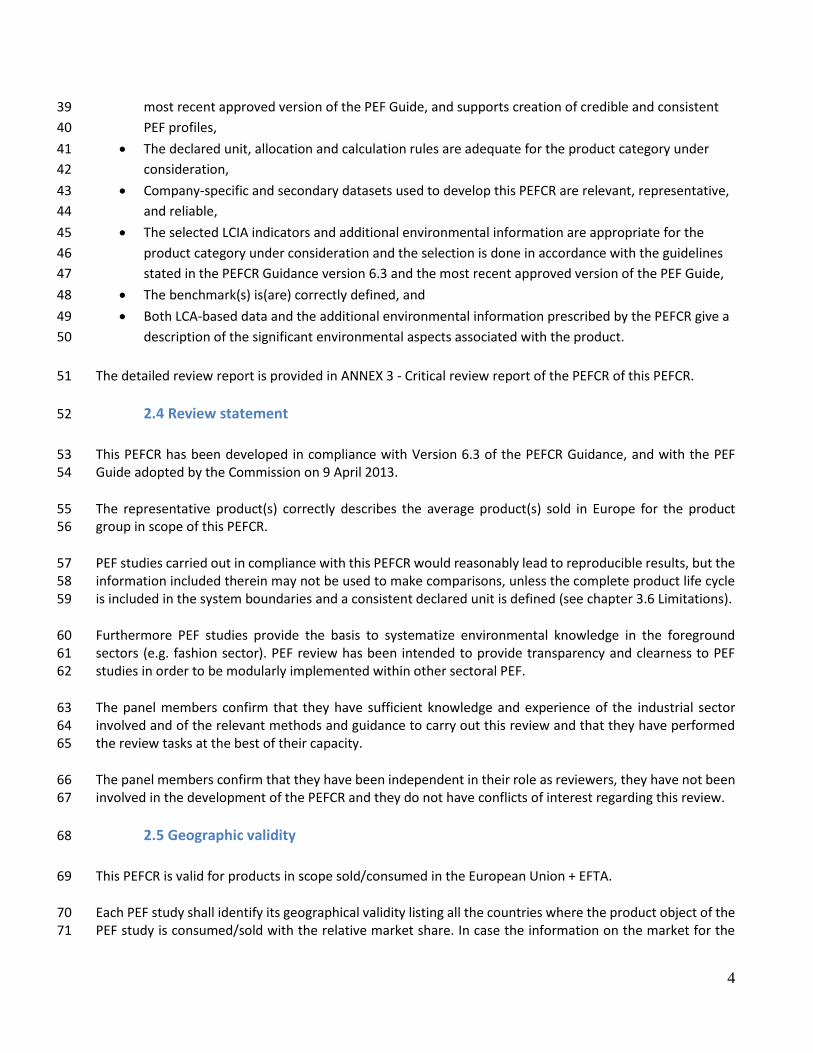
The review panel was composed as depicted in Table 3. The first review was performed before the 33 remodelling phase and the final one took place at the end of the pilot phase. 34
Table 3 Members of the review panel 35
Name of the member
Affiliation Role
Ugo Pretato Studio Fieschi & soci Srl Review panel Chair / Life Cycle Assessment (LCA) expert
Carlo Brondi9 Consiglio Nazionale delle Ricerche (CNR) Life Cycle Assessment (LCA) expert
Gianluigi Calvanese
Stazione Sperimentale per l’Industria delle Pelli e delle Materie Concianti Srl (SSIP)
Industry expert
Antonino Morabito9
LEGAMBIENTE Onlus - Direzione Nazionale Non-Governmental Organization (NGO) representative
The reviewers have verified that the following requirements have been fulfilled: 36
The PEFCR has been developed in accordance with the requirement provided in the PEFCR 37
Guidance version 6.3, and where appropriate in accordance with the requirements provided in the 38
9 Mr. Morabito contributed to the first review only and was substituted by Mr. Brondi for the final one.
4
most recent approved version of the PEF Guide, and supports creation of credible and consistent 39
PEF profiles, 40
The declared unit, allocation and calculation rules are adequate for the product category under 41
consideration, 42
Company-specific and secondary datasets used to develop this PEFCR are relevant, representative, 43
and reliable, 44
The selected LCIA indicators and additional environmental information are appropriate for the 45
product category under consideration and the selection is done in accordance with the guidelines 46
stated in the PEFCR Guidance version 6.3 and the most recent approved version of the PEF Guide, 47
The benchmark(s) is(are) correctly defined, and 48
Both LCA-based data and the additional environmental information prescribed by the PEFCR give a 49
description of the significant environmental aspects associated with the product. 50
The detailed review report is provided in ANNEX 3 - Critical review report of the PEFCR of this PEFCR. 51
2.4 Review statement 52
This PEFCR has been developed in compliance with Version 6.3 of the PEFCR Guidance, and with the PEF 53 Guide adopted by the Commission on 9 April 2013. 54
The representative product(s) correctly describes the average product(s) sold in Europe for the product 55 group in scope of this PEFCR. 56
PEF studies carried out in compliance with this PEFCR would reasonably lead to reproducible results, but the 57 information included therein may not be used to make comparisons, unless the complete product life cycle 58 is included in the system boundaries and a consistent declared unit is defined (see chapter 3.6 Limitations). 59
Furthermore PEF studies provide the basis to systematize environmental knowledge in the foreground 60 sectors (e.g. fashion sector). PEF review has been intended to provide transparency and clearness to PEF 61 studies in order to be modularly implemented within other sectoral PEF. 62
The panel members confirm that they have sufficient knowledge and experience of the industrial sector 63 involved and of the relevant methods and guidance to carry out this review and that they have performed 64 the review tasks at the best of their capacity. 65
The panel members confirm that they have been independent in their role as reviewers, they have not been 66 involved in the development of the PEFCR and they do not have conflicts of interest regarding this review. 67
2.5 Geographic validity 68
This PEFCR is valid for products in scope sold/consumed in the European Union + EFTA. 69
Each PEF study shall identify its geographical validity listing all the countries where the product object of the 70 PEF study is consumed/sold with the relative market share. In case the information on the market for the 71

5
specific product object of the study is not available, Europe +EFTA shall be considered as the default market, 72 with an equal market share for each country. 73
2.6 Language 74
The PEFCR is written in English. The original in English supersedes translated versions in case of conflicts. 75
2.7 Conformance to other documents 76
This PEFCR has been prepared in conformance with the following documents (in prevailing order): 77
PEFCR Guidance 6.3; 78
Product Environmental Footprint (PEF) Guide; Annex II to the Recommendation 2013/179/EU, 9 April 79 2013. Published in the official journal of the European Union Volume 56, 4 May 2013. 80
3. PEFCR scope 81
These PEFCR cover leathers meeting the following definition: 82
“Finished leathers produced from raw hides and skins of bovine, ovine and caprine animals, which have been 83 raised mainly for the production of milk, meat or wool, and slaughtered mainly for human consumption 84 purposes, notably meat production.” 85
Are excluded from the present PEFCR all leathers produced from hides or skins of animals other than those 86 slaughtered for human consumption, as well as any synthetic substitute material to leather. 87
Therefore, the product categories included in this work apply to finished leathers manufactured from adult 88 bovine hides, calf, ovine and caprine skins. These are the predominant industrial products of tanneries, 89 representing more than 99% of global finished leather production (source ICT). Downstream end users 90 (leather articles manufacturers) buy leather as an external input processing material. The related Statistical 91 Classification of Products by Activity (CPA) codes for these product categories are reported in Table 4. 92
3.1 Product classification 93
The CPA codes for the products included in this PEFCR are: 94
Table 4 Classification of Products by Activity (CPA) for the products included in this PEFCR 95
C MANUFACTURED PRODUCTS
15 Leather and related products
15.1 Tanned and dressed leather; luggage, handbags, saddlery and harness; dressed and dyed fur
15.11.3 Leather, of bovine or equine animals, without hair
15.11.4 Leather of sheep, goat or swine, without hair
Leather is the result of activities performed that are classified in the Statistical Classification of Economic 96 Activities in the European Community (NACE) Rev.2 under code 15.11 Tanning and dressing of leather; 97
6
dressing and dyeing of fur, corresponding to International Standard Industrial Classification (ISIC) Rev.4 to 98 code 1511. 99
3.2 Representative product(s) 100
The RPs are virtual products defined on the basis of European market share of the different kind of leather. 101
The following four RPs, one for each of the main application and uses of finished leather, have been 102 identified: 103
RP1. Leather for automotive interiors and furniture upholstery; 104 RP2. Leather for upper footwear and leather goods (e.g. bags, belts, wallets, …); 105 RP3. Leather for garment and gloves; 106 RP4. Sole leather. 107
Each RP cover all animal origins and technologies variants for the specific end use. 108
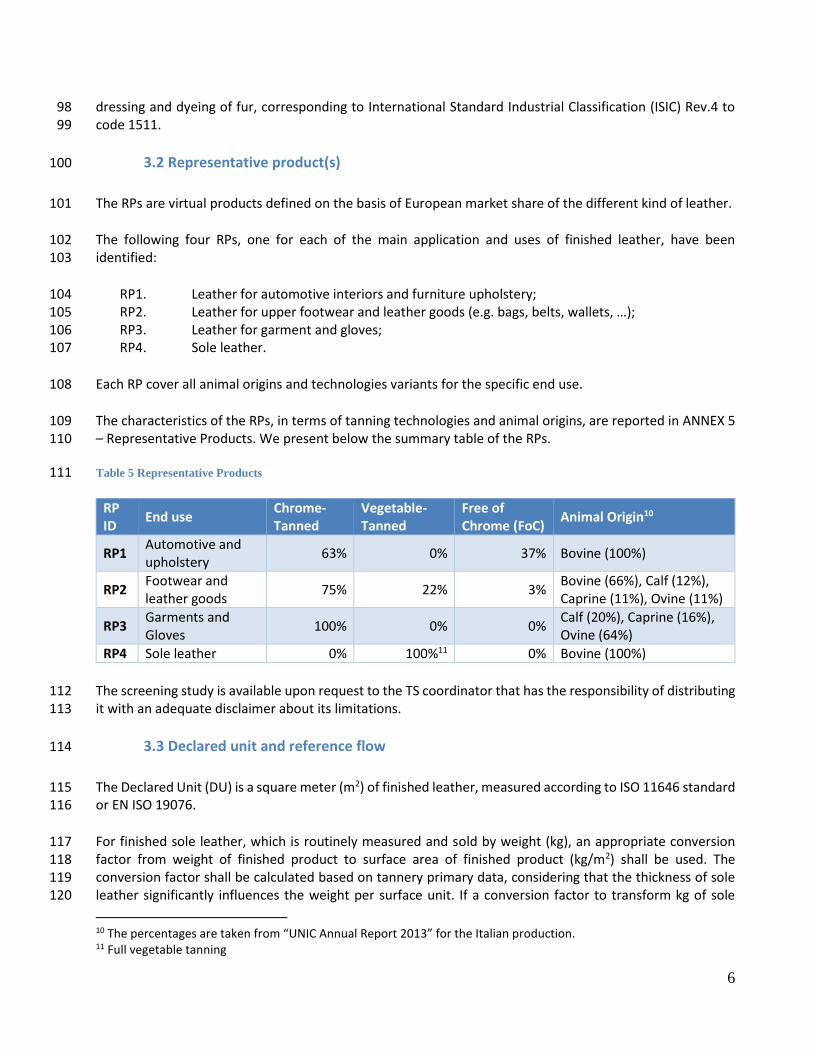
The characteristics of the RPs, in terms of tanning technologies and animal origins, are reported in ANNEX 5 109 – Representative Products. We present below the summary table of the RPs. 110
Table 5 Representative Products 111
RP ID
End use Chrome-Tanned
Vegetable-Tanned
Free of Chrome (FoC)
Animal Origin10
RP1 Automotive and upholstery
63% 0% 37% Bovine (100%)
RP2 Footwear and leather goods
75% 22% 3% Bovine (66%), Calf (12%), Caprine (11%), Ovine (11%)
RP3 Garments and Gloves
100% 0% 0% Calf (20%), Caprine (16%), Ovine (64%)
RP4 Sole leather 0% 100%11 0% Bovine (100%)
The screening study is available upon request to the TS coordinator that has the responsibility of distributing 112 it with an adequate disclaimer about its limitations. 113
3.3 Declared unit and reference flow 114
The Declared Unit (DU) is a square meter (m2) of finished leather, measured according to ISO 11646 standard 115 or EN ISO 19076. 116
For finished sole leather, which is routinely measured and sold by weight (kg), an appropriate conversion 117 factor from weight of finished product to surface area of finished product (kg/m2) shall be used. The 118 conversion factor shall be calculated based on tannery primary data, considering that the thickness of sole 119 leather significantly influences the weight per surface unit. If a conversion factor to transform kg of sole 120
10 The percentages are taken from “UNIC Annual Report 2013” for the Italian production. 11 Full vegetable tanning
7
leather into m2 of sole leather is not available as primary data from the tannery, a default value of 4.63 kg/m2 121 shall be used (average value that cover all ranges of thickness). The default values have been established in 122 an open consultation process with the producers of sole leathers producing more than 80% of the sole 123 European leather tested in the screening phase. The use of the default value shall be justified and be subject 124 to strict review by the verifier, since it greatly influence the results of the study. 125
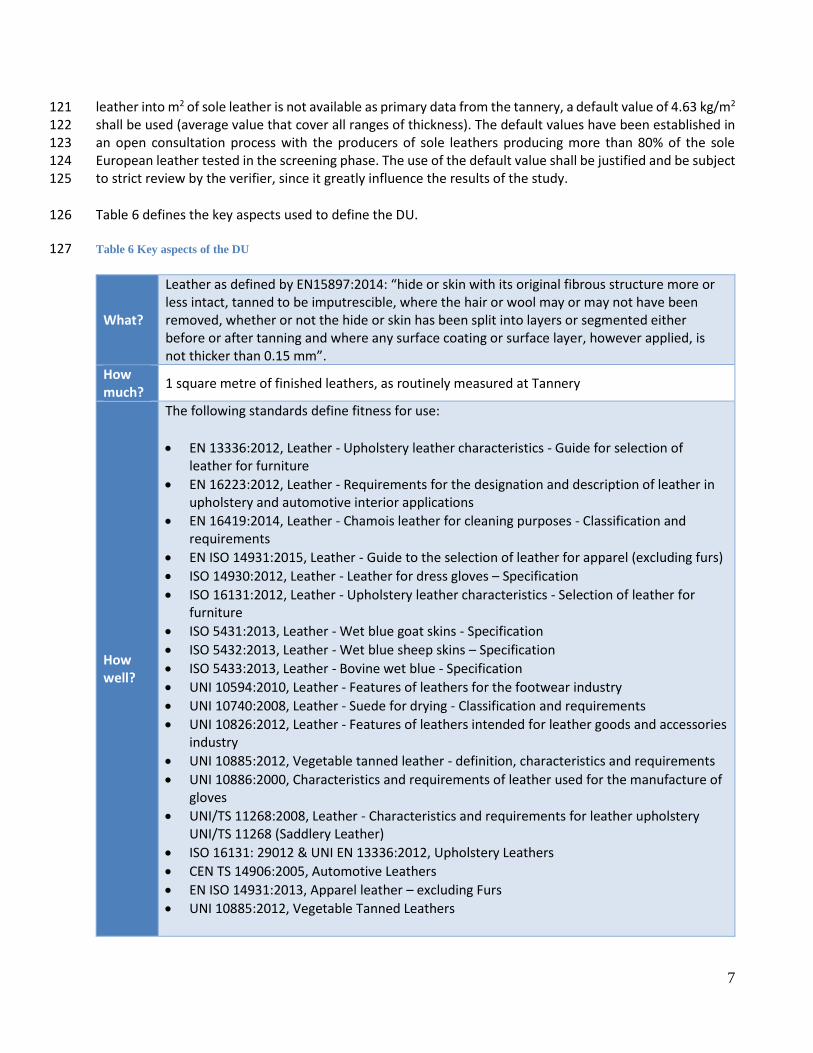
Table 6 defines the key aspects used to define the DU. 126
Table 6 Key aspects of the DU 127
What?
Leather as defined by EN15897:2014: “hide or skin with its original fibrous structure more or less intact, tanned to be imputrescible, where the hair or wool may or may not have been removed, whether or not the hide or skin has been split into layers or segmented either before or after tanning and where any surface coating or surface layer, however applied, is not thicker than 0.15 mm”.
How much?
1 square metre of finished leathers, as routinely measured at Tannery
How well?
The following standards define fitness for use:
EN 13336:2012, Leather - Upholstery leather characteristics - Guide for selection of leather for furniture
EN 16223:2012, Leather - Requirements for the designation and description of leather in upholstery and automotive interior applications
EN 16419:2014, Leather - Chamois leather for cleaning purposes - Classification and requirements
EN ISO 14931:2015, Leather - Guide to the selection of leather for apparel (excluding furs)
ISO 14930:2012, Leather - Leather for dress gloves – Specification
ISO 16131:2012, Leather - Upholstery leather characteristics - Selection of leather for furniture
ISO 5431:2013, Leather - Wet blue goat skins - Specification
ISO 5432:2013, Leather - Wet blue sheep skins – Specification
ISO 5433:2013, Leather - Bovine wet blue - Specification
UNI 10594:2010, Leather - Features of leathers for the footwear industry
UNI 10740:2008, Leather - Suede for drying - Classification and requirements
UNI 10826:2012, Leather - Features of leathers intended for leather goods and accessories industry
UNI 10885:2012, Vegetable tanned leather - definition, characteristics and requirements
UNI 10886:2000, Characteristics and requirements of leather used for the manufacture of gloves
UNI/TS 11268:2008, Leather - Characteristics and requirements for leather upholstery UNI/TS 11268 (Saddlery Leather)
ISO 16131: 29012 & UNI EN 13336:2012, Upholstery Leathers
CEN TS 14906:2005, Automotive Leathers
EN ISO 14931:2013, Apparel leather – excluding Furs
UNI 10885:2012, Vegetable Tanned Leathers
8
It is necessary to declare which standard is followed and the related level of compliance. The animal origin shall be reported.
How long?
Leather is an intermediate product and has no expiry date. Its life span depends from its final use but considering that use phase is beyond the system boundaries of these PEFCR, “how long?” specification cannot be defined.
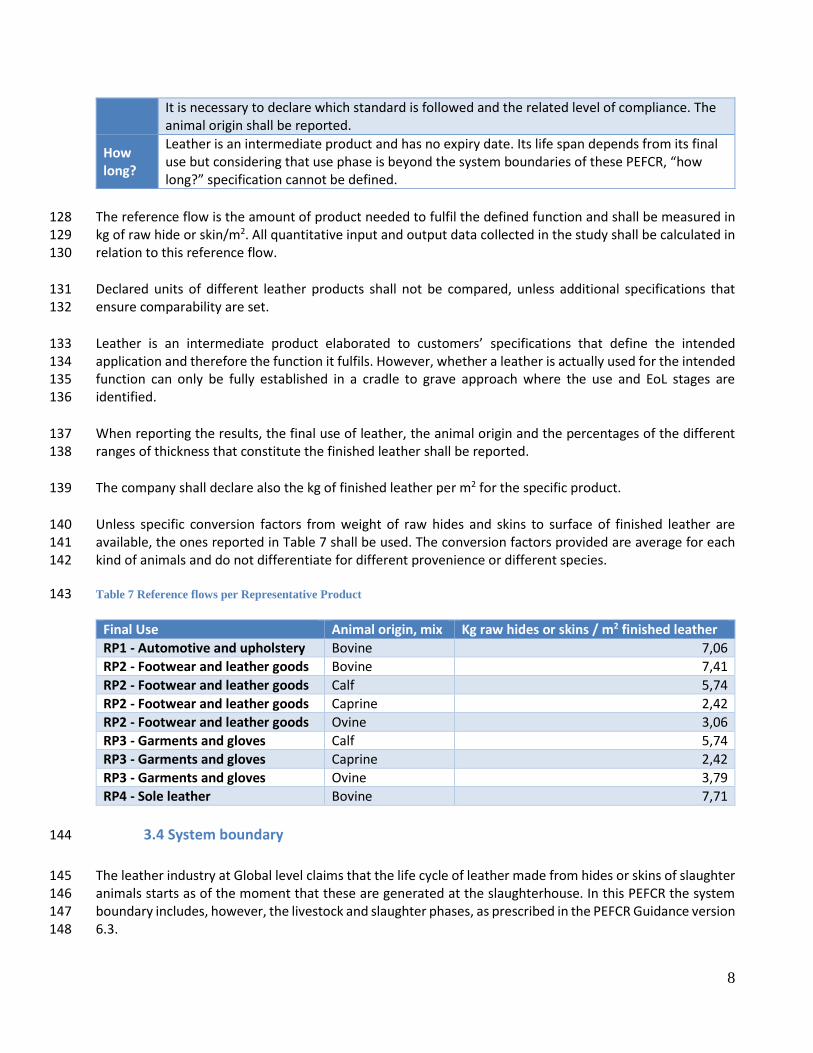
The reference flow is the amount of product needed to fulfil the defined function and shall be measured in 128 kg of raw hide or skin/m2. All quantitative input and output data collected in the study shall be calculated in 129 relation to this reference flow. 130
Declared units of different leather products shall not be compared, unless additional specifications that 131 ensure comparability are set. 132
Leather is an intermediate product elaborated to customers’ specifications that define the intended 133 application and therefore the function it fulfils. However, whether a leather is actually used for the intended 134 function can only be fully established in a cradle to grave approach where the use and EoL stages are 135 identified. 136
When reporting the results, the final use of leather, the animal origin and the percentages of the different 137 ranges of thickness that constitute the finished leather shall be reported. 138
The company shall declare also the kg of finished leather per m2 for the specific product. 139
Unless specific conversion factors from weight of raw hides and skins to surface of finished leather are 140 available, the ones reported in Table 7 shall be used. The conversion factors provided are average for each 141 kind of animals and do not differentiate for different provenience or different species. 142
Table 7 Reference flows per Representative Product 143
Final Use Animal origin, mix Kg raw hides or skins / m2 finished leather
RP1 - Automotive and upholstery Bovine 7,06
RP2 - Footwear and leather goods Bovine 7,41
RP2 - Footwear and leather goods Calf 5,74
RP2 - Footwear and leather goods Caprine 2,42
RP2 - Footwear and leather goods Ovine 3,06
RP3 - Garments and gloves Calf 5,74
RP3 - Garments and gloves Caprine 2,42
RP3 - Garments and gloves Ovine 3,79
RP4 - Sole leather Bovine 7,71
3.4 System boundary 144
The leather industry at Global level claims that the life cycle of leather made from hides or skins of slaughter 145 animals starts as of the moment that these are generated at the slaughterhouse. In this PEFCR the system 146 boundary includes, however, the livestock and slaughter phases, as prescribed in the PEFCR Guidance version 147 6.3. 148
9
As finished leather is an intermediate product, downstream processes such as B2B distribution, further 149 manufacturing into finished consumer products, distribution to customers, use phase and end-of-life 150 treatment of used products are out of scope. 151
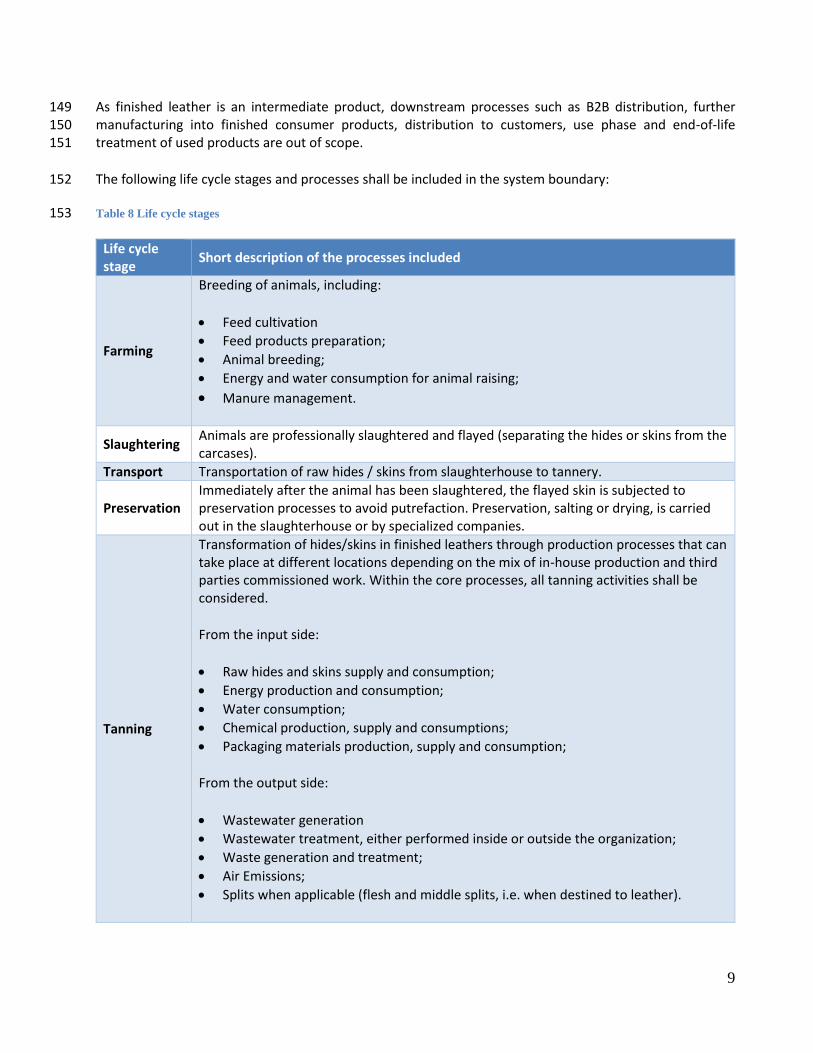
The following life cycle stages and processes shall be included in the system boundary: 152
Table 8 Life cycle stages 153
Life cycle stage
Short description of the processes included
Farming
Breeding of animals, including:
Feed cultivation
Feed products preparation;
Animal breeding;
Energy and water consumption for animal raising;
Manure management.
Slaughtering Animals are professionally slaughtered and flayed (separating the hides or skins from the carcases).
Transport Transportation of raw hides / skins from slaughterhouse to tannery.
Preservation Immediately after the animal has been slaughtered, the flayed skin is subjected to preservation processes to avoid putrefaction. Preservation, salting or drying, is carried out in the slaughterhouse or by specialized companies.
Tanning
Transformation of hides/skins in finished leathers through production processes that can take place at different locations depending on the mix of in-house production and third parties commissioned work. Within the core processes, all tanning activities shall be considered.
From the input side:
Raw hides and skins supply and consumption;
Energy production and consumption;
Water consumption;
Chemical production, supply and consumptions;
Packaging materials production, supply and consumption;
From the output side:
Wastewater generation
Wastewater treatment, either performed inside or outside the organization;
Waste generation and treatment;
Air Emissions;
Splits when applicable (flesh and middle splits, i.e. when destined to leather).
10
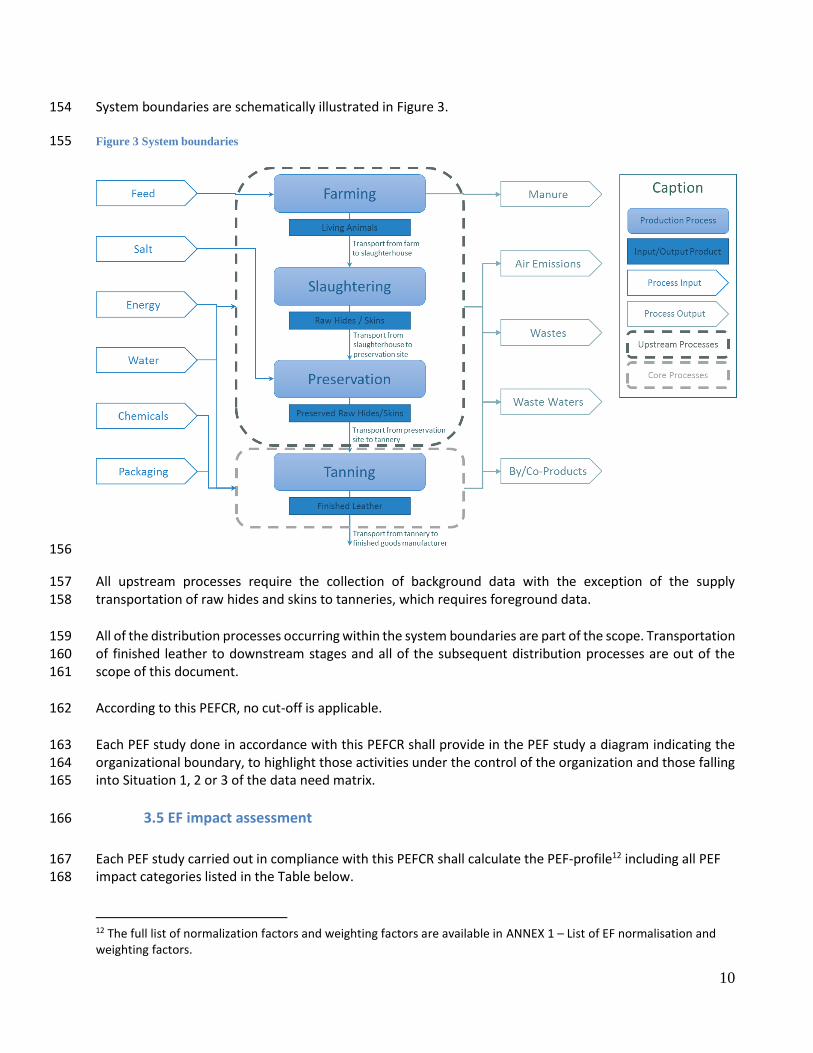
System boundaries are schematically illustrated in Figure 3. 154
Figure 3 System boundaries 155
156
All upstream processes require the collection of background data with the exception of the supply 157 transportation of raw hides and skins to tanneries, which requires foreground data. 158
All of the distribution processes occurring within the system boundaries are part of the scope. Transportation 159 of finished leather to downstream stages and all of the subsequent distribution processes are out of the 160 scope of this document. 161
According to this PEFCR, no cut-off is applicable. 162
Each PEF study done in accordance with this PEFCR shall provide in the PEF study a diagram indicating the 163 organizational boundary, to highlight those activities under the control of the organization and those falling 164 into Situation 1, 2 or 3 of the data need matrix. 165
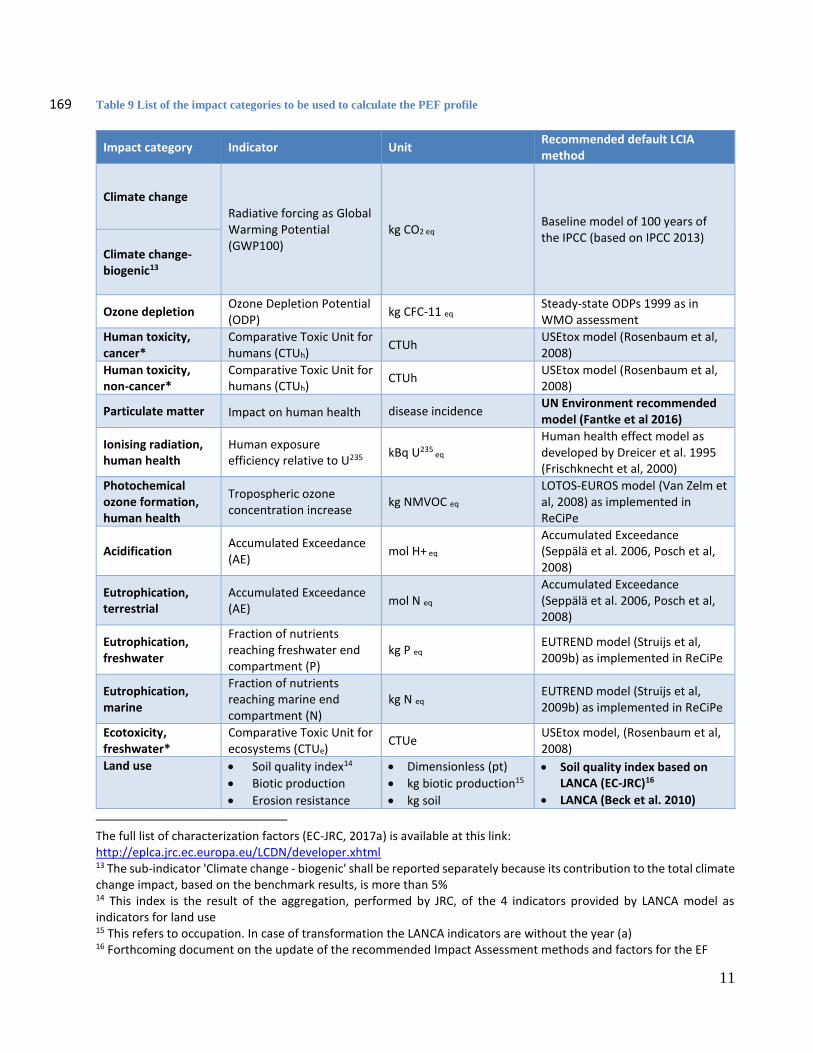
3.5 EF impact assessment 166
Each PEF study carried out in compliance with this PEFCR shall calculate the PEF-profile12 including all PEF 167 impact categories listed in the Table below. 168
12 The full list of normalization factors and weighting factors are available in ANNEX 1 – List of EF normalisation and weighting factors.
11
Table 9 List of the impact categories to be used to calculate the PEF profile 169
Impact category Indicator Unit Recommended default LCIA method
Climate change Radiative forcing as Global Warming Potential (GWP100)
kg CO2 eq Baseline model of 100 years of the IPCC (based on IPCC 2013)
Climate change-biogenic13
Ozone depletion Ozone Depletion Potential (ODP)
kg CFC-11 eq Steady-state ODPs 1999 as in WMO assessment
Human toxicity, cancer*
Comparative Toxic Unit for humans (CTUh)
CTUh USEtox model (Rosenbaum et al, 2008)
Human toxicity, non-cancer*
Comparative Toxic Unit for humans (CTUh)
CTUh USEtox model (Rosenbaum et al, 2008)
Particulate matter Impact on human health disease incidence UN Environment recommended model (Fantke et al 2016)
Ionising radiation, human health
Human exposure efficiency relative to U235
kBq U235 eq
Human health effect model as developed by Dreicer et al. 1995 (Frischknecht et al, 2000)
Photochemical ozone formation, human health
Tropospheric ozone concentration increase
kg NMVOC eq LOTOS-EUROS model (Van Zelm et al, 2008) as implemented in ReCiPe
Acidification Accumulated Exceedance (AE)
mol H+ eq Accumulated Exceedance (Seppälä et al. 2006, Posch et al, 2008)
Eutrophication, terrestrial
Accumulated Exceedance (AE)
mol N eq Accumulated Exceedance (Seppälä et al. 2006, Posch et al, 2008)
Eutrophication, freshwater
Fraction of nutrients reaching freshwater end compartment (P)
kg P eq EUTREND model (Struijs et al, 2009b) as implemented in ReCiPe
Eutrophication, marine
Fraction of nutrients reaching marine end compartment (N)
kg N eq EUTREND model (Struijs et al, 2009b) as implemented in ReCiPe
Ecotoxicity, freshwater*
Comparative Toxic Unit for ecosystems (CTUe)
CTUe USEtox model, (Rosenbaum et al, 2008)
Land use
Soil quality index14
Biotic production
Erosion resistance
Dimensionless (pt)
kg biotic production15
kg soil
Soil quality index based on LANCA (EC-JRC)16
LANCA (Beck et al. 2010)
The full list of characterization factors (EC-JRC, 2017a) is available at this link: http://eplca.jrc.ec.europa.eu/LCDN/developer.xhtml 13 The sub-indicator 'Climate change - biogenic' shall be reported separately because its contribution to the total climate change impact, based on the benchmark results, is more than 5% 14 This index is the result of the aggregation, performed by JRC, of the 4 indicators provided by LANCA model as indicators for land use 15 This refers to occupation. In case of transformation the LANCA indicators are without the year (a) 16 Forthcoming document on the update of the recommended Impact Assessment methods and factors for the EF
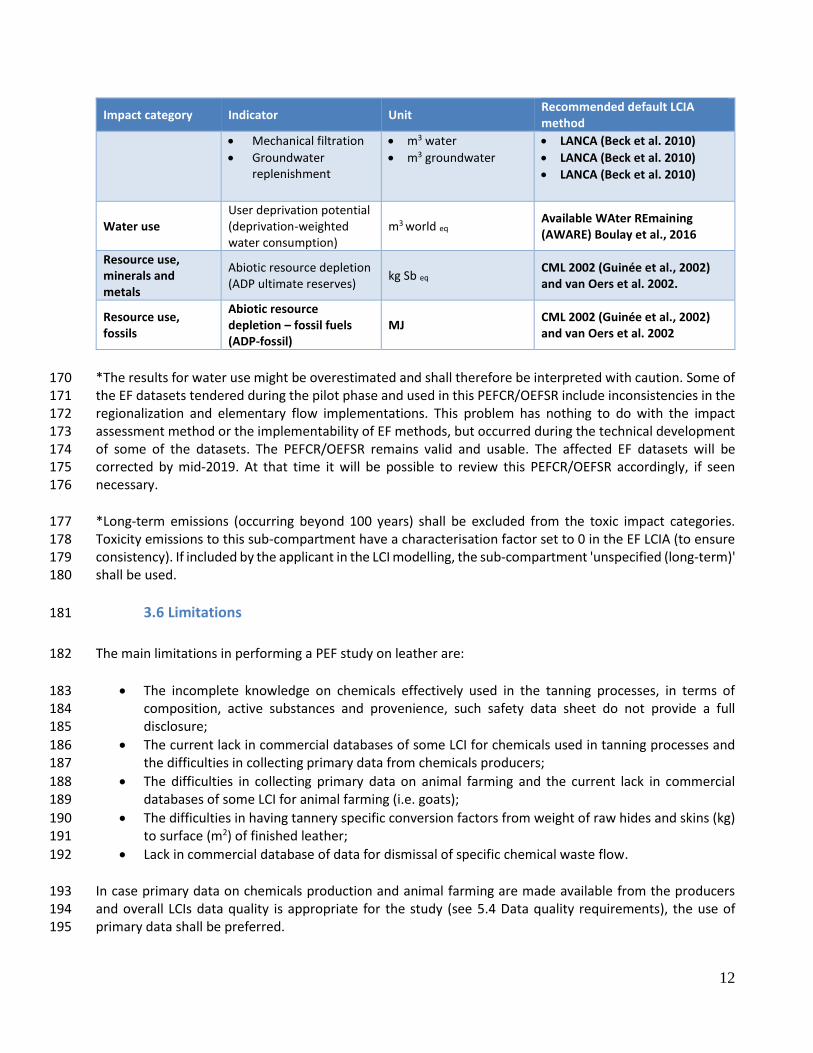
12
Impact category Indicator Unit Recommended default LCIA method
Mechanical filtration
Groundwater replenishment
m3 water
m3 groundwater
LANCA (Beck et al. 2010)
LANCA (Beck et al. 2010)
LANCA (Beck et al. 2010)
Water use User deprivation potential (deprivation-weighted water consumption)
m3 world eq Available WAter REmaining (AWARE) Boulay et al., 2016
Resource use, minerals and metals
Abiotic resource depletion (ADP ultimate reserves)
kg Sb eq CML 2002 (Guinée et al., 2002) and van Oers et al. 2002.
Resource use, fossils
Abiotic resource depletion – fossil fuels (ADP-fossil)
MJ CML 2002 (Guinée et al., 2002) and van Oers et al. 2002
*The results for water use might be overestimated and shall therefore be interpreted with caution. Some of 170 the EF datasets tendered during the pilot phase and used in this PEFCR/OEFSR include inconsistencies in the 171 regionalization and elementary flow implementations. This problem has nothing to do with the impact 172 assessment method or the implementability of EF methods, but occurred during the technical development 173 of some of the datasets. The PEFCR/OEFSR remains valid and usable. The affected EF datasets will be 174 corrected by mid-2019. At that time it will be possible to review this PEFCR/OEFSR accordingly, if seen 175 necessary. 176
*Long-term emissions (occurring beyond 100 years) shall be excluded from the toxic impact categories. 177 Toxicity emissions to this sub-compartment have a characterisation factor set to 0 in the EF LCIA (to ensure 178 consistency). If included by the applicant in the LCI modelling, the sub-compartment 'unspecified (long-term)' 179 shall be used. 180
3.6 Limitations 181
The main limitations in performing a PEF study on leather are: 182
The incomplete knowledge on chemicals effectively used in the tanning processes, in terms of 183 composition, active substances and provenience, such safety data sheet do not provide a full 184 disclosure; 185
The current lack in commercial databases of some LCI for chemicals used in tanning processes and 186 the difficulties in collecting primary data from chemicals producers; 187
The difficulties in collecting primary data on animal farming and the current lack in commercial 188 databases of some LCI for animal farming (i.e. goats); 189
The difficulties in having tannery specific conversion factors from weight of raw hides and skins (kg) 190 to surface (m2) of finished leather; 191
Lack in commercial database of data for dismissal of specific chemical waste flow. 192
In case primary data on chemicals production and animal farming are made available from the producers 193 and overall LCIs data quality is appropriate for the study (see 5.4 Data quality requirements), the use of 194 primary data shall be preferred. 195
13
In case primary specific conversion factor from weight of raw hides and skins (kg) to surface (m2) of finished 196 leather are available, their use should be preferred and clearly reported in the PEF report. 197
In case primary data are not available, assumptions to be made to overcome these known limitations are 198 reported in ANNEX 7 – Default values. 199
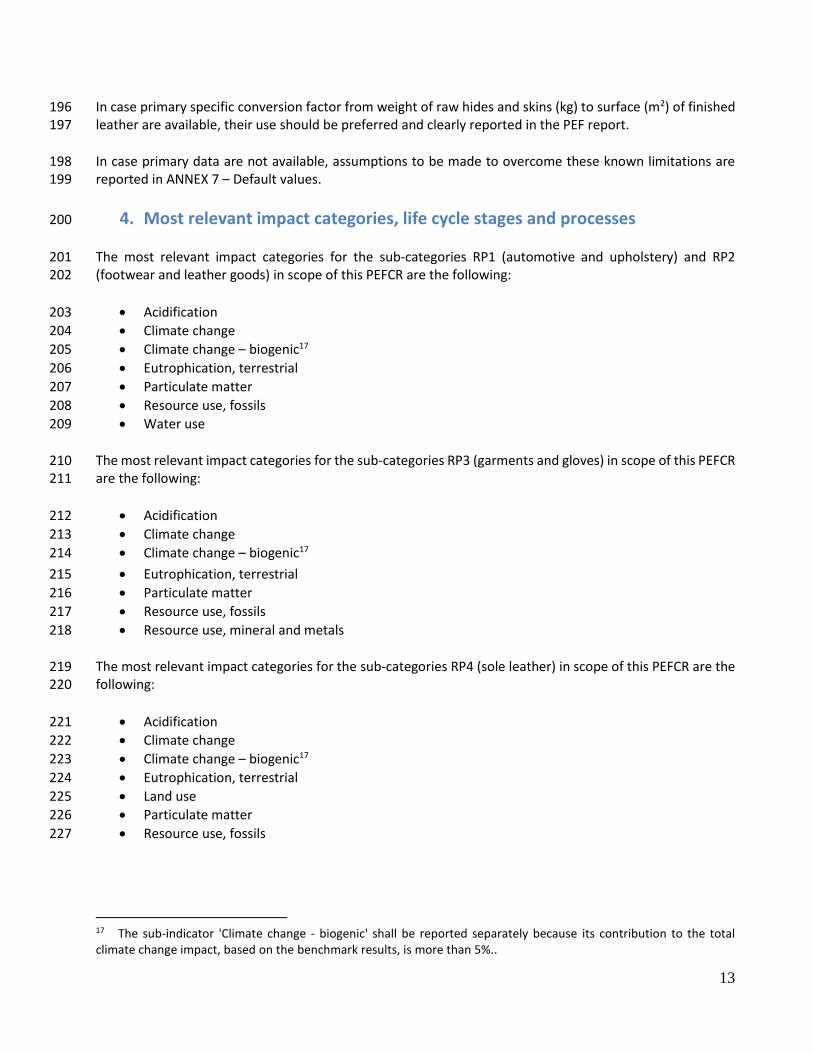
4. Most relevant impact categories, life cycle stages and processes 200
The most relevant impact categories for the sub-categories RP1 (automotive and upholstery) and RP2 201 (footwear and leather goods) in scope of this PEFCR are the following: 202
Acidification 203
Climate change 204
Climate change – biogenic17 205
Eutrophication, terrestrial 206
Particulate matter 207
Resource use, fossils 208
Water use 209
The most relevant impact categories for the sub-categories RP3 (garments and gloves) in scope of this PEFCR 210 are the following: 211
Acidification 212
Climate change 213
Climate change – biogenic17 214
Eutrophication, terrestrial 215
Particulate matter 216
Resource use, fossils 217
Resource use, mineral and metals 218
The most relevant impact categories for the sub-categories RP4 (sole leather) in scope of this PEFCR are the 219 following: 220
Acidification 221
Climate change 222
Climate change – biogenic17 223
Eutrophication, terrestrial 224
Land use 225
Particulate matter 226
Resource use, fossils 227
17 The sub-indicator 'Climate change - biogenic' shall be reported separately because its contribution to the total climate change impact, based on the benchmark results, is more than 5%..
14
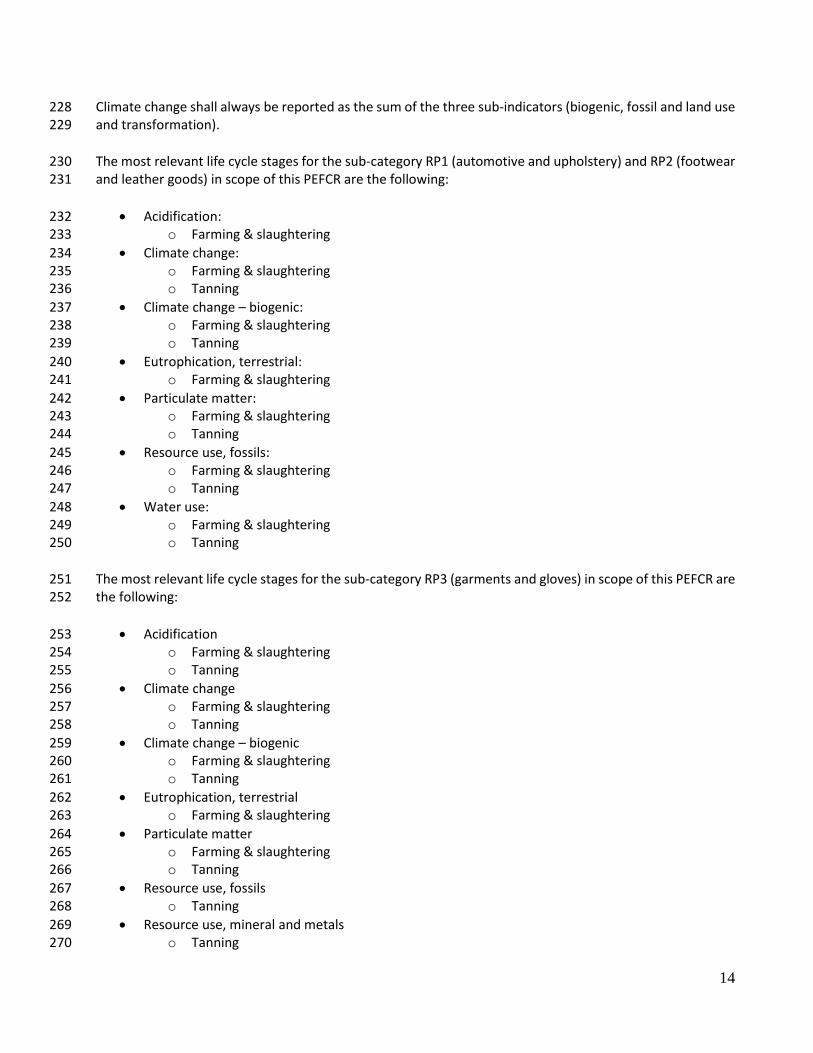
Climate change shall always be reported as the sum of the three sub-indicators (biogenic, fossil and land use 228 and transformation). 229
The most relevant life cycle stages for the sub-category RP1 (automotive and upholstery) and RP2 (footwear 230 and leather goods) in scope of this PEFCR are the following: 231
Acidification: 232 o Farming & slaughtering 233
Climate change: 234 o Farming & slaughtering 235 o Tanning 236
Climate change – biogenic: 237 o Farming & slaughtering 238 o Tanning 239
Eutrophication, terrestrial: 240 o Farming & slaughtering 241
Particulate matter: 242 o Farming & slaughtering 243 o Tanning 244
Resource use, fossils: 245 o Farming & slaughtering 246 o Tanning 247
Water use: 248 o Farming & slaughtering 249 o Tanning 250
The most relevant life cycle stages for the sub-category RP3 (garments and gloves) in scope of this PEFCR are 251 the following: 252
Acidification 253 o Farming & slaughtering 254 o Tanning 255
Climate change 256 o Farming & slaughtering 257 o Tanning 258
Climate change – biogenic 259 o Farming & slaughtering 260 o Tanning 261
Eutrophication, terrestrial 262 o Farming & slaughtering 263
Particulate matter 264 o Farming & slaughtering 265 o Tanning 266
Resource use, fossils 267 o Tanning 268
Resource use, mineral and metals 269 o Tanning 270
15
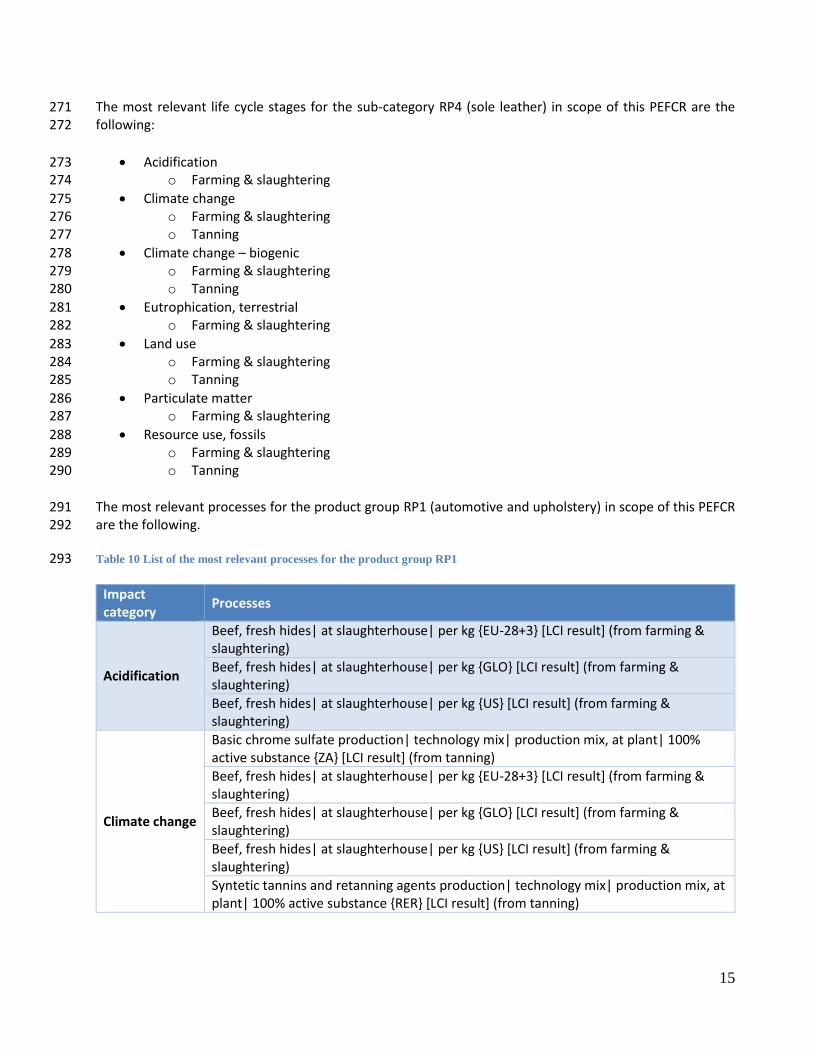
The most relevant life cycle stages for the sub-category RP4 (sole leather) in scope of this PEFCR are the 271 following: 272
Acidification 273 o Farming & slaughtering 274
Climate change 275 o Farming & slaughtering 276 o Tanning 277
Climate change – biogenic 278 o Farming & slaughtering 279 o Tanning 280
Eutrophication, terrestrial 281 o Farming & slaughtering 282
Land use 283 o Farming & slaughtering 284 o Tanning 285
Particulate matter 286 o Farming & slaughtering 287
Resource use, fossils 288 o Farming & slaughtering 289 o Tanning 290
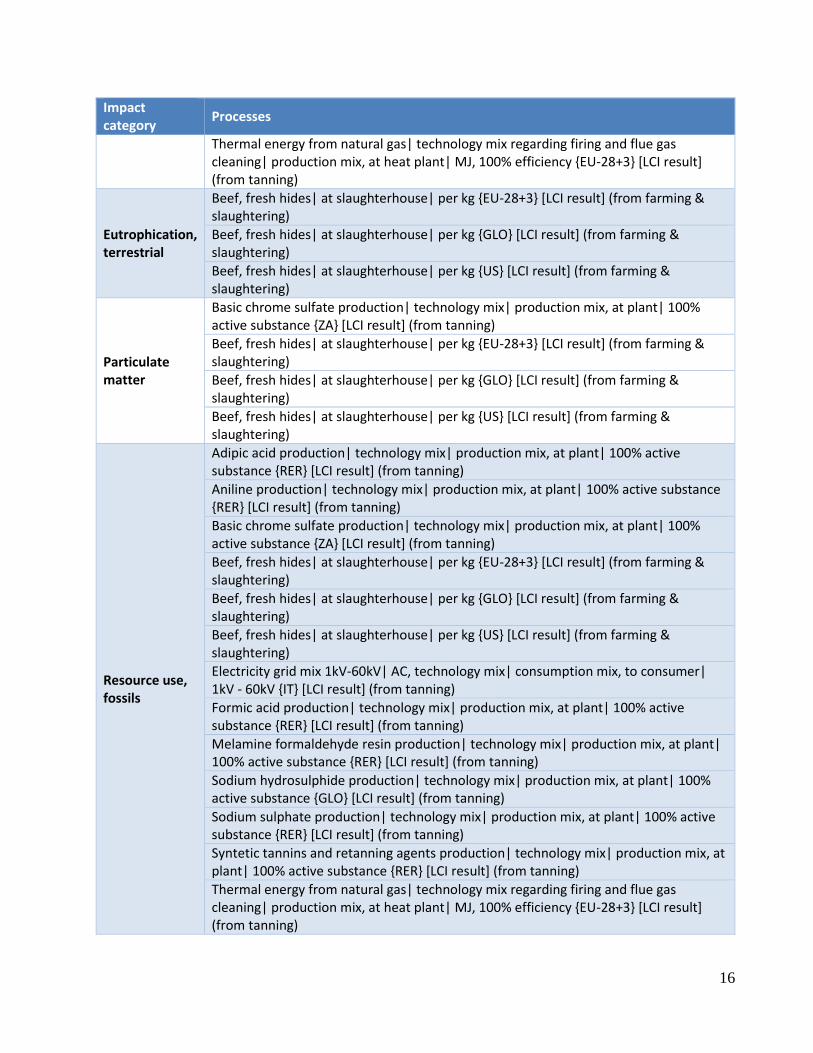
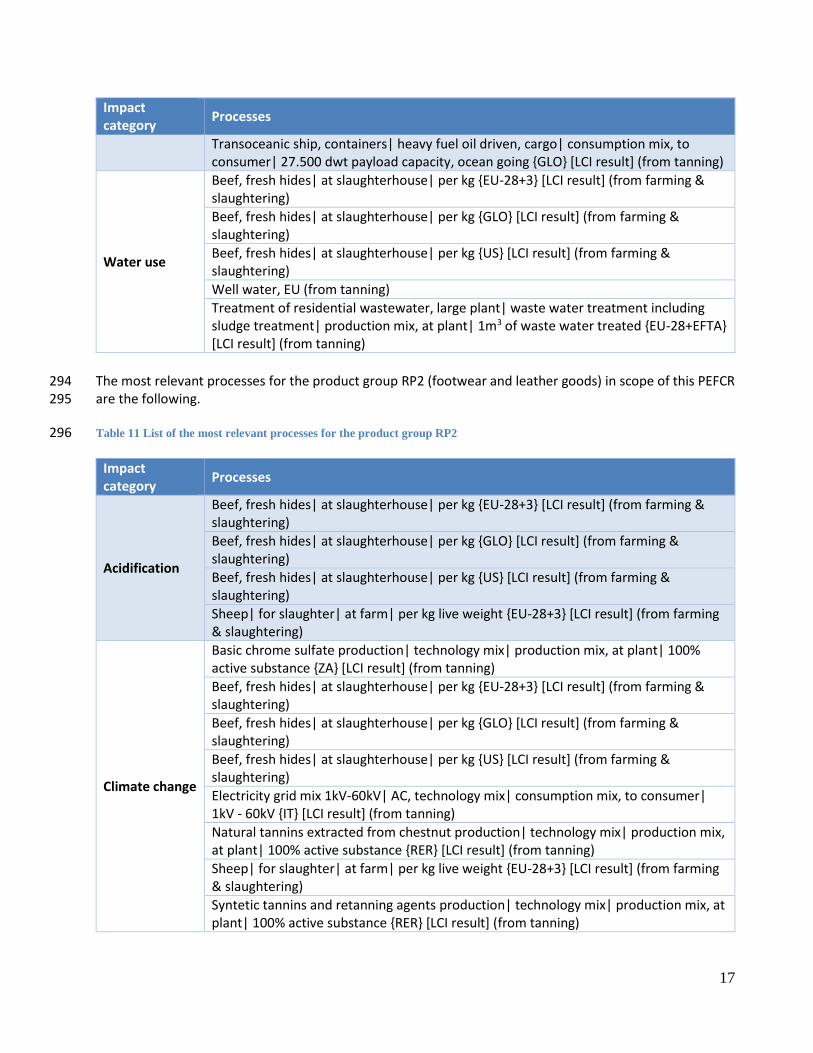
The most relevant processes for the product group RP1 (automotive and upholstery) in scope of this PEFCR 291 are the following. 292
Table 10 List of the most relevant processes for the product group RP1 293
Impact category
Processes
Acidification
Beef, fresh hides| at slaughterhouse| per kg {EU-28+3} [LCI result] (from farming & slaughtering)
Beef, fresh hides| at slaughterhouse| per kg {GLO} [LCI result] (from farming & slaughtering)
Beef, fresh hides| at slaughterhouse| per kg {US} [LCI result] (from farming & slaughtering)
Climate change
Basic chrome sulfate production| technology mix| production mix, at plant| 100% active substance {ZA} [LCI result] (from tanning)
Beef, fresh hides| at slaughterhouse| per kg {EU-28+3} [LCI result] (from farming & slaughtering)
Beef, fresh hides| at slaughterhouse| per kg {GLO} [LCI result] (from farming & slaughtering)
Beef, fresh hides| at slaughterhouse| per kg {US} [LCI result] (from farming & slaughtering)
Syntetic tannins and retanning agents production| technology mix| production mix, at plant| 100% active substance {RER} [LCI result] (from tanning)
16
Impact category
Processes
Thermal energy from natural gas| technology mix regarding firing and flue gas cleaning| production mix, at heat plant| MJ, 100% efficiency {EU-28+3} [LCI result] (from tanning)
Eutrophication, terrestrial
Beef, fresh hides| at slaughterhouse| per kg {EU-28+3} [LCI result] (from farming & slaughtering)
Beef, fresh hides| at slaughterhouse| per kg {GLO} [LCI result] (from farming & slaughtering)
Beef, fresh hides| at slaughterhouse| per kg {US} [LCI result] (from farming & slaughtering)
Particulate matter
Basic chrome sulfate production| technology mix| production mix, at plant| 100% active substance {ZA} [LCI result] (from tanning)
Beef, fresh hides| at slaughterhouse| per kg {EU-28+3} [LCI result] (from farming & slaughtering)
Beef, fresh hides| at slaughterhouse| per kg {GLO} [LCI result] (from farming & slaughtering)
Beef, fresh hides| at slaughterhouse| per kg {US} [LCI result] (from farming & slaughtering)
Resource use, fossils
Adipic acid production| technology mix| production mix, at plant| 100% active substance {RER} [LCI result] (from tanning)
Aniline production| technology mix| production mix, at plant| 100% active substance {RER} [LCI result] (from tanning)
Basic chrome sulfate production| technology mix| production mix, at plant| 100% active substance {ZA} [LCI result] (from tanning)
Beef, fresh hides| at slaughterhouse| per kg {EU-28+3} [LCI result] (from farming & slaughtering)
Beef, fresh hides| at slaughterhouse| per kg {GLO} [LCI result] (from farming & slaughtering)
Beef, fresh hides| at slaughterhouse| per kg {US} [LCI result] (from farming & slaughtering)
Electricity grid mix 1kV-60kV| AC, technology mix| consumption mix, to consumer| 1kV - 60kV {IT} [LCI result] (from tanning)
Formic acid production| technology mix| production mix, at plant| 100% active substance {RER} [LCI result] (from tanning)
Melamine formaldehyde resin production| technology mix| production mix, at plant| 100% active substance {RER} [LCI result] (from tanning)
Sodium hydrosulphide production| technology mix| production mix, at plant| 100% active substance {GLO} [LCI result] (from tanning)
Sodium sulphate production| technology mix| production mix, at plant| 100% active substance {RER} [LCI result] (from tanning)
Syntetic tannins and retanning agents production| technology mix| production mix, at plant| 100% active substance {RER} [LCI result] (from tanning)
Thermal energy from natural gas| technology mix regarding firing and flue gas cleaning| production mix, at heat plant| MJ, 100% efficiency {EU-28+3} [LCI result] (from tanning)
17
Impact category
Processes
Transoceanic ship, containers| heavy fuel oil driven, cargo| consumption mix, to consumer| 27.500 dwt payload capacity, ocean going {GLO} [LCI result] (from tanning)
Water use
Beef, fresh hides| at slaughterhouse| per kg {EU-28+3} [LCI result] (from farming & slaughtering)
Beef, fresh hides| at slaughterhouse| per kg {GLO} [LCI result] (from farming & slaughtering)
Beef, fresh hides| at slaughterhouse| per kg {US} [LCI result] (from farming & slaughtering)
Well water, EU (from tanning)
Treatment of residential wastewater, large plant| waste water treatment including sludge treatment| production mix, at plant| 1m3 of waste water treated {EU-28+EFTA} [LCI result] (from tanning)
The most relevant processes for the product group RP2 (footwear and leather goods) in scope of this PEFCR 294 are the following. 295
Table 11 List of the most relevant processes for the product group RP2 296
Impact category
Processes
Acidification
Beef, fresh hides| at slaughterhouse| per kg {EU-28+3} [LCI result] (from farming & slaughtering)
Beef, fresh hides| at slaughterhouse| per kg {GLO} [LCI result] (from farming & slaughtering)
Beef, fresh hides| at slaughterhouse| per kg {US} [LCI result] (from farming & slaughtering)
Sheep| for slaughter| at farm| per kg live weight {EU-28+3} [LCI result] (from farming & slaughtering)
Climate change
Basic chrome sulfate production| technology mix| production mix, at plant| 100% active substance {ZA} [LCI result] (from tanning)
Beef, fresh hides| at slaughterhouse| per kg {EU-28+3} [LCI result] (from farming & slaughtering)
Beef, fresh hides| at slaughterhouse| per kg {GLO} [LCI result] (from farming & slaughtering)
Beef, fresh hides| at slaughterhouse| per kg {US} [LCI result] (from farming & slaughtering)
Electricity grid mix 1kV-60kV| AC, technology mix| consumption mix, to consumer| 1kV - 60kV {IT} [LCI result] (from tanning)
Natural tannins extracted from chestnut production| technology mix| production mix, at plant| 100% active substance {RER} [LCI result] (from tanning)
Sheep| for slaughter| at farm| per kg live weight {EU-28+3} [LCI result] (from farming & slaughtering)
Syntetic tannins and retanning agents production| technology mix| production mix, at plant| 100% active substance {RER} [LCI result] (from tanning)
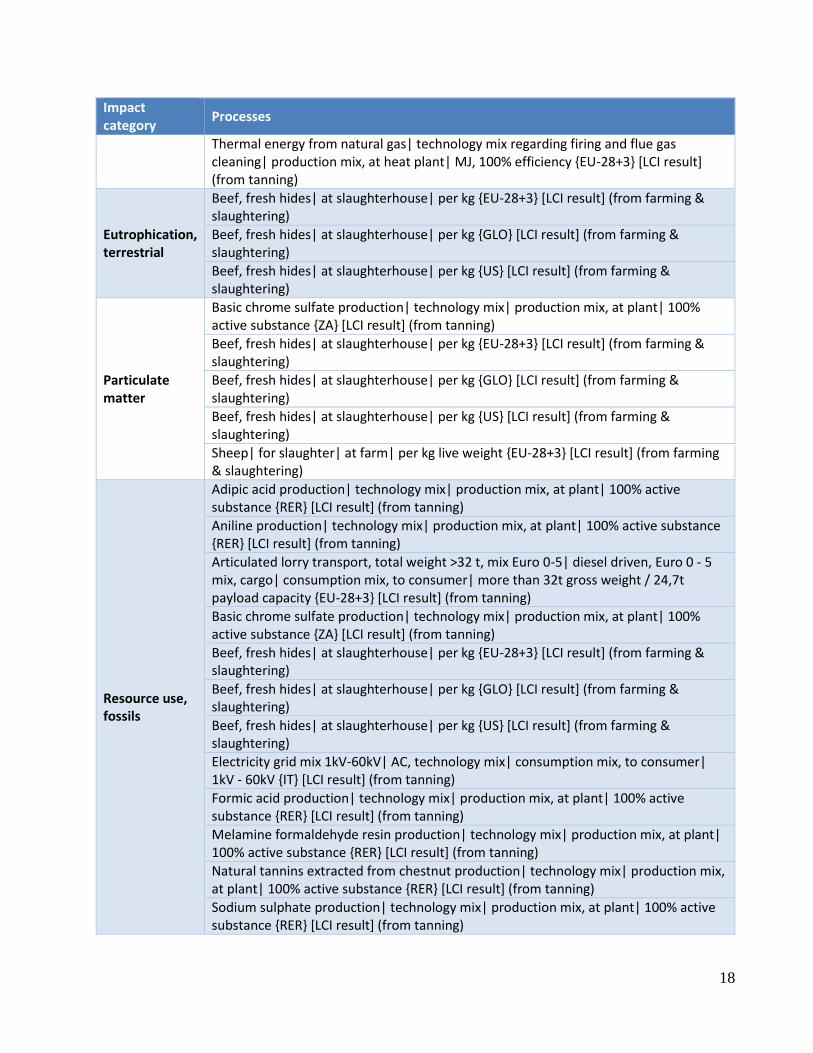
18
Impact category
Processes
Thermal energy from natural gas| technology mix regarding firing and flue gas cleaning| production mix, at heat plant| MJ, 100% efficiency {EU-28+3} [LCI result] (from tanning)
Eutrophication, terrestrial
Beef, fresh hides| at slaughterhouse| per kg {EU-28+3} [LCI result] (from farming & slaughtering)
Beef, fresh hides| at slaughterhouse| per kg {GLO} [LCI result] (from farming & slaughtering)
Beef, fresh hides| at slaughterhouse| per kg {US} [LCI result] (from farming & slaughtering)
Particulate matter
Basic chrome sulfate production| technology mix| production mix, at plant| 100% active substance {ZA} [LCI result] (from tanning)
Beef, fresh hides| at slaughterhouse| per kg {EU-28+3} [LCI result] (from farming & slaughtering)
Beef, fresh hides| at slaughterhouse| per kg {GLO} [LCI result] (from farming & slaughtering)
Beef, fresh hides| at slaughterhouse| per kg {US} [LCI result] (from farming & slaughtering)
Sheep| for slaughter| at farm| per kg live weight {EU-28+3} [LCI result] (from farming & slaughtering)
Resource use, fossils
Adipic acid production| technology mix| production mix, at plant| 100% active substance {RER} [LCI result] (from tanning)
Aniline production| technology mix| production mix, at plant| 100% active substance {RER} [LCI result] (from tanning)
Articulated lorry transport, total weight >32 t, mix Euro 0-5| diesel driven, Euro 0 - 5 mix, cargo| consumption mix, to consumer| more than 32t gross weight / 24,7t payload capacity {EU-28+3} [LCI result] (from tanning)
Basic chrome sulfate production| technology mix| production mix, at plant| 100% active substance {ZA} [LCI result] (from tanning)
Beef, fresh hides| at slaughterhouse| per kg {EU-28+3} [LCI result] (from farming & slaughtering)
Beef, fresh hides| at slaughterhouse| per kg {GLO} [LCI result] (from farming & slaughtering)
Beef, fresh hides| at slaughterhouse| per kg {US} [LCI result] (from farming & slaughtering)
Electricity grid mix 1kV-60kV| AC, technology mix| consumption mix, to consumer| 1kV - 60kV {IT} [LCI result] (from tanning)
Formic acid production| technology mix| production mix, at plant| 100% active substance {RER} [LCI result] (from tanning)
Melamine formaldehyde resin production| technology mix| production mix, at plant| 100% active substance {RER} [LCI result] (from tanning)
Natural tannins extracted from chestnut production| technology mix| production mix, at plant| 100% active substance {RER} [LCI result] (from tanning)
Sodium sulphate production| technology mix| production mix, at plant| 100% active substance {RER} [LCI result] (from tanning)
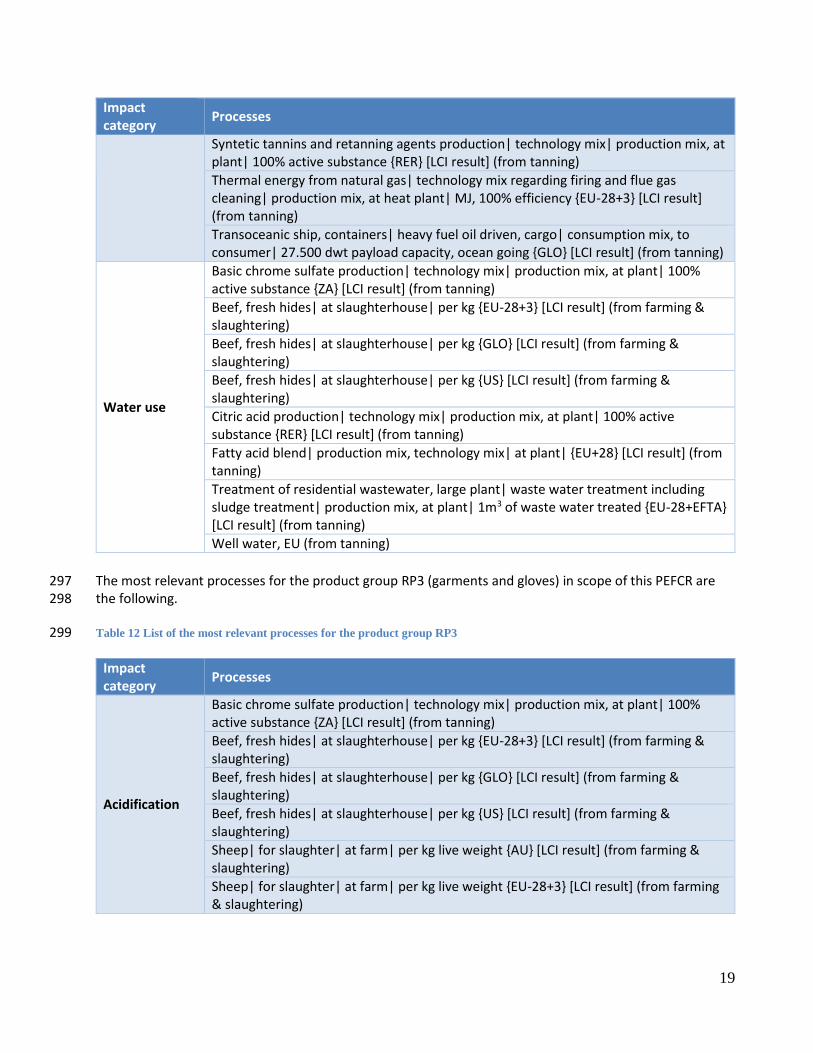
19
Impact category
Processes
Syntetic tannins and retanning agents production| technology mix| production mix, at plant| 100% active substance {RER} [LCI result] (from tanning)
Thermal energy from natural gas| technology mix regarding firing and flue gas cleaning| production mix, at heat plant| MJ, 100% efficiency {EU-28+3} [LCI result] (from tanning)
Transoceanic ship, containers| heavy fuel oil driven, cargo| consumption mix, to consumer| 27.500 dwt payload capacity, ocean going {GLO} [LCI result] (from tanning)
Water use
Basic chrome sulfate production| technology mix| production mix, at plant| 100% active substance {ZA} [LCI result] (from tanning)
Beef, fresh hides| at slaughterhouse| per kg {EU-28+3} [LCI result] (from farming & slaughtering)
Beef, fresh hides| at slaughterhouse| per kg {GLO} [LCI result] (from farming & slaughtering)
Beef, fresh hides| at slaughterhouse| per kg {US} [LCI result] (from farming & slaughtering)
Citric acid production| technology mix| production mix, at plant| 100% active substance {RER} [LCI result] (from tanning)
Fatty acid blend| production mix, technology mix| at plant| {EU+28} [LCI result] (from tanning)
Treatment of residential wastewater, large plant| waste water treatment including sludge treatment| production mix, at plant| 1m3 of waste water treated {EU-28+EFTA} [LCI result] (from tanning)
Well water, EU (from tanning)
The most relevant processes for the product group RP3 (garments and gloves) in scope of this PEFCR are 297 the following. 298
Table 12 List of the most relevant processes for the product group RP3 299
Impact category
Processes
Acidification
Basic chrome sulfate production| technology mix| production mix, at plant| 100% active substance {ZA} [LCI result] (from tanning)
Beef, fresh hides| at slaughterhouse| per kg {EU-28+3} [LCI result] (from farming & slaughtering)
Beef, fresh hides| at slaughterhouse| per kg {GLO} [LCI result] (from farming & slaughtering)
Beef, fresh hides| at slaughterhouse| per kg {US} [LCI result] (from farming & slaughtering)
Sheep| for slaughter| at farm| per kg live weight {AU} [LCI result] (from farming & slaughtering)
Sheep| for slaughter| at farm| per kg live weight {EU-28+3} [LCI result] (from farming & slaughtering)
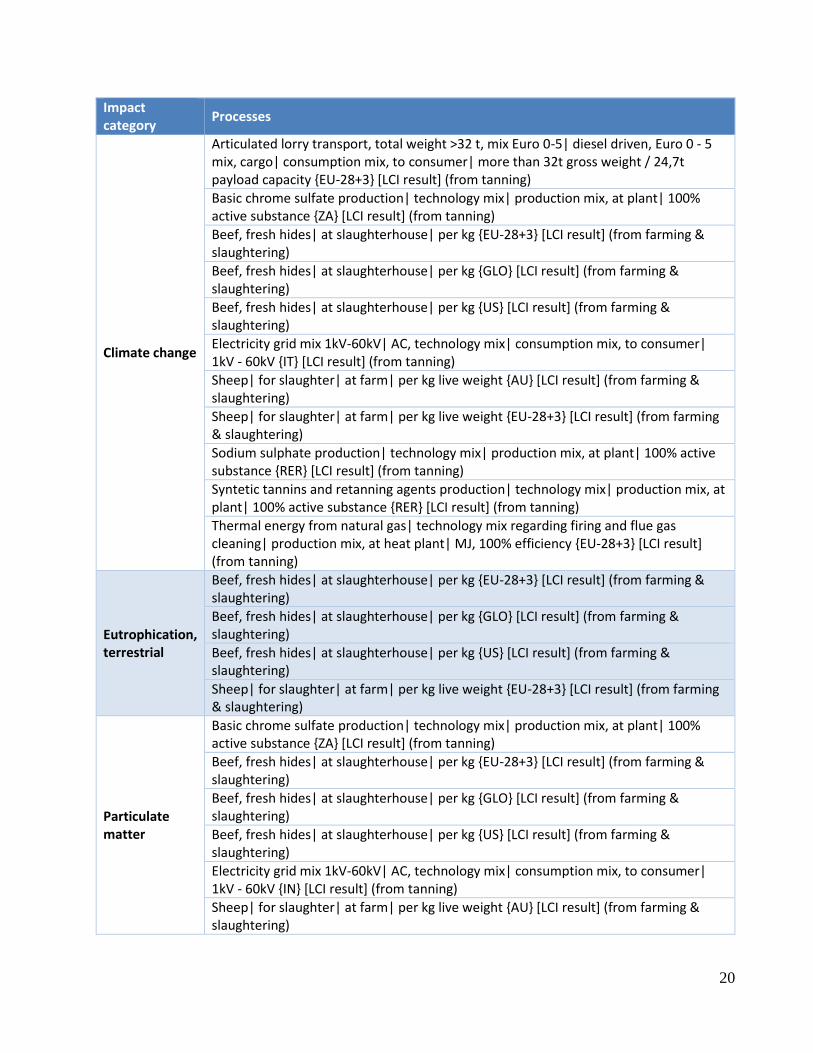
20
Impact category
Processes
Climate change
Articulated lorry transport, total weight >32 t, mix Euro 0-5| diesel driven, Euro 0 - 5 mix, cargo| consumption mix, to consumer| more than 32t gross weight / 24,7t payload capacity {EU-28+3} [LCI result] (from tanning)
Basic chrome sulfate production| technology mix| production mix, at plant| 100% active substance {ZA} [LCI result] (from tanning)
Beef, fresh hides| at slaughterhouse| per kg {EU-28+3} [LCI result] (from farming & slaughtering)
Beef, fresh hides| at slaughterhouse| per kg {GLO} [LCI result] (from farming & slaughtering)
Beef, fresh hides| at slaughterhouse| per kg {US} [LCI result] (from farming & slaughtering)
Electricity grid mix 1kV-60kV| AC, technology mix| consumption mix, to consumer| 1kV - 60kV {IT} [LCI result] (from tanning)
Sheep| for slaughter| at farm| per kg live weight {AU} [LCI result] (from farming & slaughtering)
Sheep| for slaughter| at farm| per kg live weight {EU-28+3} [LCI result] (from farming & slaughtering)
Sodium sulphate production| technology mix| production mix, at plant| 100% active substance {RER} [LCI result] (from tanning)
Syntetic tannins and retanning agents production| technology mix| production mix, at plant| 100% active substance {RER} [LCI result] (from tanning)
Thermal energy from natural gas| technology mix regarding firing and flue gas cleaning| production mix, at heat plant| MJ, 100% efficiency {EU-28+3} [LCI result] (from tanning)
Eutrophication, terrestrial
Beef, fresh hides| at slaughterhouse| per kg {EU-28+3} [LCI result] (from farming & slaughtering)
Beef, fresh hides| at slaughterhouse| per kg {GLO} [LCI result] (from farming & slaughtering)
Beef, fresh hides| at slaughterhouse| per kg {US} [LCI result] (from farming & slaughtering)
Sheep| for slaughter| at farm| per kg live weight {EU-28+3} [LCI result] (from farming & slaughtering)
Particulate matter
Basic chrome sulfate production| technology mix| production mix, at plant| 100% active substance {ZA} [LCI result] (from tanning)
Beef, fresh hides| at slaughterhouse| per kg {EU-28+3} [LCI result] (from farming & slaughtering)
Beef, fresh hides| at slaughterhouse| per kg {GLO} [LCI result] (from farming & slaughtering)
Beef, fresh hides| at slaughterhouse| per kg {US} [LCI result] (from farming & slaughtering)
Electricity grid mix 1kV-60kV| AC, technology mix| consumption mix, to consumer| 1kV - 60kV {IN} [LCI result] (from tanning)
Sheep| for slaughter| at farm| per kg live weight {AU} [LCI result] (from farming & slaughtering)
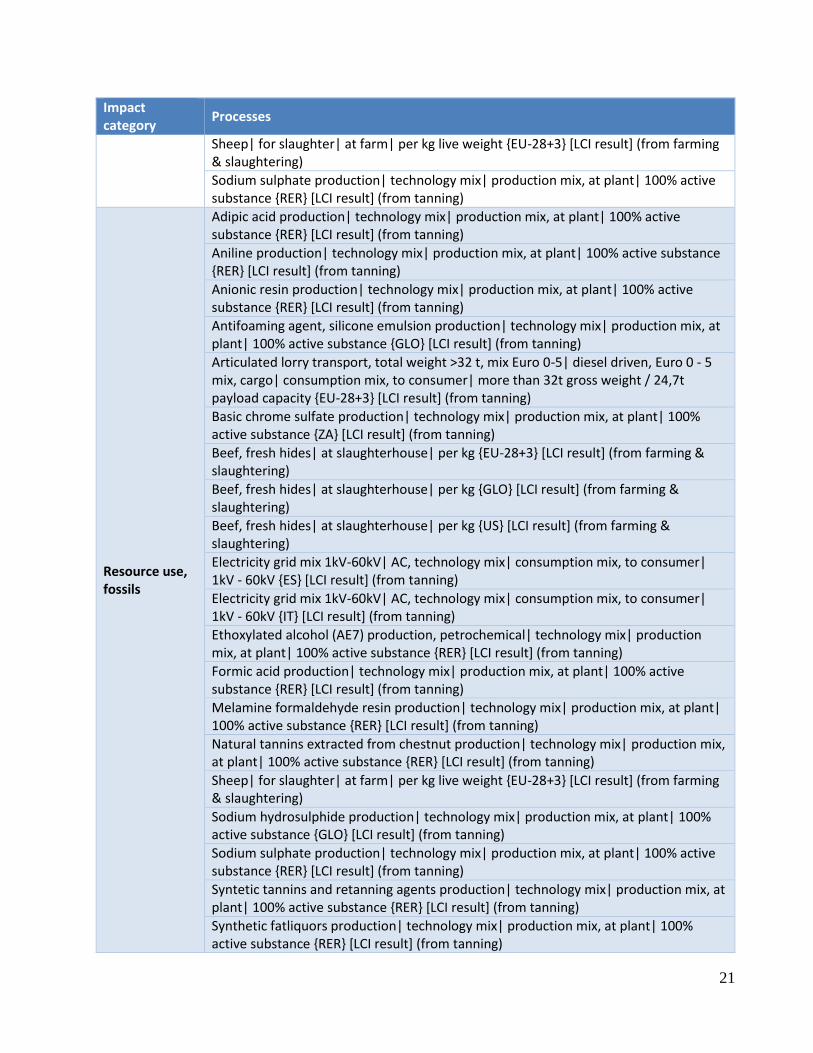
21
Impact category
Processes
Sheep| for slaughter| at farm| per kg live weight {EU-28+3} [LCI result] (from farming & slaughtering)
Sodium sulphate production| technology mix| production mix, at plant| 100% active substance {RER} [LCI result] (from tanning)
Resource use, fossils
Adipic acid production| technology mix| production mix, at plant| 100% active substance {RER} [LCI result] (from tanning)
Aniline production| technology mix| production mix, at plant| 100% active substance {RER} [LCI result] (from tanning)
Anionic resin production| technology mix| production mix, at plant| 100% active substance {RER} [LCI result] (from tanning)
Antifoaming agent, silicone emulsion production| technology mix| production mix, at plant| 100% active substance {GLO} [LCI result] (from tanning)
Articulated lorry transport, total weight >32 t, mix Euro 0-5| diesel driven, Euro 0 - 5 mix, cargo| consumption mix, to consumer| more than 32t gross weight / 24,7t payload capacity {EU-28+3} [LCI result] (from tanning)
Basic chrome sulfate production| technology mix| production mix, at plant| 100% active substance {ZA} [LCI result] (from tanning)
Beef, fresh hides| at slaughterhouse| per kg {EU-28+3} [LCI result] (from farming & slaughtering)
Beef, fresh hides| at slaughterhouse| per kg {GLO} [LCI result] (from farming & slaughtering)
Beef, fresh hides| at slaughterhouse| per kg {US} [LCI result] (from farming & slaughtering)
Electricity grid mix 1kV-60kV| AC, technology mix| consumption mix, to consumer| 1kV - 60kV {ES} [LCI result] (from tanning)
Electricity grid mix 1kV-60kV| AC, technology mix| consumption mix, to consumer| 1kV - 60kV {IT} [LCI result] (from tanning)
Ethoxylated alcohol (AE7) production, petrochemical| technology mix| production mix, at plant| 100% active substance {RER} [LCI result] (from tanning)
Formic acid production| technology mix| production mix, at plant| 100% active substance {RER} [LCI result] (from tanning)
Melamine formaldehyde resin production| technology mix| production mix, at plant| 100% active substance {RER} [LCI result] (from tanning)
Natural tannins extracted from chestnut production| technology mix| production mix, at plant| 100% active substance {RER} [LCI result] (from tanning)
Sheep| for slaughter| at farm| per kg live weight {EU-28+3} [LCI result] (from farming & slaughtering)
Sodium hydrosulphide production| technology mix| production mix, at plant| 100% active substance {GLO} [LCI result] (from tanning)
Sodium sulphate production| technology mix| production mix, at plant| 100% active substance {RER} [LCI result] (from tanning)
Syntetic tannins and retanning agents production| technology mix| production mix, at plant| 100% active substance {RER} [LCI result] (from tanning)
Synthetic fatliquors production| technology mix| production mix, at plant| 100% active substance {RER} [LCI result] (from tanning)
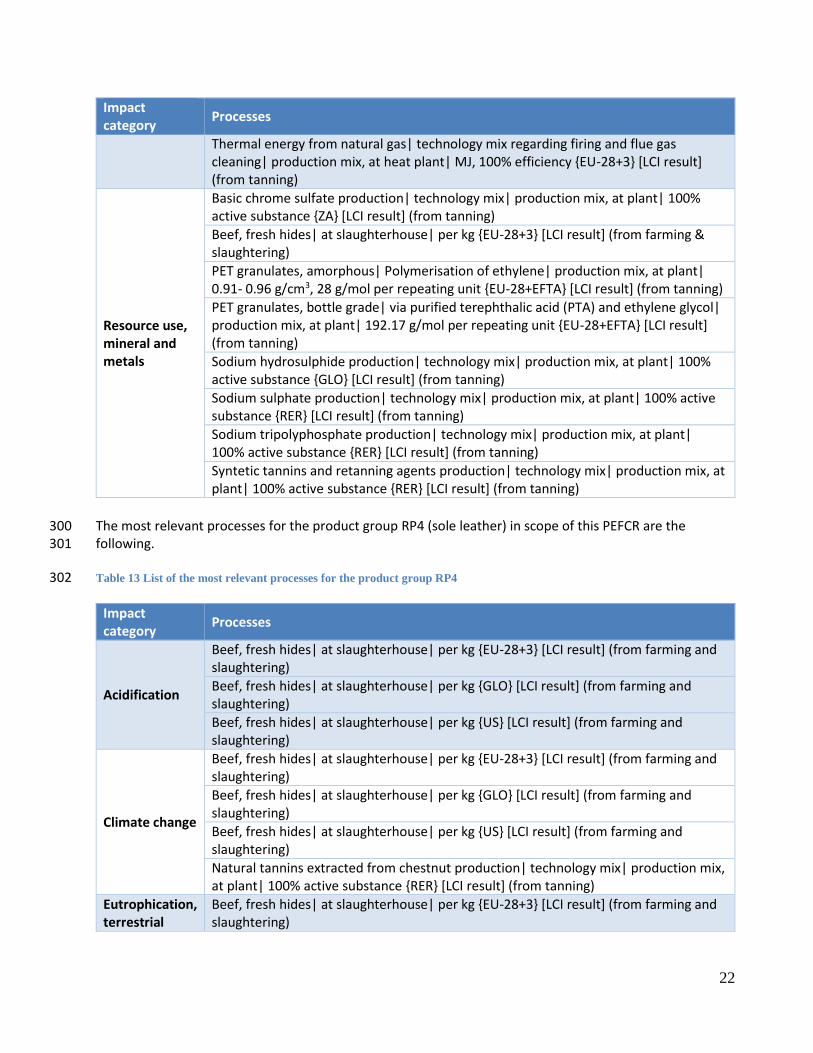
22
Impact category
Processes
Thermal energy from natural gas| technology mix regarding firing and flue gas cleaning| production mix, at heat plant| MJ, 100% efficiency {EU-28+3} [LCI result] (from tanning)
Resource use, mineral and metals
Basic chrome sulfate production| technology mix| production mix, at plant| 100% active substance {ZA} [LCI result] (from tanning)
Beef, fresh hides| at slaughterhouse| per kg {EU-28+3} [LCI result] (from farming & slaughtering)
PET granulates, amorphous| Polymerisation of ethylene| production mix, at plant| 0.91- 0.96 g/cm3, 28 g/mol per repeating unit {EU-28+EFTA} [LCI result] (from tanning)
PET granulates, bottle grade| via purified terephthalic acid (PTA) and ethylene glycol| production mix, at plant| 192.17 g/mol per repeating unit {EU-28+EFTA} [LCI result] (from tanning)
Sodium hydrosulphide production| technology mix| production mix, at plant| 100% active substance {GLO} [LCI result] (from tanning)
Sodium sulphate production| technology mix| production mix, at plant| 100% active substance {RER} [LCI result] (from tanning)
Sodium tripolyphosphate production| technology mix| production mix, at plant| 100% active substance {RER} [LCI result] (from tanning)
Syntetic tannins and retanning agents production| technology mix| production mix, at plant| 100% active substance {RER} [LCI result] (from tanning)
The most relevant processes for the product group RP4 (sole leather) in scope of this PEFCR are the 300 following. 301
Table 13 List of the most relevant processes for the product group RP4 302
Impact category
Processes
Acidification
Beef, fresh hides| at slaughterhouse| per kg {EU-28+3} [LCI result] (from farming and slaughtering)
Beef, fresh hides| at slaughterhouse| per kg {GLO} [LCI result] (from farming and slaughtering)
Beef, fresh hides| at slaughterhouse| per kg {US} [LCI result] (from farming and slaughtering)
Climate change
Beef, fresh hides| at slaughterhouse| per kg {EU-28+3} [LCI result] (from farming and slaughtering)
Beef, fresh hides| at slaughterhouse| per kg {GLO} [LCI result] (from farming and slaughtering)
Beef, fresh hides| at slaughterhouse| per kg {US} [LCI result] (from farming and slaughtering)
Natural tannins extracted from chestnut production| technology mix| production mix, at plant| 100% active substance {RER} [LCI result] (from tanning)
Eutrophication, terrestrial
Beef, fresh hides| at slaughterhouse| per kg {EU-28+3} [LCI result] (from farming and slaughtering)
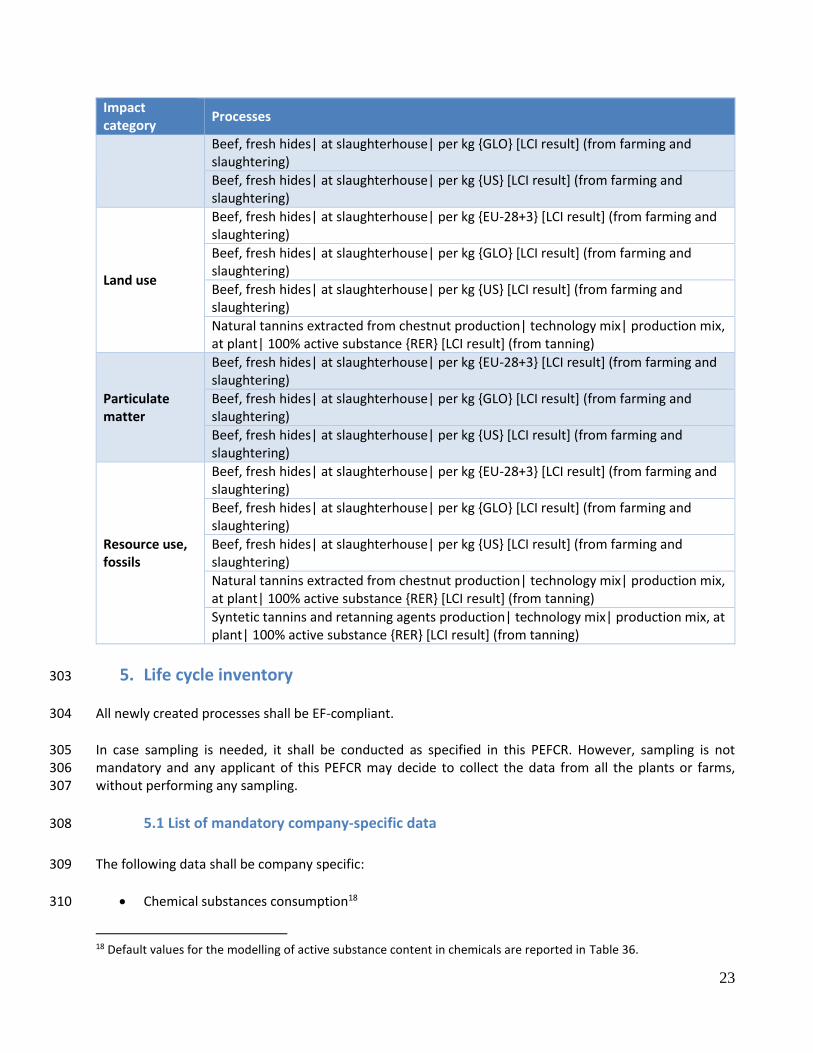
23
Impact category
Processes
Beef, fresh hides| at slaughterhouse| per kg {GLO} [LCI result] (from farming and slaughtering)
Beef, fresh hides| at slaughterhouse| per kg {US} [LCI result] (from farming and slaughtering)
Land use
Beef, fresh hides| at slaughterhouse| per kg {EU-28+3} [LCI result] (from farming and slaughtering)
Beef, fresh hides| at slaughterhouse| per kg {GLO} [LCI result] (from farming and slaughtering)
Beef, fresh hides| at slaughterhouse| per kg {US} [LCI result] (from farming and slaughtering)
Natural tannins extracted from chestnut production| technology mix| production mix, at plant| 100% active substance {RER} [LCI result] (from tanning)
Particulate matter
Beef, fresh hides| at slaughterhouse| per kg {EU-28+3} [LCI result] (from farming and slaughtering)
Beef, fresh hides| at slaughterhouse| per kg {GLO} [LCI result] (from farming and slaughtering)
Beef, fresh hides| at slaughterhouse| per kg {US} [LCI result] (from farming and slaughtering)
Resource use, fossils
Beef, fresh hides| at slaughterhouse| per kg {EU-28+3} [LCI result] (from farming and slaughtering)
Beef, fresh hides| at slaughterhouse| per kg {GLO} [LCI result] (from farming and slaughtering)
Beef, fresh hides| at slaughterhouse| per kg {US} [LCI result] (from farming and slaughtering)
Natural tannins extracted from chestnut production| technology mix| production mix, at plant| 100% active substance {RER} [LCI result] (from tanning)
Syntetic tannins and retanning agents production| technology mix| production mix, at plant| 100% active substance {RER} [LCI result] (from tanning)
5. Life cycle inventory 303
All newly created processes shall be EF-compliant. 304
In case sampling is needed, it shall be conducted as specified in this PEFCR. However, sampling is not 305 mandatory and any applicant of this PEFCR may decide to collect the data from all the plants or farms, 306 without performing any sampling. 307
5.1 List of mandatory company-specific data 308
The following data shall be company specific: 309
Chemical substances consumption18 310
18 Default values for the modelling of active substance content in chemicals are reported in Table 36.
24
Energy consumption 311
Water consumption 312
Packaging consumption 313
Waste treatment 314
Table 14 reports all activity data that shall be company specific, including the complete data quality ratings 315 (DQRs) and the Universally Unique Identifier (UUIDs). For chemical substance consumptions, if a substance 316 is missing in Table 14, the user of this PEFCR shall refer to Table 36 where to find the proxies on which to 317 model them. The user of this PEFCR shall modify, as appropriate and where available, the geographical origin 318 of the reported datasets to make the result of the footprint calculation more accurate. 319
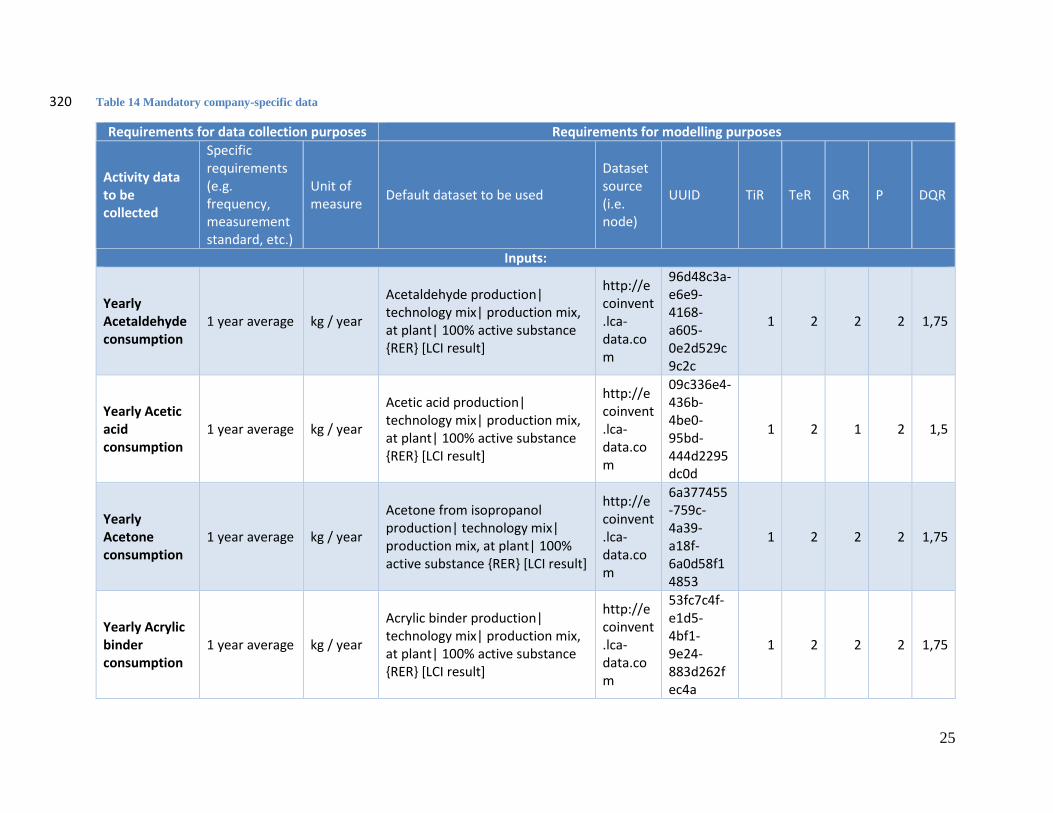
25
Table 14 Mandatory company-specific data 320
Requirements for data collection purposes Requirements for modelling purposes
Activity data to be collected
Specific requirements (e.g. frequency, measurement standard, etc.)
Unit of measure
Default dataset to be used
Dataset source (i.e. node)
UUID TiR TeR GR P DQR
Inputs:
Yearly Acetaldehyde consumption
1 year average kg / year
Acetaldehyde production| technology mix| production mix, at plant| 100% active substance {RER} [LCI result]
http://ecoinvent.lca-data.com
96d48c3a-e6e9-4168-a605-0e2d529c9c2c
1 2 2 2 1,75
Yearly Acetic acid consumption
1 year average kg / year
Acetic acid production| technology mix| production mix, at plant| 100% active substance {RER} [LCI result]
http://ecoinvent.lca-data.com
09c336e4-436b-4be0-95bd-444d2295dc0d
1 2 1 2 1,5
Yearly Acetone consumption
1 year average kg / year
Acetone from isopropanol production| technology mix| production mix, at plant| 100% active substance {RER} [LCI result]
http://ecoinvent.lca-data.com
6a377455-759c-4a39-a18f-6a0d58f14853
1 2 2 2 1,75
Yearly Acrylic binder consumption
1 year average kg / year
Acrylic binder production| technology mix| production mix, at plant| 100% active substance {RER} [LCI result]
http://ecoinvent.lca-data.com
53fc7c4f-e1d5-4bf1-9e24-883d262fec4a
1 2 2 2 1,75
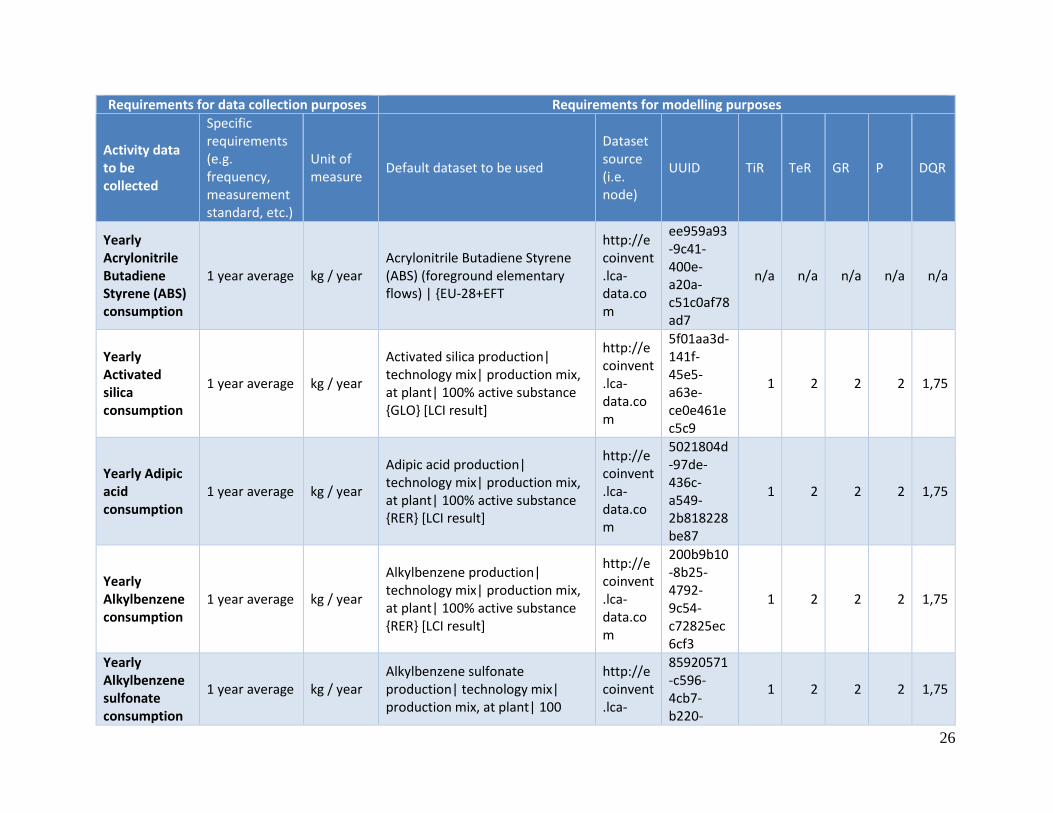
26
Requirements for data collection purposes Requirements for modelling purposes
Activity data to be collected
Specific requirements (e.g. frequency, measurement standard, etc.)
Unit of measure
Default dataset to be used
Dataset source (i.e. node)
UUID TiR TeR GR P DQR
Yearly Acrylonitrile Butadiene Styrene (ABS) consumption
1 year average kg / year Acrylonitrile Butadiene Styrene (ABS) (foreground elementary flows) | {EU-28+EFT
http://ecoinvent.lca-data.com
ee959a93-9c41-400e-a20a-c51c0af78ad7
n/a n/a n/a n/a n/a
Yearly Activated silica consumption
1 year average kg / year
Activated silica production| technology mix| production mix, at plant| 100% active substance {GLO} [LCI result]
http://ecoinvent.lca-data.com
5f01aa3d-141f-45e5-a63e-ce0e461ec5c9
1 2 2 2 1,75
Yearly Adipic acid consumption
1 year average kg / year
Adipic acid production| technology mix| production mix, at plant| 100% active substance {RER} [LCI result]
http://ecoinvent.lca-data.com
5021804d-97de-436c-a549-2b818228be87
1 2 2 2 1,75
Yearly Alkylbenzene consumption
1 year average kg / year
Alkylbenzene production| technology mix| production mix, at plant| 100% active substance {RER} [LCI result]
http://ecoinvent.lca-data.com
200b9b10-8b25-4792-9c54-c72825ec6cf3
1 2 2 2 1,75
Yearly Alkylbenzene sulfonate consumption
1 year average kg / year Alkylbenzene sulfonate production| technology mix| production mix, at plant| 100
http://ecoinvent.lca-
85920571-c596-4cb7-b220-
1 2 2 2 1,75
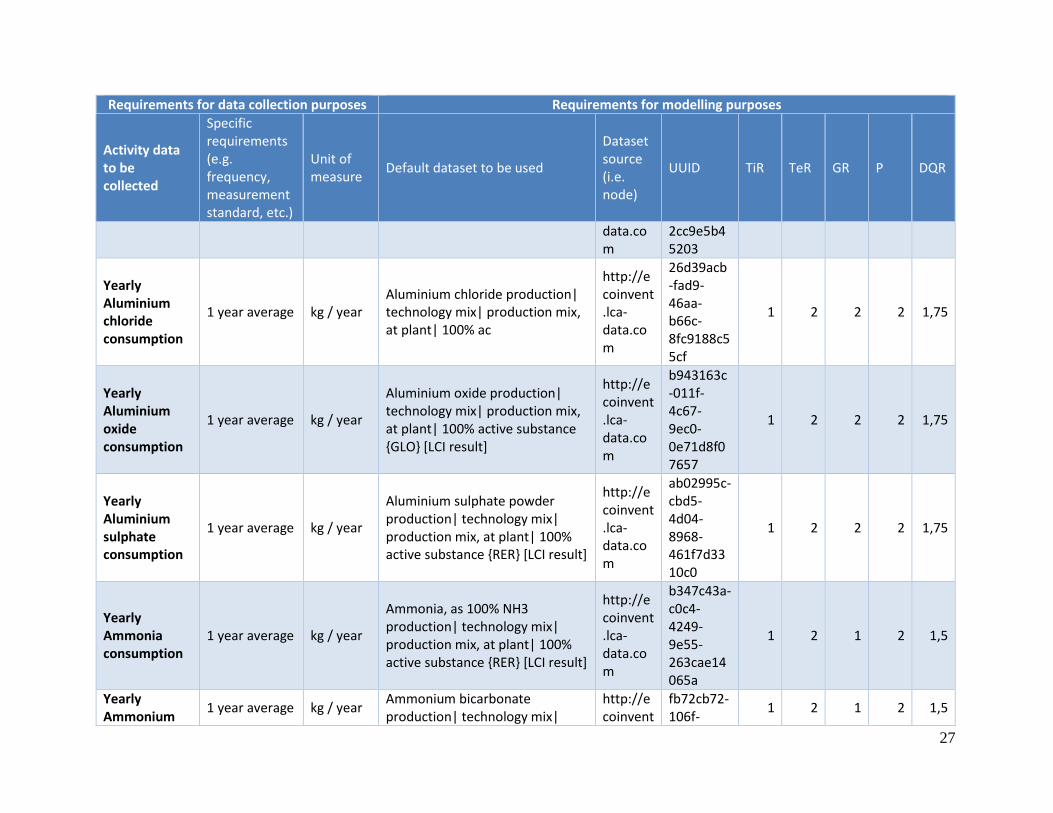
27
Requirements for data collection purposes Requirements for modelling purposes
Activity data to be collected
Specific requirements (e.g. frequency, measurement standard, etc.)
Unit of measure
Default dataset to be used
Dataset source (i.e. node)
UUID TiR TeR GR P DQR
data.com
2cc9e5b45203
Yearly Aluminium chloride consumption
1 year average kg / year Aluminium chloride production| technology mix| production mix, at plant| 100% ac
http://ecoinvent.lca-data.com
26d39acb-fad9-46aa-b66c-8fc9188c55cf
1 2 2 2 1,75
Yearly Aluminium oxide consumption
1 year average kg / year
Aluminium oxide production| technology mix| production mix, at plant| 100% active substance {GLO} [LCI result]
http://ecoinvent.lca-data.com
b943163c-011f-4c67-9ec0-0e71d8f07657
1 2 2 2 1,75
Yearly Aluminium sulphate consumption
1 year average kg / year
Aluminium sulphate powder production| technology mix| production mix, at plant| 100% active substance {RER} [LCI result]
http://ecoinvent.lca-data.com
ab02995c-cbd5-4d04-8968-461f7d3310c0
1 2 2 2 1,75
Yearly Ammonia consumption
1 year average kg / year
Ammonia, as 100% NH3 production| technology mix| production mix, at plant| 100% active substance {RER} [LCI result]
http://ecoinvent.lca-data.com
b347c43a-c0c4-4249-9e55-263cae14065a
1 2 1 2 1,5
Yearly Ammonium
1 year average kg / year Ammonium bicarbonate production| technology mix|
http://ecoinvent
fb72cb72-106f-
1 2 1 2 1,5
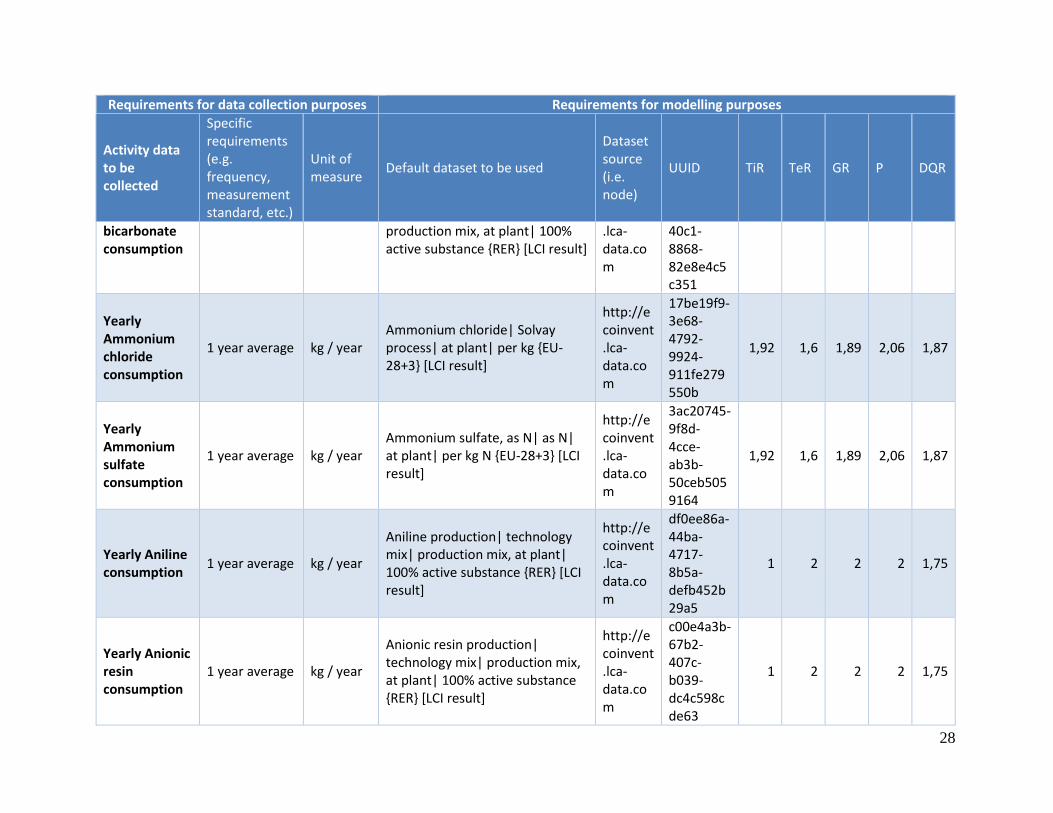
28
Requirements for data collection purposes Requirements for modelling purposes
Activity data to be collected
Specific requirements (e.g. frequency, measurement standard, etc.)
Unit of measure
Default dataset to be used
Dataset source (i.e. node)
UUID TiR TeR GR P DQR
bicarbonate consumption
production mix, at plant| 100% active substance {RER} [LCI result]
.lca-data.com
40c1-8868-82e8e4c5c351
Yearly Ammonium chloride consumption
1 year average kg / year Ammonium chloride| Solvay process| at plant| per kg {EU-28+3} [LCI result]
http://ecoinvent.lca-data.com
17be19f9-3e68-4792-9924-911fe279550b
1,92 1,6 1,89 2,06 1,87
Yearly Ammonium sulfate consumption
1 year average kg / year Ammonium sulfate, as N| as N| at plant| per kg N {EU-28+3} [LCI result]
http://ecoinvent.lca-data.com
3ac20745-9f8d-4cce-ab3b-50ceb5059164
1,92 1,6 1,89 2,06 1,87
Yearly Aniline consumption
1 year average kg / year
Aniline production| technology mix| production mix, at plant| 100% active substance {RER} [LCI result]
http://ecoinvent.lca-data.com
df0ee86a-44ba-4717-8b5a-defb452b29a5
1 2 2 2 1,75
Yearly Anionic resin consumption
1 year average kg / year
Anionic resin production| technology mix| production mix, at plant| 100% active substance {RER} [LCI result]
http://ecoinvent.lca-data.com
c00e4a3b-67b2-407c-b039-dc4c598cde63
1 2 2 2 1,75
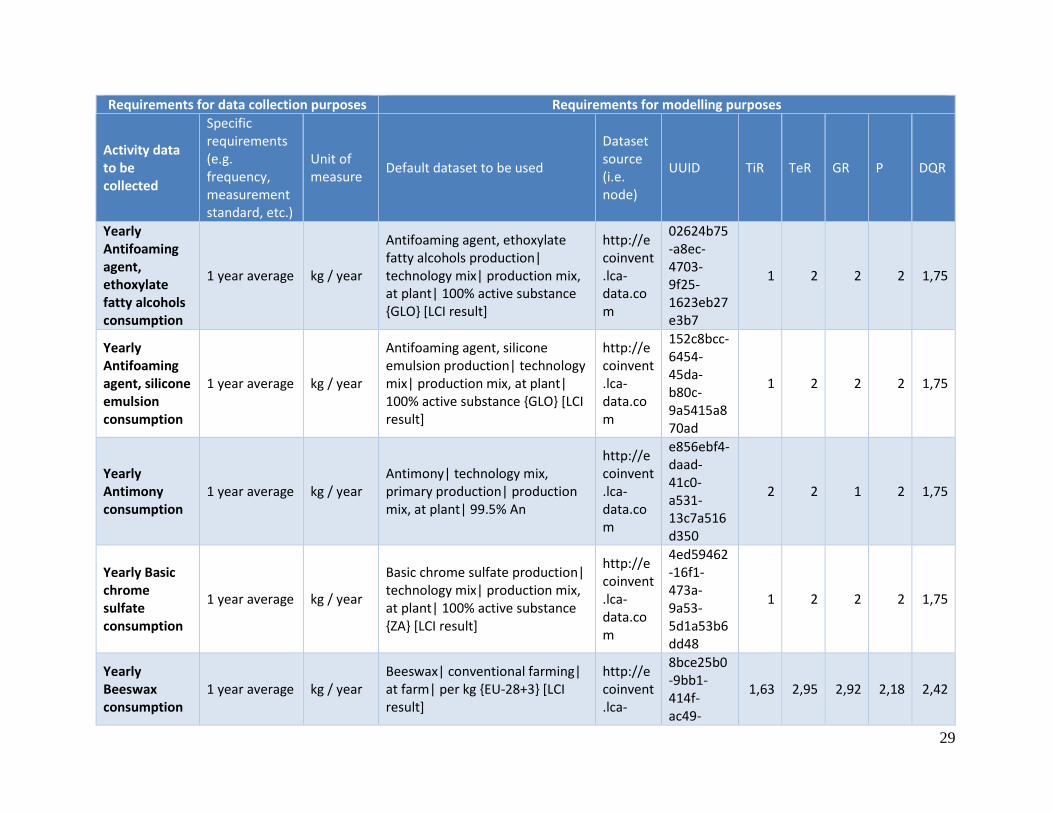
29
Requirements for data collection purposes Requirements for modelling purposes
Activity data to be collected
Specific requirements (e.g. frequency, measurement standard, etc.)
Unit of measure
Default dataset to be used
Dataset source (i.e. node)
UUID TiR TeR GR P DQR
Yearly Antifoaming agent, ethoxylate fatty alcohols consumption
1 year average kg / year
Antifoaming agent, ethoxylate fatty alcohols production| technology mix| production mix, at plant| 100% active substance {GLO} [LCI result]
http://ecoinvent.lca-data.com
02624b75-a8ec-4703-9f25-1623eb27e3b7
1 2 2 2 1,75
Yearly Antifoaming agent, silicone emulsion consumption
1 year average kg / year
Antifoaming agent, silicone emulsion production| technology mix| production mix, at plant| 100% active substance {GLO} [LCI result]
http://ecoinvent.lca-data.com
152c8bcc-6454-45da-b80c-9a5415a870ad
1 2 2 2 1,75
Yearly Antimony consumption
1 year average kg / year Antimony| technology mix, primary production| production mix, at plant| 99.5% An
http://ecoinvent.lca-data.com
e856ebf4-daad-41c0-a531-13c7a516d350
2 2 1 2 1,75
Yearly Basic chrome sulfate consumption
1 year average kg / year
Basic chrome sulfate production| technology mix| production mix, at plant| 100% active substance {ZA} [LCI result]
http://ecoinvent.lca-data.com
4ed59462-16f1-473a-9a53-5d1a53b6dd48
1 2 2 2 1,75
Yearly Beeswax consumption
1 year average kg / year Beeswax| conventional farming| at farm| per kg {EU-28+3} [LCI result]
http://ecoinvent.lca-
8bce25b0-9bb1-414f-ac49-
1,63 2,95 2,92 2,18 2,42
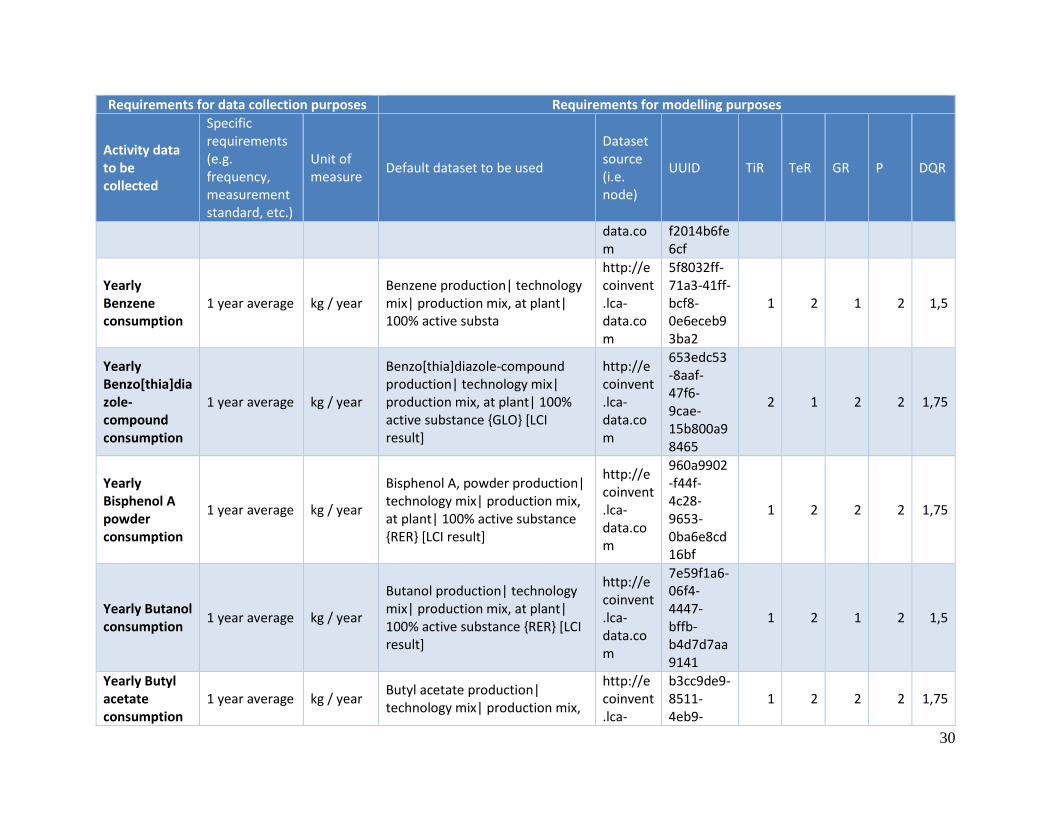
30
Requirements for data collection purposes Requirements for modelling purposes
Activity data to be collected
Specific requirements (e.g. frequency, measurement standard, etc.)
Unit of measure
Default dataset to be used
Dataset source (i.e. node)
UUID TiR TeR GR P DQR
data.com
f2014b6fe6cf
Yearly Benzene consumption
1 year average kg / year Benzene production| technology mix| production mix, at plant| 100% active substa
http://ecoinvent.lca-data.com
5f8032ff-71a3-41ff-bcf8-0e6eceb93ba2
1 2 1 2 1,5
Yearly Benzo[thia]diazole-compound consumption
1 year average kg / year
Benzo[thia]diazole-compound production| technology mix| production mix, at plant| 100% active substance {GLO} [LCI result]
http://ecoinvent.lca-data.com
653edc53-8aaf-47f6-9cae-15b800a98465
2 1 2 2 1,75
Yearly Bisphenol A powder consumption
1 year average kg / year
Bisphenol A, powder production| technology mix| production mix, at plant| 100% active substance {RER} [LCI result]
http://ecoinvent.lca-data.com
960a9902-f44f-4c28-9653-0ba6e8cd16bf
1 2 2 2 1,75
Yearly Butanol consumption
1 year average kg / year
Butanol production| technology mix| production mix, at plant| 100% active substance {RER} [LCI result]
http://ecoinvent.lca-data.com
7e59f1a6-06f4-4447-bffb-b4d7d7aa9141
1 2 1 2 1,5
Yearly Butyl acetate consumption
1 year average kg / year Butyl acetate production| technology mix| production mix,
http://ecoinvent.lca-
b3cc9de9-8511-4eb9-
1 2 2 2 1,75
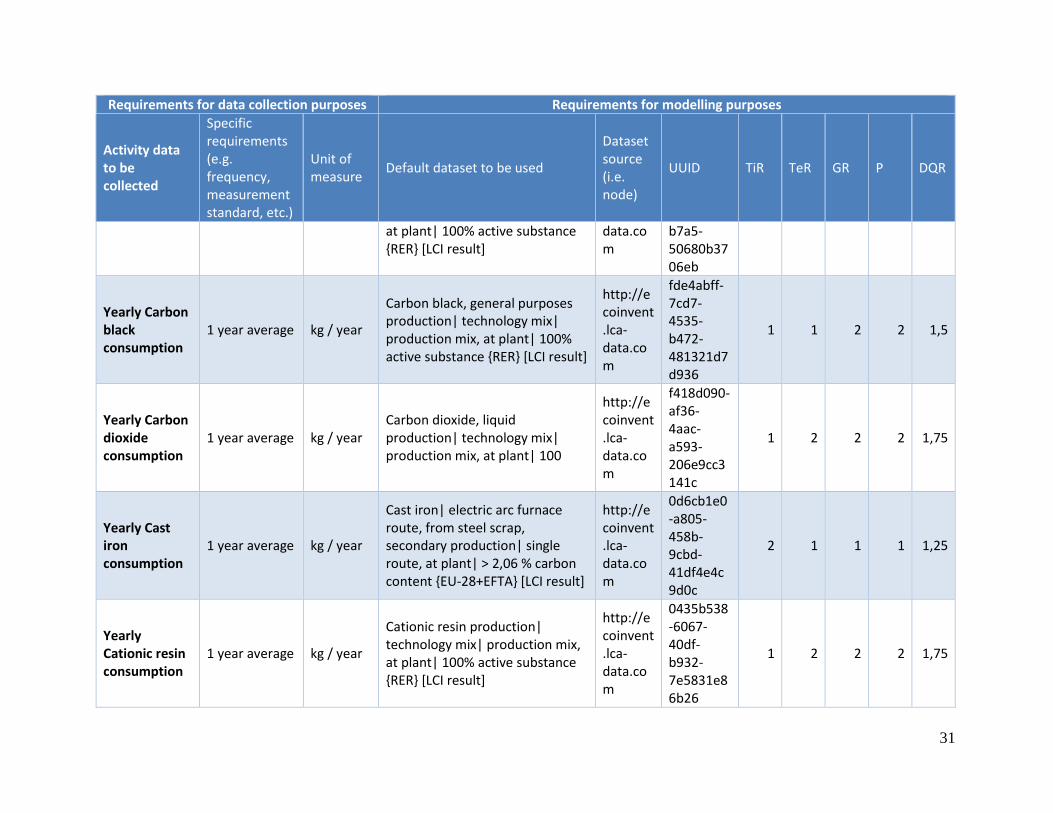
31
Requirements for data collection purposes Requirements for modelling purposes
Activity data to be collected
Specific requirements (e.g. frequency, measurement standard, etc.)
Unit of measure
Default dataset to be used
Dataset source (i.e. node)
UUID TiR TeR GR P DQR
at plant| 100% active substance {RER} [LCI result]
data.com
b7a5-50680b3706eb
Yearly Carbon black consumption
1 year average kg / year
Carbon black, general purposes production| technology mix| production mix, at plant| 100% active substance {RER} [LCI result]
http://ecoinvent.lca-data.com
fde4abff-7cd7-4535-b472-481321d7d936
1 1 2 2 1,5
Yearly Carbon dioxide consumption
1 year average kg / year Carbon dioxide, liquid production| technology mix| production mix, at plant| 100
http://ecoinvent.lca-data.com
f418d090-af36-4aac-a593-206e9cc3141c
1 2 2 2 1,75
Yearly Cast iron consumption
1 year average kg / year
Cast iron| electric arc furnace route, from steel scrap, secondary production| single route, at plant| > 2,06 % carbon content {EU-28+EFTA} [LCI result]
http://ecoinvent.lca-data.com
0d6cb1e0-a805-458b-9cbd-41df4e4c9d0c
2 1 1 1 1,25
Yearly Cationic resin consumption
1 year average kg / year
Cationic resin production| technology mix| production mix, at plant| 100% active substance {RER} [LCI result]
http://ecoinvent.lca-data.com
0435b538-6067-40df-b932-7e5831e86b26
1 2 2 2 1,75
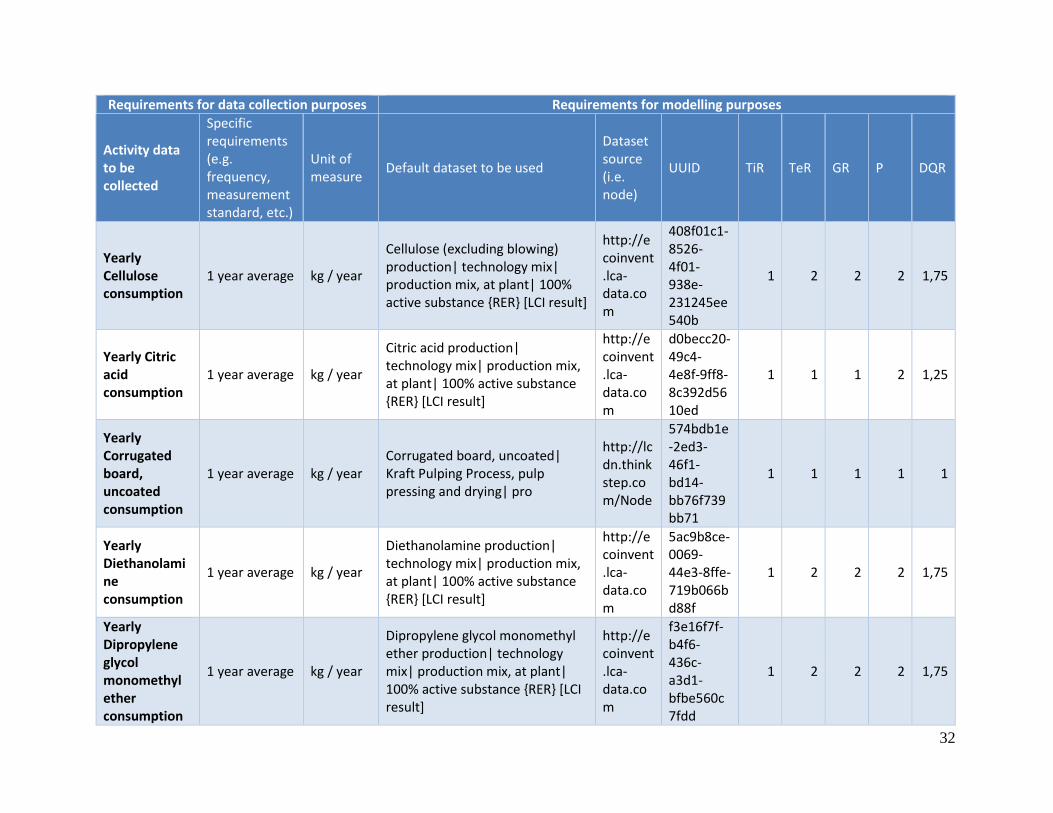
32
Requirements for data collection purposes Requirements for modelling purposes
Activity data to be collected
Specific requirements (e.g. frequency, measurement standard, etc.)
Unit of measure
Default dataset to be used
Dataset source (i.e. node)
UUID TiR TeR GR P DQR
Yearly Cellulose consumption
1 year average kg / year
Cellulose (excluding blowing) production| technology mix| production mix, at plant| 100% active substance {RER} [LCI result]
http://ecoinvent.lca-data.com
408f01c1-8526-4f01-938e-231245ee540b
1 2 2 2 1,75
Yearly Citric acid consumption
1 year average kg / year
Citric acid production| technology mix| production mix, at plant| 100% active substance {RER} [LCI result]
http://ecoinvent.lca-data.com
d0becc20-49c4-4e8f-9ff8-8c392d5610ed
1 1 1 2 1,25
Yearly Corrugated board, uncoated consumption
1 year average kg / year Corrugated board, uncoated| Kraft Pulping Process, pulp pressing and drying| pro
http://lcdn.thinkstep.com/Node
574bdb1e-2ed3-46f1-bd14-bb76f739bb71
1 1 1 1 1
Yearly Diethanolamine consumption
1 year average kg / year
Diethanolamine production| technology mix| production mix, at plant| 100% active substance {RER} [LCI result]
http://ecoinvent.lca-data.com
5ac9b8ce-0069-44e3-8ffe-719b066bd88f
1 2 2 2 1,75
Yearly Dipropylene glycol monomethyl ether consumption
1 year average kg / year
Dipropylene glycol monomethyl ether production| technology mix| production mix, at plant| 100% active substance {RER} [LCI result]
http://ecoinvent.lca-data.com
f3e16f7f-b4f6-436c-a3d1-bfbe560c7fdd
1 2 2 2 1,75
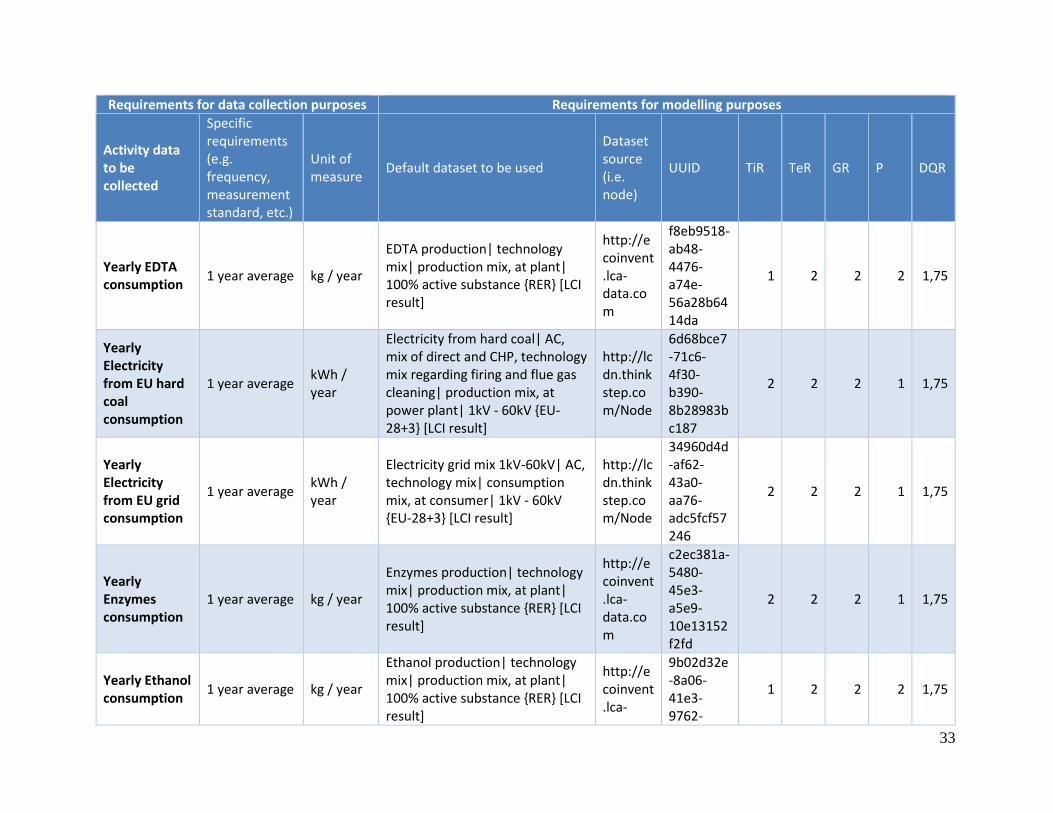
33
Requirements for data collection purposes Requirements for modelling purposes
Activity data to be collected
Specific requirements (e.g. frequency, measurement standard, etc.)
Unit of measure
Default dataset to be used
Dataset source (i.e. node)
UUID TiR TeR GR P DQR
Yearly EDTA consumption
1 year average kg / year
EDTA production| technology mix| production mix, at plant| 100% active substance {RER} [LCI result]
http://ecoinvent.lca-data.com
f8eb9518-ab48-4476-a74e-56a28b6414da
1 2 2 2 1,75
Yearly Electricity from EU hard coal consumption
1 year average kWh / year
Electricity from hard coal| AC, mix of direct and CHP, technology mix regarding firing and flue gas cleaning| production mix, at power plant| 1kV - 60kV {EU-28+3} [LCI result]
http://lcdn.thinkstep.com/Node
6d68bce7-71c6-4f30-b390-8b28983bc187
2 2 2 1 1,75
Yearly Electricity from EU grid consumption
1 year average kWh / year
Electricity grid mix 1kV-60kV| AC, technology mix| consumption mix, at consumer| 1kV - 60kV {EU-28+3} [LCI result]
http://lcdn.thinkstep.com/Node
34960d4d-af62-43a0-aa76-adc5fcf57246
2 2 2 1 1,75
Yearly Enzymes consumption
1 year average kg / year
Enzymes production| technology mix| production mix, at plant| 100% active substance {RER} [LCI result]
http://ecoinvent.lca-data.com
c2ec381a-5480-45e3-a5e9-10e13152f2fd
2 2 2 1 1,75
Yearly Ethanol consumption
1 year average kg / year
Ethanol production| technology mix| production mix, at plant| 100% active substance {RER} [LCI result]
http://ecoinvent.lca-
9b02d32e-8a06-41e3-9762-
1 2 2 2 1,75
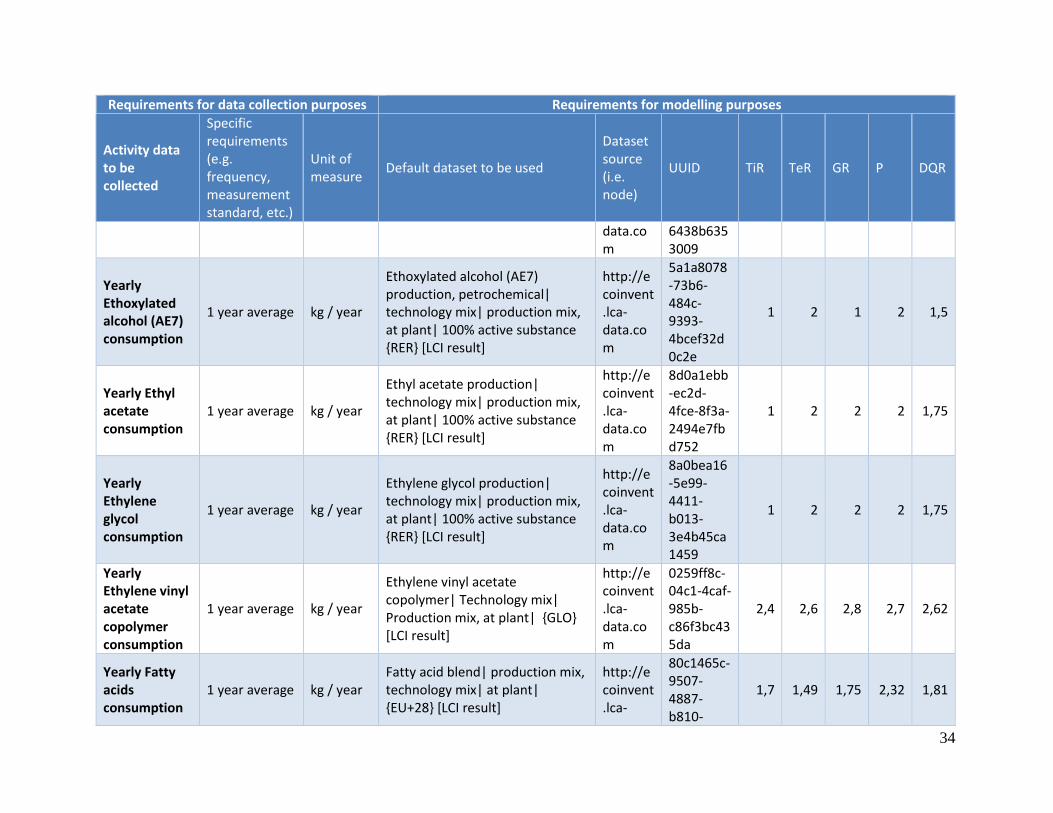
34
Requirements for data collection purposes Requirements for modelling purposes
Activity data to be collected
Specific requirements (e.g. frequency, measurement standard, etc.)
Unit of measure
Default dataset to be used
Dataset source (i.e. node)
UUID TiR TeR GR P DQR
data.com
6438b6353009
Yearly Ethoxylated alcohol (AE7) consumption
1 year average kg / year
Ethoxylated alcohol (AE7) production, petrochemical| technology mix| production mix, at plant| 100% active substance {RER} [LCI result]
http://ecoinvent.lca-data.com
5a1a8078-73b6-484c-9393-4bcef32d0c2e
1 2 1 2 1,5
Yearly Ethyl acetate consumption
1 year average kg / year
Ethyl acetate production| technology mix| production mix, at plant| 100% active substance {RER} [LCI result]
http://ecoinvent.lca-data.com
8d0a1ebb-ec2d-4fce-8f3a-2494e7fbd752
1 2 2 2 1,75
Yearly Ethylene glycol consumption
1 year average kg / year
Ethylene glycol production| technology mix| production mix, at plant| 100% active substance {RER} [LCI result]
http://ecoinvent.lca-data.com
8a0bea16-5e99-4411-b013-3e4b45ca1459
1 2 2 2 1,75
Yearly Ethylene vinyl acetate copolymer consumption
1 year average kg / year
Ethylene vinyl acetate copolymer| Technology mix| Production mix, at plant| {GLO} [LCI result]
http://ecoinvent.lca-data.com
0259ff8c-04c1-4caf-985b-c86f3bc435da
2,4 2,6 2,8 2,7 2,62
Yearly Fatty acids consumption
1 year average kg / year Fatty acid blend| production mix, technology mix| at plant| {EU+28} [LCI result]
http://ecoinvent.lca-
80c1465c-9507-4887-b810-
1,7 1,49 1,75 2,32 1,81
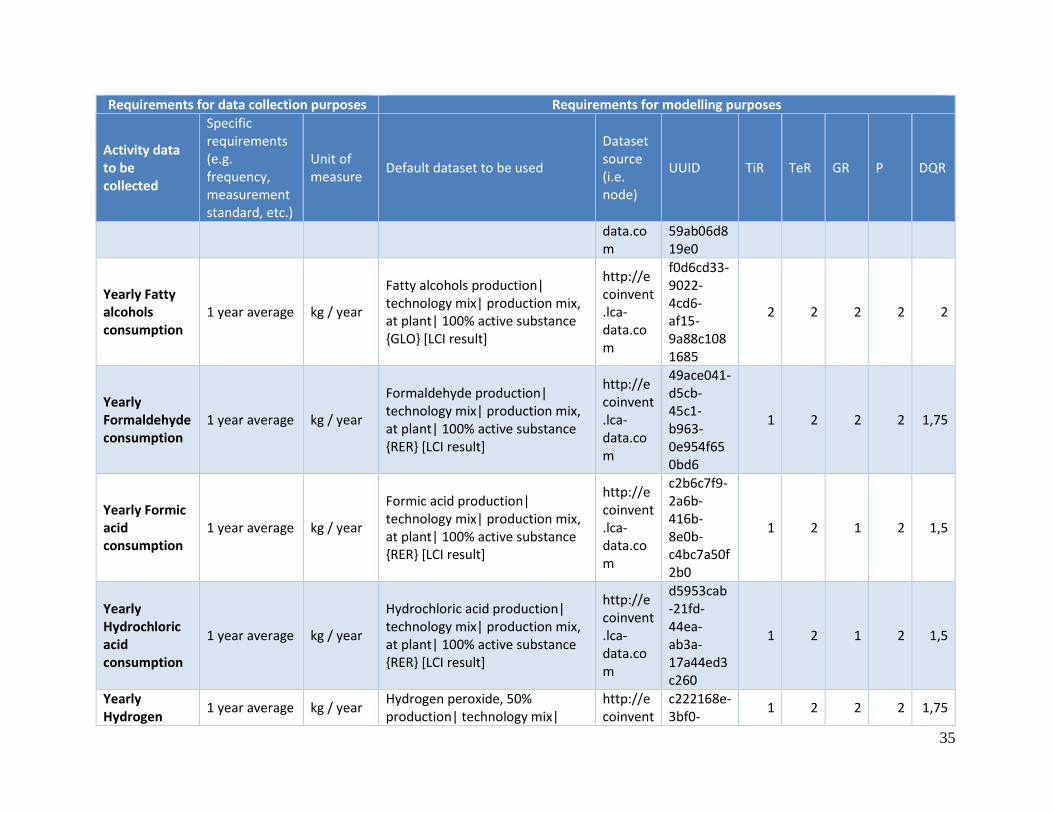
35
Requirements for data collection purposes Requirements for modelling purposes
Activity data to be collected
Specific requirements (e.g. frequency, measurement standard, etc.)
Unit of measure
Default dataset to be used
Dataset source (i.e. node)
UUID TiR TeR GR P DQR
data.com
59ab06d819e0
Yearly Fatty alcohols consumption
1 year average kg / year
Fatty alcohols production| technology mix| production mix, at plant| 100% active substance {GLO} [LCI result]
http://ecoinvent.lca-data.com
f0d6cd33-9022-4cd6-af15-9a88c1081685
2 2 2 2 2
Yearly Formaldehyde consumption
1 year average kg / year
Formaldehyde production| technology mix| production mix, at plant| 100% active substance {RER} [LCI result]
http://ecoinvent.lca-data.com
49ace041-d5cb-45c1-b963-0e954f650bd6
1 2 2 2 1,75
Yearly Formic acid consumption
1 year average kg / year
Formic acid production| technology mix| production mix, at plant| 100% active substance {RER} [LCI result]
http://ecoinvent.lca-data.com
c2b6c7f9-2a6b-416b-8e0b-c4bc7a50f2b0
1 2 1 2 1,5
Yearly Hydrochloric acid consumption
1 year average kg / year
Hydrochloric acid production| technology mix| production mix, at plant| 100% active substance {RER} [LCI result]
http://ecoinvent.lca-data.com
d5953cab-21fd-44ea-ab3a-17a44ed3c260
1 2 1 2 1,5
Yearly Hydrogen
1 year average kg / year Hydrogen peroxide, 50% production| technology mix|
http://ecoinvent
c222168e-3bf0-
1 2 2 2 1,75
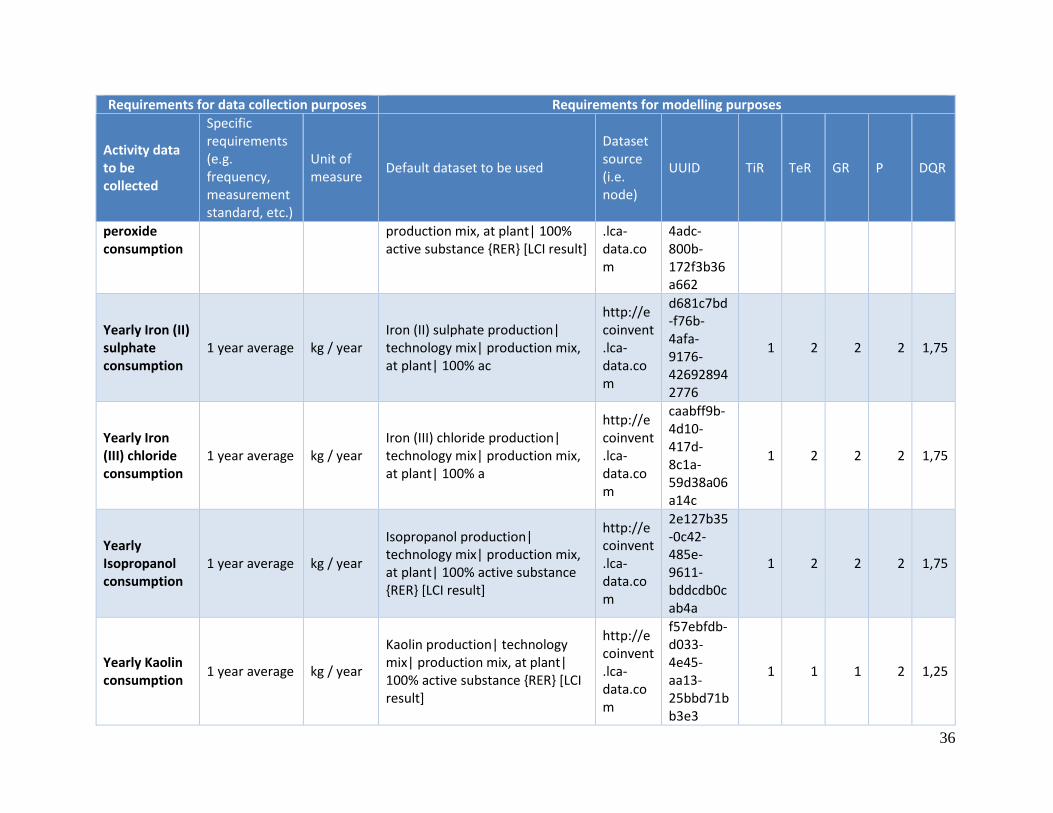
36
Requirements for data collection purposes Requirements for modelling purposes
Activity data to be collected
Specific requirements (e.g. frequency, measurement standard, etc.)
Unit of measure
Default dataset to be used
Dataset source (i.e. node)
UUID TiR TeR GR P DQR
peroxide consumption
production mix, at plant| 100% active substance {RER} [LCI result]
.lca-data.com
4adc-800b-172f3b36a662
Yearly Iron (II) sulphate consumption
1 year average kg / year Iron (II) sulphate production| technology mix| production mix, at plant| 100% ac
http://ecoinvent.lca-data.com
d681c7bd-f76b-4afa-9176-426928942776
1 2 2 2 1,75
Yearly Iron (III) chloride consumption
1 year average kg / year Iron (III) chloride production| technology mix| production mix, at plant| 100% a
http://ecoinvent.lca-data.com
caabff9b-4d10-417d-8c1a-59d38a06a14c
1 2 2 2 1,75
Yearly Isopropanol consumption
1 year average kg / year
Isopropanol production| technology mix| production mix, at plant| 100% active substance {RER} [LCI result]
http://ecoinvent.lca-data.com
2e127b35-0c42-485e-9611-bddcdb0cab4a
1 2 2 2 1,75
Yearly Kaolin consumption
1 year average kg / year
Kaolin production| technology mix| production mix, at plant| 100% active substance {RER} [LCI result]
http://ecoinvent.lca-data.com
f57ebfdb-d033-4e45-aa13-25bbd71bb3e3
1 1 1 2 1,25
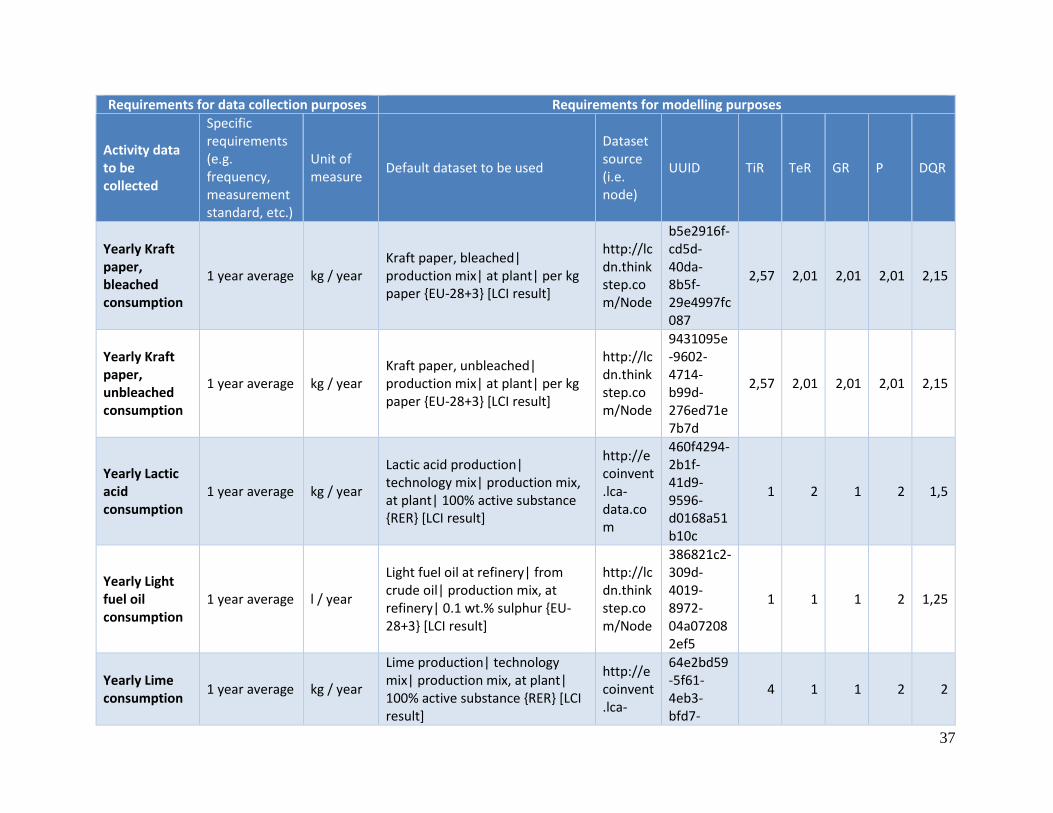
37
Requirements for data collection purposes Requirements for modelling purposes
Activity data to be collected
Specific requirements (e.g. frequency, measurement standard, etc.)
Unit of measure
Default dataset to be used
Dataset source (i.e. node)
UUID TiR TeR GR P DQR
Yearly Kraft paper, bleached consumption
1 year average kg / year Kraft paper, bleached| production mix| at plant| per kg paper {EU-28+3} [LCI result]
http://lcdn.thinkstep.com/Node
b5e2916f-cd5d-40da-8b5f-29e4997fc087
2,57 2,01 2,01 2,01 2,15
Yearly Kraft paper, unbleached consumption
1 year average kg / year Kraft paper, unbleached| production mix| at plant| per kg paper {EU-28+3} [LCI result]
http://lcdn.thinkstep.com/Node
9431095e-9602-4714-b99d-276ed71e7b7d
2,57 2,01 2,01 2,01 2,15
Yearly Lactic acid consumption
1 year average kg / year
Lactic acid production| technology mix| production mix, at plant| 100% active substance {RER} [LCI result]
http://ecoinvent.lca-data.com
460f4294-2b1f-41d9-9596-d0168a51b10c
1 2 1 2 1,5
Yearly Light fuel oil consumption
1 year average l / year
Light fuel oil at refinery| from crude oil| production mix, at refinery| 0.1 wt.% sulphur {EU-28+3} [LCI result]
http://lcdn.thinkstep.com/Node
386821c2-309d-4019-8972-04a072082ef5
1 1 1 2 1,25
Yearly Lime consumption
1 year average kg / year
Lime production| technology mix| production mix, at plant| 100% active substance {RER} [LCI result]
http://ecoinvent.lca-
64e2bd59-5f61-4eb3-bfd7-
4 1 1 2 2
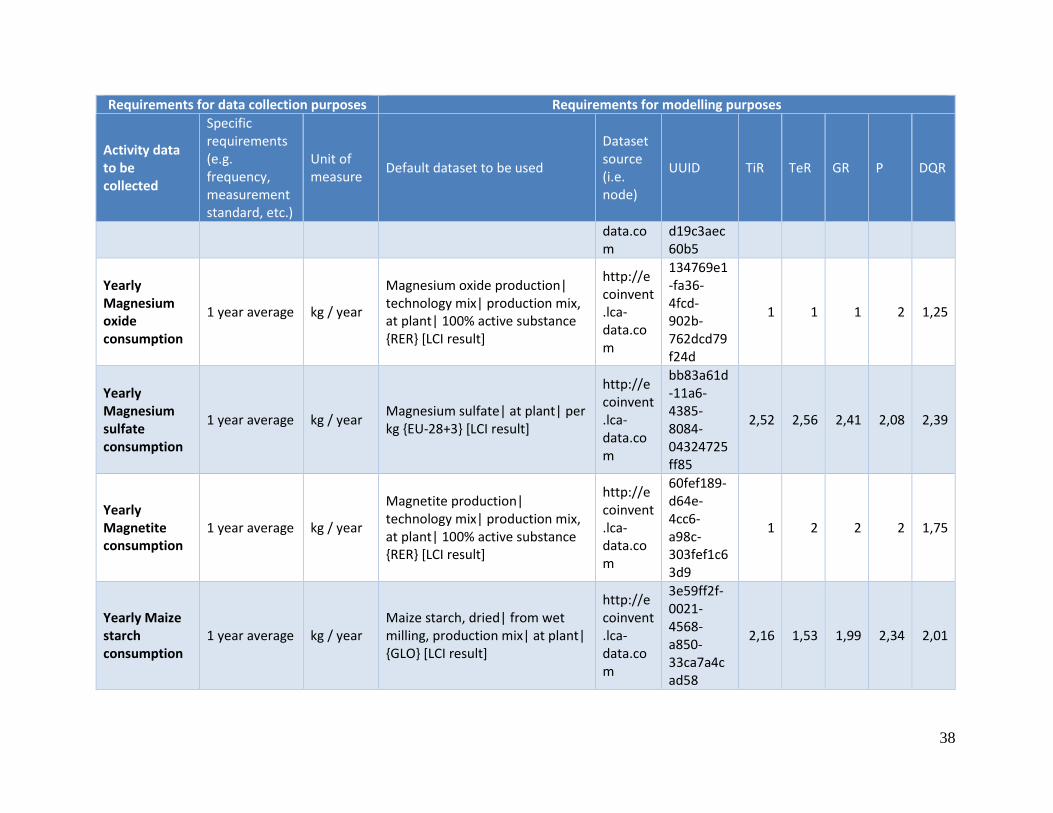
38
Requirements for data collection purposes Requirements for modelling purposes
Activity data to be collected
Specific requirements (e.g. frequency, measurement standard, etc.)
Unit of measure
Default dataset to be used
Dataset source (i.e. node)
UUID TiR TeR GR P DQR
data.com
d19c3aec60b5
Yearly Magnesium oxide consumption
1 year average kg / year
Magnesium oxide production| technology mix| production mix, at plant| 100% active substance {RER} [LCI result]
http://ecoinvent.lca-data.com
134769e1-fa36-4fcd-902b-762dcd79f24d
1 1 1 2 1,25
Yearly Magnesium sulfate consumption
1 year average kg / year Magnesium sulfate| at plant| per kg {EU-28+3} [LCI result]
http://ecoinvent.lca-data.com
bb83a61d-11a6-4385-8084-04324725ff85
2,52 2,56 2,41 2,08 2,39
Yearly Magnetite consumption
1 year average kg / year
Magnetite production| technology mix| production mix, at plant| 100% active substance {RER} [LCI result]
http://ecoinvent.lca-data.com
60fef189-d64e-4cc6-a98c-303fef1c63d9
1 2 2 2 1,75
Yearly Maize starch consumption
1 year average kg / year Maize starch, dried| from wet milling, production mix| at plant| {GLO} [LCI result]
http://ecoinvent.lca-data.com
3e59ff2f-0021-4568-a850-33ca7a4cad58
2,16 1,53 1,99 2,34 2,01
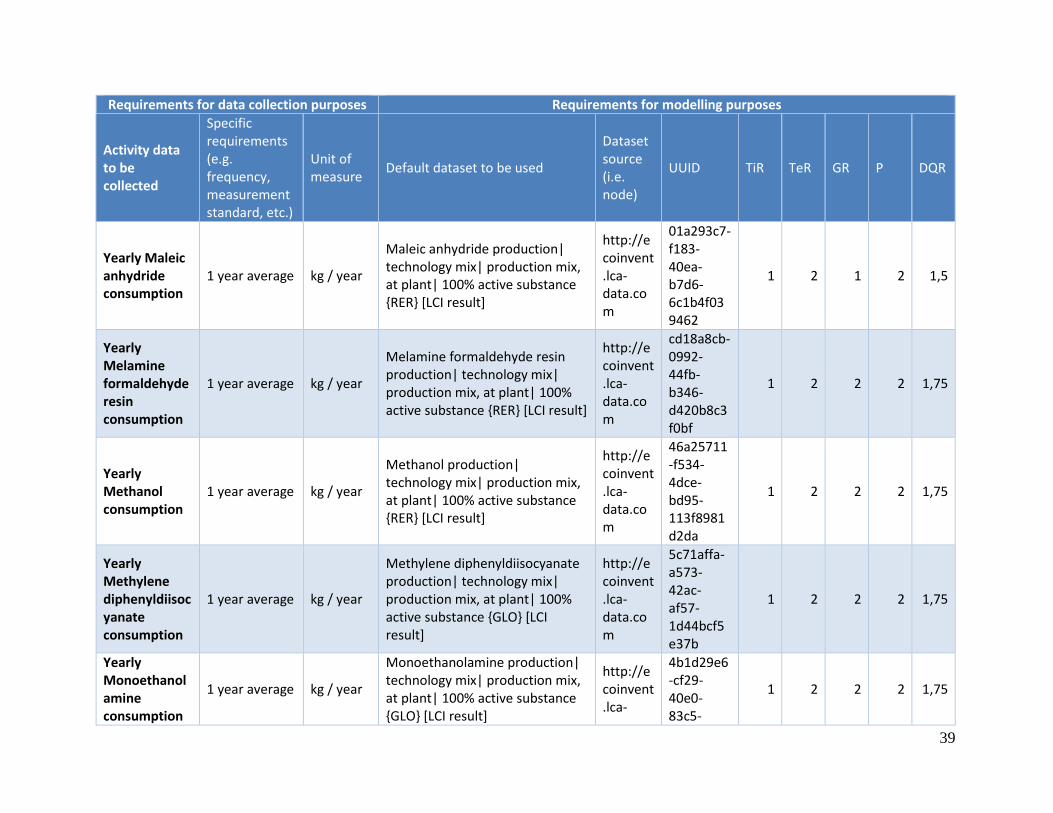
39
Requirements for data collection purposes Requirements for modelling purposes
Activity data to be collected
Specific requirements (e.g. frequency, measurement standard, etc.)
Unit of measure
Default dataset to be used
Dataset source (i.e. node)
UUID TiR TeR GR P DQR
Yearly Maleic anhydride consumption
1 year average kg / year
Maleic anhydride production| technology mix| production mix, at plant| 100% active substance {RER} [LCI result]
http://ecoinvent.lca-data.com
01a293c7-f183-40ea-b7d6-6c1b4f039462
1 2 1 2 1,5
Yearly Melamine formaldehyde resin consumption
1 year average kg / year
Melamine formaldehyde resin production| technology mix| production mix, at plant| 100% active substance {RER} [LCI result]
http://ecoinvent.lca-data.com
cd18a8cb-0992-44fb-b346-d420b8c3f0bf
1 2 2 2 1,75
Yearly Methanol consumption
1 year average kg / year
Methanol production| technology mix| production mix, at plant| 100% active substance {RER} [LCI result]
http://ecoinvent.lca-data.com
46a25711-f534-4dce-bd95-113f8981d2da
1 2 2 2 1,75
Yearly Methylene diphenyldiisocyanate consumption
1 year average kg / year
Methylene diphenyldiisocyanate production| technology mix| production mix, at plant| 100% active substance {GLO} [LCI result]
http://ecoinvent.lca-data.com
5c71affa-a573-42ac-af57-1d44bcf5e37b
1 2 2 2 1,75
Yearly Monoethanolamine consumption
1 year average kg / year
Monoethanolamine production| technology mix| production mix, at plant| 100% active substance {GLO} [LCI result]
http://ecoinvent.lca-
4b1d29e6-cf29-40e0-83c5-
1 2 2 2 1,75
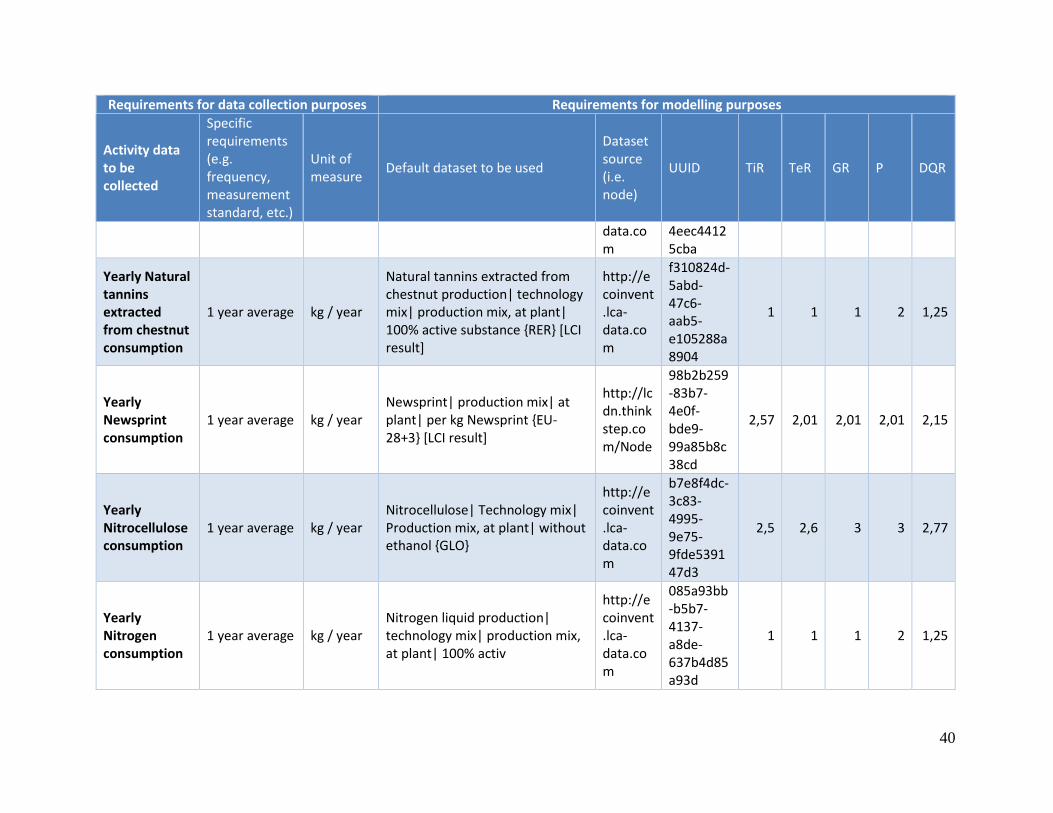
40
Requirements for data collection purposes Requirements for modelling purposes
Activity data to be collected
Specific requirements (e.g. frequency, measurement standard, etc.)
Unit of measure
Default dataset to be used
Dataset source (i.e. node)
UUID TiR TeR GR P DQR
data.com
4eec44125cba
Yearly Natural tannins extracted from chestnut consumption
1 year average kg / year
Natural tannins extracted from chestnut production| technology mix| production mix, at plant| 100% active substance {RER} [LCI result]
http://ecoinvent.lca-data.com
f310824d-5abd-47c6-aab5-e105288a8904
1 1 1 2 1,25
Yearly Newsprint consumption
1 year average kg / year Newsprint| production mix| at plant| per kg Newsprint {EU-28+3} [LCI result]
http://lcdn.thinkstep.com/Node
98b2b259-83b7-4e0f-bde9-99a85b8c38cd
2,57 2,01 2,01 2,01 2,15
Yearly Nitrocellulose consumption
1 year average kg / year Nitrocellulose| Technology mix| Production mix, at plant| without ethanol {GLO}
http://ecoinvent.lca-data.com
b7e8f4dc-3c83-4995-9e75-9fde539147d3
2,5 2,6 3 3 2,77
Yearly Nitrogen consumption
1 year average kg / year Nitrogen liquid production| technology mix| production mix, at plant| 100% activ
http://ecoinvent.lca-data.com
085a93bb-b5b7-4137-a8de-637b4d85a93d
1 1 1 2 1,25
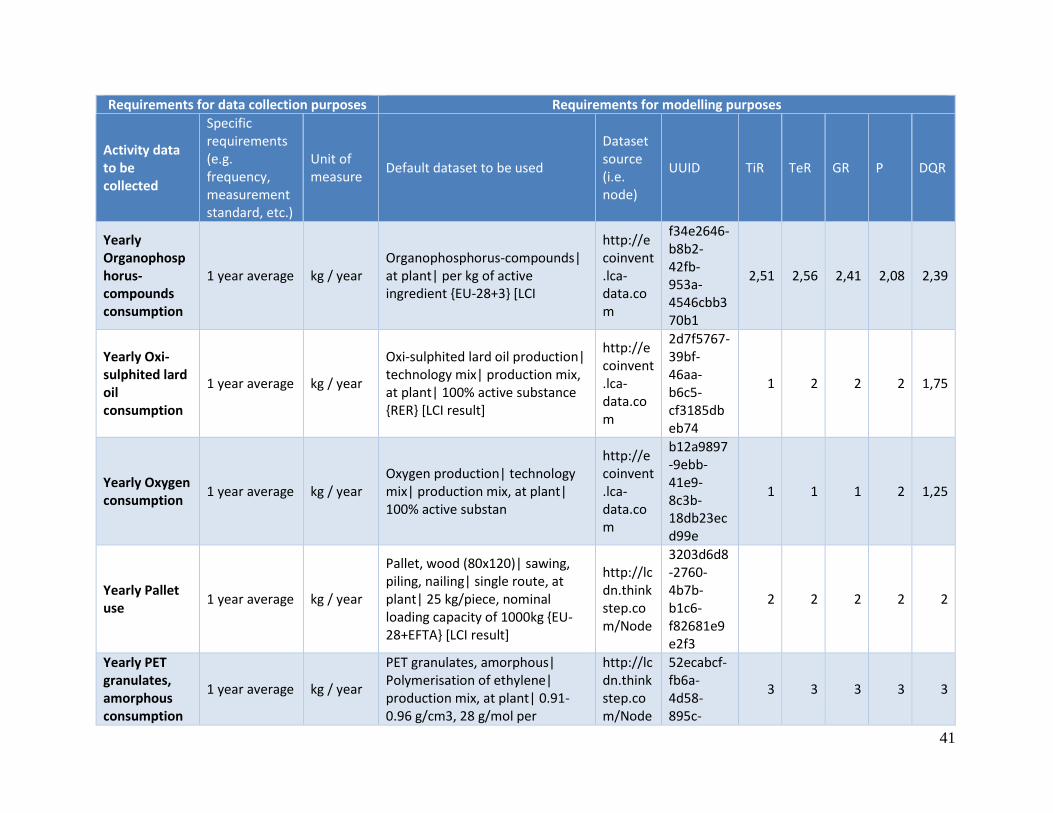
41
Requirements for data collection purposes Requirements for modelling purposes
Activity data to be collected
Specific requirements (e.g. frequency, measurement standard, etc.)
Unit of measure
Default dataset to be used
Dataset source (i.e. node)
UUID TiR TeR GR P DQR
Yearly Organophosphorus-compounds consumption
1 year average kg / year Organophosphorus-compounds| at plant| per kg of active ingredient {EU-28+3} [LCI
http://ecoinvent.lca-data.com
f34e2646-b8b2-42fb-953a-4546cbb370b1
2,51 2,56 2,41 2,08 2,39
Yearly Oxi-sulphited lard oil consumption
1 year average kg / year
Oxi-sulphited lard oil production| technology mix| production mix, at plant| 100% active substance {RER} [LCI result]
http://ecoinvent.lca-data.com
2d7f5767-39bf-46aa-b6c5-cf3185dbeb74
1 2 2 2 1,75
Yearly Oxygen consumption
1 year average kg / year Oxygen production| technology mix| production mix, at plant| 100% active substan
http://ecoinvent.lca-data.com
b12a9897-9ebb-41e9-8c3b-18db23ecd99e
1 1 1 2 1,25
Yearly Pallet use
1 year average kg / year
Pallet, wood (80x120)| sawing, piling, nailing| single route, at plant| 25 kg/piece, nominal loading capacity of 1000kg {EU-28+EFTA} [LCI result]
http://lcdn.thinkstep.com/Node
3203d6d8-2760-4b7b-b1c6-f82681e9e2f3
2 2 2 2 2
Yearly PET granulates, amorphous consumption
1 year average kg / year
PET granulates, amorphous| Polymerisation of ethylene| production mix, at plant| 0.91- 0.96 g/cm3, 28 g/mol per
http://lcdn.thinkstep.com/Node
52ecabcf-fb6a-4d58-895c-
3 3 3 3 3
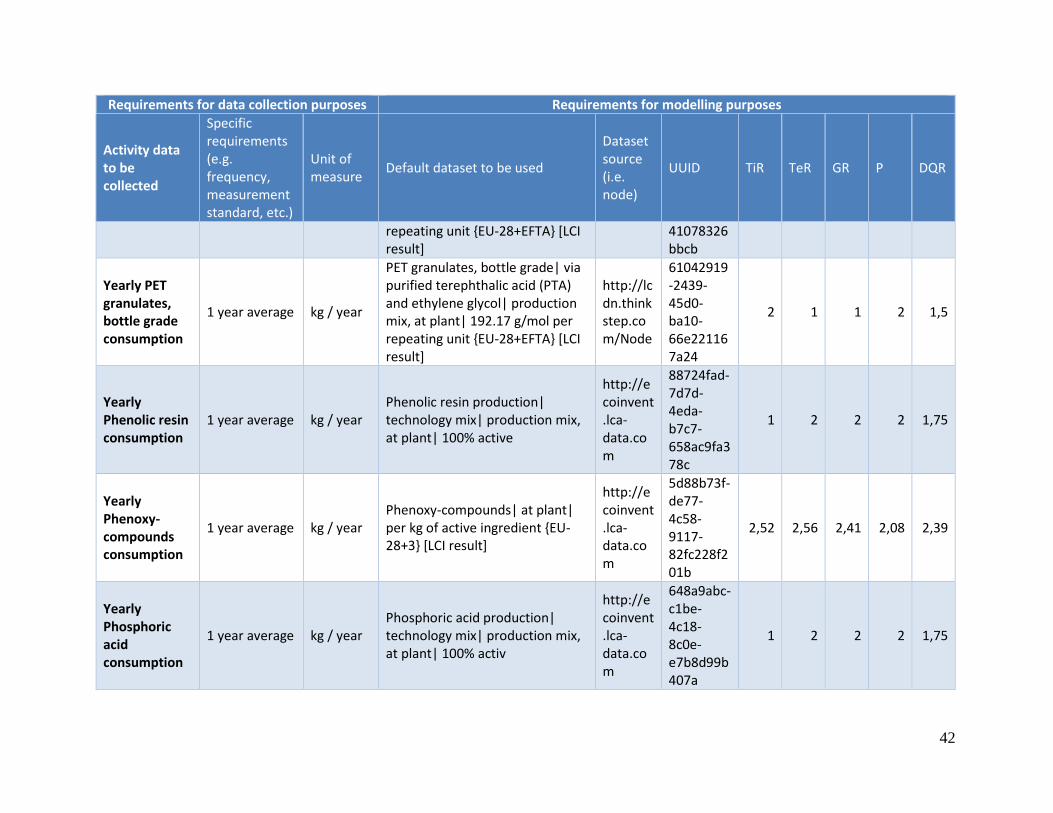
42
Requirements for data collection purposes Requirements for modelling purposes
Activity data to be collected
Specific requirements (e.g. frequency, measurement standard, etc.)
Unit of measure
Default dataset to be used
Dataset source (i.e. node)
UUID TiR TeR GR P DQR
repeating unit {EU-28+EFTA} [LCI result]
41078326bbcb
Yearly PET granulates, bottle grade consumption
1 year average kg / year
PET granulates, bottle grade| via purified terephthalic acid (PTA) and ethylene glycol| production mix, at plant| 192.17 g/mol per repeating unit {EU-28+EFTA} [LCI result]
http://lcdn.thinkstep.com/Node
61042919-2439-45d0-ba10-66e221167a24
2 1 1 2 1,5
Yearly Phenolic resin consumption
1 year average kg / year Phenolic resin production| technology mix| production mix, at plant| 100% active
http://ecoinvent.lca-data.com
88724fad-7d7d-4eda-b7c7-658ac9fa378c
1 2 2 2 1,75
Yearly Phenoxy-compounds consumption
1 year average kg / year Phenoxy-compounds| at plant| per kg of active ingredient {EU-28+3} [LCI result]
http://ecoinvent.lca-data.com
5d88b73f-de77-4c58-9117-82fc228f201b
2,52 2,56 2,41 2,08 2,39
Yearly Phosphoric acid consumption
1 year average kg / year Phosphoric acid production| technology mix| production mix, at plant| 100% activ
http://ecoinvent.lca-data.com
648a9abc-c1be-4c18-8c0e-e7b8d99b407a
1 2 2 2 1,75
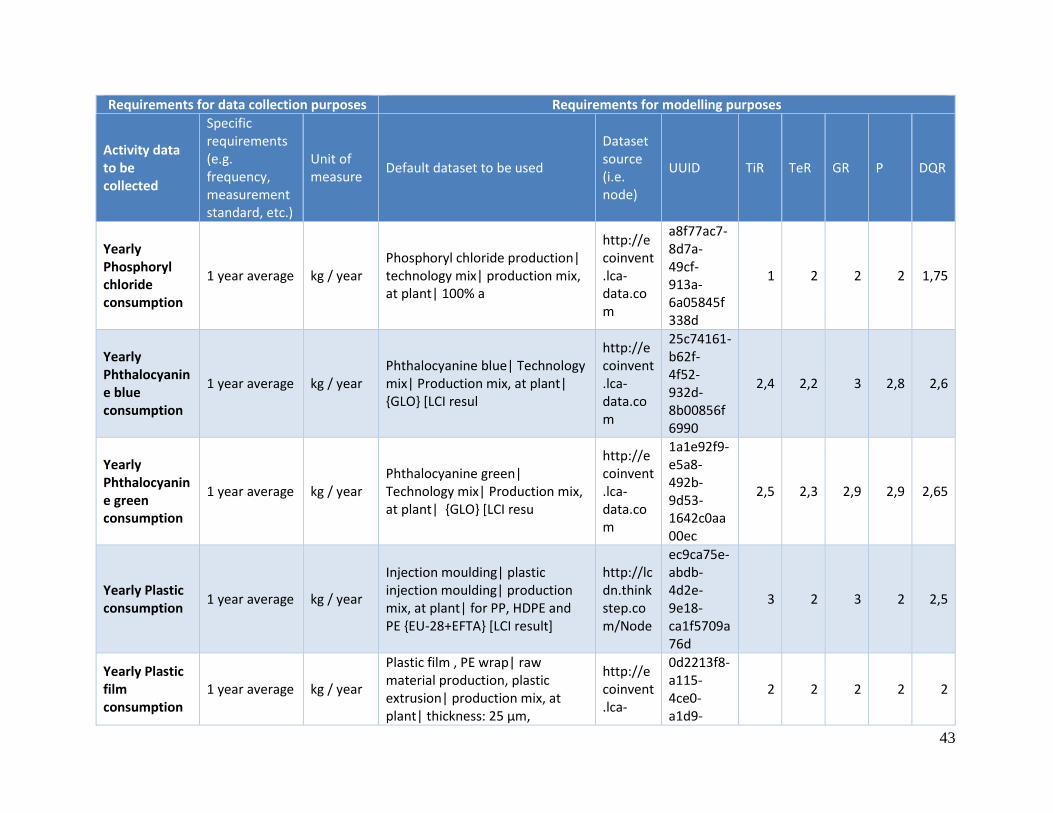
43
Requirements for data collection purposes Requirements for modelling purposes
Activity data to be collected
Specific requirements (e.g. frequency, measurement standard, etc.)
Unit of measure
Default dataset to be used
Dataset source (i.e. node)
UUID TiR TeR GR P DQR
Yearly Phosphoryl chloride consumption
1 year average kg / year Phosphoryl chloride production| technology mix| production mix, at plant| 100% a
http://ecoinvent.lca-data.com
a8f77ac7-8d7a-49cf-913a-6a05845f338d
1 2 2 2 1,75
Yearly Phthalocyanine blue consumption
1 year average kg / year Phthalocyanine blue| Technology mix| Production mix, at plant| {GLO} [LCI resul
http://ecoinvent.lca-data.com
25c74161-b62f-4f52-932d-8b00856f6990
2,4 2,2 3 2,8 2,6
Yearly Phthalocyanine green consumption
1 year average kg / year Phthalocyanine green| Technology mix| Production mix, at plant| {GLO} [LCI resu
http://ecoinvent.lca-data.com
1a1e92f9-e5a8-492b-9d53-1642c0aa00ec
2,5 2,3 2,9 2,9 2,65
Yearly Plastic consumption
1 year average kg / year
Injection moulding| plastic injection moulding| production mix, at plant| for PP, HDPE and PE {EU-28+EFTA} [LCI result]
http://lcdn.thinkstep.com/Node
ec9ca75e-abdb-4d2e-9e18-ca1f5709a76d
3 2 3 2 2,5
Yearly Plastic film consumption
1 year average kg / year
Plastic film , PE wrap| raw material production, plastic extrusion| production mix, at plant| thickness: 25 µm,
http://ecoinvent.lca-
0d2213f8-a115-4ce0-a1d9-
2 2 2 2 2
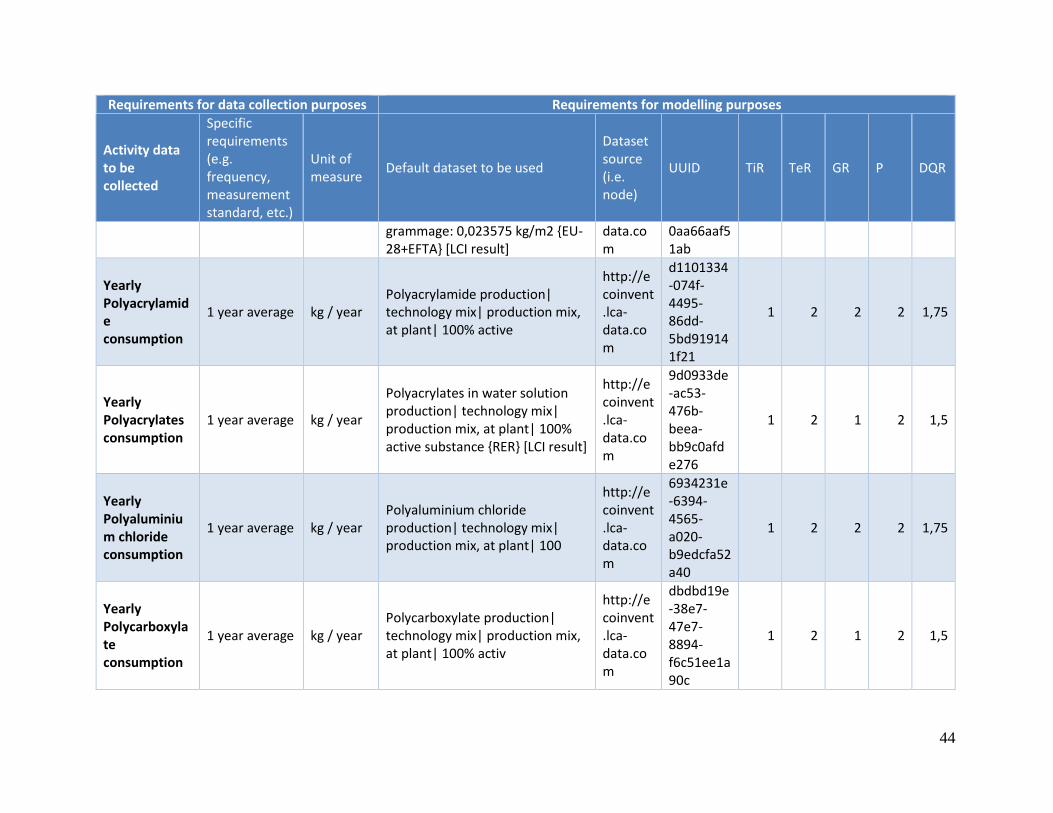
44
Requirements for data collection purposes Requirements for modelling purposes
Activity data to be collected
Specific requirements (e.g. frequency, measurement standard, etc.)
Unit of measure
Default dataset to be used
Dataset source (i.e. node)
UUID TiR TeR GR P DQR
grammage: 0,023575 kg/m2 {EU-28+EFTA} [LCI result]
data.com
0aa66aaf51ab
Yearly Polyacrylamide consumption
1 year average kg / year Polyacrylamide production| technology mix| production mix, at plant| 100% active
http://ecoinvent.lca-data.com
d1101334-074f-4495-86dd-5bd919141f21
1 2 2 2 1,75
Yearly Polyacrylates consumption
1 year average kg / year
Polyacrylates in water solution production| technology mix| production mix, at plant| 100% active substance {RER} [LCI result]
http://ecoinvent.lca-data.com
9d0933de-ac53-476b-beea-bb9c0afde276
1 2 1 2 1,5
Yearly Polyaluminium chloride consumption
1 year average kg / year Polyaluminium chloride production| technology mix| production mix, at plant| 100
http://ecoinvent.lca-data.com
6934231e-6394-4565-a020-b9edcfa52a40
1 2 2 2 1,75
Yearly Polycarboxylate consumption
1 year average kg / year Polycarboxylate production| technology mix| production mix, at plant| 100% activ
http://ecoinvent.lca-data.com
dbdbd19e-38e7-47e7-8894-f6c51ee1a90c
1 2 1 2 1,5
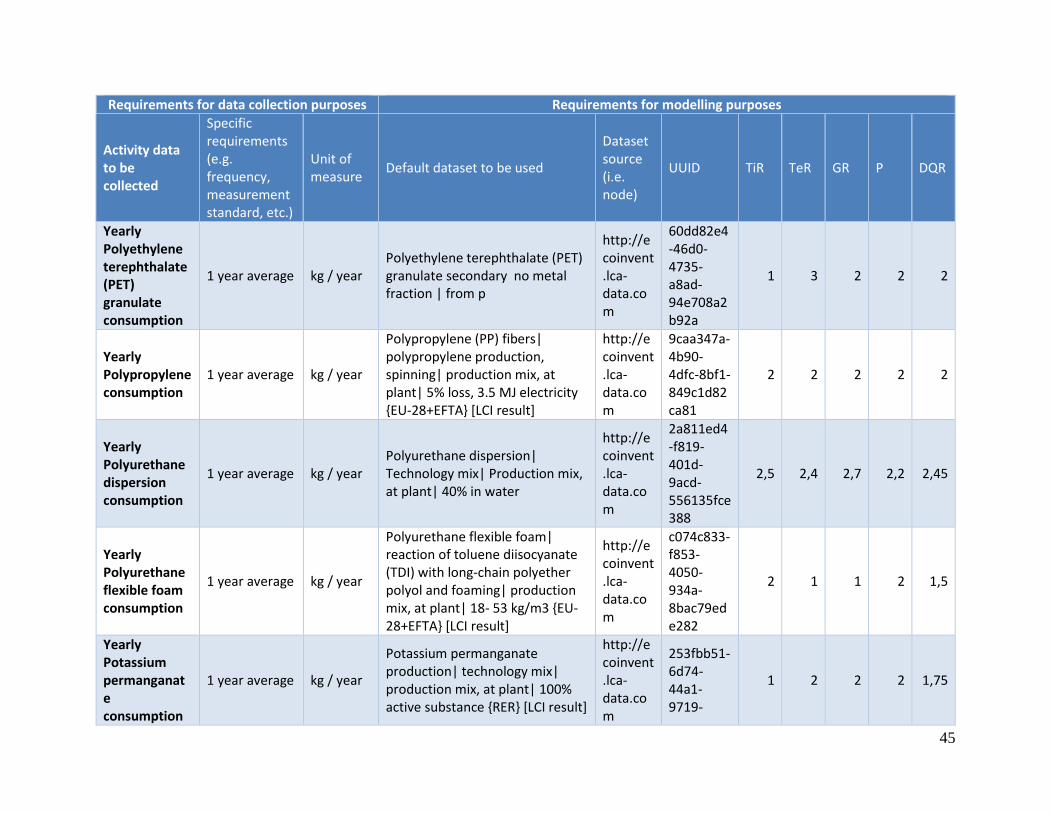
45
Requirements for data collection purposes Requirements for modelling purposes
Activity data to be collected
Specific requirements (e.g. frequency, measurement standard, etc.)
Unit of measure
Default dataset to be used
Dataset source (i.e. node)
UUID TiR TeR GR P DQR
Yearly Polyethylene terephthalate (PET) granulate consumption
1 year average kg / year Polyethylene terephthalate (PET) granulate secondary no metal fraction | from p
http://ecoinvent.lca-data.com
60dd82e4-46d0-4735-a8ad-94e708a2b92a
1 3 2 2 2
Yearly Polypropylene consumption
1 year average kg / year
Polypropylene (PP) fibers| polypropylene production, spinning| production mix, at plant| 5% loss, 3.5 MJ electricity {EU-28+EFTA} [LCI result]
http://ecoinvent.lca-data.com
9caa347a-4b90-4dfc-8bf1-849c1d82ca81
2 2 2 2 2
Yearly Polyurethane dispersion consumption
1 year average kg / year Polyurethane dispersion| Technology mix| Production mix, at plant| 40% in water
http://ecoinvent.lca-data.com
2a811ed4-f819-401d-9acd-556135fce388
2,5 2,4 2,7 2,2 2,45
Yearly Polyurethane flexible foam consumption
1 year average kg / year
Polyurethane flexible foam| reaction of toluene diisocyanate (TDI) with long-chain polyether polyol and foaming| production mix, at plant| 18- 53 kg/m3 {EU-28+EFTA} [LCI result]
http://ecoinvent.lca-data.com
c074c833-f853-4050-934a-8bac79ede282
2 1 1 2 1,5
Yearly Potassium permanganate consumption
1 year average kg / year
Potassium permanganate production| technology mix| production mix, at plant| 100% active substance {RER} [LCI result]
http://ecoinvent.lca-data.com
253fbb51-6d74-44a1-9719-
1 2 2 2 1,75
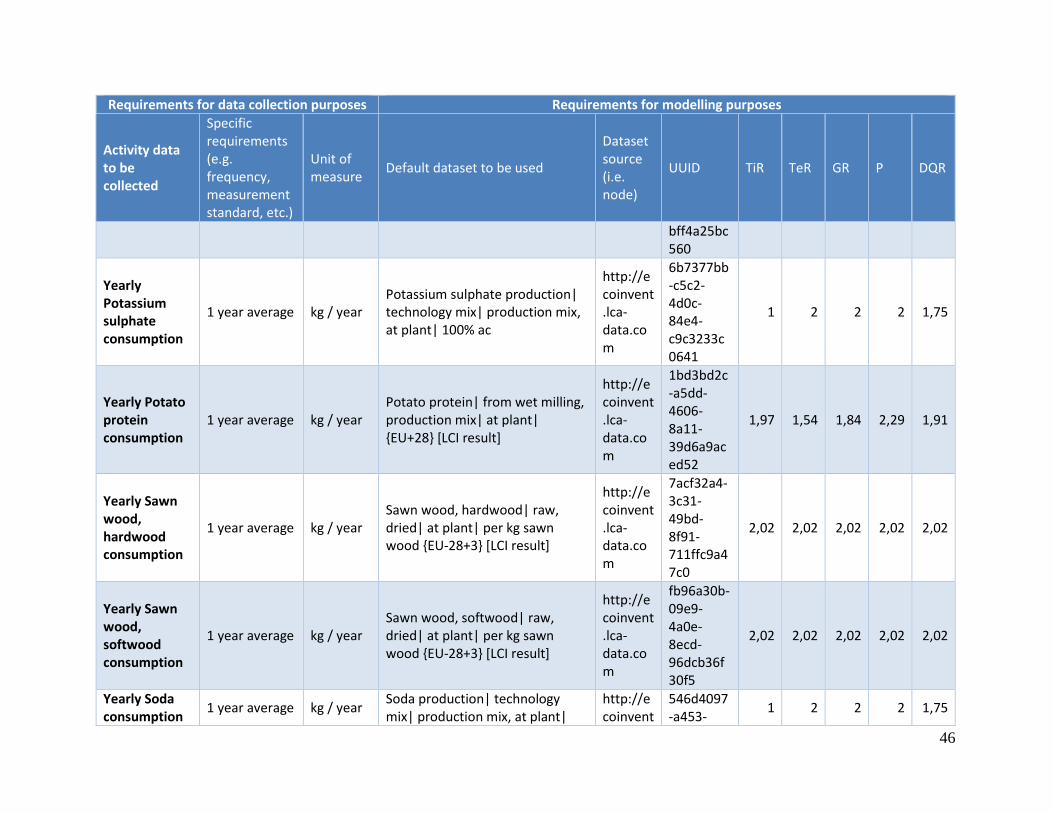
46
Requirements for data collection purposes Requirements for modelling purposes
Activity data to be collected
Specific requirements (e.g. frequency, measurement standard, etc.)
Unit of measure
Default dataset to be used
Dataset source (i.e. node)
UUID TiR TeR GR P DQR
bff4a25bc560
Yearly Potassium sulphate consumption
1 year average kg / year Potassium sulphate production| technology mix| production mix, at plant| 100% ac
http://ecoinvent.lca-data.com
6b7377bb-c5c2-4d0c-84e4-c9c3233c0641
1 2 2 2 1,75
Yearly Potato protein consumption
1 year average kg / year Potato protein| from wet milling, production mix| at plant| {EU+28} [LCI result]
http://ecoinvent.lca-data.com
1bd3bd2c-a5dd-4606-8a11-39d6a9aced52
1,97 1,54 1,84 2,29 1,91
Yearly Sawn wood, hardwood consumption
1 year average kg / year Sawn wood, hardwood| raw, dried| at plant| per kg sawn wood {EU-28+3} [LCI result]
http://ecoinvent.lca-data.com
7acf32a4-3c31-49bd-8f91-711ffc9a47c0
2,02 2,02 2,02 2,02 2,02
Yearly Sawn wood, softwood consumption
1 year average kg / year Sawn wood, softwood| raw, dried| at plant| per kg sawn wood {EU-28+3} [LCI result]
http://ecoinvent.lca-data.com
fb96a30b-09e9-4a0e-8ecd-96dcb36f30f5
2,02 2,02 2,02 2,02 2,02
Yearly Soda consumption
1 year average kg / year Soda production| technology mix| production mix, at plant|
http://ecoinvent
546d4097-a453-
1 2 2 2 1,75
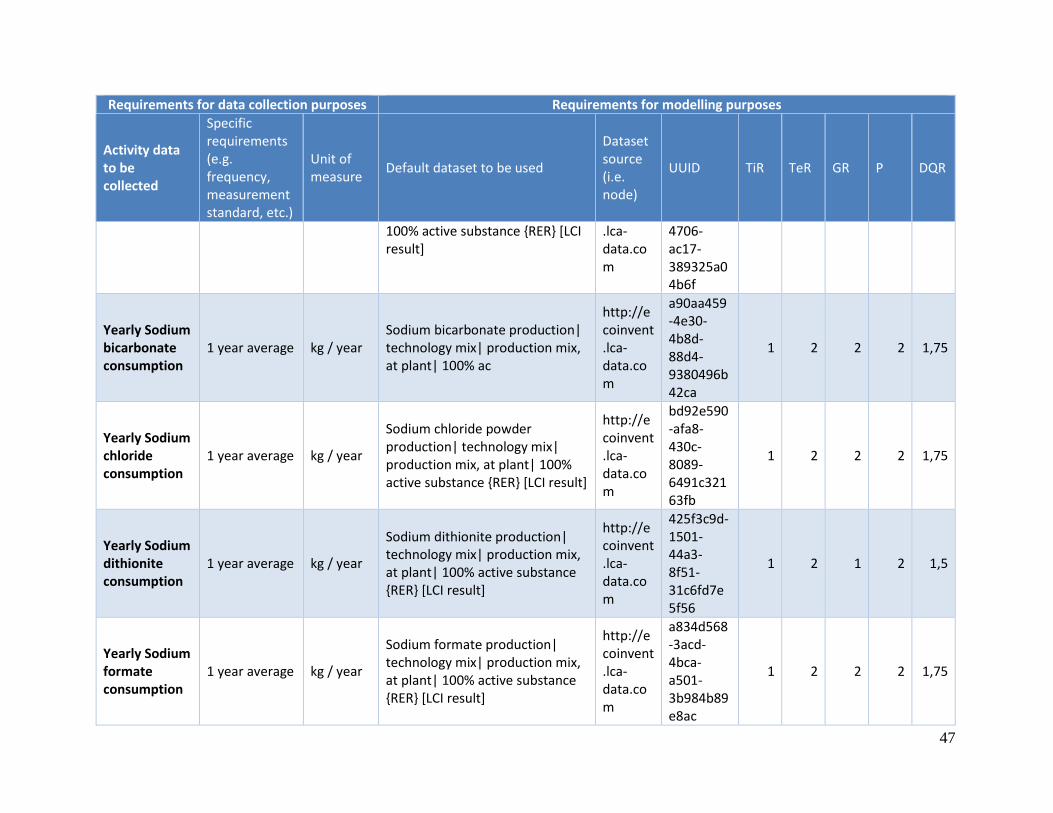
47
Requirements for data collection purposes Requirements for modelling purposes
Activity data to be collected
Specific requirements (e.g. frequency, measurement standard, etc.)
Unit of measure
Default dataset to be used
Dataset source (i.e. node)
UUID TiR TeR GR P DQR
100% active substance {RER} [LCI result]
.lca-data.com
4706-ac17-389325a04b6f
Yearly Sodium bicarbonate consumption
1 year average kg / year Sodium bicarbonate production| technology mix| production mix, at plant| 100% ac
http://ecoinvent.lca-data.com
a90aa459-4e30-4b8d-88d4-9380496b42ca
1 2 2 2 1,75
Yearly Sodium chloride consumption
1 year average kg / year
Sodium chloride powder production| technology mix| production mix, at plant| 100% active substance {RER} [LCI result]
http://ecoinvent.lca-data.com
bd92e590-afa8-430c-8089-6491c32163fb
1 2 2 2 1,75
Yearly Sodium dithionite consumption
1 year average kg / year
Sodium dithionite production| technology mix| production mix, at plant| 100% active substance {RER} [LCI result]
http://ecoinvent.lca-data.com
425f3c9d-1501-44a3-8f51-31c6fd7e5f56
1 2 1 2 1,5
Yearly Sodium formate consumption
1 year average kg / year
Sodium formate production| technology mix| production mix, at plant| 100% active substance {RER} [LCI result]
http://ecoinvent.lca-data.com
a834d568-3acd-4bca-a501-3b984b89e8ac
1 2 2 2 1,75
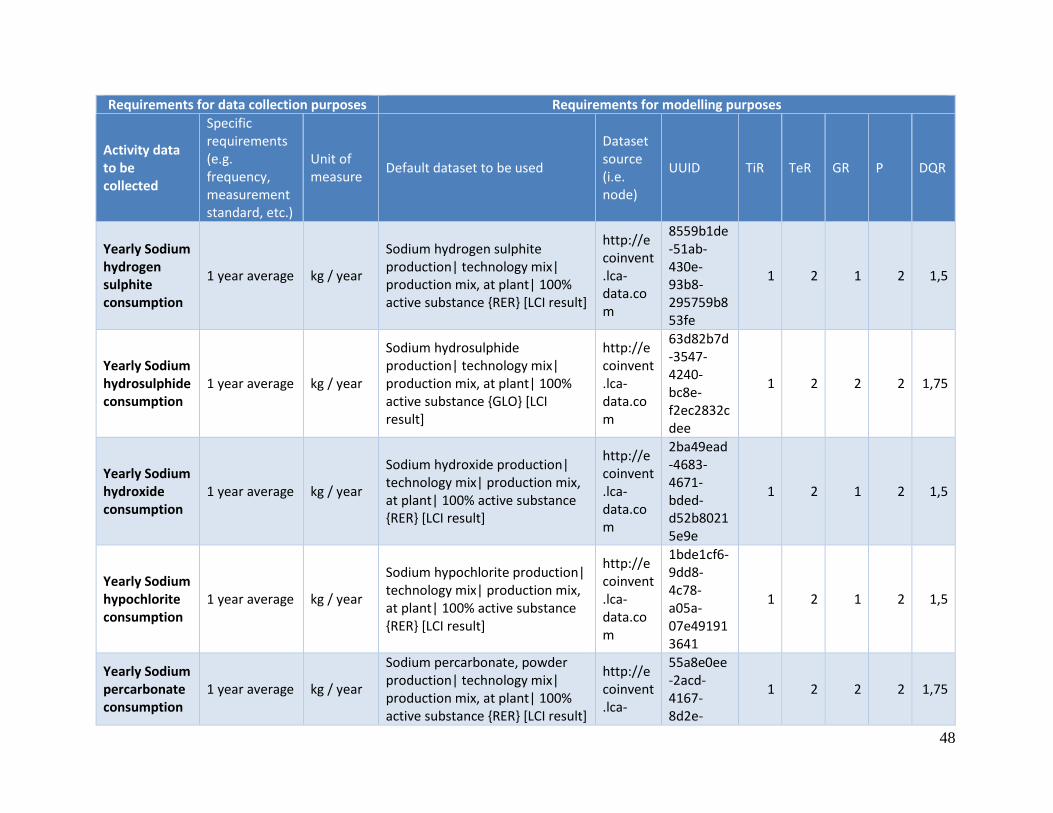
48
Requirements for data collection purposes Requirements for modelling purposes
Activity data to be collected
Specific requirements (e.g. frequency, measurement standard, etc.)
Unit of measure
Default dataset to be used
Dataset source (i.e. node)
UUID TiR TeR GR P DQR
Yearly Sodium hydrogen sulphite consumption
1 year average kg / year
Sodium hydrogen sulphite production| technology mix| production mix, at plant| 100% active substance {RER} [LCI result]
http://ecoinvent.lca-data.com
8559b1de-51ab-430e-93b8-295759b853fe
1 2 1 2 1,5
Yearly Sodium hydrosulphide consumption
1 year average kg / year
Sodium hydrosulphide production| technology mix| production mix, at plant| 100% active substance {GLO} [LCI result]
http://ecoinvent.lca-data.com
63d82b7d-3547-4240-bc8e-f2ec2832cdee
1 2 2 2 1,75
Yearly Sodium hydroxide consumption
1 year average kg / year
Sodium hydroxide production| technology mix| production mix, at plant| 100% active substance {RER} [LCI result]
http://ecoinvent.lca-data.com
2ba49ead-4683-4671-bded-d52b80215e9e
1 2 1 2 1,5
Yearly Sodium hypochlorite consumption
1 year average kg / year
Sodium hypochlorite production| technology mix| production mix, at plant| 100% active substance {RER} [LCI result]
http://ecoinvent.lca-data.com
1bde1cf6-9dd8-4c78-a05a-07e491913641
1 2 1 2 1,5
Yearly Sodium percarbonate consumption
1 year average kg / year
Sodium percarbonate, powder production| technology mix| production mix, at plant| 100% active substance {RER} [LCI result]
http://ecoinvent.lca-
55a8e0ee-2acd-4167-8d2e-
1 2 2 2 1,75
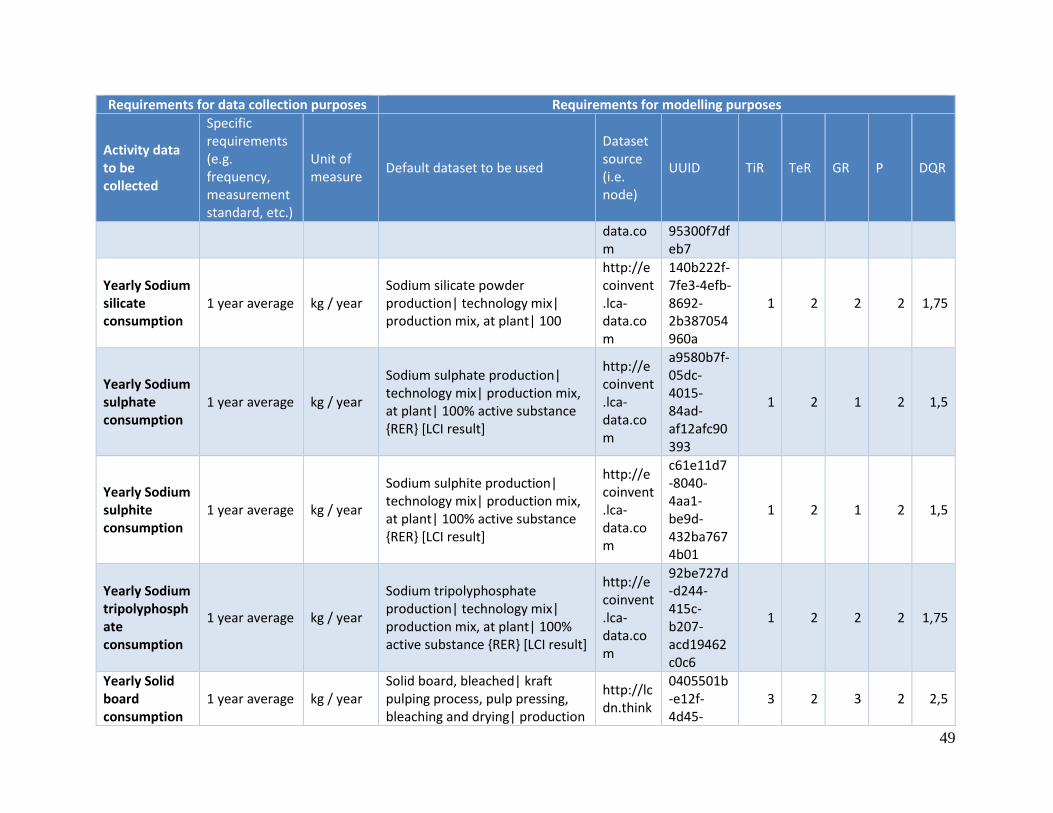
49
Requirements for data collection purposes Requirements for modelling purposes
Activity data to be collected
Specific requirements (e.g. frequency, measurement standard, etc.)
Unit of measure
Default dataset to be used
Dataset source (i.e. node)
UUID TiR TeR GR P DQR
data.com
95300f7dfeb7
Yearly Sodium silicate consumption
1 year average kg / year Sodium silicate powder production| technology mix| production mix, at plant| 100
http://ecoinvent.lca-data.com
140b222f-7fe3-4efb-8692-2b387054960a
1 2 2 2 1,75
Yearly Sodium sulphate consumption
1 year average kg / year
Sodium sulphate production| technology mix| production mix, at plant| 100% active substance {RER} [LCI result]
http://ecoinvent.lca-data.com
a9580b7f-05dc-4015-84ad-af12afc90393
1 2 1 2 1,5
Yearly Sodium sulphite consumption
1 year average kg / year
Sodium sulphite production| technology mix| production mix, at plant| 100% active substance {RER} [LCI result]
http://ecoinvent.lca-data.com
c61e11d7-8040-4aa1-be9d-432ba7674b01
1 2 1 2 1,5
Yearly Sodium tripolyphosphate consumption
1 year average kg / year
Sodium tripolyphosphate production| technology mix| production mix, at plant| 100% active substance {RER} [LCI result]
http://ecoinvent.lca-data.com
92be727d-d244-415c-b207-acd19462c0c6
1 2 2 2 1,75
Yearly Solid board consumption
1 year average kg / year Solid board, bleached| kraft pulping process, pulp pressing, bleaching and drying| production
http://lcdn.think
0405501b-e12f-4d45-
3 2 3 2 2,5
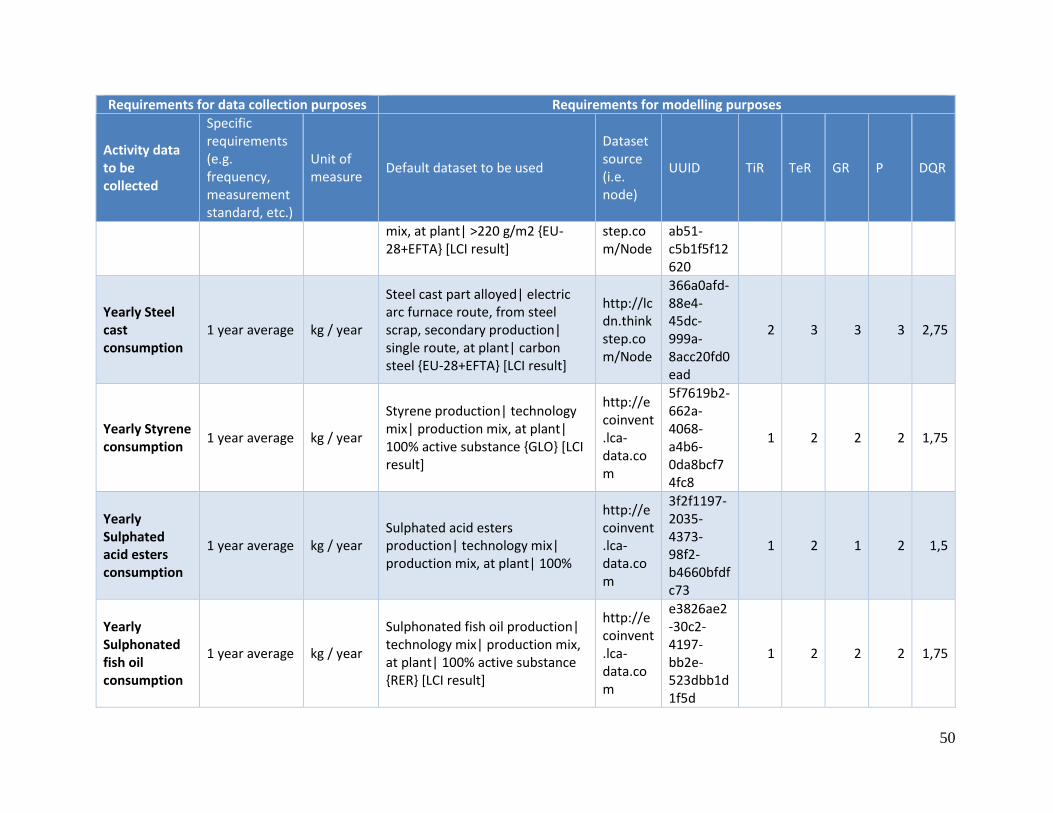
50
Requirements for data collection purposes Requirements for modelling purposes
Activity data to be collected
Specific requirements (e.g. frequency, measurement standard, etc.)
Unit of measure
Default dataset to be used
Dataset source (i.e. node)
UUID TiR TeR GR P DQR
mix, at plant| >220 g/m2 {EU-28+EFTA} [LCI result]
step.com/Node
ab51-c5b1f5f12620
Yearly Steel cast consumption
1 year average kg / year
Steel cast part alloyed| electric arc furnace route, from steel scrap, secondary production| single route, at plant| carbon steel {EU-28+EFTA} [LCI result]
http://lcdn.thinkstep.com/Node
366a0afd-88e4-45dc-999a-8acc20fd0ead
2 3 3 3 2,75
Yearly Styrene consumption
1 year average kg / year
Styrene production| technology mix| production mix, at plant| 100% active substance {GLO} [LCI result]
http://ecoinvent.lca-data.com
5f7619b2-662a-4068-a4b6-0da8bcf74fc8
1 2 2 2 1,75
Yearly Sulphated acid esters consumption
1 year average kg / year Sulphated acid esters production| technology mix| production mix, at plant| 100%
http://ecoinvent.lca-data.com
3f2f1197-2035-4373-98f2-b4660bfdfc73
1 2 1 2 1,5
Yearly Sulphonated fish oil consumption
1 year average kg / year
Sulphonated fish oil production| technology mix| production mix, at plant| 100% active substance {RER} [LCI result]
http://ecoinvent.lca-data.com
e3826ae2-30c2-4197-bb2e-523dbb1d1f5d
1 2 2 2 1,75
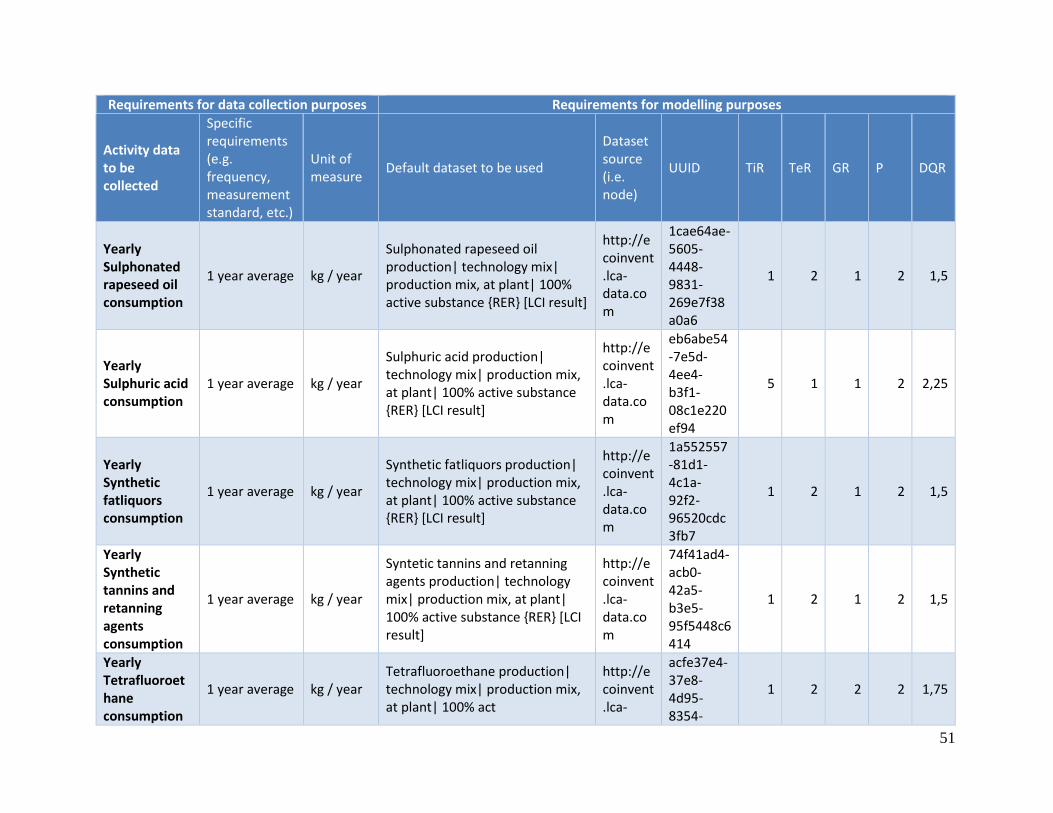
51
Requirements for data collection purposes Requirements for modelling purposes
Activity data to be collected
Specific requirements (e.g. frequency, measurement standard, etc.)
Unit of measure
Default dataset to be used
Dataset source (i.e. node)
UUID TiR TeR GR P DQR
Yearly Sulphonated rapeseed oil consumption
1 year average kg / year
Sulphonated rapeseed oil production| technology mix| production mix, at plant| 100% active substance {RER} [LCI result]
http://ecoinvent.lca-data.com
1cae64ae-5605-4448-9831-269e7f38a0a6
1 2 1 2 1,5
Yearly Sulphuric acid consumption
1 year average kg / year
Sulphuric acid production| technology mix| production mix, at plant| 100% active substance {RER} [LCI result]
http://ecoinvent.lca-data.com
eb6abe54-7e5d-4ee4-b3f1-08c1e220ef94
5 1 1 2 2,25
Yearly Synthetic fatliquors consumption
1 year average kg / year
Synthetic fatliquors production| technology mix| production mix, at plant| 100% active substance {RER} [LCI result]
http://ecoinvent.lca-data.com
1a552557-81d1-4c1a-92f2-96520cdc3fb7
1 2 1 2 1,5
Yearly Synthetic tannins and retanning agents consumption
1 year average kg / year
Syntetic tannins and retanning agents production| technology mix| production mix, at plant| 100% active substance {RER} [LCI result]
http://ecoinvent.lca-data.com
74f41ad4-acb0-42a5-b3e5-95f5448c6414
1 2 1 2 1,5
Yearly Tetrafluoroethane consumption
1 year average kg / year Tetrafluoroethane production| technology mix| production mix, at plant| 100% act
http://ecoinvent.lca-
acfe37e4-37e8-4d95-8354-
1 2 2 2 1,75
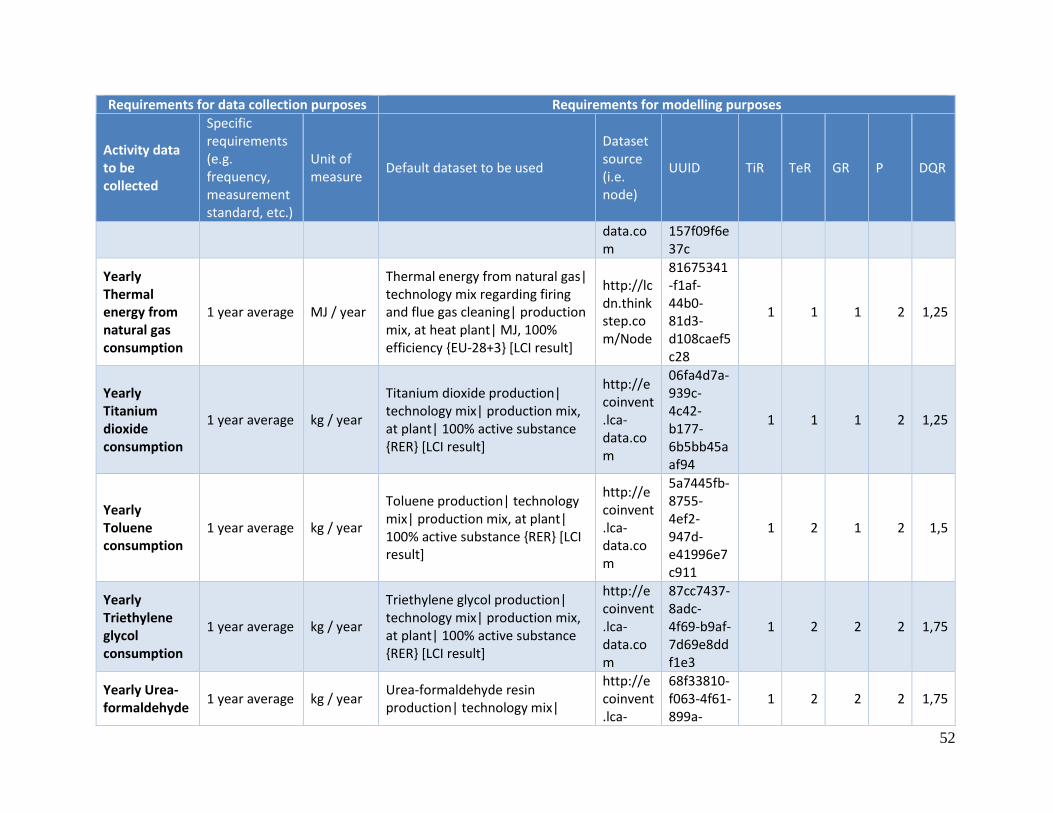
52
Requirements for data collection purposes Requirements for modelling purposes
Activity data to be collected
Specific requirements (e.g. frequency, measurement standard, etc.)
Unit of measure
Default dataset to be used
Dataset source (i.e. node)
UUID TiR TeR GR P DQR
data.com
157f09f6e37c
Yearly Thermal energy from natural gas consumption
1 year average MJ / year
Thermal energy from natural gas| technology mix regarding firing and flue gas cleaning| production mix, at heat plant| MJ, 100% efficiency {EU-28+3} [LCI result]
http://lcdn.thinkstep.com/Node
81675341-f1af-44b0-81d3-d108caef5c28
1 1 1 2 1,25
Yearly Titanium dioxide consumption
1 year average kg / year
Titanium dioxide production| technology mix| production mix, at plant| 100% active substance {RER} [LCI result]
http://ecoinvent.lca-data.com
06fa4d7a-939c-4c42-b177-6b5bb45aaf94
1 1 1 2 1,25
Yearly Toluene consumption
1 year average kg / year
Toluene production| technology mix| production mix, at plant| 100% active substance {RER} [LCI result]
http://ecoinvent.lca-data.com
5a7445fb-8755-4ef2-947d-e41996e7c911
1 2 1 2 1,5
Yearly Triethylene glycol consumption
1 year average kg / year
Triethylene glycol production| technology mix| production mix, at plant| 100% active substance {RER} [LCI result]
http://ecoinvent.lca-data.com
87cc7437-8adc-4f69-b9af-7d69e8ddf1e3
1 2 2 2 1,75
Yearly Urea-formaldehyde
1 year average kg / year Urea-formaldehyde resin production| technology mix|
http://ecoinvent.lca-
68f33810-f063-4f61-899a-
1 2 2 2 1,75
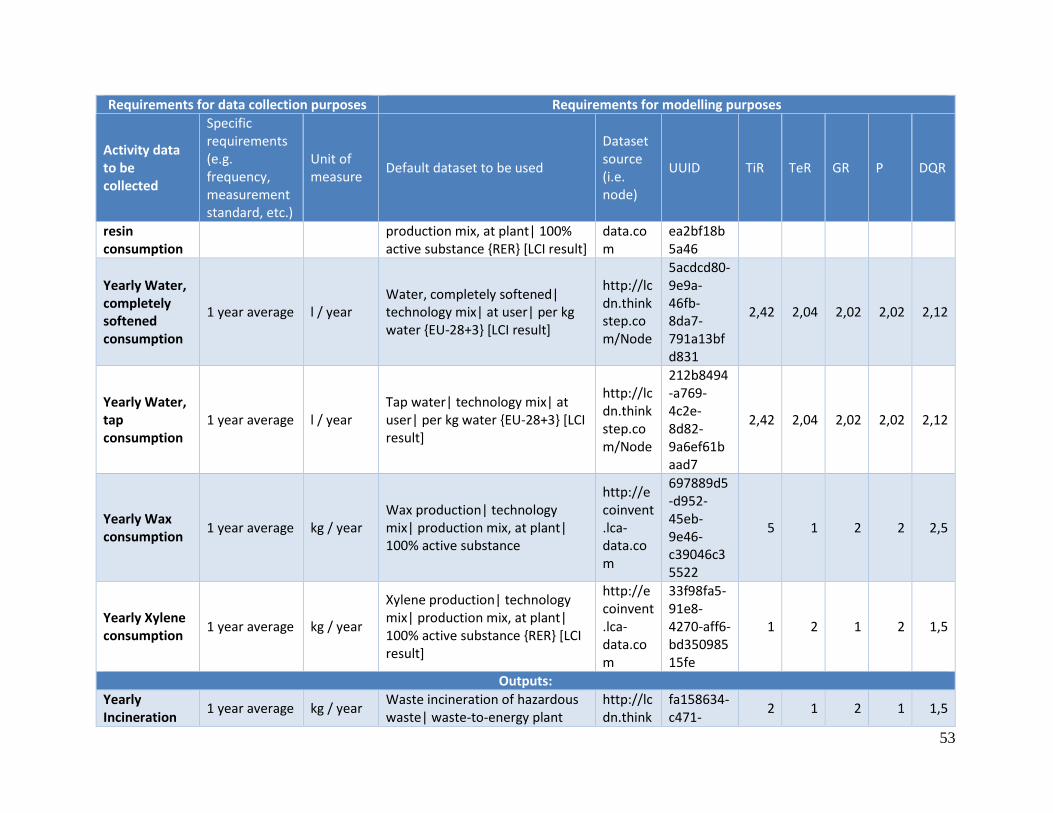
53
Requirements for data collection purposes Requirements for modelling purposes
Activity data to be collected
Specific requirements (e.g. frequency, measurement standard, etc.)
Unit of measure
Default dataset to be used
Dataset source (i.e. node)
UUID TiR TeR GR P DQR
resin consumption
production mix, at plant| 100% active substance {RER} [LCI result]
data.com
ea2bf18b5a46
Yearly Water, completely softened consumption
1 year average l / year Water, completely softened| technology mix| at user| per kg water {EU-28+3} [LCI result]
http://lcdn.thinkstep.com/Node
5acdcd80-9e9a-46fb-8da7-791a13bfd831
2,42 2,04 2,02 2,02 2,12
Yearly Water, tap consumption
1 year average l / year Tap water| technology mix| at user| per kg water {EU-28+3} [LCI result]
http://lcdn.thinkstep.com/Node
212b8494-a769-4c2e-8d82-9a6ef61baad7
2,42 2,04 2,02 2,02 2,12
Yearly Wax consumption
1 year average kg / year Wax production| technology mix| production mix, at plant| 100% active substance
http://ecoinvent.lca-data.com
697889d5-d952-45eb-9e46-c39046c35522
5 1 2 2 2,5
Yearly Xylene consumption
1 year average kg / year
Xylene production| technology mix| production mix, at plant| 100% active substance {RER} [LCI result]
http://ecoinvent.lca-data.com
33f98fa5-91e8-4270-aff6-bd35098515fe
1 2 1 2 1,5
Outputs:
Yearly Incineration
1 year average kg / year Waste incineration of hazardous waste| waste-to-energy plant
http://lcdn.think
fa158634-c471-
2 1 2 1 1,5
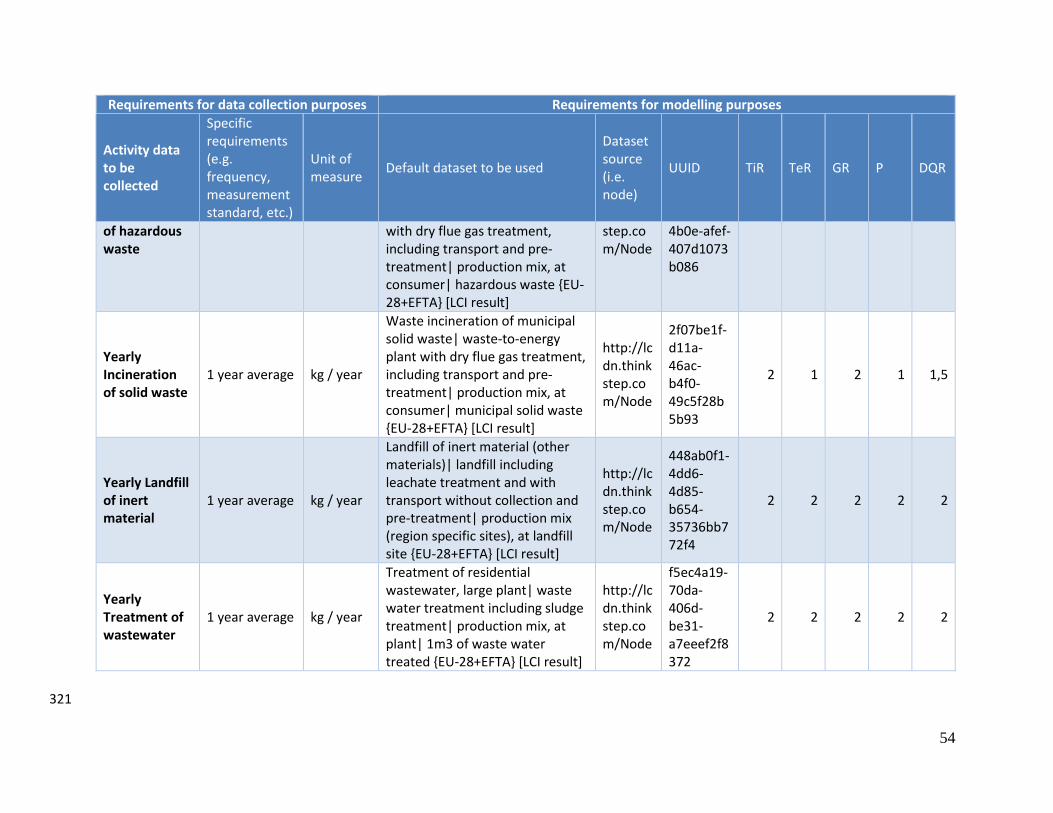
54
Requirements for data collection purposes Requirements for modelling purposes
Activity data to be collected
Specific requirements (e.g. frequency, measurement standard, etc.)
Unit of measure
Default dataset to be used
Dataset source (i.e. node)
UUID TiR TeR GR P DQR
of hazardous waste
with dry flue gas treatment, including transport and pre-treatment| production mix, at consumer| hazardous waste {EU-28+EFTA} [LCI result]
step.com/Node
4b0e-afef-407d1073b086
Yearly Incineration of solid waste
1 year average kg / year
Waste incineration of municipal solid waste| waste-to-energy plant with dry flue gas treatment, including transport and pre-treatment| production mix, at consumer| municipal solid waste {EU-28+EFTA} [LCI result]
http://lcdn.thinkstep.com/Node
2f07be1f-d11a-46ac-b4f0-49c5f28b5b93
2 1 2 1 1,5
Yearly Landfill of inert material
1 year average kg / year
Landfill of inert material (other materials)| landfill including leachate treatment and with transport without collection and pre-treatment| production mix (region specific sites), at landfill site {EU-28+EFTA} [LCI result]
http://lcdn.thinkstep.com/Node
448ab0f1-4dd6-4d85-b654-35736bb772f4
2 2 2 2 2
Yearly Treatment of wastewater
1 year average kg / year
Treatment of residential wastewater, large plant| waste water treatment including sludge treatment| production mix, at plant| 1m3 of waste water treated {EU-28+EFTA} [LCI result]
http://lcdn.thinkstep.com/Node
f5ec4a19-70da-406d-be31-a7eeef2f8372
2 2 2 2 2
321
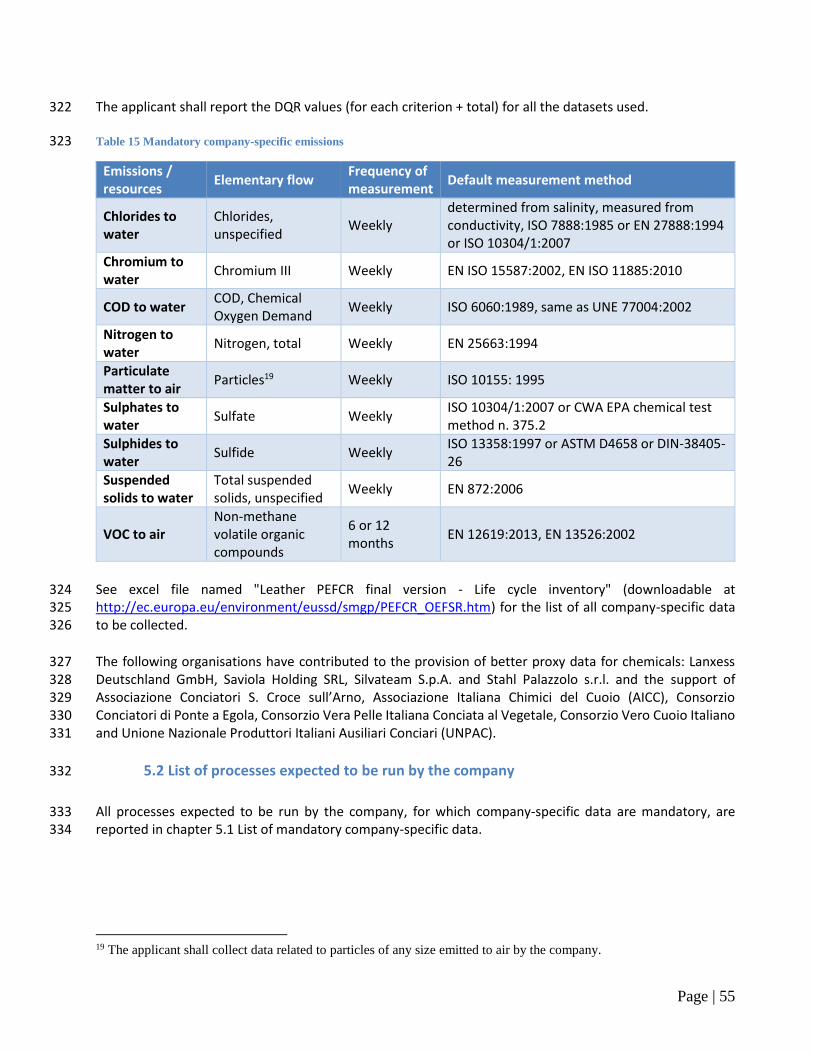
Page | 55
The applicant shall report the DQR values (for each criterion + total) for all the datasets used. 322
Table 15 Mandatory company-specific emissions 323
Emissions / resources
Elementary flow Frequency of measurement
Default measurement method
Chlorides to water
Chlorides, unspecified
Weekly determined from salinity, measured from conductivity, ISO 7888:1985 or EN 27888:1994 or ISO 10304/1:2007
Chromium to water
Chromium III Weekly EN ISO 15587:2002, EN ISO 11885:2010
COD to water COD, Chemical Oxygen Demand
Weekly ISO 6060:1989, same as UNE 77004:2002
Nitrogen to water
Nitrogen, total Weekly EN 25663:1994
Particulate matter to air
Particles19 Weekly ISO 10155: 1995
Sulphates to water
Sulfate Weekly ISO 10304/1:2007 or CWA EPA chemical test method n. 375.2
Sulphides to water
Sulfide Weekly ISO 13358:1997 or ASTM D4658 or DIN-38405-26
Suspended solids to water
Total suspended solids, unspecified
Weekly EN 872:2006
VOC to air Non-methane volatile organic compounds
6 or 12 months
EN 12619:2013, EN 13526:2002
See excel file named "Leather PEFCR final version - Life cycle inventory" (downloadable at 324 http://ec.europa.eu/environment/eussd/smgp/PEFCR_OEFSR.htm) for the list of all company-specific data 325 to be collected. 326
The following organisations have contributed to the provision of better proxy data for chemicals: Lanxess 327 Deutschland GmbH, Saviola Holding SRL, Silvateam S.p.A. and Stahl Palazzolo s.r.l. and the support of 328 Associazione Conciatori S. Croce sull’Arno, Associazione Italiana Chimici del Cuoio (AICC), Consorzio 329 Conciatori di Ponte a Egola, Consorzio Vera Pelle Italiana Conciata al Vegetale, Consorzio Vero Cuoio Italiano 330 and Unione Nazionale Produttori Italiani Ausiliari Conciari (UNPAC). 331
5.2 List of processes expected to be run by the company 332
All processes expected to be run by the company, for which company-specific data are mandatory, are 333 reported in chapter 5.1 List of mandatory company-specific data. 334
19 The applicant shall collect data related to particles of any size emitted to air by the company.
Page | 56
5.3 Data gaps 335
Unless primary data on chemicals production and animal farming of appropriate quality (as defined in the 336
PEF Recommendation) are made available from producers, to assure an appropriate overall quality of the 337
PEF study and the comparability of the results, default proxies as in ANNEX 7 – Default values shall be used. 338
In case a chemical is not included in ANNEX 7 – Default values, the following hierarchic approach shall be 339
followed to model it: 340
To use the same PEF-compliant datasets if available in a free or commercial source not part of a Life 341
Cycle Data Network node created in the context of the EF pilot phase LCI tendering process; 342
To use another PEF-compliant dataset existing either in one of the Life Cycle Data Network nodes 343
created in the context of the EF pilot phase LCI tendering process or in a free or commercial source 344
dataset and considered to be a good proxy for the missing dataset. 345
For background data that should be used for the upstream processes see chapter 6. 346
If primary data or most appropriate datasets are not available, default datasets reported in chapter 6 shall 347
be used. Any deviation shall be clearly reported in the PEF report and justified. 348
5.4 Data quality requirements 349
The data quality of each dataset and the total EF study shall be calculated and reported. The calculation of 350 the DQR shall be based on the following formula with 4 criteria: 351
DQR = TeR +GR +TiR +P
4 [Equation 1] 352
Where TeR is the Technological-Representativeness, GR is the Geographical-Representativeness, TiR is the 353 Time-Representativeness, and P is the Precision/uncertainty. The representativeness (technological, 354 geographical and time-related) characterises to what degree the processes and products selected are 355 depicting the system analysed, while the precision indicates the way the data is derived and related level of 356 uncertainty. 357
The next chapters provide tables with the criteria to be used for the semi-quantitative assessment of each 358 criterion. If a dataset is constructed with company-specific activity data, company -specific emission data and 359 secondary sub-processes, the DQR of each shall be assessed separately. 360
5.4.1 Company-specific datasets 361
The score of criterion P cannot be higher than 3 while the score for TiR, TeR, and GR cannot be higher than 362 2 (the DQR score shall be ≤1.6). The DQR shall be calculated at the level-1 disaggregation, before any 363 aggregation of sub-processes or elementary flows is performed. The DQR of company-specific datasets shall 364 be calculated as following: 365
Page | 57
1) Select the most relevant sub-processes and direct elementary flows that account for at least 80% of the 366 total environmental impact of the company-specific dataset, listing them from the most contributing to the 367 least contributing one. 368
2) Calculate the DQR criteria TeR, TiR, GR and P for each most relevant process and each most relevant direct 369 elementary flow. The values of each criterion shall be assigned based on Table 16. 370
2.a) Each most relevant elementary flow consists of the amount and elementary flow naming (e.g. 371 40 g carbon dioxide). For each most relevant elementary flow, evaluate the 4 DQR criteria named 372 TeR-EF, TiR-EF, GR-EF, PEF in NOTE: in case the newly developed dataset has most relevant processes filled 373 in by non-EF compliant datasets (and thus without DQR), then these datasets cannot be included in 374 step 4 and 5 of the DQR calculation. (1) The weight of step 3 shall be recalculated for the EF-compliant 375 datasets only. Calculate the environmental contribution of each most-relevant EF compliant process 376 and elementary flow to the total environmental impact of all most-relevant EF compliant processes 377 and elementary flows, in %. Continue with step 4 and 5. (2) The weight of the non-EF compliant 378 dataset (calculated in step 3) shall be used to increase the DQR criteria and total DQR accordingly. 379 For example: 380
Process 1 carries 30% of the total dataset environmental impact and is ILCD entry level compliant. 381 The contribution of this process to the total of 80% is 37.5% (the latter is the weight to be used). 382
Process 1 carries 50% of the total dataset environmental impact and is EF compliant. The 383 contribution of this process to all most-relevant EF compliant processes is 100%. The latter is the 384 weight to be used in step 4. 385
After step 5, the parameters TeR , GR
, TiR, P and the total DQR shall be multiplied with 1.375. 386
It shall be evaluated for example, the timing of the flow measured, for which technology the flow 387 was measured and in which geographical area. 388
2.b) Each most relevant process is a combination of activity data and the secondary dataset used. 389 For each most relevant process, the DQR is calculated by the applicant of the PEFCR as a combination 390 of the 4 DQR criteria for activity data and the secondary dataset: (i) TiR and P shall be evaluated at 391 the level of the activity data (named TiR-AD, PAD) and (ii) TeR, TiR and GR shall be evaluated at the level 392 of the secondary dataset used (named TeR-SD , TiR-SD and GR-SD). As TiR is evaluated twice, the 393 mathematical average of TiR-AD and TiR-SD represents the TiR of the most relevant process. 394
3) Calculate the environmental contribution of each most-relevant process and elementary flow to the total 395 environmental impact of all most-relevant processes and elementary flows, in % (weighted using 13 EF 396 impact categories, with the exclusion of the 3 toxicity-related ones). For example, the newly developed 397 dataset has only two most relevant processes, contributing in total to 80% of the total environmental impact 398 of the dataset: 399
Process 1 carries 30% of the total dataset environmental impact. The contribution of this process to 400 the total of 80% is 37.5% (the latter is the weight to be used). 401
Process 1 carries 50% of the total dataset environmental impact. The contribution of this process to 402 the total of 80% is 62.5% (the latter is the weight to be used). 403
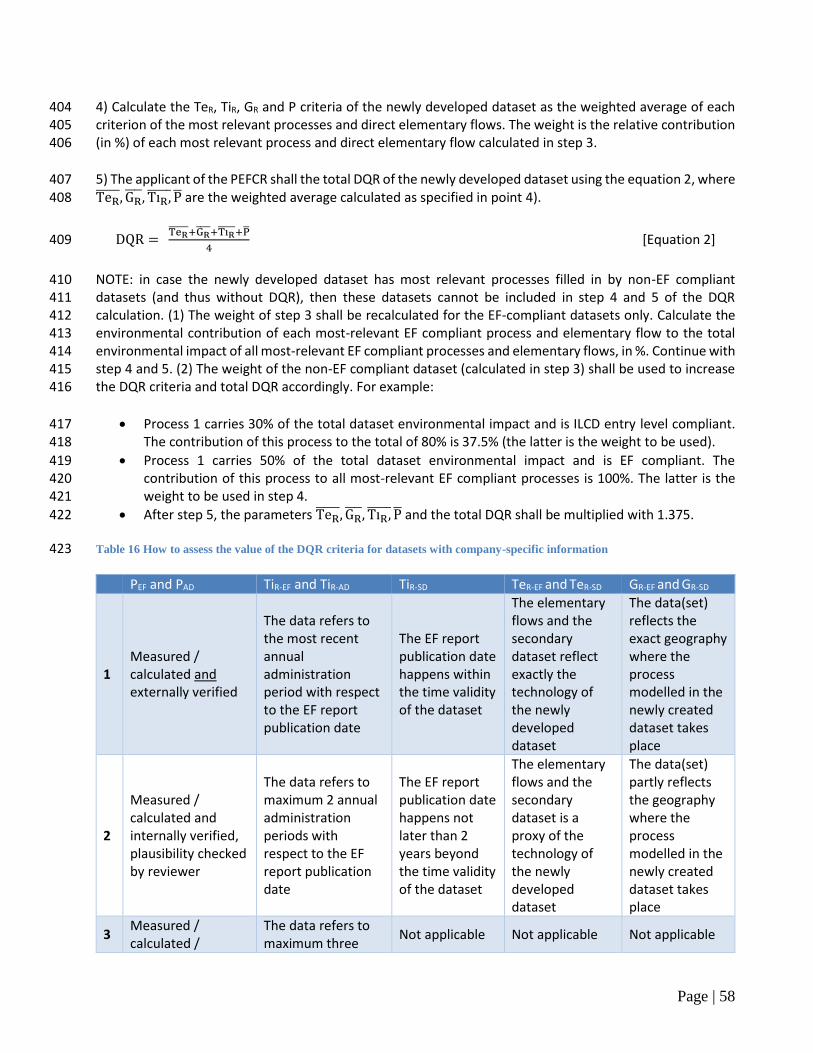
Page | 58
4) Calculate the TeR, TiR, GR and P criteria of the newly developed dataset as the weighted average of each 404 criterion of the most relevant processes and direct elementary flows. The weight is the relative contribution 405 (in %) of each most relevant process and direct elementary flow calculated in step 3. 406
5) The applicant of the PEFCR shall the total DQR of the newly developed dataset using the equation 2, where 407 TeR , GR
, TiR, P are the weighted average calculated as specified in point 4). 408
DQR = TeR +GR +TiR +P
4 [Equation 2] 409
NOTE: in case the newly developed dataset has most relevant processes filled in by non-EF compliant 410 datasets (and thus without DQR), then these datasets cannot be included in step 4 and 5 of the DQR 411 calculation. (1) The weight of step 3 shall be recalculated for the EF-compliant datasets only. Calculate the 412 environmental contribution of each most-relevant EF compliant process and elementary flow to the total 413 environmental impact of all most-relevant EF compliant processes and elementary flows, in %. Continue with 414 step 4 and 5. (2) The weight of the non-EF compliant dataset (calculated in step 3) shall be used to increase 415 the DQR criteria and total DQR accordingly. For example: 416
Process 1 carries 30% of the total dataset environmental impact and is ILCD entry level compliant. 417 The contribution of this process to the total of 80% is 37.5% (the latter is the weight to be used). 418
Process 1 carries 50% of the total dataset environmental impact and is EF compliant. The 419 contribution of this process to all most-relevant EF compliant processes is 100%. The latter is the 420 weight to be used in step 4. 421
After step 5, the parameters TeR , GR
, TiR, P and the total DQR shall be multiplied with 1.375. 422
Table 16 How to assess the value of the DQR criteria for datasets with company-specific information 423
PEF and PAD TiR-EF and TiR-AD TiR-SD TeR-EF and TeR-SD GR-EF and GR-SD
1 Measured / calculated and externally verified
The data refers to the most recent annual administration period with respect to the EF report publication date
The EF report publication date happens within the time validity of the dataset
The elementary flows and the secondary dataset reflect exactly the technology of the newly developed dataset
The data(set) reflects the exact geography where the process modelled in the newly created dataset takes place
2
Measured / calculated and internally verified, plausibility checked by reviewer
The data refers to maximum 2 annual administration periods with respect to the EF report publication date
The EF report publication date happens not later than 2 years beyond the time validity of the dataset
The elementary flows and the secondary dataset is a proxy of the technology of the newly developed dataset
The data(set) partly reflects the geography where the process modelled in the newly created dataset takes place
3 Measured / calculated /
The data refers to maximum three
Not applicable Not applicable Not applicable
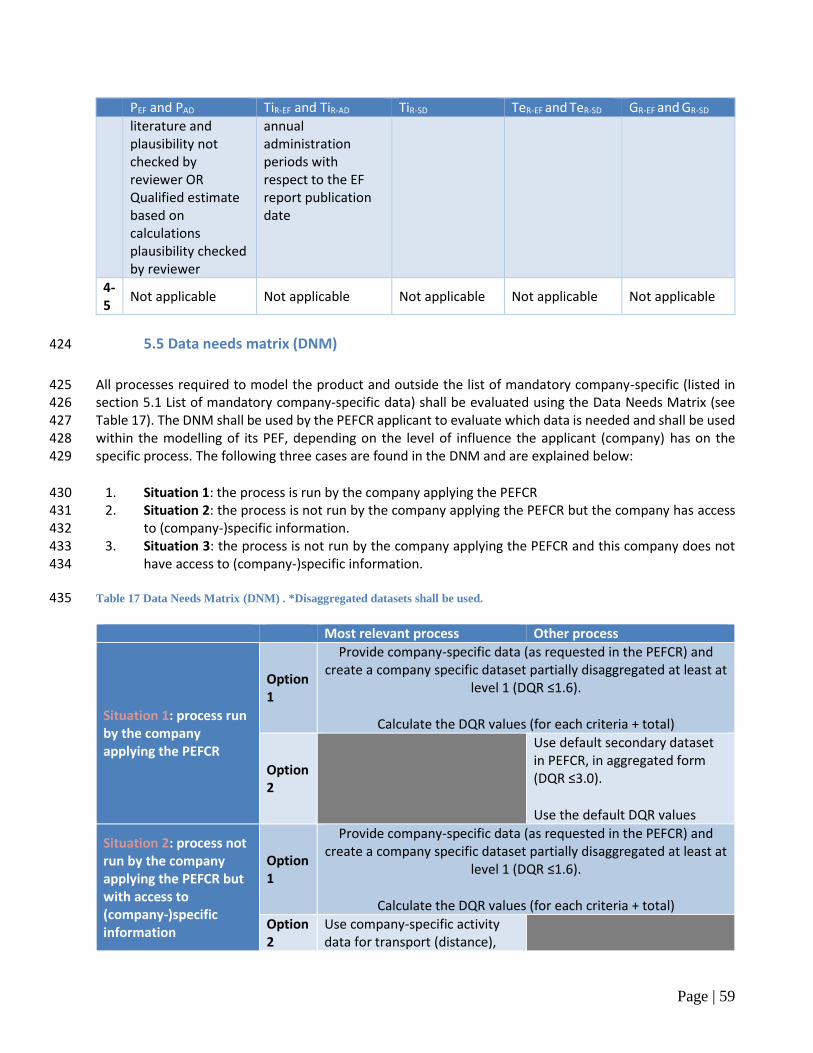
Page | 59
PEF and PAD TiR-EF and TiR-AD TiR-SD TeR-EF and TeR-SD GR-EF and GR-SD
literature and plausibility not checked by reviewer OR Qualified estimate based on calculations plausibility checked by reviewer
annual administration periods with respect to the EF report publication date
4-5
Not applicable Not applicable Not applicable Not applicable Not applicable
5.5 Data needs matrix (DNM) 424
All processes required to model the product and outside the list of mandatory company-specific (listed in 425 section 5.1 List of mandatory company-specific data) shall be evaluated using the Data Needs Matrix (see 426 Table 17). The DNM shall be used by the PEFCR applicant to evaluate which data is needed and shall be used 427 within the modelling of its PEF, depending on the level of influence the applicant (company) has on the 428 specific process. The following three cases are found in the DNM and are explained below: 429
1. Situation 1: the process is run by the company applying the PEFCR 430 2. Situation 2: the process is not run by the company applying the PEFCR but the company has access 431
to (company-)specific information. 432 3. Situation 3: the process is not run by the company applying the PEFCR and this company does not 433
have access to (company-)specific information. 434
Table 17 Data Needs Matrix (DNM) . *Disaggregated datasets shall be used. 435
Most relevant process Other process
Situation 1: process run by the company applying the PEFCR
Option 1
Provide company-specific data (as requested in the PEFCR) and create a company specific dataset partially disaggregated at least at
level 1 (DQR ≤1.6).
Calculate the DQR values (for each criteria + total)
Option 2
Use default secondary dataset in PEFCR, in aggregated form (DQR ≤3.0).
Use the default DQR values
Situation 2: process not run by the company applying the PEFCR but with access to (company-)specific information
Option 1
Provide company-specific data (as requested in the PEFCR) and create a company specific dataset partially disaggregated at least at
level 1 (DQR ≤1.6).
Calculate the DQR values (for each criteria + total)
Option 2
Use company-specific activity data for transport (distance),
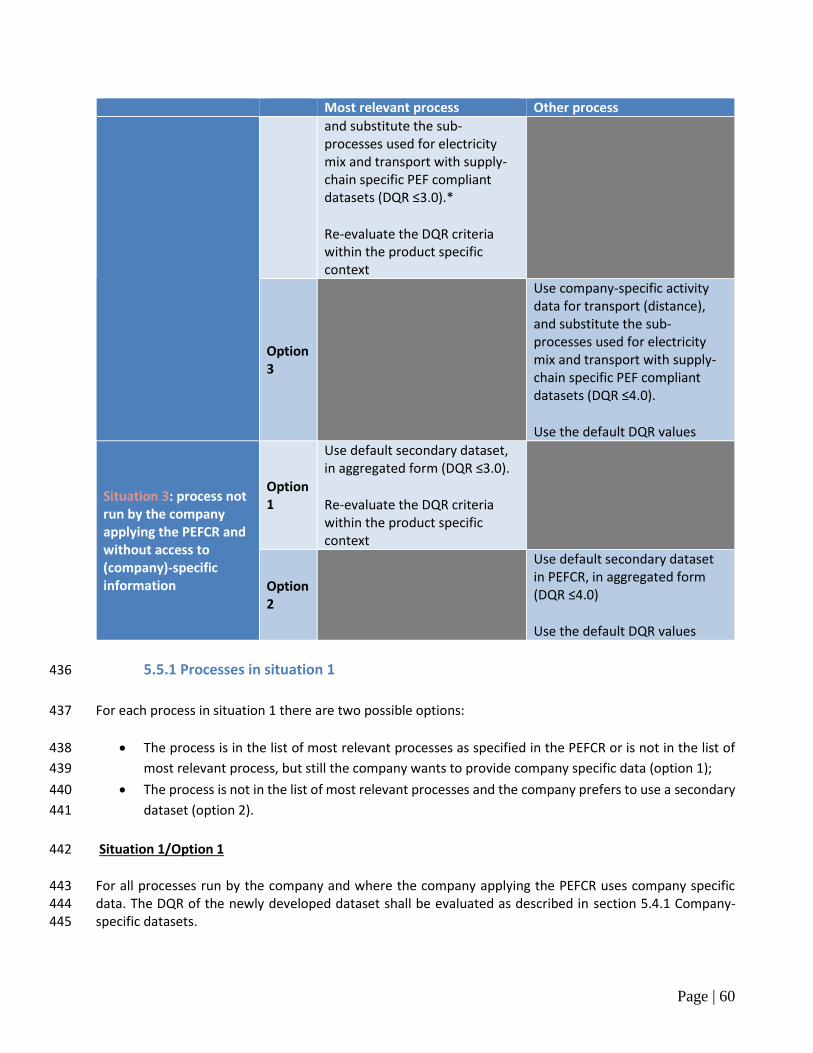
Page | 60
Most relevant process Other process
and substitute the sub-processes used for electricity mix and transport with supply-chain specific PEF compliant datasets (DQR ≤3.0).*
Re-evaluate the DQR criteria within the product specific context
Option 3
Use company-specific activity data for transport (distance), and substitute the sub-processes used for electricity mix and transport with supply-chain specific PEF compliant datasets (DQR ≤4.0).
Use the default DQR values
Situation 3: process not run by the company applying the PEFCR and without access to (company)-specific information
Option 1
Use default secondary dataset, in aggregated form (DQR ≤3.0).
Re-evaluate the DQR criteria within the product specific context
Option 2
Use default secondary dataset in PEFCR, in aggregated form (DQR ≤4.0)
Use the default DQR values
5.5.1 Processes in situation 1 436
For each process in situation 1 there are two possible options: 437
The process is in the list of most relevant processes as specified in the PEFCR or is not in the list of 438
most relevant process, but still the company wants to provide company specific data (option 1); 439
The process is not in the list of most relevant processes and the company prefers to use a secondary 440
dataset (option 2). 441
Situation 1/Option 1 442
For all processes run by the company and where the company applying the PEFCR uses company specific 443 data. The DQR of the newly developed dataset shall be evaluated as described in section 5.4.1 Company-444 specific datasets. 445
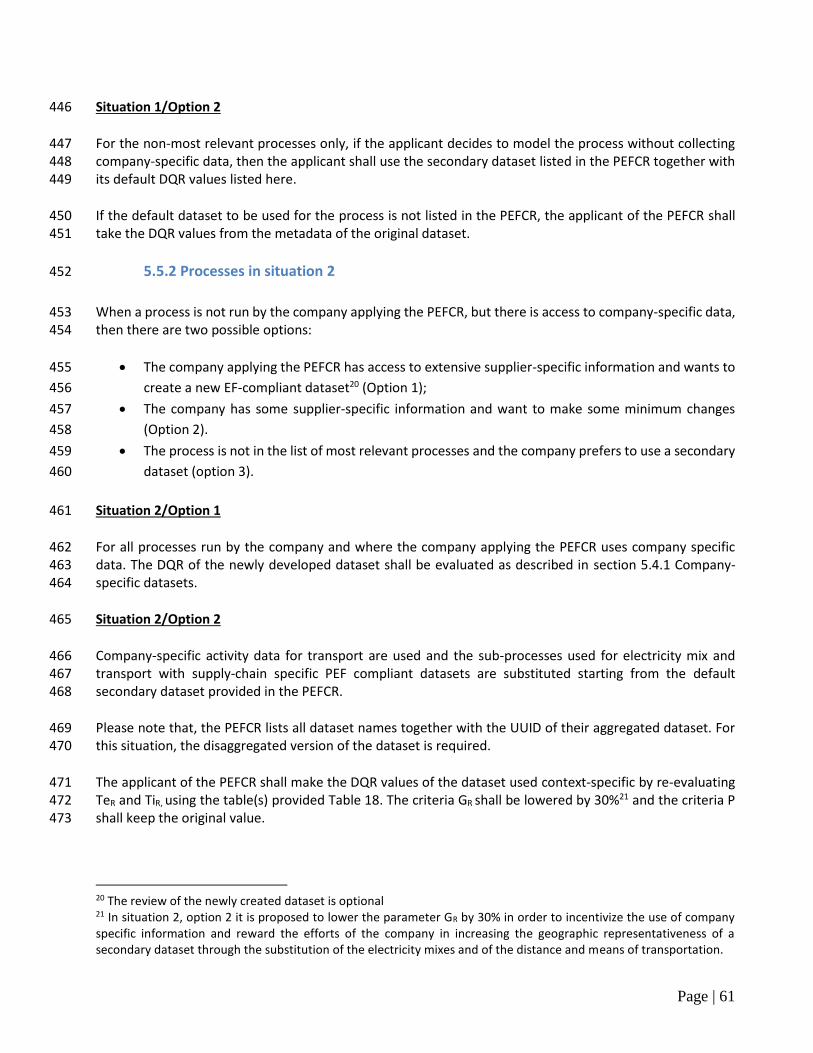
Page | 61
Situation 1/Option 2 446
For the non-most relevant processes only, if the applicant decides to model the process without collecting 447 company-specific data, then the applicant shall use the secondary dataset listed in the PEFCR together with 448 its default DQR values listed here. 449
If the default dataset to be used for the process is not listed in the PEFCR, the applicant of the PEFCR shall 450 take the DQR values from the metadata of the original dataset. 451
5.5.2 Processes in situation 2 452
When a process is not run by the company applying the PEFCR, but there is access to company-specific data, 453 then there are two possible options: 454
The company applying the PEFCR has access to extensive supplier-specific information and wants to 455
create a new EF-compliant dataset20 (Option 1); 456
The company has some supplier-specific information and want to make some minimum changes 457
(Option 2). 458
The process is not in the list of most relevant processes and the company prefers to use a secondary 459
dataset (option 3). 460
Situation 2/Option 1 461
For all processes run by the company and where the company applying the PEFCR uses company specific 462 data. The DQR of the newly developed dataset shall be evaluated as described in section 5.4.1 Company-463 specific datasets. 464
Situation 2/Option 2 465
Company-specific activity data for transport are used and the sub-processes used for electricity mix and 466 transport with supply-chain specific PEF compliant datasets are substituted starting from the default 467 secondary dataset provided in the PEFCR. 468
Please note that, the PEFCR lists all dataset names together with the UUID of their aggregated dataset. For 469 this situation, the disaggregated version of the dataset is required. 470
The applicant of the PEFCR shall make the DQR values of the dataset used context-specific by re-evaluating 471 TeR and TiR, using the table(s) provided Table 18. The criteria GR shall be lowered by 30%21 and the criteria P 472 shall keep the original value. 473
20 The review of the newly created dataset is optional 21 In situation 2, option 2 it is proposed to lower the parameter GR by 30% in order to incentivize the use of company specific information and reward the efforts of the company in increasing the geographic representativeness of a secondary dataset through the substitution of the electricity mixes and of the distance and means of transportation.
Page | 62
Situation 2/Option 3 474
For the non-most relevant processes, the applicant may use the corresponding secondary dataset listed in 475 the PEFCR together with its DQR values. 476
If the default dataset to be used for the process is not listed in the PEFCR, the applicant of the PEFCR shall 477 take the DQR values from the original dataset. 478
Table 18 How to assess the value of the DQR criteria when secondary datasets are used. 479
TiR TeR GR
1 The EF report publication date happens within the time validity of the dataset
The technology used in the EF study is exactly the same as the one in scope of the dataset
The process modelled in the EF study takes place in the country the dataset is valid for
2
The EF report publication date happens not later than 2 years beyond the time validity of the dataset
The technologies used in the EF study is included in the mix of technologies in scope of the dataset
The process modelled in the EF study takes place in the geographical region (e.g. Europe) the dataset is valid for
3
The EF report publication date happens not later than 4 years beyond the time validity of the dataset
The technologies used in the EF study are only partly included in the scope of the dataset
The process modelled in the EF study takes place in one of the geographical regions the dataset is valid for
4
The EF report publication date happens not later than 6 years beyond the time validity of the dataset
The technologies used in the EF study are similar to those included in the scope of the dataset
The process modelled in the EF study takes place in a country that is not included in the geographical region(s) the dataset is valid for, but sufficient similarities are estimated based on expert judgement.
5
The EF report publication date happens later than 6 years after the time validity of the dataset
The technologies used in the EF study are different from those included in the scope of the dataset
The process modelled in the EF study takes place in a different country than the one the dataset is valid for
5.5.3 Processes in situation 3 480
When a process is not run by the company applying the PEFCR and the company does not have access to 481 company-specific data, there are two possible options: 482
It is in the list of most relevant processes (situation 3, option 1) 483
It is not in the list of most relevant processes (situation 3, option 2) 484
Situation 3/Option 1 485
In this case, the applicant of the PEFCR shall make the DQR values of the dataset used context-specific by re-486 evaluating TeR, TiR and Gr , using the table(s) provided. The criteria P shall keep the original value. 487
Page | 63
Situation 3/Option 2 488
For the non-most relevant processes, the applicant shall use the corresponding secondary dataset listed in 489 the PEFCR together with its DQR values. 490
If the default dataset to be used for the process is not listed in the PEFCR, the applicant of the PEFCR shall 491 take the DQR values from the original dataset. 492
5.6 Which datasets to use? 493
The secondary datasets to be used by the applicant are those listed in this PEFCR. Whenever a dataset 494 needed to calculate the PEF-profile is not among those listed in this PEFCR, then the applicant shall choose 495 between the following options (in hierarchical order): 496
Use an EF-compliant dataset available on one of the following nodes: 497
o http://eplca.jrc.ec.europa.eu/EF-node 498
o http://lcdn.blonkconsultants.nl 499
o http://ecoinvent.lca-data.com 500
o http://lcdn-cepe.org 501
o https://lcdn.quantis-software.com/PEF/ 502
o http://lcdn.thinkstep.com/Node 503
Use an EF-compliant dataset available in a free or commercial source; 504
Use another EF-compliant dataset considered to be a good proxy. In such case this information shall 505
be included in the "limitation" section of the PEF report. 506
Use an ILCD-entry level-compliant dataset that has been modelled according to the modelling 507
requirements included in the Guidance version 6.3. In such case this information shall be included in 508
the "limitations" section of the PEF report. 509
Use an ILCD-entry level-compliant dataset. In such case this information shall be included in the "data 510
gap" section of the PEF report. 511
5.7 How to calculate the average DQR of the study 512
In order to calculate the average DQR of the EF study, the applicant shall calculate separately the TeR, TiR, 513 GR and P for the EF study as the weighted average of all most relevant processes, based on their relative 514 environmental contribution to the total single score (excluding the 3 toxicity-related ones). The calculation 515 rules explained in 5.4 Data quality requirements shall be used. 516
5.8 Allocation rules 517
The leather life cycle, as it results from the allocation rules specifically set up for this product category in the 518 PEFCR Guidance version 6.3, includes upstream phases of livestock breeding and slaughter. Therefore, in the 519 leather life cycle, multi-functionality occurs at different life cycle stages: 520
At the farming level, where meat and milk are produced; 521
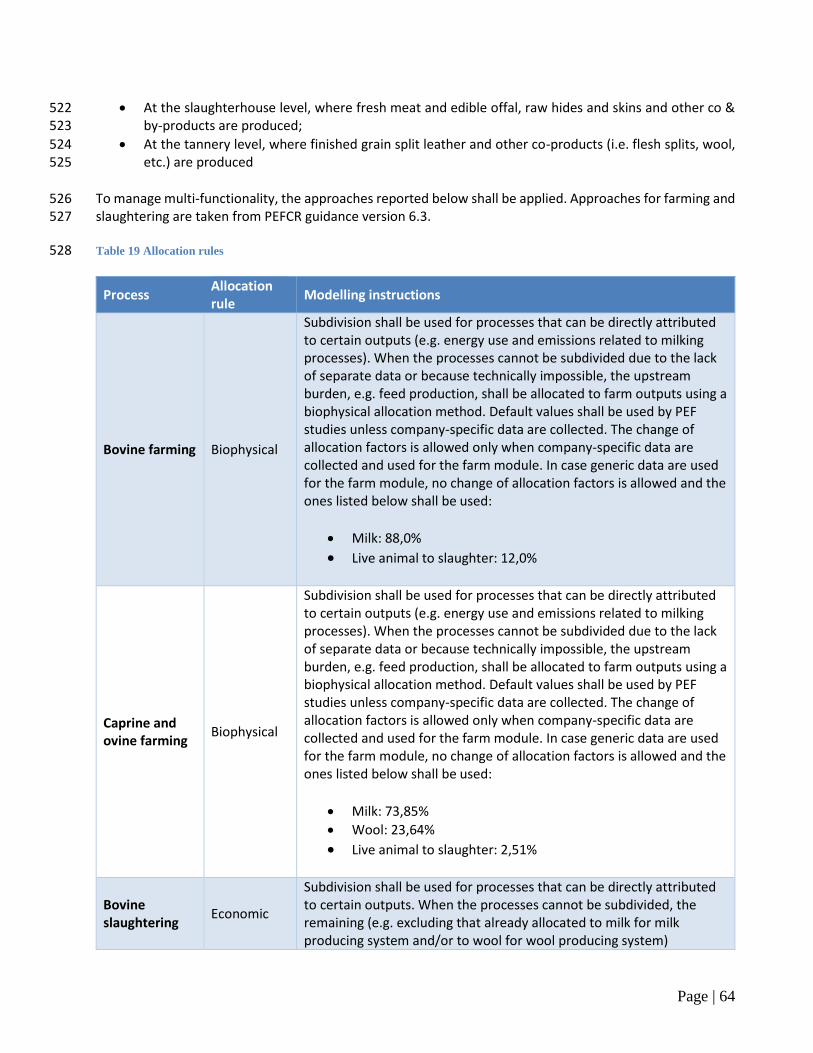
Page | 64
At the slaughterhouse level, where fresh meat and edible offal, raw hides and skins and other co & 522 by-products are produced; 523
At the tannery level, where finished grain split leather and other co-products (i.e. flesh splits, wool, 524 etc.) are produced 525
To manage multi-functionality, the approaches reported below shall be applied. Approaches for farming and 526 slaughtering are taken from PEFCR guidance version 6.3. 527
Table 19 Allocation rules 528
Process Allocation rule
Modelling instructions
Bovine farming Biophysical
Subdivision shall be used for processes that can be directly attributed to certain outputs (e.g. energy use and emissions related to milking processes). When the processes cannot be subdivided due to the lack of separate data or because technically impossible, the upstream burden, e.g. feed production, shall be allocated to farm outputs using a biophysical allocation method. Default values shall be used by PEF studies unless company-specific data are collected. The change of allocation factors is allowed only when company-specific data are collected and used for the farm module. In case generic data are used for the farm module, no change of allocation factors is allowed and the ones listed below shall be used:
Milk: 88,0%
Live animal to slaughter: 12,0%
Caprine and ovine farming
Biophysical
Subdivision shall be used for processes that can be directly attributed to certain outputs (e.g. energy use and emissions related to milking processes). When the processes cannot be subdivided due to the lack of separate data or because technically impossible, the upstream burden, e.g. feed production, shall be allocated to farm outputs using a biophysical allocation method. Default values shall be used by PEF studies unless company-specific data are collected. The change of allocation factors is allowed only when company-specific data are collected and used for the farm module. In case generic data are used for the farm module, no change of allocation factors is allowed and the ones listed below shall be used:
Milk: 73,85%
Wool: 23,64%
Live animal to slaughter: 2,51%
Bovine slaughtering
Economic
Subdivision shall be used for processes that can be directly attributed to certain outputs. When the processes cannot be subdivided, the remaining (e.g. excluding that already allocated to milk for milk producing system and/or to wool for wool producing system)
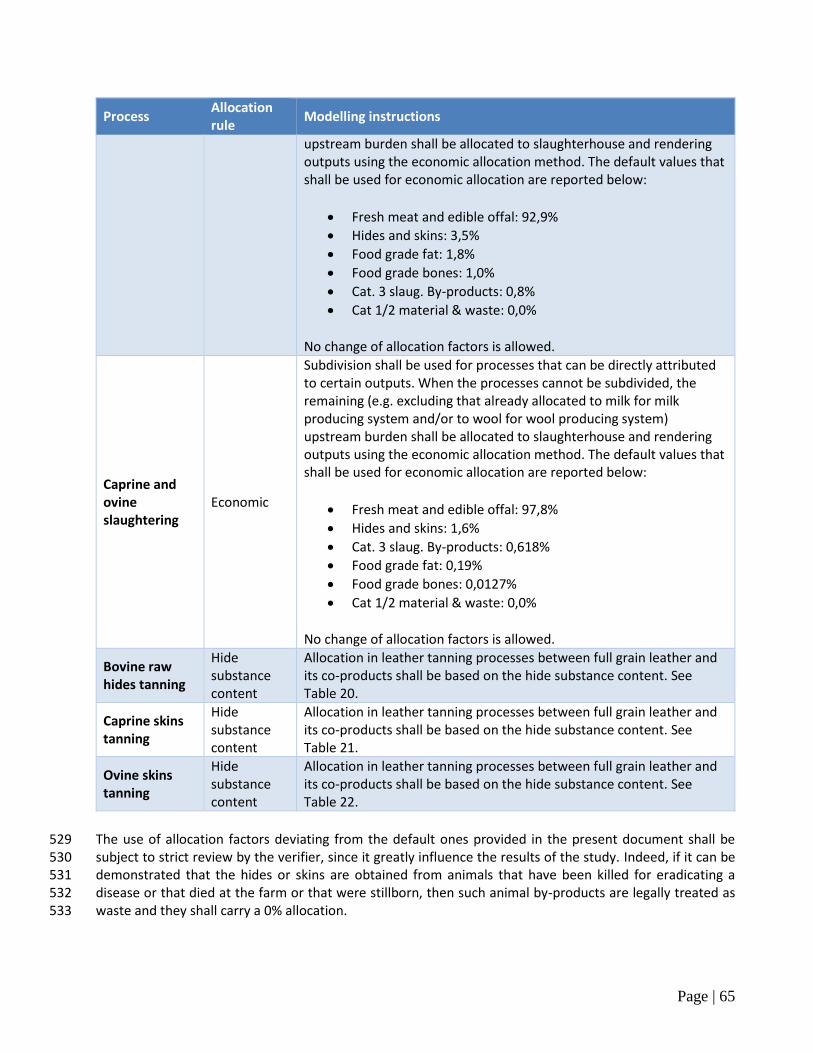
Page | 65
Process Allocation rule
Modelling instructions
upstream burden shall be allocated to slaughterhouse and rendering outputs using the economic allocation method. The default values that shall be used for economic allocation are reported below:
Fresh meat and edible offal: 92,9%
Hides and skins: 3,5%
Food grade fat: 1,8%
Food grade bones: 1,0%
Cat. 3 slaug. By-products: 0,8%
Cat 1/2 material & waste: 0,0%
No change of allocation factors is allowed.
Caprine and ovine slaughtering
Economic
Subdivision shall be used for processes that can be directly attributed to certain outputs. When the processes cannot be subdivided, the remaining (e.g. excluding that already allocated to milk for milk producing system and/or to wool for wool producing system) upstream burden shall be allocated to slaughterhouse and rendering outputs using the economic allocation method. The default values that shall be used for economic allocation are reported below:
Fresh meat and edible offal: 97,8%
Hides and skins: 1,6%
Cat. 3 slaug. By-products: 0,618%
Food grade fat: 0,19%
Food grade bones: 0,0127%
Cat 1/2 material & waste: 0,0%
No change of allocation factors is allowed.
Bovine raw hides tanning
Hide substance content
Allocation in leather tanning processes between full grain leather and its co-products shall be based on the hide substance content. See Table 20.
Caprine skins tanning
Hide substance content
Allocation in leather tanning processes between full grain leather and its co-products shall be based on the hide substance content. See Table 21.
Ovine skins tanning
Hide substance content
Allocation in leather tanning processes between full grain leather and its co-products shall be based on the hide substance content. See Table 22.
The use of allocation factors deviating from the default ones provided in the present document shall be 529 subject to strict review by the verifier, since it greatly influence the results of the study. Indeed, if it can be 530 demonstrated that the hides or skins are obtained from animals that have been killed for eradicating a 531 disease or that died at the farm or that were stillborn, then such animal by-products are legally treated as 532 waste and they shall carry a 0% allocation. 533
Page | 66
The calculation of simplified sets of average and approximate allocation factors was carried out on the basis 534 of the mass balance of the biogenic and bio-based Protein-Nitrogen content (g-N or %) Hide Substance) in 535 the co-products (grain and flesh/middle splits), as well as by-products (hair or wool recovered) and residues 536 (bio-solids and solid waste) generated during the transformation of input processing materials to finished 537 leather and Tannery effluent treatment, respectively. 538
The quantities of co-products, by-products and waste can vary significantly as a function of specific input 539 material, output leather article and tannery. The thickness of the output pelts and leathers can result in 540 significant variations of allocated hide substance content. 541
Allocation factors are reported in the following tables. 542
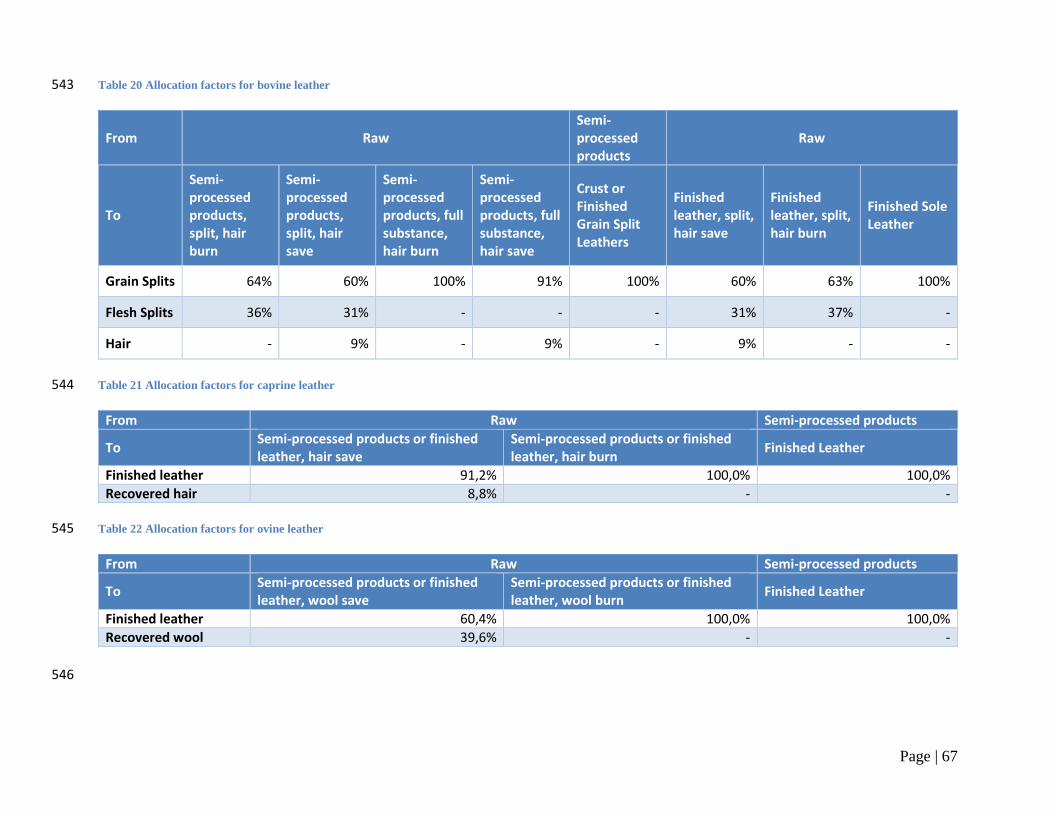
Page | 67
Table 20 Allocation factors for bovine leather 543
From Raw Semi-processed products
Raw
To
Semi-processed products, split, hair burn
Semi-processed products, split, hair save
Semi-processed products, full substance, hair burn
Semi-processed products, full substance, hair save
Crust or Finished Grain Split Leathers
Finished leather, split, hair save
Finished leather, split, hair burn
Finished Sole Leather
Grain Splits 64% 60% 100% 91% 100% 60% 63% 100%
Flesh Splits 36% 31% - - - 31% 37% -
Hair - 9% - 9% - 9% - -
Table 21 Allocation factors for caprine leather 544
From Raw Semi-processed products
To Semi-processed products or finished leather, hair save
Semi-processed products or finished leather, hair burn
Finished Leather
Finished leather 91,2% 100,0% 100,0%
Recovered hair 8,8% - -
Table 22 Allocation factors for ovine leather 545
From Raw Semi-processed products
To Semi-processed products or finished leather, wool save
Semi-processed products or finished leather, wool burn
Finished Leather
Finished leather 60,4% 100,0% 100,0%
Recovered wool 39,6% - -
546
Page | 68
The allocation factors proposed represent the percentages of total tanning impact that go to finished grain 547 split leather and to recoverable losses. 548
The Circular Footprint formula shall be applied to all wastes deriving from the tanning processes. 549
5.9 Electricity modelling 550
The guidelines in this section shall only be used for the processes where company-specific information is 551 collected (situation 1 / Option 1 & 2 / Option 1of the DNM). 552
In PEF studies the following electricity mix shall be used in hierarchical order: 553
(i) Supplier-specific electricity product shall be used if: 554 (a) Available, and 555 (b) The set of minimum criteria to ensure the contractual instruments are reliable is 556
met. 557 (ii) The supplier-specific total electricity mix shall be used if: 558
(a) Available, and 559 (b) The set of minimum criteria to ensure the contractual instruments are reliable 560
is met. 561 (iii) As a last option the 'country-specific residual grid mix, consumption mix' shall be used (available 562
at http://lcdn.thinkstep.com/Node/). Country-specific means the country in which the life cycle 563 stage occurs. This may be an EU country or non-EU country. The residual grid mix characterizes 564 the unclaimed, untracked or publicly shared electricity. This prevents double counting with the 565 use of supplier-specific electricity mixes in (i) and (ii). 566
Note: if for a country, there is a 100% tracking system in place, case (i) shall be applied. 567
Note: for the use stage, the consumption grid mix shall be used. 568
The environmental integrity of the use of supplier-specific electricity mix depends on ensuring that 569 contractual instruments (for tracking) reliably and uniquely convey claims to consumers. Without this, the 570 PEF lacks the accuracy and consistency necessary to drive product/corporate electricity procurement 571 decisions and accurate consumer (buyer of electricity) claims. Therefore, a set of minimum criteria that relate 572 to the integrity of the contractual instruments as reliable conveyers of environmental footprint information 573 has been identified. They represent the minimum features necessary to use supplier-specific mix within PEF 574 studies. 575
Set of minimal criteria to ensure contractual instruments from suppliers: 576
A supplier-specific electricity product/mix may only be used when the applicant ensures that any contractual 577 instrument meets the criteria specified below. If contractual instruments do not meet the criteria, then 578 'country-specific residual grid mix, consumption mix' shall be used in the modelling. 579
A contractual instrument used for electricity modelling shall: 580
1. Convey attributes: 581
Page | 69
Convey the energy type mix associated with the unit of electricity produced. 582
The energy type mix shall be calculated based on delivered electricity, incorporating certificates 583
sourced and retired on behalf of its customers. Electricity from facilities for which the attributes have 584
been sold off (via contracts or certificates) shall be characterized as having the environmental 585
attributes of the country residual consumption mix where the facility is located. 586
2. Be a unique claim: 587
Be the only instruments that carry the environmental attribute claim associated with that quantity 588
of electricity generated. 589
Be tracked and redeemed, retired, or cancelled by or on behalf of the company (e.g. by an audit of 590
contracts, third party certification, or may be handled automatically through other disclosure 591
registries, systems, or mechanisms). 592
3. Be as close as possible to the period to which the contractual instrument is applied. 593
Modelling 'country-specific residual grid mix, consumption mix': 594
Datasets for residual grid mix, per energy type, per country and per voltage have been purchased by the 595 European Commission and are available in the dedicated node 596 (https://ec.europa.eu/energy/intelligent/projects/sites/iee-projects/files/projects/documents/e-597 track_ii_guarantees_of_origin_in_europe.pdf). In case the necessary dataset is not available, an alternative 598 dataset shall be chosen according to the procedure described in section 5.8 Allocation rules. If no dataset is 599 available, the following approach may be used: 600
Determine the country consumption mix (e.g. X% of MWh produced with hydro energy, Y% of MWh 601 produced with coal power plant) and combined them with LCI datasets per energy type and country/region 602 (e.g. LCI dataset for the production of 1MWh hydro energy in Switzerland): 603
● Activity data related to non-EU country consumption mix per detailed energy type shall be 604 determined based on: 605
o Domestic production mix per production technologies 606 o Import quantity and from which neighbouring countries 607 o Transmission losses 608 o Distribution losses 609 o Type of fuel supply (share of resources used, by import and / or domestic supply) 610
These data may be found in the publications of the International Energy Agency (IEA). 611
● Available LCI datasets per fuel technologies in the node. The LCI datasets available are generally 612 specific to a country or a region in terms of: 613
o Fuel supply (share of resources used, by import and / or domestic supply), 614 o Energy carrier properties (e.g. element and energy contents) 615 o Technology standards of power plants regarding efficiency, firing technology, flue-616
gas desulphurisation, NOx removal and de-dusting. 617 Allocation rules: 618
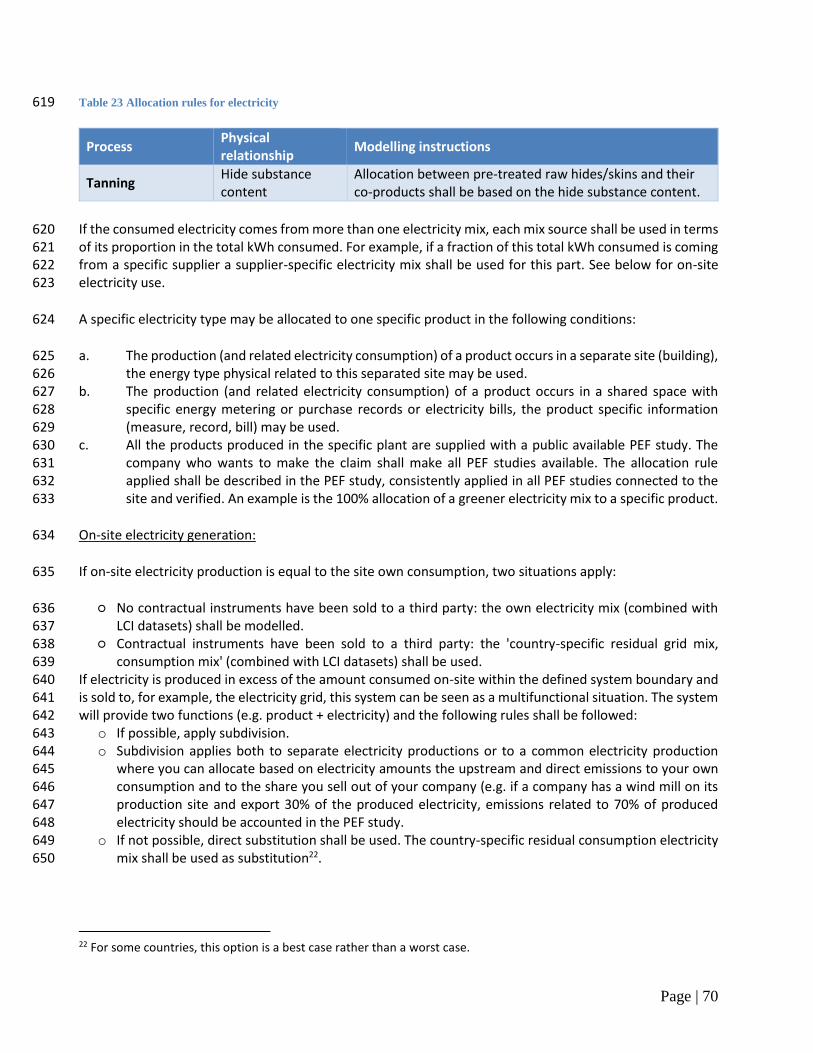
Page | 70
Table 23 Allocation rules for electricity 619
Process Physical relationship
Modelling instructions
Tanning Hide substance content
Allocation between pre-treated raw hides/skins and their co-products shall be based on the hide substance content.
If the consumed electricity comes from more than one electricity mix, each mix source shall be used in terms 620 of its proportion in the total kWh consumed. For example, if a fraction of this total kWh consumed is coming 621 from a specific supplier a supplier-specific electricity mix shall be used for this part. See below for on-site 622 electricity use. 623
A specific electricity type may be allocated to one specific product in the following conditions: 624
a. The production (and related electricity consumption) of a product occurs in a separate site (building), 625 the energy type physical related to this separated site may be used. 626
b. The production (and related electricity consumption) of a product occurs in a shared space with 627 specific energy metering or purchase records or electricity bills, the product specific information 628 (measure, record, bill) may be used. 629
c. All the products produced in the specific plant are supplied with a public available PEF study. The 630 company who wants to make the claim shall make all PEF studies available. The allocation rule 631 applied shall be described in the PEF study, consistently applied in all PEF studies connected to the 632 site and verified. An example is the 100% allocation of a greener electricity mix to a specific product. 633
On-site electricity generation: 634
If on-site electricity production is equal to the site own consumption, two situations apply: 635
○ No contractual instruments have been sold to a third party: the own electricity mix (combined with 636 LCI datasets) shall be modelled. 637
○ Contractual instruments have been sold to a third party: the 'country-specific residual grid mix, 638 consumption mix' (combined with LCI datasets) shall be used. 639
If electricity is produced in excess of the amount consumed on-site within the defined system boundary and 640 is sold to, for example, the electricity grid, this system can be seen as a multifunctional situation. The system 641 will provide two functions (e.g. product + electricity) and the following rules shall be followed: 642
o If possible, apply subdivision. 643 o Subdivision applies both to separate electricity productions or to a common electricity production 644
where you can allocate based on electricity amounts the upstream and direct emissions to your own 645 consumption and to the share you sell out of your company (e.g. if a company has a wind mill on its 646 production site and export 30% of the produced electricity, emissions related to 70% of produced 647 electricity should be accounted in the PEF study. 648
o If not possible, direct substitution shall be used. The country-specific residual consumption electricity 649 mix shall be used as substitution22. 650
22 For some countries, this option is a best case rather than a worst case.
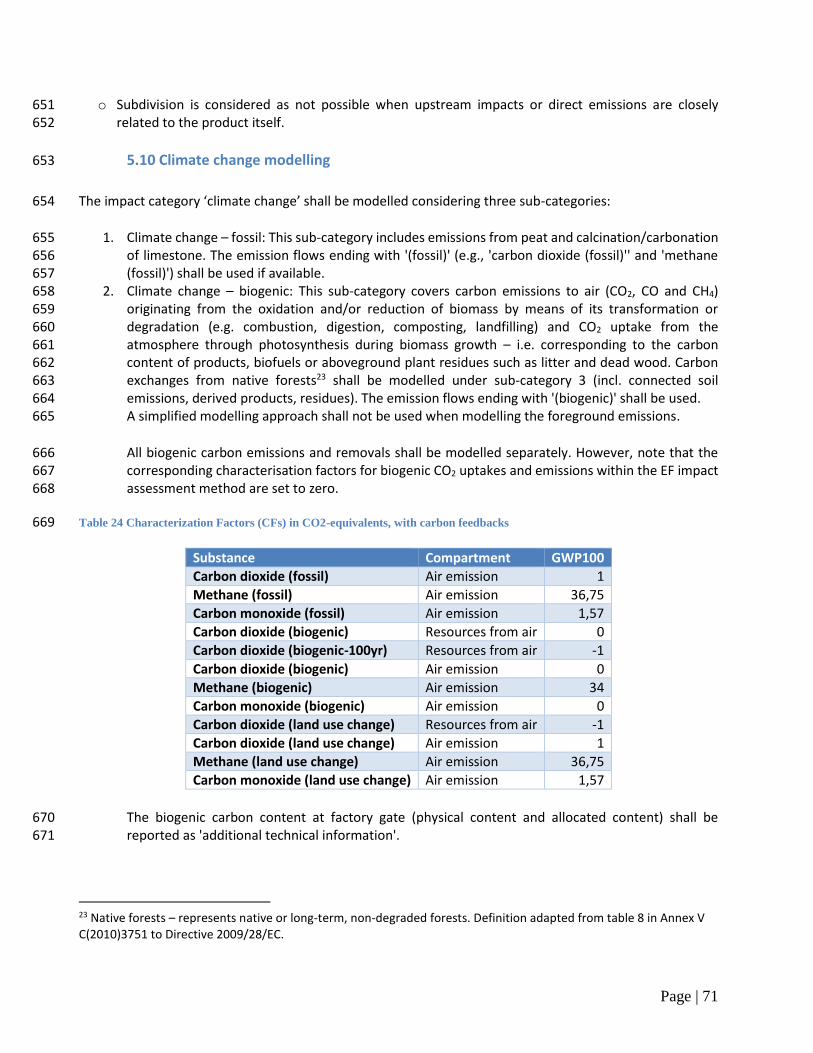
Page | 71
o Subdivision is considered as not possible when upstream impacts or direct emissions are closely 651 related to the product itself. 652
5.10 Climate change modelling 653
The impact category ‘climate change’ shall be modelled considering three sub-categories: 654
1. Climate change – fossil: This sub-category includes emissions from peat and calcination/carbonation 655 of limestone. The emission flows ending with '(fossil)' (e.g., 'carbon dioxide (fossil)'' and 'methane 656 (fossil)') shall be used if available. 657
2. Climate change – biogenic: This sub-category covers carbon emissions to air (CO2, CO and CH4) 658 originating from the oxidation and/or reduction of biomass by means of its transformation or 659 degradation (e.g. combustion, digestion, composting, landfilling) and CO2 uptake from the 660 atmosphere through photosynthesis during biomass growth – i.e. corresponding to the carbon 661 content of products, biofuels or aboveground plant residues such as litter and dead wood. Carbon 662 exchanges from native forests23 shall be modelled under sub-category 3 (incl. connected soil 663 emissions, derived products, residues). The emission flows ending with '(biogenic)' shall be used. 664 A simplified modelling approach shall not be used when modelling the foreground emissions. 665
All biogenic carbon emissions and removals shall be modelled separately. However, note that the 666 corresponding characterisation factors for biogenic CO2 uptakes and emissions within the EF impact 667 assessment method are set to zero. 668
Table 24 Characterization Factors (CFs) in CO2-equivalents, with carbon feedbacks 669
Substance Compartment GWP100
Carbon dioxide (fossil) Air emission 1
Methane (fossil) Air emission 36,75
Carbon monoxide (fossil) Air emission 1,57
Carbon dioxide (biogenic) Resources from air 0
Carbon dioxide (biogenic-100yr) Resources from air -1
Carbon dioxide (biogenic) Air emission 0
Methane (biogenic) Air emission 34
Carbon monoxide (biogenic) Air emission 0
Carbon dioxide (land use change) Resources from air -1
Carbon dioxide (land use change) Air emission 1
Methane (land use change) Air emission 36,75
Carbon monoxide (land use change) Air emission 1,57
The biogenic carbon content at factory gate (physical content and allocated content) shall be 670 reported as 'additional technical information'. 671
23 Native forests – represents native or long-term, non-degraded forests. Definition adapted from table 8 in Annex V C(2010)3751 to Directive 2009/28/EC.
Page | 72
3. Climate change – land use and land transformation: This sub-category accounts for carbon uptakes 672 and emissions (CO2, CO and CH4) originating from carbon stock changes caused by land use change 673 and land use. This sub-category includes biogenic carbon exchanges from deforestation, road 674 construction or other soil activities (incl. soil carbon emissions). For native forests, all related CO2 675 emissions are included and modelled under this sub-category (including connected soil emissions, 676 products derived from native forest24 and residues), while their CO2 uptake is excluded. The emission 677 flows ending with '(land use change)' shall be used. 678 For land use change, all carbon emissions and removals shall be modelled following the modelling 679 guidelines of PAS 2050:2011 (BSI 2011) and the supplementary document PAS2050-1:2012 (BSI 680 2012) for horticultural products. PAS 2050:2011 (BSI 2011): Large emissions of GHGs can result as a 681 consequence of land use change. Removals as a direct result of land use change (and not as a result 682 of long-term management practices) do not usually occur, although it is recognized that this could 683 happen in specific circumstances. Examples of direct land use change are the conversion of land used 684 for growing crops to industrial use or conversion from forestland to cropland. All forms of land use 685 change that result in emissions or removals are to be included. Indirect land use change refers to 686 such conversions of land use as a consequence of changes in land use elsewhere. While GHG 687 emissions also arise from indirect land use change, the methods and data requirements for 688 calculating these emissions are not fully developed. Therefore, the assessment of emissions arising 689 from indirect land use change is not included. 690
The GHG emissions and removals arising from direct land use change shall be assessed for any input 691 to the life cycle of a product originating from that land and shall be included in the assessment of 692 GHG emissions. The emissions arising from the product shall be assessed on the basis of the default 693 land use change values provided in PAS 2050:2011 Annex C, unless better data is available. For 694 countries and land use changes not included in this annex, the emissions arising from the product 695 shall be assessed using the included GHG emissions and removals occurring as a result of direct land 696 use change in accordance with the relevant sections of the IPCC (2006). The assessment of the impact 697 of land use change shall include all direct land use change occurring not more than 20 years, or a 698 single harvest period, prior to undertaking the assessment (whichever is the longer). The total GHG 699 emissions and removals arising from direct land use change over the period shall be included in the 700 quantification of GHG emissions of products arising from this land on the basis of equal allocation to 701 each year of the period25. 702
1) Where it can be demonstrated that the land use change occurred more than 20 years prior to the 703 assessment being carried out, no emissions from land use change should be included in the 704 assessment. 705
2) Where the timing of land use change cannot be demonstrated to be more than 20 years, or a 706 single harvest period, prior to making the assessment (whichever is the longer), it shall be assumed 707 that the land use change occurred on 1 January of either: 708
○ The earliest year in which it can be demonstrated that the land use change had occurred; or 709 ○ On 1 January of the year in which the assessment of GHG emissions and removals is being 710
carried out. 711
24 Following the instantaneous oxidation approach in IPCC 2013 (Chapter 2). 25 In case of variability of production over the years, a mass allocation should be applied.
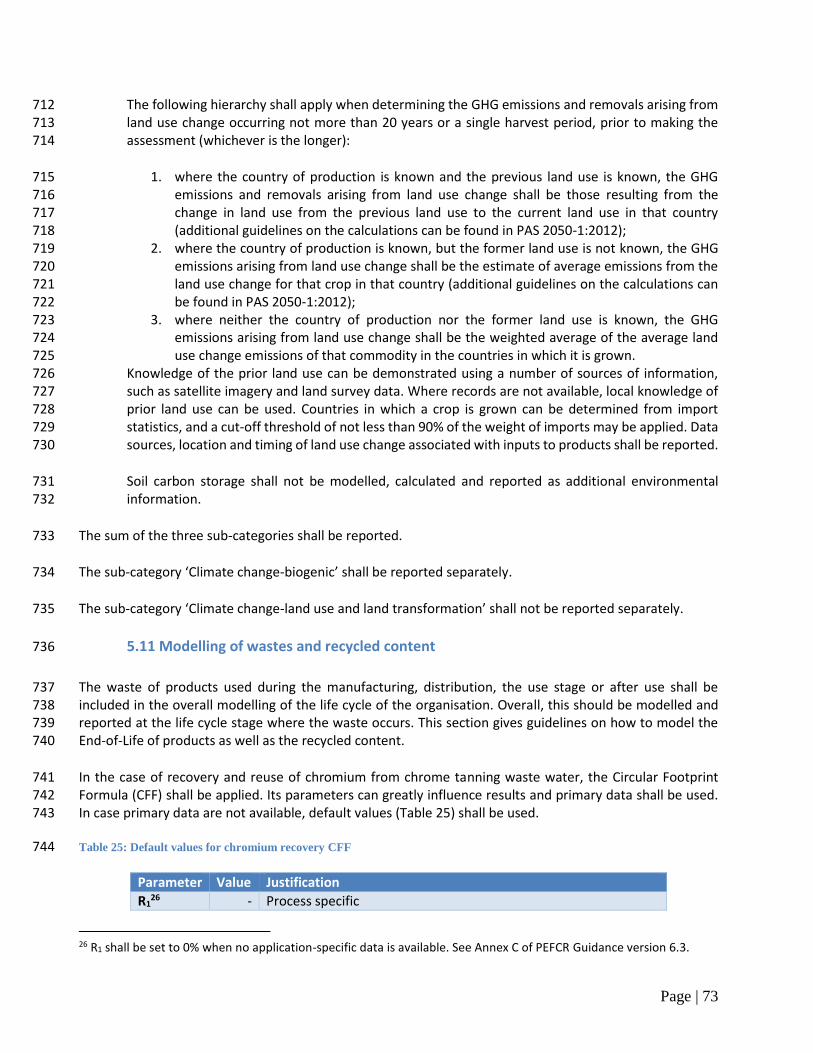
Page | 73
The following hierarchy shall apply when determining the GHG emissions and removals arising from 712 land use change occurring not more than 20 years or a single harvest period, prior to making the 713 assessment (whichever is the longer): 714
1. where the country of production is known and the previous land use is known, the GHG 715 emissions and removals arising from land use change shall be those resulting from the 716 change in land use from the previous land use to the current land use in that country 717 (additional guidelines on the calculations can be found in PAS 2050-1:2012); 718
2. where the country of production is known, but the former land use is not known, the GHG 719 emissions arising from land use change shall be the estimate of average emissions from the 720 land use change for that crop in that country (additional guidelines on the calculations can 721 be found in PAS 2050-1:2012); 722
3. where neither the country of production nor the former land use is known, the GHG 723 emissions arising from land use change shall be the weighted average of the average land 724 use change emissions of that commodity in the countries in which it is grown. 725
Knowledge of the prior land use can be demonstrated using a number of sources of information, 726 such as satellite imagery and land survey data. Where records are not available, local knowledge of 727 prior land use can be used. Countries in which a crop is grown can be determined from import 728 statistics, and a cut-off threshold of not less than 90% of the weight of imports may be applied. Data 729 sources, location and timing of land use change associated with inputs to products shall be reported. 730
Soil carbon storage shall not be modelled, calculated and reported as additional environmental 731 information. 732
The sum of the three sub-categories shall be reported. 733
The sub-category ‘Climate change-biogenic’ shall be reported separately. 734
The sub-category ‘Climate change-land use and land transformation’ shall not be reported separately. 735
5.11 Modelling of wastes and recycled content 736
The waste of products used during the manufacturing, distribution, the use stage or after use shall be 737 included in the overall modelling of the life cycle of the organisation. Overall, this should be modelled and 738 reported at the life cycle stage where the waste occurs. This section gives guidelines on how to model the 739 End-of-Life of products as well as the recycled content. 740
In the case of recovery and reuse of chromium from chrome tanning waste water, the Circular Footprint 741 Formula (CFF) shall be applied. Its parameters can greatly influence results and primary data shall be used. 742 In case primary data are not available, default values (Table 25) shall be used. 743
Table 25: Default values for chromium recovery CFF 744
Parameter Value Justification
R126 - Process specific
26 R1 shall be set to 0% when no application-specific data is available. See Annex C of PEFCR Guidance version 6.3.
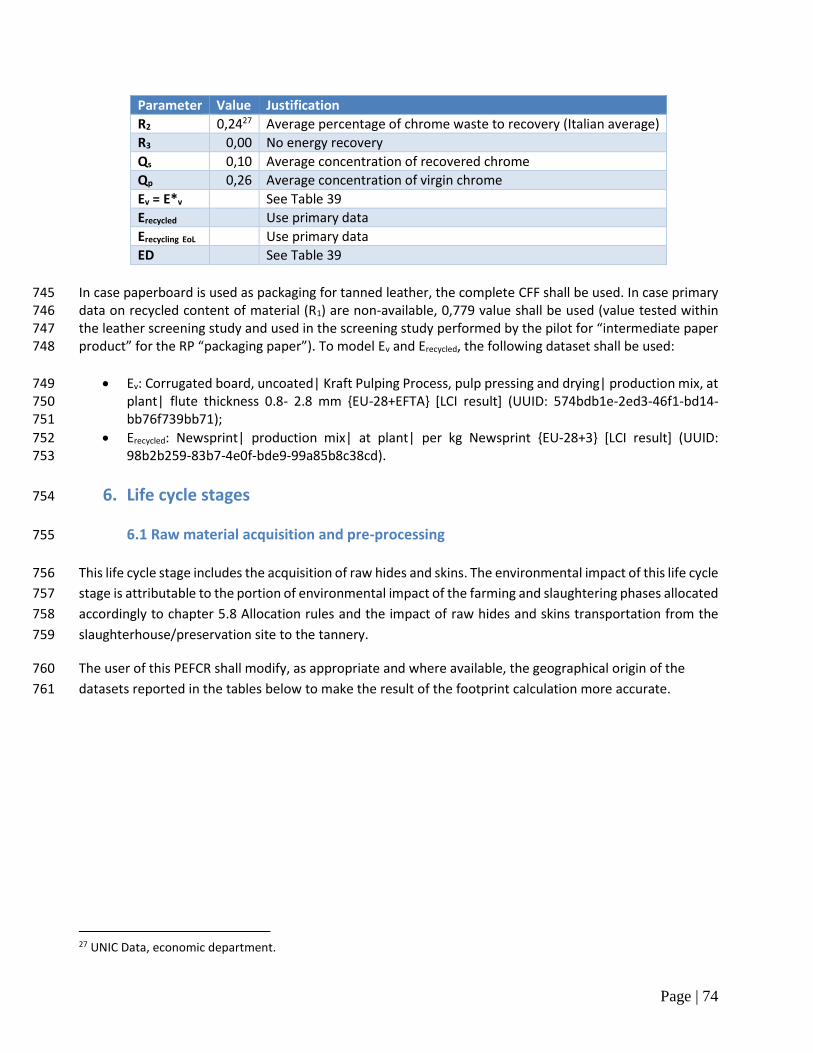
Page | 74
Parameter Value Justification
R2 0,2427 Average percentage of chrome waste to recovery (Italian average)
R3 0,00 No energy recovery
Qs 0,10 Average concentration of recovered chrome
Qp 0,26 Average concentration of virgin chrome
Ev = E*v See Table 39
Erecycled Use primary data
Erecycling EoL Use primary data
ED See Table 39
In case paperboard is used as packaging for tanned leather, the complete CFF shall be used. In case primary 745 data on recycled content of material (R1) are non-available, 0,779 value shall be used (value tested within 746 the leather screening study and used in the screening study performed by the pilot for “intermediate paper 747 product” for the RP “packaging paper”). To model Ev and Erecycled, the following dataset shall be used: 748
Ev: Corrugated board, uncoated| Kraft Pulping Process, pulp pressing and drying| production mix, at 749 plant| flute thickness 0.8- 2.8 mm {EU-28+EFTA} [LCI result] (UUID: 574bdb1e-2ed3-46f1-bd14-750 bb76f739bb71); 751
Erecycled: Newsprint| production mix| at plant| per kg Newsprint {EU-28+3} [LCI result] (UUID: 752 98b2b259-83b7-4e0f-bde9-99a85b8c38cd). 753
6. Life cycle stages 754
6.1 Raw material acquisition and pre-processing 755
This life cycle stage includes the acquisition of raw hides and skins. The environmental impact of this life cycle 756
stage is attributable to the portion of environmental impact of the farming and slaughtering phases allocated 757
accordingly to chapter 5.8 Allocation rules and the impact of raw hides and skins transportation from the 758
slaughterhouse/preservation site to the tannery. 759
The user of this PEFCR shall modify, as appropriate and where available, the geographical origin of the 760
datasets reported in the tables below to make the result of the footprint calculation more accurate. 761
27 UNIC Data, economic department.
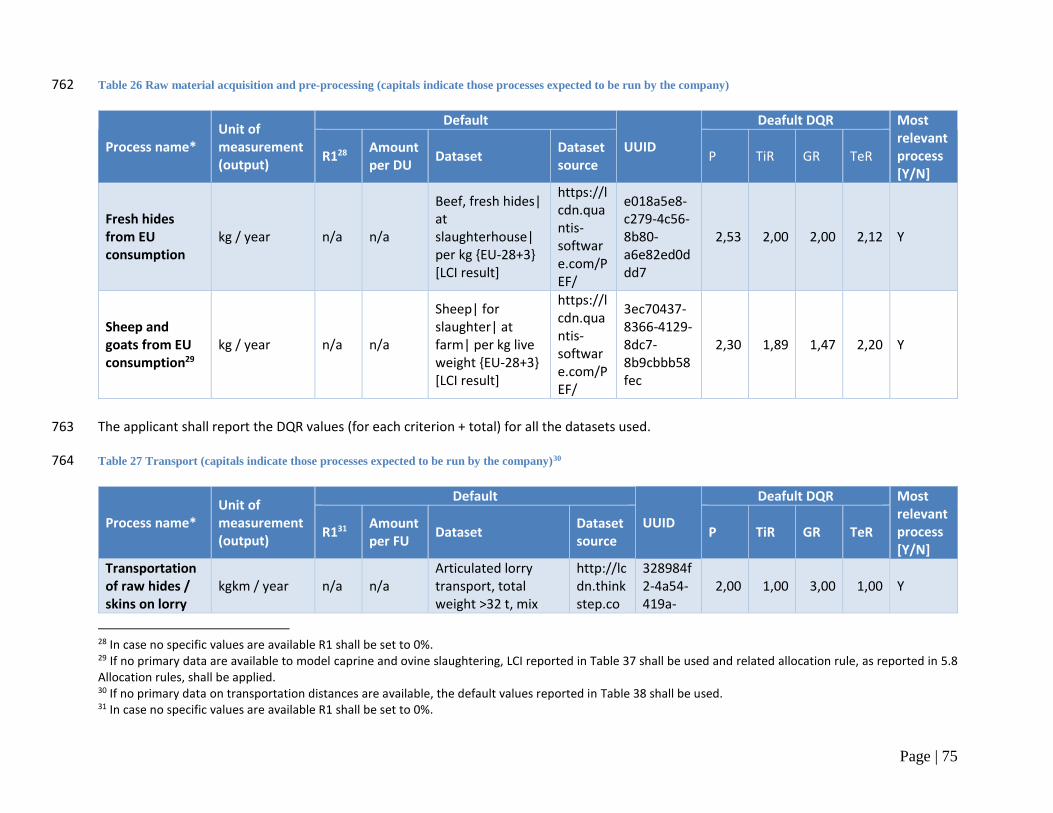
Page | 75
Table 26 Raw material acquisition and pre-processing (capitals indicate those processes expected to be run by the company) 762
Process name* Unit of measurement (output)
Default
UUID
Deafult DQR Most relevant process [Y/N]
R128 Amount per DU
Dataset Dataset source
P TiR GR TeR
Fresh hides from EU consumption
kg / year n/a n/a
Beef, fresh hides| at slaughterhouse| per kg {EU-28+3} [LCI result]
https://lcdn.quantis-software.com/PEF/
e018a5e8-c279-4c56-8b80-a6e82ed0ddd7
2,53 2,00 2,00 2,12 Y
Sheep and goats from EU consumption29
kg / year n/a n/a
Sheep| for slaughter| at farm| per kg live weight {EU-28+3} [LCI result]
https://lcdn.quantis-software.com/PEF/
3ec70437-8366-4129-8dc7-8b9cbbb58fec
2,30 1,89 1,47 2,20 Y
The applicant shall report the DQR values (for each criterion + total) for all the datasets used. 763
Table 27 Transport (capitals indicate those processes expected to be run by the company)30 764
Process name* Unit of measurement (output)
Default
UUID
Deafult DQR Most relevant process [Y/N]
R131 Amount per FU
Dataset Dataset source
P TiR GR TeR
Transportation of raw hides / skins on lorry
kgkm / year n/a n/a Articulated lorry transport, total weight >32 t, mix
http://lcdn.thinkstep.co
328984f2-4a54-419a-
2,00 1,00 3,00 1,00 Y
28 In case no specific values are available R1 shall be set to 0%. 29 If no primary data are available to model caprine and ovine slaughtering, LCI reported in Table 37 shall be used and related allocation rule, as reported in 5.8 Allocation rules, shall be applied. 30 If no primary data on transportation distances are available, the default values reported in Table 38 shall be used. 31 In case no specific values are available R1 shall be set to 0%.
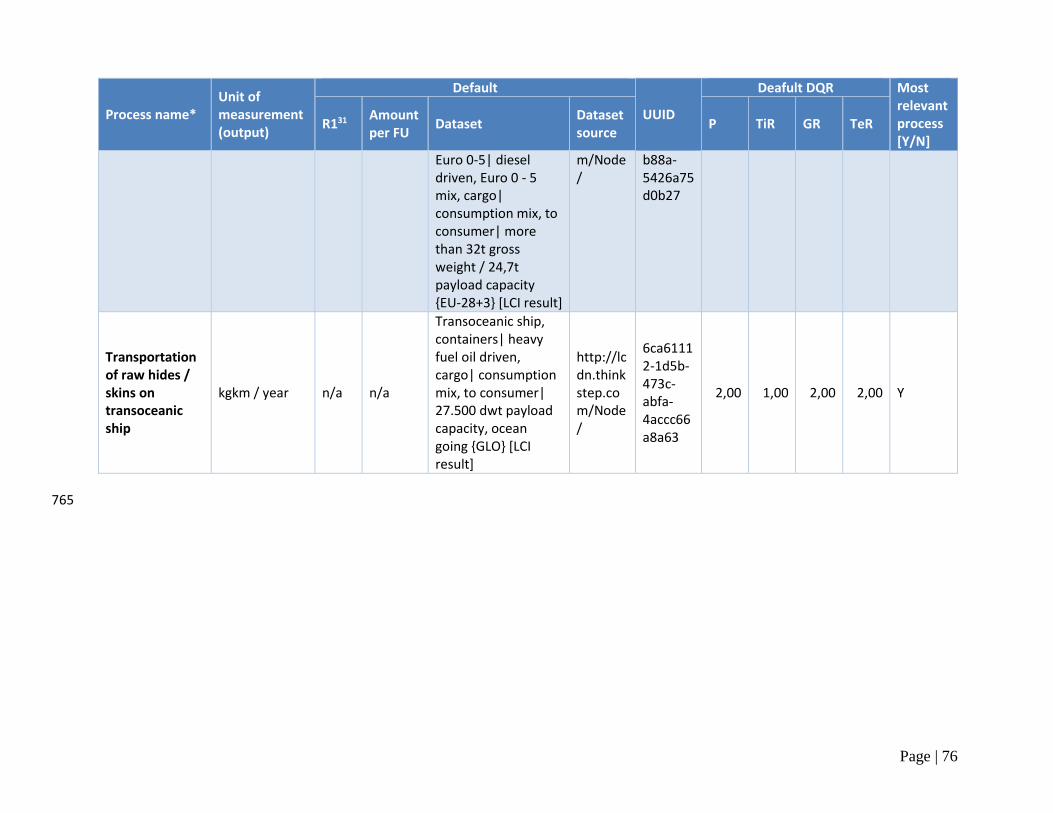
Page | 76
Process name* Unit of measurement (output)
Default
UUID
Deafult DQR Most relevant process [Y/N]
R131 Amount per FU
Dataset Dataset source
P TiR GR TeR
Euro 0-5| diesel driven, Euro 0 - 5 mix, cargo| consumption mix, to consumer| more than 32t gross weight / 24,7t payload capacity {EU-28+3} [LCI result]
m/Node/
b88a-5426a75d0b27
Transportation of raw hides / skins on transoceanic ship
kgkm / year n/a n/a
Transoceanic ship, containers| heavy fuel oil driven, cargo| consumption mix, to consumer| 27.500 dwt payload capacity, ocean going {GLO} [LCI result]
http://lcdn.thinkstep.com/Node/
6ca61112-1d5b-473c-abfa-4accc66a8a63
2,00 1,00 2,00 2,00 Y
765
Page | 77
*The applicant of this PEFCR shall always check the utilisation ratio applied in the default dataset and adapt 766 it accordingly. 767
Modelling the recycled content (if applicable) 768
The following formula is used to model the recycled content: 769
(1 − R1)EV + R1 × (AErecycled + (1 − A)EV ×QSin
Qp) 770
The R1 values applied shall be supply-chain or default as provided in the table above, in relation with the 771 DNM. Material-specific values based on supply market statistics are not accepted as a proxy. The applied R1 772 values shall be subject to PEF study verification. 773
When using supply-chain specific R1 values other than 0, traceability throughout the supply chain is 774 necessary. The following general guidelines shall be followed when using supply-chain specific R1 values: 775
● The supplier information (through e.g., statement of conformity or delivery note) shall be maintained 776 during all stages of production and delivery at the converter; 777
● Once the material is delivered to the converter for production of the end products, the converter 778 shall handle information through their regular administrative procedures; 779
● The converter for production of the end products claiming recycled content shall demonstrate 780 through his management system the [%] of recycled input material into the respective end 781 product(s). 782
● The latter demonstration shall be transferred upon request to the user of the end product. In case a 783 PEF profile is calculated and reported, this shall be stated as additional technical information of the 784 PEF profile. 785
● Company-owned traceability systems can be applied as long as they cover the general guidelines 786 outlined above. 787
The PEF profile shall be calculated and reported using A equal to 1. 788
6.2 Manufacturing 789
Processes expected to be run by the company at manufacturing stage, for which company-specific data are 790 mandatory, are reported in chapter 5.1 List of mandatory company-specific data. 791
7. PEF results 792
7.1 Benchmark values 793
Benchmark is not applicable for leather since it is an intermediate product. 794
7.2 PEF profile 795
The applicant shall calculate the PEF profile of its product in compliance with all requirements included in 796 this PEFCR. The following information shall be included in the PEF report: 797
Page | 78
- full life cycle inventory; 798 - characterised results in absolute values, for all impact categories (including toxicity; as a table); 799 - normalised and weighted result in absolute values, for all impact categories (including toxicity; as a 800
table); 801 - the aggregated single score in absolute values 802
Together with the PEF report, the applicant shall develop an aggregated EF-compliant dataset of its product 803 in scope. This dataset shall be made available on the EF node (http://eplca.jrc.ec.europa.eu/EF-node). The 804 disaggregated version may stay confidential. 805
7.3 Additional technical information 806
- The recycled content (R1) shall be reported. 807 - Results with application-specific A-values, if relevant. 808
7.4 Additional environmental information 809
Additional environmental information shall include the carbon storage in the leather at the tannery gate, as 810 described in ANNEX 6 – Downstream scenarios. 811
Biodiversity is already captured by the land use impact category. It is indeed proposed by the UN 812 Environment as a good proxy for the impact on biodiversity. 813
Biodiversity is not considered as relevant for this PEFCR. 814
8. Verification 815
The verification of an EF study/report carried out in compliance with this PEFCR shall be done according to 816 all the general requirements included in Section 8 of the PEFCR Guidance 6.3 and the requirements listed 817 below. 818
The verifier(s) shall verify that the EF study is conducted in compliance with this PEFCR. 819
These requirements will remain valid until an EF verification scheme is adopted at European level or 820 alternative verification approaches applicable to EF studies/report are included in existing or new policies. 821
The verifier(s) shall validate the accuracy and reliability of the quantitative information used in the calculation 822 of the study. As this can be highly resource intensive, the following requirements shall be followed: 823
The verifier shall check if the correct version of all impact assessment methods was used. For each 824 of the most relevant impact categories, at least 50% of the characterisation factors (for each of the 825 most relevant EF impact categories) shall be verified, while all normalisation and weighting factors 826 of all ICs shall be verified. In particular, the verifier shall check that the characterisation factors 827
Page | 79
correspond to those included in the EF impact assessment method the study declares compliance 828 with32; 829
All the newly created datasets shall be checked on their EF compliancy (for the meaning of EF 830 compliant datasets refer to Annex H of the Guidance). All their underlying data (elementary flows, 831 activity data and sub processes) shall be validated; 832
The aggregated EF-compliant dataset of the product in scope (meaning, the EF study) is available on 833 the EF node (http://eplca.jrc.ec.europa.eu/EF-node). 834
For at least 70% of the most relevant processes in situation 2 option 2 of the DNM, 70% of the 835 underlying data shall be validated. The 70% data shall including all energy and transport sub 836 processes for those in situation 2 option 2; 837
For at least 60% of the most relevant processes in situation 3 of the DNM, 60% of the underlying 838 data shall be validated; 839
For at least 50% of the other processes in situation 1, 2 and 3 of the DNM, 50% of the underlying 840 data shall be validated. 841
In particular, it shall be verified for the selected processes if the DQR of the process satisfies the minimum 842 DQR as specified in the DNM. 843
The selection of the processes to be verified for each situation shall be done ordering them from the most 844 contributing to the less contributing one and selecting those contributing up to the identified percentage 845 starting from the most contributing ones. In case of non-integer numbers, the rounding shall be made always 846 considering the next upper integer. 847
These data checks shall include, but should not be limited to, the activity data used, the selection of 848 secondary sub-processes, the selection of the direct elementary flows and the CFF parameters. For example, 849 if there are 5 processes and each one of them includes 5 activity data, 5 secondary datasets and 10 CFF 850 parameters, then the verifier(s) has to check at least 4 out of 5 processes (70%) and, for each process, (s)he 851 shall check at least 4 activity data (70% of the total amount of activity data), 4 secondary datasets (70% of 852 the total amount of secondary datasets), and 7 CFF parameters (70% of the total amount of CFF parameters), 853 i.e. the 70% of each of data that could be possible subject of check. 854
The verification of the EF report shall be carried out by randomly checking enough information to provide 855 reasonable assurance that the EF report fulfils all the conditions listed in section 8 of the PEFCR Guidance. 856
9. References 857
BLC: K. Alexander, eta al, JSLTC, 17, 1992. 858
CIV ‐ INRA, Valeurs nutritionnelles des viandes ‐ 2006‐2009 859
CTC and SSIP data for Solid Waste production for leathers of small and large dimensions France and Italy, 860 1979 861
CTC: M. Aloy, Proceedings IULTCS ENVIRONMENT COMMISSION, VIENNA, April 1991, 862
32 Available at: http://eplca.jrc.ec.europa.eu/LCDN/developer.xhtml
Page | 80
D. Winters, UNIDO, id/wg.411/10, 1984 863
Die Lederherstellung. Sonderdrueck 148 aus Leder und Hauetemarkt "Gerbereiwissenschaft und Praxis", 864 Decemebr 1979 865
DTI: W. Frendrup et al, "Environmental Managment in Tanneries - A Practical Handbook", DTI, 1995 866
EU: Technical and Economic Study on the Reduction (based on the best technology available9 of Industrial 867 Emissions (water, air and solid wastes) from Tanneries", 92/013868/LR/sh, April 1992 868
Food and Agriculture Organization of the United Nations Statistics division (FAOSTAT) 869
Hellenic Tanners Association: I.A. Ioannidis, IPPC Study of the Hellenoc Leather Sector, 1998 870
Herfeld & Pauckner, Sonderdrueck 35 871
Innovaleather Project - www.innovaleather.ro, 2014, Bucharest, Romania 872
Lollar, JALCA, 311, 1982. 873
M. Portavella: La verdad de la contaminacion en tenerias lanares, 1991 874
Ministry of Agriculture USA, JALCA, 380, 1992 875
National Bank for Industrial Development S.A., August 1997, Athens, Study offices: M. Bakalis, Dr. P. 876 Markantonatos and Dr. A. Paraskevopoulou R. Puig et al, “Feasibility survey and technical preliminary study 877 for the recovery and reuse of Chromium as well as the Management of biosolids and solid waste of the IN.PA 878 of Leather” 879
Rita Puig et al, Industrial ecology in the cattle-to-leather supply chain, pages 42-43 - ISBN 978-88-464-9696-880 6, Francoangeli srl, 2007, Milano. Italy 881
Simoncini, E. Chraccevini, G. Simone, IV Congresso Internazionale di Merceologia, Bari, September 1983. 882
SSIP: A. Simoncini, De Simone eta al, CPMC, 24, 1989. 883
SSIP: G. Manzo, 67(5), 1991 884
W. Pauckner, Sonderdrueck, 97, 1971 885

Page | 81
ANNEX 1 – List of EF normalisation and weighting factors 886
Global normalisation factors are applied within the EF. The normalisation factors as the global impact per 887 person are used in the EF calculations. 888
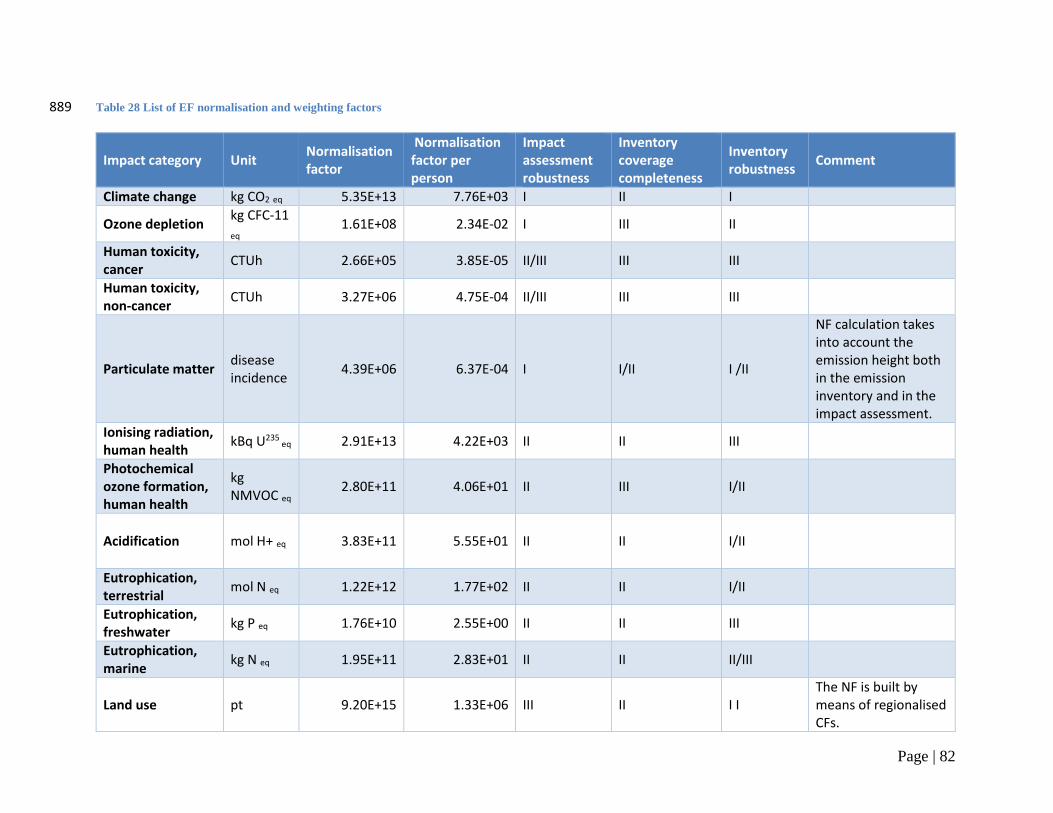
Page | 82
Table 28 List of EF normalisation and weighting factors 889
Impact category Unit Normalisation factor
Normalisation factor per person
Impact assessment robustness
Inventory coverage completeness
Inventory robustness
Comment
Climate change kg CO2 eq 5.35E+13 7.76E+03 I II I
Ozone depletion kg CFC-11
eq 1.61E+08 2.34E-02 I III II
Human toxicity, cancer
CTUh 2.66E+05 3.85E-05 II/III III III
Human toxicity, non-cancer
CTUh 3.27E+06 4.75E-04 II/III III III
Particulate matter disease incidence
4.39E+06 6.37E-04 I I/II I /II
NF calculation takes into account the emission height both in the emission inventory and in the impact assessment.
Ionising radiation, human health
kBq U235 eq 2.91E+13 4.22E+03 II II III
Photochemical ozone formation, human health
kg NMVOC eq
2.80E+11 4.06E+01 II III I/II
Acidification mol H+ eq 3.83E+11 5.55E+01 II II I/II
Eutrophication, terrestrial
mol N eq 1.22E+12 1.77E+02 II II I/II
Eutrophication, freshwater
kg P eq 1.76E+10 2.55E+00 II II III
Eutrophication, marine
kg N eq 1.95E+11 2.83E+01 II II II/III
Land use pt 9.20E+15 1.33E+06 III II I I The NF is built by means of regionalised CFs.
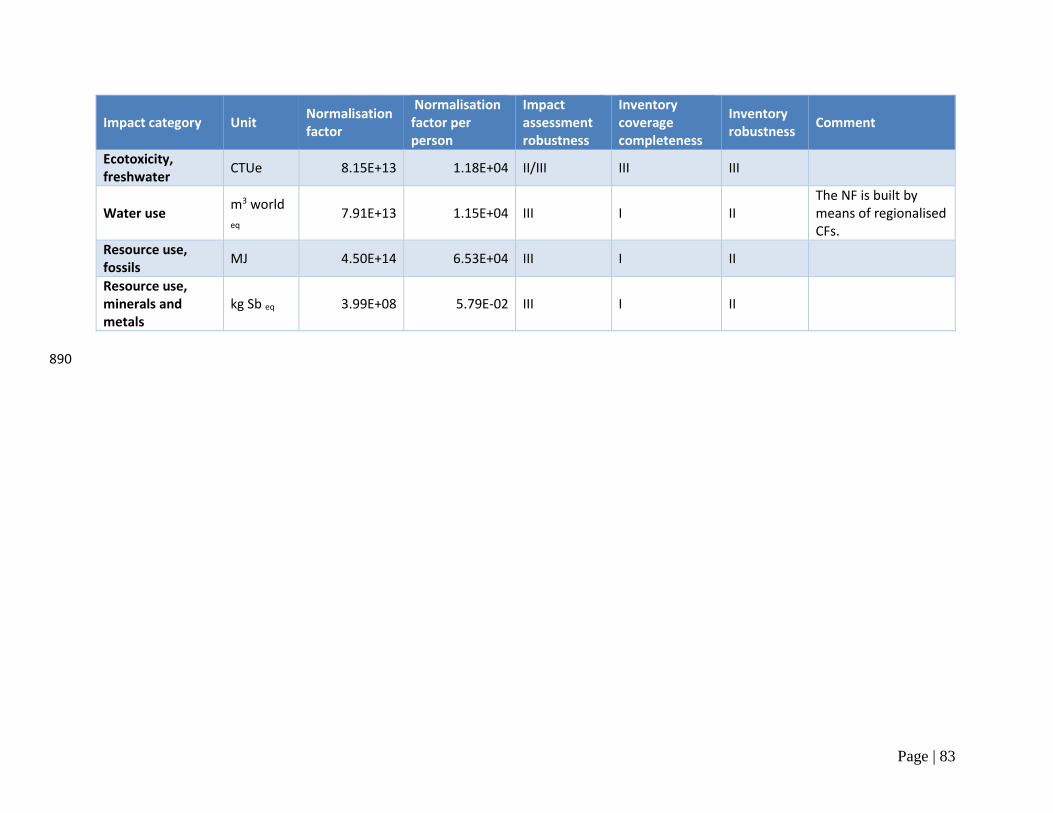
Page | 83
Impact category Unit Normalisation factor
Normalisation factor per person
Impact assessment robustness
Inventory coverage completeness
Inventory robustness
Comment
Ecotoxicity, freshwater
CTUe 8.15E+13 1.18E+04 II/III III III
Water use m3 world
eq 7.91E+13 1.15E+04 III I II
The NF is built by means of regionalised CFs.
Resource use, fossils
MJ 4.50E+14 6.53E+04 III I II
Resource use, minerals and metals
kg Sb eq 3.99E+08 5.79E-02 III I II
890
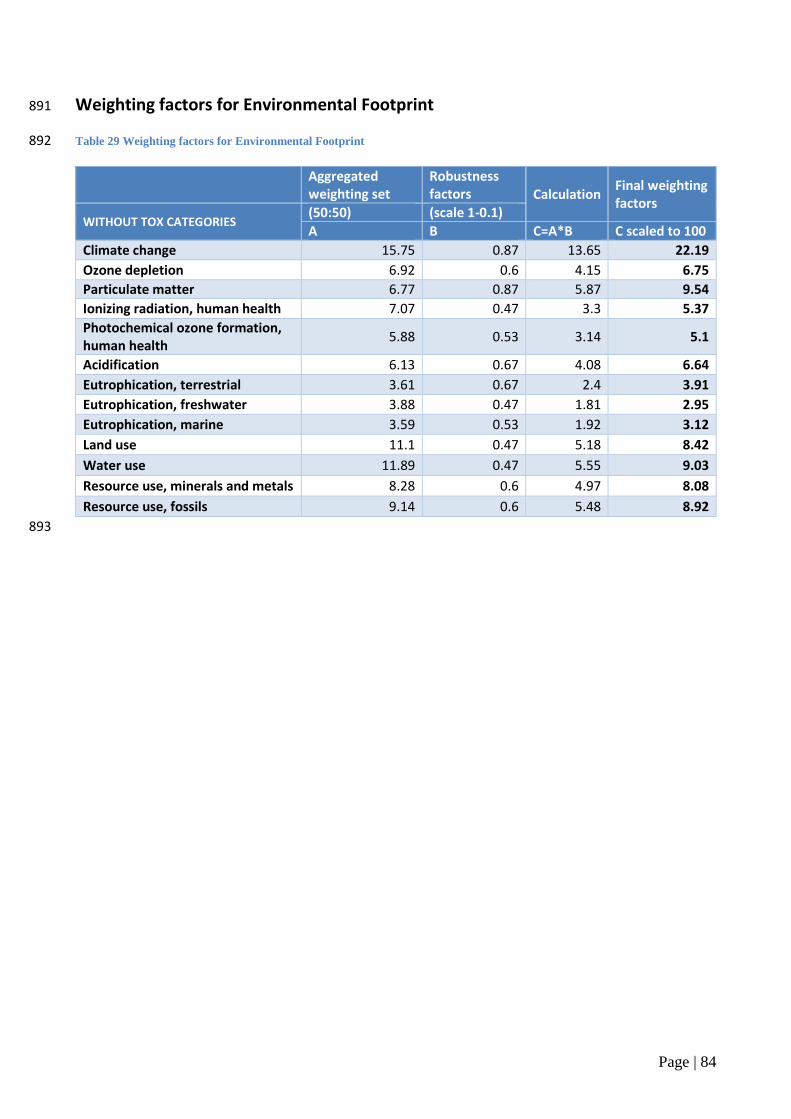
Page | 84
Weighting factors for Environmental Footprint 891
Table 29 Weighting factors for Environmental Footprint 892
Aggregated weighting set
Robustness factors Calculation
Final weighting factors
WITHOUT TOX CATEGORIES (50:50) (scale 1-0.1)
A B C=A*B C scaled to 100
Climate change 15.75 0.87 13.65 22.19
Ozone depletion 6.92 0.6 4.15 6.75
Particulate matter 6.77 0.87 5.87 9.54
Ionizing radiation, human health 7.07 0.47 3.3 5.37
Photochemical ozone formation, human health
5.88 0.53 3.14 5.1
Acidification 6.13 0.67 4.08 6.64
Eutrophication, terrestrial 3.61 0.67 2.4 3.91
Eutrophication, freshwater 3.88 0.47 1.81 2.95
Eutrophication, marine 3.59 0.53 1.92 3.12
Land use 11.1 0.47 5.18 8.42
Water use 11.89 0.47 5.55 9.03
Resource use, minerals and metals 8.28 0.6 4.97 8.08
Resource use, fossils 9.14 0.6 5.48 8.92
893
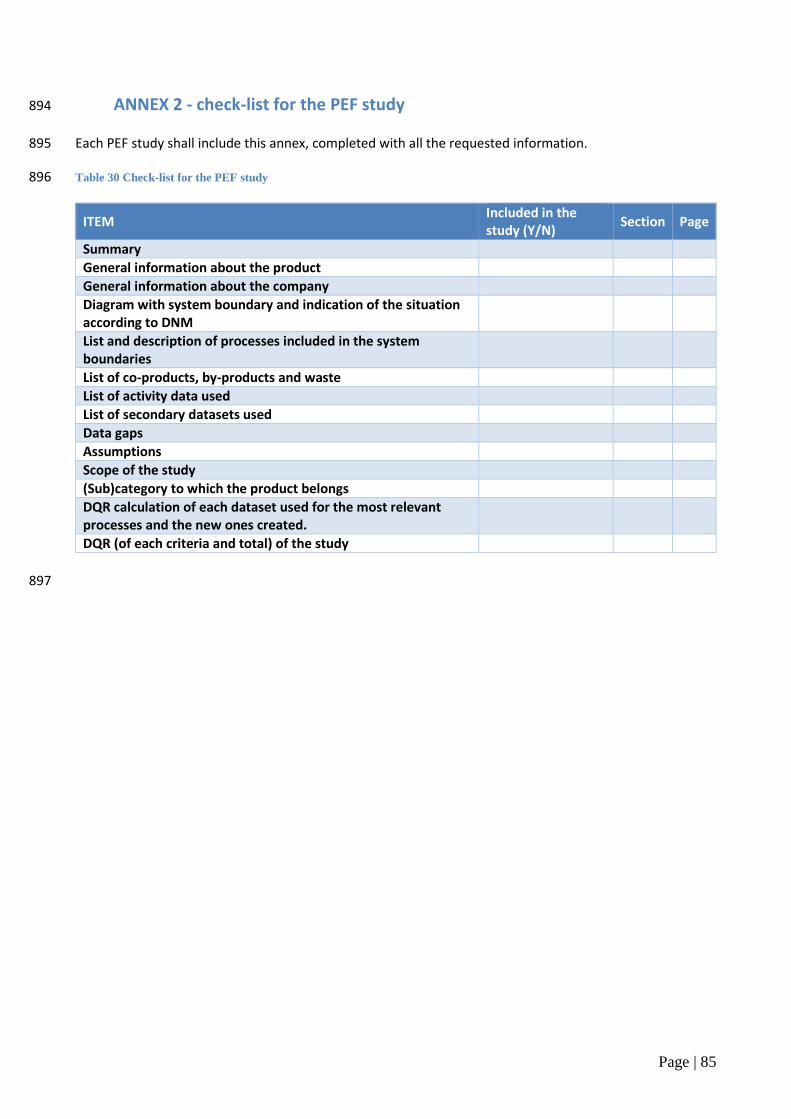
Page | 85
ANNEX 2 - check-list for the PEF study 894
Each PEF study shall include this annex, completed with all the requested information. 895
Table 30 Check-list for the PEF study 896
ITEM Included in the study (Y/N)
Section Page
Summary
General information about the product
General information about the company
Diagram with system boundary and indication of the situation according to DNM
List and description of processes included in the system boundaries
List of co-products, by-products and waste
List of activity data used
List of secondary datasets used
Data gaps
Assumptions
Scope of the study
(Sub)category to which the product belongs
DQR calculation of each dataset used for the most relevant processes and the new ones created.
DQR (of each criteria and total) of the study
897
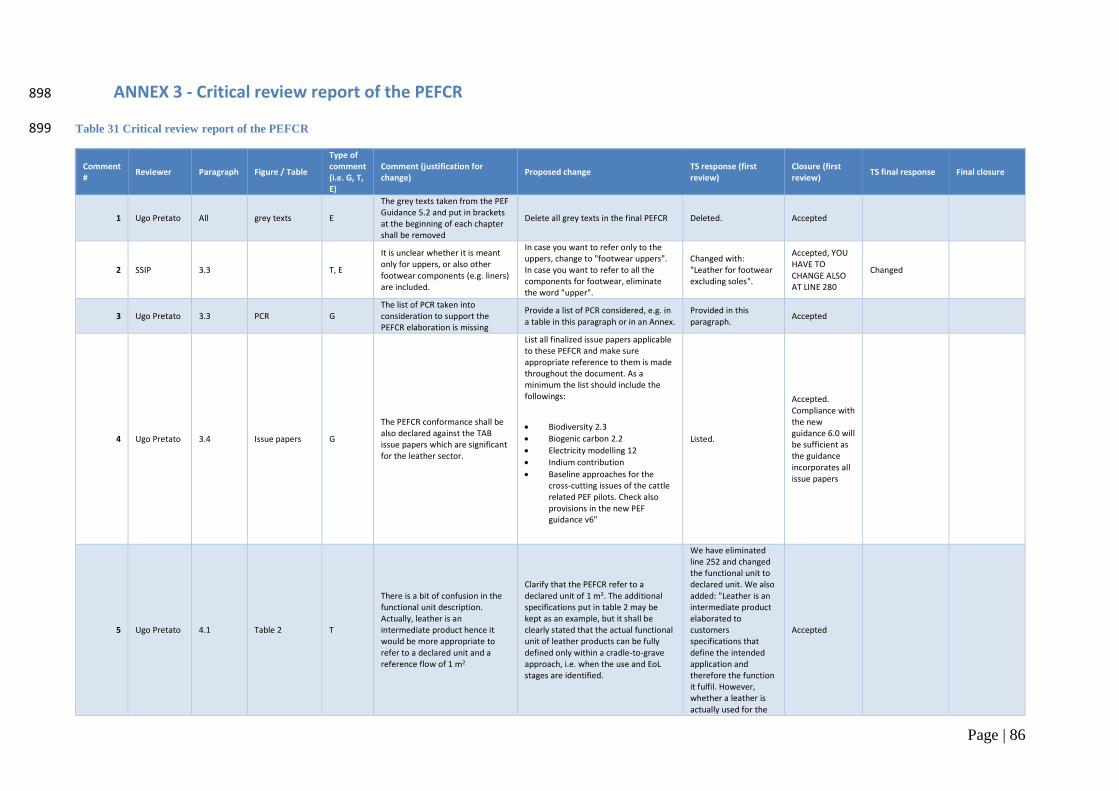
Page | 86
ANNEX 3 - Critical review report of the PEFCR 898
Table 31 Critical review report of the PEFCR 899
Comment #
Reviewer Paragraph Figure / Table
Type of comment (i.e. G, T, E)
Comment (justification for change)
Proposed change TS response (first review)
Closure (first review)
TS final response Final closure
1 Ugo Pretato All grey texts E
The grey texts taken from the PEF Guidance 5.2 and put in brackets at the beginning of each chapter shall be removed
Delete all grey texts in the final PEFCR Deleted. Accepted
2 SSIP 3.3 T, E
It is unclear whether it is meant only for uppers, or also other footwear components (e.g. liners) are included.
In case you want to refer only to the uppers, change to "footwear uppers". In case you want to refer to all the components for footwear, eliminate the word "upper".
Changed with: "Leather for footwear excluding soles".
Accepted, YOU HAVE TO CHANGE ALSO AT LINE 280
Changed
3 Ugo Pretato 3.3 PCR G The list of PCR taken into consideration to support the PEFCR elaboration is missing
Provide a list of PCR considered, e.g. in a table in this paragraph or in an Annex.
Provided in this paragraph.
Accepted
4 Ugo Pretato 3.4 Issue papers G
The PEFCR conformance shall be also declared against the TAB issue papers which are significant for the leather sector.
List all finalized issue papers applicable to these PEFCR and make sure appropriate reference to them is made throughout the document. As a minimum the list should include the followings:
Biodiversity 2.3
Biogenic carbon 2.2
Electricity modelling 12
Indium contribution
Baseline approaches for the cross-cutting issues of the cattle related PEF pilots. Check also provisions in the new PEF guidance v6"
Listed.
Accepted. Compliance with the new guidance 6.0 will be sufficient as the guidance incorporates all issue papers
5 Ugo Pretato 4.1 Table 2 T
There is a bit of confusion in the functional unit description. Actually, leather is an intermediate product hence it would be more appropriate to refer to a declared unit and a reference flow of 1 m2
Clarify that the PEFCR refer to a declared unit of 1 m2. The additional specifications put in table 2 may be kept as an example, but it shall be clearly stated that the actual functional unit of leather products can be fully defined only within a cradle-to-grave approach, i.e. when the use and EoL stages are identified.
We have eliminated line 252 and changed the functional unit to declared unit. We also added: "Leather is an intermediate product elaborated to customers specifications that define the intended application and therefore the function it fulfil. However, whether a leather is actually used for the
Accepted
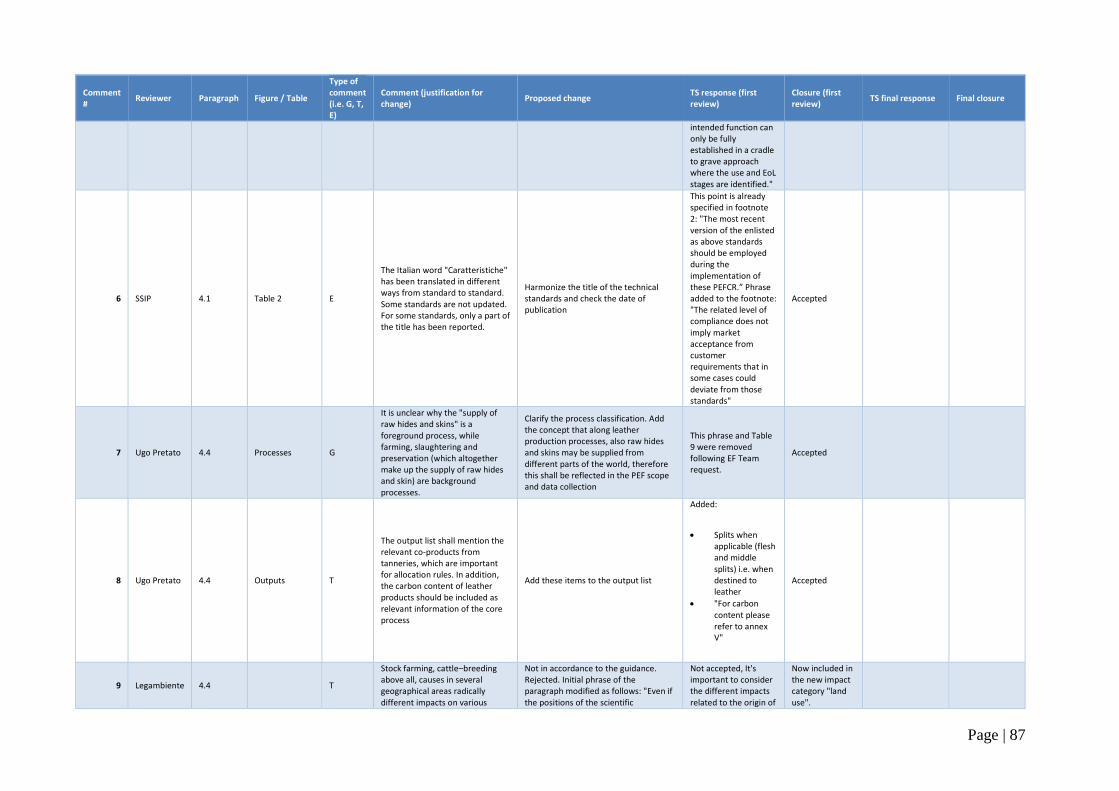
Page | 87
Comment #
Reviewer Paragraph Figure / Table
Type of comment (i.e. G, T, E)
Comment (justification for change)
Proposed change TS response (first review)
Closure (first review)
TS final response Final closure
intended function can only be fully established in a cradle to grave approach where the use and EoL stages are identified."
6 SSIP 4.1 Table 2 E
The Italian word "Caratteristiche" has been translated in different ways from standard to standard. Some standards are not updated. For some standards, only a part of the title has been reported.
Harmonize the title of the technical standards and check the date of publication
This point is already specified in footnote 2: "The most recent version of the enlisted as above standards should be employed during the implementation of these PEFCR.” Phrase added to the footnote: "The related level of compliance does not imply market acceptance from customer requirements that in some cases could deviate from those standards"
Accepted
7 Ugo Pretato 4.4 Processes G
It is unclear why the "supply of raw hides and skins" is a foreground process, while farming, slaughtering and preservation (which altogether make up the supply of raw hides and skin) are background processes.
Clarify the process classification. Add the concept that along leather production processes, also raw hides and skins may be supplied from different parts of the world, therefore this shall be reflected in the PEF scope and data collection
This phrase and Table 9 were removed following EF Team request.
Accepted
8 Ugo Pretato 4.4 Outputs T
The output list shall mention the relevant co-products from tanneries, which are important for allocation rules. In addition, the carbon content of leather products should be included as relevant information of the core process
Add these items to the output list
Added:
Splits when applicable (flesh and middle splits) i.e. when destined to leather
"For carbon content please refer to annex V"
Accepted
9 Legambiente 4.4 T
Stock farming, cattle–breeding above all, causes in several geographical areas radically different impacts on various
Not in accordance to the guidance. Rejected. Initial phrase of the paragraph modified as follows: "Even if the positions of the scientific
Not accepted, It's important to consider the different impacts related to the origin of
Now included in the new impact category "land use".
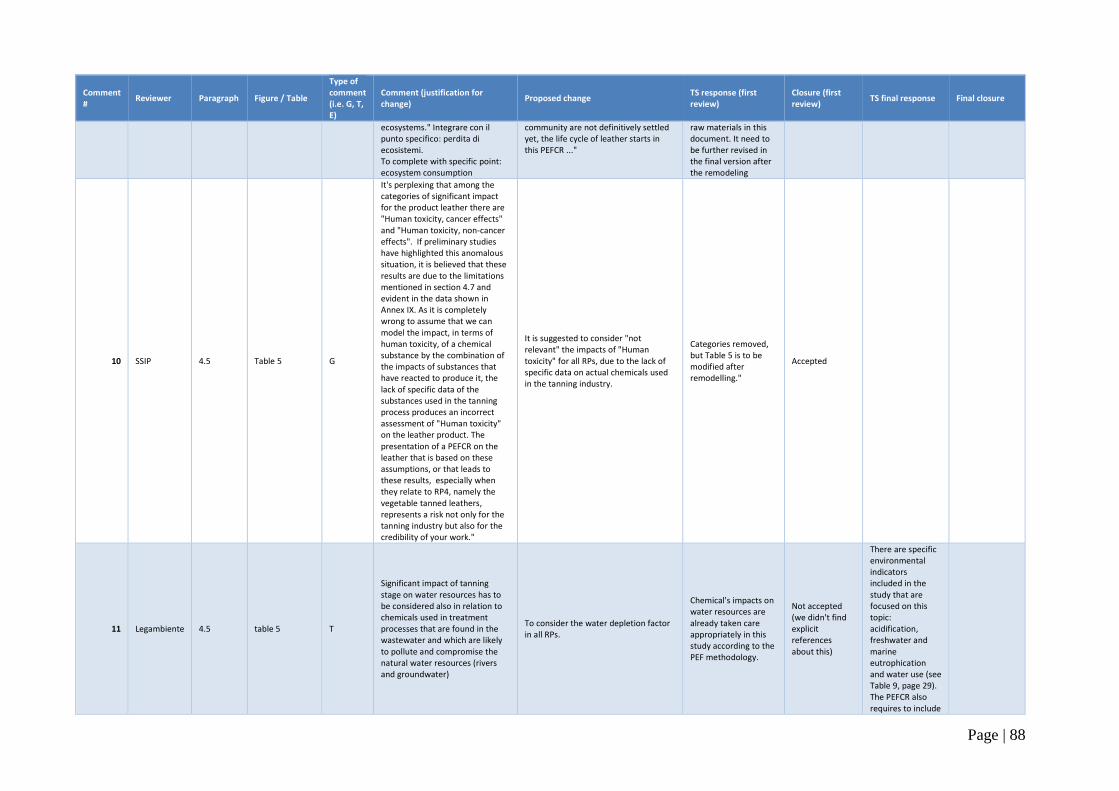
Page | 88
Comment #
Reviewer Paragraph Figure / Table
Type of comment (i.e. G, T, E)
Comment (justification for change)
Proposed change TS response (first review)
Closure (first review)
TS final response Final closure
ecosystems." Integrare con il punto specifico: perdita di ecosistemi. To complete with specific point: ecosystem consumption
community are not definitively settled yet, the life cycle of leather starts in this PEFCR ..."
raw materials in this document. It need to be further revised in the final version after the remodeling
10 SSIP 4.5 Table 5 G
It's perplexing that among the categories of significant impact for the product leather there are "Human toxicity, cancer effects" and "Human toxicity, non-cancer effects". If preliminary studies have highlighted this anomalous situation, it is believed that these results are due to the limitations mentioned in section 4.7 and evident in the data shown in Annex IX. As it is completely wrong to assume that we can model the impact, in terms of human toxicity, of a chemical substance by the combination of the impacts of substances that have reacted to produce it, the lack of specific data of the substances used in the tanning process produces an incorrect assessment of "Human toxicity" on the leather product. The presentation of a PEFCR on the leather that is based on these assumptions, or that leads to these results, especially when they relate to RP4, namely the vegetable tanned leathers, represents a risk not only for the tanning industry but also for the credibility of your work."
It is suggested to consider "not relevant" the impacts of "Human toxicity" for all RPs, due to the lack of specific data on actual chemicals used in the tanning industry.
Categories removed, but Table 5 is to be modified after remodelling."
Accepted
11 Legambiente 4.5 table 5 T
Significant impact of tanning stage on water resources has to be considered also in relation to chemicals used in treatment processes that are found in the wastewater and which are likely to pollute and compromise the natural water resources (rivers and groundwater)
To consider the water depletion factor in all RPs.
Chemical's impacts on water resources are already taken care appropriately in this study according to the PEF methodology.
Not accepted (we didn't find explicit references about this)
There are specific environmental indicators included in the study that are focused on this topic: acidification, freshwater and marine eutrophication and water use (see Table 9, page 29). The PEFCR also requires to include
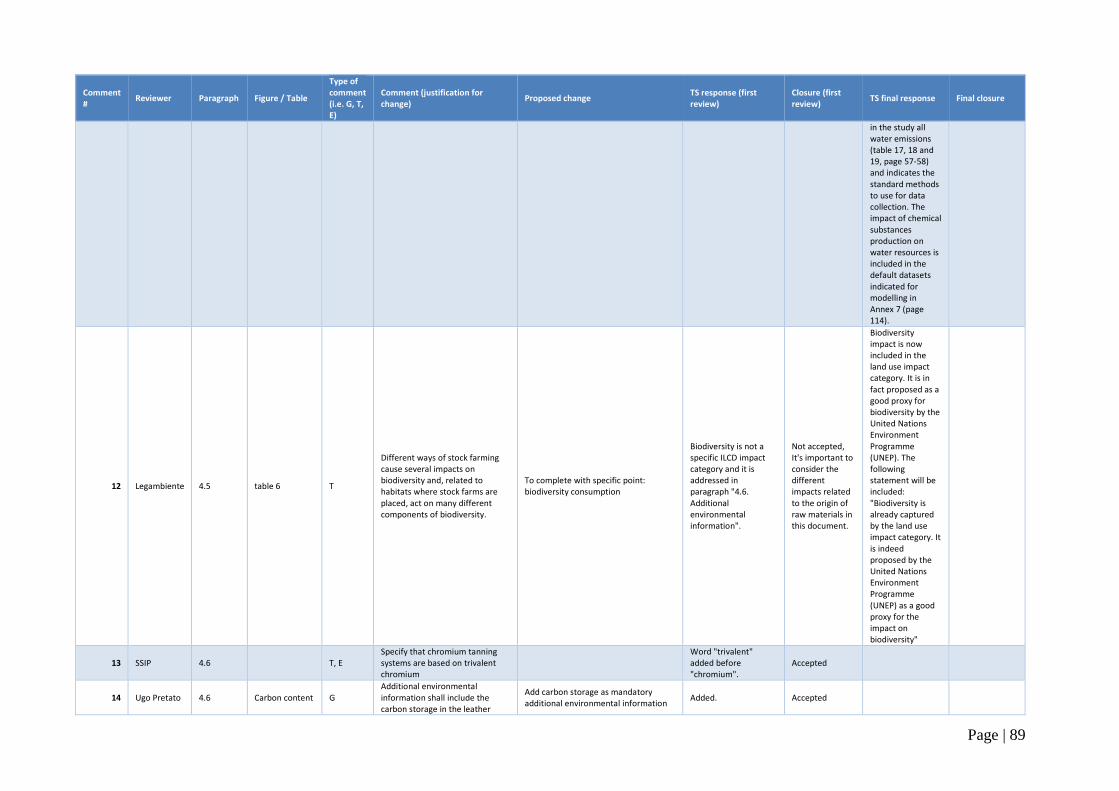
Page | 89
Comment #
Reviewer Paragraph Figure / Table
Type of comment (i.e. G, T, E)
Comment (justification for change)
Proposed change TS response (first review)
Closure (first review)
TS final response Final closure
in the study all water emissions (table 17, 18 and 19, page 57-58) and indicates the standard methods to use for data collection. The impact of chemical substances production on water resources is included in the default datasets indicated for modelling in Annex 7 (page 114).
12 Legambiente 4.5 table 6 T
Different ways of stock farming cause several impacts on biodiversity and, related to habitats where stock farms are placed, act on many different components of biodiversity.
To complete with specific point: biodiversity consumption
Biodiversity is not a specific ILCD impact category and it is addressed in paragraph "4.6. Additional environmental information".
Not accepted, It's important to consider the different impacts related to the origin of raw materials in this document.
Biodiversity impact is now included in the land use impact category. It is in fact proposed as a good proxy for biodiversity by the United Nations Environment Programme (UNEP). The following statement will be included: "Biodiversity is already captured by the land use impact category. It is indeed proposed by the United Nations Environment Programme (UNEP) as a good proxy for the impact on biodiversity"
13 SSIP 4.6 T, E Specify that chromium tanning systems are based on trivalent chromium
Word "trivalent" added before "chromium".
Accepted
14 Ugo Pretato 4.6 Carbon content G Additional environmental information shall include the carbon storage in the leather
Add carbon storage as mandatory additional environmental information
Added. Accepted
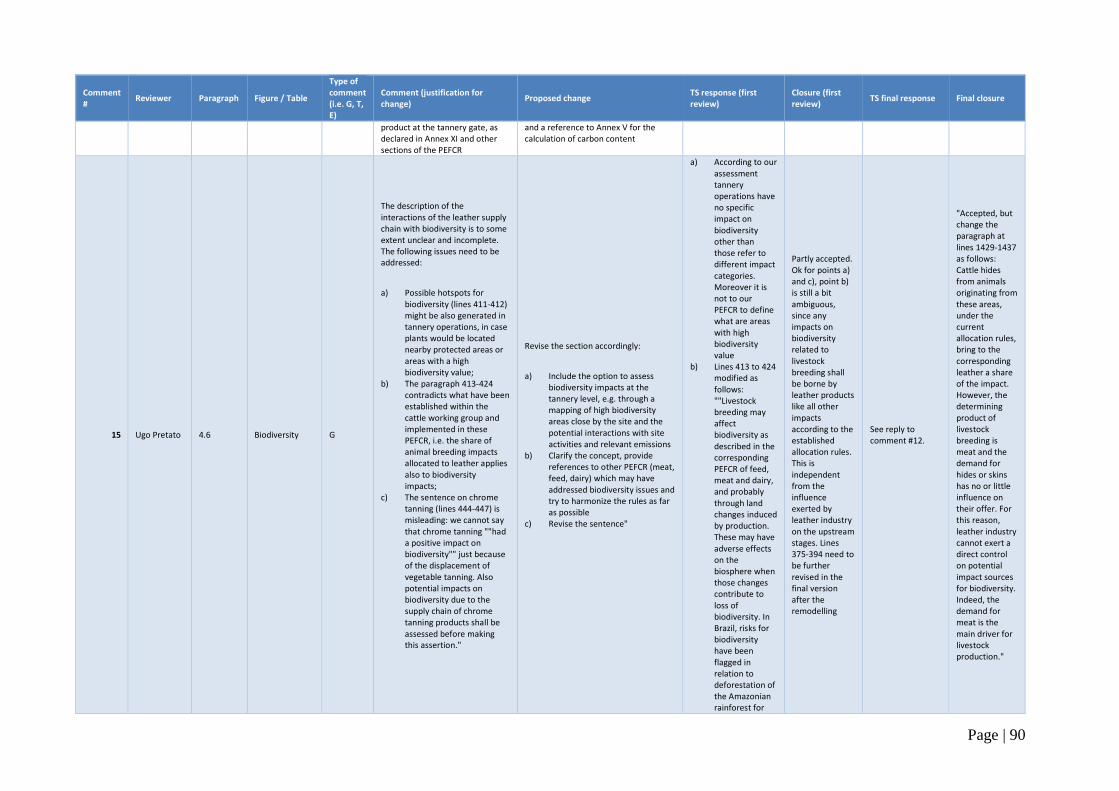
Page | 90
Comment #
Reviewer Paragraph Figure / Table
Type of comment (i.e. G, T, E)
Comment (justification for change)
Proposed change TS response (first review)
Closure (first review)
TS final response Final closure
product at the tannery gate, as declared in Annex XI and other sections of the PEFCR
and a reference to Annex V for the calculation of carbon content
15 Ugo Pretato 4.6 Biodiversity G
The description of the interactions of the leather supply chain with biodiversity is to some extent unclear and incomplete. The following issues need to be addressed:
a) Possible hotspots for biodiversity (lines 411-412) might be also generated in tannery operations, in case plants would be located nearby protected areas or areas with a high biodiversity value;
b) The paragraph 413-424 contradicts what have been established within the cattle working group and implemented in these PEFCR, i.e. the share of animal breeding impacts allocated to leather applies also to biodiversity impacts;
c) The sentence on chrome tanning (lines 444-447) is misleading: we cannot say that chrome tanning ""had a positive impact on biodiversity"" just because of the displacement of vegetable tanning. Also potential impacts on biodiversity due to the supply chain of chrome tanning products shall be assessed before making this assertion."
Revise the section accordingly:
a) Include the option to assess biodiversity impacts at the tannery level, e.g. through a mapping of high biodiversity areas close by the site and the potential interactions with site activities and relevant emissions
b) Clarify the concept, provide references to other PEFCR (meat, feed, dairy) which may have addressed biodiversity issues and try to harmonize the rules as far as possible
c) Revise the sentence"
a) According to our assessment tannery operations have no specific impact on biodiversity other than those refer to different impact categories. Moreover it is not to our PEFCR to define what are areas with high biodiversity value
b) Lines 413 to 424 modified as follows: ""Livestock breeding may affect biodiversity as described in the corresponding PEFCR of feed, meat and dairy, and probably through land changes induced by production. These may have adverse effects on the biosphere when those changes contribute to loss of biodiversity. In Brazil, risks for biodiversity have been flagged in relation to deforestation of the Amazonian rainforest for
Partly accepted. Ok for points a) and c), point b) is still a bit ambiguous, since any impacts on biodiversity related to livestock breeding shall be borne by leather products like all other impacts according to the established allocation rules. This is independent from the influence exerted by leather industry on the upstream stages. Lines 375-394 need to be further revised in the final version after the remodelling
See reply to comment #12.
"Accepted, but change the paragraph at lines 1429-1437 as follows: Cattle hides from animals originating from these areas, under the current allocation rules, bring to the corresponding leather a share of the impact. However, the determining product of livestock breeding is meat and the demand for hides or skins has no or little influence on their offer. For this reason, leather industry cannot exert a direct control on potential impact sources for biodiversity. Indeed, the demand for meat is the main driver for livestock production."
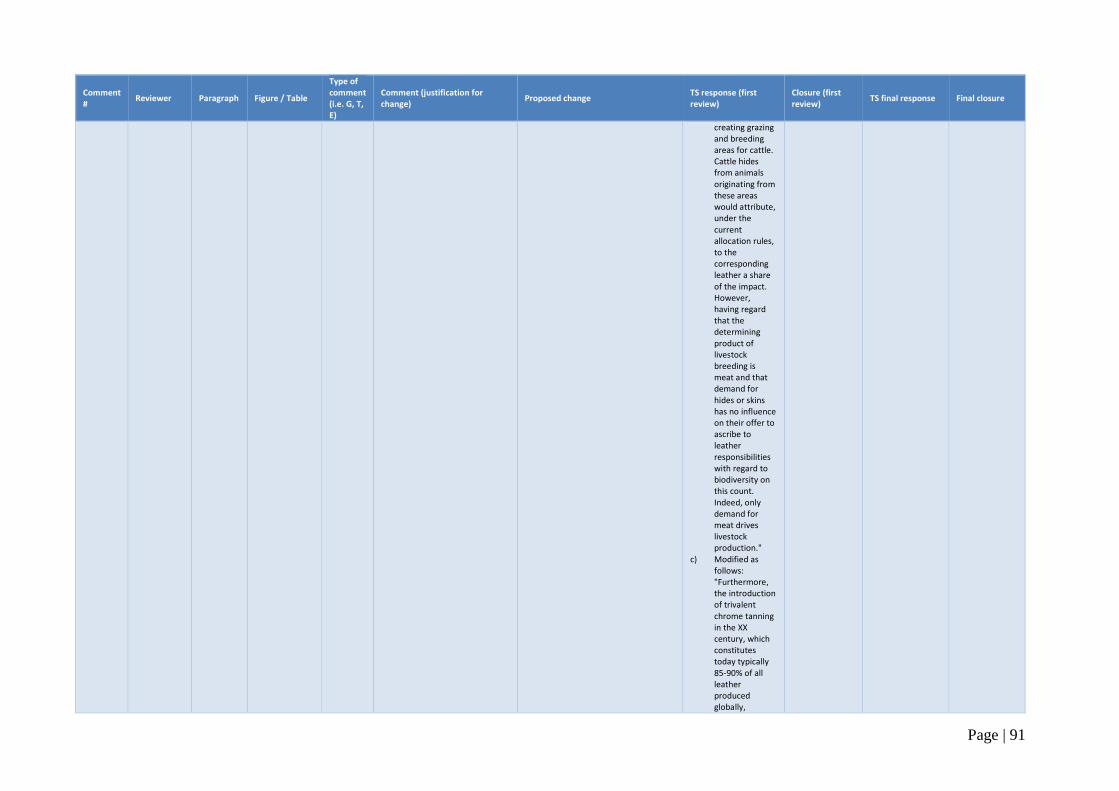
Page | 91
Comment #
Reviewer Paragraph Figure / Table
Type of comment (i.e. G, T, E)
Comment (justification for change)
Proposed change TS response (first review)
Closure (first review)
TS final response Final closure
creating grazing and breeding areas for cattle. Cattle hides from animals originating from these areas would attribute, under the current allocation rules, to the corresponding leather a share of the impact. However, having regard that the determining product of livestock breeding is meat and that demand for hides or skins has no influence on their offer to ascribe to leather responsibilities with regard to biodiversity on this count. Indeed, only demand for meat drives livestock production."
c) Modified as follows: "Furthermore, the introduction of trivalent chrome tanning in the XX century, which constitutes today typically 85-90% of all leather produced globally,
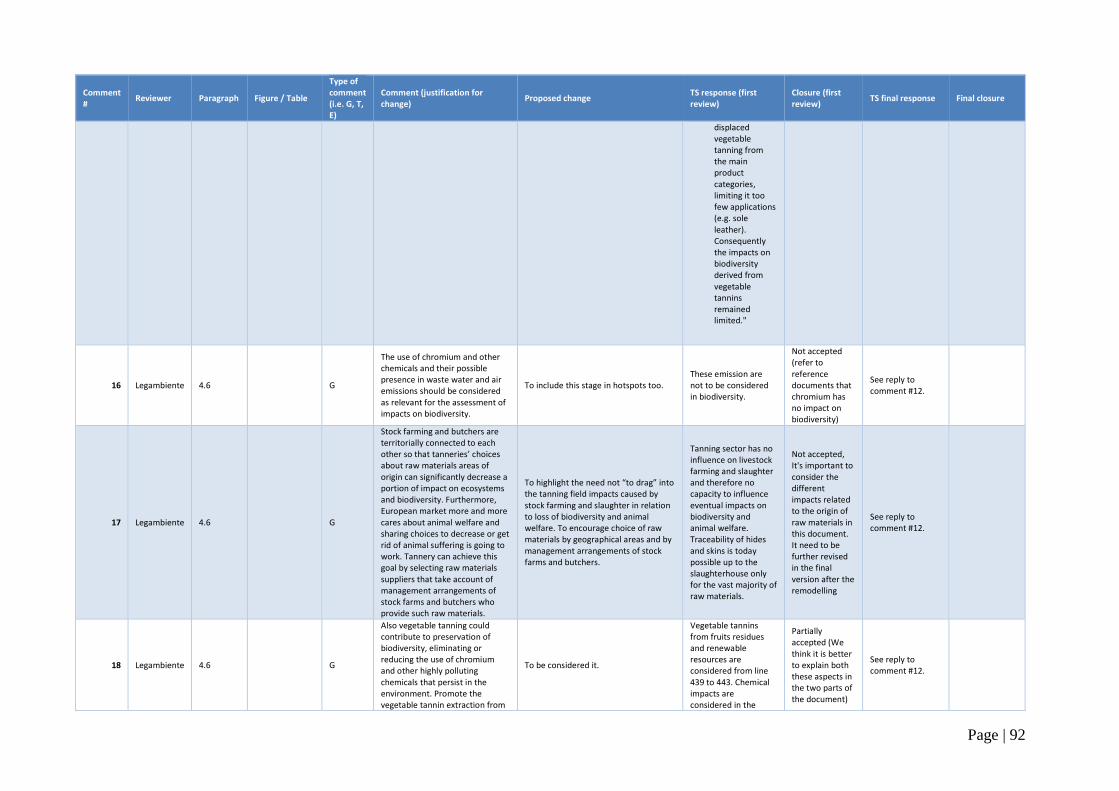
Page | 92
Comment #
Reviewer Paragraph Figure / Table
Type of comment (i.e. G, T, E)
Comment (justification for change)
Proposed change TS response (first review)
Closure (first review)
TS final response Final closure
displaced vegetable tanning from the main product categories, limiting it too few applications (e.g. sole leather). Consequently the impacts on biodiversity derived from vegetable tannins remained limited."
16 Legambiente 4.6 G
The use of chromium and other chemicals and their possible presence in waste water and air emissions should be considered as relevant for the assessment of impacts on biodiversity.
To include this stage in hotspots too. These emission are not to be considered in biodiversity.
Not accepted (refer to reference documents that chromium has no impact on biodiversity)
See reply to comment #12.
17 Legambiente 4.6 G
Stock farming and butchers are territorially connected to each other so that tanneries’ choices about raw materials areas of origin can significantly decrease a portion of impact on ecosystems and biodiversity. Furthermore, European market more and more cares about animal welfare and sharing choices to decrease or get rid of animal suffering is going to work. Tannery can achieve this goal by selecting raw materials suppliers that take account of management arrangements of stock farms and butchers who provide such raw materials.
To highlight the need not “to drag” into the tanning field impacts caused by stock farming and slaughter in relation to loss of biodiversity and animal welfare. To encourage choice of raw materials by geographical areas and by management arrangements of stock farms and butchers.
Tanning sector has no influence on livestock farming and slaughter and therefore no capacity to influence eventual impacts on biodiversity and animal welfare. Traceability of hides and skins is today possible up to the slaughterhouse only for the vast majority of raw materials.
Not accepted, It's important to consider the different impacts related to the origin of raw materials in this document. It need to be further revised in the final version after the remodelling
See reply to comment #12.
18 Legambiente 4.6 G
Also vegetable tanning could contribute to preservation of biodiversity, eliminating or reducing the use of chromium and other highly polluting chemicals that persist in the environment. Promote the vegetable tannin extraction from
To be considered it.
Vegetable tannins from fruits residues and renewable resources are considered from line 439 to 443. Chemical impacts are considered in the
Partially accepted (We think it is better to explain both these aspects in the two parts of the document)
See reply to comment #12.
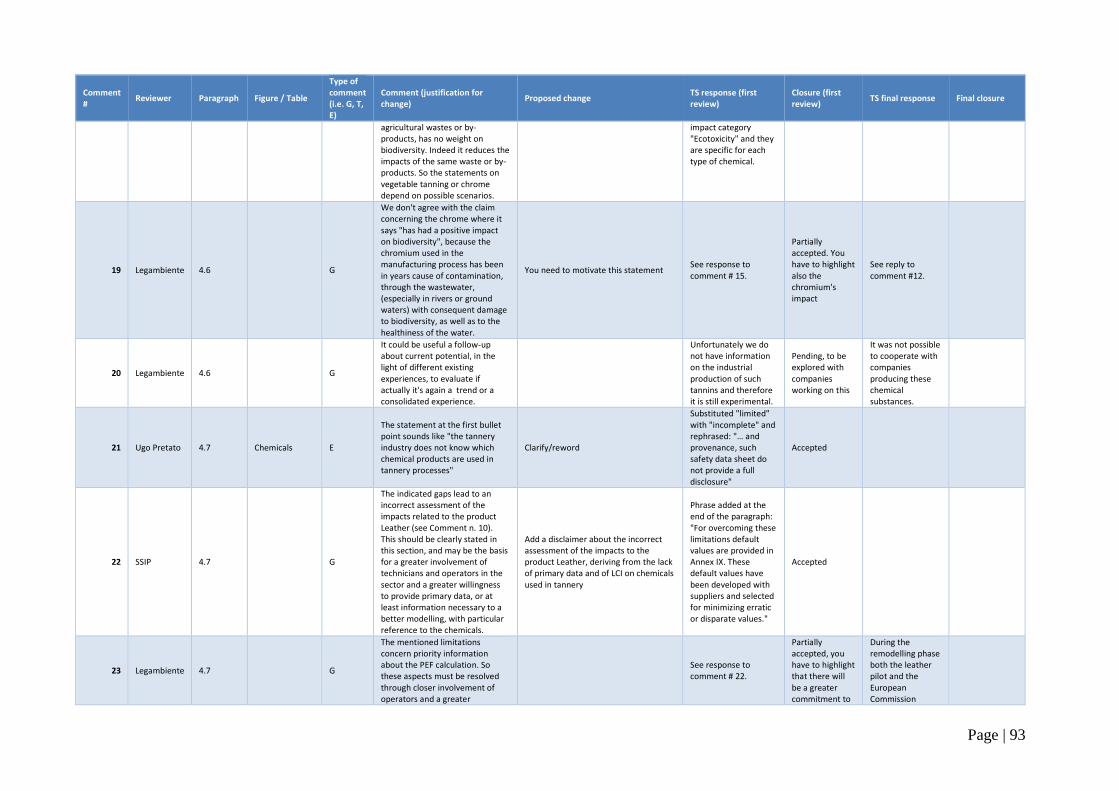
Page | 93
Comment #
Reviewer Paragraph Figure / Table
Type of comment (i.e. G, T, E)
Comment (justification for change)
Proposed change TS response (first review)
Closure (first review)
TS final response Final closure
agricultural wastes or by-products, has no weight on biodiversity. Indeed it reduces the impacts of the same waste or by-products. So the statements on vegetable tanning or chrome depend on possible scenarios.
impact category "Ecotoxicity" and they are specific for each type of chemical.
19 Legambiente 4.6 G
We don't agree with the claim concerning the chrome where it says "has had a positive impact on biodiversity", because the chromium used in the manufacturing process has been in years cause of contamination, through the wastewater, (especially in rivers or ground waters) with consequent damage to biodiversity, as well as to the healthiness of the water.
You need to motivate this statement See response to comment # 15.
Partially accepted. You have to highlight also the chromium's impact
See reply to comment #12.
20 Legambiente 4.6 G
It could be useful a follow-up about current potential, in the light of different existing experiences, to evaluate if actually it's again a trend or a consolidated experience.
Unfortunately we do not have information on the industrial production of such tannins and therefore it is still experimental.
Pending, to be explored with companies working on this
It was not possible to cooperate with companies producing these chemical substances.
21 Ugo Pretato 4.7 Chemicals E
The statement at the first bullet point sounds like "the tannery industry does not know which chemical products are used in tannery processes"
Clarify/reword
Substituted "limited" with "incomplete" and rephrased: "… and provenance, such safety data sheet do not provide a full disclosure"
Accepted
22 SSIP 4.7 G
The indicated gaps lead to an incorrect assessment of the impacts related to the product Leather (see Comment n. 10). This should be clearly stated in this section, and may be the basis for a greater involvement of technicians and operators in the sector and a greater willingness to provide primary data, or at least information necessary to a better modelling, with particular reference to the chemicals.
Add a disclaimer about the incorrect assessment of the impacts to the product Leather, deriving from the lack of primary data and of LCI on chemicals used in tannery
Phrase added at the end of the paragraph: "For overcoming these limitations default values are provided in Annex IX. These default values have been developed with suppliers and selected for minimizing erratic or disparate values."
Accepted
23 Legambiente 4.7 G
The mentioned limitations concern priority information about the PEF calculation. So these aspects must be resolved through closer involvement of operators and a greater
See response to comment # 22.
Partially accepted, you have to highlight that there will be a greater commitment to
During the remodelling phase both the leather pilot and the European Commission
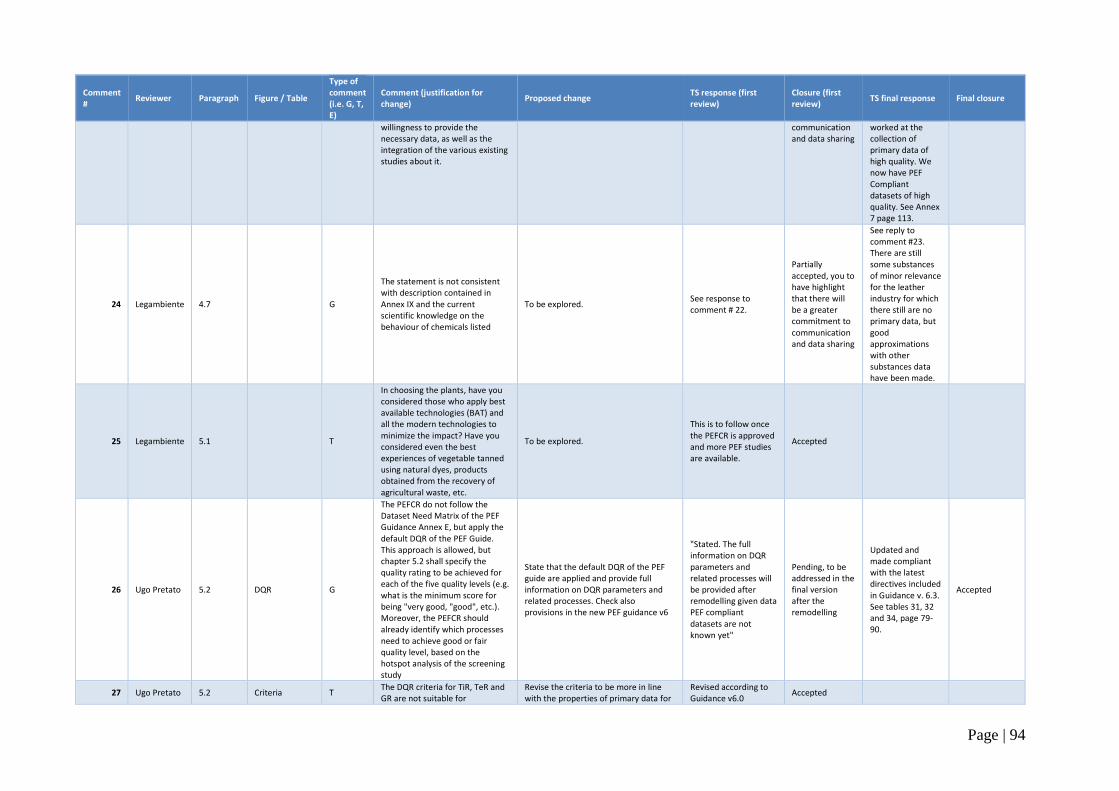
Page | 94
Comment #
Reviewer Paragraph Figure / Table
Type of comment (i.e. G, T, E)
Comment (justification for change)
Proposed change TS response (first review)
Closure (first review)
TS final response Final closure
willingness to provide the necessary data, as well as the integration of the various existing studies about it.
communication and data sharing
worked at the collection of primary data of high quality. We now have PEF Compliant datasets of high quality. See Annex 7 page 113.
24 Legambiente 4.7 G
The statement is not consistent with description contained in Annex IX and the current scientific knowledge on the behaviour of chemicals listed
To be explored. See response to comment # 22.
Partially accepted, you to have highlight that there will be a greater commitment to communication and data sharing
See reply to comment #23. There are still some substances of minor relevance for the leather industry for which there still are no primary data, but good approximations with other substances data have been made.
25 Legambiente 5.1 T
In choosing the plants, have you considered those who apply best available technologies (BAT) and all the modern technologies to minimize the impact? Have you considered even the best experiences of vegetable tanned using natural dyes, products obtained from the recovery of agricultural waste, etc.
To be explored.
This is to follow once the PEFCR is approved and more PEF studies are available.
Accepted
26 Ugo Pretato 5.2 DQR G
The PEFCR do not follow the Dataset Need Matrix of the PEF Guidance Annex E, but apply the default DQR of the PEF Guide. This approach is allowed, but chapter 5.2 shall specify the quality rating to be achieved for each of the five quality levels (e.g. what is the minimum score for being "very good, "good", etc.). Moreover, the PEFCR should already identify which processes need to achieve good or fair quality level, based on the hotspot analysis of the screening study
State that the default DQR of the PEF guide are applied and provide full information on DQR parameters and related processes. Check also provisions in the new PEF guidance v6
"Stated. The full information on DQR parameters and related processes will be provided after remodelling given data PEF compliant datasets are not known yet"
Pending, to be addressed in the final version after the remodelling
Updated and made compliant with the latest directives included in Guidance v. 6.3. See tables 31, 32 and 34, page 79-90.
Accepted
27 Ugo Pretato 5.2 Criteria T The DQR criteria for TiR, TeR and GR are not suitable for
Revise the criteria to be more in line with the properties of primary data for
Revised according to Guidance v6.0
Accepted
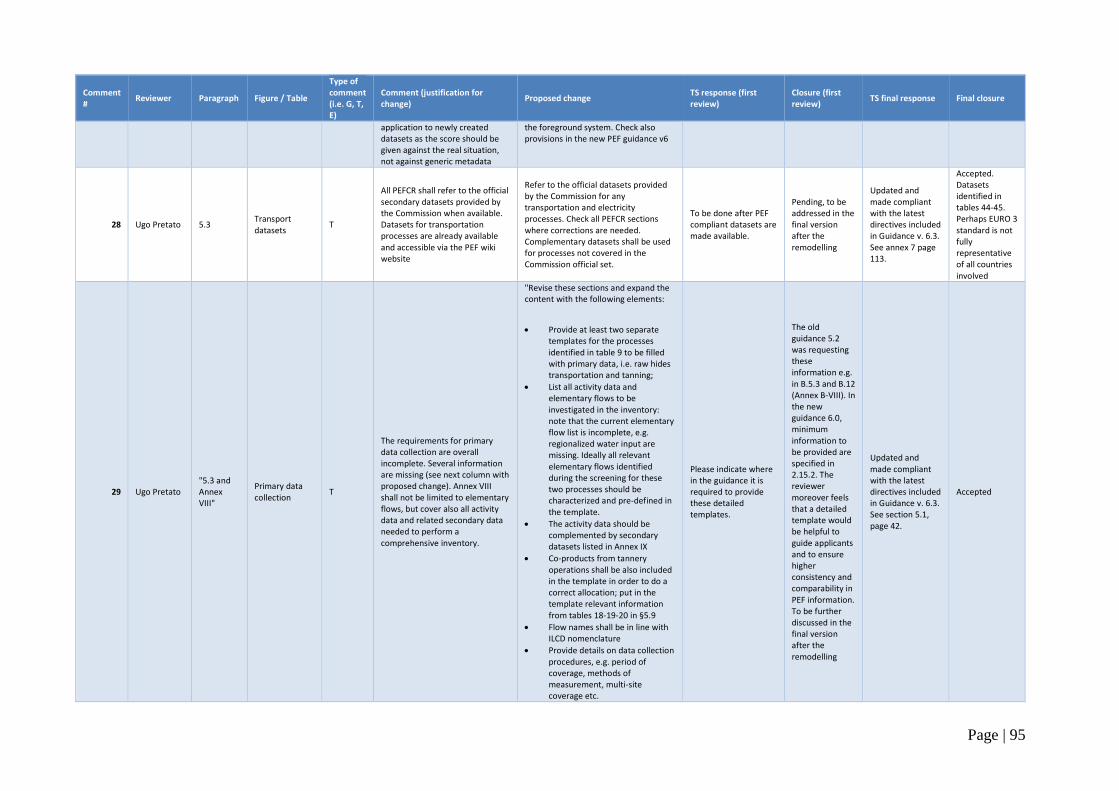
Page | 95
Comment #
Reviewer Paragraph Figure / Table
Type of comment (i.e. G, T, E)
Comment (justification for change)
Proposed change TS response (first review)
Closure (first review)
TS final response Final closure
application to newly created datasets as the score should be given against the real situation, not against generic metadata
the foreground system. Check also provisions in the new PEF guidance v6
28 Ugo Pretato 5.3 Transport datasets
T
All PEFCR shall refer to the official secondary datasets provided by the Commission when available. Datasets for transportation processes are already available and accessible via the PEF wiki website
Refer to the official datasets provided by the Commission for any transportation and electricity processes. Check all PEFCR sections where corrections are needed. Complementary datasets shall be used for processes not covered in the Commission official set.
To be done after PEF compliant datasets are made available.
Pending, to be addressed in the final version after the remodelling
Updated and made compliant with the latest directives included in Guidance v. 6.3. See annex 7 page 113.
Accepted. Datasets identified in tables 44-45. Perhaps EURO 3 standard is not fully representative of all countries involved
29 Ugo Pretato "5.3 and Annex VIII"
Primary data collection
T
The requirements for primary data collection are overall incomplete. Several information are missing (see next column with proposed change). Annex VIII shall not be limited to elementary flows, but cover also all activity data and related secondary data needed to perform a comprehensive inventory.
"Revise these sections and expand the content with the following elements:
Provide at least two separate templates for the processes identified in table 9 to be filled with primary data, i.e. raw hides transportation and tanning;
List all activity data and elementary flows to be investigated in the inventory: note that the current elementary flow list is incomplete, e.g. regionalized water input are missing. Ideally all relevant elementary flows identified during the screening for these two processes should be characterized and pre-defined in the template.
The activity data should be complemented by secondary datasets listed in Annex IX
Co-products from tannery operations shall be also included in the template in order to do a correct allocation; put in the template relevant information from tables 18-19-20 in §5.9
Flow names shall be in line with ILCD nomenclature
Provide details on data collection procedures, e.g. period of coverage, methods of measurement, multi-site coverage etc.
Please indicate where in the guidance it is required to provide these detailed templates.
The old guidance 5.2 was requesting these information e.g. in B.5.3 and B.12 (Annex B-VIII). In the new guidance 6.0, minimum information to be provided are specified in 2.15.2. The reviewer moreover feels that a detailed template would be helpful to guide applicants and to ensure higher consistency and comparability in PEF information. To be further discussed in the final version after the remodelling
Updated and made compliant with the latest directives included in Guidance v. 6.3. See section 5.1, page 42.
Accepted
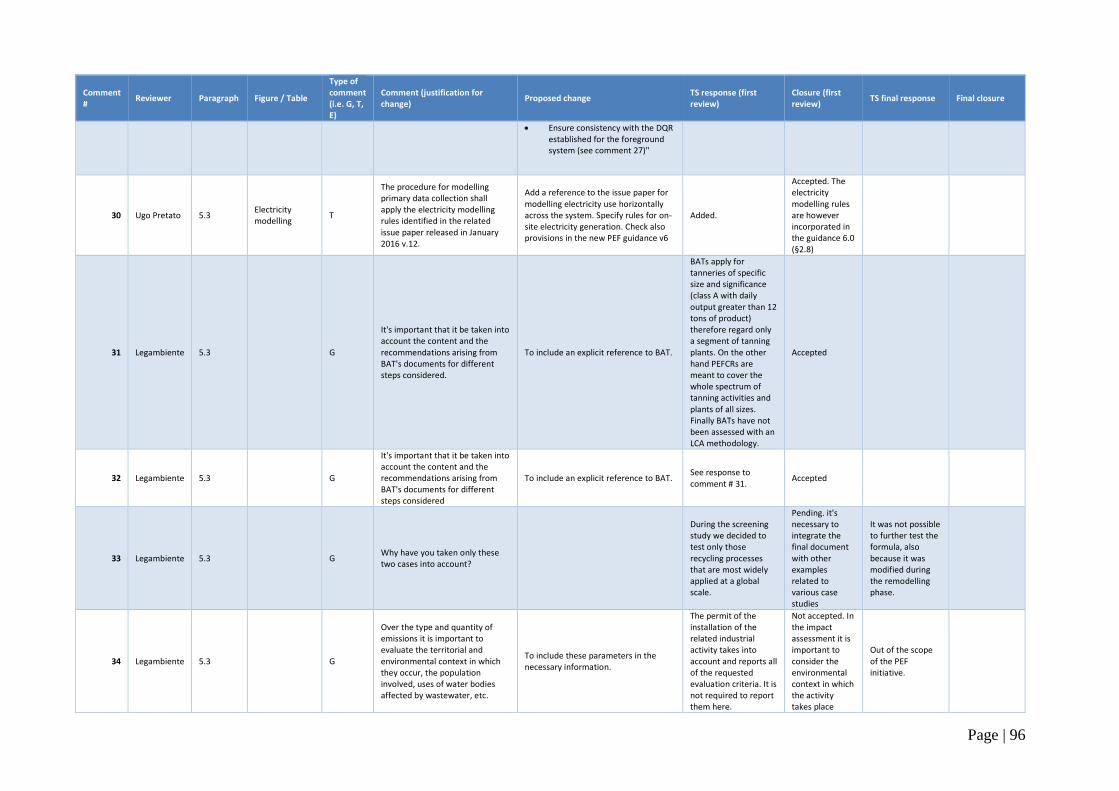
Page | 96
Comment #
Reviewer Paragraph Figure / Table
Type of comment (i.e. G, T, E)
Comment (justification for change)
Proposed change TS response (first review)
Closure (first review)
TS final response Final closure
Ensure consistency with the DQR established for the foreground system (see comment 27)"
30 Ugo Pretato 5.3 Electricity modelling
T
The procedure for modelling primary data collection shall apply the electricity modelling rules identified in the related issue paper released in January 2016 v.12.
Add a reference to the issue paper for modelling electricity use horizontally across the system. Specify rules for on-site electricity generation. Check also provisions in the new PEF guidance v6
Added.
Accepted. The electricity modelling rules are however incorporated in the guidance 6.0 (§2.8)
31 Legambiente 5.3 G
It's important that it be taken into account the content and the recommendations arising from BAT's documents for different steps considered.
To include an explicit reference to BAT.
BATs apply for tanneries of specific size and significance (class A with daily output greater than 12 tons of product) therefore regard only a segment of tanning plants. On the other hand PEFCRs are meant to cover the whole spectrum of tanning activities and plants of all sizes. Finally BATs have not been assessed with an LCA methodology.
Accepted
32 Legambiente 5.3 G
It's important that it be taken into account the content and the recommendations arising from BAT's documents for different steps considered
To include an explicit reference to BAT. See response to comment # 31.
Accepted
33 Legambiente 5.3 G Why have you taken only these two cases into account?
During the screening study we decided to test only those recycling processes that are most widely applied at a global scale.
Pending. it's necessary to integrate the final document with other examples related to various case studies
It was not possible to further test the formula, also because it was modified during the remodelling phase.
34 Legambiente 5.3 G
Over the type and quantity of emissions it is important to evaluate the territorial and environmental context in which they occur, the population involved, uses of water bodies affected by wastewater, etc.
To include these parameters in the necessary information.
The permit of the installation of the related industrial activity takes into account and reports all of the requested evaluation criteria. It is not required to report them here.
Not accepted. In the impact assessment it is important to consider the environmental context in which the activity takes place
Out of the scope of the PEF initiative.
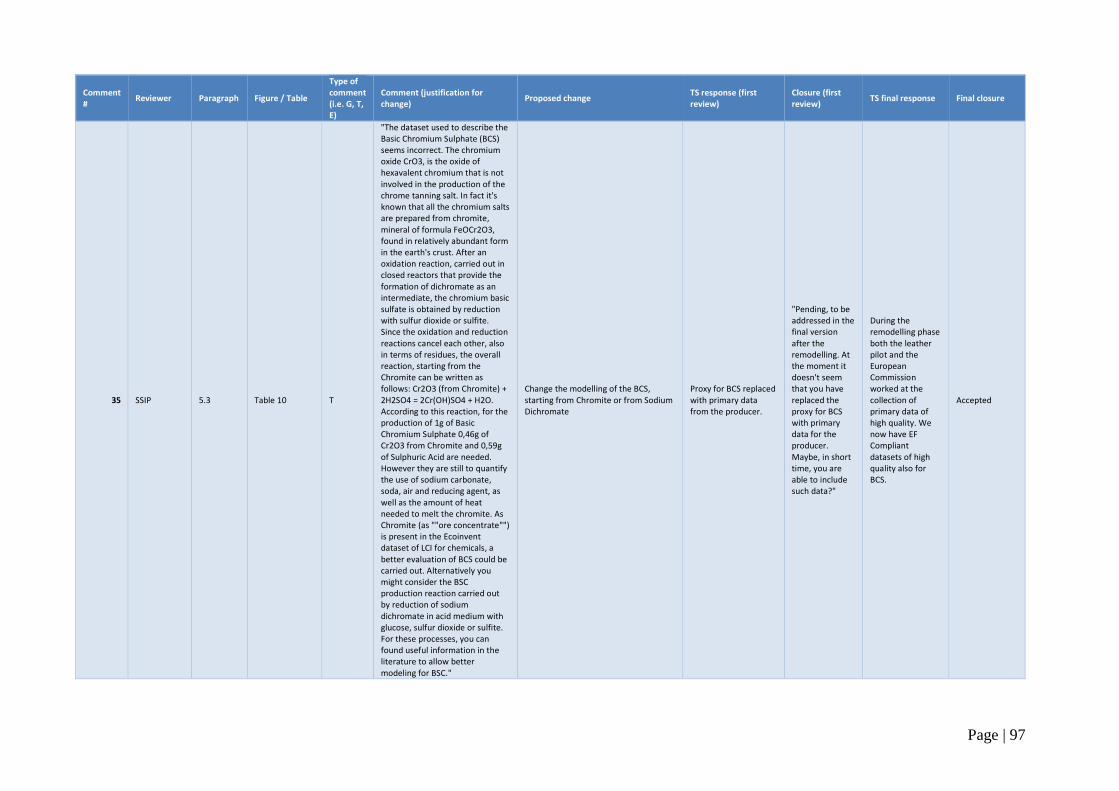
Page | 97
Comment #
Reviewer Paragraph Figure / Table
Type of comment (i.e. G, T, E)
Comment (justification for change)
Proposed change TS response (first review)
Closure (first review)
TS final response Final closure
35 SSIP 5.3 Table 10 T
"The dataset used to describe the Basic Chromium Sulphate (BCS) seems incorrect. The chromium oxide CrO3, is the oxide of hexavalent chromium that is not involved in the production of the chrome tanning salt. In fact it's known that all the chromium salts are prepared from chromite, mineral of formula FeOCr2O3, found in relatively abundant form in the earth's crust. After an oxidation reaction, carried out in closed reactors that provide the formation of dichromate as an intermediate, the chromium basic sulfate is obtained by reduction with sulfur dioxide or sulfite. Since the oxidation and reduction reactions cancel each other, also in terms of residues, the overall reaction, starting from the Chromite can be written as follows: Cr2O3 (from Chromite) + 2H2SO4 = 2Cr(OH)SO4 + H2O. According to this reaction, for the production of 1g of Basic Chromium Sulphate 0,46g of Cr2O3 from Chromite and 0,59g of Sulphuric Acid are needed. However they are still to quantify the use of sodium carbonate, soda, air and reducing agent, as well as the amount of heat needed to melt the chromite. As Chromite (as ""ore concentrate"") is present in the Ecoinvent dataset of LCI for chemicals, a better evaluation of BCS could be carried out. Alternatively you might consider the BSC production reaction carried out by reduction of sodium dichromate in acid medium with glucose, sulfur dioxide or sulfite. For these processes, you can found useful information in the literature to allow better modeling for BSC."
Change the modelling of the BCS, starting from Chromite or from Sodium Dichromate
Proxy for BCS replaced with primary data from the producer.
"Pending, to be addressed in the final version after the remodelling. At the moment it doesn't seem that you have replaced the proxy for BCS with primary data for the producer. Maybe, in short time, you are able to include such data?"
During the remodelling phase both the leather pilot and the European Commission worked at the collection of primary data of high quality. We now have EF Compliant datasets of high quality also for BCS.
Accepted
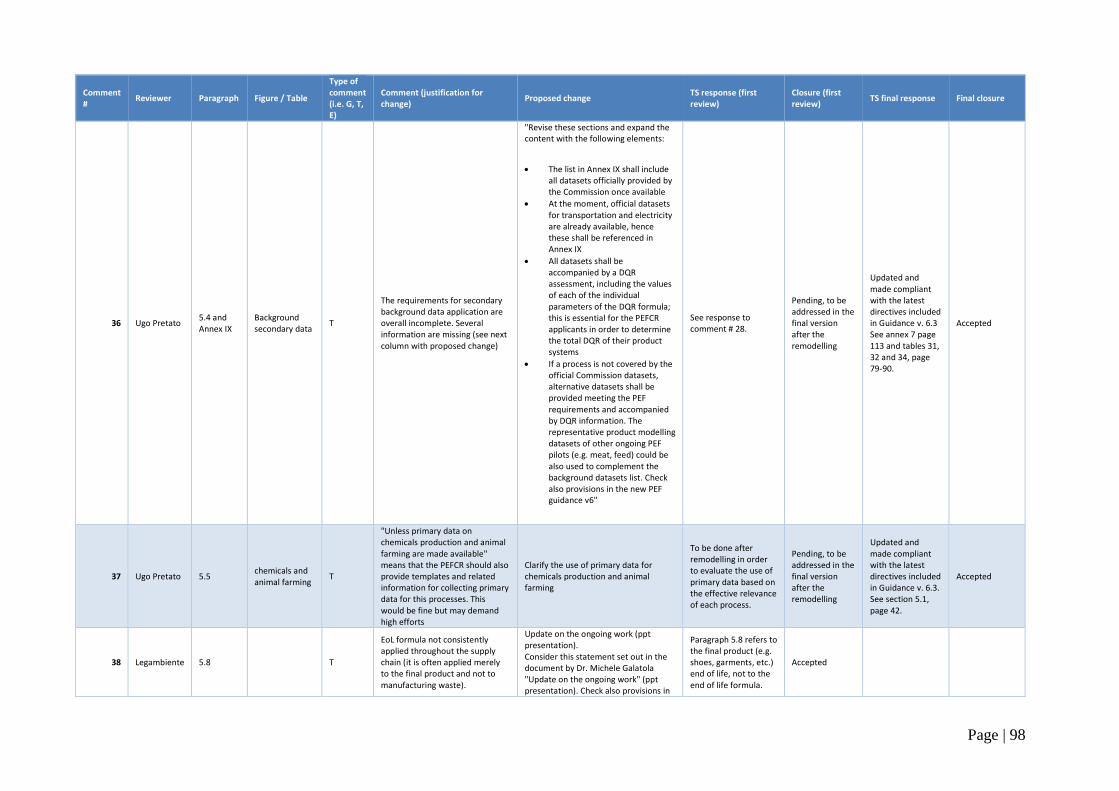
Page | 98
Comment #
Reviewer Paragraph Figure / Table
Type of comment (i.e. G, T, E)
Comment (justification for change)
Proposed change TS response (first review)
Closure (first review)
TS final response Final closure
36 Ugo Pretato 5.4 and Annex IX
Background secondary data
T
The requirements for secondary background data application are overall incomplete. Several information are missing (see next column with proposed change)
"Revise these sections and expand the content with the following elements:
The list in Annex IX shall include all datasets officially provided by the Commission once available
At the moment, official datasets for transportation and electricity are already available, hence these shall be referenced in Annex IX
All datasets shall be accompanied by a DQR assessment, including the values of each of the individual parameters of the DQR formula; this is essential for the PEFCR applicants in order to determine the total DQR of their product systems
If a process is not covered by the official Commission datasets, alternative datasets shall be provided meeting the PEF requirements and accompanied by DQR information. The representative product modelling datasets of other ongoing PEF pilots (e.g. meat, feed) could be also used to complement the background datasets list. Check also provisions in the new PEF guidance v6"
See response to comment # 28.
Pending, to be addressed in the final version after the remodelling
Updated and made compliant with the latest directives included in Guidance v. 6.3 See annex 7 page 113 and tables 31, 32 and 34, page 79-90.
Accepted
37 Ugo Pretato 5.5 chemicals and animal farming
T
"Unless primary data on chemicals production and animal farming are made available" means that the PEFCR should also provide templates and related information for collecting primary data for this processes. This would be fine but may demand high efforts
Clarify the use of primary data for chemicals production and animal farming
To be done after remodelling in order to evaluate the use of primary data based on the effective relevance of each process.
Pending, to be addressed in the final version after the remodelling
Updated and made compliant with the latest directives included in Guidance v. 6.3. See section 5.1, page 42.
Accepted
38 Legambiente 5.8 T
EoL formula not consistently applied throughout the supply chain (it is often applied merely to the final product and not to manufacturing waste).
Update on the ongoing work (ppt presentation). Consider this statement set out in the document by Dr. Michele Galatola "Update on the ongoing work" (ppt presentation). Check also provisions in
Paragraph 5.8 refers to the final product (e.g. shoes, garments, etc.) end of life, not to the end of life formula.
Accepted
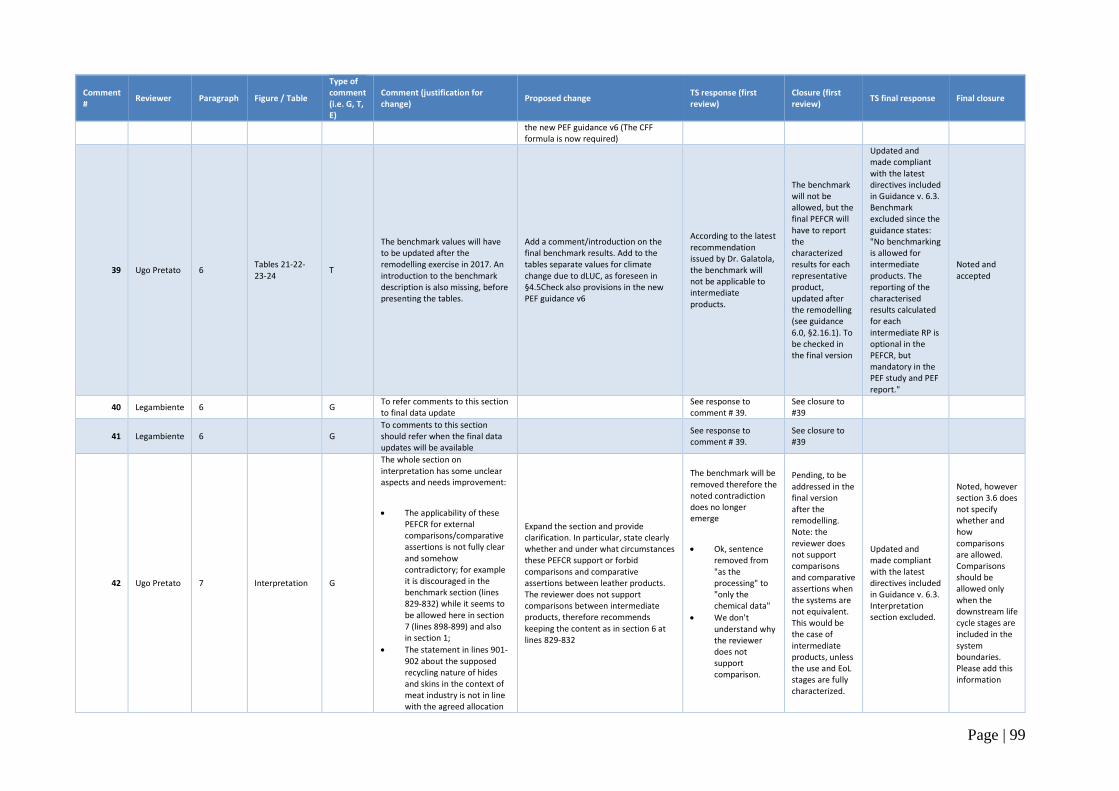
Page | 99
Comment #
Reviewer Paragraph Figure / Table
Type of comment (i.e. G, T, E)
Comment (justification for change)
Proposed change TS response (first review)
Closure (first review)
TS final response Final closure
the new PEF guidance v6 (The CFF formula is now required)
39 Ugo Pretato 6 Tables 21-22-23-24
T
The benchmark values will have to be updated after the remodelling exercise in 2017. An introduction to the benchmark description is also missing, before presenting the tables.
Add a comment/introduction on the final benchmark results. Add to the tables separate values for climate change due to dLUC, as foreseen in §4.5Check also provisions in the new PEF guidance v6
According to the latest recommendation issued by Dr. Galatola, the benchmark will not be applicable to intermediate products.
The benchmark will not be allowed, but the final PEFCR will have to report the characterized results for each representative product, updated after the remodelling (see guidance 6.0, §2.16.1). To be checked in the final version
Updated and made compliant with the latest directives included in Guidance v. 6.3. Benchmark excluded since the guidance states: "No benchmarking is allowed for intermediate products. The reporting of the characterised results calculated for each intermediate RP is optional in the PEFCR, but mandatory in the PEF study and PEF report."
Noted and accepted
40 Legambiente 6 G To refer comments to this section to final data update
See response to comment # 39.
See closure to #39
41 Legambiente 6 G To comments to this section should refer when the final data updates will be available
See response to comment # 39.
See closure to #39
42 Ugo Pretato 7 Interpretation G
The whole section on interpretation has some unclear aspects and needs improvement:
The applicability of these PEFCR for external comparisons/comparative assertions is not fully clear and somehow contradictory; for example it is discouraged in the benchmark section (lines 829-832) while it seems to be allowed here in section 7 (lines 898-899) and also in section 1;
The statement in lines 901-902 about the supposed recycling nature of hides and skins in the context of meat industry is not in line with the agreed allocation
Expand the section and provide clarification. In particular, state clearly whether and under what circumstances these PEFCR support or forbid comparisons and comparative assertions between leather products. The reviewer does not support comparisons between intermediate products, therefore recommends keeping the content as in section 6 at lines 829-832
The benchmark will be removed therefore the noted contradiction does no longer emerge
Ok, sentence removed from "as the processing" to "only the chemical data"
We don't understand why the reviewer does not support comparison.
Pending, to be addressed in the final version after the remodelling. Note: the reviewer does not support comparisons and comparative assertions when the systems are not equivalent. This would be the case of intermediate products, unless the use and EoL stages are fully characterized.
Updated and made compliant with the latest directives included in Guidance v. 6.3. Interpretation section excluded.
Noted, however section 3.6 does not specify whether and how comparisons are allowed. Comparisons should be allowed only when the downstream life cycle stages are included in the system boundaries. Please add this information
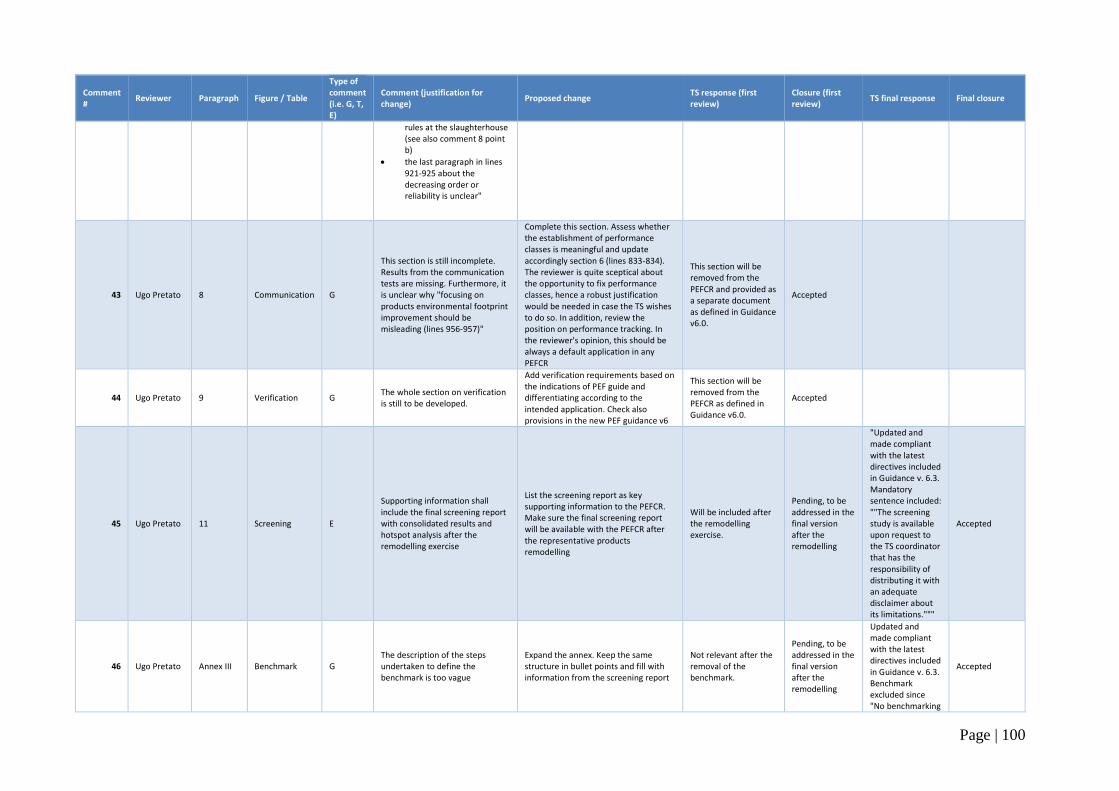
Page | 100
Comment #
Reviewer Paragraph Figure / Table
Type of comment (i.e. G, T, E)
Comment (justification for change)
Proposed change TS response (first review)
Closure (first review)
TS final response Final closure
rules at the slaughterhouse (see also comment 8 point b)
the last paragraph in lines 921-925 about the decreasing order or reliability is unclear"
43 Ugo Pretato 8 Communication G
This section is still incomplete. Results from the communication tests are missing. Furthermore, it is unclear why "focusing on products environmental footprint improvement should be misleading (lines 956-957)"
Complete this section. Assess whether the establishment of performance classes is meaningful and update accordingly section 6 (lines 833-834). The reviewer is quite sceptical about the opportunity to fix performance classes, hence a robust justification would be needed in case the TS wishes to do so. In addition, review the position on performance tracking. In the reviewer's opinion, this should be always a default application in any PEFCR
This section will be removed from the PEFCR and provided as a separate document as defined in Guidance v6.0.
Accepted
44 Ugo Pretato 9 Verification G The whole section on verification is still to be developed.
Add verification requirements based on the indications of PEF guide and differentiating according to the intended application. Check also provisions in the new PEF guidance v6
This section will be removed from the PEFCR as defined in Guidance v6.0.
Accepted
45 Ugo Pretato 11 Screening E
Supporting information shall include the final screening report with consolidated results and hotspot analysis after the remodelling exercise
List the screening report as key supporting information to the PEFCR. Make sure the final screening report will be available with the PEFCR after the representative products remodelling
Will be included after the remodelling exercise.
Pending, to be addressed in the final version after the remodelling
"Updated and made compliant with the latest directives included in Guidance v. 6.3. Mandatory sentence included: ""The screening study is available upon request to the TS coordinator that has the responsibility of distributing it with an adequate disclaimer about its limitations."""
Accepted
46 Ugo Pretato Annex III Benchmark G The description of the steps undertaken to define the benchmark is too vague
Expand the annex. Keep the same structure in bullet points and fill with information from the screening report
Not relevant after the removal of the benchmark.
Pending, to be addressed in the final version after the remodelling
Updated and made compliant with the latest directives included in Guidance v. 6.3. Benchmark excluded since "No benchmarking
Accepted
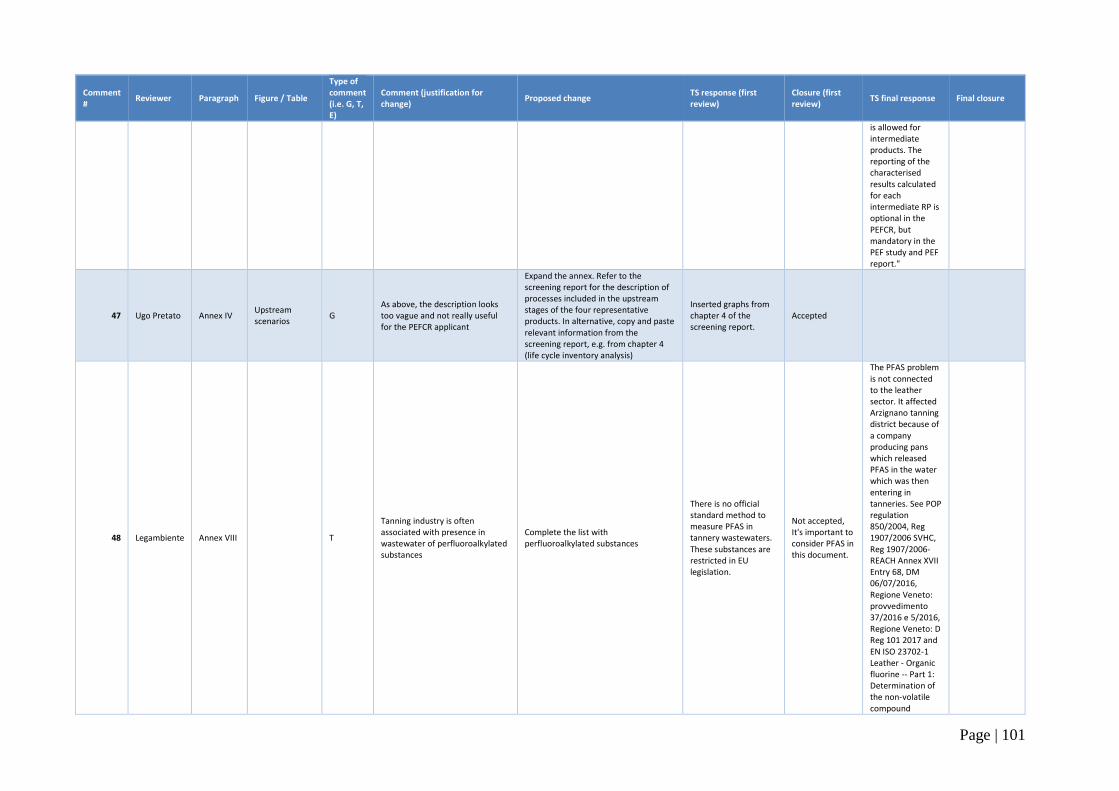
Page | 101
Comment #
Reviewer Paragraph Figure / Table
Type of comment (i.e. G, T, E)
Comment (justification for change)
Proposed change TS response (first review)
Closure (first review)
TS final response Final closure
is allowed for intermediate products. The reporting of the characterised results calculated for each intermediate RP is optional in the PEFCR, but mandatory in the PEF study and PEF report."
47 Ugo Pretato Annex IV Upstream scenarios
G As above, the description looks too vague and not really useful for the PEFCR applicant
Expand the annex. Refer to the screening report for the description of processes included in the upstream stages of the four representative products. In alternative, copy and paste relevant information from the screening report, e.g. from chapter 4 (life cycle inventory analysis)
Inserted graphs from chapter 4 of the screening report.
Accepted
48 Legambiente Annex VIII T
Tanning industry is often associated with presence in wastewater of perfluoroalkylated substances
Complete the list with perfluoroalkylated substances
There is no official standard method to measure PFAS in tannery wastewaters. These substances are restricted in EU legislation.
Not accepted, It's important to consider PFAS in this document.
The PFAS problem is not connected to the leather sector. It affected Arzignano tanning district because of a company producing pans which released PFAS in the water which was then entering in tanneries. See POP regulation 850/2004, Reg 1907/2006 SVHC, Reg 1907/2006-REACH Annex XVII Entry 68, DM 06/07/2016, Regione Veneto: provvedimento 37/2016 e 5/2016, Regione Veneto: D Reg 101 2017 and EN ISO 23702-1 Leather - Organic fluorine -- Part 1: Determination of the non-volatile compound
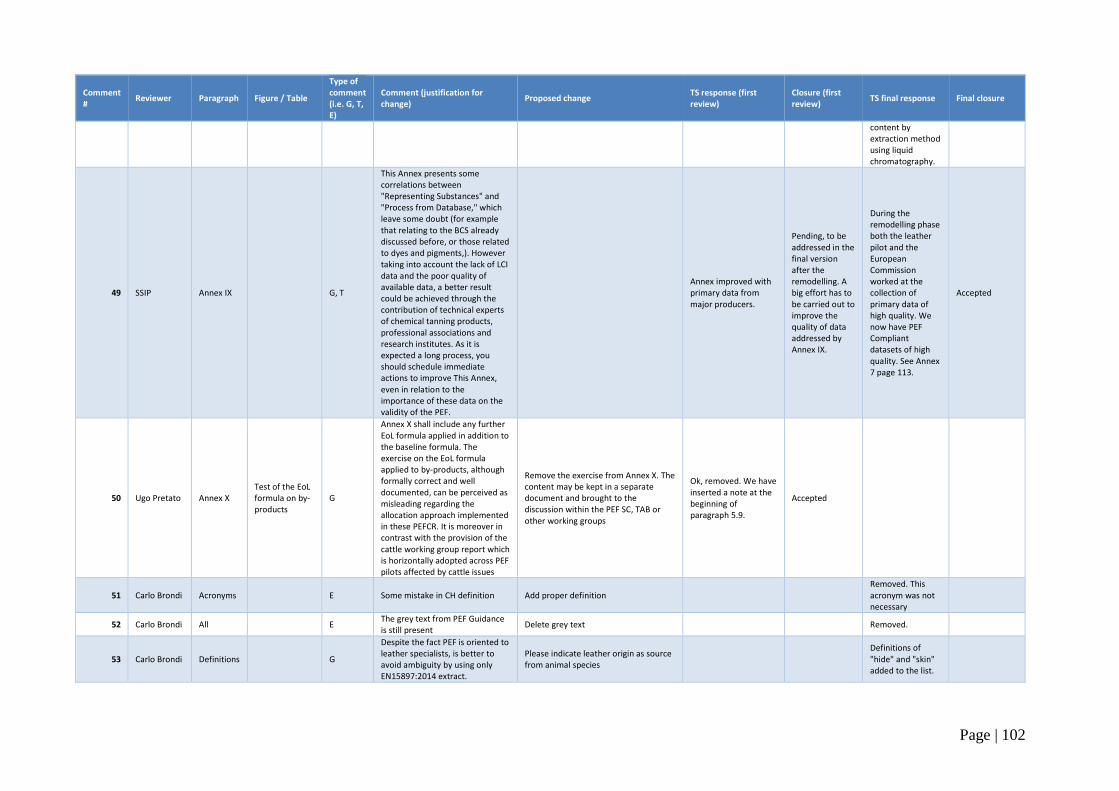
Page | 102
Comment #
Reviewer Paragraph Figure / Table
Type of comment (i.e. G, T, E)
Comment (justification for change)
Proposed change TS response (first review)
Closure (first review)
TS final response Final closure
content by extraction method using liquid chromatography.
49 SSIP Annex IX G, T
This Annex presents some correlations between "Representing Substances" and "Process from Database," which leave some doubt (for example that relating to the BCS already discussed before, or those related to dyes and pigments,). However taking into account the lack of LCI data and the poor quality of available data, a better result could be achieved through the contribution of technical experts of chemical tanning products, professional associations and research institutes. As it is expected a long process, you should schedule immediate actions to improve This Annex, even in relation to the importance of these data on the validity of the PEF.
Annex improved with primary data from major producers.
Pending, to be addressed in the final version after the remodelling. A big effort has to be carried out to improve the quality of data addressed by Annex IX.
During the remodelling phase both the leather pilot and the European Commission worked at the collection of primary data of high quality. We now have PEF Compliant datasets of high quality. See Annex 7 page 113.
Accepted
50 Ugo Pretato Annex X Test of the EoL formula on by-products
G
Annex X shall include any further EoL formula applied in addition to the baseline formula. The exercise on the EoL formula applied to by-products, although formally correct and well documented, can be perceived as misleading regarding the allocation approach implemented in these PEFCR. It is moreover in contrast with the provision of the cattle working group report which is horizontally adopted across PEF pilots affected by cattle issues
Remove the exercise from Annex X. The content may be kept in a separate document and brought to the discussion within the PEF SC, TAB or other working groups
Ok, removed. We have inserted a note at the beginning of paragraph 5.9.
Accepted
51 Carlo Brondi Acronyms E Some mistake in CH definition Add proper definition Removed. This acronym was not necessary
52 Carlo Brondi All E The grey text from PEF Guidance is still present
Delete grey text Removed.
53 Carlo Brondi Definitions G
Despite the fact PEF is oriented to leather specialists, is better to avoid ambiguity by using only EN15897:2014 extract.
Please indicate leather origin as source from animal species
Definitions of "hide" and "skin" added to the list.
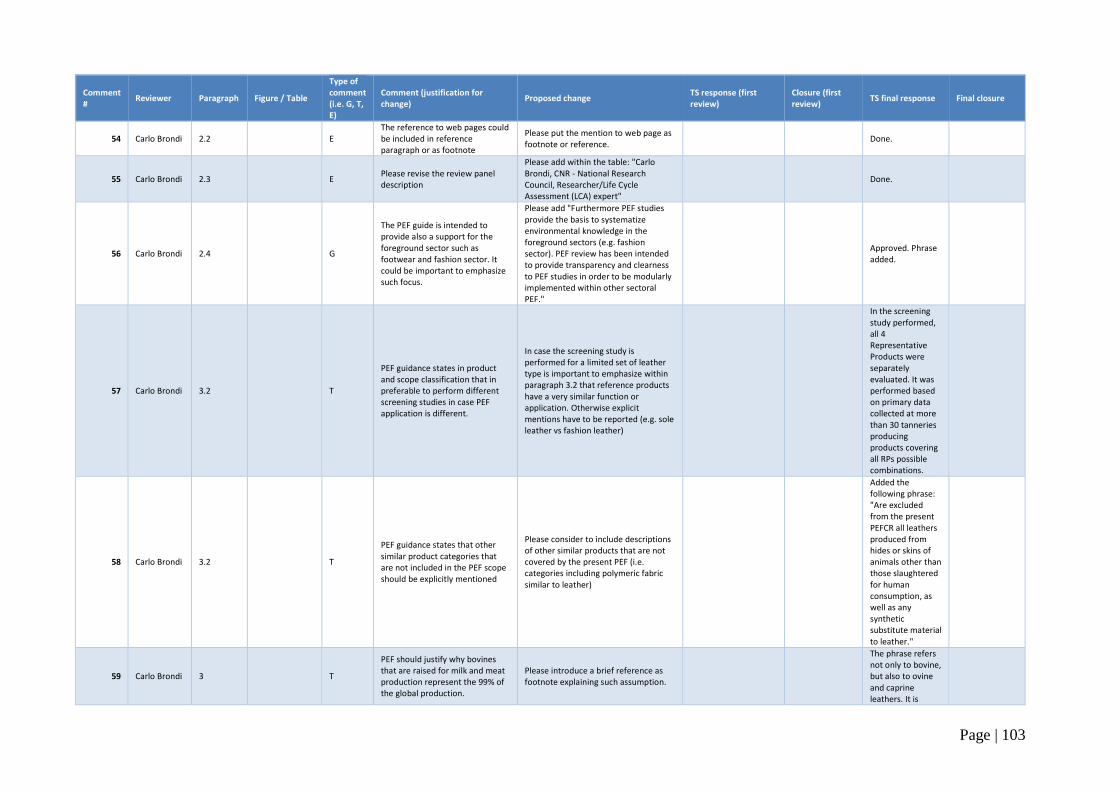
Page | 103
Comment #
Reviewer Paragraph Figure / Table
Type of comment (i.e. G, T, E)
Comment (justification for change)
Proposed change TS response (first review)
Closure (first review)
TS final response Final closure
54 Carlo Brondi 2.2 E The reference to web pages could be included in reference paragraph or as footnote
Please put the mention to web page as footnote or reference.
Done.
55 Carlo Brondi 2.3 E Please revise the review panel description
Please add within the table: "Carlo Brondi, CNR - National Research Council, Researcher/Life Cycle Assessment (LCA) expert"
Done.
56 Carlo Brondi 2.4 G
The PEF guide is intended to provide also a support for the foreground sector such as footwear and fashion sector. It could be important to emphasize such focus.
Please add "Furthermore PEF studies provide the basis to systematize environmental knowledge in the foreground sectors (e.g. fashion sector). PEF review has been intended to provide transparency and clearness to PEF studies in order to be modularly implemented within other sectoral PEF."
Approved. Phrase added.
57 Carlo Brondi 3.2 T
PEF guidance states in product and scope classification that in preferable to perform different screening studies in case PEF application is different.
In case the screening study is performed for a limited set of leather type is important to emphasize within paragraph 3.2 that reference products have a very similar function or application. Otherwise explicit mentions have to be reported (e.g. sole leather vs fashion leather)
In the screening study performed, all 4 Representative Products were separately evaluated. It was performed based on primary data collected at more than 30 tanneries producing products covering all RPs possible combinations.
58 Carlo Brondi 3.2 T
PEF guidance states that other similar product categories that are not included in the PEF scope should be explicitly mentioned
Please consider to include descriptions of other similar products that are not covered by the present PEF (i.e. categories including polymeric fabric similar to leather)
Added the following phrase: "Are excluded from the present PEFCR all leathers produced from hides or skins of animals other than those slaughtered for human consumption, as well as any synthetic substitute material to leather."
59 Carlo Brondi 3 T
PEF should justify why bovines that are raised for milk and meat production represent the 99% of the global production.
Please introduce a brief reference as footnote explaining such assumption.
The phrase refers not only to bovine, but also to ovine and caprine leathers. It is
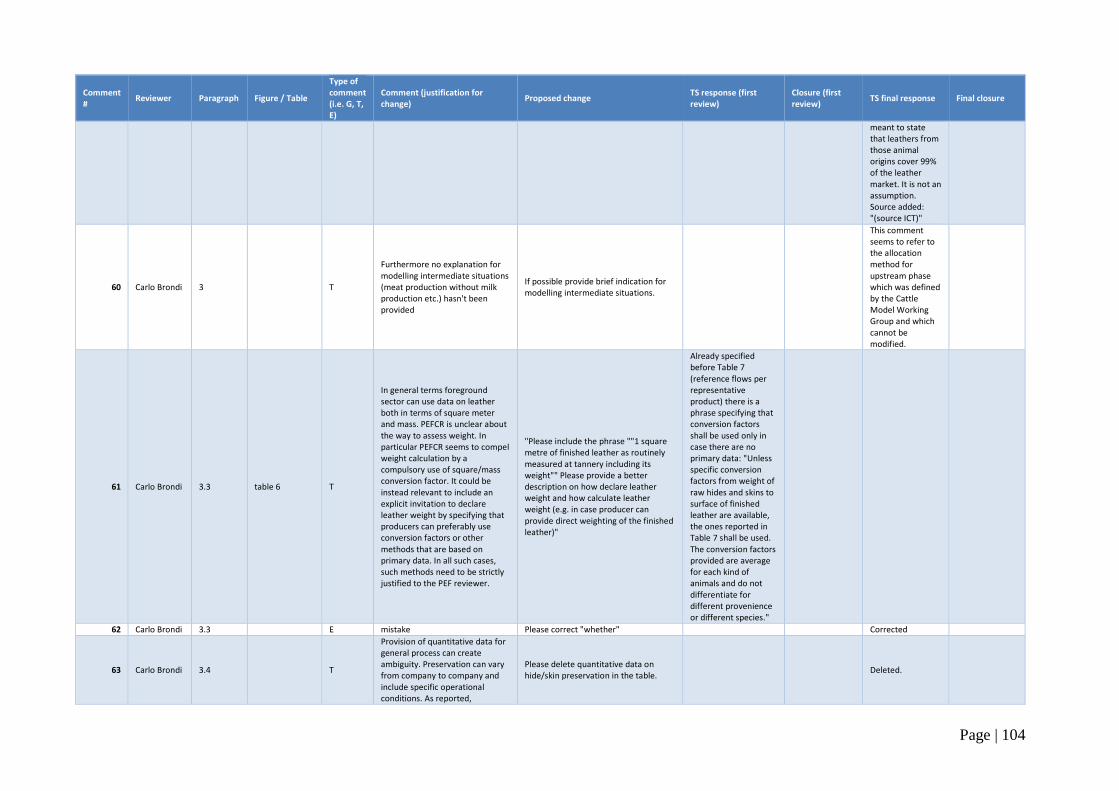
Page | 104
Comment #
Reviewer Paragraph Figure / Table
Type of comment (i.e. G, T, E)
Comment (justification for change)
Proposed change TS response (first review)
Closure (first review)
TS final response Final closure
meant to state that leathers from those animal origins cover 99% of the leather market. It is not an assumption. Source added: "(source ICT)"
60 Carlo Brondi 3 T
Furthermore no explanation for modelling intermediate situations (meat production without milk production etc.) hasn't been provided
If possible provide brief indication for modelling intermediate situations.
This comment seems to refer to the allocation method for upstream phase which was defined by the Cattle Model Working Group and which cannot be modified.
61 Carlo Brondi 3.3 table 6 T
In general terms foreground sector can use data on leather both in terms of square meter and mass. PEFCR is unclear about the way to assess weight. In particular PEFCR seems to compel weight calculation by a compulsory use of square/mass conversion factor. It could be instead relevant to include an explicit invitation to declare leather weight by specifying that producers can preferably use conversion factors or other methods that are based on primary data. In all such cases, such methods need to be strictly justified to the PEF reviewer.
"Please include the phrase ""1 square metre of finished leather as routinely measured at tannery including its weight"" Please provide a better description on how declare leather weight and how calculate leather weight (e.g. in case producer can provide direct weighting of the finished leather)"
Already specified before Table 7 (reference flows per representative product) there is a phrase specifying that conversion factors shall be used only in case there are no primary data: "Unless specific conversion factors from weight of raw hides and skins to surface of finished leather are available, the ones reported in Table 7 shall be used. The conversion factors provided are average for each kind of animals and do not differentiate for different provenience or different species."
62 Carlo Brondi 3.3 E mistake Please correct "whether" Corrected
63 Carlo Brondi 3.4 T
Provision of quantitative data for general process can create ambiguity. Preservation can vary from company to company and include specific operational conditions. As reported,
Please delete quantitative data on hide/skin preservation in the table.
Deleted.
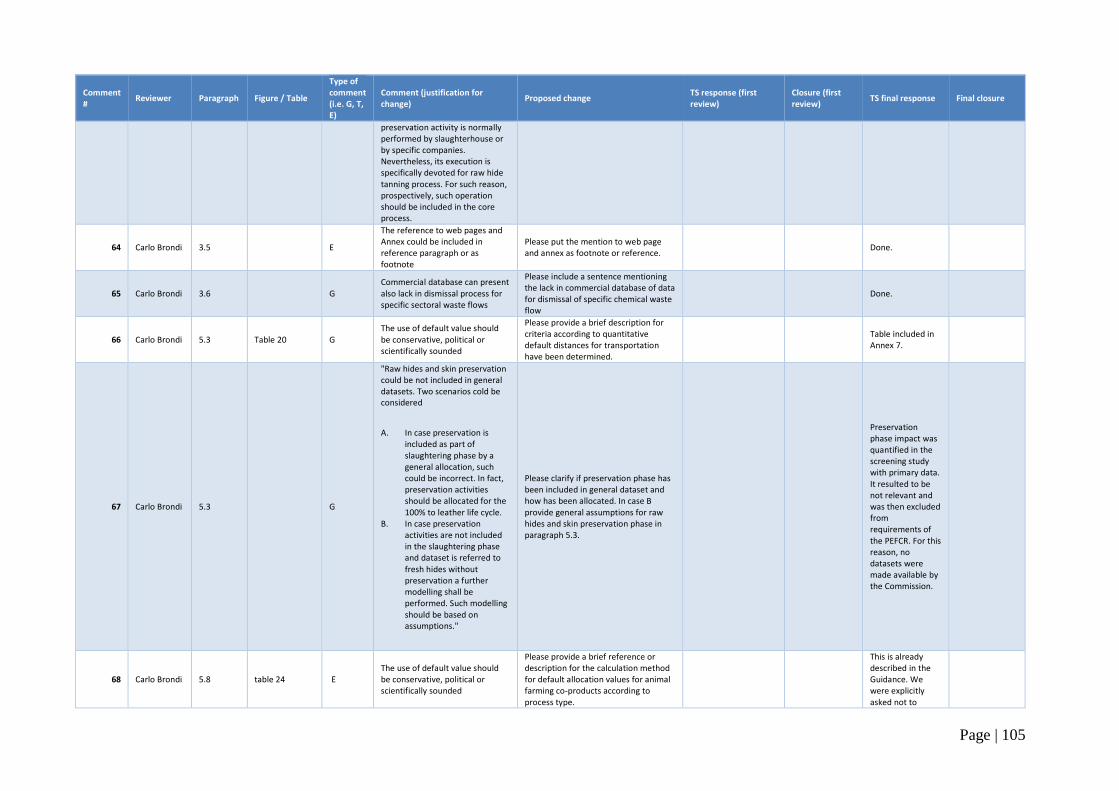
Page | 105
Comment #
Reviewer Paragraph Figure / Table
Type of comment (i.e. G, T, E)
Comment (justification for change)
Proposed change TS response (first review)
Closure (first review)
TS final response Final closure
preservation activity is normally performed by slaughterhouse or by specific companies. Nevertheless, its execution is specifically devoted for raw hide tanning process. For such reason, prospectively, such operation should be included in the core process.
64 Carlo Brondi 3.5 E
The reference to web pages and Annex could be included in reference paragraph or as footnote
Please put the mention to web page and annex as footnote or reference.
Done.
65 Carlo Brondi 3.6 G Commercial database can present also lack in dismissal process for specific sectoral waste flows
Please include a sentence mentioning the lack in commercial database of data for dismissal of specific chemical waste flow
Done.
66 Carlo Brondi 5.3 Table 20 G The use of default value should be conservative, political or scientifically sounded
Please provide a brief description for criteria according to quantitative default distances for transportation have been determined.
Table included in Annex 7.
67 Carlo Brondi 5.3 G
"Raw hides and skin preservation could be not included in general datasets. Two scenarios cold be considered
A. In case preservation is included as part of slaughtering phase by a general allocation, such could be incorrect. In fact, preservation activities should be allocated for the 100% to leather life cycle.
B. In case preservation activities are not included in the slaughtering phase and dataset is referred to fresh hides without preservation a further modelling shall be performed. Such modelling should be based on assumptions."
Please clarify if preservation phase has been included in general dataset and how has been allocated. In case B provide general assumptions for raw hides and skin preservation phase in paragraph 5.3.
Preservation phase impact was quantified in the screening study with primary data. It resulted to be not relevant and was then excluded from requirements of the PEFCR. For this reason, no datasets were made available by the Commission.
68 Carlo Brondi 5.8 table 24 E The use of default value should be conservative, political or scientifically sounded
Please provide a brief reference or description for the calculation method for default allocation values for animal farming co-products according to process type.
This is already described in the Guidance. We were explicitly asked not to
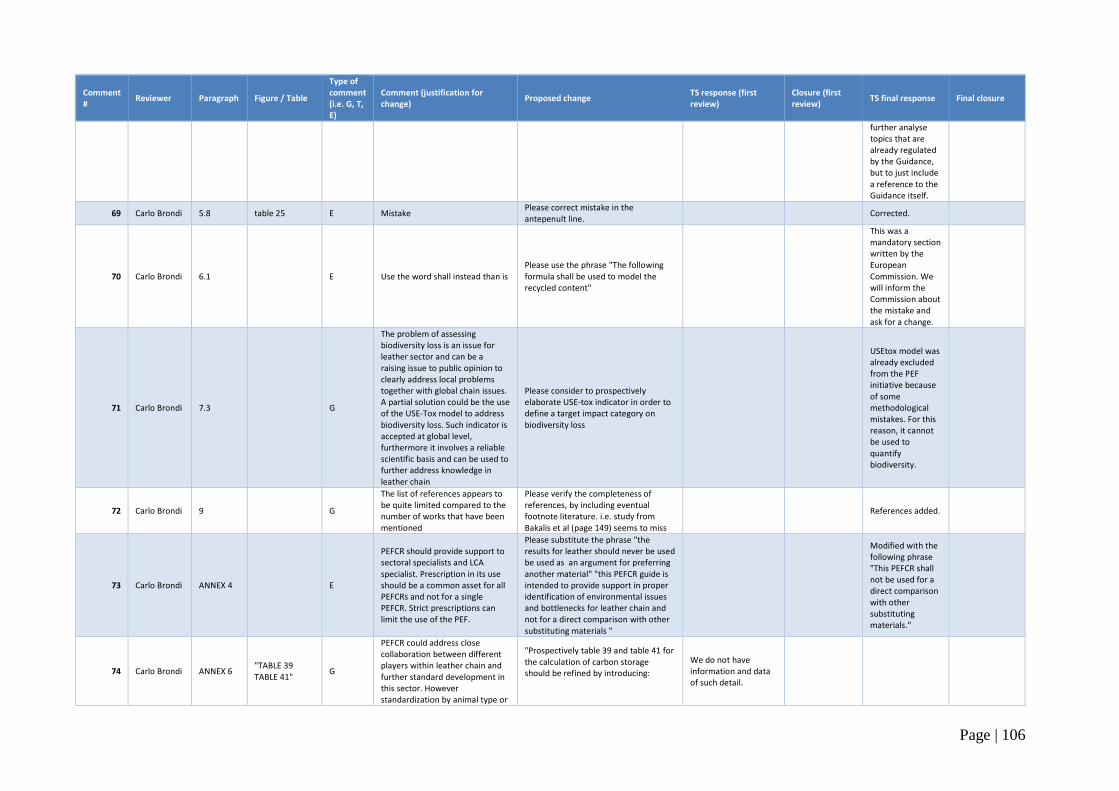
Page | 106
Comment #
Reviewer Paragraph Figure / Table
Type of comment (i.e. G, T, E)
Comment (justification for change)
Proposed change TS response (first review)
Closure (first review)
TS final response Final closure
further analyse topics that are already regulated by the Guidance, but to just include a reference to the Guidance itself.
69 Carlo Brondi 5.8 table 25 E Mistake Please correct mistake in the antepenult line.
Corrected.
70 Carlo Brondi 6.1 E Use the word shall instead than is Please use the phrase "The following formula shall be used to model the recycled content"
This was a mandatory section written by the European Commission. We will inform the Commission about the mistake and ask for a change.
71 Carlo Brondi 7.3 G
The problem of assessing biodiversity loss is an issue for leather sector and can be a raising issue to public opinion to clearly address local problems together with global chain issues. A partial solution could be the use of the USE-Tox model to address biodiversity loss. Such indicator is accepted at global level, furthermore it involves a reliable scientific basis and can be used to further address knowledge in leather chain
Please consider to prospectively elaborate USE-tox indicator in order to define a target impact category on biodiversity loss
USEtox model was already excluded from the PEF initiative because of some methodological mistakes. For this reason, it cannot be used to quantify biodiversity.
72 Carlo Brondi 9 G
The list of references appears to be quite limited compared to the number of works that have been mentioned
Please verify the completeness of references, by including eventual footnote literature. i.e. study from Bakalis et al (page 149) seems to miss
References added.
73 Carlo Brondi ANNEX 4 E
PEFCR should provide support to sectoral specialists and LCA specialist. Prescription in its use should be a common asset for all PEFCRs and not for a single PEFCR. Strict prescriptions can limit the use of the PEF.
Please substitute the phrase "the results for leather should never be used be used as an argument for preferring another material" "this PEFCR guide is intended to provide support in proper identification of environmental issues and bottlenecks for leather chain and not for a direct comparison with other substituting materials "
Modified with the following phrase "This PEFCR shall not be used for a direct comparison with other substituting materials."
74 Carlo Brondi ANNEX 6 "TABLE 39 TABLE 41"
G
PEFCR could address close collaboration between different players within leather chain and further standard development in this sector. However standardization by animal type or
"Prospectively table 39 and table 41 for the calculation of carbon storage should be refined by introducing:
We do not have information and data of such detail.
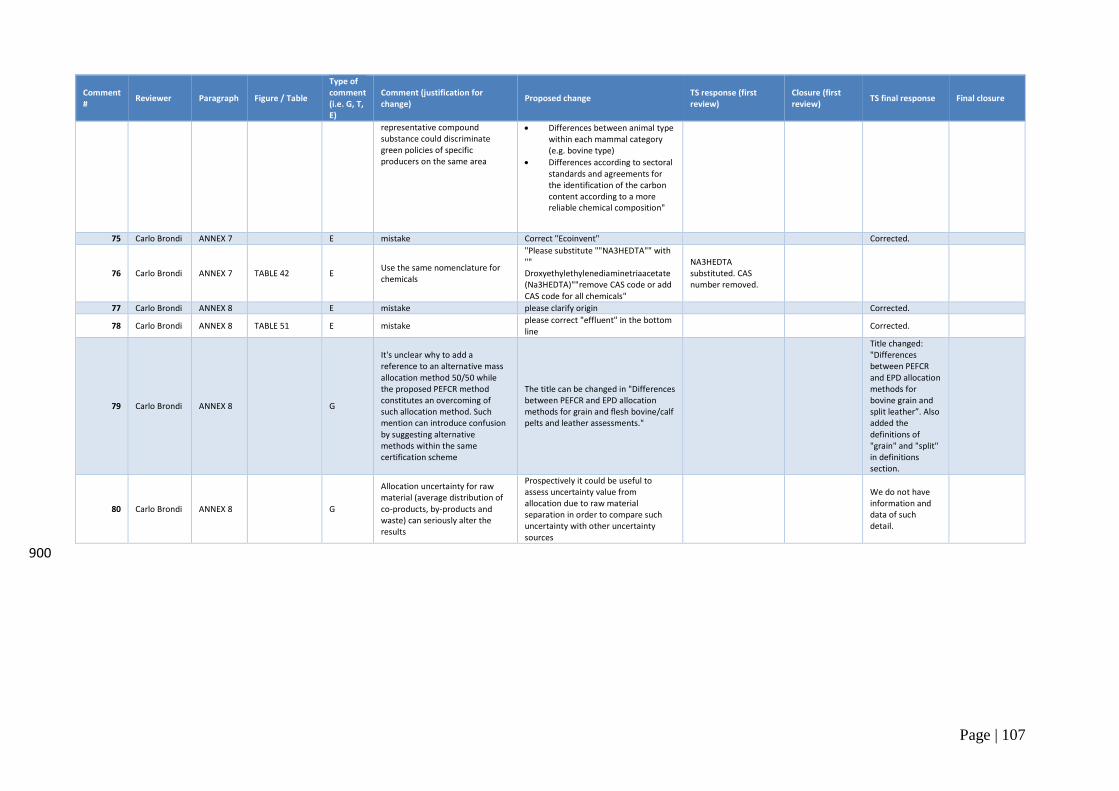
Page | 107
Comment #
Reviewer Paragraph Figure / Table
Type of comment (i.e. G, T, E)
Comment (justification for change)
Proposed change TS response (first review)
Closure (first review)
TS final response Final closure
representative compound substance could discriminate green policies of specific producers on the same area
Differences between animal type within each mammal category (e.g. bovine type)
Differences according to sectoral standards and agreements for the identification of the carbon content according to a more reliable chemical composition"
75 Carlo Brondi ANNEX 7 E mistake Correct "Ecoinvent" Corrected.
76 Carlo Brondi ANNEX 7 TABLE 42 E Use the same nomenclature for chemicals
"Please substitute ""NA3HEDTA"" with "" Droxyethylethylenediaminetriaacetate (Na3HEDTA)""remove CAS code or add CAS code for all chemicals"
NA3HEDTA substituted. CAS number removed.
77 Carlo Brondi ANNEX 8 E mistake please clarify origin Corrected.
78 Carlo Brondi ANNEX 8 TABLE 51 E mistake please correct "effluent" in the bottom line
Corrected.
79 Carlo Brondi ANNEX 8 G
It's unclear why to add a reference to an alternative mass allocation method 50/50 while the proposed PEFCR method constitutes an overcoming of such allocation method. Such mention can introduce confusion by suggesting alternative methods within the same certification scheme
The title can be changed in "Differences between PEFCR and EPD allocation methods for grain and flesh bovine/calf pelts and leather assessments."
Title changed: "Differences between PEFCR and EPD allocation methods for bovine grain and split leather”. Also added the definitions of "grain" and "split" in definitions section.
80 Carlo Brondi ANNEX 8 G
Allocation uncertainty for raw material (average distribution of co-products, by-products and waste) can seriously alter the results
Prospectively it could be useful to assess uncertainty value from allocation due to raw material separation in order to compare such uncertainty with other uncertainty sources
We do not have information and data of such detail.
900
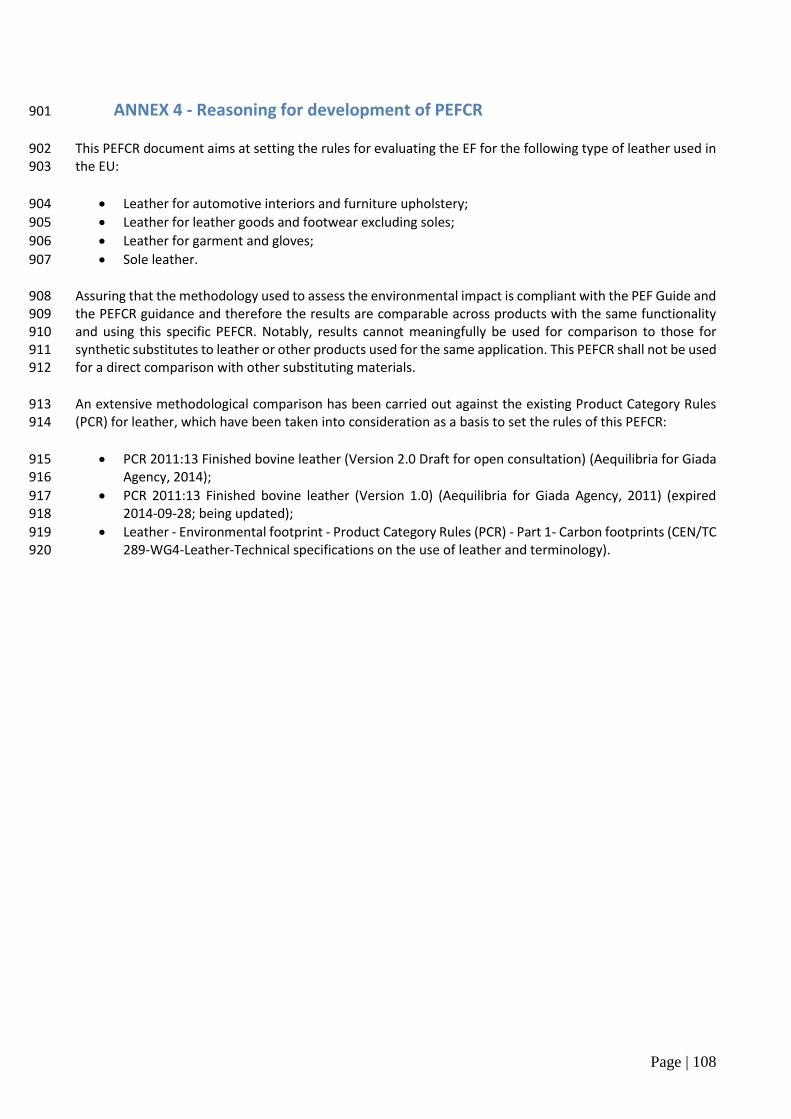
Page | 108
ANNEX 4 - Reasoning for development of PEFCR 901
This PEFCR document aims at setting the rules for evaluating the EF for the following type of leather used in 902 the EU: 903
Leather for automotive interiors and furniture upholstery; 904
Leather for leather goods and footwear excluding soles; 905
Leather for garment and gloves; 906
Sole leather. 907
Assuring that the methodology used to assess the environmental impact is compliant with the PEF Guide and 908 the PEFCR guidance and therefore the results are comparable across products with the same functionality 909 and using this specific PEFCR. Notably, results cannot meaningfully be used for comparison to those for 910 synthetic substitutes to leather or other products used for the same application. This PEFCR shall not be used 911 for a direct comparison with other substituting materials. 912
An extensive methodological comparison has been carried out against the existing Product Category Rules 913 (PCR) for leather, which have been taken into consideration as a basis to set the rules of this PEFCR: 914
PCR 2011:13 Finished bovine leather (Version 2.0 Draft for open consultation) (Aequilibria for Giada 915 Agency, 2014); 916
PCR 2011:13 Finished bovine leather (Version 1.0) (Aequilibria for Giada Agency, 2011) (expired 917 2014-09-28; being updated); 918
Leather - Environmental footprint - Product Category Rules (PCR) - Part 1- Carbon footprints (CEN/TC 919 289-WG4-Leather-Technical specifications on the use of leather and terminology). 920
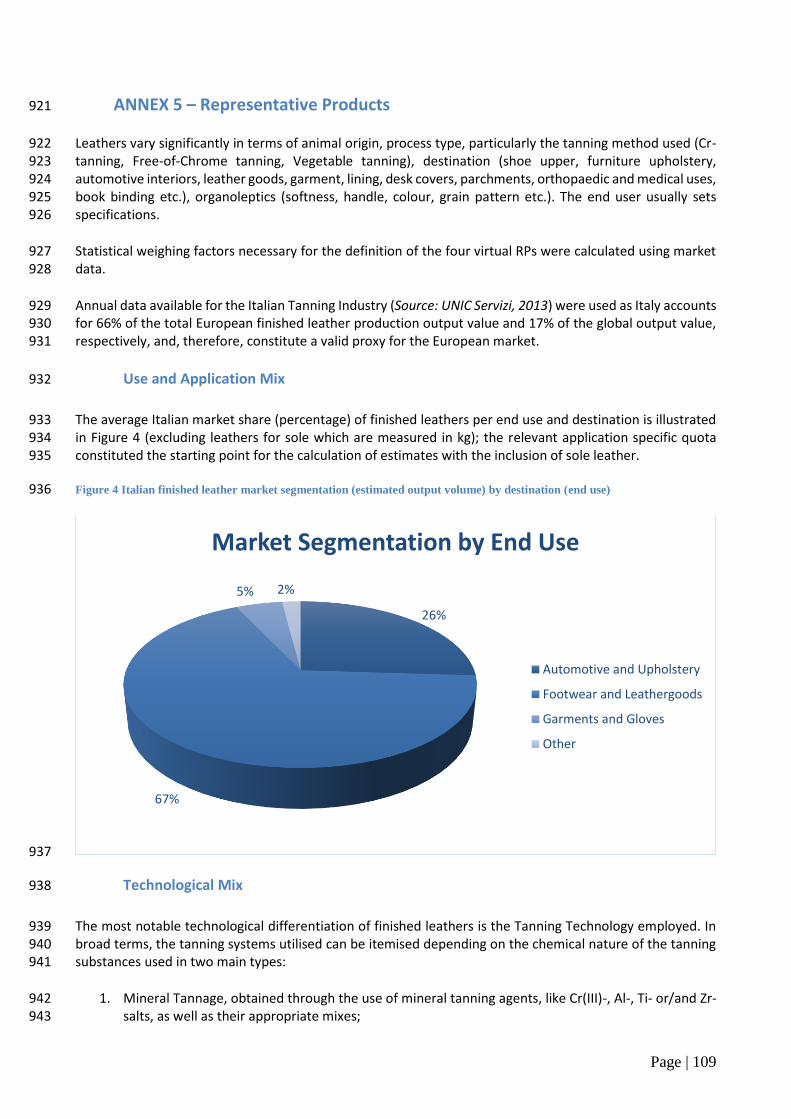
Page | 109
ANNEX 5 – Representative Products 921
Leathers vary significantly in terms of animal origin, process type, particularly the tanning method used (Cr-922 tanning, Free-of-Chrome tanning, Vegetable tanning), destination (shoe upper, furniture upholstery, 923 automotive interiors, leather goods, garment, lining, desk covers, parchments, orthopaedic and medical uses, 924 book binding etc.), organoleptics (softness, handle, colour, grain pattern etc.). The end user usually sets 925 specifications. 926
Statistical weighing factors necessary for the definition of the four virtual RPs were calculated using market 927 data. 928
Annual data available for the Italian Tanning Industry (Source: UNIC Servizi, 2013) were used as Italy accounts 929 for 66% of the total European finished leather production output value and 17% of the global output value, 930 respectively, and, therefore, constitute a valid proxy for the European market. 931
Use and Application Mix 932
The average Italian market share (percentage) of finished leathers per end use and destination is illustrated 933 in Figure 4 (excluding leathers for sole which are measured in kg); the relevant application specific quota 934 constituted the starting point for the calculation of estimates with the inclusion of sole leather. 935
Figure 4 Italian finished leather market segmentation (estimated output volume) by destination (end use) 936
937
Technological Mix 938
The most notable technological differentiation of finished leathers is the Tanning Technology employed. In 939 broad terms, the tanning systems utilised can be itemised depending on the chemical nature of the tanning 940 substances used in two main types: 941
1. Mineral Tannage, obtained through the use of mineral tanning agents, like Cr(III)-, Al-, Ti- or/and Zr- 942 salts, as well as their appropriate mixes; 943
26%
67%
5% 2%
Market Segmentation by End Use
Automotive and Upholstery
Footwear and Leathergoods
Garments and Gloves
Other
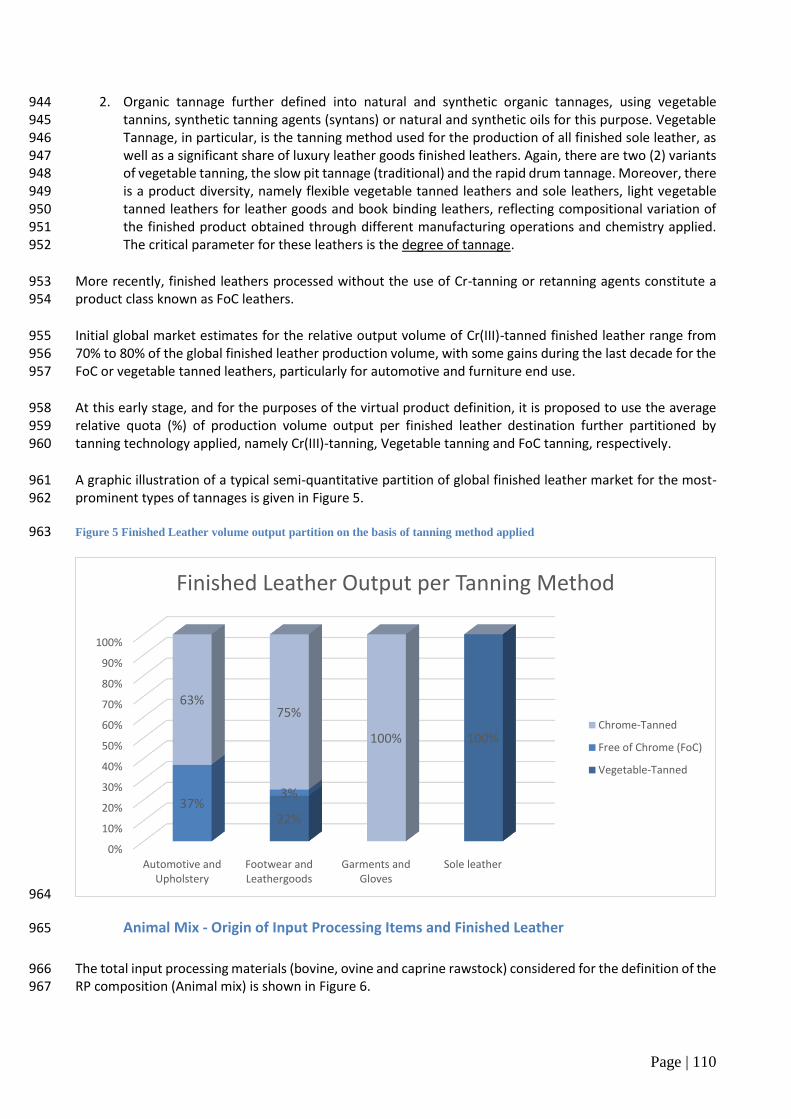
Page | 110
2. Organic tannage further defined into natural and synthetic organic tannages, using vegetable 944 tannins, synthetic tanning agents (syntans) or natural and synthetic oils for this purpose. Vegetable 945 Tannage, in particular, is the tanning method used for the production of all finished sole leather, as 946 well as a significant share of luxury leather goods finished leathers. Again, there are two (2) variants 947 of vegetable tanning, the slow pit tannage (traditional) and the rapid drum tannage. Moreover, there 948 is a product diversity, namely flexible vegetable tanned leathers and sole leathers, light vegetable 949 tanned leathers for leather goods and book binding leathers, reflecting compositional variation of 950 the finished product obtained through different manufacturing operations and chemistry applied. 951 The critical parameter for these leathers is the degree of tannage. 952
More recently, finished leathers processed without the use of Cr-tanning or retanning agents constitute a 953 product class known as FoC leathers. 954
Initial global market estimates for the relative output volume of Cr(III)-tanned finished leather range from 955 70% to 80% of the global finished leather production volume, with some gains during the last decade for the 956 FoC or vegetable tanned leathers, particularly for automotive and furniture end use. 957
At this early stage, and for the purposes of the virtual product definition, it is proposed to use the average 958 relative quota (%) of production volume output per finished leather destination further partitioned by 959 tanning technology applied, namely Cr(III)-tanning, Vegetable tanning and FoC tanning, respectively. 960
A graphic illustration of a typical semi-quantitative partition of global finished leather market for the most-961 prominent types of tannages is given in Figure 5. 962
Figure 5 Finished Leather volume output partition on the basis of tanning method applied 963
964
Animal Mix - Origin of Input Processing Items and Finished Leather 965
The total input processing materials (bovine, ovine and caprine rawstock) considered for the definition of the 966 RP composition (Animal mix) is shown in Figure 6. 967
0%
10%
20%
30%
40%
50%
60%
70%
80%
90%
100%
Automotive andUpholstery
Footwear andLeathergoods
Garments andGloves
Sole leather
22%
100%
37%3%
63%75%
100%
Finished Leather Output per Tanning Method
Chrome-Tanned
Free of Chrome (FoC)
Vegetable-Tanned

Page | 111
Figure 6 Finished leather market segmentation (input volume) by animal origin of hides and skins 968
969
RPs Specification 970
To define a representative virtual product the applications of finished leathers, tanning technology and 971 animal mix have been considered, as proposed above, with respect to their relevance for defining the PEFCR 972 rules. 973
The required characteristics of the RP can be summarised as shown in Table 5. 974
To make the selected RPs representative of the actual leather consumed in Europe, EU leather consumption 975 mix has been calculated based on Eurostat for trade and the data for production from EU national 976 associations of tanners (notably UNIC Economic Department) as: 977
Total EU tanners’ sales of finished leather in the EU market 2014: 5,909 million €ur (as difference 978 between EU tanners’ total turnover (8,267 million €ur) and EU tanners’ export to extra-EU (2,358 979 million €ur]); 980
Total Extra-EU import of finished leather in 2014: 1,244 million €ur; 981
Total apparent consumption of finished leather in the EU market: 7,153 million €ur. 982
The consumption mix details per main Country, based on EU members tanning turnovers, extra-EU export of 983 finished leather of EU members and extra-EU import of finished leather per extra-EU Countries is reported 984 in Table 32. The same consumption mix is used for all the RPs due to the lack of data for the identification of 985 a specific consumption mix for each RP. 986
Table 32 EU Leather consumption mix (Countries contribution for less than 55 million €ur have been excluded) 987
Producing/Exporting Country Finished leather sales in EU28 market (million €ur) Percentage
Italy 3 661 57,7%
Spain 608 9,6%
Germany 377 5,9%
France 311 4,9%
0%
10%
20%
30%
40%
50%
60%
70%
80%
90%
100%
Automotive andUpholstery
Footwear andLeathergoods
Garments andGloves
Sole leather
11%
64%
11%
16%
12%
20%
100%
66%
100%
Market Segmentation by Animal Origin
Bovine
Calf
Caprine
Ovine
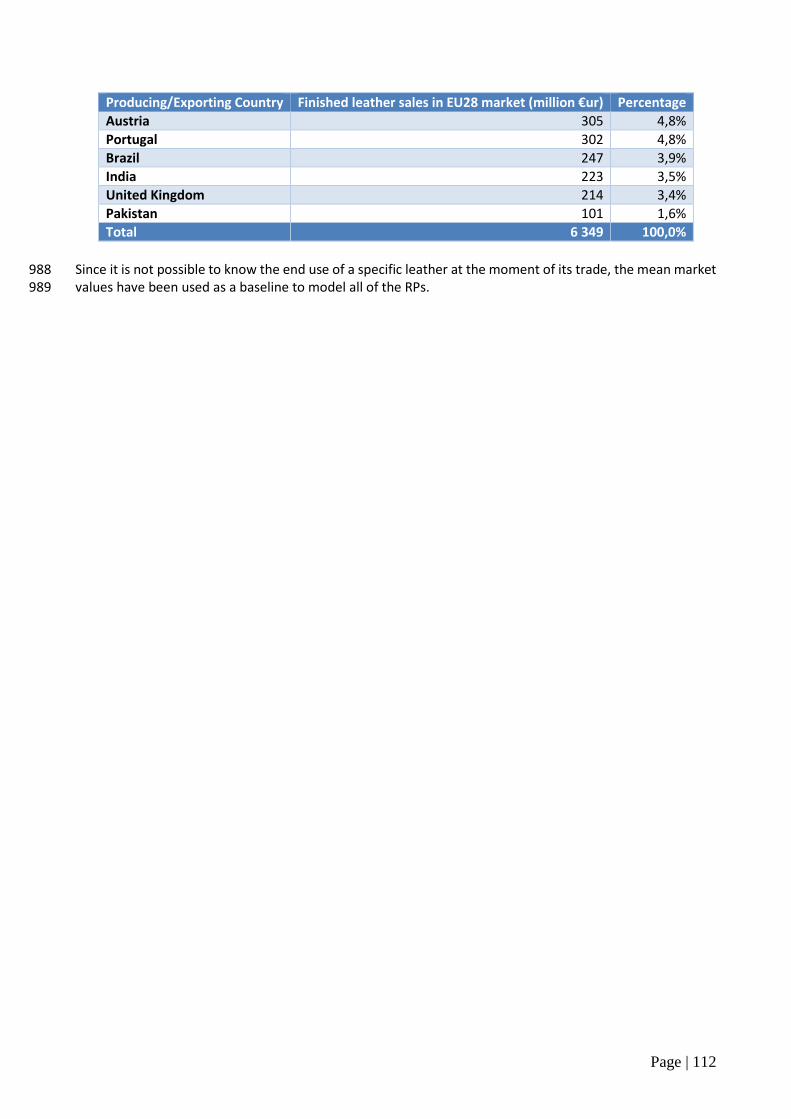
Page | 112
Producing/Exporting Country Finished leather sales in EU28 market (million €ur) Percentage
Austria 305 4,8%
Portugal 302 4,8%
Brazil 247 3,9%
India 223 3,5%
United Kingdom 214 3,4%
Pakistan 101 1,6%
Total 6 349 100,0%
Since it is not possible to know the end use of a specific leather at the moment of its trade, the mean market 988 values have been used as a baseline to model all of the RPs. 989
Page | 113
ANNEX 6 – Downstream scenarios 990
Downstream processes are not included into the system boundaries of the intermediate product “finished 991 leather”. However, the carbon stored in finished leather shall be calculated as a relevant information for the 992 modelling of downstream scenarios. 993
Carbon stored in finished leather derives from two different sources: 994
The carbon stored in raw hides and skins (the calculation of the amount of Biogenic Stored Carbon 995 (BSC) is mandatory); 996
The biogenic carbon stored in chemicals products that remain fixed on finished leather. 997
If primary data are not available, the methodology described below shall be used. 998
Calculations of Stored Carbon Content in Finished Leather Products 999
Inventories for each RP have been compiled using primary specific data for this purpose. These, in turn, 1000 comprise the average quantities of chemical ancillary products employed during finished leather 1001 manufacture. 1002
On the other hand, the calculation of the quantities of added chemicals administered, as well as of the 1003 products of their reaction with the processing input materials would require: 1004
Analytical compositional data – it is unrealistic to try and implement a systematic analytical effort for 1005 the various finished leathers and manufacturing plants. Moreover, such data already available, relate 1006 to the content of monitored, regulated or restricted substances in the finished leathers, as routinely 1007 applied for the Tanneries and end users. Finally, in several cases analytical methods do not exist or 1008 the exact chemical nature of the compounds found in leather cannot be identified with any precision; 1009
Measurement or calculation of the main organic component of the finished leather, namely collagen 1010 and of other proteins and biopolymers. Hide substance, also used for the allocation of environmental 1011 impacts to the various co-products in this survey, is measured from N-TKN (Kjedahl Total Nitrogen 1012 Content, IUC 10), whereas N-NH4+ can be determined separately. 1013
Concomitantly, and in view, of the lack of a BOM for the finished leather or detailed and complete 1014 compositional data the stored carbon content in the various RPs was calculated as follows: 1015
Biogenic Stored Carbon (BSC)33 1016
This is equal, in general terms, to the collagen (corium) quantities recovered from input processing materials 1017 and ennobled during leather manufacture. The average hide substance content for the procurement mix 1018 (animal origins) is known from generic data available in the world wide sectoral literature and the 1019 corresponding values are reported with Table 33. 1020
33 The complete calculation sheet and results for BSC for each RP and animal origin are reported in Table 34.
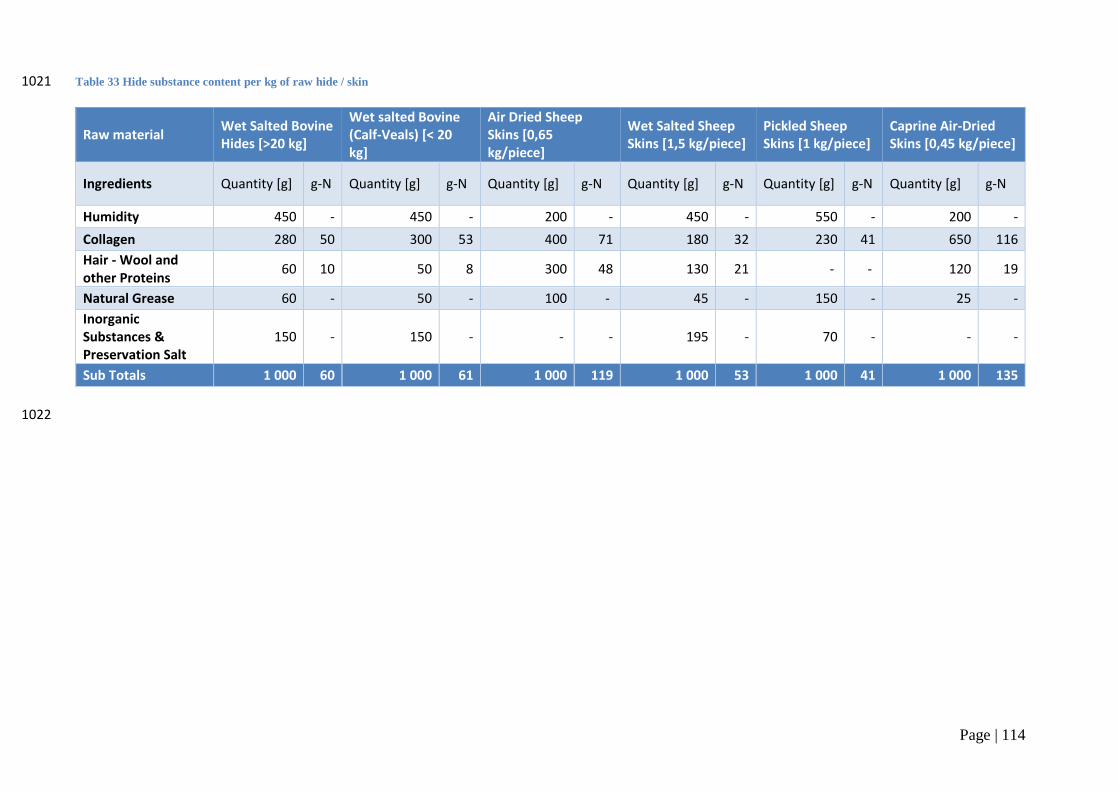
Page | 114
Table 33 Hide substance content per kg of raw hide / skin 1021
Raw material Wet Salted Bovine Hides [>20 kg]
Wet salted Bovine (Calf-Veals) [< 20 kg]
Air Dried Sheep Skins [0,65 kg/piece]
Wet Salted Sheep Skins [1,5 kg/piece]
Pickled Sheep Skins [1 kg/piece]
Caprine Air-Dried Skins [0,45 kg/piece]
Ingredients Quantity [g] g-N Quantity [g] g-N Quantity [g] g-N Quantity [g] g-N Quantity [g] g-N Quantity [g] g-N
Humidity 450 - 450 - 200 - 450 - 550 - 200 -
Collagen 280 50 300 53 400 71 180 32 230 41 650 116
Hair - Wool and other Proteins
60 10 50 8 300 48 130 21 - - 120 19
Natural Grease 60 - 50 - 100 - 45 - 150 - 25 -
Inorganic Substances & Preservation Salt
150 - 150 - - - 195 - 70 - - -
Sub Totals 1 000 60 1 000 61 1 000 119 1 000 53 1 000 41 1 000 135
1022
Page | 115
On the other hand, the average reference flow per DU (kg of raw hide or skin / m2) has been determined for 1023 the various procurement mixes and finished products, as cited in Table 7. 1024
It is therefore possible to calculate the total quantity of hide substance processed and partially recovered in 1025 the finished leather, as follows: 1026
Equation 1: Biogenic protein content valorised [g / kg raw hides or skins] = Biogenic protein content [g / kg 1027 raw hides or skins] x Quota of bio-based protein content valorised [%] 1028
Equation 2: Biogenic protein content (hide substance) [g / m2 of finished leather] = Reference flow (Table 7) 1029 [kg raw hides or skins / m2 of finished leather] x Biogenic protein content valorised [g / kg raw 1030 hides or skins] 1031
In order to calculate the equivalent amount of Carbon Stored per DU, it was necessary to assume that: 1032
Bulk protein content is collagen of Type I, namely a biopolymer with an average molecular weight of 1033 300 kDa (as determined by Sodium Dodecyl Sulphate - PolyAcrylamide Gel Electrophoresis (SDS-1034 PAGE) analysis and literature published data); 1035
The monomer building block of hide substance is tropocollagen and the % content of hide substance 1036 in carbon is equal to the % carbon content of tropocollagen, respectively. 1037
Along these lines, the Biogenic content in each RP was determined by employing the following formula: 1038
Equation 3: Biogenic stored carbon content g-c [g / m2 of finished leather] = Biogenic protein content (hide 1039 substance) [g / m2 of finished leather] * 51.8% 1040
Table 34 provides a more detailed description of the calculation method. Values provided in the table can 1041
be used as default by the user of the PEFCR.1042
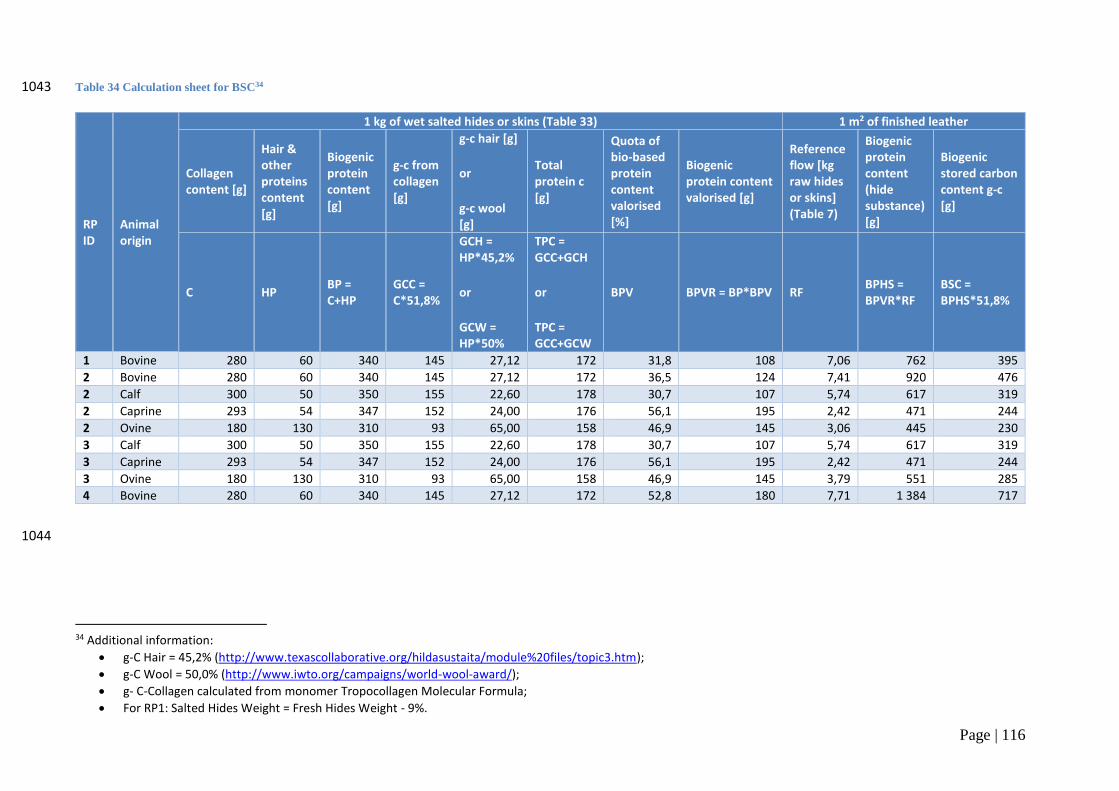
Page | 116
Table 34 Calculation sheet for BSC34 1043
RP ID
Animal origin
1 kg of wet salted hides or skins (Table 33) 1 m2 of finished leather
Collagen content [g]
Hair & other proteins content [g]
Biogenic protein content [g]
g-c from collagen [g]
g-c hair [g]
or
g-c wool [g]
Total protein c [g]
Quota of bio-based protein content valorised [%]
Biogenic protein content valorised [g]
Reference flow [kg raw hides or skins] (Table 7)
Biogenic protein content (hide substance) [g]
Biogenic stored carbon content g-c [g]
C HP BP = C+HP
GCC = C*51,8%
GCH = HP*45,2%
or
GCW = HP*50%
TPC = GCC+GCH
or
TPC = GCC+GCW
BPV BPVR = BP*BPV RF BPHS = BPVR*RF
BSC = BPHS*51,8%
1 Bovine 280 60 340 145 27,12 172 31,8 108 7,06 762 395
2 Bovine 280 60 340 145 27,12 172 36,5 124 7,41 920 476
2 Calf 300 50 350 155 22,60 178 30,7 107 5,74 617 319
2 Caprine 293 54 347 152 24,00 176 56,1 195 2,42 471 244
2 Ovine 180 130 310 93 65,00 158 46,9 145 3,06 445 230
3 Calf 300 50 350 155 22,60 178 30,7 107 5,74 617 319
3 Caprine 293 54 347 152 24,00 176 56,1 195 2,42 471 244
3 Ovine 180 130 310 93 65,00 158 46,9 145 3,79 551 285
4 Bovine 280 60 340 145 27,12 172 52,8 180 7,71 1 384 717
1044
34 Additional information:
g-C Hair = 45,2% (http://www.texascollaborative.org/hildasustaita/module%20files/topic3.htm);
g-C Wool = 50,0% (http://www.iwto.org/campaigns/world-wool-award/);
g- C-Collagen calculated from monomer Tropocollagen Molecular Formula;
For RP1: Salted Hides Weight = Fresh Hides Weight - 9%.
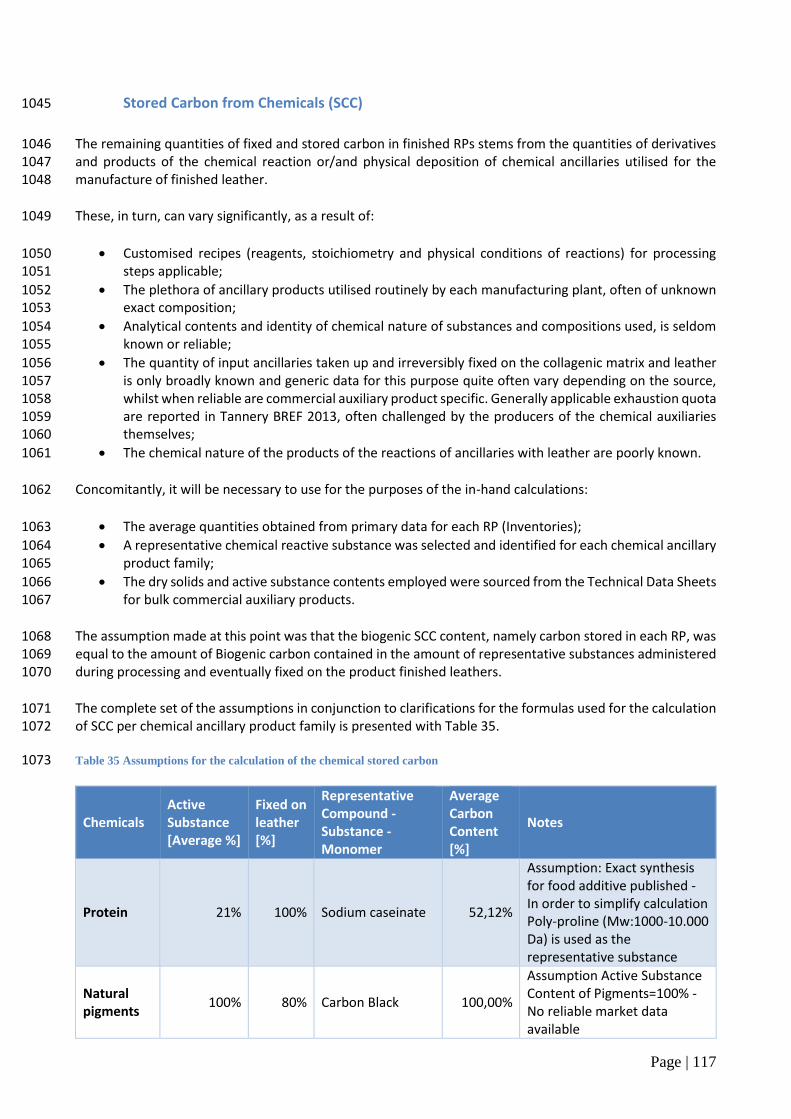
Page | 117
Stored Carbon from Chemicals (SCC) 1045
The remaining quantities of fixed and stored carbon in finished RPs stems from the quantities of derivatives 1046 and products of the chemical reaction or/and physical deposition of chemical ancillaries utilised for the 1047 manufacture of finished leather. 1048
These, in turn, can vary significantly, as a result of: 1049
Customised recipes (reagents, stoichiometry and physical conditions of reactions) for processing 1050 steps applicable; 1051
The plethora of ancillary products utilised routinely by each manufacturing plant, often of unknown 1052 exact composition; 1053
Analytical contents and identity of chemical nature of substances and compositions used, is seldom 1054 known or reliable; 1055
The quantity of input ancillaries taken up and irreversibly fixed on the collagenic matrix and leather 1056 is only broadly known and generic data for this purpose quite often vary depending on the source, 1057 whilst when reliable are commercial auxiliary product specific. Generally applicable exhaustion quota 1058 are reported in Tannery BREF 2013, often challenged by the producers of the chemical auxiliaries 1059 themselves; 1060
The chemical nature of the products of the reactions of ancillaries with leather are poorly known. 1061
Concomitantly, it will be necessary to use for the purposes of the in-hand calculations: 1062
The average quantities obtained from primary data for each RP (Inventories); 1063
A representative chemical reactive substance was selected and identified for each chemical ancillary 1064 product family; 1065
The dry solids and active substance contents employed were sourced from the Technical Data Sheets 1066 for bulk commercial auxiliary products. 1067
The assumption made at this point was that the biogenic SCC content, namely carbon stored in each RP, was 1068 equal to the amount of Biogenic carbon contained in the amount of representative substances administered 1069 during processing and eventually fixed on the product finished leathers. 1070
The complete set of the assumptions in conjunction to clarifications for the formulas used for the calculation 1071 of SCC per chemical ancillary product family is presented with Table 35. 1072
Table 35 Assumptions for the calculation of the chemical stored carbon 1073
Chemicals Active Substance [Average %]
Fixed on leather [%]
Representative Compound - Substance - Monomer
Average Carbon Content [%]
Notes
Protein 21% 100% Sodium caseinate 52,12%
Assumption: Exact synthesis for food additive published - In order to simplify calculation Poly-proline (Mw:1000-10.000 Da) is used as the representative substance
Natural pigments
100% 80% Carbon Black 100,00%
Assumption Active Substance Content of Pigments=100% - No reliable market data available
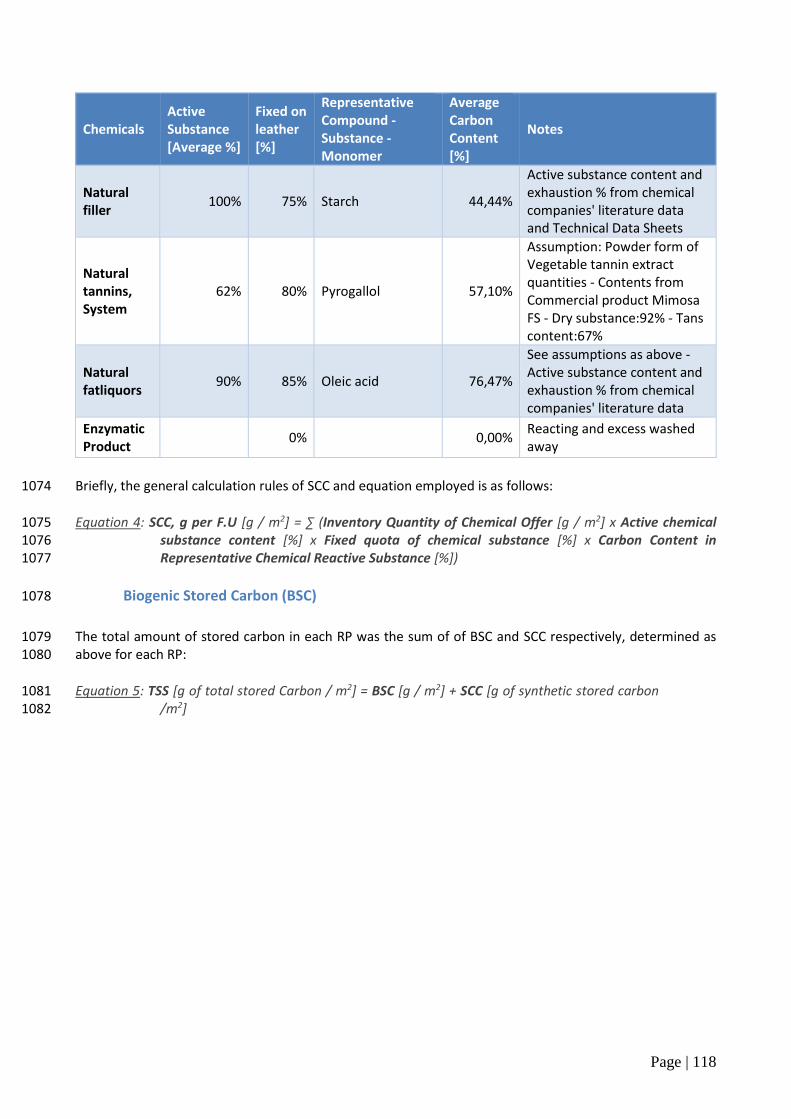
Page | 118
Chemicals Active Substance [Average %]
Fixed on leather [%]
Representative Compound - Substance - Monomer
Average Carbon Content [%]
Notes
Natural filler
100% 75% Starch 44,44%
Active substance content and exhaustion % from chemical companies' literature data and Technical Data Sheets
Natural tannins, System
62% 80% Pyrogallol 57,10%
Assumption: Powder form of Vegetable tannin extract quantities - Contents from Commercial product Mimosa FS - Dry substance:92% - Tans content:67%
Natural fatliquors
90% 85% Oleic acid 76,47%
See assumptions as above - Active substance content and exhaustion % from chemical companies' literature data
Enzymatic Product
0% 0,00% Reacting and excess washed away
Briefly, the general calculation rules of SCC and equation employed is as follows: 1074
Equation 4: SCC, g per F.U [g / m2] = ∑ (Inventory Quantity of Chemical Offer [g / m2] x Active chemical 1075 substance content [%] x Fixed quota of chemical substance [%] x Carbon Content in 1076 Representative Chemical Reactive Substance [%]) 1077
Biogenic Stored Carbon (BSC) 1078
The total amount of stored carbon in each RP was the sum of of BSC and SCC respectively, determined as 1079 above for each RP: 1080
Equation 5: TSS [g of total stored Carbon / m2] = BSC [g / m2] + SCC [g of synthetic stored carbon 1081 /m2] 1082
Page | 119
ANNEX 7 – Default values 1083
The table below reports the default composition of chemical substances to be used in case primary data on 1084 the active substance content are not available.1085
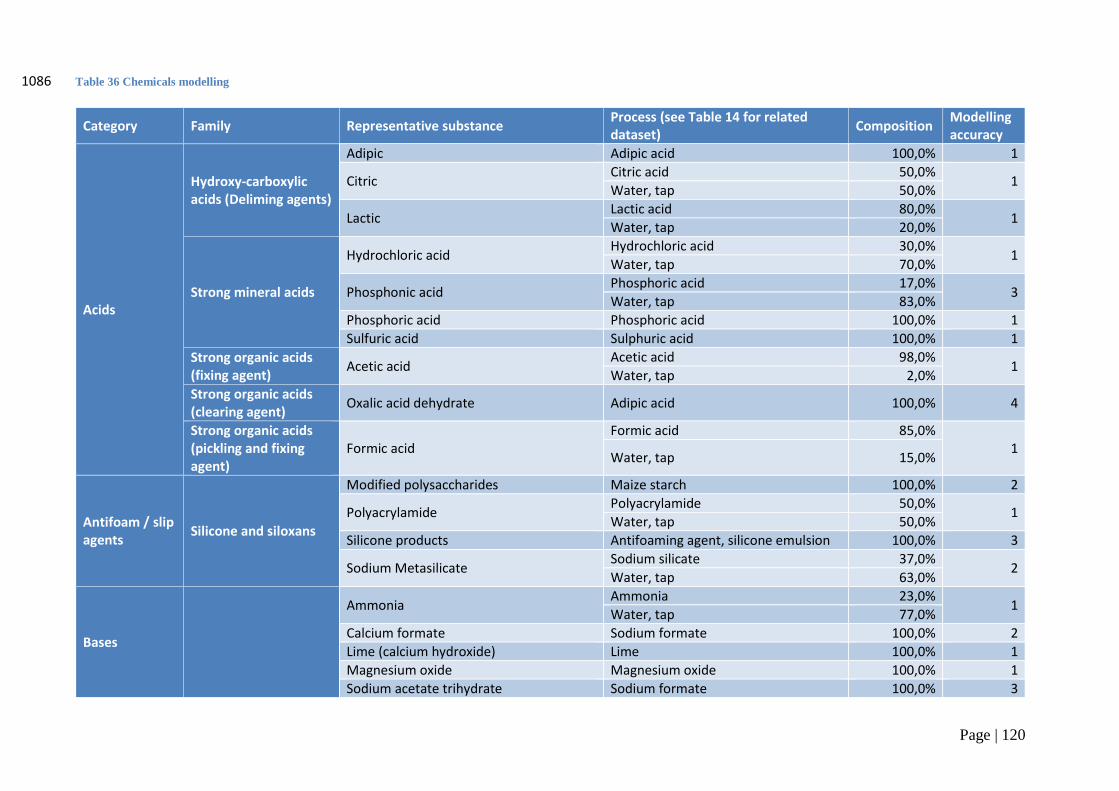
Page | 120
Table 36 Chemicals modelling 1086
Category Family Representative substance Process (see Table 14 for related dataset)
Composition Modelling accuracy
Acids
Hydroxy-carboxylic acids (Deliming agents)
Adipic Adipic acid 100,0% 1
Citric Citric acid 50,0%
1 Water, tap 50,0%
Lactic Lactic acid 80,0%
1 Water, tap 20,0%
Strong mineral acids
Hydrochloric acid Hydrochloric acid 30,0%
1 Water, tap 70,0%
Phosphonic acid Phosphoric acid 17,0%
3 Water, tap 83,0%
Phosphoric acid Phosphoric acid 100,0% 1
Sulfuric acid Sulphuric acid 100,0% 1
Strong organic acids (fixing agent)
Acetic acid Acetic acid 98,0%
1 Water, tap 2,0%
Strong organic acids (clearing agent)
Oxalic acid dehydrate Adipic acid 100,0% 4
Strong organic acids (pickling and fixing agent)
Formic acid Formic acid 85,0%
1 Water, tap 15,0%
Antifoam / slip agents
Silicone and siloxans
Modified polysaccharides Maize starch 100,0% 2
Polyacrylamide Polyacrylamide 50,0%
1 Water, tap 50,0%
Silicone products Antifoaming agent, silicone emulsion 100,0% 3
Sodium Metasilicate Sodium silicate 37,0%
2 Water, tap 63,0%
Bases
Ammonia Ammonia 23,0%
1 Water, tap 77,0%
Calcium formate Sodium formate 100,0% 2
Lime (calcium hydroxide) Lime 100,0% 1
Magnesium oxide Magnesium oxide 100,0% 1
Sodium acetate trihydrate Sodium formate 100,0% 3
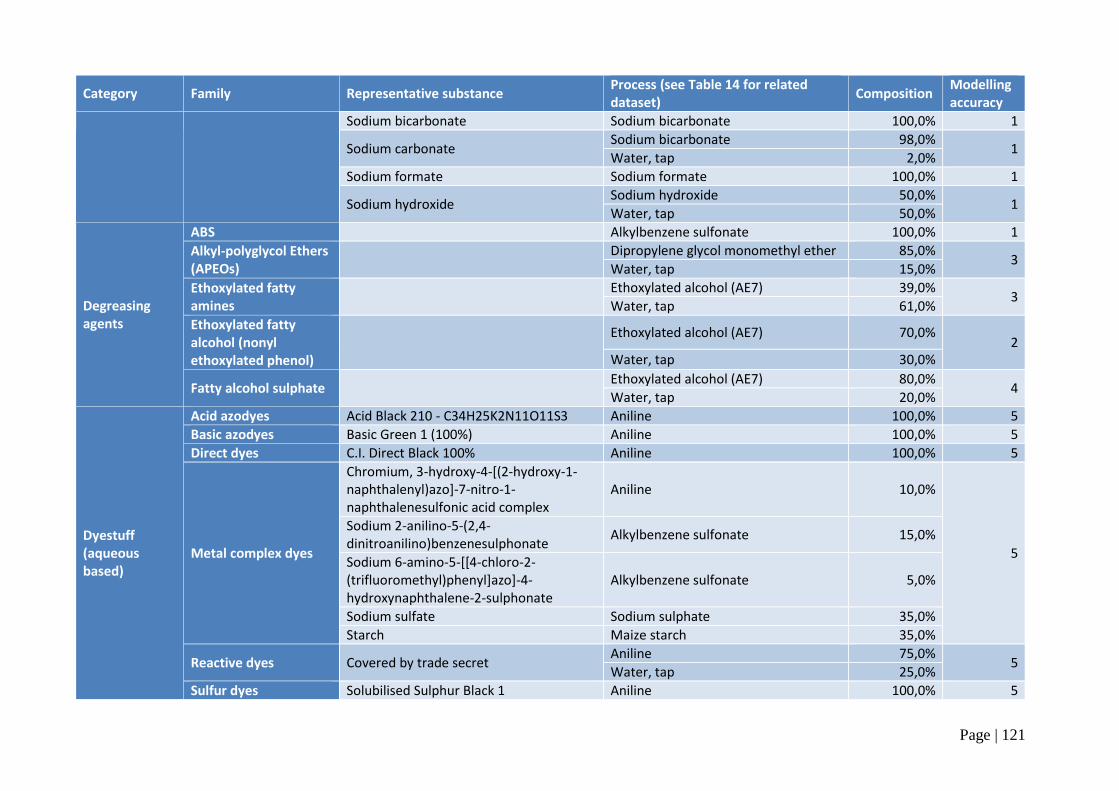
Page | 121
Category Family Representative substance Process (see Table 14 for related dataset)
Composition Modelling accuracy
Sodium bicarbonate Sodium bicarbonate 100,0% 1
Sodium carbonate Sodium bicarbonate 98,0%
1 Water, tap 2,0%
Sodium formate Sodium formate 100,0% 1
Sodium hydroxide Sodium hydroxide 50,0%
1 Water, tap 50,0%
Degreasing agents
ABS Alkylbenzene sulfonate 100,0% 1
Alkyl-polyglycol Ethers (APEOs)
Dipropylene glycol monomethyl ether 85,0%
3 Water, tap 15,0%
Ethoxylated fatty amines
Ethoxylated alcohol (AE7) 39,0%
3 Water, tap 61,0%
Ethoxylated fatty alcohol (nonyl ethoxylated phenol)
Ethoxylated alcohol (AE7) 70,0%
2 Water, tap 30,0%
Fatty alcohol sulphate Ethoxylated alcohol (AE7) 80,0%
4 Water, tap 20,0%
Dyestuff (aqueous based)
Acid azodyes Acid Black 210 - C34H25K2N11O11S3 Aniline 100,0% 5
Basic azodyes Basic Green 1 (100%) Aniline 100,0% 5
Direct dyes C.I. Direct Black 100% Aniline 100,0% 5
Metal complex dyes
Chromium, 3-hydroxy-4-[(2-hydroxy-1-naphthalenyl)azo]-7-nitro-1-naphthalenesulfonic acid complex
Aniline 10,0%
5
Sodium 2-anilino-5-(2,4-dinitroanilino)benzenesulphonate
Alkylbenzene sulfonate 15,0%
Sodium 6-amino-5-[[4-chloro-2-(trifluoromethyl)phenyl]azo]-4-hydroxynaphthalene-2-sulphonate
Alkylbenzene sulfonate 5,0%
Sodium sulfate Sodium sulphate 35,0%
Starch Maize starch 35,0%
Reactive dyes Covered by trade secret Aniline 75,0%
5 Water, tap 25,0%
Sulfur dyes Solubilised Sulphur Black 1 Aniline 100,0% 5
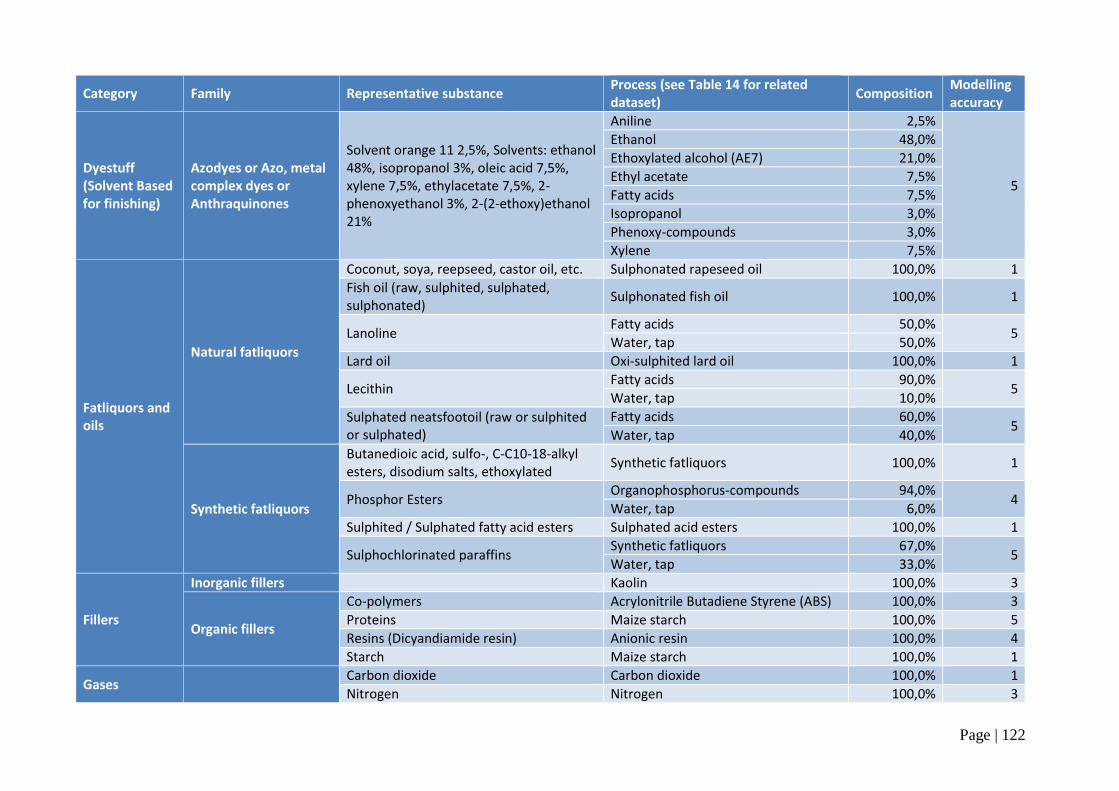
Page | 122
Category Family Representative substance Process (see Table 14 for related dataset)
Composition Modelling accuracy
Dyestuff (Solvent Based for finishing)
Azodyes or Azo, metal complex dyes or Anthraquinones
Solvent orange 11 2,5%, Solvents: ethanol 48%, isopropanol 3%, oleic acid 7,5%, xylene 7,5%, ethylacetate 7,5%, 2-phenoxyethanol 3%, 2-(2-ethoxy)ethanol 21%
Aniline 2,5%
5
Ethanol 48,0%
Ethoxylated alcohol (AE7) 21,0%
Ethyl acetate 7,5%
Fatty acids 7,5%
Isopropanol 3,0%
Phenoxy-compounds 3,0%
Xylene 7,5%
Fatliquors and oils
Natural fatliquors
Coconut, soya, reepseed, castor oil, etc. Sulphonated rapeseed oil 100,0% 1
Fish oil (raw, sulphited, sulphated, sulphonated)
Sulphonated fish oil 100,0% 1
Lanoline Fatty acids 50,0%
5 Water, tap 50,0%
Lard oil Oxi-sulphited lard oil 100,0% 1
Lecithin Fatty acids 90,0%
5 Water, tap 10,0%
Sulphated neatsfootoil (raw or sulphited or sulphated)
Fatty acids 60,0% 5
Water, tap 40,0%
Synthetic fatliquors
Butanedioic acid, sulfo-, C-C10-18-alkyl esters, disodium salts, ethoxylated
Synthetic fatliquors 100,0% 1
Phosphor Esters Organophosphorus-compounds 94,0%
4 Water, tap 6,0%
Sulphited / Sulphated fatty acid esters Sulphated acid esters 100,0% 1
Sulphochlorinated paraffins Synthetic fatliquors 67,0%
5 Water, tap 33,0%
Fillers
Inorganic fillers Kaolin 100,0% 3
Organic fillers
Co-polymers Acrylonitrile Butadiene Styrene (ABS) 100,0% 3
Proteins Maize starch 100,0% 5
Resins (Dicyandiamide resin) Anionic resin 100,0% 4
Starch Maize starch 100,0% 1
Gases Carbon dioxide Carbon dioxide 100,0% 1
Nitrogen Nitrogen 100,0% 3
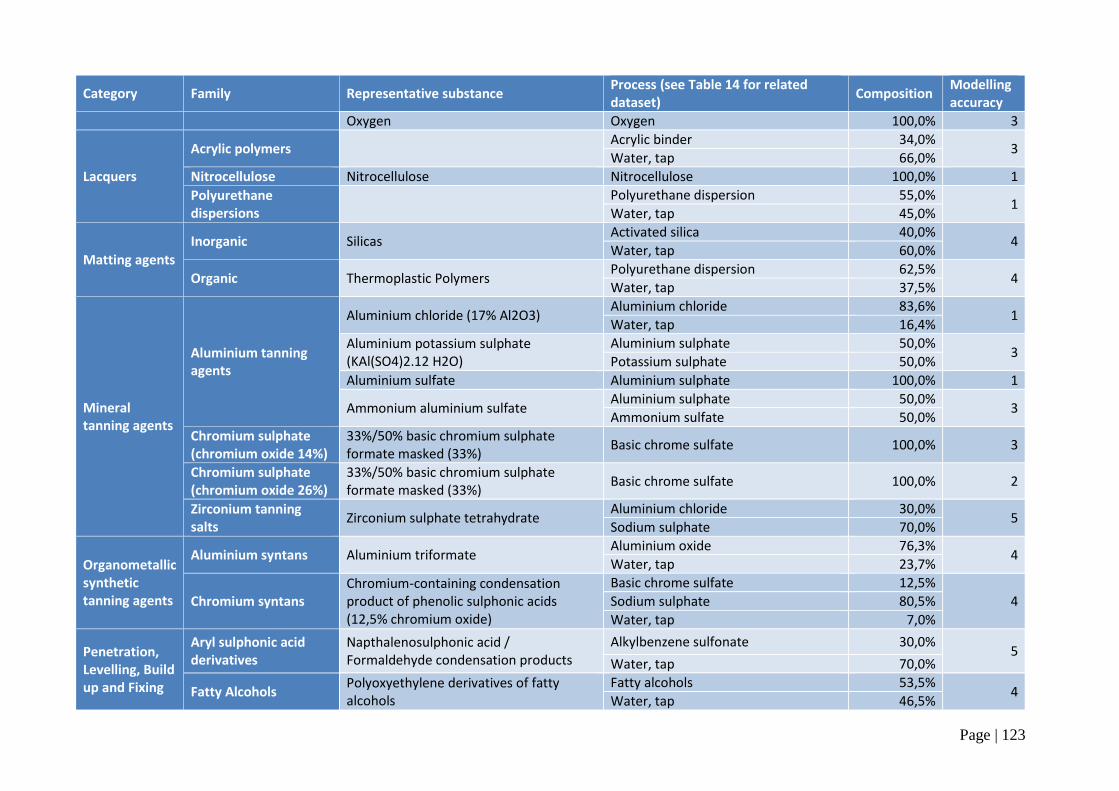
Page | 123
Category Family Representative substance Process (see Table 14 for related dataset)
Composition Modelling accuracy
Oxygen Oxygen 100,0% 3
Lacquers
Acrylic polymers Acrylic binder 34,0%
3 Water, tap 66,0%
Nitrocellulose Nitrocellulose Nitrocellulose 100,0% 1
Polyurethane dispersions
Polyurethane dispersion 55,0%
1 Water, tap 45,0%
Matting agents
Inorganic Silicas Activated silica 40,0%
4 Water, tap 60,0%
Organic Thermoplastic Polymers Polyurethane dispersion 62,5%
4 Water, tap 37,5%
Mineral tanning agents
Aluminium tanning agents
Aluminium chloride (17% Al2O3) Aluminium chloride 83,6%
1 Water, tap 16,4%
Aluminium potassium sulphate (KAl(SO4)2.12 H2O)
Aluminium sulphate 50,0% 3
Potassium sulphate 50,0%
Aluminium sulfate Aluminium sulphate 100,0% 1
Ammonium aluminium sulfate Aluminium sulphate 50,0%
3 Ammonium sulfate 50,0%
Chromium sulphate (chromium oxide 14%)
33%/50% basic chromium sulphate formate masked (33%)
Basic chrome sulfate 100,0% 3
Chromium sulphate (chromium oxide 26%)
33%/50% basic chromium sulphate formate masked (33%)
Basic chrome sulfate 100,0% 2
Zirconium tanning salts
Zirconium sulphate tetrahydrate Aluminium chloride 30,0%
5 Sodium sulphate 70,0%
Organometallic synthetic tanning agents
Aluminium syntans Aluminium triformate Aluminium oxide 76,3%
4 Water, tap 23,7%
Chromium syntans Chromium-containing condensation product of phenolic sulphonic acids (12,5% chromium oxide)
Basic chrome sulfate 12,5%
4 Sodium sulphate 80,5%
Water, tap 7,0%
Penetration, Levelling, Build up and Fixing
Aryl sulphonic acid derivatives
Napthalenosulphonic acid / Formaldehyde condensation products
Alkylbenzene sulfonate 30,0% 5
Water, tap 70,0%
Fatty Alcohols Polyoxyethylene derivatives of fatty alcohols
Fatty alcohols 53,5% 4
Water, tap 46,5%
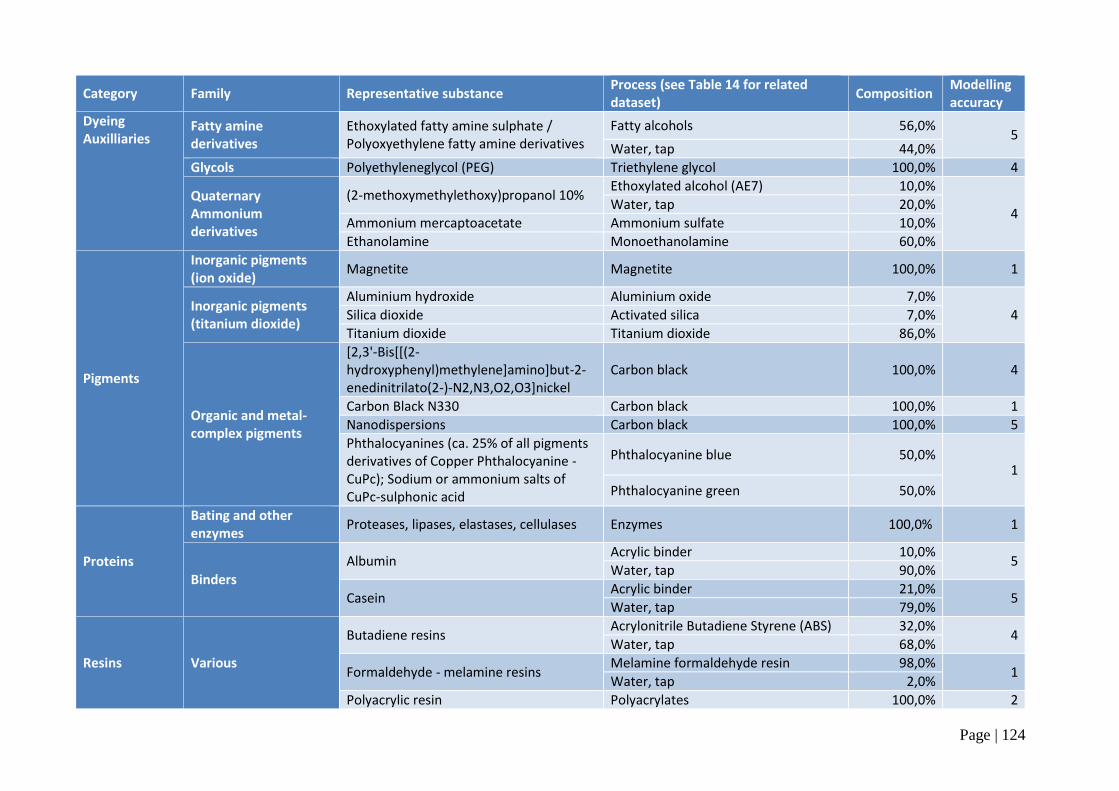
Page | 124
Category Family Representative substance Process (see Table 14 for related dataset)
Composition Modelling accuracy
Dyeing Auxilliaries
Fatty amine derivatives
Ethoxylated fatty amine sulphate / Polyoxyethylene fatty amine derivatives
Fatty alcohols 56,0% 5
Water, tap 44,0%
Glycols Polyethyleneglycol (PEG) Triethylene glycol 100,0% 4
Quaternary Ammonium derivatives
(2-methoxymethylethoxy)propanol 10% Ethoxylated alcohol (AE7) 10,0%
4 Water, tap 20,0%
Ammonium mercaptoacetate Ammonium sulfate 10,0%
Ethanolamine Monoethanolamine 60,0%
Pigments
Inorganic pigments (ion oxide)
Magnetite Magnetite 100,0% 1
Inorganic pigments (titanium dioxide)
Aluminium hydroxide Aluminium oxide 7,0%
4 Silica dioxide Activated silica 7,0%
Titanium dioxide Titanium dioxide 86,0%
Organic and metal-complex pigments
[2,3'-Bis[[(2-hydroxyphenyl)methylene]amino]but-2-enedinitrilato(2-)-N2,N3,O2,O3]nickel
Carbon black 100,0% 4
Carbon Black N330 Carbon black 100,0% 1
Nanodispersions Carbon black 100,0% 5
Phthalocyanines (ca. 25% of all pigments derivatives of Copper Phthalocyanine - CuPc); Sodium or ammonium salts of CuPc-sulphonic acid
Phthalocyanine blue 50,0% 1
Phthalocyanine green 50,0%
Proteins
Bating and other enzymes
Proteases, lipases, elastases, cellulases Enzymes 100,0% 1
Binders
Albumin Acrylic binder 10,0%
5 Water, tap 90,0%
Casein Acrylic binder 21,0%
5 Water, tap 79,0%
Resins Various
Butadiene resins Acrylonitrile Butadiene Styrene (ABS) 32,0%
4 Water, tap 68,0%
Formaldehyde - melamine resins Melamine formaldehyde resin 98,0%
1 Water, tap 2,0%
Polyacrylic resin Polyacrylates 100,0% 2
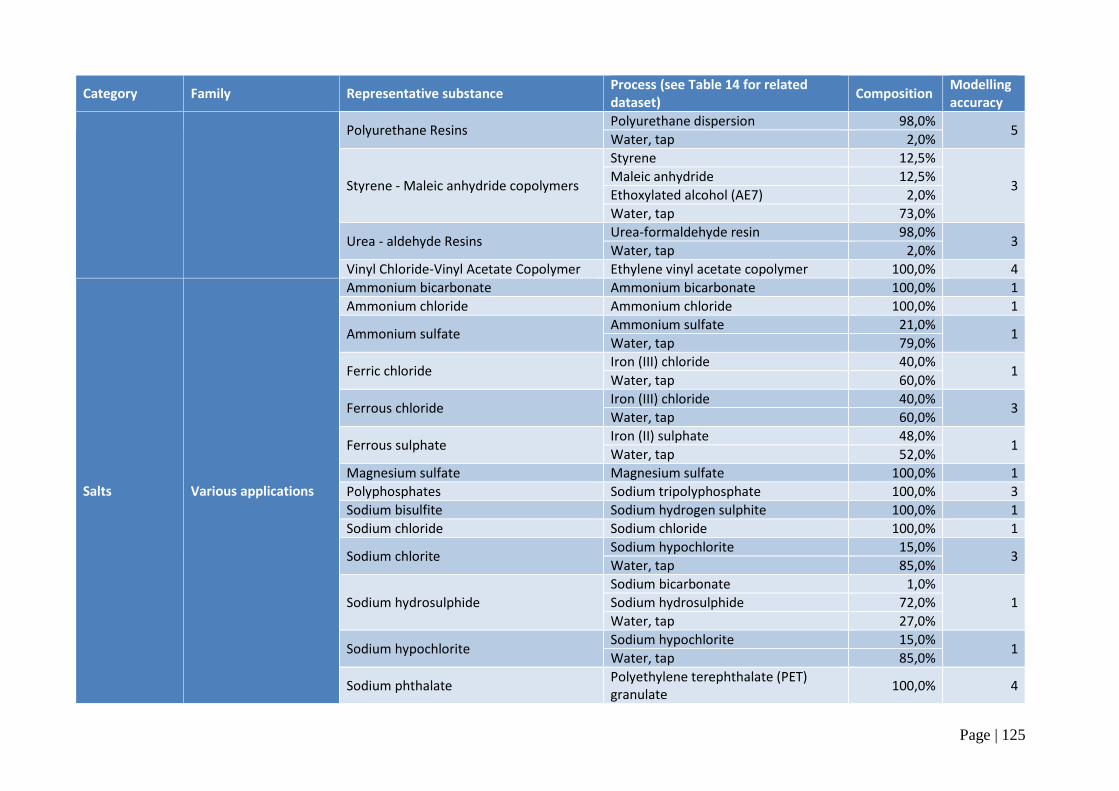
Page | 125
Category Family Representative substance Process (see Table 14 for related dataset)
Composition Modelling accuracy
Polyurethane Resins Polyurethane dispersion 98,0%
5 Water, tap 2,0%
Styrene - Maleic anhydride copolymers
Styrene 12,5%
3 Maleic anhydride 12,5%
Ethoxylated alcohol (AE7) 2,0%
Water, tap 73,0%
Urea - aldehyde Resins Urea-formaldehyde resin 98,0%
3 Water, tap 2,0%
Vinyl Chloride-Vinyl Acetate Copolymer Ethylene vinyl acetate copolymer 100,0% 4
Salts Various applications
Ammonium bicarbonate Ammonium bicarbonate 100,0% 1
Ammonium chloride Ammonium chloride 100,0% 1
Ammonium sulfate Ammonium sulfate 21,0%
1 Water, tap 79,0%
Ferric chloride Iron (III) chloride 40,0%
1 Water, tap 60,0%
Ferrous chloride Iron (III) chloride 40,0%
3 Water, tap 60,0%
Ferrous sulphate Iron (II) sulphate 48,0%
1 Water, tap 52,0%
Magnesium sulfate Magnesium sulfate 100,0% 1
Polyphosphates Sodium tripolyphosphate 100,0% 3
Sodium bisulfite Sodium hydrogen sulphite 100,0% 1
Sodium chloride Sodium chloride 100,0% 1
Sodium chlorite Sodium hypochlorite 15,0%
3 Water, tap 85,0%
Sodium hydrosulphide
Sodium bicarbonate 1,0%
1 Sodium hydrosulphide 72,0%
Water, tap 27,0%
Sodium hypochlorite Sodium hypochlorite 15,0%
1 Water, tap 85,0%
Sodium phthalate Polyethylene terephthalate (PET) granulate
100,0% 4
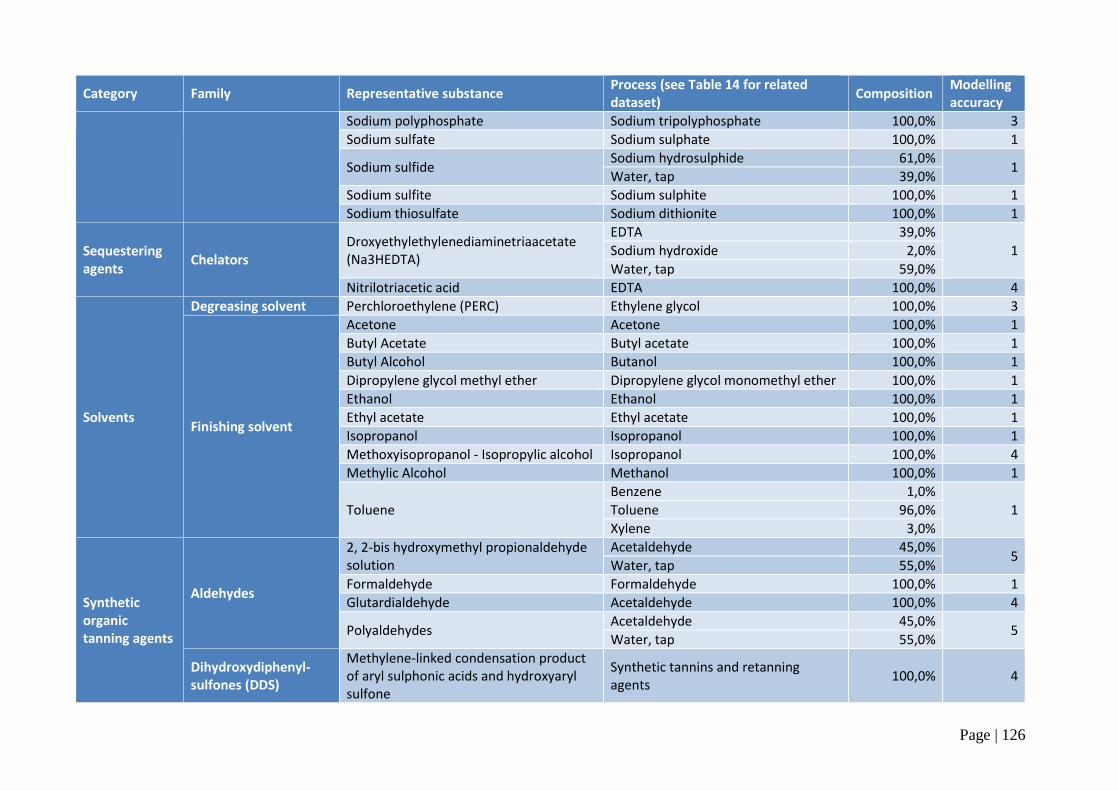
Page | 126
Category Family Representative substance Process (see Table 14 for related dataset)
Composition Modelling accuracy
Sodium polyphosphate Sodium tripolyphosphate 100,0% 3
Sodium sulfate Sodium sulphate 100,0% 1
Sodium sulfide Sodium hydrosulphide 61,0%
1 Water, tap 39,0%
Sodium sulfite Sodium sulphite 100,0% 1
Sodium thiosulfate Sodium dithionite 100,0% 1
Sequestering agents
Chelators Droxyethylethylenediaminetriaacetate (Na3HEDTA)
EDTA 39,0%
1 Sodium hydroxide 2,0%
Water, tap 59,0%
Nitrilotriacetic acid EDTA 100,0% 4
Solvents
Degreasing solvent Perchloroethylene (PERC) Ethylene glycol 100,0% 3
Finishing solvent
Acetone Acetone 100,0% 1
Butyl Acetate Butyl acetate 100,0% 1
Butyl Alcohol Butanol 100,0% 1
Dipropylene glycol methyl ether Dipropylene glycol monomethyl ether 100,0% 1
Ethanol Ethanol 100,0% 1
Ethyl acetate Ethyl acetate 100,0% 1
Isopropanol Isopropanol 100,0% 1
Methoxyisopropanol - Isopropylic alcohol Isopropanol 100,0% 4
Methylic Alcohol Methanol 100,0% 1
Toluene
Benzene 1,0%
1 Toluene 96,0%
Xylene 3,0%
Synthetic organic tanning agents
Aldehydes
2, 2-bis hydroxymethyl propionaldehyde solution
Acetaldehyde 45,0% 5
Water, tap 55,0%
Formaldehyde Formaldehyde 100,0% 1
Glutardialdehyde Acetaldehyde 100,0% 4
Polyaldehydes Acetaldehyde 45,0%
5 Water, tap 55,0%
Dihydroxydiphenyl-sulfones (DDS)
Methylene-linked condensation product of aryl sulphonic acids and hydroxyaryl sulfone
Synthetic tannins and retanning agents
100,0% 4
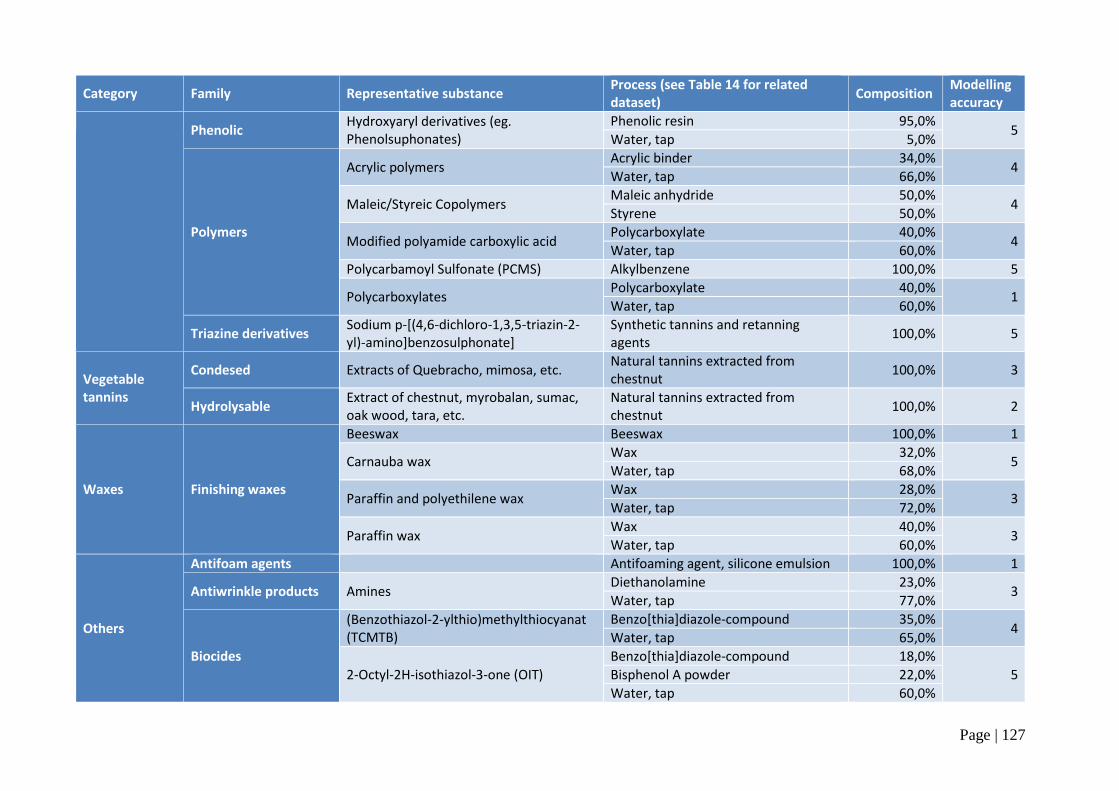
Page | 127
Category Family Representative substance Process (see Table 14 for related dataset)
Composition Modelling accuracy
Phenolic Hydroxyaryl derivatives (eg. Phenolsuphonates)
Phenolic resin 95,0% 5
Water, tap 5,0%
Polymers
Acrylic polymers Acrylic binder 34,0%
4 Water, tap 66,0%
Maleic/Styreic Copolymers Maleic anhydride 50,0%
4 Styrene 50,0%
Modified polyamide carboxylic acid Polycarboxylate 40,0%
4 Water, tap 60,0%
Polycarbamoyl Sulfonate (PCMS) Alkylbenzene 100,0% 5
Polycarboxylates Polycarboxylate 40,0%
1 Water, tap 60,0%
Triazine derivatives Sodium p-[(4,6-dichloro-1,3,5-triazin-2-yl)-amino]benzosulphonate]
Synthetic tannins and retanning agents
100,0% 5
Vegetable tannins
Condesed Extracts of Quebracho, mimosa, etc. Natural tannins extracted from chestnut
100,0% 3
Hydrolysable Extract of chestnut, myrobalan, sumac, oak wood, tara, etc.
Natural tannins extracted from chestnut
100,0% 2
Waxes Finishing waxes
Beeswax Beeswax 100,0% 1
Carnauba wax Wax 32,0%
5 Water, tap 68,0%
Paraffin and polyethilene wax Wax 28,0%
3 Water, tap 72,0%
Paraffin wax Wax 40,0%
3 Water, tap 60,0%
Others
Antifoam agents Antifoaming agent, silicone emulsion 100,0% 1
Antiwrinkle products Amines Diethanolamine 23,0%
3 Water, tap 77,0%
Biocides
(Benzothiazol-2-ylthio)methylthiocyanat (TCMTB)
Benzo[thia]diazole-compound 35,0% 4
Water, tap 65,0%
2-Octyl-2H-isothiazol-3-one (OIT)
Benzo[thia]diazole-compound 18,0%
5 Bisphenol A powder 22,0%
Water, tap 60,0%
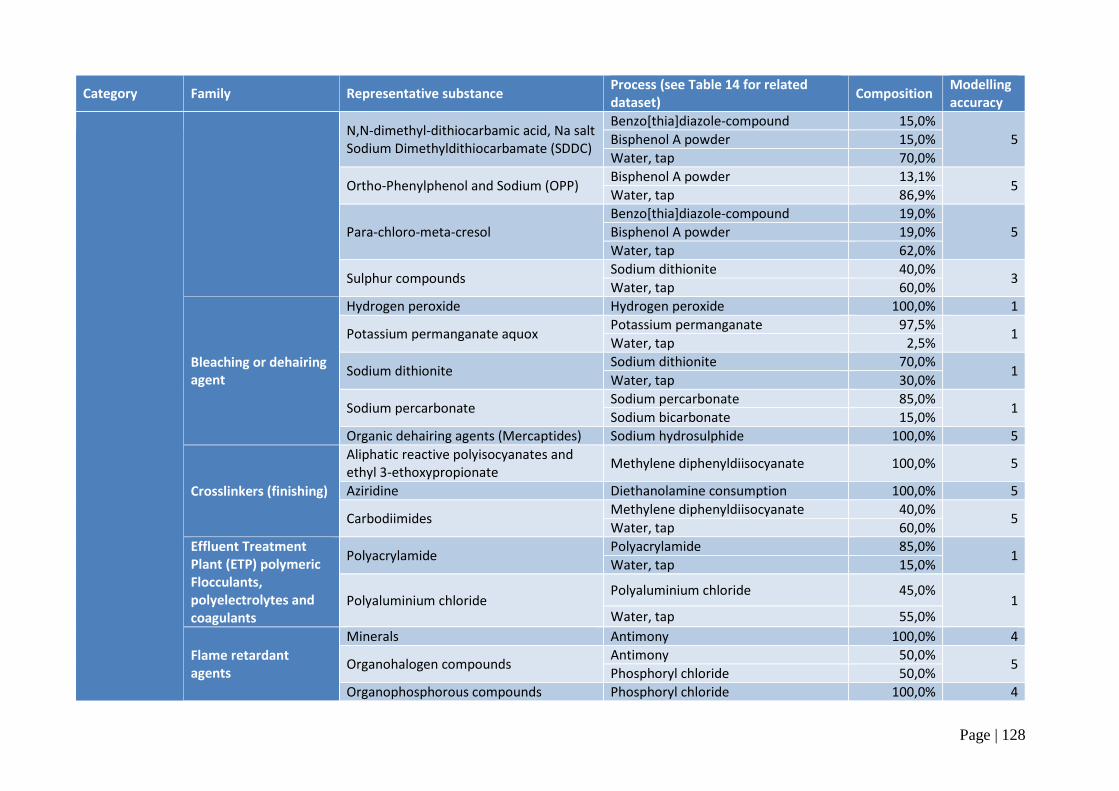
Page | 128
Category Family Representative substance Process (see Table 14 for related dataset)
Composition Modelling accuracy
N,N-dimethyl-dithiocarbamic acid, Na salt Sodium Dimethyldithiocarbamate (SDDC)
Benzo[thia]diazole-compound 15,0%
5 Bisphenol A powder 15,0%
Water, tap 70,0%
Ortho-Phenylphenol and Sodium (OPP) Bisphenol A powder 13,1%
5 Water, tap 86,9%
Para-chloro-meta-cresol
Benzo[thia]diazole-compound 19,0%
5 Bisphenol A powder 19,0%
Water, tap 62,0%
Sulphur compounds Sodium dithionite 40,0%
3 Water, tap 60,0%
Bleaching or dehairing agent
Hydrogen peroxide Hydrogen peroxide 100,0% 1
Potassium permanganate aquox Potassium permanganate 97,5%
1 Water, tap 2,5%
Sodium dithionite Sodium dithionite 70,0%
1 Water, tap 30,0%
Sodium percarbonate Sodium percarbonate 85,0%
1 Sodium bicarbonate 15,0%
Organic dehairing agents (Mercaptides) Sodium hydrosulphide 100,0% 5
Crosslinkers (finishing)
Aliphatic reactive polyisocyanates and ethyl 3-ethoxypropionate
Methylene diphenyldiisocyanate 100,0% 5
Aziridine Diethanolamine consumption 100,0% 5
Carbodiimides Methylene diphenyldiisocyanate 40,0%
5 Water, tap 60,0%
Effluent Treatment Plant (ETP) polymeric Flocculants, polyelectrolytes and coagulants
Polyacrylamide Polyacrylamide 85,0%
1 Water, tap 15,0%
Polyaluminium chloride Polyaluminium chloride 45,0%
1 Water, tap 55,0%
Flame retardant agents
Minerals Antimony 100,0% 4
Organohalogen compounds Antimony 50,0%
5 Phosphoryl chloride 50,0%
Organophosphorous compounds Phosphoryl chloride 100,0% 4
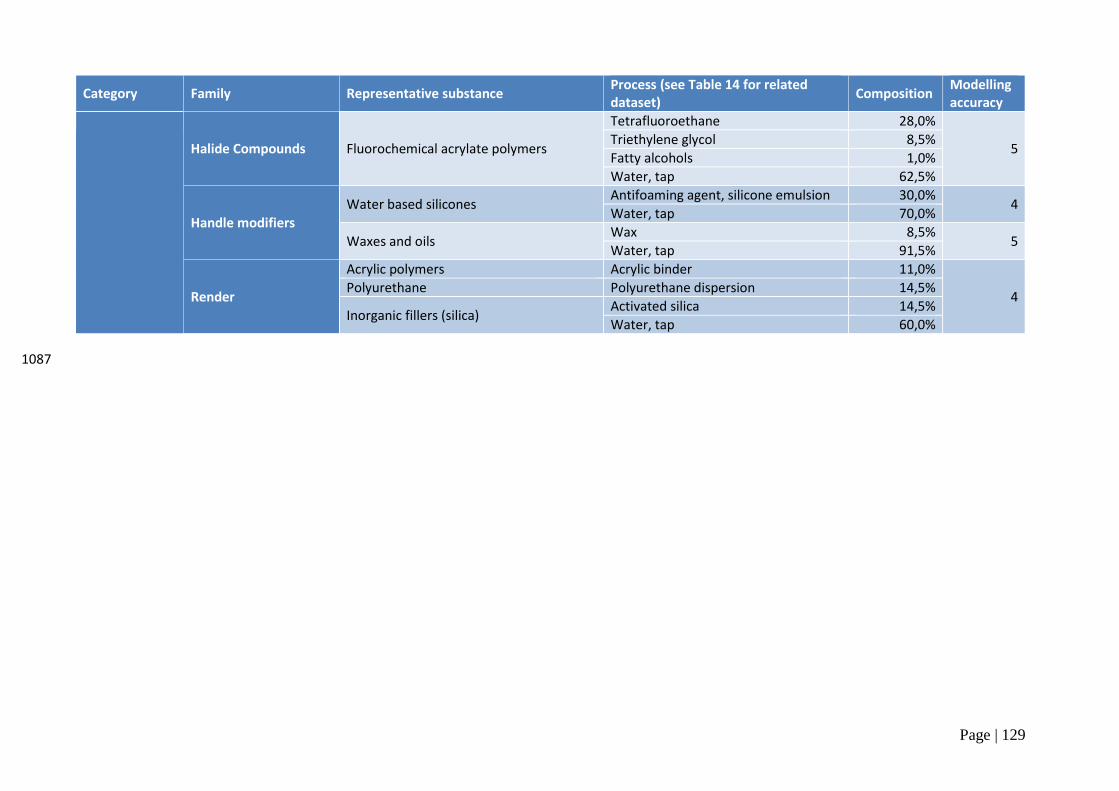
Page | 129
Category Family Representative substance Process (see Table 14 for related dataset)
Composition Modelling accuracy
Halide Compounds Fluorochemical acrylate polymers
Tetrafluoroethane 28,0%
5 Triethylene glycol 8,5%
Fatty alcohols 1,0%
Water, tap 62,5%
Handle modifiers
Water based silicones Antifoaming agent, silicone emulsion 30,0%
4 Water, tap 70,0%
Waxes and oils Wax 8,5%
5 Water, tap 91,5%
Render
Acrylic polymers Acrylic binder 11,0%
4 Polyurethane Polyurethane dispersion 14,5%
Inorganic fillers (silica) Activated silica 14,5%
Water, tap 60,0%
1087
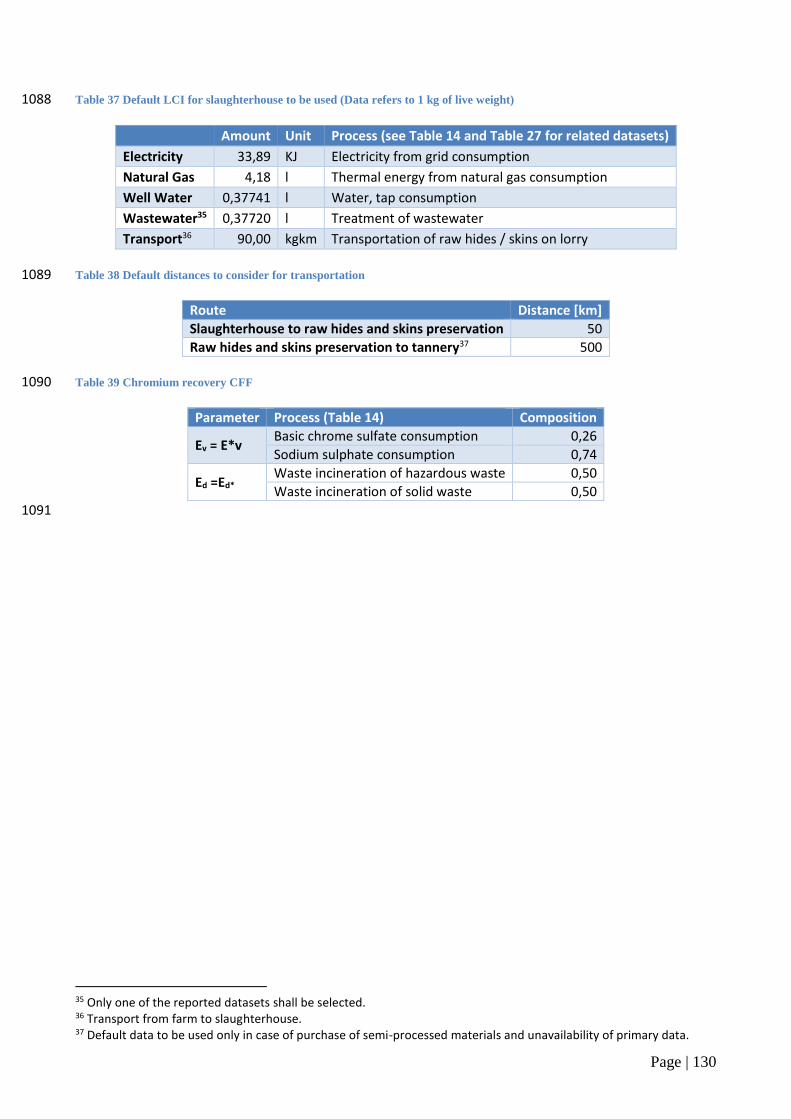
Page | 130
Table 37 Default LCI for slaughterhouse to be used (Data refers to 1 kg of live weight) 1088
Amount Unit Process (see Table 14 and Table 27 for related datasets)
Electricity 33,89 KJ Electricity from grid consumption
Natural Gas 4,18 l Thermal energy from natural gas consumption
Well Water 0,37741 l Water, tap consumption
Wastewater35 0,37720 l Treatment of wastewater
Transport36 90,00 kgkm Transportation of raw hides / skins on lorry
Table 38 Default distances to consider for transportation 1089
Route Distance [km]
Slaughterhouse to raw hides and skins preservation 50
Raw hides and skins preservation to tannery37 500
Table 39 Chromium recovery CFF 1090
Parameter Process (Table 14) Composition
Ev = E*v Basic chrome sulfate consumption 0,26
Sodium sulphate consumption 0,74
Ed =Ed* Waste incineration of hazardous waste 0,50
Waste incineration of solid waste 0,50
1091
35 Only one of the reported datasets shall be selected. 36 Transport from farm to slaughterhouse. 37 Default data to be used only in case of purchase of semi-processed materials and unavailability of primary data.
Page | 131
ANNEX 8 – Background information on methodological choices 1092
All impact categories required by the ILCD and the PEF methodology have been evaluated. Most relevant 1093 impact categories have been defined based on normalised results and sectorial relevance. 1094
Since leather is a bio-based intermediate product, the carbon storage of leather has to be considered as a 1095 relevant additional environmental information. 1096
Allocation Step-by-Step Methodology Description 1097
Overture 1098
Mass allocation of environmental impacts for the core leather manufacturing processes and for the various 1099 input processing materials will be based on the biobased and biogenic protein content (primary collagen, but 1100 also elastin, keratin, other types of sclero-proteins and proteoglycans) recovered or/and valorised with all 1101 possible core processes outputs which bear an economic value and are not classified as waste. N-proteic 1102 content, can be directly and reliably quantified and measured as Proteic-Nitrogen content, whilst routinely 1103 and systematically expressed as “hide substance” (in other languages the term used is “dermal substance” 1104 and in some cases “dermal matter”). 1105
Equation 1: Hide Substance [g] = N-proteic content [g] x 5.62 1106
The Standard Leather Testing method applicable for both the Nitrogen content determination and the 1107 calculation of Hide substance content thereof is ISO 5397:1984, whilst quick and reliable measurements of 1108 protein content can be carried out on site using the most recently developed and commercialised 1109 SpectraMax® QuickDrop™ Micro-Volume Spectrophotometer - see attached technical data sheet. 1110
Vade Mecum 1111
Starting point for all the calculations were published and industrial average data regarding the main 1112 ingredients composition of the raw materials of various animal origins and preservation methods. 1113
Along these lines, the average of biobased protein and N-proteic contents, expressed in g, have been 1114 quantified and reported in the literature for the main products, by-products and waste-effluent generated. 1115 The most comprehensive and complete protein and N-proteic mass balance and the related values for 1116 bovine, calf, and ovicaprine hides/skins, pickled pelts – when applicable - and leathers (semi-processed, semi-1117 finished and finished) can be found in Table 40 and in the one reported below. 1118
Moreover, the N-Mass Balance for all outputs (products, by-products, waste, biolsolids and effluent 1119 generated at the ETP) for four (4) production lines and raw materials from four (4) animal origins (bovine, 1120 calf, lamb and kid) have been reported in the literature ([1]. In particular, the outputs’ quantities and the 1121 corresponding quota of N-proteic contents (%) can be found in the table reported below. 1122
These, in turn, constituted the starting point the generation of the complete inventory of default allocation 1123 factors to be employed, when primary datasets were not collected or available for the purposes of a PEF-1124 study. 1125
In general, data for bovine leather production are abundant in the literature, whereas, for ovi-caprine skins 1126 processing, this information is scarce and seldom published, accordingly (Table 40). 1127
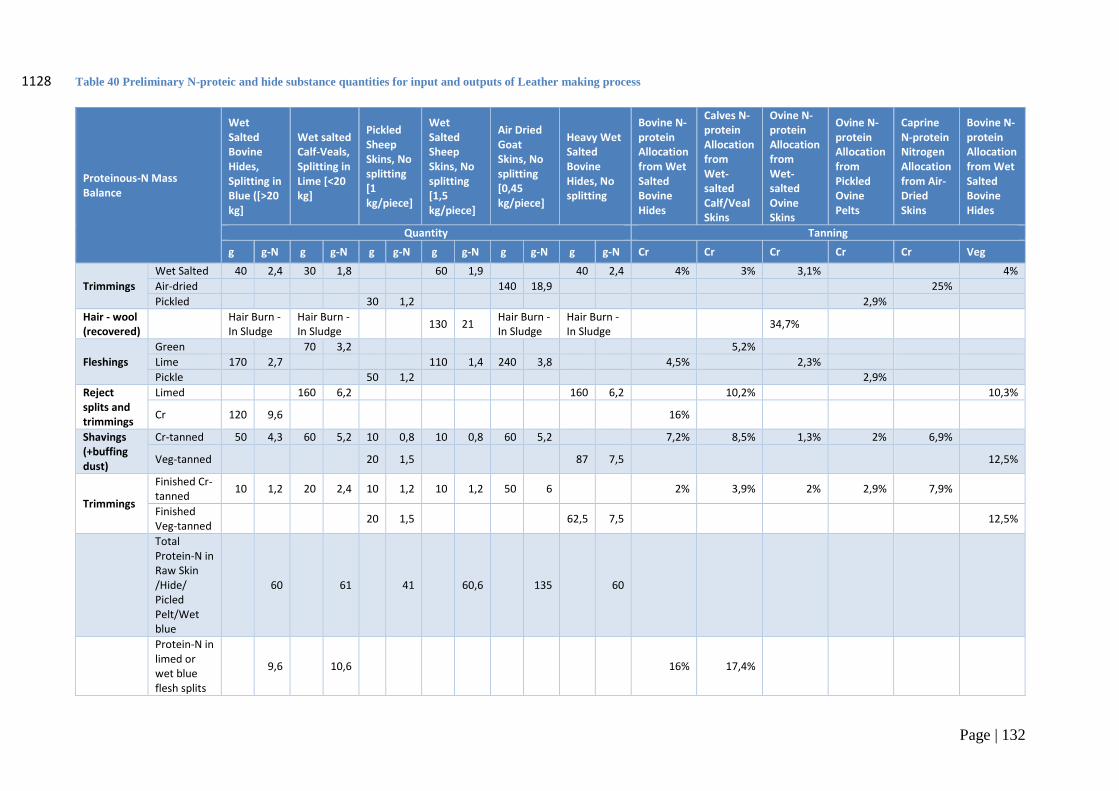
Page | 132
Table 40 Preliminary N-proteic and hide substance quantities for input and outputs of Leather making process 1128
Proteinous-N Mass Balance
Wet Salted Bovine Hides, Splitting in Blue ([>20 kg]
Wet salted Calf-Veals, Splitting in Lime [<20 kg]
Pickled Sheep Skins, No splitting [1 kg/piece]
Wet Salted Sheep Skins, No splitting [1,5 kg/piece]
Air Dried Goat Skins, No splitting [0,45 kg/piece]
Heavy Wet Salted Bovine Hides, No splitting
Bovine N-protein Allocation from Wet Salted Bovine Hides
Calves N-protein Allocation from Wet-salted Calf/Veal Skins
Ovine N-protein Allocation from Wet-salted Ovine Skins
Ovine N-protein Allocation from Pickled Ovine Pelts
Caprine N-protein Nitrogen Allocation from Air-Dried Skins
Bovine N-protein Allocation from Wet Salted Bovine Hides
Quantity Tanning
g g-N g g-N g g-N g g-N g g-N g g-N Cr Cr Cr Cr Cr Veg
Trimmings
Wet Salted 40 2,4 30 1,8 60 1,9 40 2,4 4% 3% 3,1% 4%
Air-dried 140 18,9 25%
Pickled 30 1,2 2,9%
Hair - wool (recovered)
Hair Burn - In Sludge
Hair Burn - In Sludge
130 21 Hair Burn - In Sludge
Hair Burn - In Sludge
34,7%
Fleshings
Green 70 3,2 5,2%
Lime 170 2,7 110 1,4 240 3,8 4,5% 2,3%
Pickle 50 1,2 2,9%
Reject splits and trimmings
Limed 160 6,2 160 6,2 10,2% 10,3%
Cr 120 9,6 16%
Shavings (+buffing dust)
Cr-tanned 50 4,3 60 5,2 10 0,8 10 0,8 60 5,2 7,2% 8,5% 1,3% 2% 6,9%
Veg-tanned 20 1,5 87 7,5 12,5%
Trimmings
Finished Cr-tanned
10 1,2 20 2,4 10 1,2 10 1,2 50 6 2% 3,9% 2% 2,9% 7,9%
Finished Veg-tanned
20 1,5 62,5 7,5 12,5%
Total Protein-N in Raw Skin /Hide/ Picled Pelt/Wet blue
60 61 41 60,6 135 60
Protein-N in limed or wet blue flesh splits
9,6 10,6 16% 17,4%
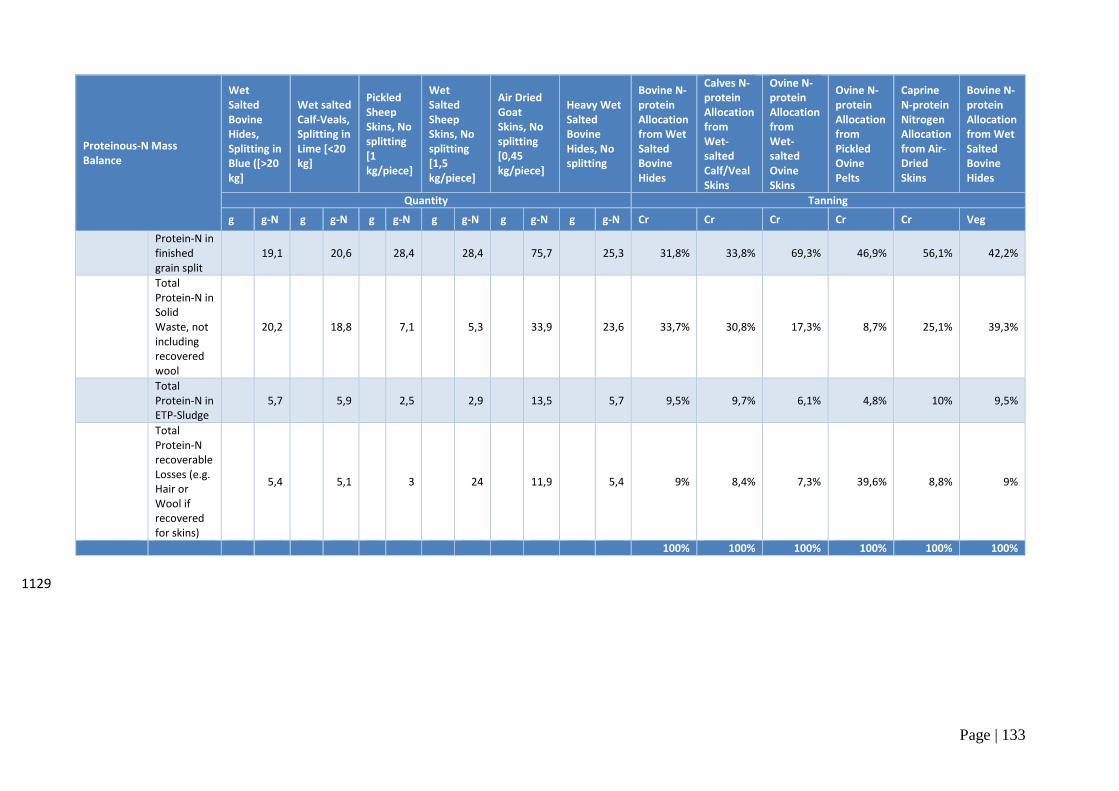
Page | 133
Proteinous-N Mass Balance
Wet Salted Bovine Hides, Splitting in Blue ([>20 kg]
Wet salted Calf-Veals, Splitting in Lime [<20 kg]
Pickled Sheep Skins, No splitting [1 kg/piece]
Wet Salted Sheep Skins, No splitting [1,5 kg/piece]
Air Dried Goat Skins, No splitting [0,45 kg/piece]
Heavy Wet Salted Bovine Hides, No splitting
Bovine N-protein Allocation from Wet Salted Bovine Hides
Calves N-protein Allocation from Wet-salted Calf/Veal Skins
Ovine N-protein Allocation from Wet-salted Ovine Skins
Ovine N-protein Allocation from Pickled Ovine Pelts
Caprine N-protein Nitrogen Allocation from Air-Dried Skins
Bovine N-protein Allocation from Wet Salted Bovine Hides
Quantity Tanning
g g-N g g-N g g-N g g-N g g-N g g-N Cr Cr Cr Cr Cr Veg
Protein-N in finished grain split
19,1 20,6 28,4 28,4 75,7 25,3 31,8% 33,8% 69,3% 46,9% 56,1% 42,2%
Total Protein-N in Solid Waste, not including recovered wool
20,2 18,8 7,1 5,3 33,9 23,6 33,7% 30,8% 17,3% 8,7% 25,1% 39,3%
Total Protein-N in ETP-Sludge
5,7 5,9 2,5 2,9 13,5 5,7 9,5% 9,7% 6,1% 4,8% 10% 9,5%
Total Protein-N recoverable Losses (e.g. Hair or Wool if recovered for skins)
5,4 5,1 3 24 11,9 5,4 9% 8,4% 7,3% 39,6% 8,8% 9%
100% 100% 100% 100% 100% 100%
1129
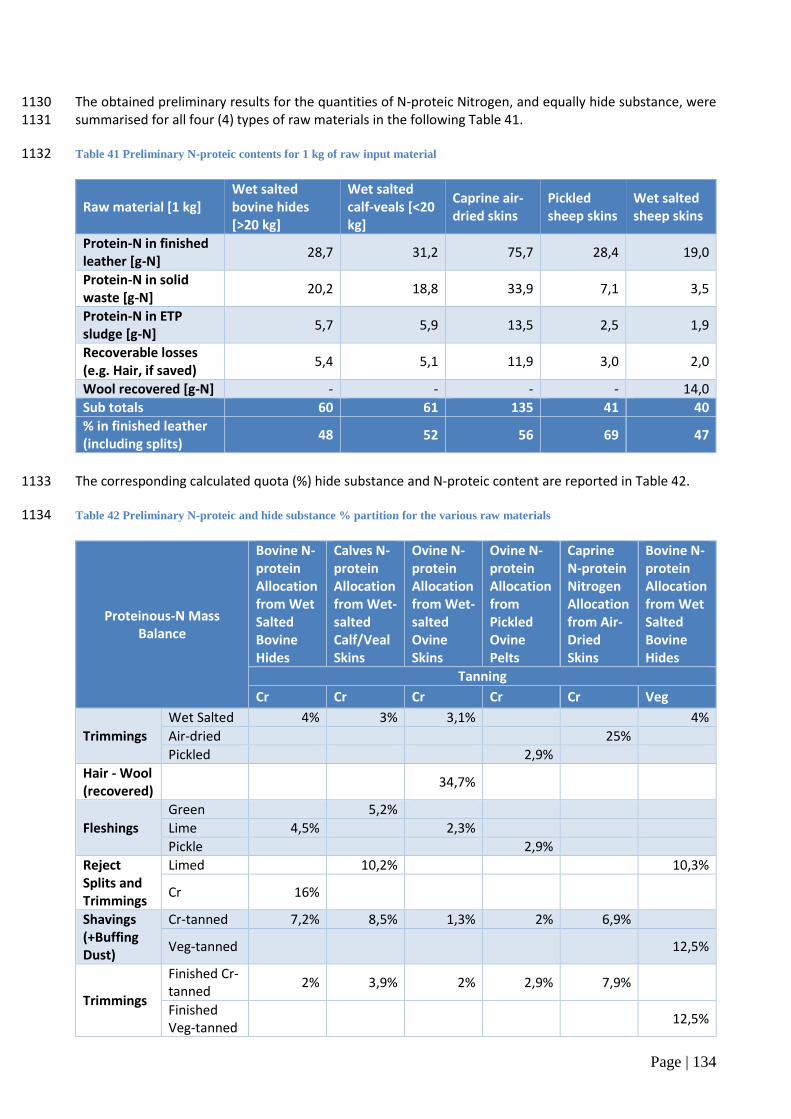
Page | 134
The obtained preliminary results for the quantities of N-proteic Nitrogen, and equally hide substance, were 1130 summarised for all four (4) types of raw materials in the following Table 41. 1131
Table 41 Preliminary N-proteic contents for 1 kg of raw input material 1132
Raw material [1 kg] Wet salted bovine hides [>20 kg]
Wet salted calf-veals [<20 kg]
Caprine air-dried skins
Pickled sheep skins
Wet salted sheep skins
Protein-N in finished leather [g-N]
28,7 31,2 75,7 28,4 19,0
Protein-N in solid waste [g-N]
20,2 18,8 33,9 7,1 3,5
Protein-N in ETP sludge [g-N]
5,7 5,9 13,5 2,5 1,9
Recoverable losses (e.g. Hair, if saved)
5,4 5,1 11,9 3,0 2,0
Wool recovered [g-N] - - - - 14,0
Sub totals 60 61 135 41 40
% in finished leather (including splits)
48 52 56 69 47
The corresponding calculated quota (%) hide substance and N-proteic content are reported in Table 42. 1133
Table 42 Preliminary N-proteic and hide substance % partition for the various raw materials 1134
Proteinous-N Mass Balance
Bovine N-protein Allocation from Wet Salted Bovine Hides
Calves N-protein Allocation from Wet-salted Calf/Veal Skins
Ovine N-protein Allocation from Wet-salted Ovine Skins
Ovine N-protein Allocation from Pickled Ovine Pelts
Caprine N-protein Nitrogen Allocation from Air-Dried Skins
Bovine N-protein Allocation from Wet Salted Bovine Hides
Tanning
Cr Cr Cr Cr Cr Veg
Trimmings
Wet Salted 4% 3% 3,1% 4%
Air-dried 25%
Pickled 2,9%
Hair - Wool (recovered)
34,7%
Fleshings
Green 5,2%
Lime 4,5% 2,3%
Pickle 2,9%
Reject Splits and Trimmings
Limed 10,2% 10,3%
Cr 16%
Shavings (+Buffing Dust)
Cr-tanned 7,2% 8,5% 1,3% 2% 6,9%
Veg-tanned 12,5%
Trimmings
Finished Cr-tanned
2% 3,9% 2% 2,9% 7,9%
Finished Veg-tanned
12,5%
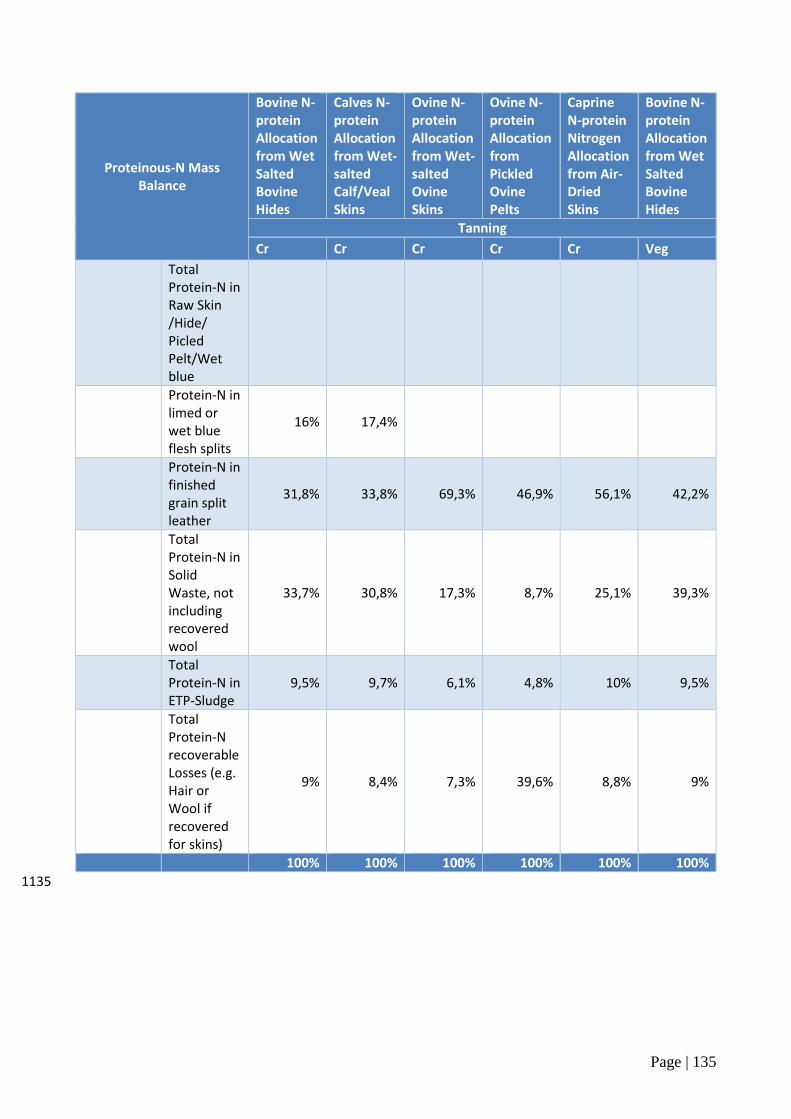
Page | 135
Proteinous-N Mass Balance
Bovine N-protein Allocation from Wet Salted Bovine Hides
Calves N-protein Allocation from Wet-salted Calf/Veal Skins
Ovine N-protein Allocation from Wet-salted Ovine Skins
Ovine N-protein Allocation from Pickled Ovine Pelts
Caprine N-protein Nitrogen Allocation from Air-Dried Skins
Bovine N-protein Allocation from Wet Salted Bovine Hides
Tanning
Cr Cr Cr Cr Cr Veg
Total Protein-N in Raw Skin /Hide/ Picled Pelt/Wet blue
Protein-N in limed or wet blue flesh splits
16% 17,4%
Protein-N in finished grain split leather
31,8% 33,8% 69,3% 46,9% 56,1% 42,2%
Total Protein-N in Solid Waste, not including recovered wool
33,7% 30,8% 17,3% 8,7% 25,1% 39,3%
Total Protein-N in ETP-Sludge
9,5% 9,7% 6,1% 4,8% 10% 9,5%
Total Protein-N recoverable Losses (e.g. Hair or Wool if recovered for skins)
9% 8,4% 7,3% 39,6% 8,8% 9%
100% 100% 100% 100% 100% 100%
1135
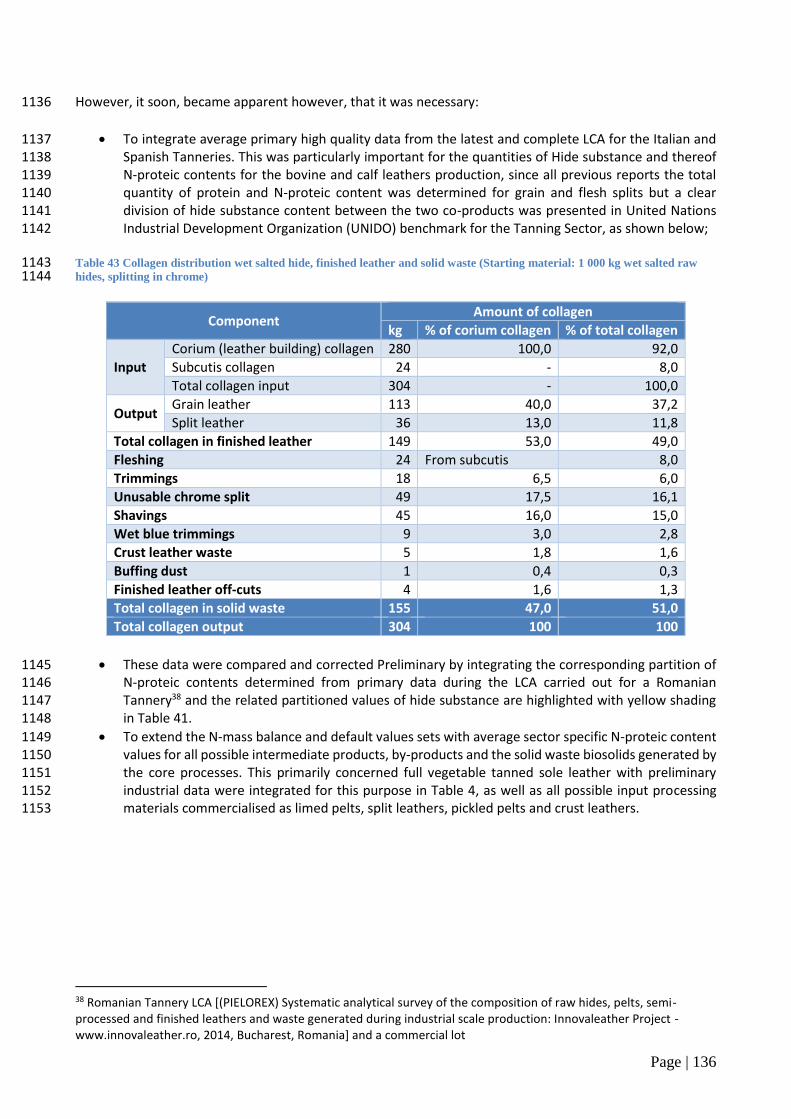
Page | 136
However, it soon, became apparent however, that it was necessary: 1136
To integrate average primary high quality data from the latest and complete LCA for the Italian and 1137 Spanish Tanneries. This was particularly important for the quantities of Hide substance and thereof 1138 N-proteic contents for the bovine and calf leathers production, since all previous reports the total 1139 quantity of protein and N-proteic content was determined for grain and flesh splits but a clear 1140 division of hide substance content between the two co-products was presented in United Nations 1141 Industrial Development Organization (UNIDO) benchmark for the Tanning Sector, as shown below; 1142
Table 43 Collagen distribution wet salted hide, finished leather and solid waste (Starting material: 1 000 kg wet salted raw 1143 hides, splitting in chrome) 1144
Component Amount of collagen
kg % of corium collagen % of total collagen
Input
Corium (leather building) collagen 280 100,0 92,0
Subcutis collagen 24 - 8,0
Total collagen input 304 - 100,0
Output Grain leather 113 40,0 37,2
Split leather 36 13,0 11,8
Total collagen in finished leather 149 53,0 49,0
Fleshing 24 From subcutis 8,0
Trimmings 18 6,5 6,0
Unusable chrome split 49 17,5 16,1
Shavings 45 16,0 15,0
Wet blue trimmings 9 3,0 2,8
Crust leather waste 5 1,8 1,6
Buffing dust 1 0,4 0,3
Finished leather off-cuts 4 1,6 1,3
Total collagen in solid waste 155 47,0 51,0
Total collagen output 304 100 100
These data were compared and corrected Preliminary by integrating the corresponding partition of 1145 N-proteic contents determined from primary data during the LCA carried out for a Romanian 1146 Tannery38 and the related partitioned values of hide substance are highlighted with yellow shading 1147 in Table 41. 1148
To extend the N-mass balance and default values sets with average sector specific N-proteic content 1149 values for all possible intermediate products, by-products and the solid waste biosolids generated by 1150 the core processes. This primarily concerned full vegetable tanned sole leather with preliminary 1151 industrial data were integrated for this purpose in Table 4, as well as all possible input processing 1152 materials commercialised as limed pelts, split leathers, pickled pelts and crust leathers. 1153
38 Romanian Tannery LCA [(PIELOREX) Systematic analytical survey of the composition of raw hides, pelts, semi-processed and finished leathers and waste generated during industrial scale production: Innovaleather Project - www.innovaleather.ro, 2014, Bucharest, Romania] and a commercial lot
Page | 137
To enable the calculation of allocation factors in function of the following chemical and mechanical 1154 operations deployed in the Tannery: 1155
o The dehairing/dewooling chemical operations (“hair burn” or “hair save” and “wool save” 1156 respectively); 1157
o The various splitting mechanical operations, when applicable – namely splitting in lime, blue 1158 splitting and splitting in pickle, whereas green splitting is a Best Available Technique (BAT) 1159 but only seldom applicable hitherto and skiving (dry-splitting has not been incorporated as a 1160 possible scenario usually employed by downstream end users); 1161
o The various fleshing operations (“green fleshing” or/and “lime fleshing”); 1162 o The broad tanning technologies categories, which very much determine process efficiency, 1163
composition and quantities of outputs. 1164
“Dry-shaving” of some types of semi-finished and finished leathers has not been yet included since such 1165 primary or generic data are not available. 1166
Along these lines, Sector specific N-proteic contents and protein quantities for waste and by-products were 1167 sourced from various sources. These in several cases came from National Sectoral surveys undertaken by 1168 Trade Associations, UNIDO. On the other hand, the partition of hide substance for the whole production cycle 1169 for the manufacture of finished upper bovine leathers and Italian Tanneries was sourced by the only 1170 previously existing LCA studies for the Italian and Spanish Sectors39. The flow chart and values reported with 1171 the LCA were converted into a practical table, used for the determination of the allocation factors for bovine 1172 leather production. 1173
39 Rita Puig et al, Industrial ecology in the cattle-to-leather supply chain, pages 42-43 - ISBN 978-88-464-9696-6,, Francoangeli srl, 2007, Milano. Italy
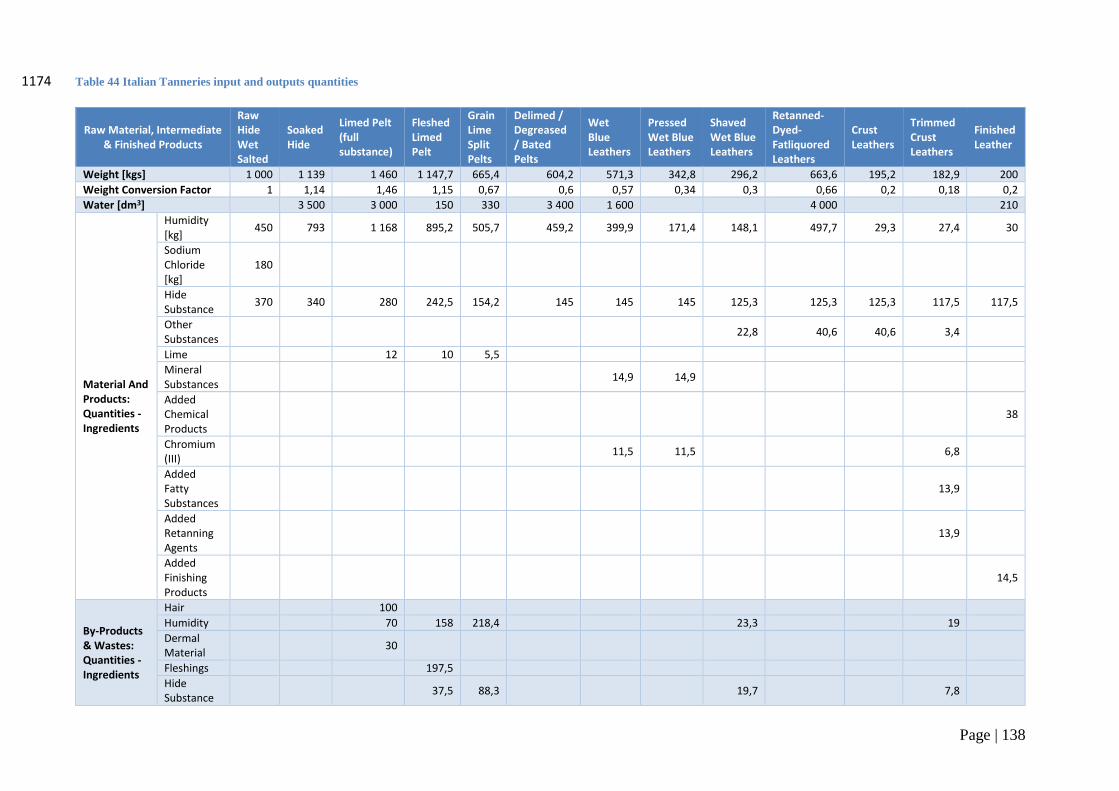
Page | 138
Table 44 Italian Tanneries input and outputs quantities 1174
Raw Material, Intermediate & Finished Products
Raw Hide Wet Salted
Soaked Hide
Limed Pelt (full substance)
Fleshed Limed Pelt
Grain Lime Split Pelts
Delimed / Degreased / Bated Pelts
Wet Blue Leathers
Pressed Wet Blue Leathers
Shaved Wet Blue Leathers
Retanned-Dyed-Fatliquored Leathers
Crust Leathers
Trimmed Crust Leathers
Finished Leather
Weight [kgs] 1 000 1 139 1 460 1 147,7 665,4 604,2 571,3 342,8 296,2 663,6 195,2 182,9 200
Weight Conversion Factor 1 1,14 1,46 1,15 0,67 0,6 0,57 0,34 0,3 0,66 0,2 0,18 0,2
Water [dm3] 3 500 3 000 150 330 3 400 1 600 4 000 210
Material And Products: Quantities - Ingredients
Humidity [kg]
450 793 1 168 895,2 505,7 459,2 399,9 171,4 148,1 497,7 29,3 27,4 30
Sodium Chloride [kg]
180
Hide Substance
370 340 280 242,5 154,2 145 145 145 125,3 125,3 125,3 117,5 117,5
Other Substances
22,8 40,6 40,6 3,4
Lime 12 10 5,5
Mineral Substances
14,9 14,9
Added Chemical Products
38
Chromium (III)
11,5 11,5 6,8
Added Fatty Substances
13,9
Added Retanning Agents
13,9
Added Finishing Products
14,5
By-Products & Wastes: Quantities - Ingredients
Hair 100
Humidity 70 158 218,4 23,3 19
Dermal Material
30
Fleshings 197,5
Hide Substance
37,5 88,3 19,7 7,8
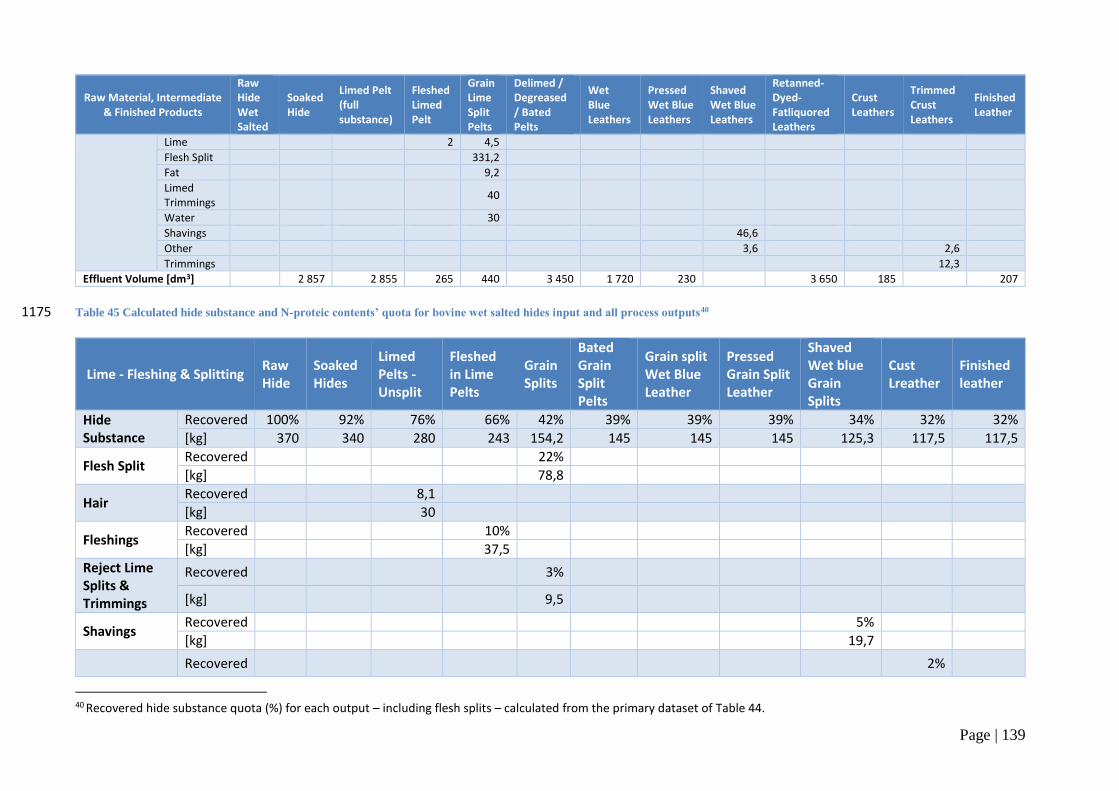
Page | 139
Raw Material, Intermediate & Finished Products
Raw Hide Wet Salted
Soaked Hide
Limed Pelt (full substance)
Fleshed Limed Pelt
Grain Lime Split Pelts
Delimed / Degreased / Bated Pelts
Wet Blue Leathers
Pressed Wet Blue Leathers
Shaved Wet Blue Leathers
Retanned-Dyed-Fatliquored Leathers
Crust Leathers
Trimmed Crust Leathers
Finished Leather
Lime 2 4,5
Flesh Split 331,2
Fat 9,2
Limed Trimmings
40
Water 30
Shavings 46,6
Other 3,6 2,6
Trimmings 12,3
Effluent Volume [dm3] 2 857 2 855 265 440 3 450 1 720 230 3 650 185 207
Table 45 Calculated hide substance and N-proteic contents’ quota for bovine wet salted hides input and all process outputs40 1175
Lime - Fleshing & Splitting Raw Hide
Soaked Hides
Limed Pelts - Unsplit
Fleshed in Lime Pelts
Grain Splits
Bated Grain Split Pelts
Grain split Wet Blue Leather
Pressed Grain Split Leather
Shaved Wet blue Grain Splits
Cust Lreather
Finished leather
Hide Substance
Recovered 100% 92% 76% 66% 42% 39% 39% 39% 34% 32% 32%
[kg] 370 340 280 243 154,2 145 145 145 125,3 117,5 117,5
Flesh Split Recovered 22%
[kg] 78,8
Hair Recovered 8,1
[kg] 30
Fleshings Recovered 10%
[kg] 37,5
Reject Lime Splits & Trimmings
Recovered 3%
[kg] 9,5
Shavings Recovered 5%
[kg] 19,7
Recovered 2%
40 Recovered hide substance quota (%) for each output – including flesh splits – calculated from the primary dataset of Table 44.
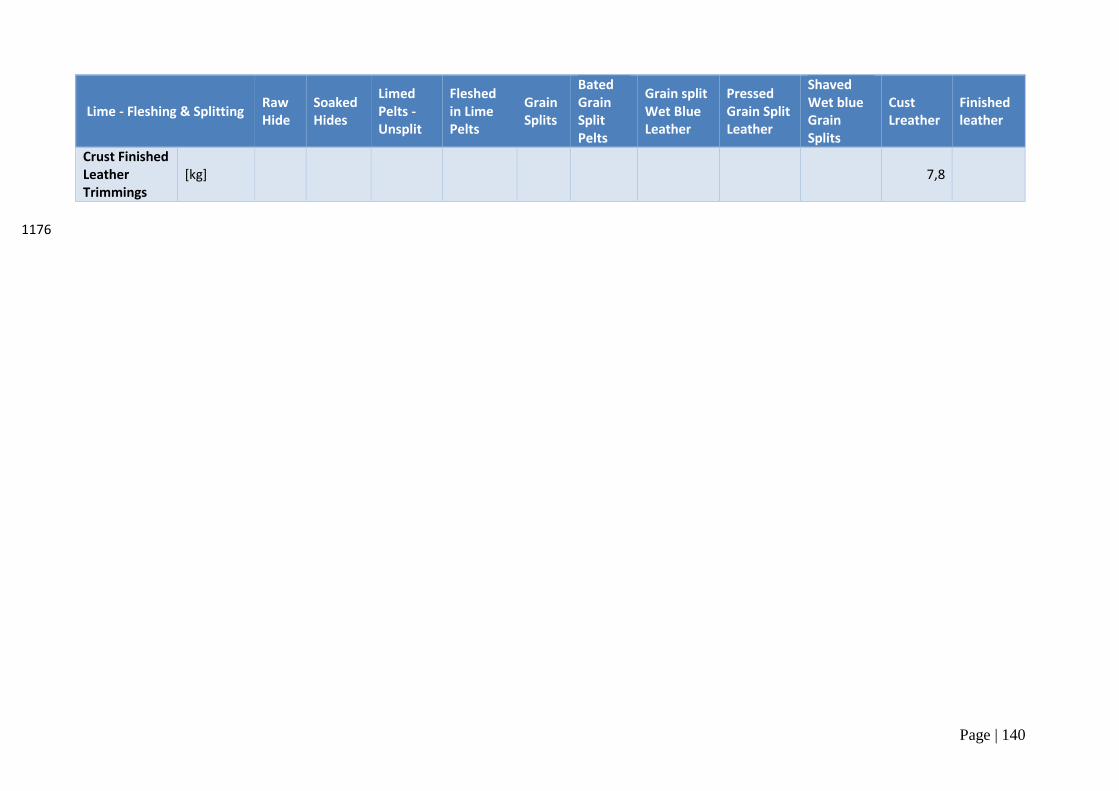
Page | 140
Lime - Fleshing & Splitting Raw Hide
Soaked Hides
Limed Pelts - Unsplit
Fleshed in Lime Pelts
Grain Splits
Bated Grain Split Pelts
Grain split Wet Blue Leather
Pressed Grain Split Leather
Shaved Wet blue Grain Splits
Cust Lreather
Finished leather
Crust Finished Leather Trimmings
[kg] 7,8
1176
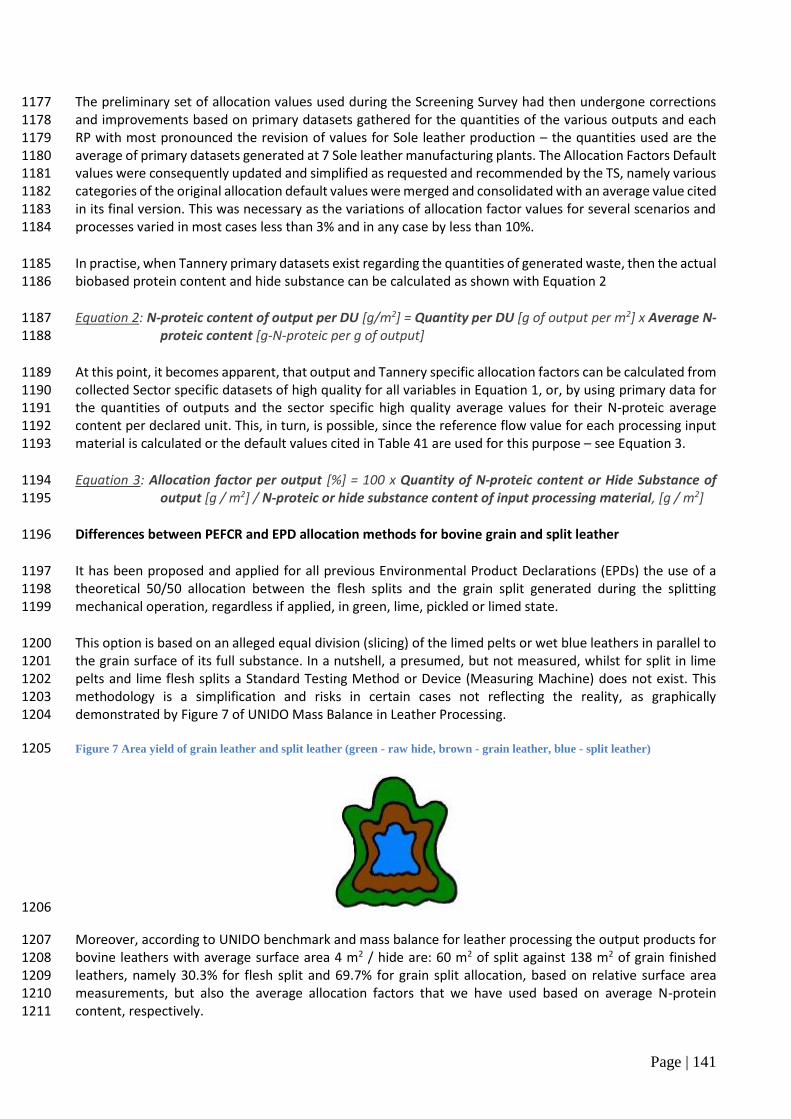
Page | 141
The preliminary set of allocation values used during the Screening Survey had then undergone corrections 1177 and improvements based on primary datasets gathered for the quantities of the various outputs and each 1178 RP with most pronounced the revision of values for Sole leather production – the quantities used are the 1179 average of primary datasets generated at 7 Sole leather manufacturing plants. The Allocation Factors Default 1180 values were consequently updated and simplified as requested and recommended by the TS, namely various 1181 categories of the original allocation default values were merged and consolidated with an average value cited 1182 in its final version. This was necessary as the variations of allocation factor values for several scenarios and 1183 processes varied in most cases less than 3% and in any case by less than 10%. 1184
In practise, when Tannery primary datasets exist regarding the quantities of generated waste, then the actual 1185 biobased protein content and hide substance can be calculated as shown with Equation 2 1186
Equation 2: N-proteic content of output per DU [g/m2] = Quantity per DU [g of output per m2] x Average N-1187 proteic content [g-N-proteic per g of output] 1188
At this point, it becomes apparent, that output and Tannery specific allocation factors can be calculated from 1189 collected Sector specific datasets of high quality for all variables in Equation 1, or, by using primary data for 1190 the quantities of outputs and the sector specific high quality average values for their N-proteic average 1191 content per declared unit. This, in turn, is possible, since the reference flow value for each processing input 1192 material is calculated or the default values cited in Table 41 are used for this purpose – see Equation 3. 1193
Equation 3: Allocation factor per output [%] = 100 x Quantity of N-proteic content or Hide Substance of 1194 output [g / m2] / N-proteic or hide substance content of input processing material, [g / m2] 1195
Differences between PEFCR and EPD allocation methods for bovine grain and split leather 1196
It has been proposed and applied for all previous Environmental Product Declarations (EPDs) the use of a 1197 theoretical 50/50 allocation between the flesh splits and the grain split generated during the splitting 1198 mechanical operation, regardless if applied, in green, lime, pickled or limed state. 1199
This option is based on an alleged equal division (slicing) of the limed pelts or wet blue leathers in parallel to 1200 the grain surface of its full substance. In a nutshell, a presumed, but not measured, whilst for split in lime 1201 pelts and lime flesh splits a Standard Testing Method or Device (Measuring Machine) does not exist. This 1202 methodology is a simplification and risks in certain cases not reflecting the reality, as graphically 1203 demonstrated by Figure 7 of UNIDO Mass Balance in Leather Processing. 1204
Figure 7 Area yield of grain leather and split leather (green - raw hide, brown - grain leather, blue - split leather) 1205
1206
Moreover, according to UNIDO benchmark and mass balance for leather processing the output products for 1207 bovine leathers with average surface area 4 m2 / hide are: 60 m2 of split against 138 m2 of grain finished 1208 leathers, namely 30.3% for flesh split and 69.7% for grain split allocation, based on relative surface area 1209 measurements, but also the average allocation factors that we have used based on average N-protein 1210 content, respectively. 1211
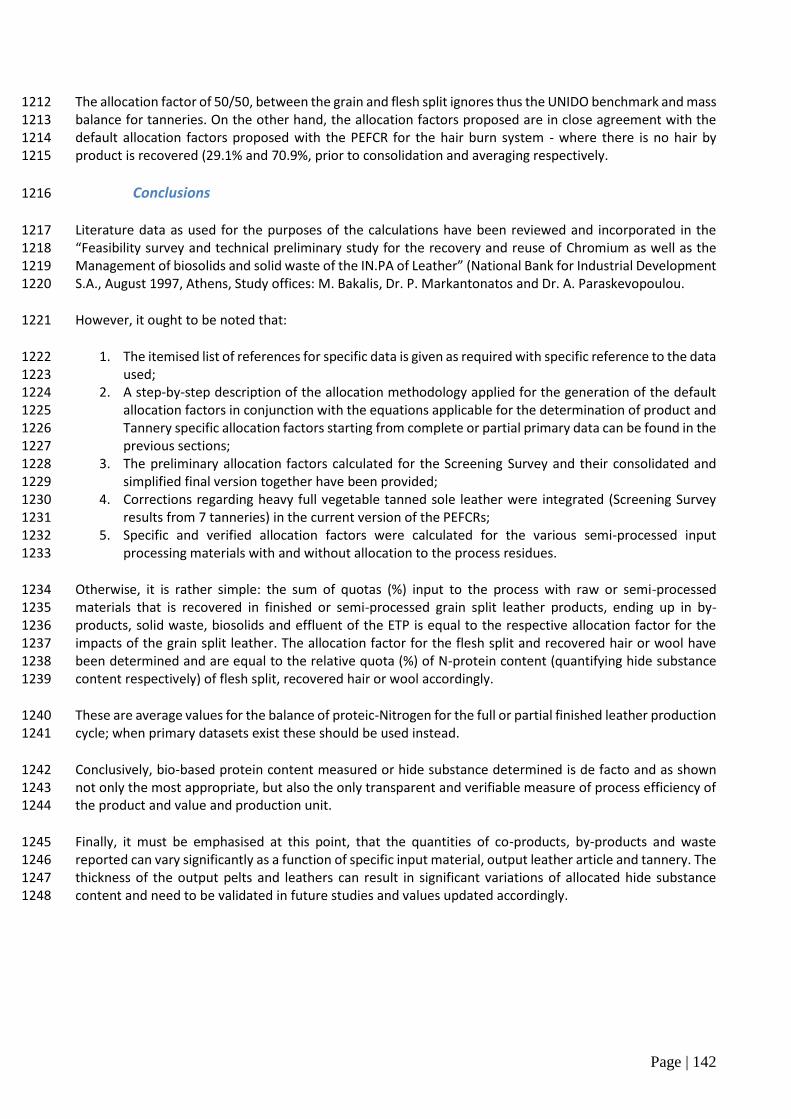
Page | 142
The allocation factor of 50/50, between the grain and flesh split ignores thus the UNIDO benchmark and mass 1212 balance for tanneries. On the other hand, the allocation factors proposed are in close agreement with the 1213 default allocation factors proposed with the PEFCR for the hair burn system - where there is no hair by 1214 product is recovered (29.1% and 70.9%, prior to consolidation and averaging respectively. 1215
Conclusions 1216
Literature data as used for the purposes of the calculations have been reviewed and incorporated in the 1217 “Feasibility survey and technical preliminary study for the recovery and reuse of Chromium as well as the 1218 Management of biosolids and solid waste of the IN.PA of Leather” (National Bank for Industrial Development 1219 S.A., August 1997, Athens, Study offices: M. Bakalis, Dr. P. Markantonatos and Dr. A. Paraskevopoulou. 1220
However, it ought to be noted that: 1221
1. The itemised list of references for specific data is given as required with specific reference to the data 1222 used; 1223
2. A step-by-step description of the allocation methodology applied for the generation of the default 1224 allocation factors in conjunction with the equations applicable for the determination of product and 1225 Tannery specific allocation factors starting from complete or partial primary data can be found in the 1226 previous sections; 1227
3. The preliminary allocation factors calculated for the Screening Survey and their consolidated and 1228 simplified final version together have been provided; 1229
4. Corrections regarding heavy full vegetable tanned sole leather were integrated (Screening Survey 1230 results from 7 tanneries) in the current version of the PEFCRs; 1231
5. Specific and verified allocation factors were calculated for the various semi-processed input 1232 processing materials with and without allocation to the process residues. 1233
Otherwise, it is rather simple: the sum of quotas (%) input to the process with raw or semi-processed 1234 materials that is recovered in finished or semi-processed grain split leather products, ending up in by-1235 products, solid waste, biosolids and effluent of the ETP is equal to the respective allocation factor for the 1236 impacts of the grain split leather. The allocation factor for the flesh split and recovered hair or wool have 1237 been determined and are equal to the relative quota (%) of N-protein content (quantifying hide substance 1238 content respectively) of flesh split, recovered hair or wool accordingly. 1239
These are average values for the balance of proteic-Nitrogen for the full or partial finished leather production 1240 cycle; when primary datasets exist these should be used instead. 1241
Conclusively, bio-based protein content measured or hide substance determined is de facto and as shown 1242 not only the most appropriate, but also the only transparent and verifiable measure of process efficiency of 1243 the product and value and production unit. 1244
Finally, it must be emphasised at this point, that the quantities of co-products, by-products and waste 1245 reported can vary significantly as a function of specific input material, output leather article and tannery. The 1246 thickness of the output pelts and leathers can result in significant variations of allocated hide substance 1247 content and need to be validated in future studies and values updated accordingly. 1248