creation of a customer relations development system draft phase … · creation of a customer...
TRANSCRIPT
Creation of a Customer Relations Development System – Draft Phase I Report
Applied Engineering Management (AEM) Corporation Texas A&M Transportation Institute (TTI) Prepared for the Ohio Department of Transportation Office of Statewide Planning and Research State Job Number 134722 November 1, 2013

ii
Technical Report Documentation Page (Form 1700.7)??
iii
CREATION OF A CUSTOMER RELATIONS DEVELOPMENT SYSTEM – PHASE I
Prepared by:
Applied Engineering Management (AEM) Corporation Herndon, VA 20171
&
Texas A&M Transportation Institute (TTI) College Station, TX 77843
Prepared in Cooperation with The Ohio Department of Transportation
November 1, 2013

iv
Disclaimer
The contents of this report reflect the views of the authors who are responsible for the facts and the accuracy of the data presented herein. The contents do not necessarily reflect the official views or policies of the Ohio Department of Transportation (ODOT). This report does not constitute a standard, specification, or regulation.
v
Acknowledgements
The researchers would like to thank the Ohio Department of Transportation (ODOT) for
sponsoring this study. Special thanks go to Andrew Shepler, Scott Phinney, and Andy Eline for
providing contact information, providing data, helping to arrange a focus group of ODOT Public
Information Officers (PIOs), and providing reviews. Thanks also go to the PIOs for participating
in interviews and the focus group.
vi
Table of Contents
1 Introduction ............................................................................................................................. 1 Background ...................................................................................................................................... 1 1.1 Objectives and Scope ....................................................................................................................... 3 1.2 Organization of Phase I Report ........................................................................................................ 4 1.3
2 Information Gathering/Data Collection .................................................................................. 5 Approach .......................................................................................................................................... 5 2.1
Interviews and Focus Group with ODOT Staff .........................................................................................5 2.1.1 Analysis of ODOT Customer Feedback Data ...........................................................................................6 2.1.2 Best Practice Review of Customer Relations/Communications among Transportation Agencies ..........6 2.1.3 Identification and Assessment of Customer Relations/Communications Tools/Software ......................7 2.1.4 Survey of ODOT Customers .....................................................................................................................7 2.1.5
Limitations ....................................................................................................................................... 8 2.2 Customer Inquiry Data ............................................................................................................................8 2.2.1 Customer Survey Data ............................................................................................................................9 2.2.2
3 Analysis Approach ................................................................................................................. 10 Gap Analysis Approach .................................................................................................................. 10 3.1 SWOT Analysis Approach ............................................................................................................... 11 3.2
4 Results of Gap Analysis .......................................................................................................... 13 Potential Performance versus Current Performance .................................................................... 13 4.1
Internal ODOT Processes and Communications ....................................................................................13 4.1.1 Communications Portals/Tools .............................................................................................................14 4.1.2 Customer Communications – Information and Service .........................................................................16 4.1.3 Customer Communications Data ..........................................................................................................18 4.1.4
Current Performance versus Needed/Desired Performance ........................................................ 20 4.2 Communications Portals/Tools, Information, and Service – What do Customers Want?.....................21 4.2.1 Communications Tools/Portals, Information, and Service – How Do Customer Needs/Desires Compare 4.2.2
with Where ODOT is Now? ...................................................................................................................24 Needed/Desired Performance versus Potential Performance ...................................................... 28 4.3
5 Results of SWOT Analysis ...................................................................................................... 29 Internal Processes and Communications ....................................................................................... 29 5.1
Strengths ...............................................................................................................................................29 5.1.1 Weaknesses ..........................................................................................................................................29 5.1.2 Opportunities ........................................................................................................................................30 5.1.3 Threats ..................................................................................................................................................30 5.1.4
Communications Portals/Tools ...................................................................................................... 30 5.2 Strengths ...............................................................................................................................................30 5.2.1 Weaknesses ..........................................................................................................................................31 5.2.2 Opportunities ........................................................................................................................................33 5.2.3 Threats ..................................................................................................................................................35 5.2.4
Customer Communications – Information and Service ................................................................. 38 5.3 Strengths ...............................................................................................................................................38 5.3.1 Weaknesses ..........................................................................................................................................39 5.3.2 Opportunities ........................................................................................................................................40 5.3.3 Threats ..................................................................................................................................................42 5.3.4
Customer Communications Data ................................................................................................... 43 5.4 Strengths ...............................................................................................................................................43 5.4.1 Weaknesses ..........................................................................................................................................43 5.4.2 Opportunities ........................................................................................................................................44 5.4.3
vii
Threats ..................................................................................................................................................44 5.4.4
6 Phase II Work Plan and Schedule .......................................................................................... 46 Phase II Work Plan ......................................................................................................................... 46 6.1
Task 6 – Recommend New and/or Modified Feedback Portals to Meet Customer Needs ....................46 6.1.1 Task 7 – Recommend Specifications for an Electronic CRD System ......................................................48 6.1.2 Task 8 – Develop Reports and Executive Summary and Present Research Findings .............................49 6.1.3 Task 9 – Develop Article for R&D Newsletter ........................................................................................49 6.1.4
Phase II Schedule of Research Activities ........................................................................................ 49 6.2
Appendix A - ODOT Interviews and Focus Group ......................................................................... 52 Interview Questions ................................................................................................................................ 52 Findings from Interviews with ODOT Staff ............................................................................................. 54
Web Feedback Form ............................................................................................................................................54 Social Media ........................................................................................................................................................56 Telephone ............................................................................................................................................................58 U.S. Mail ..............................................................................................................................................................60 MindMixer ...........................................................................................................................................................60
Ohio DOT Employee Focus Group Discussion Guide .............................................................................. 61 Findings from ODOT Focus Group........................................................................................................... 64
PIO Responsibilities .............................................................................................................................................64 Communication ...................................................................................................................................................65 Proactive Information Provision ..........................................................................................................................66
Social Media ............................................................................................................................................ 67 CIMS 68 Tools 70 Data, Metrics and Performance Measures .........................................................................................................71
Summary ................................................................................................................................................. 72 Interviews with ODOT Staff .................................................................................................................................72 ODOT Focus Group ..............................................................................................................................................72
Appendix B - Analysis of ODOT Customer Feedback Data ........................................................... 75 Web Feedback Data ................................................................................................................................ 75 Social Media Data ................................................................................................................................... 81 Telephone Data ....................................................................................................................................... 85 U.S. Mail Data .......................................................................................................................................... 86 MindMixer Data ...................................................................................................................................... 87 Customer Inquiry Management System ................................................................................................. 88 Summary ................................................................................................................................................. 96
Appendix C - State DOT’s Customer Communications and Relations Best Practices ................... 97 Customer Relations Management (CRM), Performance Measures, and Social Media .......................... 97 Customer Service Surveys, Feedback Forms, and Technology ............................................................. 100 State DOT Best Practices Summary....................................................................................................... 101
Appendix D – Assessment of Customer Relations/Communications Tools/Software ............... 102 Review of Software Tools for Customer Relations and Communications ............................................ 102
Basic Versus Integrated Solutions .................................................................................................................... 102 Targeted Feedback versus Idea Forum Tools ................................................................................................... 103 Other Tools to Collect Feedback ....................................................................................................................... 103 Tools and Providers Included in the Review ..................................................................................................... 103 General Observations about Third-Party Applications ..................................................................................... 105
Review of Feedback Management Systems ......................................................................................... 106 SuggestionBox .................................................................................................................................................. 106 UserVoice ......................................................................................................................................................... 108
viii
IdeaScale .......................................................................................................................................................... 113 Zoho Commentbox ........................................................................................................................................... 116 Mindmixer ........................................................................................................................................................ 118 Feedbackify ...................................................................................................................................................... 121 Kampyle 124 Tomyface .......................................................................................................................................................... 127 Mosio 129 SquaQr 131 OpinionLab ....................................................................................................................................................... 133 Medallia 135 Yourgov 137
Summary ............................................................................................................................................... 138
Appendix E – Customer Survey ................................................................................................... 139 Sampling Frame Assessment ................................................................................................................ 139 Survey Instrument ................................................................................................................................. 142 Findings ................................................................................................................................................. 151
Details about Contact with ODOT .................................................................................................................... 151 Communication Methods Used by ODOT ......................................................................................................... 157 Demographics .................................................................................................................................................. 164
Summary ............................................................................................................................................... 166
ix
List of Tables
Table 1. Gap Analysis Template ................................................................................................... 11
Table 2. SWOT Analysis Template ................................................................................................ 12
Table 3. Internal Processes and Communications ....................................................................... 13
Table 4. Communications Portals/Tools ...................................................................................... 15
Table 5. Customer Communications – Information and Service ................................................. 18
Table 6. Customer Communications Data ................................................................................... 20
Table 7. Specific Customer Comments from Survey on Information Needs ............................... 23
Table 8. Communications Portals/Tools ...................................................................................... 25
Table 9. Communications/Information ........................................................................................ 26
Table 10. Customer Service.......................................................................................................... 27
Table 11. Technology and Market Issues ..................................................................................... 47
Table 12. Classification of 337 Web Feedback Form Inquiries .................................................... 77
Table 13. Summary of General Requests for Information from ODOT ....................................... 79
Table 14. Summary of Inquiries Via Email and Web Feedback Form from CIMS Data ............... 80
Table 15. Summary of Social Media Usage .................................................................................. 83
Table 16. Summary of Telephone Inquiries ................................................................................. 85
Table 17. Summary of Inquiries Via Telephone Analyzed in Detail from CIMS Data .................. 85
Table 18. Summary of Inquiries Via U.S. Mail According to District Interviews .......................... 87
Table 19. Summary of U.S. Mail Inquiries from CIMS .................................................................. 87
Table 20. Summary of Communications by Portal as Indicated Through CIMS Data (Past Year) ............................................................................................................................ 91
Table 21. Summary of Communications by Portal as Indicated Through CIMS Data (Past 12 Years) ........................................................................................................................... 92
Table 22. Summary of Communication Types by Portal .............................................................. 93
Table 23. Classification of 420 CIMS Records (All Portals)........................................................... 94
Table 24. Feedback Management Systems Reviewed. .............................................................. 104
Table 25. Summary of Analysis .................................................................................................. 139
Table 26. Which of the following categories best describes your question or issue, the last time you contacted ODOT about a specific issue? ................................................... 152
Table 27. Contact Method used to Contact ODOT .................................................................... 152
Table 28. Specific ODOT Region Contacted ............................................................................... 152
Table 29. How easy was it to initially identify HOW to contact ODOT? .................................... 153
Table 30. Was the initial contact courteous and helpful? ......................................................... 153
Table 31. How satisfied were you with the response to your inquiry? ..................................... 154
Table 32. Did ODOT ask what method of communication they should use to follow up with you regarding your inquiry? ...................................................................................... 154
Table 33. Did ODOT ask what method of communication they should use to follow up with you regarding your inquiry? ...................................................................................... 154
Table 34. Within how many days of your initial contact did you receive follow up communication from ODOT? .................................................................................... 155
x
Table 35. Using a scale of 1 to 5, with 1 being "not at all pleasant" and 5 being "very pleasant", how pleasant would you rate your overall experience dealing with ODOT? ....................................................................................................................... 156
Table 36. How Pleasant Would you Rate your Overall Experience with each ODOT District? . 156
Table 37. Correlation Analyses .................................................................................................. 157
Table 38. Is There a Need for ODOT to Initiate Communication with its Customers? .............. 157
Table 39. Do you use social media, such as Facebook or Twitter? ............................................ 160
Table 40. Use of Social Media by Need for ODOT Initiated Communication ............................ 160
Table 41. Please select each of the following social media applications you may use? ........... 161
Table 42. Do you Follow ODOT on Social Media? ...................................................................... 161
Table 43. Which ODOT District do you Follow? ......................................................................... 161
Table 44. Why don't you follow ODOT on social media? .......................................................... 162
Table 45. How would you Rate ODOT’s Use of Social Media to Communicate with the Public? ....................................................................................................................... 162
Table 46. How could ODOT Improve its Use of Social Media to Communicate with the Public? ....................................................................................................................... 162
Table 47. Is there any information that ODOT does not currently communicate to its customers, in any way, that you believe they should? ............................................. 163
Table 48. [Social Media Users Only] Is there Information ODOT Should be Communicating to its Customers that it Currently is not? – Social Media User Strata ...................... 163
Table 49. Age .............................................................................................................................. 164
Table 50. Household Size ........................................................................................................... 164
Table 51. Education .................................................................................................................... 164
Table 52. Ethnicity ...................................................................................................................... 165
Table 53. Annual Household Income ......................................................................................... 165
Table 54. Gender ........................................................................................................................ 166
xi
List of Figures
Figure 1. Average Communication Frequency Rating by Information Type ................................ 23
Figure 2. Specification Development Cycle.................................................................................. 46
Figure 3. Phase II Schedule of Research Activities ....................................................................... 50
Figure 4. ODOT’s Web Feedback Form ........................................................................................ 54
Figure 5. Screen Shot of CIMS Data from Hummingbird GQL ..................................................... 90
Figure 6. Tools to Monitor Customer Feedback ........................................................................ 107
Figure 7. Response to Suggestions using Status Update ........................................................... 107
Figure 8. Live Search Feature of UserVoice Feedback .............................................................. 109
Figure 9. Comment System Feature of UserVoice Feedback .................................................... 110
Figure 10. Example of UserVoice Implementation Used by Sephora.com ............................... 111
Figure 11. Example of UserVoice Idea Form Used by Sephora.com ......................................... 112
Figure 12. IdeaScale Forum of the City of Fayetteville, Arkansas ............................................. 113
Figure 13. IdeaScale Forum of the President’s Save Award Webpage ..................................... 114
Figure 14. Zoho Commentbox Feedback Form .......................................................................... 116
Figure 15. City of Cincinnati Plan Build Live Initiative Using Mindmixer ................................... 118
Figure 16. Screenshot of Topics in Form Based Code Category ................................................ 119
Figure 17. Screenshot of Poll Questions and Comments .......................................................... 120
Figure 18. List of Rewards Available for Users of Mindmixer ................................................... 120
Figure 19. Example of Feedback Button at Dictionary.com ...................................................... 122
Figure 20. Example of a Feedback Form using Feedbackify ..................................................... 122
Figure 21. Example of the Request to Provide Email Address after Submitting Feedback ...... 123
Figure 22. Sample Feedback Window from Kampyle ............................................................... 125
Figure 23. Sample Optional Contact Information Window from Kampyle ............................... 125
Figure 24. Screenshot of Kampyle Feedback Management System ......................................... 126
Figure 25. Example Feedback Form in Tomyface. ..................................................................... 128
Figure 26. Example of QR Codes Using SquaQr ........................................................................ 131
Figure 27. Sample of a Feedback Form Presented on a Smartphone after Scanning a QR code .......................................................................................................................... 132
Figure 28. Example of Opinionlab Feedback Link Integration on Webpage ............................. 133
Figure 29. Sample of Opinionlab Feedback Form ..................................................................... 134
Figure 30. Screenshot of Yourgov Citizen Request Application ................................................ 137
Figure 31. Frequency with Which Respondents Want Various Types of Information from ODOT ......................................................................................................................... 158
Figure 32. Mean Score – Relative Frequency of Updates Desired by Topic .............................. 159
Figure 33. Method by which Respondents want ODOT Initiated Communication ................... 159
1
1 Introduction
BACKGROUND 1.1
Private sector organizations regularly monitor customer satisfaction and use that information to improve service delivery to stay competitive. Customers demand new ways to access products, services, and support; innovative companies anticipate these demands and improve their customer-facing operations accordingly. With a nod to advanced technology and efforts to improve customer satisfaction, companies today can measure exactly how much business a customer generates, what he/she is likely to buy, and how much it costs to answer the phone (D. Reis, 2003). New advancements can deliver products and services both more efficiently and more effectively.
Similar to customer service improvements demanded in the private sector, federal, state, and local governments must keep pace with the public’s expectations and transform their customer services – soliciting regular customer feedback, streamlining processes, ensuring transparency, using resources efficiently and delivering consistent service across customer channels. Since the mid-1990s there have been several initiatives designed to change the way citizens interact and participate in government. The Clinton administration cited “Create an Electronic Government” as one of a set of five actions that would change government forever (Kamensky, 1999). Executive Order 12862 directed federal agencies to survey their customers to determine the types of services they wanted versus what they were receiving (Clinton, 1993). Studies analyzed businesses to determine which had the best record of resolving customer complaints, to identify the gap between customer expectations and agency performance, to understand what actions were used to close that gap, and to determine how those actions could be implemented in a federal agency.
In 2011, President Obama signed Executive Order 13571, Streamlining Service Delivery and Improving Customer Service, requiring each federal agency to develop a customer service plan that identified implementation steps for their customer service activities, including a "signature initiative" that uses technology to improve the customer experience (US Government). In doing so, President Obama recognized that advances in technology and service delivery systems in the private sector raise customer expectations that the federal government should at least meet, if not exceed. This effort to expand the government’s accessibility and increase accountability is known as “Gov 2.0,” and it is based on the ideals behind Web 2.0, which are designed to “facilitate interactive information sharing, interoperability, user centered design, and collaboration” (Sharma, 2009).
These plans also prepared agencies to integrate specific customer service goals into annual agency performance plans and reports. Accordingly, the U.S. Department of Transportation published their Customer Service Plan in October 2011 with the following goal:
Our Plan was developed by a diverse, multimodal group with support from both executive leadership and individual employees. The Plan serves as a blueprint for improving our customer service by applying open government principles in combination with advanced technologies to deliver vital information to consumers. It will also guide
2
us as we redesign complex business processes to improve the customer experience while streamlining service delivery (Porcari, 2011).
Recent legislative activity indicates the federal government continues to work to improve the quality of service provided by government agencies to the public. On September 11, 2012, House bill (H.R.) 538, Government Customer Service Improvement Act, was passed by the U.S. House of Representatives;1 companion Senate bill S. 3455, requiring establishment of customer service standards for federal agencies, is pending in Committee.2 These recent actions exemplify the commitment from the federal government to improve customer service, simplify communication procedures, and integrate technology into customer service goals and agency performance plans.
Several departments of transportation (DOTs) have initiated customer satisfaction efforts as a result of some crisis. For example, in 1999, a citizen initiative was successful at removing approximately one third of Washington State’s transportation revenue, and the debate surrounding the vote elucidated that the public and elected leaders were concerned about the apparent inefficiency, lack of accountability, and growing problems in a number of subject areas (Bremmer & Bryan, 2008). Virginia’s Dashboard initiative began as an internal effort to gain control over cost and scheduling problems that sapped the Virginia Department of Transportation’s (VDOT) credibility with the General Assembly and the public (Commonwealth of Virginia, 2007). Maryland’s Attainment Report and Florida’s Key Performance Measures were developed as a way to improve the delivery of transportation products and services and to improve the linkages between their long-range plans, financial plans, and employee work processes (O'Malley, Brown, & Porcari, 2009), (Florida DOT, 2006).
State DOTs have implemented different approaches to improve communications with customers. As part of a 1996 initiative to become more connected with its citizens through effective two-way communication and response to the public needs, the Alaska DOT conducted in-depth interviews, a baseline telephone survey, and two subsequent surveys and developed a public improvement plan (PIP) (Alaska, 1996). The Missouri DOT conducts 3,500 telephone interviews annually towards its mission of “delighting its customers.” The annual telephone survey is conducted to measure various aspects of customer satisfaction, to acknowledge trends, and to see where improvements can be made (Missouri DOT, 2012). Washington State DOT uses Twitter, Facebook, blogs, discussion boards, MySpace, and Flickr to facilitate open two-way communication with its customers and also uses Web 2.0 to track and monitor the feedback and to respond to issues in a timely and effective manner (Brown, 2010). In 2010, the U.S. DOT developed an “Open Government Plan” to improve the services provided to its customers as well as to facilitate two-way communication between stakeholders and the public through a public dialogue website (U.S. DOT, 2010).
1 CONGRESSMAN CUELLAR’S BILL TO IMPROVE FEDERAL AGENCIES’ CUSTOMER SERVICE PASSES THE HOUSE
Washington, D.C., cuellar.house.gov September 11, 2012. Henry Cuellar website: cuellar.house.gov Press release: http://cuellar.house.gov/news/documentprint.aspx?DocumentID=308046 2 S. 3455: Government Customer Service Improvement Act of 2012, 112
th Congress, 2011-2012. Bill tracking site
http:// http://www.govtrack.us/congress/bills/112/s3455 Accessed on December 3, 2012
3
State have developed numerous processes and metrics to measure and monitor the performance and physical conditions of their transportation facilities. One aspect of transportation performance that has not received as much attention, however, is how the public perceives and assesses performance and service quality, and how these perceptions impact customer satisfaction with the transportation system. Similar to other states, ODOT does not currently have a comprehensive process or system that provides for two-way communication with its customers. As a result, ODOT cannot directly monitor or measures how well Ohio’s transportation system meets the needs of its customers.
To address this deficiency, ODOT is researching the development of a comprehensive customer relations development (CRD) system that will facilitate communication between the users of the transportation system and the department by allowing ODOT to receive feedback from its customers as well as to respond to this feedback. The result will be a system in which a wide variety of information flows easily between the department and its customers thereby improving efficiency, increasing transparency, and demonstrating accountability. This research project will provide ODOT with a clear understanding of its current performance, benchmark ODOT against peer agencies and customer needs/desires, recommend alternative systems for managing communications with customers, and provide a blueprint for developing and deploying a recommended system.
OBJECTIVES AND SCOPE 1.2
The overall goal of this research project is to recommend a robust CRD system that can efficiently and accurately gather, process, and quantify the needs and requirements of ODOT’s customers and that will facilitate two-way communication between ODOT and its customers. The research will culminate in specifications for a CRD system that will not only collect customer input but also will effectively disseminate information back to customers.
To accomplish this overall goal, the research team focused on the following technical objectives in Phase I:
Analyze ODOT’s current customer relations processes, portals, and tools.
Baseline customer satisfaction with existing customer feedback portals and responses.
Benchmark ODOT’s customer relations processes/portals against practices at other public agencies.
Benchmark ODOT’s customer relations processes/portals against the needs and desires of its customers.
Identify and assess available customer relations tools and services.
In Phase II of this research project the following remaining technical objectives will be addressed:
Recommend alternative approaches to a CRD system that meet the needs of ODOT as well as its customers.
Develop CRD system specifications for one or more selected approaches.
4
ORGANIZATION OF PHASE I REPORT 1.3
Phase I of this research project involved extensive information and data gathering activities including a best practices review, review of customer relations tools and software, interviews and a focus group with ODOT staff, analysis of ODOT customer communications data, and a customer survey. Following the information and data gathering activities, the team conducted a gap analysis and SWOT analyses using the information and data gathered. The findings from these analyses are the crux of the Phase I efforts and will guide the research project into Phase II. Therefore, in the main body of this report, the research team has focused on elucidating the various approaches used to gather information/data, the analysis approaches, the findings from the analyses, and how these findings will support the Phase II efforts. Following the main body of the report, the detailed findings from each of the data activities is presented in a set of appendices. The report is organized as follows.
Chapter 2 – Information Gathering/Data Collection
Chapter 3 – Analysis Approach
Chapter 4 – Findings from Gap Analysis
Chapter 5 – Findings from SWOT Analysis
Chapter 6 – Phase II Work Plan and Schedule
Appendix A – ODOT Interviews and Focus Group
Appendix B – Analysis of ODOT Customer Feedback Data
Appendix C – State DOT’s Customer Communications and Relations Best Practices
Appendix D – Assessment of Customer Relations/Communications Tools/Software
5
2 Information Gathering/Data Collection
APPROACH 2.1
This chapter presents a description of the various approaches used by the research team to gather information and data to meet the Phase I objectives listed above. The research team employed a variety of approaches, including:
Interviews and focus group with ODOT staff.
Analysis of ODOT customer feedback data.
Best practice review of customer relations/communications among transportation agencies.
Identification and assessment of customer relations/communications tools/software.
Survey of ODOT customers.
Each of these approaches is described in detail below.
Interviews and Focus Group with ODOT Staff 2.1.1
2.1.1.1 Interviews with ODOT Staff
The first approach to assessing ODOT’s current customer communications processes was to conduct telephone interviews with ODOT district staff responsible for the day-to-day communications with customers in their districts. ODOT provided the contact information for the appropriate district personnel. Prior to scheduling the interviews, the research team developed a list of questions to inquire about the processes that each district uses when communicating with customers via the various portals.
Between November 19th and November 28th, 2012, telephone interviews were conducted with the appropriate ODOT district staff. The employee interviewed within each district, was most often the Public Information Officers (PIO), and one of the staff interviewed represented the district’s IT department. In all, nine telephone interviews were conducted and included representatives from the following ODOT districts: Districts 1, 3, 4, 6, 8, 9, 10, and 11. In addition, representatives from four districts (Districts 3, 5, 7, and 12) provided written responses to the questions. District 2 was the only district that did not provide a response.
The interview questions and a complete summary of the findings from the interviews can be found in Appendix A.
2.1.1.2 ODOT Focus Group
The second approach to assessing ODOT’s current customer communications processes, and was a follow-up approach to the interviews, was to conduct a focus group with ODOT District PIOs. Even though many of the PIOs took part in both activities, the focus group allowed for interaction and discussion between participants.
Prior to conducting the focus group, a discussion guide was developed for the focus group moderators. The discussion guide was used to help initiate conversation and keep a relatively moderate amount of focus of the group to ensure the topics of interest to the researchers were
6
covered. The focus group discussion guide was not as formal or as detailed as the interview questions but was helpful in keeping the participants on topic as much as possible.
The research team conducted the focus group with ODOT’s District PIOs on September 10, 2013. The group was attended by seventeen PIOs and one representative of ODOT central administration. At least one representative from each district participated in the focus group. The focus group lasted approximately two hours and was held at ODOT’s state headquarters in Columbus, Ohio. Discussions centered on current PIO activities, tools utilized by PIOs in managing customer service-related functions, and issues associated with ODOT customer service initiatives.
The discussion guide and the detailed findings of the focus group can be found in Appendix A.
Analysis of ODOT Customer Feedback Data 2.1.2
To assess the quantity and types of customer communications, ODOT provided actual customer feedback data from the following two sources:
ODOT’s web feedback form.
ODOT’s Customer Inquiry Management System (CIMS) database.
ODOT archived customer feedback made via the web feedback form from June 27, 2013 through October 22, 2012, a period of about four months. During this time ODOT received 587 inquiries via the web feedback form. In addition, ODOT provided the research team with a sample of 720 customer inquiries that had been input into ODOT’s CIMS for about a one-year period beginning November 1, 2011. This sample included a mix of customer inquiries from various districts and portals, as well as the time of year the inquiry was submitted.
An in-depth analysis was conducted on a sample of 337 inquiries from the web feedback form and 420 inquiries from CIMS. Each comment was read in detail and classified into one of 23 primary topic categories (e.g., construction, maintenance, safety, traffic lights), as well as one or more secondary topic categories, if appropriate.
In addition to the customer feedback data provided to the research team by ODOT, the research team conducted a high-level assessment of communications via ODOT’s Facebook and Twitter pages. The focus of this assessment was on quantifying the number of comments posted by ODOT and by customers on the various accounts, as well as to get a general idea of the types of information being communicated.
A detailed summary of the findings from the assessment of ODOT’s customer feedback data is located in Appendix B.
Best Practice Review of Customer Relations/Communications among Transportation 2.1.3Agencies
The objective of the best practices review was to present a framework for why customer relations, communications, and satisfaction are important and how other transportation agencies have addressed these issues. The research team began by identifying and summarizing federal initiatives that recognize and prioritize customer satisfaction as a basic tenet of good business, as adapted from the private sector. Then, to identify best practices, the
7
team primarily used a literature review approach, which identified examples of agencies, mostly state DOTs, that have extensive customer satisfaction programs. In addition, the research team reviewed the DOTs and transit agencies that are leading in the arena of performance measures to assess if and how customer satisfaction is measured and reported. Agencies reviewed included:
Metropolitan Transportation Authority (MTA).
Washington Metropolitan Area Transit Authority (WMATA).
Vancouver TransLink.
Missouri DOT.
Wisconsin DOT.
Texas DOT.
All information gathered was documented in a technical memorandum. A detailed summary of best practices is located in Appendix C.
Identification and Assessment of Customer Relations/Communications Tools/Software 2.1.4
There are a number of customer relations development tools available that ODOT could consider, depending on its specific needs, and many of these tools are very similar. Therefore, the research team conducted a review and assessment of a variety of existing tools and software alternatives for their potential application within ODOT. The approach used was not to review all tools (time and resources did not allow for this extensive of a review); however, the approach was to provide a review to give an overview of some of the more popular tools that ODOT might consider. While the selection of which tools to review was somewhat subjective, the research team wanted to provide ODOT with a range of tools – from tools that offer very basic solutions to tools that offer more integrated solutions – as well as to highlight the difference between targeted feedback versus idea forum tools. Each tool or system was assessed according to the following framework:
Purpose.
Features.
Benefits.
Drawbacks.
Assessment of applicability to ODOT.
All information gathered was documented in a technical memorandum. A detailed summary of customer relations/communications tools/software is located in Appendix D.
Survey of ODOT Customers 2.1.5
A web-based survey was used to assess customers’ needs, desires, and satisfaction with current communications with ODOT. The survey instrument was designed collaboratively between the research team and ODOT and contained approximately 30 questions. The survey collected details regarding the respondents’ most recent contacts with ODOT, respondents’ perceptions of various communication methods used by ODOT, and respondents’ demographic information.
8
For the sample of ODOT customers, ODOT pulled customer contact information from the 587 feedback form inquiries archived for the purposes of this study. Once duplicates names and physical addresses were removed, a total of 5543 usable records remained. Of the 554 records, 461 (83 percent) had a usable email address to which to send an email with a link to the web-based survey.
The survey went “live” on August 26, 2013 when 461 Ohioans were sent emails explaining the survey and requesting their participation. The email contained a web Uniform Resource Locator (URL) that took participants to the survey landing page. On September 16, 2013 a reminder email was sent suggesting that there was one week left to participate. The survey ended on September 23, 2013. A total of 144 Ohioans responded to the survey, which represents a 31 percent participation rate.
The survey instrument, analysis plan, and detailed results of the survey are found in Appendix E.
LIMITATIONS 2.2
This section describes some limitations associated with the customer inquiry data and the customer survey data that are important to keep in mind when considering the findings from both the analysis of ODOT’s customer feedback data and the customer survey. Understanding the limitations will help the reader put the findings into context and interpret them with care. These limitations are referred to again in Chapters 4 and 5 in the presentation of the findings.
Customer Inquiry Data 2.2.1
The customer inquiry data analyzed came from two sources: four months of customer inquiries via the web feedback form and one year of customer inquiries that were documented in CIMS, ODOT’s database for tracking and managing customer inquiries. From the CIMS data, the research team analyzed a sample of 420 customer inquiries. Because CIMS is used inconsistently across ODOT districts (some districts do not use CIMS at all, others use it for only some types of inquiries, and others use it only for inquiries from specific portals), the data available CIMS, and thus the sample provided for analysis, is not representative of all customer inquiries to ODOT.
In addition, the research team analyzed a sample of 337 inquiries made during a two-month period. Coincidentally, this period of time corresponded to a deadline regarding the Recreational Trails Program (RTP) in Ohio. Of the 337 inquiries, 100 of the inquiries (most of which were a standard form letter) were in regards to continuing the RTP. The large amount of inquiries related to this specific topic is not representative of a typical frequency of the inquiries received via the web feedback form; this finding should be considered when interpreting the results of the analysis of the customer feedback data.
3 Duplicate physical addresses were only removed if the email addresses were duplicated. Duplicate physical
addresses having different email address were kept, as it is possible to have two different individuals from the same HH contact ODOT.
9
Customer Survey Data 2.2.2
Due to the time and resources available for this project, a statewide survey of Ohio residents was not possible. Instead, the approach was to use a convenience sample of ODOT customers based on recent customer inquiries. A convenience sample is a type of nonprobability sample that is drawn from that part of the population which is “close to hand.” That is, a population is selected because it is readily available and convenient. The convenience sample used for the customer survey was a list of 689 customers that had contacted ODOT via the web feedback form or email within a one-year period (November 2011-October 2012) prior to this project and for which ODOT had email addresses.
Once the email list of “cleaned” (e.g., elimination of duplicate emails) the list was reduced to 461 email addresses. Of the 461 Ohioans that were invited via email to participate in the web-based survey, 144 responded to the survey (a 31 percent participation rate). Of the 144 that responded, 24 indicated that they had never contacted ODOT. As the survey was intended to illicit responses about customers’ previous experiences contacting ODOT, these 24 responses were removed, leaving the number of completed surveys at 120, which is not a large enough sample to make statistical inferences to Ohio’s population.
Analysis of the demographics of the survey respondents suggests that they may not be representative of Ohio’s population. Survey respondents tended to be older, more affluent, highly educated, and from a one- or two-person households. There were no respondents between the ages of 18 and 24, and only 17 percent of respondents were between the age of 25 and 44. In contrast, 58 percent of respondents were 55 and older, which is over twice that of the percentage statewide (26.2 percent).4 Regarding household income, according to US Census data, the median household income between 2007 and 2011 in Ohio was $48,0715; however, the median household income of survey respondents was between $75,000 and $99,999 (27 percent of respondents did not indicate their income).
Because the customer survey data was gathered from a convenience sample, the sample size is small, and the respondent demographics do not reflect those of all Ohioans, the survey results cannot be generalized to the population of Ohio. Additionally, within the survey itself, some of the questions did not illicit a significant number of responses for statistical estimates. Questions such as the one related to respondents’ rating of ODOT’s use of social media (see Table 46) had only eight responses. Although not absolute, 30 is traditionally the minimum sample size for which to conduct statistical estimates (assuming a normal distribution exists). Any statistical inferences using small sample sizes must be considered with caution.
4 U.S. Census. http://factfinder2.census.gov/faces/tableservices/jsf/pages/productview.xhtml?src=bkmk Accessed
October 29, 2013. 5 U.S. Census. http://quickfacts.census.gov/qfd/states/39000.html. Accessed October 29, 2013.
10
3 Analysis Approach
GAP ANALYSIS APPROACH 3.1
The research team followed a four-step process to complete the gap analysis. These four steps included:
1. Establish fundamental questions for gap analysis. 2. Create gap analysis template. 3. Populate template with findings from ODOT interviews and focus group, best practices,
software review, and customer survey. 4. Make comparisons and assess where gaps exist.
First, the project team established the following fundamental questions with which to assess customer communications gaps within ODOT. These questions included:
Where is ODOT currently in terms of customer communications (e.g., what are the processes and tools used, how efficient and consistent are the use of these processes/tools, what and how much customer feedback data are available, how are these data used, what is ODOT’s current level of performance from the customer’s perspective)? Answering these questions will establish ODOT’s current performance in the area of customer communications.
Where does ODOT want to be with respect to customer communications (e.g., what improvements to processes and/or tools does ODOT wish to make, what data does ODOT need/want, how and for what purposes does ODOT want to use these data)? Answering these questions will help to establish ODOT’s goals for future performance, or potential performance, in the area of customer communications.
What are the needs and desires of ODOT’s customers with respect to customer communications (e.g., what processes would improve ODOT’s performance from the customer’s perspective, what communication portals do customers want to use to communicate with ODOT, what information do customers want to receive and how)? Answering these questions will help to establish the needed/desired performance by ODOT’s customers.
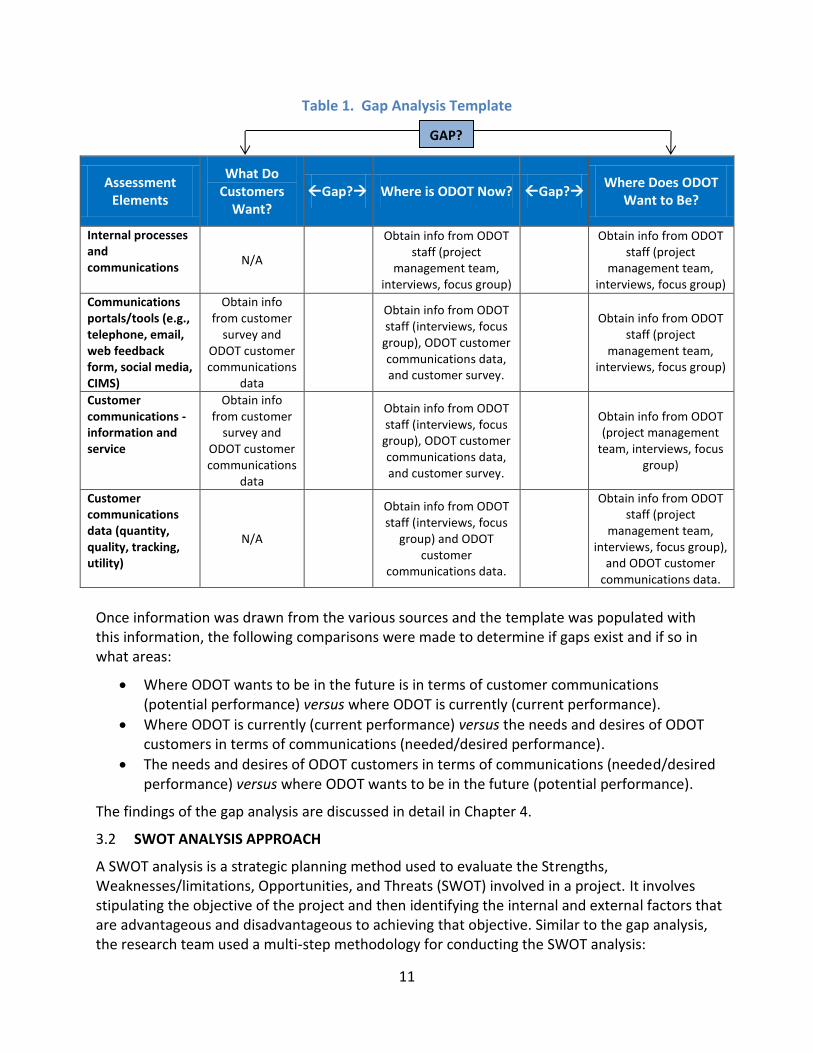
As answers to many of these fundamental questions could be found in the work completed in the information gathering/data collection tasks, the research team created a gap analysis template to indicate from which sources information/findings would be drawn to begin to answer these questions. Table 1 shows the gap analysis template. The template contains the three primary fundamental questions, as well as four different elements on which to assess each question: 1) internal processes and communications, 2) communication portals/tools, 3) customer communications – information and service, and 4) customer communications data. Each cell then indicates the source from where information/findings would be drawn to answer the questions on each of the assessment elements. Information sources included: up-front conversations with the ODOT project management team, the assessment of ODOT customer communications data (from the web feedback form and from CIMS), interviews with ODOT communications staff, the focus group with ODOT PIOs, and the customer survey.
11
Table 1. Gap Analysis Template
Assessment Elements
What Do Customers
Want? Gap? Where is ODOT Now? Gap?
Where Does ODOT Want to Be?
Internal processes and communications
N/A
Obtain info from ODOT staff (project
management team, interviews, focus group)
Obtain info from ODOT staff (project
management team, interviews, focus group)
Communications portals/tools (e.g., telephone, email, web feedback form, social media, CIMS)
Obtain info from customer
survey and ODOT customer communications
data
Obtain info from ODOT staff (interviews, focus
group), ODOT customer communications data, and customer survey.
Obtain info from ODOT
staff (project management team,
interviews, focus group)
Customer communications - information and service
Obtain info from customer
survey and ODOT customer communications
data
Obtain info from ODOT staff (interviews, focus
group), ODOT customer communications data, and customer survey.
Obtain info from ODOT (project management
team, interviews, focus group)
Customer communications data (quantity, quality, tracking, utility)
N/A
Obtain info from ODOT staff (interviews, focus
group) and ODOT customer
communications data.
Obtain info from ODOT staff (project
management team, interviews, focus group),
and ODOT customer communications data.
Once information was drawn from the various sources and the template was populated with this information, the following comparisons were made to determine if gaps exist and if so in what areas:
Where ODOT wants to be in the future is in terms of customer communications (potential performance) versus where ODOT is currently (current performance).
Where ODOT is currently (current performance) versus the needs and desires of ODOT customers in terms of communications (needed/desired performance).
The needs and desires of ODOT customers in terms of communications (needed/desired performance) versus where ODOT wants to be in the future (potential performance).
The findings of the gap analysis are discussed in detail in Chapter 4.
SWOT ANALYSIS APPROACH 3.2
A SWOT analysis is a strategic planning method used to evaluate the Strengths, Weaknesses/limitations, Opportunities, and Threats (SWOT) involved in a project. It involves stipulating the objective of the project and then identifying the internal and external factors that are advantageous and disadvantageous to achieving that objective. Similar to the gap analysis, the research team used a multi-step methodology for conducting the SWOT analysis:
GAP?
12
1. State the objective of the project. 2. Create a SWOT analysis template. 3. Populate template with findings from ODOT interviews and focus group, best practices,
software review, and customer survey. 4. Conduct analysis.
First, the objective, as stated in the project RFP, is to promote and increase open, two-way communication between ODOT and its customers through an improved customer relations process and the development and use of a CRD system.
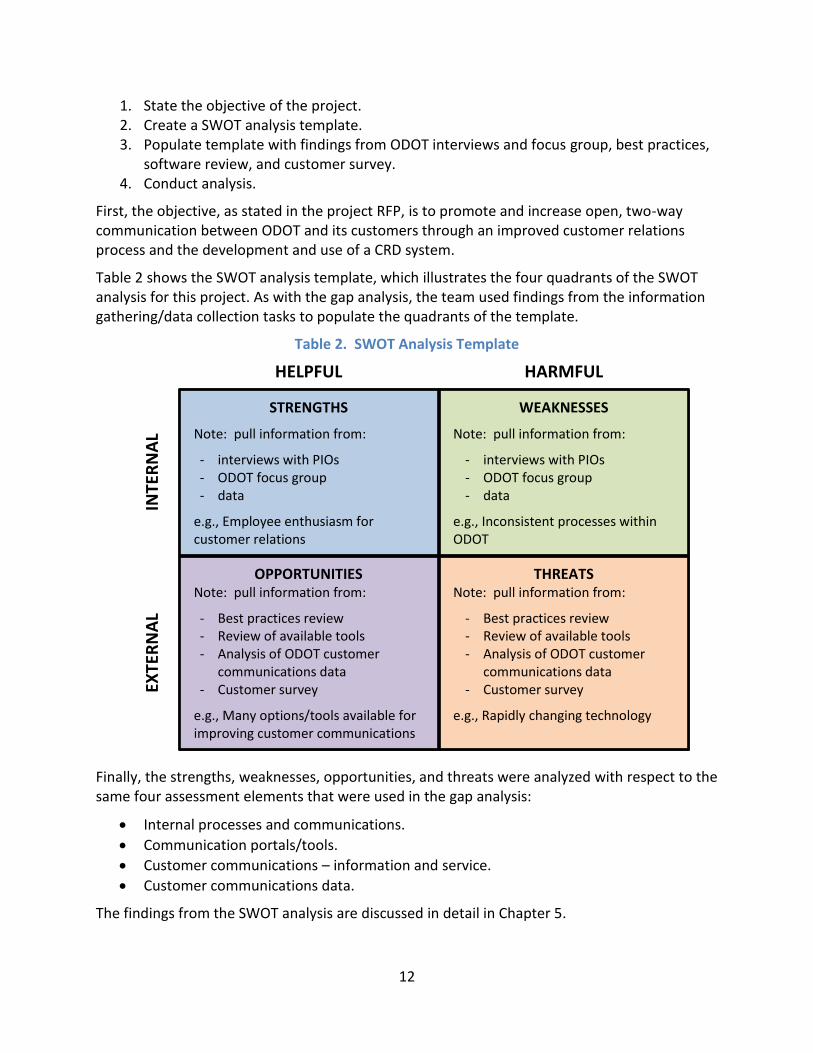
Table 2 shows the SWOT analysis template, which illustrates the four quadrants of the SWOT analysis for this project. As with the gap analysis, the team used findings from the information gathering/data collection tasks to populate the quadrants of the template.
Table 2. SWOT Analysis Template
HELPFUL HARMFUL
INTE
RN
AL
STRENGTHS
Note: pull information from:
- interviews with PIOs - ODOT focus group - data
e.g., Employee enthusiasm for customer relations
WEAKNESSES
Note: pull information from:
- interviews with PIOs - ODOT focus group - data
e.g., Inconsistent processes within ODOT
EXTE
RN
AL
OPPORTUNITIES Note: pull information from:
- Best practices review - Review of available tools - Analysis of ODOT customer
communications data - Customer survey
e.g., Many options/tools available for improving customer communications
THREATS Note: pull information from:
- Best practices review - Review of available tools - Analysis of ODOT customer
communications data - Customer survey
e.g., Rapidly changing technology
Finally, the strengths, weaknesses, opportunities, and threats were analyzed with respect to the same four assessment elements that were used in the gap analysis:
Internal processes and communications.
Communication portals/tools.
Customer communications – information and service.
Customer communications data.
The findings from the SWOT analysis are discussed in detail in Chapter 5.
13
4 Results of Gap Analysis
This chapter presents the findings from the gap analysis.
POTENTIAL PERFORMANCE VERSUS CURRENT PERFORMANCE 4.1
A comparison of ODOT’s potential performance to its current performance was made for each of the four assessment elements defined on the gap analysis template in (Table 1).
Internal ODOT Processes and Communications 4.1.1
4.1.1.1 Where does ODOT want to be?
According to the RFP for this project, ODOT would like to have an efficient, consistent, and reliable process for collecting information from its customers. PIOs need to be made aware of inquiries from the public that are fielded by other functional areas within the district or department. Ideally a system would be developed that could automatically notify the appropriate ODOT office to respond to feedback when necessary, which would help in streamlining internal communications during inquiry resolution and response.
4.1.1.2 Where is ODOT now?
Through interviews and a focus group with ODOT PIOs, the research team established that there is a considerable amount of inconsistency between districts with respect to the processes used for internal communications and the documentation and tracking of customer inquiries. Regarding inquiry documentation/tracking, most districts document/track at least some customer inquiries received through their offices; however, individual PIOs have adopted their own individual/unique systems for tracking these inquiries, which leads to interdepartmental inconsistencies.
Regarding internal communications, many district employees do not communicate effectively with the PIO and their staff, which leads to inefficiencies. Furthermore, communication within and between districts is critical from a customer service perspective, as the PIO generally has difficulty in determining if public inquiries are being addressed by the district or person to which they are assigned. It is difficult and time consuming for PIOs and their staff to have to continually follow up with staff in other functional areas to obtain status updates on inquiries.
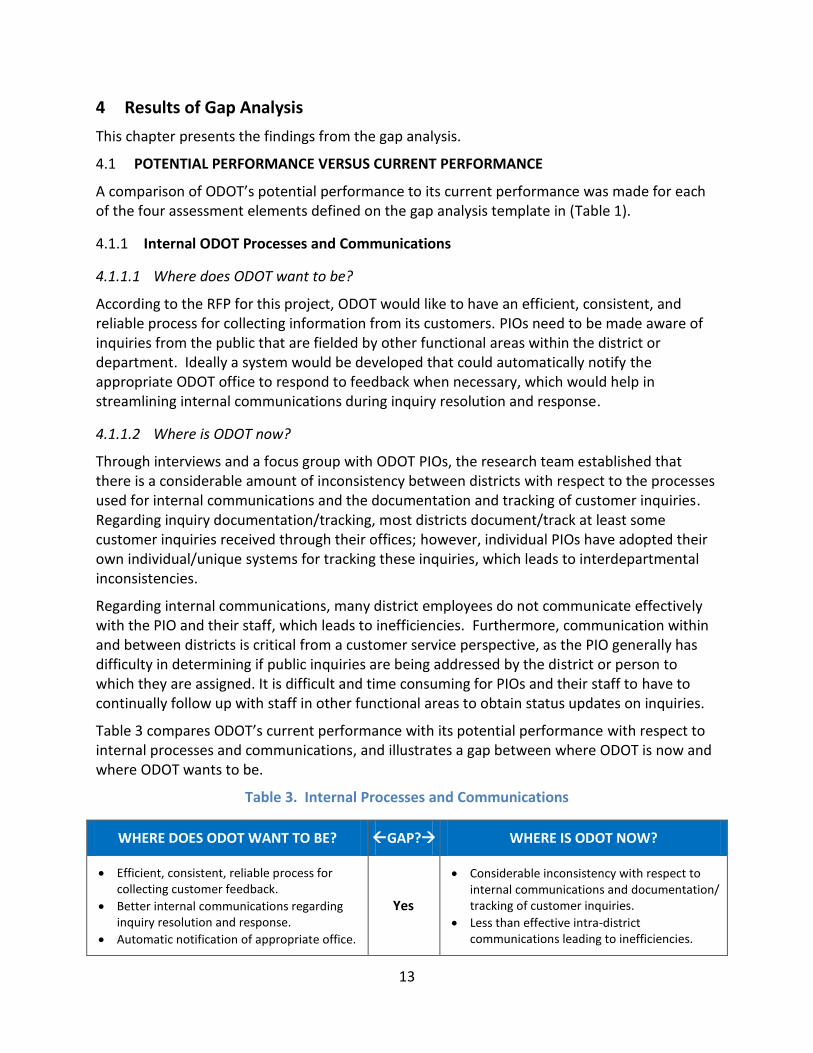
Table 3 compares ODOT’s current performance with its potential performance with respect to internal processes and communications, and illustrates a gap between where ODOT is now and where ODOT wants to be.
Table 3. Internal Processes and Communications
WHERE DOES ODOT WANT TO BE? GAP? WHERE IS ODOT NOW?
Efficient, consistent, reliable process for collecting customer feedback.
Better internal communications regarding inquiry resolution and response.
Automatic notification of appropriate office.
Yes
Considerable inconsistency with respect to internal communications and documentation/ tracking of customer inquiries.
Less than effective intra-district communications leading to inefficiencies.
14
Communications Portals/Tools 4.1.2
4.1.2.1 Where does ODOT want to be?
According to the RFP for this project, ODOT would like a CRD system that collects and maintains all feedback from all communication portals. This system should comply with ODOT’s Default Web Application Architecture and should be expandable to incorporate information from new communication portals in the future.
PIOs would like to have access to more data. None of the districts acknowledged CIMS as an efficient system for documenting and tracking the majority of telephone calls received; as such, PIOs would like an efficient system that would allow them to document the numerous telephone calls received daily, including those received via cell phone when they are out of the office. PIOs would also like access to more communications tools. For example, PIOs would like a tool/application that would allow information to be simultaneously transmitted on the various communication channels. While some PIOs have explored tools such as live chats, Nixel, and Hootsuite, they have not determined how these tools/applications would be incorporated into their current processes. Training for staff outside of the PIO operations (e.g., county time keepers) will be necessary for any new applications/tools to be effective.
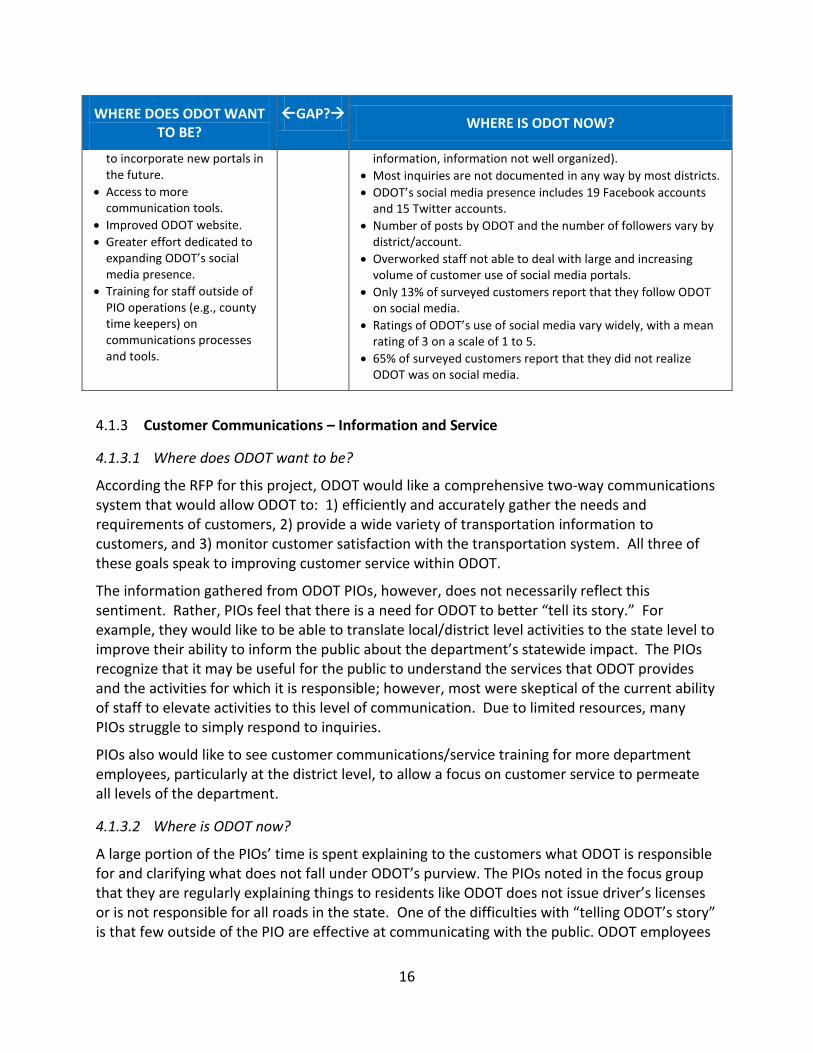
PIOs would also like to see an improved ODOT website that helps to better “tell ODOT’s story,” as well as an expanded social media presence of ODOT’s districts.
4.1.2.2 Where is ODOT now?
PIOs report that the telephone is a very useful tool for ODOT to have a personal connection to its customers. Based on data provided by ODOT to the research team, the telephone appears to be the method of choice by many of ODOT’s customers. Seventy-two percent of the inquiries documented in CIMS over a 12-year period (2000-2012) were made via telephone; however, this number could be higher considering that some districts do not use the CIMS system at all. Districts report a varying number of calls received per day. While some of these calls are documented by some districts in various ways (e.g., CIMS, spreadsheet, email exchanges), most of these telephone inquiries are not documented in any way.
Email appears to be on the rise as a method of contacting ODOT. Only 15 percent of the inquiries documented in CIMS between 2000 and 2012 were made via email; however, in 2012, almost 30 percent of inquiries were by email. Furthermore, 63 percent of survey respondents reported contacting ODOT via email. As with telephone inquiries, email inquiries are documented in various ways, but most are not documented.
PIOs view the web feedback form as a user-friendly tool that is easy to use for both customers and ODOT – easy to use for simple questions and the turnaround time to respond is often immediate. This system is most useful when the PIO can handle the inquiry personally. However, not all department employees are familiar with the feedback form, which can create confusion among employees when a request is received. Furthermore, an analysis of the format of the feedback form shows that the form’s current design (e.g., limited categories from which customers can select) may limit the quality of the feedback received (or at least the quality of
15
the information for routing the feedback). An analysis of inquiries made via the web feedback form showed that many customers selected an inappropriate subject.
Regarding social media, ODOT has 19 Facebook accounts and 15 Twitter accounts representing ODOT’s main office, districts, and various special projects. The number of posts by ODOT and the number of followers vary by district/account, and overworked staff is not able to deal with large volumes of social media data and increasing customer use of social media portals. From the survey, 53 percent of customers report using social media, but only 13 percent (8 people) reported that they follow ODOT on social media. Sixty-five percent of customers reported they did not realize ODOT was on social media. Ratings of ODOT’s use of social media vary widely, with an average rating of 3 on a scale of 1 to 5.
PIOs do not feel that the department's existing web presence is effective (e.g., too much information, information not organized in a manner that allows quick and easy use), reporting that staff even has problems finding information on the website.
Through the interviews and focus group with PIOs, the research team established that there appears to be a disconnect between ODOT central administration and the district PIOs regarding the use and availability of tools for public communication/feedback and for the tracking of customer service data. CIMS is probably the best example of this disconnect. CIMS, while meant to be a tool to document and track customer inquiries, is not well or consistently utilized for various reasons. Inquiries from the various portals must be manually entered into the database, and the time-consuming nature of CIMS limits entering phone calls as they are received, as many can be handled quickly. As a result, CIMS data typically consists of the more complex inquiries that require action from ODOT or follow-up/tracking. Overall, there is a lack of support for CIMS within ODOT; there is a lack of staffing to train new staff to use CIMS and/or to fully utilize CIMS, therefore, not everyone who takes a call uses CIMS (e.g., district engineers often get contacted directly by citizens). New employees are even warned to "stay away" from the system. Furthermore, the lack of technical support for CIMS also limits its usefulness.
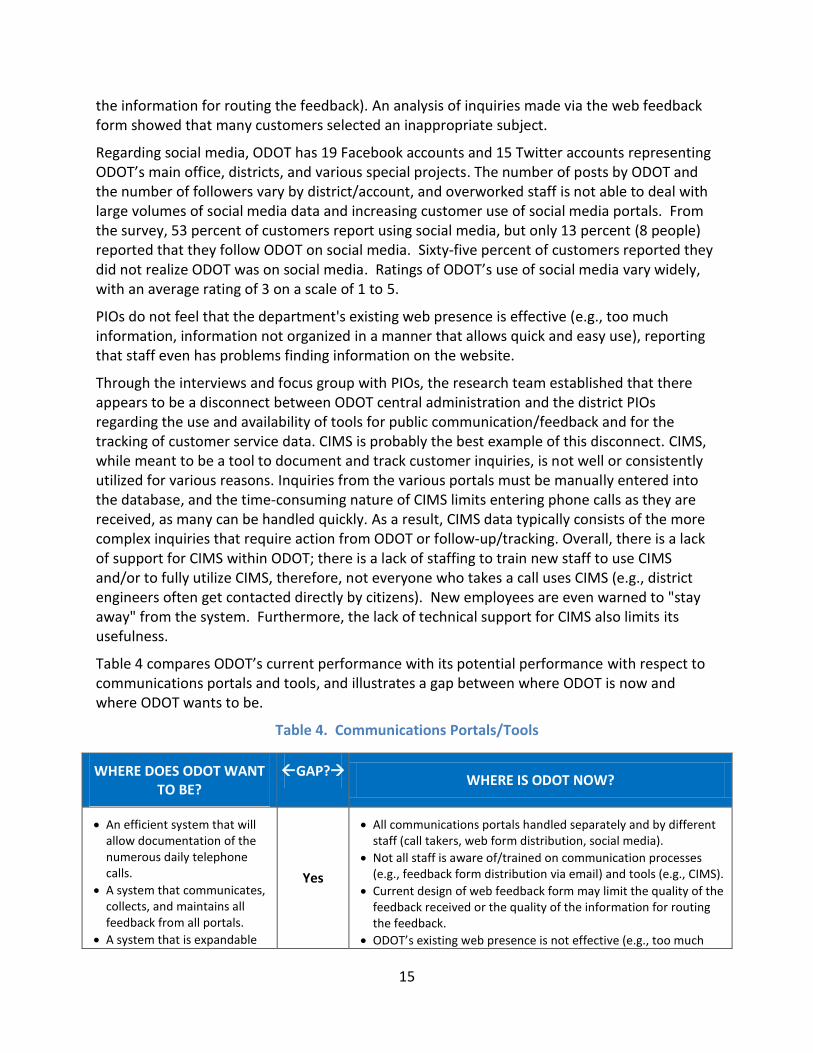
Table 4 compares ODOT’s current performance with its potential performance with respect to communications portals and tools, and illustrates a gap between where ODOT is now and where ODOT wants to be.
Table 4. Communications Portals/Tools
WHERE DOES ODOT WANT TO BE?
GAP? WHERE IS ODOT NOW?
An efficient system that will allow documentation of the numerous daily telephone calls.
A system that communicates, collects, and maintains all feedback from all portals.
A system that is expandable
Yes
All communications portals handled separately and by different staff (call takers, web form distribution, social media).
Not all staff is aware of/trained on communication processes (e.g., feedback form distribution via email) and tools (e.g., CIMS).
Current design of web feedback form may limit the quality of the feedback received or the quality of the information for routing the feedback.
ODOT’s existing web presence is not effective (e.g., too much
16
WHERE DOES ODOT WANT TO BE?
GAP? WHERE IS ODOT NOW?
to incorporate new portals in the future.
Access to more communication tools.
Improved ODOT website.
Greater effort dedicated to expanding ODOT’s social media presence.
Training for staff outside of PIO operations (e.g., county time keepers) on communications processes and tools.
information, information not well organized).
Most inquiries are not documented in any way by most districts.
ODOT’s social media presence includes 19 Facebook accounts and 15 Twitter accounts.
Number of posts by ODOT and the number of followers vary by district/account.
Overworked staff not able to deal with large and increasing volume of customer use of social media portals.
Only 13% of surveyed customers report that they follow ODOT on social media.
Ratings of ODOT’s use of social media vary widely, with a mean rating of 3 on a scale of 1 to 5.
65% of surveyed customers report that they did not realize ODOT was on social media.
Customer Communications – Information and Service 4.1.3
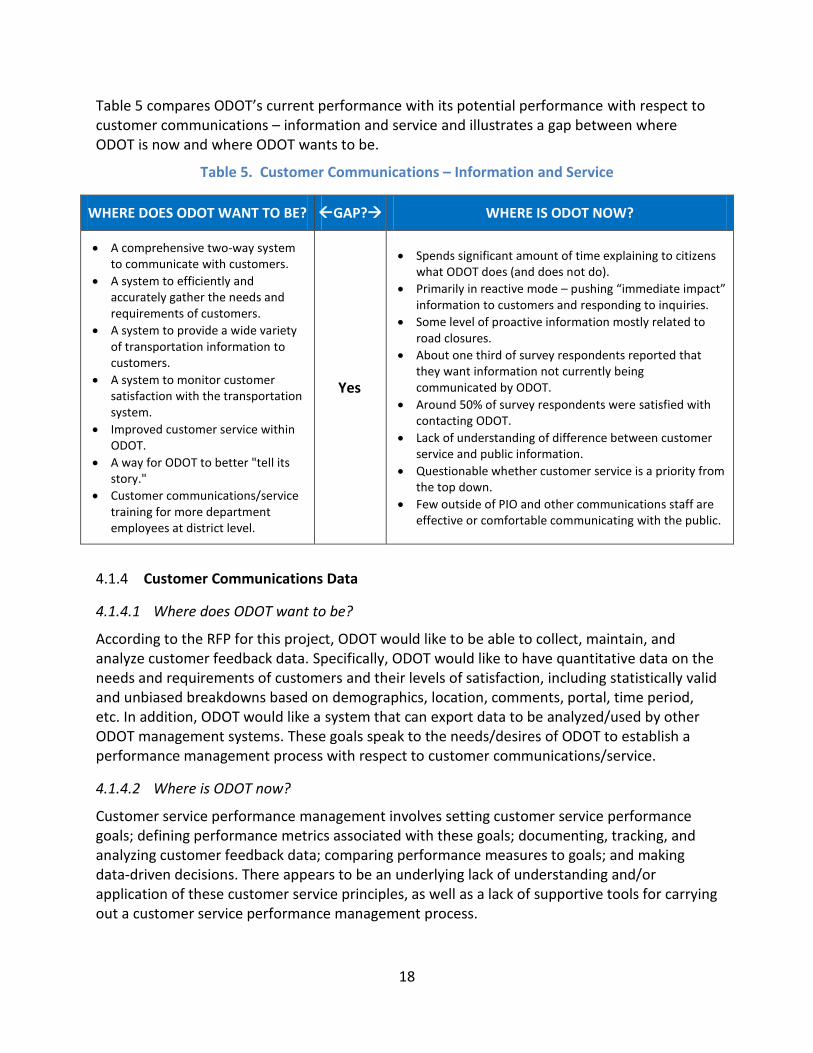
4.1.3.1 Where does ODOT want to be?
According the RFP for this project, ODOT would like a comprehensive two-way communications system that would allow ODOT to: 1) efficiently and accurately gather the needs and requirements of customers, 2) provide a wide variety of transportation information to customers, and 3) monitor customer satisfaction with the transportation system. All three of these goals speak to improving customer service within ODOT.
The information gathered from ODOT PIOs, however, does not necessarily reflect this sentiment. Rather, PIOs feel that there is a need for ODOT to better “tell its story.” For example, they would like to be able to translate local/district level activities to the state level to improve their ability to inform the public about the department’s statewide impact. The PIOs recognize that it may be useful for the public to understand the services that ODOT provides and the activities for which it is responsible; however, most were skeptical of the current ability of staff to elevate activities to this level of communication. Due to limited resources, many PIOs struggle to simply respond to inquiries.
PIOs also would like to see customer communications/service training for more department employees, particularly at the district level, to allow a focus on customer service to permeate all levels of the department.
4.1.3.2 Where is ODOT now?
A large portion of the PIOs’ time is spent explaining to the customers what ODOT is responsible for and clarifying what does not fall under ODOT’s purview. The PIOs noted in the focus group that they are regularly explaining things to residents like ODOT does not issue driver’s licenses or is not responsible for all roads in the state. One of the difficulties with “telling ODOT’s story” is that few outside of the PIO are effective at communicating with the public. ODOT employees
17
may interact with the public at any level of the organization, but not all are trained or comfortable in dealing with the public.
With respect to providing information to the public, PIOs are primarily concerned with pushing information related to traffic, weather, and road closures, as well as responding to inquiries (mostly media), all of which is information that could be considered to be of immediate impact to customers. PIOs operate primarily in reactive mode – mostly due to a shortage of resources – responding to inquiries as they come in and “putting out fires,” which leaves little time to look beyond what they are currently providing. This impacts the stated ODOT goal of achieving two-way communication. Some districts do undertake at least some proactive information provision, which primarily relates to pushing out road closure information. From the public survey, 57 percent of respondents reported that there are no other additional types of information that ODOT needs to communicate that it is not already; however, 34 percent of respondents feel that ODOT should be communicating certain types of information that it currently does not.
Within the PIO functions, there appears to be a lack of understanding that “customer service” is different than “public information.” A primary role of the PIOs is to provide public information and to provide a certain level of service in doing so. Beyond that, however, customer service involves pushing higher-level information, setting customer service goals, and collecting data in support of meeting those goals. The PIOs are supportive of improving customer service. They recognize that as a highly visible state agency, it is important for the public to know the value of the agency; however, most indicated this is not seen as a priority from ODOT administration. The PIOs indicated that there are no clear directives from the central administration regarding the quality of how issues identified by the public are to be resolved. They feel that if ODOT is to improve customer service levels that the central administration and district leadership must define metrics for the assessment of customer service quality and the performance goals to indicate success.
With respect to inquiries, customers mostly contact the districts directly (as opposed to central administration). From the survey, 56 percent of respondents reported that it was “somewhat easy” or “easy” to determine how to contact ODOT, while 12 percent reported that it was “not at all easy.” This distribution is important, as ease of contacting ODOT is positively correlated with how satisfied respondents are with ODOT’s response to their inquiry. Regarding their experience with ODOT, 74 percent of respondents reported that the initial contact with ODOT was courteous and helpful, 49 percent were “somewhat satisfied” or “very satisfied” with ODOT’s response to their inquiry, and 57 percent reported their overall experience dealing with ODOT as “somewhat pleasant” or “pleasant.” On the other hand, 27 percent of customers were “somewhat dissatisfied” or “dissatisfied” with ODOT’s response to their inquiry, and 20 percent reported their overall experience dealing with ODOT as “somewhat unpleasant” or “not at all pleasant.” Examples of dissatisfied customers include:
“I received no response in any way, shape, or form, from my email inquiry.”
“I wrote a letter about bike paths on Route 250 and no one ever got back to me with what they might do.”
18
Table 5 compares ODOT’s current performance with its potential performance with respect to customer communications – information and service and illustrates a gap between where ODOT is now and where ODOT wants to be.
Table 5. Customer Communications – Information and Service
WHERE DOES ODOT WANT TO BE? GAP? WHERE IS ODOT NOW?
A comprehensive two-way system to communicate with customers.
A system to efficiently and accurately gather the needs and requirements of customers.
A system to provide a wide variety of transportation information to customers.
A system to monitor customer satisfaction with the transportation system.
Improved customer service within ODOT.
A way for ODOT to better "tell its story."
Customer communications/service training for more department employees at district level.
Yes
Spends significant amount of time explaining to citizens what ODOT does (and does not do).
Primarily in reactive mode – pushing “immediate impact” information to customers and responding to inquiries.
Some level of proactive information mostly related to road closures.
About one third of survey respondents reported that they want information not currently being communicated by ODOT.
Around 50% of survey respondents were satisfied with contacting ODOT.
Lack of understanding of difference between customer service and public information.
Questionable whether customer service is a priority from the top down.
Few outside of PIO and other communications staff are effective or comfortable communicating with the public.
Customer Communications Data 4.1.4
4.1.4.1 Where does ODOT want to be?
According to the RFP for this project, ODOT would like to be able to collect, maintain, and analyze customer feedback data. Specifically, ODOT would like to have quantitative data on the needs and requirements of customers and their levels of satisfaction, including statistically valid and unbiased breakdowns based on demographics, location, comments, portal, time period, etc. In addition, ODOT would like a system that can export data to be analyzed/used by other ODOT management systems. These goals speak to the needs/desires of ODOT to establish a performance management process with respect to customer communications/service.
4.1.4.2 Where is ODOT now?
Customer service performance management involves setting customer service performance goals; defining performance metrics associated with these goals; documenting, tracking, and analyzing customer feedback data; comparing performance measures to goals; and making data-driven decisions. There appears to be an underlying lack of understanding and/or application of these customer service principles, as well as a lack of supportive tools for carrying out a customer service performance management process.
19
With respect to documenting and tracking customer inquiries, other than CIMS, there is no consistent, statewide approach to documenting customer inquiries. Due to the issues with CIMS, most districts have developed or adopted their own “strategies” for recording and tracking inquiries (e.g., SharePoint forms, email archiving, spreadsheets), which leads to inconsistencies, as well as an inability to pool data for performance measurement or data-driven decision making.
Information/data from telephone inquiries are documented in different ways by the various districts, but generally are not documented at all, resulting in a loss of a large amount of customer feedback data. Information/data from inquiries made via the web feedback form are in free text and get distributed internally to the appropriate personnel as needed; however, this information/data are not archived (i.e., no database to store inquiries) unless ODOT specifically makes an effort to save them. Information/data from the web feedback form are not currently being used or analyzed for performance management or data-driven decision making. Likewise, ODOT is not currently analyzing or making use of customer feedback via social media other than responding to individual posts and comments when necessary.
With respect to performance metrics, ODOT has not established metrics or a consistent approach for measuring the performance of its communications with or response to customers (at least not that PIOs are aware of); rather, tracking activities are undertaken out of simple necessity, as the sheer volume of requests received requires some form of record-keeping but only in some districts. At a higher level, it is unclear whether ODOT has established metrics or a consistent approach for measuring customer satisfaction with the transportation system. Moreover, most PIOs did not support measuring for the sake of measuring. There must be a clear case made to the PIOs of how measuring customer inquiries will affect decision-making. At this point, disparate information portals and divergent record-keeping practices among districts and central administration preclude the ability to even develop consistent metrics. Furthermore, the lack of consistent, statewide documentation of feedback would make gathering and processing information for the purposes of analysis inefficient and ineffective. When discussing the idea of performance metrics with PIOs, they perceive difficulty in even finding ways to determine departmental success, as the "goods" and "services" provided by the DOT are abstract and difficult to quantify, and service quality is thus more difficult to determine. Perhaps more concerning is that PIOs do not see the full benefits of developing performance metrics and tracking them. They do not believe the metrics can be viewed as a measure of performance (just workload), or perhaps they do not want to potentially be held accountable for something this is not their fault or is beyond their control. There is a need to look beyond the use of metrics for tracking individual employee/office performance and understanding the need to demonstrate transparency.
Table 6 compares ODOT’s current performance with its potential performance with respect to customer communications data and illustrates a gap between where ODOT is now and where ODOT wants to be.
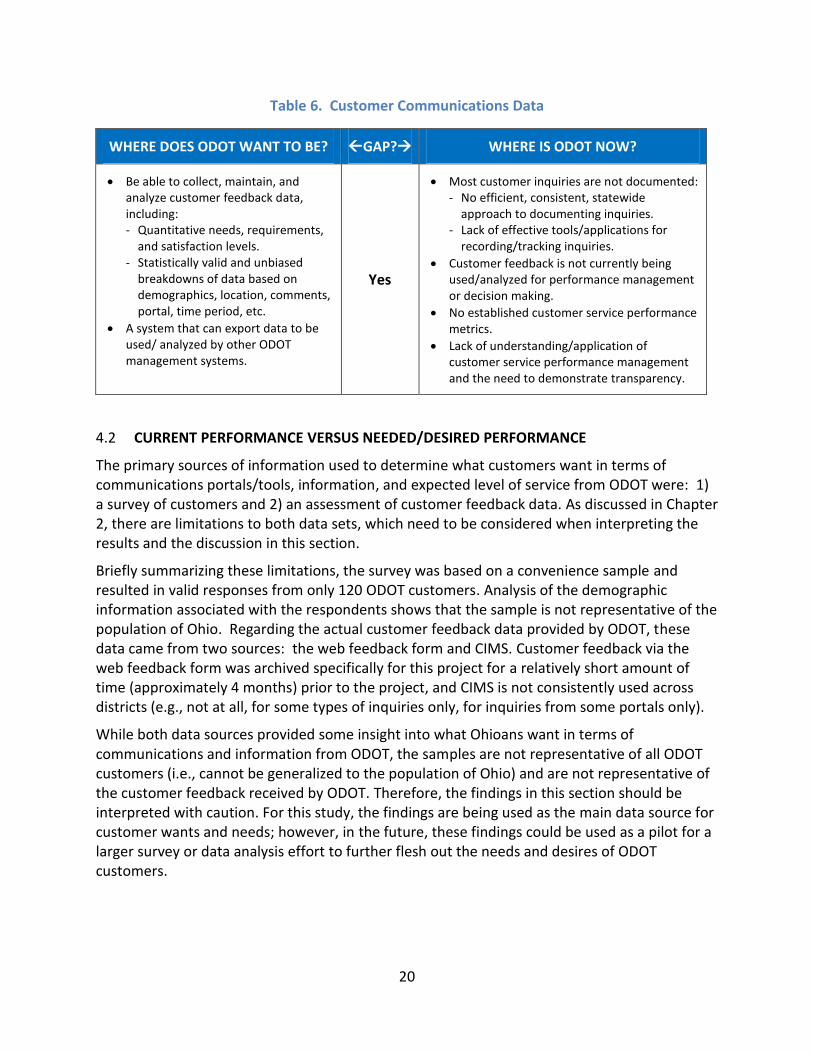
20
Table 6. Customer Communications Data
WHERE DOES ODOT WANT TO BE? GAP? WHERE IS ODOT NOW?
Be able to collect, maintain, and analyze customer feedback data, including: - Quantitative needs, requirements,
and satisfaction levels. - Statistically valid and unbiased
breakdowns of data based on demographics, location, comments, portal, time period, etc.
A system that can export data to be used/ analyzed by other ODOT management systems.
Yes
Most customer inquiries are not documented: - No efficient, consistent, statewide
approach to documenting inquiries. - Lack of effective tools/applications for
recording/tracking inquiries.
Customer feedback is not currently being used/analyzed for performance management or decision making.
No established customer service performance metrics.
Lack of understanding/application of customer service performance management and the need to demonstrate transparency.
CURRENT PERFORMANCE VERSUS NEEDED/DESIRED PERFORMANCE 4.2
The primary sources of information used to determine what customers want in terms of communications portals/tools, information, and expected level of service from ODOT were: 1) a survey of customers and 2) an assessment of customer feedback data. As discussed in Chapter 2, there are limitations to both data sets, which need to be considered when interpreting the results and the discussion in this section.
Briefly summarizing these limitations, the survey was based on a convenience sample and resulted in valid responses from only 120 ODOT customers. Analysis of the demographic information associated with the respondents shows that the sample is not representative of the population of Ohio. Regarding the actual customer feedback data provided by ODOT, these data came from two sources: the web feedback form and CIMS. Customer feedback via the web feedback form was archived specifically for this project for a relatively short amount of time (approximately 4 months) prior to the project, and CIMS is not consistently used across districts (e.g., not at all, for some types of inquiries only, for inquiries from some portals only).
While both data sources provided some insight into what Ohioans want in terms of communications and information from ODOT, the samples are not representative of all ODOT customers (i.e., cannot be generalized to the population of Ohio) and are not representative of the customer feedback received by ODOT. Therefore, the findings in this section should be interpreted with caution. For this study, the findings are being used as the main data source for customer wants and needs; however, in the future, these findings could be used as a pilot for a larger survey or data analysis effort to further flesh out the needs and desires of ODOT customers.
21
Communications Portals/Tools, Information, and Service – What do Customers Want? 4.2.1
As was previously discussed in Section 4.1.1.2, the telephone and email appear to be the preferred methods for contacting ODOT. Information from PIOs and CIMS data suggest the telephone is used more frequently than email, but that email use is on the rise. Sixty-three percent of survey respondents indicated that they contacted ODOT via email, and only 15 percent reported using the telephone. Thirteen percent of survey respondents reported using the web feedback form. Specific comments/requests from the survey regarding contacting ODOT include:
“The feedback form frequently does not work at all.”
“(I would like) the ability in all districts to have a uniform way to report road damage with a reply entry so the person reporting it can get a reply to know if the work has been schedule, completed, or not accepted.”
An analysis of customer inquiries input into CIMS and/or made via the web feedback form showed that customers communicate a wide variety of topics to ODOT. Most of the inquiries were either complaints and/or reports of problems/issues. These problems are not necessarily ones that ODOT can be proactive in addressing, but customers do want a way to make these complaints/reports and to receive status updates on their resolution. A smaller portion of the inquiries were actual questions or requests for information such as the start/completion dates of construction/maintenance projects or road/ramp closure and information on detours.
When asked how they would like to receive various types of information from ODOT, in every category of information, a plurality of survey respondents (30-44 percent, depending on the type of information) selected “email.” The second most popular portal overall was the ODOT website; however, less than 20 percent of respondents want immediate impact information (e.g., construction/maintenance/closures, travel times, weather-related) via the website, whereas about 30 percent do want pedestrian/bicycle and rest area information via ODOT’s website. Electronic highway signs narrowly beat out social media for third most preferred choice for receiving information from ODOT (electronic highway signs was preferred by about 16 percent of respondents on average, and social media was preferred by about 13 percent of respondents on average). Specific comments/requests from the survey regarding receiving information from ODOT include:
“Major maintenance and road closure information is very hard to locate on the ODOT web site - make it easy to find.”
“(I would like to receive) emails/texts when routes that are part of my commute are affected. A web portal could offer a way to accomplish this.”
“ODOT should also do in-depth surveys to learn how its projects will affect people. There's more to learning that than just holding some meeting (which probably do not represent more than 1 percent of residents).”
“I searched the ODOT web site in vain trying to find the details of the Route 95 project in Marion. It would have been nice to see some sort of blueprint showing what the finished product will look like.”
22
Fifty-three percent of survey respondents reported that they use social media, and of these only 13 percent reported that they follow ODOT on social medial; 65 percent of the social media users did not even realize ODOT was on social media. Among the social media users, Facebook is by far the most widely used application. A correlation analysis of survey responses shows that social media users need more information than those that do not use social media. One survey respondent suggested that ODOT “tweet road conditions, shut downs, and weather related information.” Twenty-seven percent of social media users reported they are not interested in following ODOT on social media.
Correlation analyses to survey responses suggest that to increase customer satisfaction, emphasis should be placed on the following:
Making it easy for customers to identify who within ODOT they should contact.
Ensuring that the initial individual responding to the inquiry is helpful and courteous.
Asking what method the respondent prefers for follow up communication.
Minimizing the amount of time between the customer’s initial inquiry and ODOT’s response.
With respect to ODOT communicating information to its customers, 61 percent of survey respondents say there is a need for ODOT to initiate communication with its customers, and 34 percent of respondents feel that ODOT should be communicating certain types of information that it currently does not. Survey respondents report that they would like to have the following information from ODOT:
“More information on maintenance projects (e.g., length and end dates of projects; better advance notice of up-coming projects and detours).”
“Engage with the public directly and early in project planning, tell the truth, be objective, provide the information requested, listen to the community and respond to their needs.”
“The only information I get is from highway signs. If I need to detour, especially on I-75, I would like to know in advance.”
“Commercials on TV, through the local newscasts, or flyers regarding road closures and construction impacts. It doesn't have to be fancy.”
“Opportunity to generate personalized travel information.”
“Get the word out that ODOT is on Facebook/social media but, believe an email is more appropriate communication. Updates on Facebook are missed if not viewed frequently.”
Regarding the desired frequency of information from ODOT, respondents seem to either want information on a regular or somewhat regular basis or not at all, and about 10 percent do not know if/how often they want information. Respondents generally want more frequent updates on the issues that personally affect them. Specifically:
50 percent of respondents would like weather-related information from ODOT multiple times per day or daily; however, 26 percent reported they do not want weather-related information from ODOT at all.
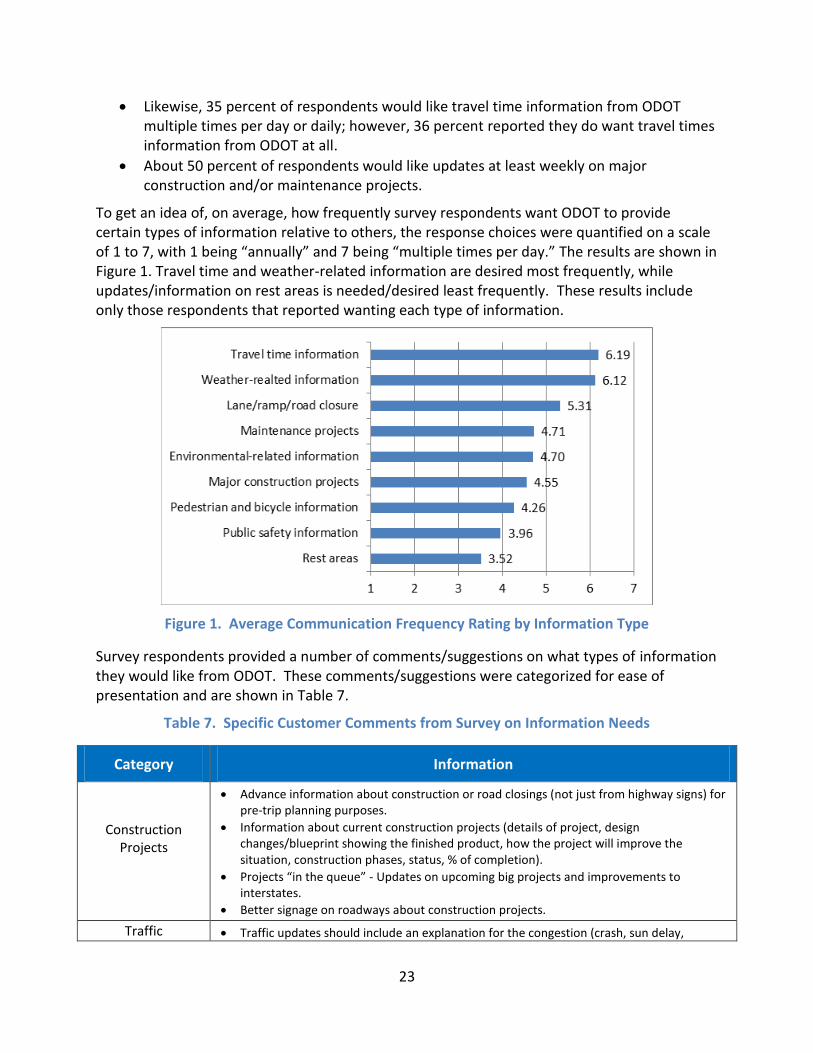
23
Likewise, 35 percent of respondents would like travel time information from ODOT multiple times per day or daily; however, 36 percent reported they do want travel times information from ODOT at all.
About 50 percent of respondents would like updates at least weekly on major construction and/or maintenance projects.
To get an idea of, on average, how frequently survey respondents want ODOT to provide certain types of information relative to others, the response choices were quantified on a scale of 1 to 7, with 1 being “annually” and 7 being “multiple times per day.” The results are shown in Figure 1. Travel time and weather-related information are desired most frequently, while updates/information on rest areas is needed/desired least frequently. These results include only those respondents that reported wanting each type of information.
Figure 1. Average Communication Frequency Rating by Information Type
Survey respondents provided a number of comments/suggestions on what types of information they would like from ODOT. These comments/suggestions were categorized for ease of presentation and are shown in Table 7.
Table 7. Specific Customer Comments from Survey on Information Needs
Category Information
Construction Projects
Advance information about construction or road closings (not just from highway signs) for pre-trip planning purposes.
Information about current construction projects (details of project, design changes/blueprint showing the finished product, how the project will improve the situation, construction phases, status, % of completion).
Projects “in the queue” - Updates on upcoming big projects and improvements to interstates.
Better signage on roadways about construction projects.
Traffic Traffic updates should include an explanation for the congestion (crash, sun delay,
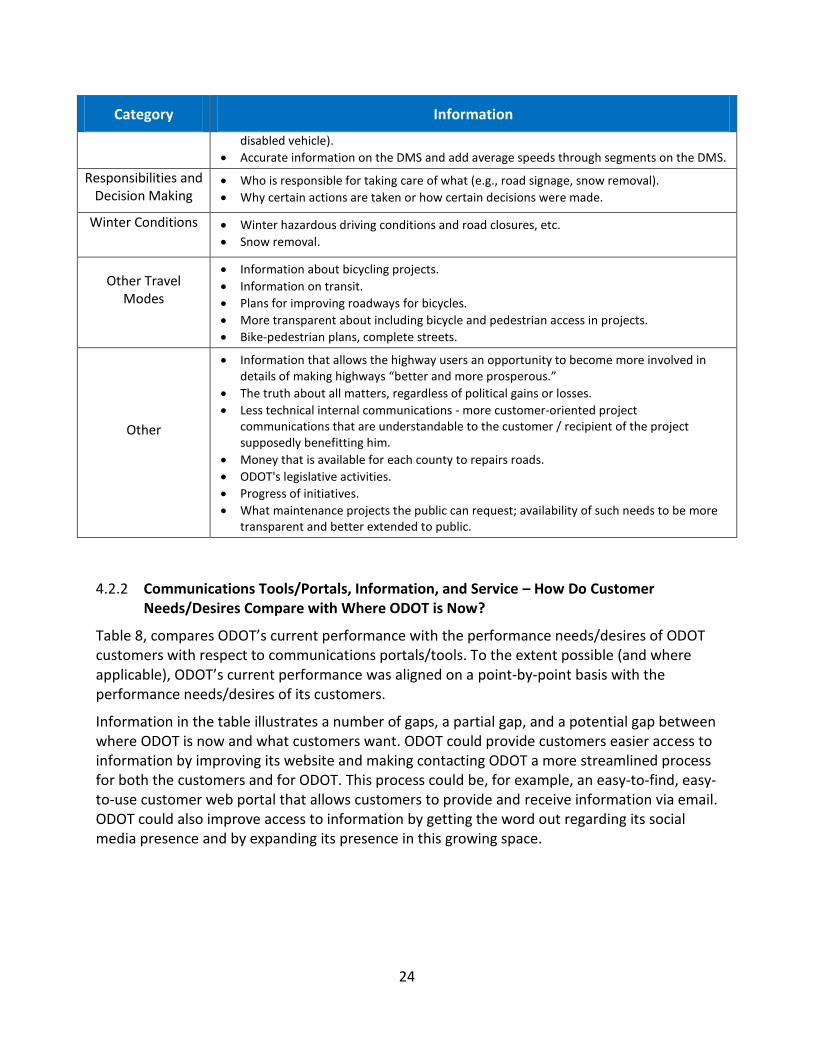
24
Category Information
disabled vehicle).
Accurate information on the DMS and add average speeds through segments on the DMS.
Responsibilities and Decision Making
Who is responsible for taking care of what (e.g., road signage, snow removal).
Why certain actions are taken or how certain decisions were made.
Winter Conditions
Winter hazardous driving conditions and road closures, etc.
Snow removal.
Other Travel Modes
Information about bicycling projects.
Information on transit.
Plans for improving roadways for bicycles.
More transparent about including bicycle and pedestrian access in projects.
Bike-pedestrian plans, complete streets.
Other
Information that allows the highway users an opportunity to become more involved in details of making highways “better and more prosperous.”
The truth about all matters, regardless of political gains or losses.
Less technical internal communications - more customer-oriented project communications that are understandable to the customer / recipient of the project supposedly benefitting him.
Money that is available for each county to repairs roads.
ODOT's legislative activities.
Progress of initiatives.
What maintenance projects the public can request; availability of such needs to be more transparent and better extended to public.
Communications Tools/Portals, Information, and Service – How Do Customer 4.2.2Needs/Desires Compare with Where ODOT is Now?
Table 8, compares ODOT’s current performance with the performance needs/desires of ODOT customers with respect to communications portals/tools. To the extent possible (and where applicable), ODOT’s current performance was aligned on a point-by-point basis with the performance needs/desires of its customers.
Information in the table illustrates a number of gaps, a partial gap, and a potential gap between where ODOT is now and what customers want. ODOT could provide customers easier access to information by improving its website and making contacting ODOT a more streamlined process for both the customers and for ODOT. This process could be, for example, an easy-to-find, easy-to-use customer web portal that allows customers to provide and receive information via email. ODOT could also improve access to information by getting the word out regarding its social media presence and by expanding its presence in this growing space.
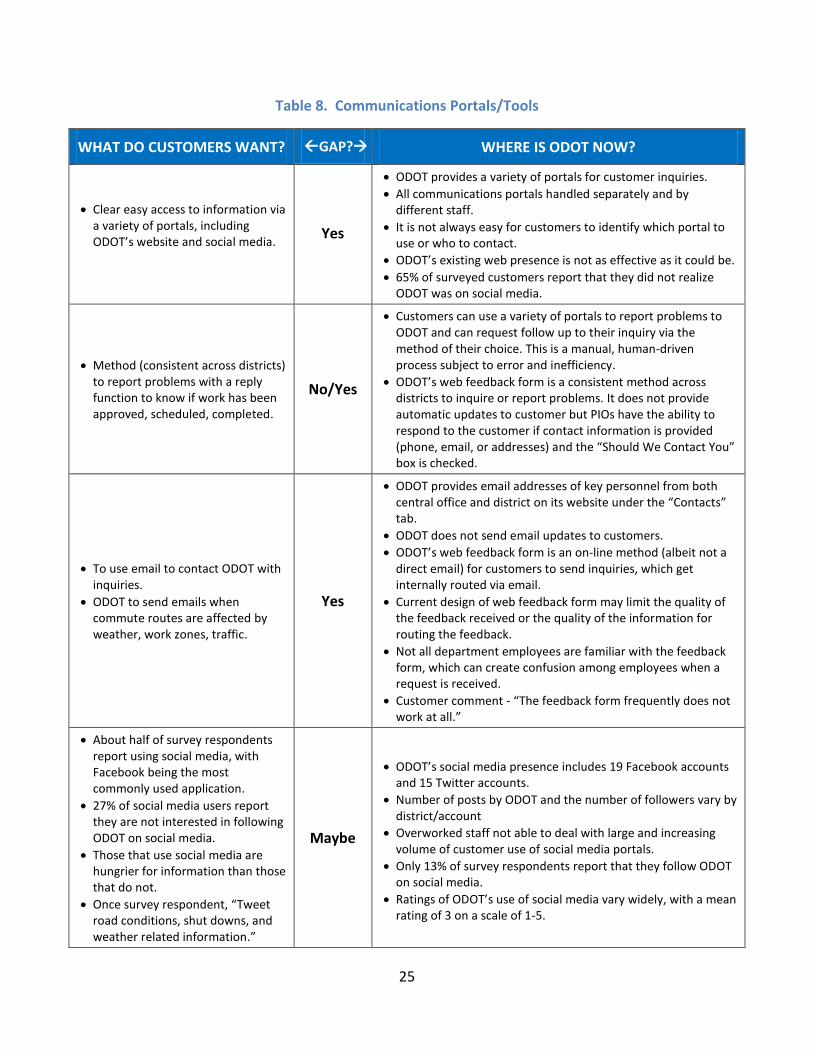
25
Table 8. Communications Portals/Tools
WHAT DO CUSTOMERS WANT? GAP? WHERE IS ODOT NOW?
Clear easy access to information via a variety of portals, including ODOT’s website and social media.
Yes
ODOT provides a variety of portals for customer inquiries.
All communications portals handled separately and by different staff.
It is not always easy for customers to identify which portal to use or who to contact.
ODOT’s existing web presence is not as effective as it could be.
65% of surveyed customers report that they did not realize ODOT was on social media.
Method (consistent across districts) to report problems with a reply function to know if work has been approved, scheduled, completed.
No/Yes
Customers can use a variety of portals to report problems to ODOT and can request follow up to their inquiry via the method of their choice. This is a manual, human-driven process subject to error and inefficiency.
ODOT’s web feedback form is a consistent method across districts to inquire or report problems. It does not provide automatic updates to customer but PIOs have the ability to respond to the customer if contact information is provided (phone, email, or addresses) and the “Should We Contact You” box is checked.
To use email to contact ODOT with inquiries.
ODOT to send emails when commute routes are affected by weather, work zones, traffic.
Yes
ODOT provides email addresses of key personnel from both central office and district on its website under the “Contacts” tab.
ODOT does not send email updates to customers.
ODOT’s web feedback form is an on-line method (albeit not a direct email) for customers to send inquiries, which get internally routed via email.
Current design of web feedback form may limit the quality of the feedback received or the quality of the information for routing the feedback.
Not all department employees are familiar with the feedback form, which can create confusion among employees when a request is received.
Customer comment - “The feedback form frequently does not work at all.”
About half of survey respondents report using social media, with Facebook being the most commonly used application.
27% of social media users report they are not interested in following ODOT on social media.
Those that use social media are hungrier for information than those that do not.
Once survey respondent, “Tweet road conditions, shut downs, and weather related information.”
Maybe
ODOT’s social media presence includes 19 Facebook accounts and 15 Twitter accounts.
Number of posts by ODOT and the number of followers vary by district/account
Overworked staff not able to deal with large and increasing volume of customer use of social media portals.
Only 13% of survey respondents report that they follow ODOT on social media.
Ratings of ODOT’s use of social media vary widely, with a mean rating of 3 on a scale of 1-5.
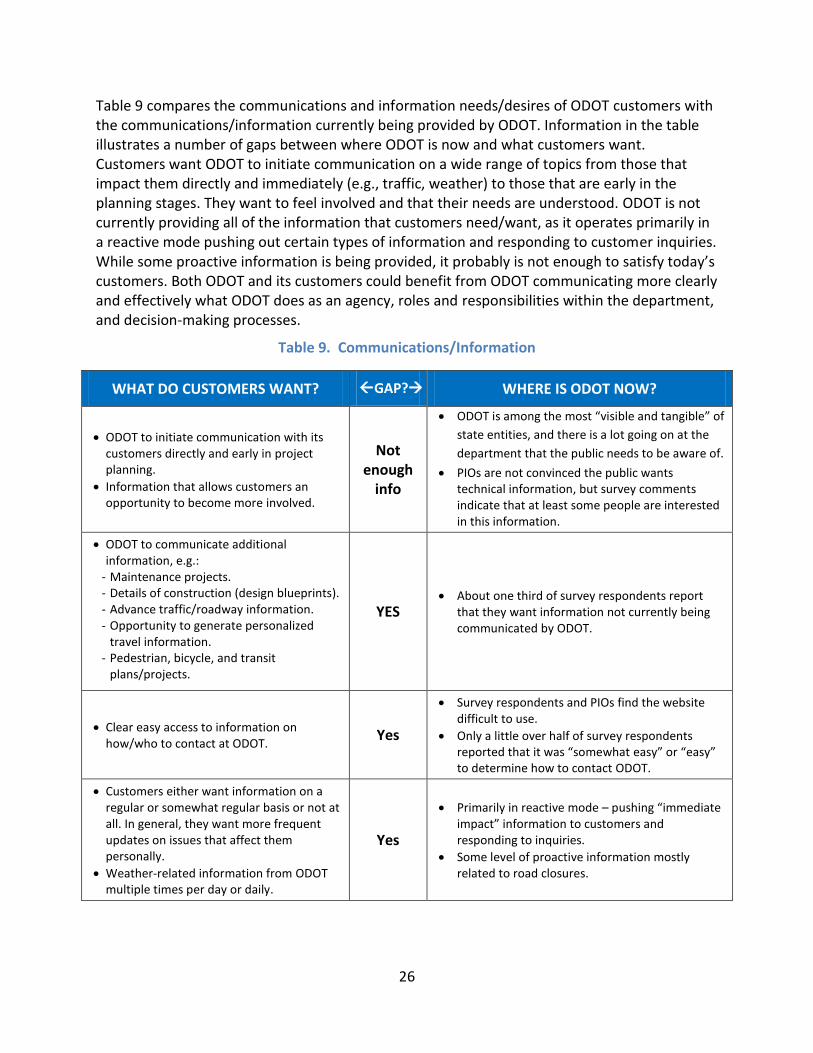
26
Table 9 compares the communications and information needs/desires of ODOT customers with the communications/information currently being provided by ODOT. Information in the table illustrates a number of gaps between where ODOT is now and what customers want. Customers want ODOT to initiate communication on a wide range of topics from those that impact them directly and immediately (e.g., traffic, weather) to those that are early in the planning stages. They want to feel involved and that their needs are understood. ODOT is not currently providing all of the information that customers need/want, as it operates primarily in a reactive mode pushing out certain types of information and responding to customer inquiries. While some proactive information is being provided, it probably is not enough to satisfy today’s customers. Both ODOT and its customers could benefit from ODOT communicating more clearly and effectively what ODOT does as an agency, roles and responsibilities within the department, and decision-making processes.
Table 9. Communications/Information
WHAT DO CUSTOMERS WANT? GAP? WHERE IS ODOT NOW?
ODOT to initiate communication with its customers directly and early in project planning.
Information that allows customers an opportunity to become more involved.
Not enough
info
ODOT is among the most “visible and tangible” of
state entities, and there is a lot going on at the
department that the public needs to be aware of.
PIOs are not convinced the public wants technical information, but survey comments indicate that at least some people are interested in this information.
ODOT to communicate additional information, e.g.:
- Maintenance projects. - Details of construction (design blueprints). - Advance traffic/roadway information. - Opportunity to generate personalized
travel information. - Pedestrian, bicycle, and transit
plans/projects.
YES About one third of survey respondents report
that they want information not currently being communicated by ODOT.
Clear easy access to information on how/who to contact at ODOT.
Yes
Survey respondents and PIOs find the website difficult to use.
Only a little over half of survey respondents reported that it was “somewhat easy” or “easy” to determine how to contact ODOT.
Customers either want information on a regular or somewhat regular basis or not at all. In general, they want more frequent updates on issues that affect them personally.
Weather-related information from ODOT multiple times per day or daily.
Yes
Primarily in reactive mode – pushing “immediate impact” information to customers and responding to inquiries.
Some level of proactive information mostly related to road closures.
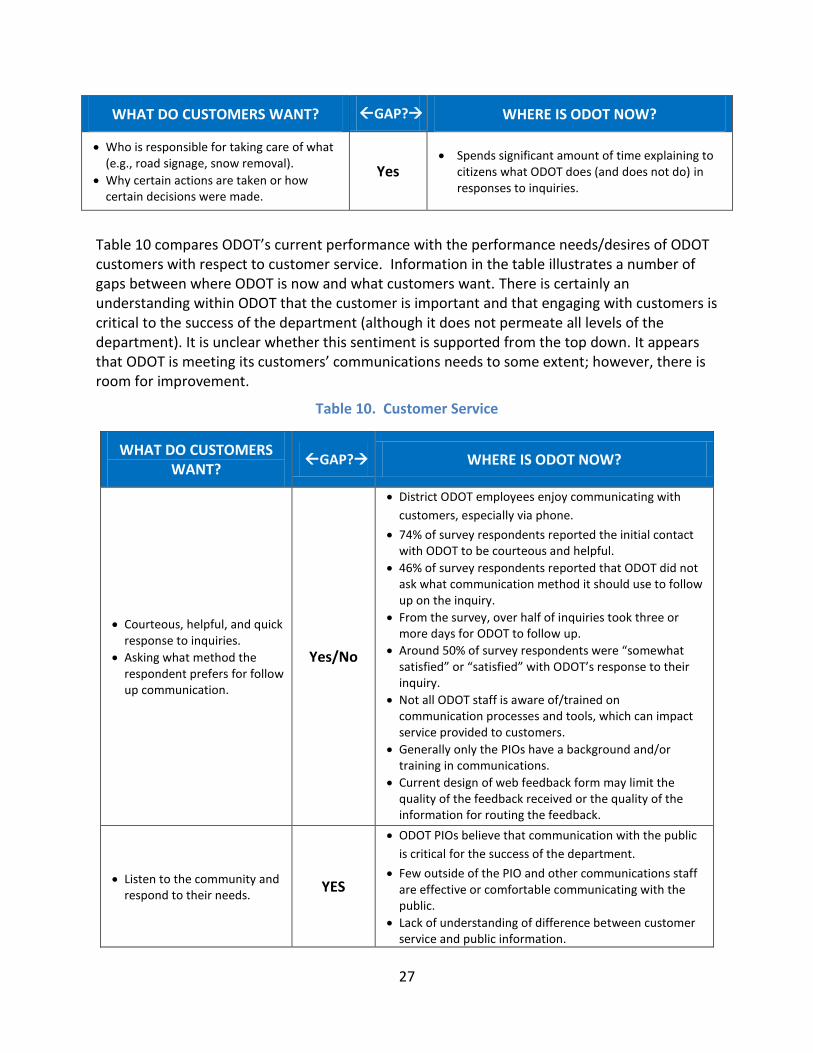
27
WHAT DO CUSTOMERS WANT? GAP? WHERE IS ODOT NOW?
Who is responsible for taking care of what (e.g., road signage, snow removal).
Why certain actions are taken or how certain decisions were made.
Yes Spends significant amount of time explaining to
citizens what ODOT does (and does not do) in responses to inquiries.
Table 10 compares ODOT’s current performance with the performance needs/desires of ODOT customers with respect to customer service. Information in the table illustrates a number of gaps between where ODOT is now and what customers want. There is certainly an understanding within ODOT that the customer is important and that engaging with customers is critical to the success of the department (although it does not permeate all levels of the department). It is unclear whether this sentiment is supported from the top down. It appears that ODOT is meeting its customers’ communications needs to some extent; however, there is room for improvement.
Table 10. Customer Service
WHAT DO CUSTOMERS WANT?
GAP? WHERE IS ODOT NOW?
Courteous, helpful, and quick response to inquiries.
Asking what method the respondent prefers for follow up communication.
Yes/No
District ODOT employees enjoy communicating with
customers, especially via phone.
74% of survey respondents reported the initial contact with ODOT to be courteous and helpful.
46% of survey respondents reported that ODOT did not ask what communication method it should use to follow up on the inquiry.
From the survey, over half of inquiries took three or more days for ODOT to follow up.
Around 50% of survey respondents were “somewhat satisfied” or “satisfied” with ODOT’s response to their inquiry.
Not all ODOT staff is aware of/trained on communication processes and tools, which can impact service provided to customers.
Generally only the PIOs have a background and/or training in communications.
Current design of web feedback form may limit the quality of the feedback received or the quality of the information for routing the feedback.
Listen to the community and respond to their needs.
YES
ODOT PIOs believe that communication with the public
is critical for the success of the department.
Few outside of the PIO and other communications staff are effective or comfortable communicating with the public.
Lack of understanding of difference between customer service and public information.
28
WHAT DO CUSTOMERS WANT?
GAP? WHERE IS ODOT NOW?
Questionable whether customer service is a priority from the top down.
NEEDED/DESIRED PERFORMANCE VERSUS POTENTIAL PERFORMANCE 4.3
The goal of developing a CRD system to meet a number of critical objectives in customer communications and service is definitely moving ODOT in the right direction towards better meeting the communications needs and desires of its customers. While having an effective tool, such as the comprehensive CRD system that ODOT envisions, will begin to fill some of the identified gaps in customer needs, this tool, per se, is not going to fill all of the gaps. ODOT leadership needs to demonstrate that customer service is a priority that comes from the top, backing this priority up with a commitment to resources, staffing, training, etc. to ensure that a focus on customer satisfaction permeates all levels of the department. Furthermore, the rules of customer service have changed. Today’s customers expect organizations to be a lot more responsive and to respond more quickly than ever. Without doing the associated internal work, any CRD tool will likely go by the wayside, similar to what has happened with CIMS. This internal work can – and should – be done simultaneously with the development of a CRD system. A commitment from the top, witnessed and experienced by all staff throughout the department, will only help to support the adoption and use of the system, better ensuring ODOT’s success.
29
5 Results of SWOT Analysis
This chapter presents the findings from the SWOT analysis with respect to the four assessment elements defined in the SWOT analysis template (Table 2).
INTERNAL PROCESSES AND COMMUNICATIONS 5.1
The strengths, weaknesses, opportunities, and threats associated with ODOT’s internal processes and communications related to customer communications are discussed in this section.
Strengths 5.1.1
The primary strength identified with respect to ODOT’s internal processes and communications is ODOT’s customer-focused processes. Overall, there is a goal to respond to all customer inquiries within 24-48 hours, even if this response is just an acknowledgement of receipt of the inquiry. In most districts there is one designated staff (usually the PIO) to interface/interact with customers when responding to an inquiry. This process ensures that, as much as possible, the PIO is the only person with whom the customer needs to interact (even though other ODOT staff may be working to provide a response). For customer inquiries that cannot be handled by ODOT (e.g., other agency’s purview, issues out of ODOT’s control), all districts provide some type of direction to the customer as to where and how they can obtain the information they are seeking. When assigning responsibility for inquiries via the web feedback form, in all districts the first person who receives the email from the web feedback form is responsible for assigning or forwarding the information to the person best able to handle the response to the customer’s inquiry. As such, ODOT is able to immediately answer the majority of the inquiries made via the web feedback form. All of these examples exemplify ODOT’s focus on providing good service to its inquiring customers.
Weaknesses 5.1.2
The primary weaknesses identified with respect to ODOT’s internal processes and communications related to customer communications are associated with process inconsistencies between districts, including internal communications. As was discussed in the gap analysis, there is a considerable amount of inconsistency between districts with respect to if or how they document/track customer inquiries, and many PIOs use their own individual/unique systems for doing so. At this point, ODOT does not know the details about its customer contact – how many customers contact ODOT in a day/week/month/year (overall and by portal), how quickly does ODOT respond to customer inquiries (overall and by type of inquiry), why do customers contact ODOT? Not having this information due to process inconsistency is a weakness because ODOT cannot determine its current performance in the area of customer relations and communications or how customers feel about other issues.
In addition, not having clearly defined and consistent processes leads to internal communication inefficiencies. One example is the need for PIOs and their staff to continually follow up with staff in other functional areas to obtain status updates on customer requests and inquiries. In addition, larger communications issues appear to impact customer service
30
within ODOT. It is not clear whether the concept of customer service has been communicated from the highest levels of ODOT or how this idea permeates throughout the department.
Opportunities 5.1.3
The primary opportunity identified with respect to ODOT’s internal processes and communications related to customer communications is to standardize these processes across districts. The ODOT PIOs appear to be committed to providing the best customer service possible, as evidenced by their own unique processes that have emerged. ODOT’s administration could capitalize on this commitment in a number of ways, including:
Communicating to all levels of the department a commitment to customer service.
Determining which district-level processes (if any) are the most efficient and effective and working from there to develop a uniform, centralized policy for customer communications.
Providing additional resources in terms of employees, tools, and training.
Threats 5.1.4
The primary threat identified with respect to ODOT’s internal processes and communications related to customer communications is moving forward too quickly with the development/implementation of a customer relations tool/system without doing the internal work necessary to develop support for and sustained use of the tool throughout the department. Currently, there does not appear to be a sufficient level of understanding by district employees regarding the importance of customer service performance measurement, which could undermine the overall goals and objectives of developing/implementing a customer relations tool/system. Introduction of a new customer relations tool/system will change current processes that some employees may not be ready to let go. Further, required use of the tool/system may create the perception of an increase in workload for customer relations/communications activities. While the addition of a customer relations tool/system will inevitably alter internal processes and work duties, it will provide many benefits to the department, and employees need to understand these benefits. If the tool/system is introduced too quickly and is not properly backed up or “sold” to employees, ODOT risks a lack of employee “buy-in,” which could lead to limited or complete non-use of the tool/system.
COMMUNICATIONS PORTALS/TOOLS 5.2
The strengths, weaknesses, opportunities, and threats associated with customer communications portals and tools are discussed in this section.
Strengths 5.2.1
There were two primary strengths identified with respect to customer communications portals/tools:
Multiple portals used for customer communications.
Positive attitude towards expanding communications portals/tools.
31
5.2.1.1 Multiple Portals Used for Customer Communications
ODOT and the public are currently utilizing multiple portals to communicate with each other, including social media, which allows ODOT to capture different types of inquiries from different types of customers. On its website, ODOT provides email addresses and phone numbers for an extensive number of employees throughout central administration and the individual districts. ODOT accepts phone calls and emails from citizens and does its best to provide the best response possible within an acceptable timeframe (usually within 24-48 hours, if not addressed immediately). ODOT offers a web feedback form on its website to allow web-based inquiries from customers who either do not want to use the phone or email or whose inquiries may not be as urgent or time-sensitive. Within the past couple of years, ODOT has entered the social media space by opening a number of Facebook pages and Twitter accounts. ODOT is working to open communications to a wide range of customers.
5.2.1.2 Positive Attitude towards Expanding Communications Portals/Tools
Evidenced from this project, as well as from conversations with district PIOs, there is a positive attitude about the concept of a centralized system to document and track customer entries. Most PIOs agree that CIMS is not a useful or efficient system to document most customer inquiries, and even for more involved requests/inquiries, the system is cumbersome and time consuming to use. Therefore, most PIOs are open to an improved tool for helping them better do their jobs.
There is also support (at least at the PIO level) for a greater effort dedicated to expanding the social media presence of ODOT’s districts. Despite the added time needed to keep social media outlets up-to-date, PIOs recognize the ability to communicate critical, time-sensitive information (e.g., storm warnings and road closures) immediately, which is visible to customers through a number of personal devices (computers, tablets, smart phones, etc.). The number of social media applications is increasing, and more and more people are using social media day-to-day. For ODOT to stay connected to its customers, it will be important for it to keep up with the growth and expansion and social media.
In general, PIOs would like to have access to more communications tools. One specific application of interest would allow information to be simultaneously transmitted on ODOT’s various communication channels. Some PIOs have reportedly explored this concept, as well as tools such as Nixel (a notification service for government agencies), live chats, and Hootsuite (a social media dashboard). These are all strengths that will support ODOT’s success in moving towards new and better ways of doing business.
Weaknesses 5.2.2
There were two primary weaknesses identified with respect to customer communications portals/tools:
Disconnect regarding the use and availability of tools for maintaining and managing customer communications.
Usefulness of ODOT’s website.
32
5.2.2.1 Disconnect Regarding the Use and Availability of Tools for Customer Communications
As was discussed in the gap analysis, there appears to be a disconnect between ODOT central administration and the district PIOs regarding the use and availability of tools for public communication and input and the tracking of customer contact data. CIMS is a good example of this disconnect. CIMS weaknesses include:
Not user-friendly.
Very time-consuming to enter inquiries (a lot of information required).
Not well designed to enter quick, easy-to-address telephone inquiries.
Lack of support for CIMS elsewhere within ODOT (e.g., IT).
Lack of training of new staff to use CIMS and/or to fully utilize CIMS.
Not everyone who takes a call uses CIMS (e.g., district engineers are sometimes contacted directly by citizens).
For all of these reasons, CIMS is not well or consistently utilized (in fact it was reported that new employees are sometimes even warned to “stay away” from the system). This lack of use results in a loss of information about a large portion of customer inquiries to ODOT. Furthermore, the lack of useful tools for recording/tracking inquiries has resulted in some districts developing/adopting their own “strategies” for doing so (e.g., use of spreadsheets and SharePoint forms and archiving email exchanges), which leads to inconsistencies in processes, as well as inability to pool data for performance measurement or data-driven decision making. The efforts being put forth by some districts to document what amounts to being only a small number of inquiries from a statewide perspective are then both inefficient and ineffective.
Another example of the disconnect between central administration and the district PIOs regarding communications tools is MindMixer. MindMixer is a tool that has been used by central administration to obtain input on the statewide long-range plan, but the district PIOs did not know what it was and were not aware of its use within ODOT. Not having this knowledge or access to the tool is putting the districts at a disadvantage.
5.2.2.2 Usefulness of ODOT’s Website
PIOs do not feel that the department’s existing web presence is effective. They feel the website contains too much information, and that information is not organized in a manner that allows users to quickly and easily find what they need. Even ODOT staff reportedly has problems finding information on the website. One comment from the customer survey regarding ODOT’s website was, “Major maintenance and road closure information is very hard to locate on the ODOT web site - make it easy to find.”
In addition to the main website, when analyzing the customer feedback data provided by ODOT, there were a lot of complaints about the Buckeye Traffic website. Complaints centered
33
around difficulty of use, long load times on mobile phones, not being able to see accident locations and estimated clearance times.6
Opportunities 5.2.3
There were three primary opportunities identified with respect to customer communications portals/tools:
Use of ODOT’s website for improved customer communications and satisfaction.
Expanded use of social media.
Many tools available for customer communications and service.
5.2.3.1 Use of ODOT’s Website for Improved Customer Communications and Satisfaction
ODOT’s website could be one of its strongest portals/tools for customer communications. It could be the primary mechanism for ODOT to “tell its story” and educate the public on what ODOT does and what ODOT does not do. Through the website, ODOT could provide a wide range of information to satisfy the information needs of a variety of customers (from detailed project information to high-level planning information). The addition of a “customer portal,” live features (e.g., ODOT news ticker), podcasts, blogs, and/or interactive features (e.g., allowing customers to vote, tag, and add information) could also be a way to draw more customers into the website, get more customers involved, and increase customer satisfaction.
5.2.3.2 Expanded Use of Social Media
First and foremost, ODOT needs to get the word out about its social media presence. From the survey responses, it appears that most of ODOT’s customers may not even be aware that they can get information and communicate with ODOT via Facebook and Twitter. Next, many opportunities lie in the expansion of social media, and there are many reasons why ODOT should consider doing so:
Social media allows agencies to immediately communicate critical, time-sensitive information that can be accessed through a number of personal and mobile devices (computers, tablets, smart phones), allowing customers to literally have information “at their fingertips” at almost any time.
“Social media is a little like having a direct line into what customers are thinking” – according to TransLink, the transit agency in Vancouver, Canada, where each shift there is staff responsible for following and responding to customer comments and questions through Twitter.
Based on info from one district, the media makes most requests and prefers to get the information via social media.
Social media is also currently the communication choice of the younger generations.
6 It should be noted that the customer data analysis was done on data from late 2012. Since this time, ODOT has
instituted the new real-time traffic website, OHGO. Analysis of customer feedback regarding the new website was not part of this project.
34
Based on findings from the customer survey, Facebook is likely the most widely used application by ODOT customers; however, if ODOT wants to target its younger customers, applications such as Twitter, Snapchat, and Instagram should also be expanded/considered.
5.2.3.3 Many Tools Available for Customer Communications and Service
There are many services available for improving customer relations/two-way communications and customer feedback. Small software companies that deliver software as a service (SaaS) platforms to collect, analyze, and measure feedback provided by website visitors typically offer affordable service and maintenance terms. The level of customization and support varies, as do implementation and maintenance costs.
Full-service providers tend to offer complete enterprise solutions that provide varying degrees of outsourcing the customer feedback management process to the provider. These providers may offer to design feedback systems from the ground up, design and oversee a plan for integrating the system, and develop a plan for monitoring, interpreting, and acting upon the data and may even offer personnel to maintain the system and act upon customer feedback. These providers often work with large businesses that focus on integrated customer retention and business improvement solutions. Once implemented, a main portion of the service provided may focus on analyzing feedback data, developing action plans, and the management of the data including customer service and response.
Social Customer Relations Management (SCRM) is an emerging new paradigm for integrating social networking in more traditional CRM systems, allowing an organization to engage in two-way communications with customers through a variety of channels. With SCRM, organizations can:
Distribute messages unfiltered by reporters or traditional media outlets.
Obtain feedback from stakeholders on services and programs.
Send/receive text message updates/questions.
Receive mobile feedback.
Conduct targeted feedback.
Engage customers in idea forums.
Set up citizen request.
Texting systems provide information and support to customers via text messages to mobile devices. These systems also allow users to text back with additional questions. Mobile feedback can include providing a quick response (QR) code that customers can scan using a smart phone. The code then brings up a website where customers can leave feedback using their mobile device. Targeted feedback allows an organization to develop a short survey or questionnaire (typically only one question or just a few questions). After answering the question, customers can typically provide additional feedback. This feedback can be provided anonymously, or an email address can be provided that allows the company to follow up on the comment. Idea forums are more open in that they let customers provide comments to issues or ideas generated by the organization, or let customers develop ideas that can be viewed and discussed among all customers. These tools are very useful for generating new ideas and getting feedback from other customers. They also avoid duplication of certain issues, as customers can see the existing
35
discussion if they encounter a problem or come up with an idea that is already being discussed. Customers can also indicate their support by “voting” on certain issues, ideas, or requests to help businesses prioritize. Finally, citizen request systems use smart phone applications that allow customers to send requests directly to the appropriate government department. Using a mapping interface, the customer may be able to provide the location of the problem, then add a description, and finally attach a picture before sending it off.
PIOs suggested making modifications to the new Equipment Inventory Maintenance System (EIMS) being developed for use by area maintenance offices such that field personnel can take pictures of reported maintenance issues prior to and following the work to be done. This would allow for visual verification that issues reported by the public are being addressed. A direct interface with a CRD system would make this even more useful, similar to many “report a pothole”-type applications used by cities across the country.
Threats 5.2.4
There were four primary threats identified with respect to customer communications portals/tools:
Internal support and expectations for new CRD system.
Technology use and changes.
Getting into “competition” with private sector service providers.
Restrictions, limitations, terms, and rights of service/software vendors.
5.2.4.1 Internal Support and Expectations for New CRD System
Despite the billions of dollars that have been spent on establishing CRM systems, many companies or public agencies are unhappy with the results. Research shows that this dissatisfaction may stem from:
Poor implementation of the systems.
Companies expecting too much from the systems.
Lack of internal support.
Developing a CRM system that doesn’t address diverse functions.
Lack of buy-in from employees.
Leadership not setting expectations and/or demonstrating that CRD is an important policy objective.
Responsible employees not recognizing the overall benefits of having a successful system.
An example of lack of internal support is what has happened with CIMS within ODOT. As noted by PIOs, there was a stronger focus on supporting CIMS upon its initial introduction (e.g., dedicated IT group and programmer), and this focus led to greater utilization; however, these resources were allocated elsewhere or discontinued, after which use of the system declined. For a CRD system to be effective, others outside of PIO operations (e.g., county time keepers) will have to be trained on how to use it as well as the benefits of its use, which will help to establish buy-in from employees.
36
5.2.4.2 Technology Changes and Use
Even as technology advances and people move towards new and better ways of doing things, some people/entities are either behind the technology curve or simply refuse to make the leap forward. As reported by PIOs, they generally have to utilize all available channels in communicating with the public, media and elected officials, even if those channels are not necessarily that efficient. One example was a media outlet in a rural area of Ohio that still insists on receiving communication from ODOT via facsimile. If ODOT is forced to continue to use outdated communications portals to meet the needs of certain customers, the move to advance its communications processes and portals will be hindered.
The rapid growth and use of technology has its advantages and disadvantages. While the advantages are numerous, the potential disadvantages cannot be overlooked or ignored. One example is the rapid changes in technologies. Often times it means acquiring a new device only to see the latest-and-greatest version come out soon after. It is difficult to keep up with these changes. The threat to an organization is spending time and money on building or acquiring a new system, only to see a better solution emerge a short time later. How does an organization make a decision about if it should acquire a new technology/system and if so which technology/system to acquire?
Another example is in the use of technology. The technologies can be used in positive, supportive ways and in negative, threatening ways. For example, the use of social media as a portal for two-way communications with customers has many advantages; however, with social media one disgruntled customer can be rapidly successful in making one complaint go “viral.”
A third example is the way in which technology changes the expectations of customers (including the media). With the ability for the near immediate exchange in communications, customers now expect a very quick turn-around in response, which cannot always realistically be achieved. This is particularly a challenge for public agencies using social media for the dissemination of information and customer feedback. The more an agency uses its social media channels, the more the customers expect.
5.2.4.3 Getting into “Competition” with Private Sector Service Providers
When it comes to tools for traffic information dissemination, a public agency needs to analyze the benefits and drawbacks of developing such tools versus allowing the private sector to develop and provide these tools. Often times, the private sector is better positioned to develop, maintain, and upgrade tools and applications than a public agency. As an example, applications such as Inrix Traffic, Waze, and TomTom may be better tools for providing traffic information than what a DOT can provide.
Evidence of this may be seen in the results of the customer survey. With regards to receiving information from ODOT, respondents seem to either want information on a regular or somewhat regular basis or not at all, and respondents generally want more frequent updates on the issues that affect them personally. Specific examples are: 50 percent of respondents would like weather-related information from ODOT multiple times per day or daily; however, 26 percent reported they do not want weather-related information from ODOT at all. Likewise, 35 percent of respondents would like travel time information from ODOT multiple times per
37
day or daily; however, 36 percent reported they do want travel times information from ODOT at all. It may be that those customers that reporting now wanting travel time and/or weather-related information from ODOT are getting this information from other sources.
5.2.4.4 Restrictions, Limitations, Terms, and Rights of Service/Software Vendors
A counter to the opportunities present in the many tools and services available for improving customer relations, two-way communications, and customer feedback is the potential perceived threat of the restrictions, limitations, terms, and rights of service associated with these tools and services. These may or may not be a concern for the development of a customer relations system at ODOT; however, they should be noted:
Some third-party software providers reserve the right to modify their terms and conditions and privacy policy at any time for any reason.
Some tools route users to a third-party site to provide feedback. Users may be reluctant to provide personal information using a third-party site for fear that the company may use or sell personal information to other companies. Often a provider's privacy policy may include a provision that the site may share some or all of a user's personal information with an affiliate company.
Depending on the provider, a site may or may not delete all information about a user from active databases and archives upon termination of an account.
Depending on the provider, service plans may be modified at any time, often simply by posting the change on the provider's website. Continued use of the website after posting the changes may constitute acceptance of the new terms. Service plans and user accounts may also be subject to termination at any time without notice.
Personal information stored at the provider's site is subject to security risks. The level of risk depends on the provider's care to secure the data.
Sensitive data may travel through infrastructure that is outside of the control of the third-party software provider. Claims with respect to the security of the data may exclude the infrastructure which is outside of the control of the third-party software provider.
Service is typically provided "as is," "where is," "as available," and "with all faults," and providers typically refuse any responsibility or liability for the loss or deletion of any data stored or transmitted. As such, data that is stored on behalf of a business is usually excluded from claims, damages, and liabilities.
Liability of the third-party software provider is often limited to a year's worth of fees collected for their services.
Agreement terms usually include a disclaimer that the software company makes no warranties with regard to limitation of service, platforms, or application programming interfaces.
Some sites require the use of temporary or persistent cookies to work correctly, and collect information about how users use the service via these cookies. Others use services that collect data remotely by using "pixel tags," "web beacons," "clear GIFs," or similar technologies, such as Facebook Connect, Google +1, Twitter Badge, and others. Such technologies can recognize certain types of information on a web browser, check
38
whether a user viewed a particular web page or email message, and determine, among other things, the time, date, and IP address of the computer from which they were viewed.
Few providers guarantee up-time for the webpage or services provided.
The research suggests that while small software companies tend to provide simple, affordable products focused on one aspect of customer feedback management, they tend to offer limited customization and limited integration with existing Information Technology (IT) infrastructure. Typically, these providers do not offer consultancy to develop an enterprise solution and provide limited support, sometimes on email-basis only.
CUSTOMER COMMUNICATIONS – INFORMATION AND SERVICE 5.3
The strengths, weaknesses, opportunities, and threats associated with customer communications information and service are discussed in this section.
Strengths 5.3.1
There were two primary strengths identified with respect to customer communications information and service:
Understanding that engaging with customers is critical to the success of the department.
Successful in providing a good level of customer communications/service.
5.3.1.1 Understanding that Engaging with Customer is Critical to the Success of the Department
ODOT district employees reportedly enjoy communicating with customers, especially via the telephone phone. Further, they understand that this engagement is critical to the success of the department. PIOs report that ODOT is among the most “visible and tangible” of state entities, and they acknowledge that there is a lot going on in the department of which the public needs to be aware. As such, some districts have undertaken efforts to proactively identify issues pertinent to the public that the department can work to address.
5.3.1.2 Successful in Providing a Good Level of Customer Communications/Service
Many districts are currently providing some level of proactive information (i.e., pushing information out to the public). Furthermore, most of the PIOs currently use some form of tracking for at least some of the requests received through their office via their own unique systems. As a result of their efforts, 53 percent of survey respondents reported their experience dealing with ODOT as either “somewhat pleasant” or “pleasant,” and another 24 percent were neutral. Therefore, less than 25 percent of survey respondents reported their experience as “somewhat unpleasant” or “unpleasant.” Seventy-four (74) percent of survey respondents reported that their initial contact with ODOT was courteous and helpful, and only 27 percent were “somewhat dissatisfied” or “dissatisfied” with ODOT’s response to their inquiry. Despite these numbers, there is still room for improvement (see section 5.3.2.2 below).
39
Weaknesses 5.3.2
There were four primary weaknesses identified with respect to customer communications information and service:
Lack of pro-active and higher-level information provided to public.
Room for improvement in customer communications/response.
Not equipped to handle current or projected levels of social media communications.
Lack of defined performance metrics related to customer communications/service.
5.3.2.1 Lack of Pro-Active and Higher-Level Information Provided to Public
Currently not all districts proactively provide information to the public. PIOs report that a lot of activities are occurring at the local/district level, and there is an inherent difficulty in translating these local activities and initiatives to the state level. This makes it difficult to tell a statewide story.
Many district PIOs are in a primarily operating in a reactive mode, mostly due to a shortage of resources. They are primarily concerned with pushing information related to traffic, weather, and road closures, the information that has an immediate impact on customers, as well as responding to the numerous inquiries from the public and media. As a result, the districts are not thinking much beyond pushing the immediate-impact information, and they do not really have time to do so anyway. More importantly, however, it appears they do not understand that pushing higher-level information is part of customer service. For example, the PIOs do not think the public, of which there are many different kinds, is interested in information about how well ODOT is performing its duties such as completing projects on time and on budget. While not every member of the general public may be interested in this information, members of the legislature may be. Moreover, it will be important to provide this type of information to promote agency transparency and accountability.
5.3.2.2 Room for Improvement in Customer Communications/Response
While customer service was noted as one of ODOT’s strengths, there is room for improvement. Less than half (49 percent) of survey respondents were “satisfied” or “very satisfied” with ODOT’s response to their inquiry, and 27 percent of survey respondents were "somewhat dissatisfied" or "dissatisfied" with ODOT's response to their inquiry. Specific comments from the survey include:
"I received no response in any way, shape, or form, from my email inquiry."
"I wrote a letter about bike paths on Route 250 and no one ever got back to me with what they might do."
Customer service needs to be seen as a priority from the top down, which does not appear to be the case within ODOT currently.
5.3.2.3 Not Equipped to Handle Current or Projected Levels of Social Media Communications
PIOs report that overworked staff already is not able to deal with the large and increasing volume of customer feedback via social network portals, which is only going to grow in the
40
coming years. As previously stated, the number of social media applications is increasing, and more and more people are using social media day-to-day. For ODOT to stay connected to its customers, it will be important for it to keep up with the growth and expansion and social media by providing dedicated resources for this purpose.
5.3.2.4 Lack of Defined Performance Metrics Related to Customer Communications/Service
At the PIO level, there is an apparent lack of understanding of what customer service means (e.g., customer service is different than public information) as well as the need for and usefulness of performance metrics – not for tracking individual performance but for meeting statewide goals. To be fair, the PIOs may see their job strictly as providing information in a pleasant, courteous and respectful manner. There appear to be no directives from central administration to focus on customer service from a performance management perspective and many may not have this skill set without additional training. According to PIOs, ODOT has not established and does not use any metrics for measuring the performance of their response/communications with customers, and any documentation/tracking of inquiries is undertaken out of simple necessity; the sheer volume of requests received (and the complicated nature of some) requires some form of record- keeping. Beyond this, PIOs do not appear to see the full benefits of tracking customer communications performance metrics. Documenting and tracking customer inquiries is a foundational component for customer service.
With regard to performance metrics, divergent record-keeping practices among districts and central administration preclude the ability to develop consistent metrics at this point. It would be difficult for ODOT to even establish statewide goals without some data on its current level of performance. In fact, some metrics discussed in the focus group were not viewed by PIOs as measures of performance, rather measures of workload. There appears to be some resistance to the use of performance measures for fear that they might be used against individuals or offices or that PIOs and/or staff might be held responsible for something that is not within their control. However, it’s not just how long it takes to fix a reported pothole, but also how long it takes the DOT to respond to the person who reported it, as well as the quality of the response and the interaction.
Opportunities 5.3.3
There were four primary opportunities identified with respect to customer communications information and service:
Capitalize on higher-level customer service initiatives.
Need to make it easy and pleasant for customers to contact ODOT.
New/different way of thinking about customer communications.
Establishment of performance metrics and a performance management approach/process for customer communications/service.
41
5.3.3.1 Capitalize on Higher-Level Customer Service Initiatives.
Recent Federal-level actions exemplify the commitment from the federal government to improve customer service, simplify communication procedures, and integrate technology into customer service goals and agency performance plans. Executive Order 13571 (2011), Streamlining Service Delivery and Improving Customer Service, required federal agencies to develop a customer service plan, including a "signature initiative" that uses technology to improve the customer experience (Performance.gov). House bill (H.R.) 538, Government Customer Service Improvement Act, was passed by the U.S. House of Representatives in Sept 2012. Senate bill S. 3455, requires establishment of customer service standards for federal agencies, is pending in Committee. State agencies such as ODOT can use these actions to push improved customer service through customer service standards and goals and agency performance plans within their organizations.
5.3.3.2 Make it Easy and Pleasant for Customers to Contact ODOT
A bivariate correlation analysis was conducted on responses to the customer survey to quantify the relationship between the ease with which respondents initially identified how to contact ODOT and respondents’ ratings of satisfaction regarding ODOT’s response to their inquiry. The resulting correlation coefficient of 0.563 was statistically significant at the .01 level, suggesting a positive statistically significant relationship between these two variables – as ease increases, so too does satisfaction.
Similarly, a bivariate correlation analysis was conducted to quantify the relationship between the pleasantness experienced by respondents regarding their inquiry and respondents’ ratings of satisfaction regarding ODOT’s response to their inquiry. The resulting correlation coefficient of 0.814 was statistically significant at the 0.01 level, suggesting a positive relationship – as perceived pleasantness of respondent experience increases, so too does satisfaction.
Finally, a bivariate correlation analysis was conducted to quantify the relationship between the time between when the inquiry was made and when ODOT first responded and respondents’ ratings of satisfaction regarding ODOT’s response to their inquiry. The resulting correlation coefficient of -0.523 was statistically significant at the .05 level, suggesting a negative statistically significant relationship between these two variables – as time between inquiry and response increases, customer satisfaction decreases.
Therefore, to increase customer satisfaction, ODOT should place emphasis on: (1) making it easy for customers to identify who within ODOT to contact, (2) ensuring that the initial individual responding to the inquiry is helpful and courteous, (3) minimizing the amount of time between the customer’s inquiry and ODOT’s response. These factors are all correlated with customer satisfaction.
5.3.3.3 New/Different Way of Thinking about Customer Communications
There are a couple of new or different ways in which ODOT could think about customer communications. One way is that ODOT does not necessarily need to communicate all things to all people all the time, which is time consuming and not always effective. Making use of different portals to get different information out to different segments of the population or
42
target audiences could help to streamline communications. Allowing people to subscribe to particular notices based on specific criteria may also help to customize the customer experience. For example, allowing people to sign up for a monthly newsletter about a particular project update could accomplish this. Moreover, initial information and sign up opportunities about the project can be targeted to a specific geographic area within close proximity to the project.
5.3.3.4 Establishment of Performance Metrics and a Performance Management Approach/Process for Customer Communications/Service
As previously discussed, one of ODOT’s weaknesses is a lack of defined performance metrics related to customer communications/service. This weakness leads to an opportunity for ODOT to establish strategic performance measures to evaluate agency goals and level of service provided to the public. Performance measures might include:
Percent of customers that are satisfied with feedback they receive from DOT after an inquiry.
Percent of customers that believe completed projects are the right transportation solutions.
Percent of customers satisfied with transportation options.
Percent of overall customer satisfaction.
Because of the limitations inherent in the results of the survey conducted for this project, ODOT could consider conducting a statewide survey to determine what type of information people want and through which mediums. There appears to be some potential disparities between what ODOT PIOs think customers want in terms of information and what customers might actually really want and/or need.
Threats 5.3.4
There were two primary threats identified with respect to customer communications information and service:
Public not understanding what ODOT does.
DOT culture of “public service” versus “customer service.”
5.3.4.1 Public Not Understanding What ODOT Does
PIOs reported that the public does not know exactly what ODOT does, and this lack of understanding leads to wasted time explaining this over and over. There is thus a significant need for ODOT to “tell its story” so that the public knows what it is that ODOT does and what it does not do. This is also an opportunity for ODOT to demonstrate its value to the taxpayers of Ohio.
5.3.4.2 DOT Culture of “Public Service” versus “Customer Service”
PIOs reportedly perceive difficulty in finding ways to determine departmental success, as the “goods” and “services” provided by the DOT are abstract and difficult to quantify, and service quality is thus more difficult to measure. Historically, DOTs are not used to providing customer service or interacting with customers on such a short-term turn-around basis. This DOT
43
“culture” of public service versus customer service is a threat to ODOT meeting its objectives of open two-way communications with customers and the tracking and analysis of customer feedback data. As was already discussed, ODOT should consider establishing customer service as a priority from the top down, as well as backing up this commitment with resources such as staff and training to ensure that a focus on customer satisfaction permeates all levels of the department.
CUSTOMER COMMUNICATIONS DATA 5.4
The strengths, weaknesses, opportunities, and threats associated with customer communications data are discussed in this section.
Strengths 5.4.1
Because ODOT has very limited amounts of customer communications data, it was difficult to identify strengths in this area. When used, the CIMS database can provide districts with data to track work orders that have been generated, and this is done by some districts, depending on the type of inquiry. What data are in CIMS do allow ODOT to at least look for trends such as portal used and type of inquiry (on a high level).
Weaknesses 5.4.2
There were two primary weaknesses identified with regard to customer communications data:
Lack of good, usable, customer communications data.
Not using customer communications data.
5.4.2.1 Lack of Good, Usable, Customer Communications Data
Overall, there is a lack of statewide customer communications data. While some districts document and track inquiries, there is no consistency between districts regarding if or how the inquiries are documented/tracked – while some districts document some telephone inquiries, most do not document them at all. The same holds true for email inquiries. Therefore, while data can be pulled from CIMS, the data are not representative of the customer inquiries received by ODOT (as was the case with the data analysis for this project). If the districts are not consistently documenting customer inquiries, ODOT is missing an opportunity to not only analyze and compare performance across the districts but also to aggregate the district-level data to assess and report statewide performance.
Another example of a lack of good, usable customer communications data are the data available through the web feedback form. While ODOT could make use of these data, the inquiries are in free text format, which is cumbersome and resource-intensive to reduce and analyze. Furthermore, even analyzing inquiries using the categories provided on the website may not yield valid results; an analysis of the form’s current design showed limited categories from which customers can select, which may limit the quality of the feedback received. In addition, an analysis of inquiries showed that many customers selected an inappropriate category for their inquiry.
44
5.4.2.2 Not Using Customer Communications Data
ODOT’s web feedback form is an existing avenue from which customer feedback could be collected and analyzed, as customers are personally entering the information into the electronic forms (i.e., no work involved on ODOT’s end to enter the inquiries); however, these customer communications data are currently not being stored or used in any way other than to respond to the actual inquiries. ODOT has the opportunity to archive customer inquiries made via the web feedback form, as it did for the use in this research project, and this could be a first step at understanding what information customers are seeking, as well as their needs, desires, and satisfaction with the transportation system.
Opportunities 5.4.3
There were two primary opportunities identified with respect to customer communications data:
Improving the quality of customer communications data within ODOT
Exploration and use of social media data.
5.4.3.1 Improving the Quality of Customer Communications Data within ODOT
The opportunity to improve the quality of customer communications data within ODOT overlaps other opportunities already presented. Through standardization of processes, including the development and use of a common customer relations tool/system, the quality of customer communications data at ODOT will improve significantly.
5.4.3.2 Exploration and Use of Social Media Data
The growing use of social media by the public presents an interesting opportunity for ODOT to learn more about its customers. One way of analyzing social media data is through sentiment analysis, which provides a way for an organization to learn by simply “listening” to what their customers are saying. One example is within the District of Columbia government. Currently, the District Department of Transportation (DDOT) provides on its website monthly customer grades (e.g., B+). These grades are based on an algorithm that scores public sentiment shared by web, text, or social media. Grade.DC.gov gathers innovative analytical technology to improve customer service at 10 participating DC government agencies, of which DDOT is one. Feedback is collected from the website and combined with data from comments posted on social media sites like Twitter and Facebook, which allows the DC government to form a grade for each agency. Customers can easily offer actionable feedback and help DC government agencies to improve the quality of customer service. In the case of social media, people/customers are like “sensors” that are providing information from all over, at all times, and on many different topics, and this is rich and deep data just waiting to be explored.
Threats 5.4.4
There were two primary threats identified with respect to customer communications data, but of which are associated with the availability of resources:
Lack of data to justify additional resources.
45
Lack of resources to analyze and use data.
5.4.4.1 Lack of Data to Justify Additional Resources
ODOT’s current lack of customer communications data is a threat to being able to secure additional resources needed to support the sustained use of a new CRD system, as well as a customer communications management process. Without sufficient data, it may be difficult for ODOT to justify the additional resources needed to support these efforts.
5.4.4.2 Lack of Resources to Analyze and Use Data
A new CRD system, coupled with growing levels of social media use, is likely to result in a large volume of diverse customer communications data (including structured and unstructured data) for ODOT. While on one hand, having a rich and large database is advantageous and beneficial, both to the organization and to its customers, resources will be needed to manage, analyze, and make use of the data. Without the appropriate dedicated resources, the available data will not be used to its fullest extent.
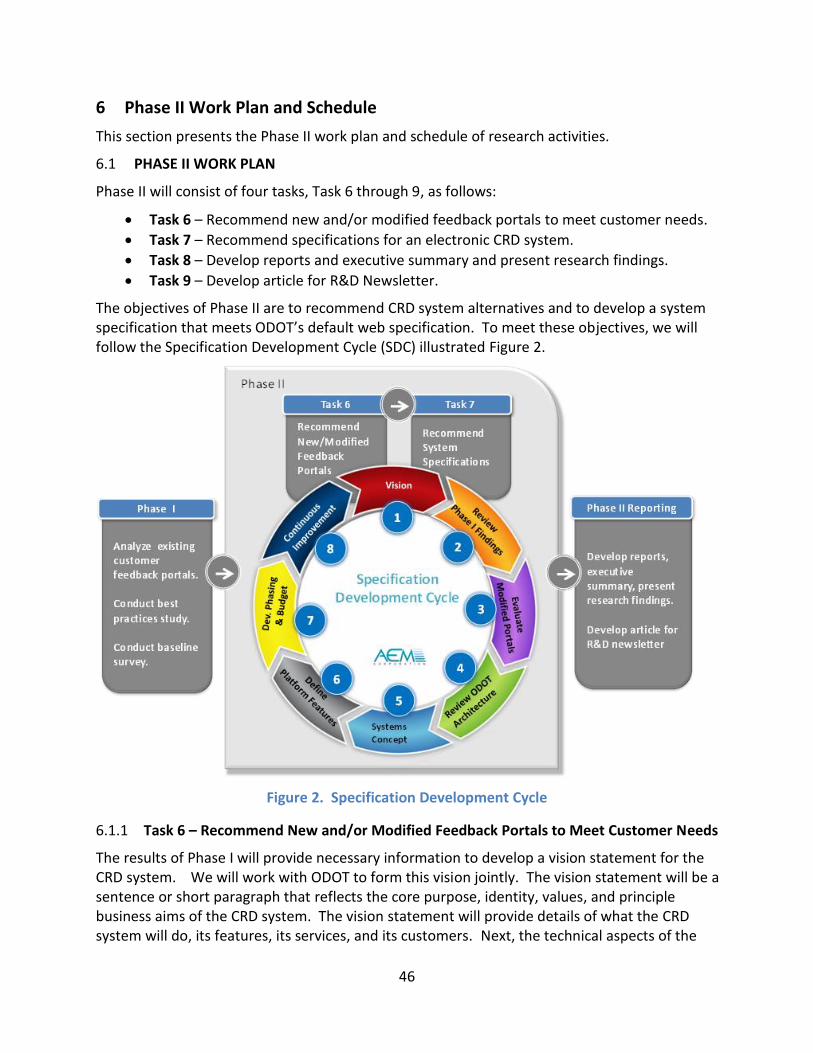
46
6 Phase II Work Plan and Schedule
This section presents the Phase II work plan and schedule of research activities.
PHASE II WORK PLAN 6.1
Phase II will consist of four tasks, Task 6 through 9, as follows:
Task 6 – Recommend new and/or modified feedback portals to meet customer needs.
Task 7 – Recommend specifications for an electronic CRD system.
Task 8 – Develop reports and executive summary and present research findings.
Task 9 – Develop article for R&D Newsletter.
The objectives of Phase II are to recommend CRD system alternatives and to develop a system specification that meets ODOT’s default web specification. To meet these objectives, we will follow the Specification Development Cycle (SDC) illustrated Figure 2.
Figure 2. Specification Development Cycle
Task 6 – Recommend New and/or Modified Feedback Portals to Meet Customer Needs 6.1.1
The results of Phase I will provide necessary information to develop a vision statement for the CRD system. We will work with ODOT to form this vision jointly. The vision statement will be a sentence or short paragraph that reflects the core purpose, identity, values, and principle business aims of the CRD system. The vision statement will provide details of what the CRD system will do, its features, its services, and its customers. Next, the technical aspects of the
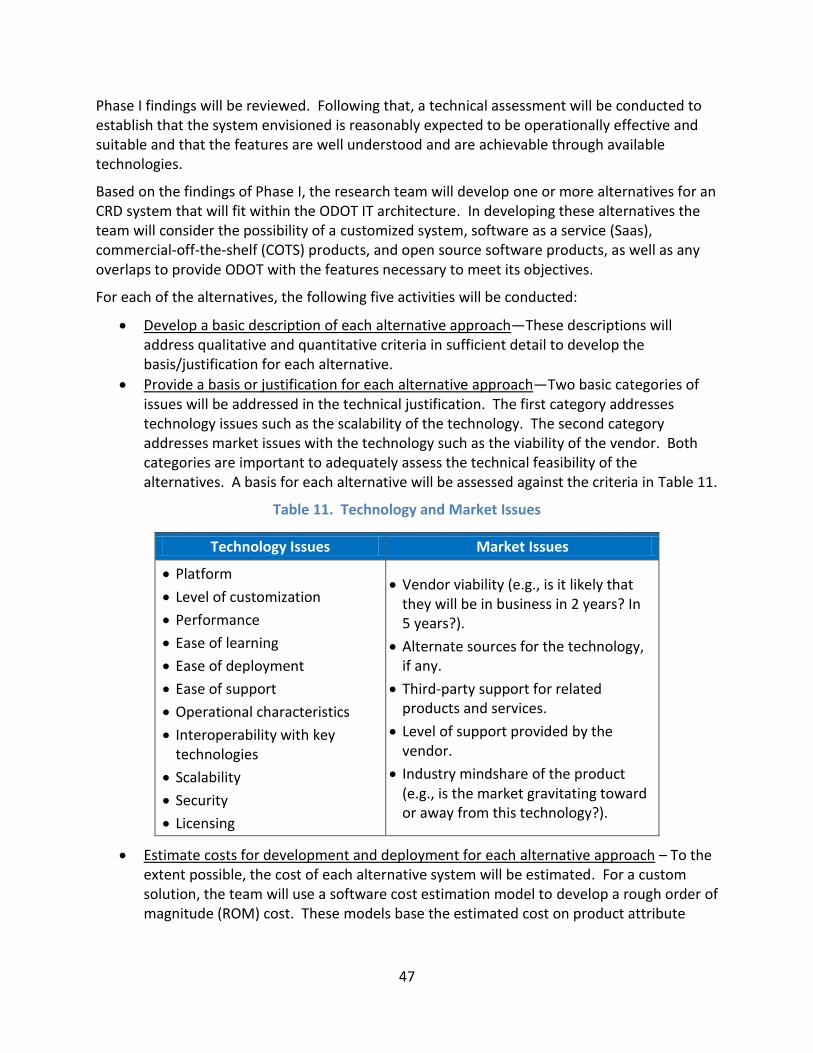
47
Phase I findings will be reviewed. Following that, a technical assessment will be conducted to establish that the system envisioned is reasonably expected to be operationally effective and suitable and that the features are well understood and are achievable through available technologies.
Based on the findings of Phase I, the research team will develop one or more alternatives for an CRD system that will fit within the ODOT IT architecture. In developing these alternatives the team will consider the possibility of a customized system, software as a service (Saas), commercial-off-the-shelf (COTS) products, and open source software products, as well as any overlaps to provide ODOT with the features necessary to meet its objectives.
For each of the alternatives, the following five activities will be conducted:
Develop a basic description of each alternative approach—These descriptions will address qualitative and quantitative criteria in sufficient detail to develop the basis/justification for each alternative.
Provide a basis or justification for each alternative approach—Two basic categories of issues will be addressed in the technical justification. The first category addresses technology issues such as the scalability of the technology. The second category addresses market issues with the technology such as the viability of the vendor. Both categories are important to adequately assess the technical feasibility of the alternatives. A basis for each alternative will be assessed against the criteria in Table 11.
Table 11. Technology and Market Issues
Technology Issues Market Issues
Platform
Level of customization
Performance
Ease of learning
Ease of deployment
Ease of support
Operational characteristics
Interoperability with key technologies
Scalability
Security
Licensing
Vendor viability (e.g., is it likely that they will be in business in 2 years? In 5 years?).
Alternate sources for the technology, if any.
Third-party support for related products and services.
Level of support provided by the vendor.
Industry mindshare of the product (e.g., is the market gravitating toward or away from this technology?).
Estimate costs for development and deployment for each alternative approach – To the extent possible, the cost of each alternative system will be estimated. For a custom solution, the team will use a software cost estimation model to develop a rough order of magnitude (ROM) cost. These models base the estimated cost on product attribute
48
criteria and personnel attribute criteria. For the approaches that use Saas or COTS products, the team will estimate the costs associated with these products.
Project usage and benefit to ODOT for each alternative approach – Based on the survey response and the reactions to the new and modified feedback portals, the likelihood of use and the benefit will be estimated. Features that provide additional capability over the baseline will be identified, and the benefit of each option will be evaluated with a set of criteria such as:
- Relative benefit of each new feature over the baseline. - Feasibility in achieving performance requirements. - Achieving compliance with ODOT’s “Default Architecture.” - Obtaining program personnel and user acceptance. - Obtaining public acceptance. - Programmatic fit or strategic alignment. - Legal considerations (e.g., issues relating to accessibility). - Total cost of ownership.
Conduct a benefit-cost analysis of each alternative approach – A DSS will be employed to provide a benefit-cost analysis for each alternative system. While total cost of ownership data is straightforward, benefit data will be developed using both quantitative and qualitative criteria such as feasibility, acceptance, and risk, which are measured in units that are not directly comparable. The DSS uses ratio-scale mathematics for benefit-cost analysis, which allows for the use of criteria with incommensurate units. ODOT will provide input into the appropriate criteria and the weight and rank for each criterion, as noted above.
The description and assessment of the alternative systems will be submitted to ODOT for review.
Task 7 – Recommend Specifications for an Electronic CRD System 6.1.2
After ODOT review, ODOT will determine which alternative(s) for which it would like specifications. Task 7 will focus on developing the system(s) specification that meets the following criteria:
Complies with “ODOT’s Default Web Application Architecture.”
Collects and maintain all feedback from all portals.
Analyzes feedback to provide statistically valid and unbiased breakdowns based on: customer demographics, customer location, comments, portal, time period (i.e. last week, month, year).
Exports data and analysis to be used by other ODOT management systems.
Notifies the appropriate ODOT office to respond to feedback, if necessary.
Is expandable to incorporate new communication portals in the future.
Provides customers the opportunity to provide feedback on the CRD system itself.
The systems concept will be further refined to describe how the business will operate once the approved system is implemented, and to assess how the system will impact employee and
49
customer privacy. Additionally security certification and accreditation needs will be discussed, system security requirements identified, and high level vulnerability assessment provided.
The platform features will be formally defined, which will delineate the requirements in terms of data, system performance, security, and maintainability requirements for the system. All features will be defined to a level of detail sufficient for the systems specification. All requirements will be measurable and testable and will relate to the business need identified in the systems concept. The physical characteristics of the system will be specified. The operating environment will be established, major subsystems and their inputs and outputs defined, and resources allocated to processes. Each identified subsystem will be partitioned into one or more design units or modules, and the subsystems identified during design will be used to create a detailed structure of the system. Finally, a detailed system specification will be prepared.
Task 8 – Develop Reports and Executive Summary and Present Research Findings 6.1.3
Much of the draft report has been developed through the Phase I report. In addition to the Phase I report, activities from Tasks 6 and 7 will be thoroughly documented to complete the draft report. Upon completion of the draft final report and executive summary, one original and five copies of each will be submitted by March 31, 2014.
ODOT will provide comments by May 31, 2014, at which point, a teleconference with ODOT and other interested parties will be held to discuss the comments and recommended revisions. The revised final report and executive summary will be submitted to ODOT by June 30, 2014 via two electronic versions of each document – one electronic version will be in Adobe Acrobat (.pdf), and the other electronic version will be in Microsoft Word (.doc).
In addition, the research team will develop and deliver a presentation of the research results to ODOT by June 30, 2014.
Task 9 – Develop Article for R&D Newsletter 6.1.4
In addition to the final report, a two-page article will be developed for the IRIS R&D newsletter.
PHASE II SCHEDULE OF RESEARCH ACTIVITIES 6.2
The Phase II schedule is shown in Figure 3.
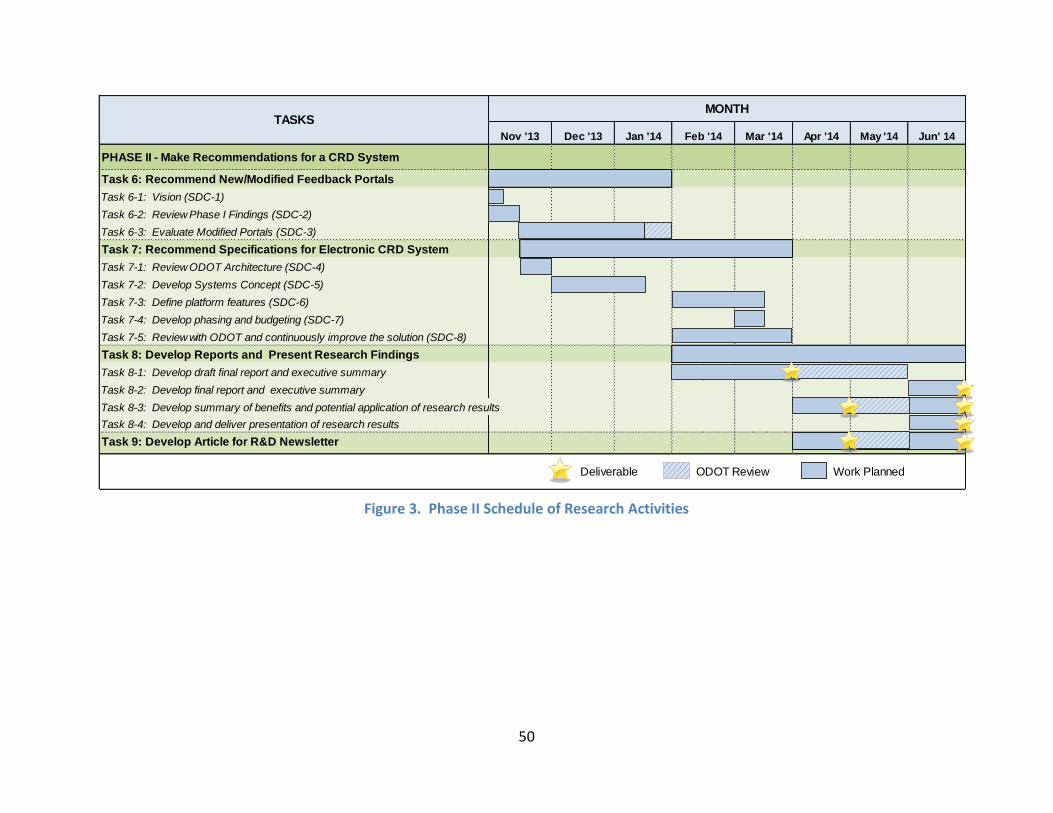
50
Figure 3. Phase II Schedule of Research Activities
Jan '14 Mar '14 Apr '14 May '14 Jun' 14
PHASE II - Make Recommendations for a CRD System
Task 6: Recommend New/Modified Feedback Portals
Task 6-1: Vision (SDC-1)
Task 6-2: Review Phase I Findings (SDC-2)
Task 6-3: Evaluate Modified Portals (SDC-3)
Task 7: Recommend Specifications for Electronic CRD System
Task 7-1: Review ODOT Architecture (SDC-4)
Task 7-2: Develop Systems Concept (SDC-5)
Task 7-3: Define platform features (SDC-6)
Task 7-4: Develop phasing and budgeting (SDC-7)
Task 7-5: Review with ODOT and continuously improve the solution (SDC-8)
Task 8: Develop Reports and Present Research Findings
Task 8-1: Develop draft final report and executive summary
Task 8-2: Develop final report and executive summary
Task 8-3: Develop summary of benefits and potential application of research results
Task 8-4: Develop and deliver presentation of research results
Task 9: Develop Article for R&D Newsletter
Deliverable ODOT Review Work Planned
Feb '14Dec '13
MONTH
Nov '13
TASKS
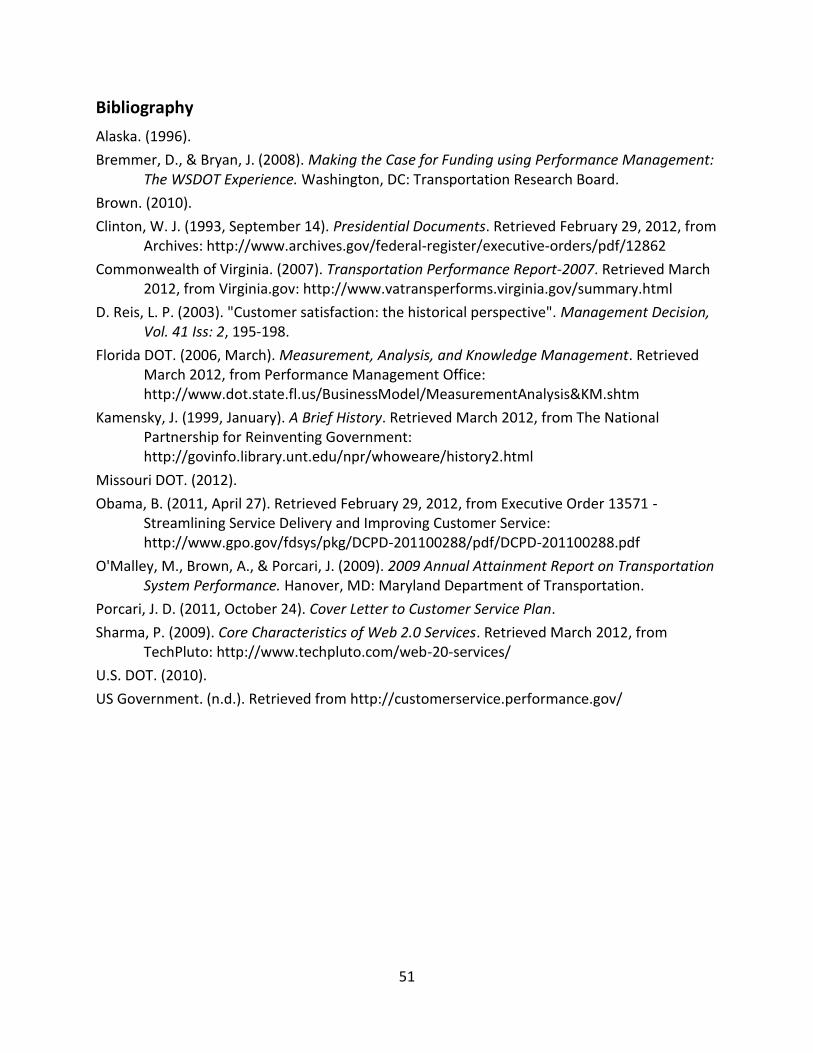
51
Bibliography
Alaska. (1996).
Bremmer, D., & Bryan, J. (2008). Making the Case for Funding using Performance Management: The WSDOT Experience. Washington, DC: Transportation Research Board.
Brown. (2010).
Clinton, W. J. (1993, September 14). Presidential Documents. Retrieved February 29, 2012, from Archives: http://www.archives.gov/federal-register/executive-orders/pdf/12862
Commonwealth of Virginia. (2007). Transportation Performance Report-2007. Retrieved March 2012, from Virginia.gov: http://www.vatransperforms.virginia.gov/summary.html
D. Reis, L. P. (2003). "Customer satisfaction: the historical perspective". Management Decision, Vol. 41 Iss: 2, 195-198.
Florida DOT. (2006, March). Measurement, Analysis, and Knowledge Management. Retrieved March 2012, from Performance Management Office: http://www.dot.state.fl.us/BusinessModel/MeasurementAnalysis&KM.shtm
Kamensky, J. (1999, January). A Brief History. Retrieved March 2012, from The National Partnership for Reinventing Government: http://govinfo.library.unt.edu/npr/whoweare/history2.html
Missouri DOT. (2012).
Obama, B. (2011, April 27). Retrieved February 29, 2012, from Executive Order 13571 - Streamlining Service Delivery and Improving Customer Service: http://www.gpo.gov/fdsys/pkg/DCPD-201100288/pdf/DCPD-201100288.pdf
O'Malley, M., Brown, A., & Porcari, J. (2009). 2009 Annual Attainment Report on Transportation System Performance. Hanover, MD: Maryland Department of Transportation.
Porcari, J. D. (2011, October 24). Cover Letter to Customer Service Plan.
Sharma, P. (2009). Core Characteristics of Web 2.0 Services. Retrieved March 2012, from TechPluto: http://www.techpluto.com/web-20-services/
U.S. DOT. (2010).
US Government. (n.d.). Retrieved from http://customerservice.performance.gov/
52
Appendix A - ODOT Interviews and Focus Group
INTERVIEW QUESTIONS
CIMS
1) Who is responsible for entering information into CIMS when a customer submits an inquiry?
2) Who is responsible for making sure the inquiry gets to the appropriate person that can respond to and/or resolve the issue?
3) Is there a timeframe within which ODOT must respond to an inquiry? 4) Does anyone keep track of the inquiries and close the claim in CIMS when resolved? If
so, who? 5) Are there any additional processes you feel we should know about when ODOT uses the
CIMS system? 6) What do you like about CIMS? 7) What do you not like about CIMS? 8) How could CIMS be improved?
Web Feedback Form
9) When the forms are submitted online, who receives them? Do they go to a centralized location? If so, how do they get distributed to the districts?
10) Who is responsible for making sure the inquiry gets to the appropriate person that can respond to and/or resolve the issue?
11) Is there a timeframe within which ODOT must respond to an inquiry? 12) Does anyone keep track of the inquiries and make sure they are addressed? If so, who? 13) Are there any additional processes you feel we should know about when ODOT uses the
Web Feedback Form? 14) What do you like about the web feedback form/process? 15) What do you not like about the web feedback form/process? 16) How could the web feedback form/process be improved?
Social Media (Facebook and Twitter)
17) How often do you generally update your social media sites? 18) What types of information do you typically send out to customers? 19) If a customer has an inquiry that cannot be answered by the site moderator, what
process is followed? Does the moderator contact the people that can handle the question directly?
20) Is there a timeframe within which ODOT must respond to an inquiry? 21) Are there any additional processes you feel we should know about when ODOT uses
social media? 22) What do you like about the process of communicating with customers via social media?
53
23) What do you not like about the process of communicating with customers via social media?
24) How could the process of communicating with customers via social media be improved?
Telephone
25) Do you receive telephone inquiries from customers? If so, how often? 26) If a customer calls you directly and you can answer the question/inquiry, do you
document or pass on the inquiry? 27) If a customer calls you directly and you cannot immediately answer the
question/inquiry, what do you do? Do you document these calls? 28) If you receive a telephone inquiry intended for someone else, what do you do? Do you
document or pass on these inquiries? 29) Do you follow up on telephone inquiries that cannot be resolved immediately? Are
these telephone inquiries tracked? 30) Are there any additional processes you feel we should know about regarding how ODOT
manages telephone inquiries from customers? 31) Is there any feedback you would like to provide to us on what you like/dislike about
ODOTs process of managing telephone inquiries from customers?
32) Do you ever receive written inquiries from customers via US mail? If so, how often? 33) What are the general topics of these written inquiries? 34) What do you do when you receive a written inquiry? Do you document or pass on the
inquiry? 35) Are there any additional processes you feel we should know about regarding how ODOT
manages written inquiries from customers via US mail? 36) Is there any feedback you would like to provide to us on what you like/dislike about
ODOTs process of managing written inquiries from customers via US mail?
MindMixer
37) Are you familiar with ODOT’s use of MindMixer? 38) Who is responsible for maintaining the site and/or the information being collected? 39) What is ODOT doing with the information collected from MindMixer? 40) Is there any feedback you would like to provide to us on what you like/dislike about
ODOT’s use of MindMixer?
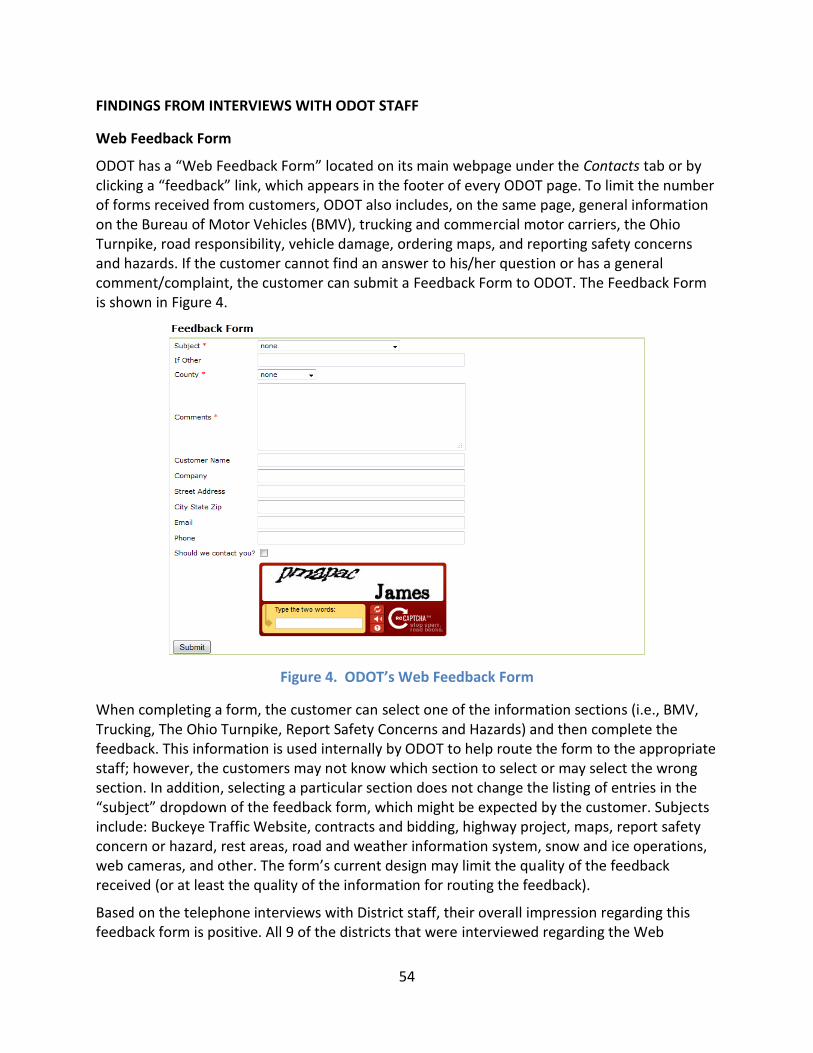
54
FINDINGS FROM INTERVIEWS WITH ODOT STAFF
Web Feedback Form
ODOT has a “Web Feedback Form” located on its main webpage under the Contacts tab or by clicking a “feedback” link, which appears in the footer of every ODOT page. To limit the number of forms received from customers, ODOT also includes, on the same page, general information on the Bureau of Motor Vehicles (BMV), trucking and commercial motor carriers, the Ohio Turnpike, road responsibility, vehicle damage, ordering maps, and reporting safety concerns and hazards. If the customer cannot find an answer to his/her question or has a general comment/complaint, the customer can submit a Feedback Form to ODOT. The Feedback Form is shown in Figure 4.
Figure 4. ODOT’s Web Feedback Form
When completing a form, the customer can select one of the information sections (i.e., BMV, Trucking, The Ohio Turnpike, Report Safety Concerns and Hazards) and then complete the feedback. This information is used internally by ODOT to help route the form to the appropriate staff; however, the customers may not know which section to select or may select the wrong section. In addition, selecting a particular section does not change the listing of entries in the “subject” dropdown of the feedback form, which might be expected by the customer. Subjects include: Buckeye Traffic Website, contracts and bidding, highway project, maps, report safety concern or hazard, rest areas, road and weather information system, snow and ice operations, web cameras, and other. The form’s current design may limit the quality of the feedback received (or at least the quality of the information for routing the feedback).
Based on the telephone interviews with District staff, their overall impression regarding this feedback form is positive. All 9 of the districts that were interviewed regarding the Web
55
Feedback Form feel that it is a user-friendly system that is easy to use for both the customers and for ODOT. The PIOs find that it is helpful to use for simple questions and the turnaround time for them to respond is often immediate.
The districts did provide some suggestions for the improvement of the Web Feedback Form. Multiple districts mentioned that the visibility of the form on the ODOT website was inadequate, as they thought it would be used more often if customers had better access to it or knew it existed. About half of the districts reported that they did not like the customer anonymity. The Feedback Form does not require customers to provide contact information when they voice concerns. If the customer does not provide contact information ODOT is unable to address these concerns with the customer as they would like to do. These districts also reported that they prefer to interact with their customers on a more personal level, either via telephone or in-person, noting that the Feedback Form is an impersonal type of communication.
Once the Feedback Form is completed and submitted by the customer, the process followed by each district varies slightly. In all but two districts (Districts 6 and 10) the initial inquiry is sent to the district PIO. Depending on the topic, ODOT’s central office may also be copied. In District 6, the form starts at the Customer Service Office, and in District 10, the website administrator receives it first. For both Districts 6 and 10, the CSO representative or website administrator will forward the inquiry to the appropriate person, if applicable, while the rest are sent to the PIO if the administrator does not know who to send the inquiry to. In all districts, the first person that receives the email from the Web Feedback Form is responsible for assigning or forwarding the information to the person best able to handle it. If the PIO can answer the inquiry without consulting anyone else, he or she does so. Ideally, the goal is to answer the inquiry within 24-48 hours with at least an acknowledgement of receipt. District 1 allows one week for answering an inquiry via the feedback form. According to the PIOs that were interviewed, they are able to immediately answer the majority of submittals via the Feedback Form.
In most districts, any inquiries that require the PIO to elicit an opinion or answer from another person, the PIO serve as the go-between for the customer. The reason for this is so the customer only has one point of contact within ODOT even though more than one person may be working on a response. The PIO also remains the person responsible for ensuring that all issues are resolved. In District 3, all inquiries that need to be answered by someone other than the PIO, the PIO forwards the claim to the appropriate person, who is then responsible for answering the customer.
Documentation of the actions taken to resolve an inquiry submitted via the web feedback form is not consistent between the districts. Each district has found a way to track the feedback forms that best fits its process, if there is any tracking at all. District 1 does not document the communication in any way. Three districts (Districts 3, 4, and 9) keep track of the communication via email and save everything in folders. The District 3 PIO maintains a personal spreadsheet to track feedback through the web form. Two districts (Districts 6 and 11) reported that they enter the inquiries into CIMS for tracking; however, they also reported that not all inquiries make it into CIMS, as the process is time-consuming. It should be noted that the Districts receive notification of web feedback form inquiries via email. Therefore, some of
56
Districts may be classifying some or all of these inquiries in CIMS as “email” inquiries rather than “Internet” inquiries.
Social Media
Every district within ODOT has a Facebook page and a Twitter page. There are also some pages on both the Facebook and Twitter websites that contain statewide general information or are dedicated to certain projects or topics. With the current social media boom, ODOT has been able to effectively reach out to its customers via this portal to provide information quickly, while reaching a large number of people at one time.
ODOT currently has more than 15 Facebook pages, including the following:
ODOT 71670 - This page is exclusively for the I-71 and I-670 improvement project. It is mostly used to update the community on progress and what to expect regarding road closures and traffic conditions. The page was started in January of 2012.
ODOT Ice & Snow Take it Slow - This page is ODOT’s winter safety page. It was started in the winter of 2010.
Ohio Department of Transportation - This is the main ODOT page. It covers a wide range of topics including weather, construction, and safety tips.
Individual Districts - Each district has its own page that was started in the beginning of 2012. Information covered is mainly related to weather, safety, traffic or construction.
ODOT currently has more than 15 Twitter accounts, including the following:
Statewide - This is the general Twitter account for the entire state. The tweets are very general and include safety comments. Many of the tweets direct the users to the individual district Twitter pages.
Innerbelt Bridge - This page is used to update customers on conditions on/around the Innerbelt Bridge.
71670 - This account is used to keep customers up to date on the current situation with the I-71/I-670 project.
Individual Districts - Each district has their own Twitter account that is maintained at the district level.
The interviews with the district PIOs revealed a positive outlook on the use of social media to communicate with customers. Each representative interviewed provided information about what they liked and did not like, as well as suggestions for improving how ODOT uses social media. Noted benefits of using social media included:
It is quick and easy to post up-to-date information
Great for mass communication
Compliments and positive feedback is seen by everyone
It appeals to a different type of customer (young and tech-savvy)
Instantaneous metrics and feedback are obtained on a topic or posting
Great way to tell ODOTs “story”
Gives ODOT a closer connection to its customers
57
Noted disadvantages of using social media included:
Negative feedback and complaints are seen by everyone and is sometimes used at a platform for someone to vent their frustrations
Message length restrictions can cause a message to be incomplete or not “tell the whole story”
It is time-demanding as people expect faster responses and many daily updates
People should not be driving while checking social media sites
Some ways that the districts recommended improving the processes included:
Increase staffing to deal with the time consuming pages
Develop technology that makes it easier to update the sites
Implement training and continued training for this ever-changing technology
The following is a summary of an assessment of ODOT’s process for updating its Facebook pages:
ODOT 71670 – All of the customer comments have been answered promptly. This page is kept up to date and new posts are created two to three times per day to keep the public informed.
ODOT Ice & Snow Take it Slow – This page is updated with winter safety tips on an as needed basis during the winter months when it snows or icy conditions exist.
Ohio Department of Transportation – This page has been updated about every 3 days since it was started in January of 2012.
Individual Districts – Each district has someone responsible for updating/checking its page. Some are updated 3-5 times per day, while others are updated about once per week (Districts 1 and 9)
The following is a summary of an assessment of ODOT’s process for updating its Twitter account:
Statewide – A new tweet is sent out about once per week. ODOT also responds to other tweets regularly.
Innerbelt Bridge – New tweets are sent out multiple times per day on this page. The vast majority of the tweets contain information regarding road closures. Some of the tweets are regarding safety tips.
71670 – Tweets are posted about once per week regarding road closures and any other details pertinent to travel in the areas affected by this project. Customers also ask questions that are answered promptly by the moderator of this page.
Individual Districts – Districts 1 and 9 send messages only on an as needed basis (about once per week), mostly during snow and ice. The rest of the districts update their sites multiple times per day with pertinent information.
The processes of updating these sites are similar for each district. District 3 is using the Hootsuite website to simultaneously manage their Facebook and Twitter accounts, and Districts 8 and 11 linked the two together. The rest of the districts update their pages as needed, which may be a few times per day regarding accidents or construction lane closures. If there is a snow
58
and ice event or a major issue, the updates are much more frequent (up to 10 per day) in order to keep the customers informed.
Additional processes that were discussed with ODOT staff responsible for social media updates and communications involved customer inquiries that are posted on ODOTs social media pages. All of the districts follow the same general processes when it comes to dealing with questions posted on social media sites. When a customer posts to the Facebook or Twitter pages, the PIO is notified via an email. The site moderator (usually the PIO) will either answer the question immediately or ask the appropriate person for guidance, then answer the customer. Responses are always given via social media. Generally responses are provided within a 24 hour timeframe or as soon as possible, with 3 districts (Districts 3, 7, and 9) providing an answer within 48 hours. Response time is expected to be shorter due to the nature of social media and expectations for quick responses.
Telephone
ODOT has a “general number” listed on the Contacts page of their website. This phone number is (614) 446-7170. Phone numbers are also listed on this page for key personnel under the following headings: Executive Management, Chief Legal Counsel, Communications, Construction, Engineering, Facilities and Equipment Management, Finance, Human Resources, Information Technology, Innovative Delivery, Operations, Planning, Policy and Legislative Services, Rail Development Commission, and Individual Districts. There is also an ODOT phone listing, which gives the name and phone number for every ODOT employee statewide.
Every district receives phone calls directly from its customers. In fact, telephone calls are the most common form of communication that customers use to reach out to ODOT with questions and concerns, and the reasons for contacting ODOT via telephone vary widely. In terms of the actions required by ODOT, telephone inquiries can be classified in four categories: inquiries that can be resolved immediately by the person answering the call, inquiries that require some question/correspondence with other ODOT staff before following up with the customer, inquiries that require some action on the part of ODOT, and inquiries that cannot be resolved by ODOT.
Telephone calls from customers that can be resolved immediately while the customer is still on the phone are the most common. In all districts, the person that receives the call (usually the PIO) addresses the question and no follow-up phone call or action is required. It is important to note that the majority of districts do not document these inquiries in any way. District 10 is the only district that regularly documents these inquiries; the PIO documents these inquiries in a personal spreadsheet. District 11 reported that they occasionally enter these inquiries into CIMS.
The processes for handing telephone inquiries that cannot be resolved immediately by the person who answers the telephone are more complex. If the inquiry requires a question of other ODOT staff, Districts 1 and 12 forward the calls to the appropriate person within ODOT to obtain an answer to the question. District 12 does document these calls in CIMS and assigns the claim to the person to which the call was forwarded. The rest of the district PIOs take a message from the customer, retrieve the answer from the appropriate person/division within
59
ODOT, and then call the customer back. In these cases, the PIOs serve as the go-between and ensure that the customer is satisfied. When documenting these inquiries, the process is extremely unique to each district. Districts 1, 6, 8, and 11 reported that they do not document these inquiries at all. Districts 3 and 9 reported that they document the calls through the use of email. As previously noted, District 12 documents these inquiries in CIMS, and the District 10 PIO documents these inquiries, as all telephone inquiries, in a personal spreadsheet.
For telephone inquiries that require an action on the part of ODOT (e.g., fixing a pot hole, replacing a sign, removing debris), more Districts do enter these inquiries into CIMS so that the status can be tracked. Districts 3, 4, 6, 8, and 12 document these inquiries in CIMS. District 9 uses email exchanges as documentation of the inquiries, and District 10 documents the inquiries, as they do all telephone inquiries, in a spreadsheet. Districts 1 and 11 do not document these inquiries at all.
For telephone inquiries that cannot be handled by ODOT (usually intended for another agency and/or regarding an issue that is out of ODOT’s control), every district PIO indicated that he/she either has a list of phone numbers available to them to give to the customer or he/she looks up the appropriate number for the customer. If the capability exists, the PIO will forward the call to the appropriate person at the other agency or district. None of the districts leave the customer without direction to where they can obtain the information they are seeking. Again, these inquiries are rarely, if ever, documented. Therefore, it cannot be determined how often these inquiries are being handled by ODOT staff or who within ODOT is handling the inquiries.
Based on the interviews, there appear to be several areas for improvement regarding the current telephone system. Four districts indicated that they would like to have an efficient system that would allow them to document the numerous telephone calls received daily. None of the districts acknowledged CIMS as an efficient system for documenting and tracking the majority of telephone calls they receive. PIOs like the fact that they are able to forward calls to their cell phones so they can be reached when they are out of the office on assignment; however, they reported that it is especially hard to document calls when they are not in the office, and they usually do not have the time to document these inquiries at a later time.
Another issue is that ODOT staff regularly receives telephone calls intended for other districts and regarding issues that are out of their control (e.g., DMV or state permits department). Some suggestions given regarding why ODOT receives these calls include the customer’s inability to find the information he/she needs online and customers being unfamiliar with whom they should talk regarding their questions. ODOT also receives calls from “frequent flyers,” which are either customers that frequently call ODOT to file complaints or elderly customers that may simply want someone to talk to.
Overall, each of the district representatives that were interviewed was pleased with the phone system and acknowledged that it is part of daily work in customer service. Many emphasized that they enjoy speaking with customers on the telephone because it allows them to give more personalized service and ensure that the customer has had a pleasant experience with ODOT.
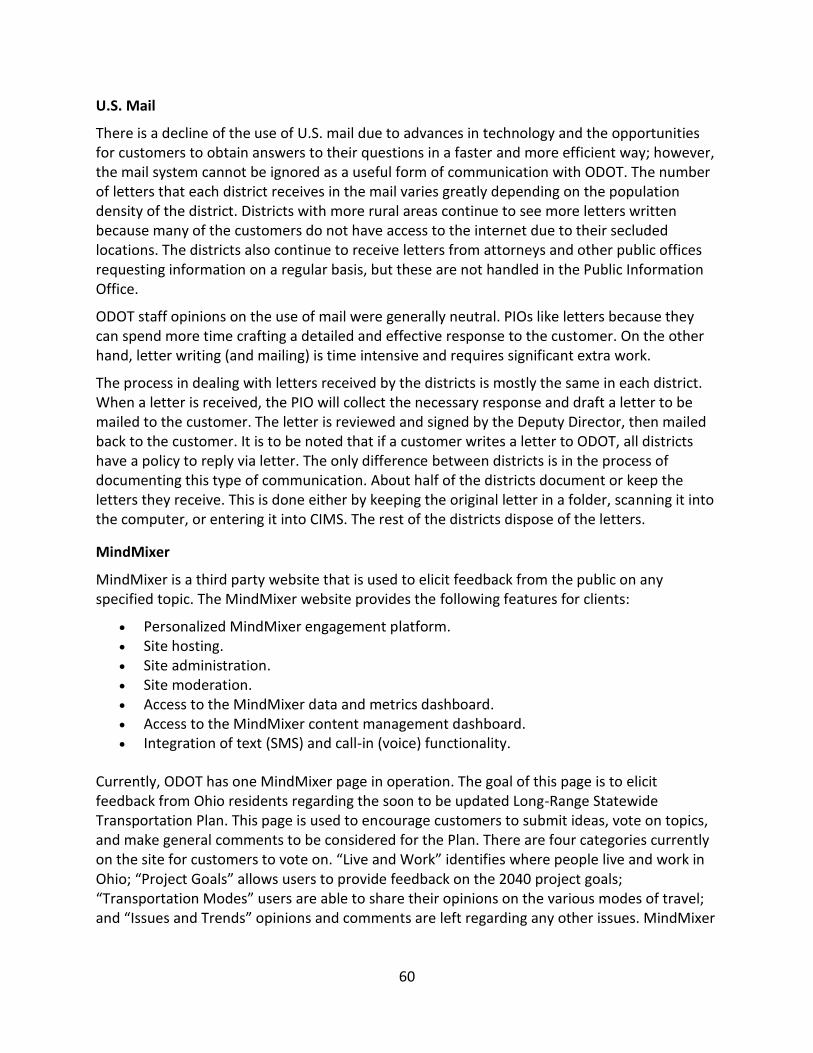
60
U.S. Mail
There is a decline of the use of U.S. mail due to advances in technology and the opportunities for customers to obtain answers to their questions in a faster and more efficient way; however, the mail system cannot be ignored as a useful form of communication with ODOT. The number of letters that each district receives in the mail varies greatly depending on the population density of the district. Districts with more rural areas continue to see more letters written because many of the customers do not have access to the internet due to their secluded locations. The districts also continue to receive letters from attorneys and other public offices requesting information on a regular basis, but these are not handled in the Public Information Office.
ODOT staff opinions on the use of mail were generally neutral. PIOs like letters because they can spend more time crafting a detailed and effective response to the customer. On the other hand, letter writing (and mailing) is time intensive and requires significant extra work.
The process in dealing with letters received by the districts is mostly the same in each district. When a letter is received, the PIO will collect the necessary response and draft a letter to be mailed to the customer. The letter is reviewed and signed by the Deputy Director, then mailed back to the customer. It is to be noted that if a customer writes a letter to ODOT, all districts have a policy to reply via letter. The only difference between districts is in the process of documenting this type of communication. About half of the districts document or keep the letters they receive. This is done either by keeping the original letter in a folder, scanning it into the computer, or entering it into CIMS. The rest of the districts dispose of the letters.
MindMixer
MindMixer is a third party website that is used to elicit feedback from the public on any specified topic. The MindMixer website provides the following features for clients:
Personalized MindMixer engagement platform. Site hosting. Site administration. Site moderation. Access to the MindMixer data and metrics dashboard. Access to the MindMixer content management dashboard. Integration of text (SMS) and call-in (voice) functionality.
Currently, ODOT has one MindMixer page in operation. The goal of this page is to elicit feedback from Ohio residents regarding the soon to be updated Long-Range Statewide Transportation Plan. This page is used to encourage customers to submit ideas, vote on topics, and make general comments to be considered for the Plan. There are four categories currently on the site for customers to vote on. “Live and Work” identifies where people live and work in Ohio; “Project Goals” allows users to provide feedback on the 2040 project goals; “Transportation Modes” users are able to share their opinions on the various modes of travel; and “Issues and Trends” opinions and comments are left regarding any other issues. MindMixer
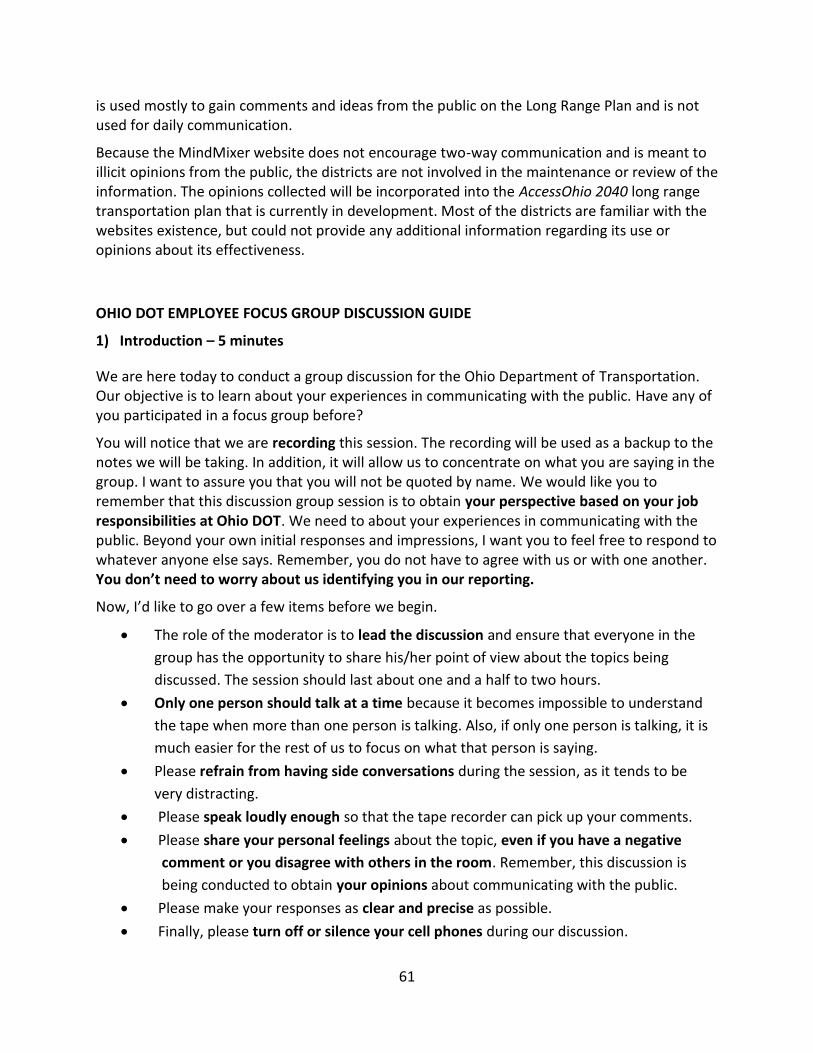
61
is used mostly to gain comments and ideas from the public on the Long Range Plan and is not used for daily communication.
Because the MindMixer website does not encourage two-way communication and is meant to illicit opinions from the public, the districts are not involved in the maintenance or review of the information. The opinions collected will be incorporated into the AccessOhio 2040 long range transportation plan that is currently in development. Most of the districts are familiar with the websites existence, but could not provide any additional information regarding its use or opinions about its effectiveness.
OHIO DOT EMPLOYEE FOCUS GROUP DISCUSSION GUIDE
1) Introduction – 5 minutes
We are here today to conduct a group discussion for the Ohio Department of Transportation. Our objective is to learn about your experiences in communicating with the public. Have any of you participated in a focus group before?
You will notice that we are recording this session. The recording will be used as a backup to the notes we will be taking. In addition, it will allow us to concentrate on what you are saying in the group. I want to assure you that you will not be quoted by name. We would like you to remember that this discussion group session is to obtain your perspective based on your job responsibilities at Ohio DOT. We need to about your experiences in communicating with the public. Beyond your own initial responses and impressions, I want you to feel free to respond to whatever anyone else says. Remember, you do not have to agree with us or with one another. You don’t need to worry about us identifying you in our reporting.
Now, I’d like to go over a few items before we begin.
The role of the moderator is to lead the discussion and ensure that everyone in the
group has the opportunity to share his/her point of view about the topics being
discussed. The session should last about one and a half to two hours.
Only one person should talk at a time because it becomes impossible to understand
the tape when more than one person is talking. Also, if only one person is talking, it is
much easier for the rest of us to focus on what that person is saying.
Please refrain from having side conversations during the session, as it tends to be
very distracting.
Please speak loudly enough so that the tape recorder can pick up your comments.
Please share your personal feelings about the topic, even if you have a negative
comment or you disagree with others in the room. Remember, this discussion is
being conducted to obtain your opinions about communicating with the public.
Please make your responses as clear and precise as possible.
Finally, please turn off or silence your cell phones during our discussion.
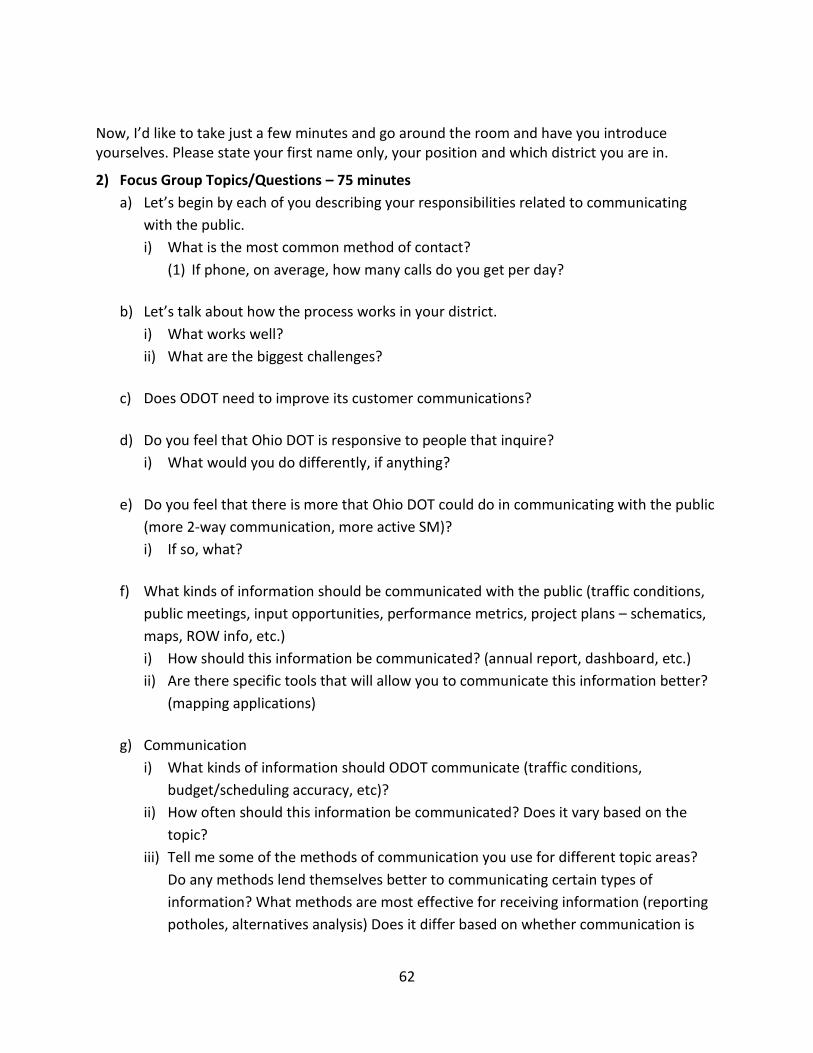
62
Now, I’d like to take just a few minutes and go around the room and have you introduce yourselves. Please state your first name only, your position and which district you are in.
2) Focus Group Topics/Questions – 75 minutes
a) Let’s begin by each of you describing your responsibilities related to communicating
with the public.
i) What is the most common method of contact?
(1) If phone, on average, how many calls do you get per day?
b) Let’s talk about how the process works in your district.
i) What works well?
ii) What are the biggest challenges?
c) Does ODOT need to improve its customer communications?
d) Do you feel that Ohio DOT is responsive to people that inquire?
i) What would you do differently, if anything?
e) Do you feel that there is more that Ohio DOT could do in communicating with the public
(more 2-way communication, more active SM)?
i) If so, what?
f) What kinds of information should be communicated with the public (traffic conditions,
public meetings, input opportunities, performance metrics, project plans – schematics,
maps, ROW info, etc.)
i) How should this information be communicated? (annual report, dashboard, etc.)
ii) Are there specific tools that will allow you to communicate this information better?
(mapping applications)
g) Communication
i) What kinds of information should ODOT communicate (traffic conditions,
budget/scheduling accuracy, etc)?
ii) How often should this information be communicated? Does it vary based on the
topic?
iii) Tell me some of the methods of communication you use for different topic areas?
Do any methods lend themselves better to communicating certain types of
information? What methods are most effective for receiving information (reporting
potholes, alternatives analysis) Does it differ based on whether communication is
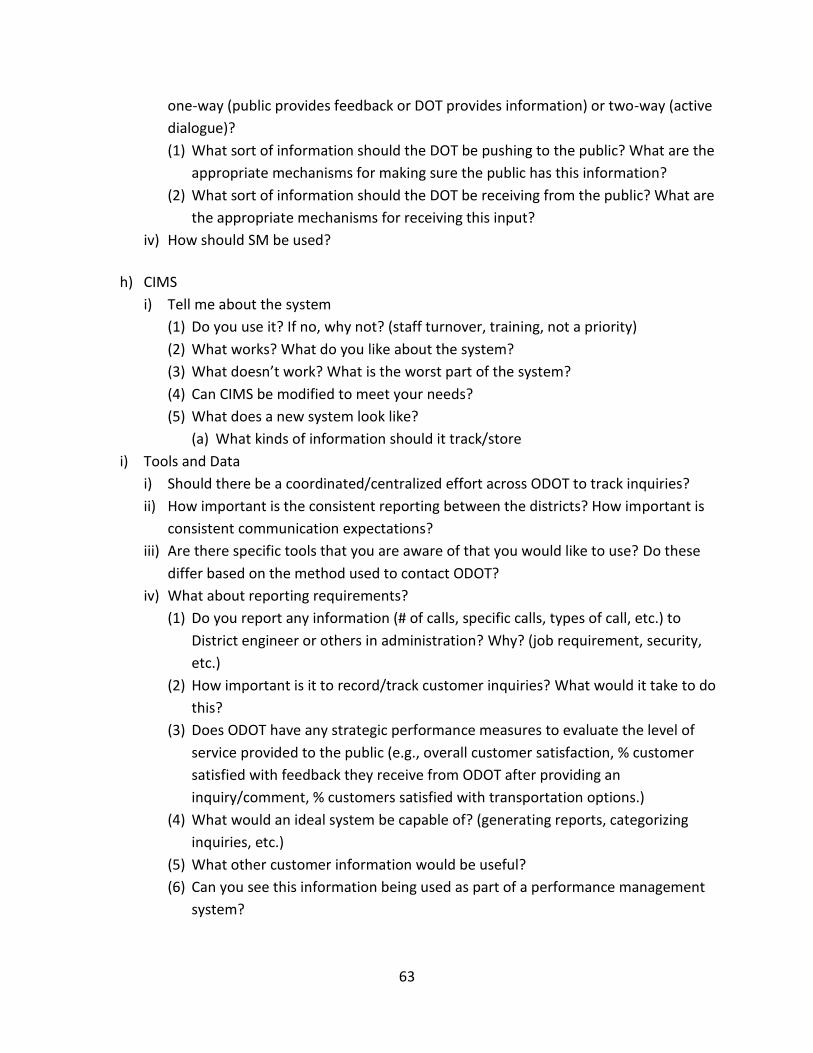
63
one-way (public provides feedback or DOT provides information) or two-way (active
dialogue)?
(1) What sort of information should the DOT be pushing to the public? What are the
appropriate mechanisms for making sure the public has this information?
(2) What sort of information should the DOT be receiving from the public? What are
the appropriate mechanisms for receiving this input?
iv) How should SM be used?
h) CIMS
i) Tell me about the system
(1) Do you use it? If no, why not? (staff turnover, training, not a priority)
(2) What works? What do you like about the system?
(3) What doesn’t work? What is the worst part of the system?
(4) Can CIMS be modified to meet your needs?
(5) What does a new system look like?
(a) What kinds of information should it track/store
i) Tools and Data
i) Should there be a coordinated/centralized effort across ODOT to track inquiries?
ii) How important is the consistent reporting between the districts? How important is
consistent communication expectations?
iii) Are there specific tools that you are aware of that you would like to use? Do these
differ based on the method used to contact ODOT?
iv) What about reporting requirements?
(1) Do you report any information (# of calls, specific calls, types of call, etc.) to
District engineer or others in administration? Why? (job requirement, security,
etc.)
(2) How important is it to record/track customer inquiries? What would it take to do
this?
(3) Does ODOT have any strategic performance measures to evaluate the level of
service provided to the public (e.g., overall customer satisfaction, % customer
satisfied with feedback they receive from ODOT after providing an
inquiry/comment, % customers satisfied with transportation options.)
(4) What would an ideal system be capable of? (generating reports, categorizing
inquiries, etc.)
(5) What other customer information would be useful?
(6) Can you see this information being used as part of a performance management
system?
64
j) Staff needs/wants
i) Is there a need for Ohio DOT to communicate more/different information?
ii) Should Ohio DOT spend resources developing this information?
iii) Is there a need to track customer inquiries?
(1) If so, what methods/tools would be accomplish this?
3) Wrap up – 15 minutes
a) Summarize
b) Hanging issues
c) Thanks
FINDINGS FROM ODOT FOCUS GROUP
PIO Responsibilities
After initial introductions, the group first discussed typical work activities for ODOT PIOs and their staff. Most of those in attendance are PIOs or work in a very similar capacity. Day-to-day activities generally include responding to requests for information from the public, media and elected officials. It appears that most requests coming in to these offices are in the form of e-mails, but up until a few years ago most requests came in the form of phone calls. In some cases districts delineate between regular e-mails and those received through an ODOT web-based form, but not all districts do this. It was unclear from the discussion whether the majority of inquiries are coming from ODOT websites or regular e-mail. Many of those in attendance were also responsible for pushing information, such as road closures and maintenance schedules, to the public. The various methods by which this occurs will be discussed in a subsequent section.
PIOs appear to operate with high level of autonomy with regard to central administration. Most of those in attendance noted that direction on how their offices were to operate generally comes from the district directors and engineers, not central administration. However, one PIO noted that their district has twelve different deputy directors and each has their own priorities. Others noted that they enjoyed significant levels of autonomy even within their own district due to their level of experience.
Workloads vary by the district. One PIO stated that it was “feast or famine” with regard to inquiries and requests for information from the public. For example, during snow season the PIO is flooded with calls and e-mails, but that does not occur during other times of the year.
Some PIOs have undertaken efforts to proactively identify issues pertinent to the public that the department can work to address. One PIO stated that their office conducted a survey with this objective, and one of the most common requests made by respondents was that there be a greater effort placed on speed enforcement. As such, the district office worked with other area governmental entities to increase these activities. That effort was very well received by area residents.
65
Communication
The PIOs in attendance believe that communication with the public is critical for the success of the department. The PIOs also stated that they spend a significant amount of time explaining to people exactly what it is that ODOT does. For example, a lot of Ohio residents do not know that ODOT is not responsible for all roads and is not responsible for the issuance of driver’s licenses.
There is thus a significant need for ODOT to “tell its story.” It was noted that ODOT is among the most “visible and tangible” of state entities, and that there is a lot going on at the department that the public should be aware of. One of the difficulties with this is that a lot of these activities are occurring at the local/district level, and there is an inherent difficulty with translating local activities and initiatives to the state level. This makes it difficult to tell a statewide story. ODOT districts, and particularly those in smaller rural areas, have employees that are part of the community. It is easier for ODOT to tell a story in these areas because people are more likely to know someone that works at ODOT or is more likely to have been personally impacted by an ODOT project or interacted with an ODOT employee. District offices in urban areas do not enjoy this level of visibility, which makes outreach in these areas and the state as a whole more problematic.
It was noted throughout the session that a focus on customer satisfaction needs to permeate all levels of the department, not just the PIO. One of the difficulties with “telling ODOT’s story” is that few outside of the PIO are effective at communicating with the public. ODOT employees may interact with the public at any level of the organization, but not all are trained or comfortable in dealing with the public. Furthermore, many district employees do not communicate effectively with the PIO and their staff. Communication within and between districts is critical from a customer service perspective, as the PIO generally has difficulty in determining if public inquiries are being addressed by the district or person they are assigned to. It is difficult and time consuming for PIOs and their staff to continually have to follow up with individuals in other functional areas to obtain status updates on requests and inquiries. Furthermore, PIOs need to be made aware of inquiries from the public that are fielded by other areas. However, those in attendance were fully aware that other divisions have work to do that does not involve customer service. They are generally doing the actual work of the department in terms of expanding and maintaining the state’s transportation infrastructure, which is perceived as a higher priority than customer service and public information-related activities.
One of the mechanisms that can help ODOT in telling its story is the department’s website. However, the PIOs in attendance did not feel that the department’s existing web presence was effective. It was noted by numerous attendees that the website contains too much information, and that information is not segregated by topic in a manner that allows users to quickly and easily find what they need. The PIOs in attendance stated that they and their staff even have problems finding information on the website. For example, one of the functions that the public mistakenly thinks ODOT is responsible for is the issuance of driver’s licenses and specifically commercial driver’s licenses (CDL). A link to the entity responsible for these functions is provided on the department’s webpage, but that website itself is so poorly organized and confusing that users often resort to calling the district PIO with their inquiry anyway. While,
66
ODOT has no control over another state agency’s website, providing a simple explanation with appropriate contact information may eliminate some calls to the PIOs.
ODOT’s PIOs generally have to utilize all available channels in communicating with the public, media and elected officials, even if those channels are not necessarily the most efficient. One PIO noted that their district covers a predominately rural area of the state and that there are a lot of small market “mom and pop” media outlets like local newspapers. The officer stated that many of these outlets refuse to give up using facsimile transmissions (fax) as a medium for communication, and that the PIO has to be sure to send out all information by fax for those outlets even though it is outdated and inefficient relative to other communication channels like e-mail. Furthermore, it was noted that even when all available channels are used, it is impossible to make sure that everyone who needs to receive the information will. One PIO mentioned that they recently had a “super load” come through their area, and even though they sent out notices through all available channels, people still called the PIO upset that they were unaware when the load came through town and disrupted traffic.
One issue that was cited as a barrier to effective customer service was that the public and media often have differing expectations for what constitutes a reasonable time frame for responsiveness. The media, in particular, often expects information to be provided much faster than the PIO is able to accommodate. This is due in large part to intra-institutional communication issues cited previously. It generally takes more time for complex requests and inquiries to be filtered through to the appropriate division, and it then takes time to verify that the issue has been addressed. Thus, it often appears to the public and media that the DOT is inefficient or, worse, unresponsive.
Proactive Information Provision
One function that is common to all district PIOs is responding to requests for information from the public, but not all districts proactively provide information to the public. Many district PIOs are therefore in a primarily reactive mode, which appeared to be viewed by most in attendance as an unavoidable result of resource shortages.
However, many districts do undertake at least some proactive information provision, essentially pushing information out the public. It was noted by many in attendance that the information provided by the district has to be salient to the intended audience, provided through desirable channels, and well-timed. Consideration must; therefore, be given to identifying what information the public wants to receive and how and when it wants to receive it.
Methods for proactively communicating with the public vary and, as previously noted, in most cases PIOs have to utilize a wide array of communication channels. One PIO stated that whenever they have information they have to get out to the public and media, they must: draft and send e-mails, update the district website, post the information on social media (Twitter and Facebook), and fax the press release to media outlets. It was noted that this is necessary because different audiences desire different communication channels, and all must be accommodated. One PIO did note that they had undertaken a review of where most requests for information where coming from, and had determined that most inquiries came from the media. This PIO then contacted area media outlets and asked them to take a survey on their
67
preferred communication channels. The majority of outlets stated that they preferred to get information from the district through social media. Therefore more resources are dedicated to communicating through social media.
The PIOs noted that the information the public wants to receive is generally personal in nature: people want to know how ODOT will be directly affecting them. This means that the most desirable information tends to be things like maintenance and construction notifications; which directly impact people’s travel. The PIOs felt that information presented from a statewide perspective, such as the percentage of projects completed on time and on budget, is generally of little interest to the public. This does not mean that the state should not undertake the development of project dashboards and other applications that convey such information, but it is not the type of information that the public necessarily wants to have pushed by the department. Several PIOs also felt this information was too complicated for the public to understand.
As previously noted, the PIOs in attendance stated that the public desires information on DOT activities that will directly impact them. As such, they were asked if it was important to provide detailed information on specific projects, such as technical plans and engineering schematics. The PIOs in attendance felt that this level of detail would be unnecessary. Part of their job already is to translate technical engineering work into layman’s terms in response to public inquiries, and proactively pushing such information would unnecessarily confuse the public. Several PIOs stated that it is better to actively identify what information on a specific project the public wants to hear about as opposed to providing a lot of unnecessary technical detail. One attendee stated that their office had contacted landowners in advance of various maintenance and major construction projects and asked them to take a survey, which was aimed at identifying the aspects of the project they were most interested in. In general the public is most interested in hearing about how long construction of a particular project will take, how it will affect their travel time, and any available alternate routes.
Examples of proactive communication efforts undertaken by district PIOs include:
Buckeye Traffic – This website contains information on construction information in map
form. Not everyone in the district is aware of the site, and when drivers find out about it
they are generally very pleased it.
Informational Videos – Some districts produce informational videos on general roadway
issues or DOT activities. For example, one district noted that it had produced a well-
received video on work zones and the operation of contra-flow lanes.
SOCIAL MEDIA
Social media is being increasingly used by PIOs for both proactive and reactive communication with the public. The PIOs who utilize social media outlets such as Twitter and Facebook stated that the public views these tools as being more accessible and quicker in terms of getting a response or resolution to their specific issue. PIOs observed that the use of social media by the public is generational, and that younger customers are more likely to rely on these channels. Greater effort should therefore be dedicated to expanding the social media presence of ODOT’s
68
various districts as it is likely that more and more customers will utilize these channels as the driving population ages.
PIOs who use social media found it to be particularly useful in providing critical, time-sensitive information such as storm warnings and road closures. Social media allows such information to be immediately available and visible through a number of communication devices.
The PIOs were supportive of allocating more resources to the monitoring and maintenance of the department’s social media outlets. However, most PIOs repeatedly brought up resource and staffing shortages that dictated the allocation of personnel to other activities.
CIMS
A major topic of discussed in focus group session was utilization by district PIOs of the Customer Inquiry Management System (CIMS) system. It was developed as a tool for managing customer service functions but is not used to a great extent by ODOT district PIOs. There were a few focus group participants that indicated that they used the system for the tracking of certain types of public inquiries and requests, but there were no districts that stated that they used the system for the tracking of all of these activities. One PIO representative stated that they were told to “stay away” from the system when they joined the office.
What is CIMS Used For?
Every district in attendance stated that they used CIMS for something, but the level to which they utilized the system varied significantly. Only one district indicated that they had at some point used CIMS extensively. This district noted that that they used it “for everything,” and that information was entered into the system by interns. However, this individual stated that this was not the case anymore, but did not elaborate as to why exactly CIMS was not used to the extent that it previously was. A lack of staffing was generally noted by attendees as one reason for low CIMS utilization. These PIOs stated that they often did not have the requisite staff to teach new employees how to use the system.
CIMS is used intermittently by a few districts for various public information efforts. One district noted that it used CIMS for the tracking of complex requests that might not be easily addressed and might require follow-up, such as drainage or right-of-way related issues. A couple of districts also noted that they use CIMS to log open records requests. In general, CIMS appears to be used mostly for record-keeping in terms of simply logging and cataloguing requests and inquiries received by the PIO. However, the sentiment that CIMS is useful for records-keeping was not at all universal, as most PIOs have adopted other record-keeping strategies that will be discussed in subsequent sections of this report.
One district stated that the CIMS system was useful in terms of cataloguing repeated requests received from the public. This representative stated that they had “frequent flyers” who would contact the PIO on a regular basis, and that CIMS allowed the PIO and their staff to look at what issues had been identified by these individuals in the past. Another district stated that they had one frequent flyer who would request a number be assigned to their information requests so that they could check back to check on status, and that CIMS was useful for that.
69
Why is CIMS Not Used?
CIMS appears to be best suited for tracking requests submitted through correspondence or e-mail; not telephone requests. A primary reason behind this is that the system is time-consuming, and issues submitted to the PIO through the telephone can often be resolved in far less time that in takes to input the request into CIMS. One example that was cited by several of those in attendance was travelers calling the PIO office to see if a certain road would be open. This information can be obtained and relayed to the requestor in less than a minute, and it does not make sense to then spend another five to seven minutes logging the request into CIMS. One PIO estimated that about 80 percent of the calls they receive are addressed this quickly and simply.
Another reason that CIMS does not appear to be widely used is that there is a lack of support for the system elsewhere within ODOT. One PIO noted that there seemed to be a stronger focus on supporting the CIMS system upon its initial introduction, and that that this focus led to greater utilization by all PIOs. This person stated that at one time CIMS had a dedicated IT group and programmer, and that during that time the system worked well and was useful. However, these resources were allocated elsewhere or discontinued, and after that the system “started floundering.”
Another significant issue cited with CIMS is that not everyone in the district offices who might take a call from a customer uses the system. Several PIO’s noted that district engineers often get contacted directly by citizens, and that they are either unaware of the CIMS system or choose not to enter the requisite information when a request or inquiry is fielded. It was noted repeatedly that if CIMS is to be effective, others outside of PIO operations will have to be trained to use the system. For example, county time keepers, which work in the district maintenance offices, were cited repeatedly as individuals in need of training.
In addition to the broader discussion about why CIMS was not used to a great extent by PIOs, several attendees made comments about specific peculiarities with the system that, while not major contributing factors to non-use of the system, nonetheless made it more difficult to use. These included:
A name has to be entered for each record – Several noted that they are not required to
get a name or contact information from those who contact their office, yet CIMS
requires a name to be entered in order to generate a record. One PIO stated that they
insert their district number in the name field, while another stated that their staff often
just made up names.
System generated e-mails – The CIMS system often generates automatic e-mails to
those who are responsible for the answer and a record is generated in CIMS as a result
of that contact. When district employees unfamiliar with CIMS receive these emails they
are not sure what to do or how the email was generated.
Apostrophes not accepted – One attendee noted that system does not accept
apostrophes. If one is inadvertently entered then CIMS will reject the inputted record,
forcing the data entry person to go back and reenter the information.
70
Difficult to tell if issues have been resolved – One attendee noted that it would be very
helpful to incorporate a feature that allowed users to determine whether cases in the
database had been resolved. Users can run queries and generate lists of outstanding
requests but there is not a high level of confidence in the accuracy of these reports
Tools
There appears to be a disconnect between the district PIOs and ODOT central administration regarding the use and availability of tools for public communication and input or the tracking of customer service data. The PIOs were generally only aware of CIMS as a centralized system for such activities. For example, none of the PIOs in attendance were aware that the “Mindmixer” web-based forum application had been used in a recent long-range planning initiative. In fact, forums were not cited as a tool used for public communication by any of the PIOs in attendance.
Some PIOs have developed their own systems for the tracking and logging of public information requests. One PIO noted that they use forms on a SharePoint site to manage the volume of calls they receive at their office. This person stated that the SharePoint site was especially useful in managing requests from the media.
Another attendee stated that they try to input all phone calls they receive into the form of an e-mail. These are then filed digitally with regular e-mails that then are organized based on various identifiers. The attendee stated that they can then simply search through their e-mail file to obtain information on most requests submitted to their district. This particular attendee noted that they do not generally use CIMS and that this method is oriented first and foremost around efficiency and “getting things done.”
Attendees stated that they would like to have access to more data and communication tools. For example, as previously noted, many of the districts have to rely on several different communication channels in order to get information out to the public, which can be time consuming. These PIOs stated that some sort of application that allows information to be simultaneously transmitted on these channels would be desirable. A couple of PIOs stated that they had looked into “Nixel” as a possible option for this, as they had seen it demonstrated at a Department of Public Safety-sponsored symposium. However, they had never been able to get more information on how to join the service. One attendee noted that they had set up some simple routines that allowed information to at least be simultaneously transmitted on social media. Another PIO mentioned that their office has looked into utilizing “Hootsuite,” a social media management dashboard application.
One popular suggestion for communication with the public was live chats. Many of those in attendance had used such chats in their personal lives and found them to be useful and rewarding. PIOs recognized, however, that this is more labor intensive than other communication options, and would only be useful when DOT employees were available during working hours.
One PIO noted that a new Equipment Inventory Maintenance System (EIMS) is being developed for use by area maintenance offices. It will incorporate a hand-held device that will be used to
71
collect information while in the field on various maintenance activities. This attendee suggested that the system be modified such that field personnel can take pictures of reported maintenance issues prior to and following the work to be done. This would allow for visual verification that issues reported by the public are being addressed. A direct interface with a customer inquiry system would make this even more useful, similar to many “report a pothole”-type applications used by cities across the country.
Regardless of the tools that are eventually provided, the PIOs in attendance noted that the tools themselves cannot become a primary focus of attention by their staff such that other job functions lose priority. It is also important to ensure that any communication protocols adopted by the department not conflict with public policy objectives. For example, it was noted that the department actively seeks to discourage distracted driving. As such, it might be imprudent to utilize a messaging system that sends out text messages, as drivers might be tempted to look at their phones while driving.
Data, Metrics and Performance Measures
All of the PIOs in attendance use some form of tracking for at least some of the requests they receive through their office. The current CIMS system is not widely used, for reasons discussed previously, and most PIOs have developed their own unique systems for tracking public requests and inquiries. However, these activities are not undertaken out of a need to provide metrics and statistics on PIO activities to superiors. Regardless of their autonomy from either central administration or their district directors, the PIOs in attendance stated that they were not generally held accountable by either their district directors/engineers or central administration for the volume of calls and requests that they receive and process as long as things run smoothly
Those in attendance did not feel that it was necessary to justify their job performance by providing metrics on the number of requests handled in their offices to their superiors. Rather, tracking activities are undertaken out of simple necessity, as the sheer volume of requests received requires some form of record-keeping. PIOs see their primary job as being responsive to their customers, in this case the residents of Ohio, and systems for tracking public inquiries and requests help to fulfill that goal. However, many in attendance did feel that it would be good to have mechanisms in place to show that their offices are busy while remaining responsive, but noted that divergent practices among districts and central administration with regard to record-keeping preclude the ability to develop consistent metrics.
There was a significant level of discussion regarding the fact that tracking and metrics do not necessarily mean that a PIO and their office is doing a good job. The volume and nature of calls or e-mails received and catalogued does not give any indication as to the quality of the response provided by the department. In this sense, tracking activities and metrics can, at best, be viewed as an indicator of workload; not performance. Furthermore, it was noted on several occasions that in many cases the work being requested by the public was completely out of the hands of the PIO. They could only pass the information along to the relevant section, such as maintenance, and then check back to verify if the work was completed. As such, it would be
72
difficult and unreasonable to hold the PIO accountable to any measures oriented around customer satisfaction with issue resolution.
There was brief discussion about the difficulty in even finding ways to determine departmental success. One PIO noted that it is difficult to benchmark the activities of a DOT and its public information office against that of a customer service center for a private entity, primarily because there is not an actual good or service being sold. And it is just difficult to benchmark against other public sector entities such as utility providers. The “goods” and “services” provided by the DOT are abstract and difficult to quantify, and service quality is thus more difficult to determine.
SUMMARY
Interviews with ODOT Staff
Based on the responses obtained through the interviews with ODOT, it is apparent that a user-friendly, centralized system that will assist PIOs in their daily duties in communicating with customers via a variety of portals is needed. Inconsistency within districts, a lack of documentation, and nonexistent process uniformity throughout ODOT has made it difficult to analyze and track inquiries to improve customer service. A more consistent approach throughout ODOT that would allow for data to be analyzed centrally could allow ODOT to implement strategies and training that could lead to improved customer satisfaction.
The most apparent roadblock to this centralized system is the buy-in from the districts due to the general distaste for CIMS. Mandating the use of the system as well as training could help to ensure the use of a comprehensive system. Another roadblock to a centralized system is accommodating inquiries that can be easily and immediately resolved. Telephone inquiries and inquiries made via the web feedback form are the least likely to be documented if the issue is quickly resolved, which indicates that the proposed system must be easy to use so that documenting simple inquiries is not seen as cumbersome or unnecessary.
Social media is seen as the most beneficial form of communication, and the districts expressed a need for increased usage of this portal; however, updating social media sites can be a full-time task that all districts are not necessarily staffed to handle. Being able to incorporate social media site updates into a centralized communications system could allow for more frequent posts to keep the customers informed.
As reported by the districts, the majority of telephone inquiries are never documented, making it impossible to do a detailed assessment of the reasons for these customer inquiries.
Overall, the districts responded positively when introduced to the concept of a centralized system that would be able to incorporate all portals into a centralized location and be able to track and report on inquiries.
ODOT Focus Group
The focus group session with ODOT PIOs produced the following conclusions regarding ODOT’s current customer service-related activities and the tools used to carry out those activities.
“Customer service” needs to be better defined and articulated
73
It is apparent that most of the day-to-day activities undertaken by ODOT public information offices involve direct communication with the public, media and public officials. However, the provision of information to these groups does not necessarily constitute “customer service,” as most of the focus group participants believe that customer service includes more than just providing information to the public and fielding requests and inquiries regarding DOT activities. It also includes ensuring that issues identified by the public are resolved in a timely and satisfactory manner. However, there are currently no metrics or tracking mechanisms for use by public information officers to determine whether issues have been resolved in a satisfactory manner; only that issues have been received and processed by the public information office. Furthermore, there appear to be no directives from leadership at the district or central administration level regarding the quality with which issues identified by the public are to be resolved. If ODOT is going to improve its level of customer service, it must define what customer service activities entail and articulate metrics for the assessment of customer service quality and ultimately the performance goals that indicate success.
There is a need for a comprehensive customer service focus by the department as a whole.
A recurring theme throughout the session was that customer service functions cannot be fulfilled solely by ODOT’s public information offices and that a greater emphasis on customer service, however it is eventually defined, is needed from all divisions within the department. District public information offices are generally unable to fulfill requests made by the public and media outside of simple information provision. They are unable to fill potholes, fix guardrails, remove debris from the roadway, or any other such activities that require action by departmental field agents. Furthermore, the public and media often bypass public information offices in making requests and inquiries of the department. Maintenance workers are often approached in the field by the public, and district engineers are often contacted directly about critical matters. As such, a significant amount of what might be considered customer service-related work is being done outside of the purview of the public information office. Whatever definition of customer service is eventually adopted by the department, it needs to be communicated to all divisions within the department. Furthermore, whatever systems are eventually adopted to achieve desired levels of customer service quality must be utilized by all divisions that interact directly with the public.
Internal ODOT communication needs improvement.
The focus group session showed that there is a significant disconnect in terms of communication between district public information offices and central administration and even between public information offices and the districts they operate within. Districts are often unaware of initiatives by central administration and, when they are aware, are often unclear as to the ultimate goal of these initiatives. In fact, many of the focus group participants were unaware of where this research effort initiated and how the results would be used. Most were also unaware of central administration efforts at improving the department’s customer service functions. If area public information offices are to fulfill the requirements of departmental initiatives then more effort will be needed to communicate with district offices. Greater involvement by these employees will improve the process by allowing them to take ownership of the process and thereby increase their interest in a successful outcome.
74
ODOT needs to identify what information the public wants from the department.
Not all information that can potentially be generated by the department for public use is necessarily salient to the public. As was noted throughout this report, public information staffing resources are already strained, so the provision of information to the public must be done in a strategic manner. District offices have, in some cases, identified the type of information that the public is most interested in receiving at the local/regional level, but communication on statewide issues is more problematic. For example, focus group participants indicated that information related to the department’s performance in completing projects on time and on budget may be important to provide, it is not necessarily critical and salient to all ODOT customers. However, there are likely certain aspects of ODOT performance that are salient at certain times. The method by which that information is communicated is also important. For example, it is unlikely that departmental performance is as important to the public as road closures, and thus might not be appropriate for communication channels better suited for time sensitive information. Therefore, a greater effort needs to be dedicated to determining what information the public wants and how it wants to receive it.
Any new tools developed and adopted by ODOT for customer service activities should be oriented around achieving quality in customer service and not increase workloads.
Focus group participants recognized that there are likely numerous tools that could be deployed in order to improve the department’s customer service activities. However, it will be important that any new tools developed not unnecessarily burden staff. Existing systems such as CIMS require a great deal of effort from public information office staff but do not yield a corresponding benefit for that effort. Furthermore, it is also important that any new tools be utilized to improve the agency’s customer service performance and not serve as simply a means of gathering data. Tracking of public requests for information and other inquiries must be done with an overall goal for improving performance. These measures and metrics should then be used in departmental decision-making and resource allocation. A recurring theme in these discussions was that the department should not impose customer tracking practices simply for the sake of record keeping. The information must be used towards some greater purpose.
75
Appendix B - Analysis of ODOT Customer Feedback Data
WEB FEEDBACK DATA
For the specific purpose of this study, ODOT archived all inquiries via the feedback form from June 27, 2012 to October 22, 2012. The total number of inquiries archived during this time period was 587. Outside of the inquiries archived during this period, no other data regarding the inquiries via the feedback form are available because the feedback form currently does not have a database that collects and stores these inquiries. However, some districts do enter the inquiries from the feedback form into CIMS, which will be addressed later in the CIMS section.
An initial look at the 587 inquiries showed that the inquiries/comments submitted via the web feedback form fell into the following categories, as selected by the customer submitting the form online:
150 inquiries for “Report safety concerns or hazard.”
83 inquiries regarding “Highway projects.”
53 inquiries regarding the Buckeye Traffic Website.”
17 inquiries regarding “Rest areas.”
16 inquiries regarding “Web cameras.”
10 inquiries regarding “Road and weather information.”
4 inquiries regarding “Contracts and bidding information.”
2 inquiries regarding “Maps.”
1 inquiry regarding “Snow and ice operations.”
250 inquiries classified as “Other.”
A closer examination of the data showed a much wider range of topics of communications than those listed above, which is simply a function of the pre-selected categories available to customers when submitting the form, as these are the only subjects available to the customer. In addition, many customers selected an inappropriate subject when examining their comments in more detail, which is a function of their understanding of transportation and the workings of the DOT, but an important note to make when considering any future redesign of the feedback form.
An in-depth analysis was conducted on the inquiries that were submitted between August 22 and October 22, 2012 – a total of 337 inquiries during this 2-month time period. Each comment was read in detail and classified into a primary topic category, as well as one or more secondary topic categories, if appropriate. Table 12 shows the classification of the 337 inquiries. The inquiries were classified into 23 primary topics and an “other” topic, as well as into one or more subtopics. The table shows the number of inquiries that fell into each of the 23 primary topic areas, as well as the percentage of the total inquiries.
Arguably, this was a subjective analysis, and inquiries could have been classified any number of different ways. This is just one classification scheme, and it could be adjusted by collapsing or splitting primary topic areas, making subtopic areas their own primary topic, or moving primary topics as subtopics. What is important about the table is that it represents the wide variety of
76
topics that are being communicated to ODOT through the feedback form, and that by having some type of classification scheme, whatever it may be, ODOT would be able to quickly analyze the topics of feedback received from customers via the web portal.
One finding interesting to note is that there were 100 inquiries requesting continuation of the Recreational Trails Program (RTP) in Ohio during the 2-month period analyzed. The recently signed legislation, Moving Ahead for Progress in the 21st Century Act (Map 21), continues the RTP but gave states the option to “opt out” of the program. The deadline for states to make their decisions was September 1, 2012. These 100 inquiries regarding the RTP came through the ODOT web feedback form in a three-week period between August 24 and September 14, 2012. The majority of the inquiries were a standard form letter requesting that ODOT continue in the Program. So while the RTP inquiries represent a plurality of the 337 inquiries analyzed, this finding is a result of the time period for the analysis and is not representative of a typical frequency of these types of inquiries.
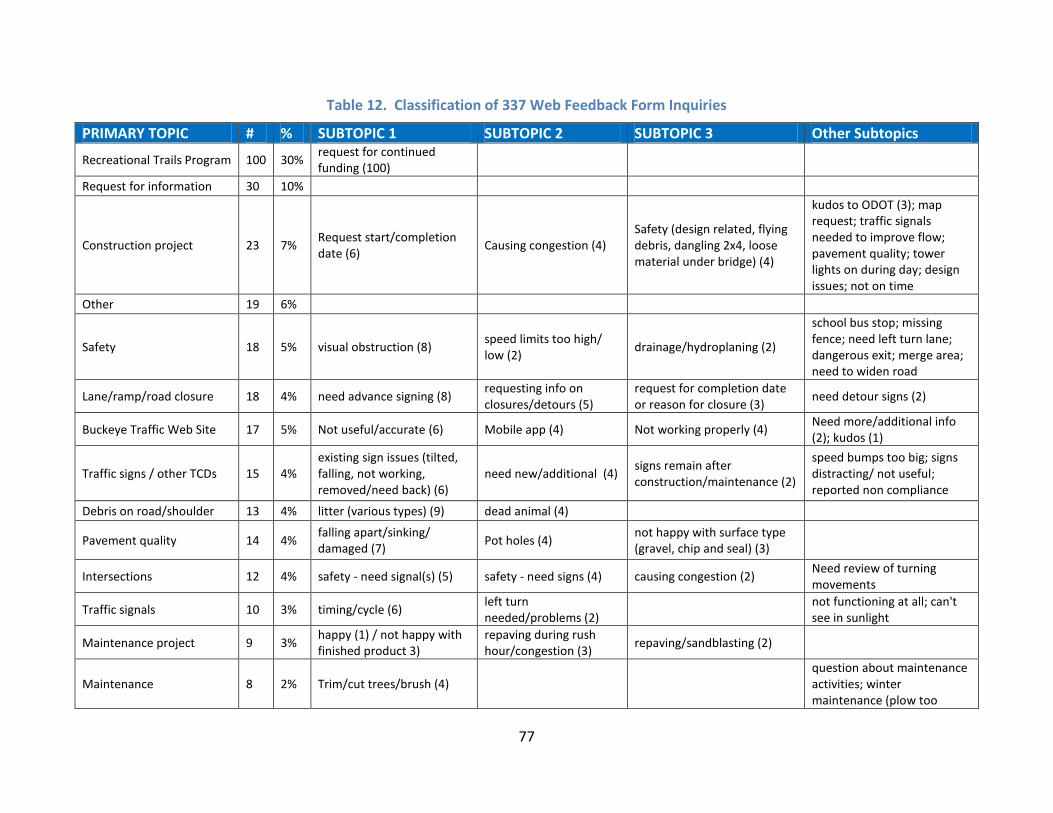
77
Table 12. Classification of 337 Web Feedback Form Inquiries
PRIMARY TOPIC # % SUBTOPIC 1 SUBTOPIC 2 SUBTOPIC 3 Other Subtopics
Recreational Trails Program 100 30% request for continued funding (100)
Request for information 30 10%
Construction project 23 7% Request start/completion date (6)
Causing congestion (4) Safety (design related, flying debris, dangling 2x4, loose material under bridge) (4)
kudos to ODOT (3); map request; traffic signals needed to improve flow; pavement quality; tower lights on during day; design issues; not on time
Other 19 6%
Safety 18 5% visual obstruction (8) speed limits too high/ low (2)
drainage/hydroplaning (2)
school bus stop; missing fence; need left turn lane; dangerous exit; merge area; need to widen road
Lane/ramp/road closure 18 4% need advance signing (8) requesting info on closures/detours (5)
request for completion date or reason for closure (3)
need detour signs (2)
Buckeye Traffic Web Site 17 5% Not useful/accurate (6) Mobile app (4) Not working properly (4) Need more/additional info (2); kudos (1)
Traffic signs / other TCDs 15 4% existing sign issues (tilted, falling, not working, removed/need back) (6)
need new/additional (4) signs remain after construction/maintenance (2)
speed bumps too big; signs distracting/ not useful; reported non compliance
Debris on road/shoulder 13 4% litter (various types) (9) dead animal (4)
Pavement quality 14 4% falling apart/sinking/ damaged (7)
Pot holes (4) not happy with surface type (gravel, chip and seal) (3)
Intersections 12 4% safety - need signal(s) (5) safety - need signs (4) causing congestion (2) Need review of turning movements
Traffic signals 10 3% timing/cycle (6) left turn needed/problems (2)
not functioning at all; can't see in sunlight
Maintenance project 9 3% happy (1) / not happy with finished product 3)
repaving during rush hour/congestion (3)
repaving/sandblasting (2)
Maintenance 8 2% Trim/cut trees/brush (4)
question about maintenance activities; winter maintenance (plow too
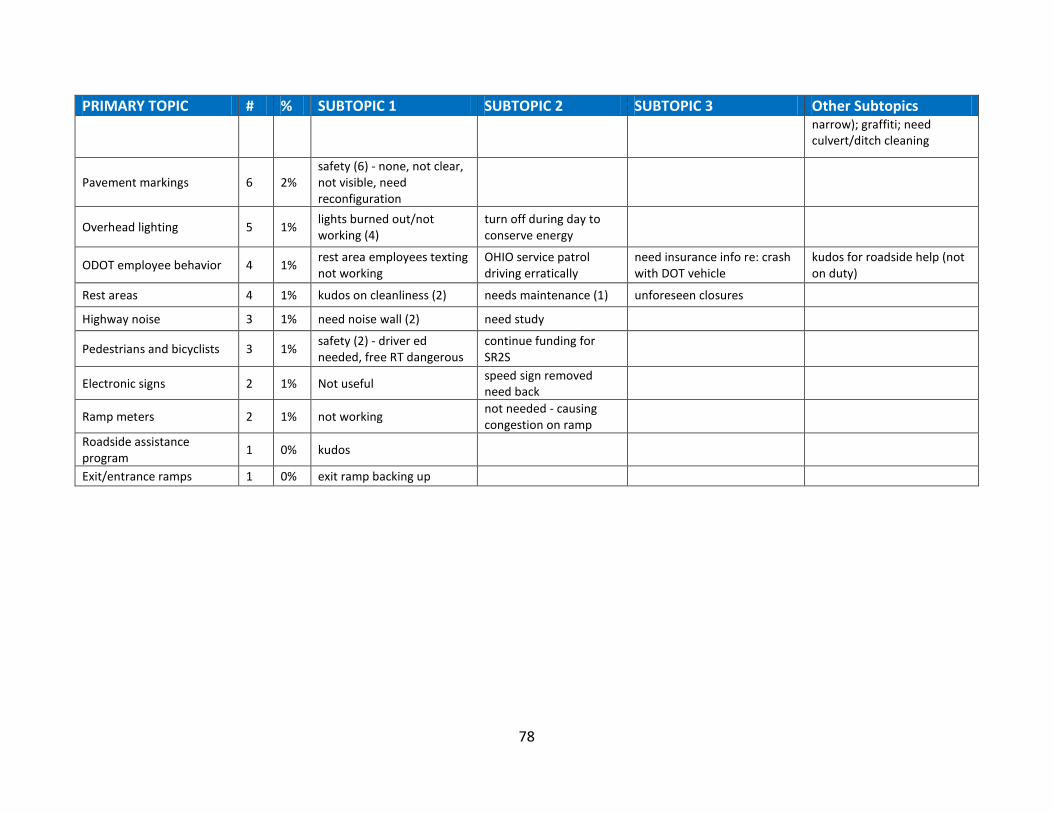
78
PRIMARY TOPIC # % SUBTOPIC 1 SUBTOPIC 2 SUBTOPIC 3 Other Subtopics narrow); graffiti; need culvert/ditch cleaning
Pavement markings 6 2% safety (6) - none, not clear, not visible, need reconfiguration
Overhead lighting 5 1% lights burned out/not working (4)
turn off during day to conserve energy
ODOT employee behavior 4 1% rest area employees texting not working
OHIO service patrol driving erratically
need insurance info re: crash with DOT vehicle
kudos for roadside help (not on duty)
Rest areas 4 1% kudos on cleanliness (2) needs maintenance (1) unforeseen closures
Highway noise 3 1% need noise wall (2) need study
Pedestrians and bicyclists 3 1% safety (2) - driver ed needed, free RT dangerous
continue funding for SR2S
Electronic signs 2 1% Not useful speed sign removed need back
Ramp meters 2 1% not working not needed - causing congestion on ramp
Roadside assistance program
1 0% kudos
Exit/entrance ramps 1 0% exit ramp backing up
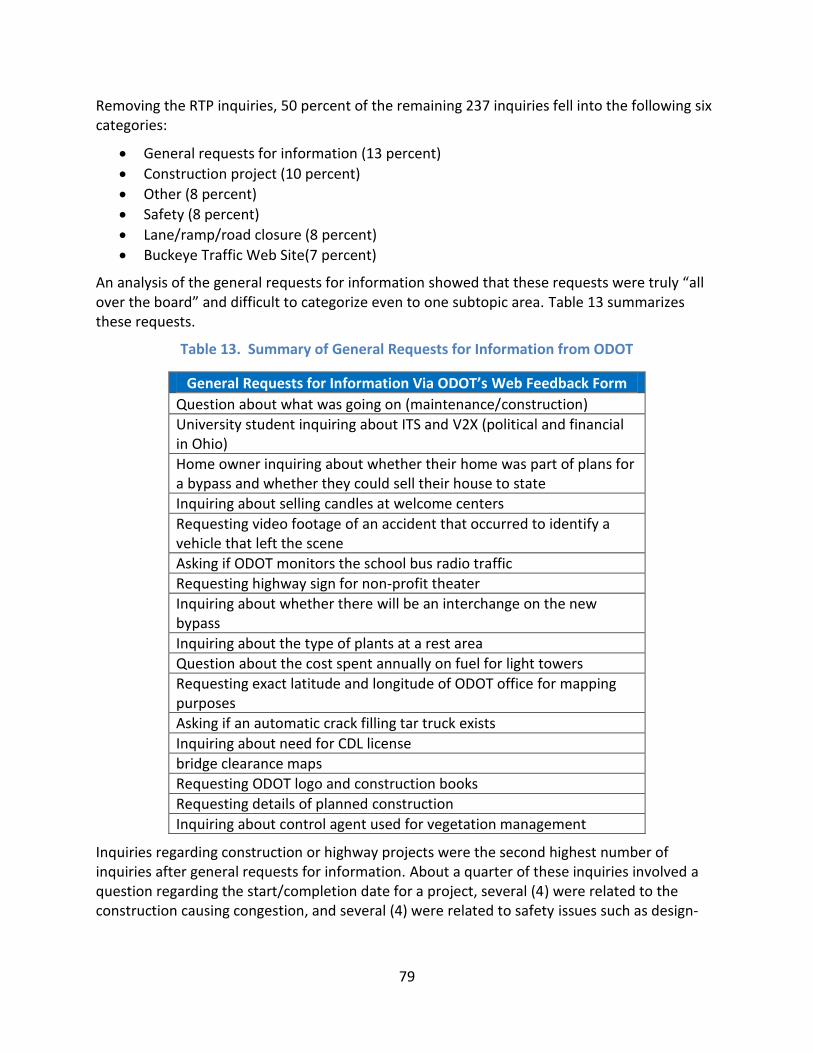
79
Removing the RTP inquiries, 50 percent of the remaining 237 inquiries fell into the following six categories:
General requests for information (13 percent)
Construction project (10 percent)
Other (8 percent)
Safety (8 percent)
Lane/ramp/road closure (8 percent)
Buckeye Traffic Web Site(7 percent)
An analysis of the general requests for information showed that these requests were truly “all over the board” and difficult to categorize even to one subtopic area. Table 13 summarizes these requests.
Table 13. Summary of General Requests for Information from ODOT
General Requests for Information Via ODOT’s Web Feedback Form
Question about what was going on (maintenance/construction)
University student inquiring about ITS and V2X (political and financial in Ohio)
Home owner inquiring about whether their home was part of plans for a bypass and whether they could sell their house to state
Inquiring about selling candles at welcome centers
Requesting video footage of an accident that occurred to identify a vehicle that left the scene
Asking if ODOT monitors the school bus radio traffic
Requesting highway sign for non-profit theater
Inquiring about whether there will be an interchange on the new bypass
Inquiring about the type of plants at a rest area
Question about the cost spent annually on fuel for light towers
Requesting exact latitude and longitude of ODOT office for mapping purposes
Asking if an automatic crack filling tar truck exists
Inquiring about need for CDL license
bridge clearance maps
Requesting ODOT logo and construction books
Requesting details of planned construction
Inquiring about control agent used for vegetation management
Inquiries regarding construction or highway projects were the second highest number of inquiries after general requests for information. About a quarter of these inquiries involved a question regarding the start/completion date for a project, several (4) were related to the construction causing congestion, and several (4) were related to safety issues such as design-
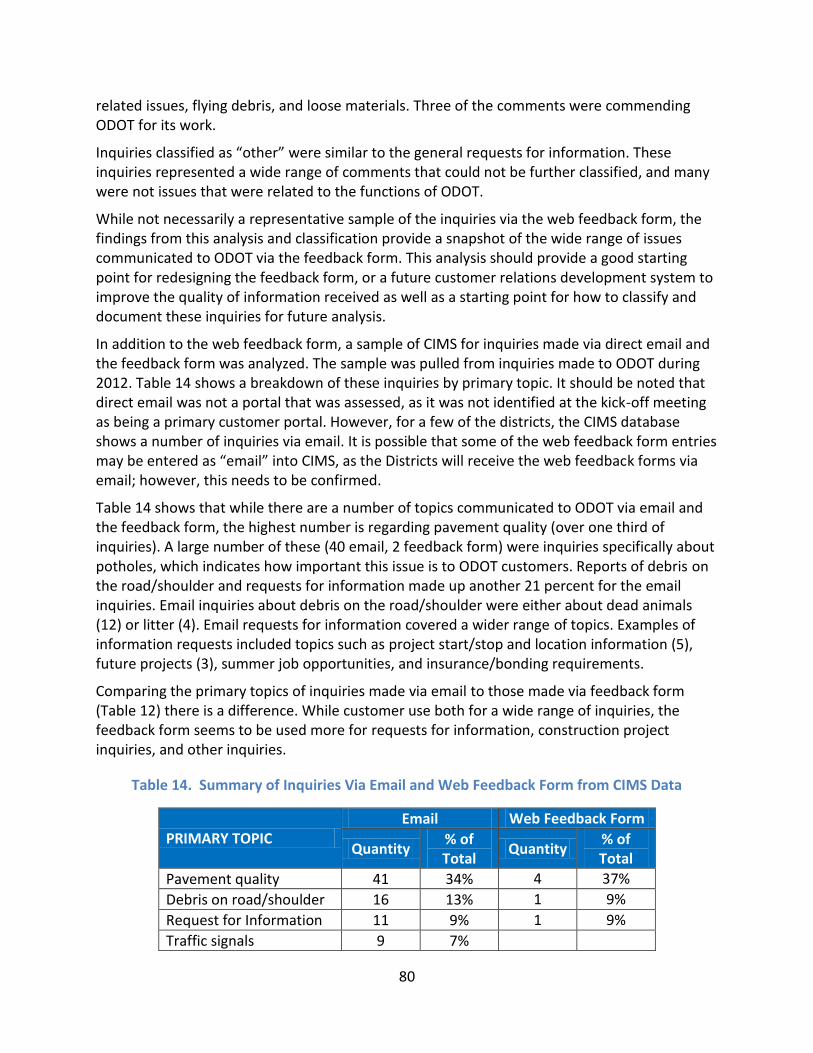
80
related issues, flying debris, and loose materials. Three of the comments were commending ODOT for its work.
Inquiries classified as “other” were similar to the general requests for information. These inquiries represented a wide range of comments that could not be further classified, and many were not issues that were related to the functions of ODOT.
While not necessarily a representative sample of the inquiries via the web feedback form, the findings from this analysis and classification provide a snapshot of the wide range of issues communicated to ODOT via the feedback form. This analysis should provide a good starting point for redesigning the feedback form, or a future customer relations development system to improve the quality of information received as well as a starting point for how to classify and document these inquiries for future analysis.
In addition to the web feedback form, a sample of CIMS for inquiries made via direct email and the feedback form was analyzed. The sample was pulled from inquiries made to ODOT during 2012. Table 14 shows a breakdown of these inquiries by primary topic. It should be noted that direct email was not a portal that was assessed, as it was not identified at the kick-off meeting as being a primary customer portal. However, for a few of the districts, the CIMS database shows a number of inquiries via email. It is possible that some of the web feedback form entries may be entered as “email” into CIMS, as the Districts will receive the web feedback forms via email; however, this needs to be confirmed.
Table 14 shows that while there are a number of topics communicated to ODOT via email and the feedback form, the highest number is regarding pavement quality (over one third of inquiries). A large number of these (40 email, 2 feedback form) were inquiries specifically about potholes, which indicates how important this issue is to ODOT customers. Reports of debris on the road/shoulder and requests for information made up another 21 percent for the email inquiries. Email inquiries about debris on the road/shoulder were either about dead animals (12) or litter (4). Email requests for information covered a wider range of topics. Examples of information requests included topics such as project start/stop and location information (5), future projects (3), summer job opportunities, and insurance/bonding requirements.
Comparing the primary topics of inquiries made via email to those made via feedback form (Table 12) there is a difference. While customer use both for a wide range of inquiries, the feedback form seems to be used more for requests for information, construction project inquiries, and other inquiries.
Table 14. Summary of Inquiries Via Email and Web Feedback Form from CIMS Data
PRIMARY TOPIC Email Web Feedback Form
Quantity % of Total
Quantity % of Total
Pavement quality 41 34% 4 37%
Debris on road/shoulder 16 13% 1 9%
Request for Information 11 9% 1 9%
Traffic signals 9 7%
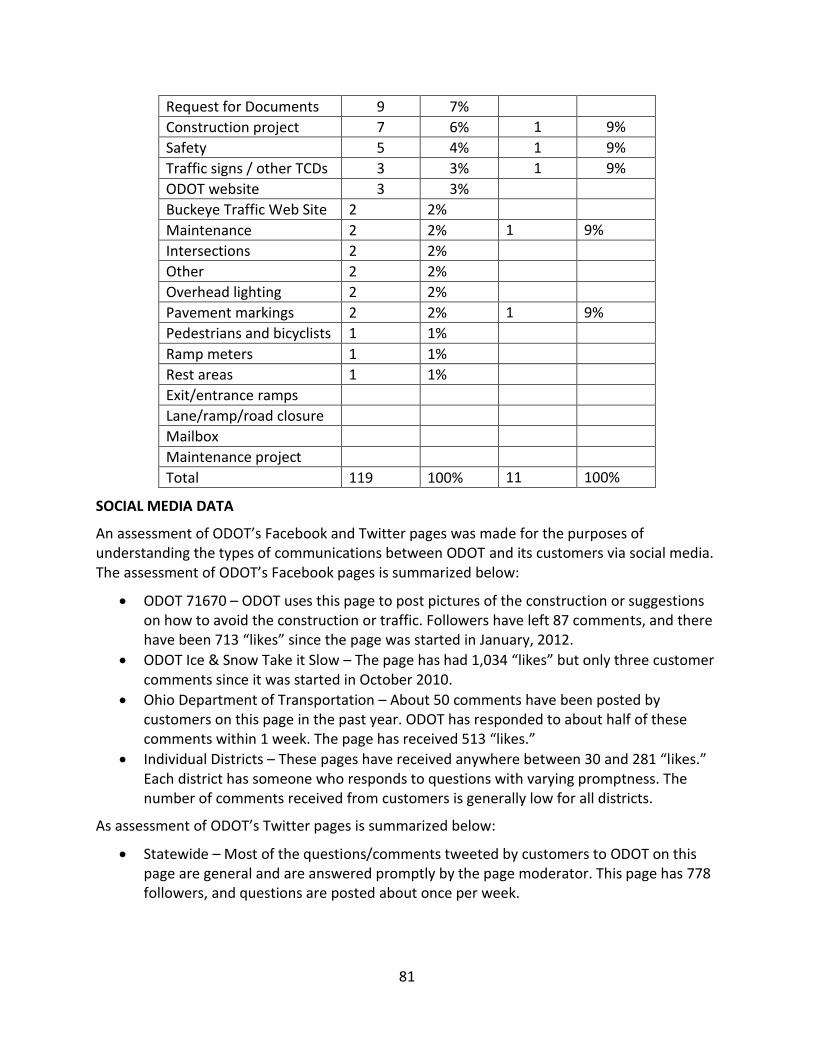
81
Request for Documents 9 7%
Construction project 7 6% 1 9%
Safety 5 4% 1 9%
Traffic signs / other TCDs 3 3% 1 9%
ODOT website 3 3%
Buckeye Traffic Web Site 2 2%
Maintenance 2 2% 1 9%
Intersections 2 2%
Other 2 2%
Overhead lighting 2 2%
Pavement markings 2 2% 1 9%
Pedestrians and bicyclists 1 1%
Ramp meters 1 1%
Rest areas 1 1%
Exit/entrance ramps
Lane/ramp/road closure
Mailbox
Maintenance project
Total 119 100% 11 100%
SOCIAL MEDIA DATA
An assessment of ODOT’s Facebook and Twitter pages was made for the purposes of understanding the types of communications between ODOT and its customers via social media. The assessment of ODOT’s Facebook pages is summarized below:
ODOT 71670 – ODOT uses this page to post pictures of the construction or suggestions on how to avoid the construction or traffic. Followers have left 87 comments, and there have been 713 “likes” since the page was started in January, 2012.
ODOT Ice & Snow Take it Slow – The page has had 1,034 “likes” but only three customer comments since it was started in October 2010.
Ohio Department of Transportation – About 50 comments have been posted by customers on this page in the past year. ODOT has responded to about half of these comments within 1 week. The page has received 513 “likes.”
Individual Districts – These pages have received anywhere between 30 and 281 “likes.” Each district has someone who responds to questions with varying promptness. The number of comments received from customers is generally low for all districts.
As assessment of ODOT’s Twitter pages is summarized below:
Statewide – Most of the questions/comments tweeted by customers to ODOT on this page are general and are answered promptly by the page moderator. This page has 778 followers, and questions are posted about once per week.
82
Innerbelt Bridge – Customers rarely tweet to this account. It is mostly a one way communication tool for ODOT to post information regarding road closures near the Innerbelt Bridge. This page has 1,159 followers.
ODOT 71670 – Aside from ODOT’s many posts regarding road closures and other construction news, questions from customers are posted on this account only about once per month, usually inquiring about road closures. This page has 629 followers.
Individual Districts – Some questions are posted by customers on these pages, mostly pertaining to road closures and safety concerns. The frequency of tweets from customers varies by district ranging from 44 to 2,142 tweets per page. The district pages have between 145 to 7,856 followers.
Table 15 summarizes the social media usage across ODOT.
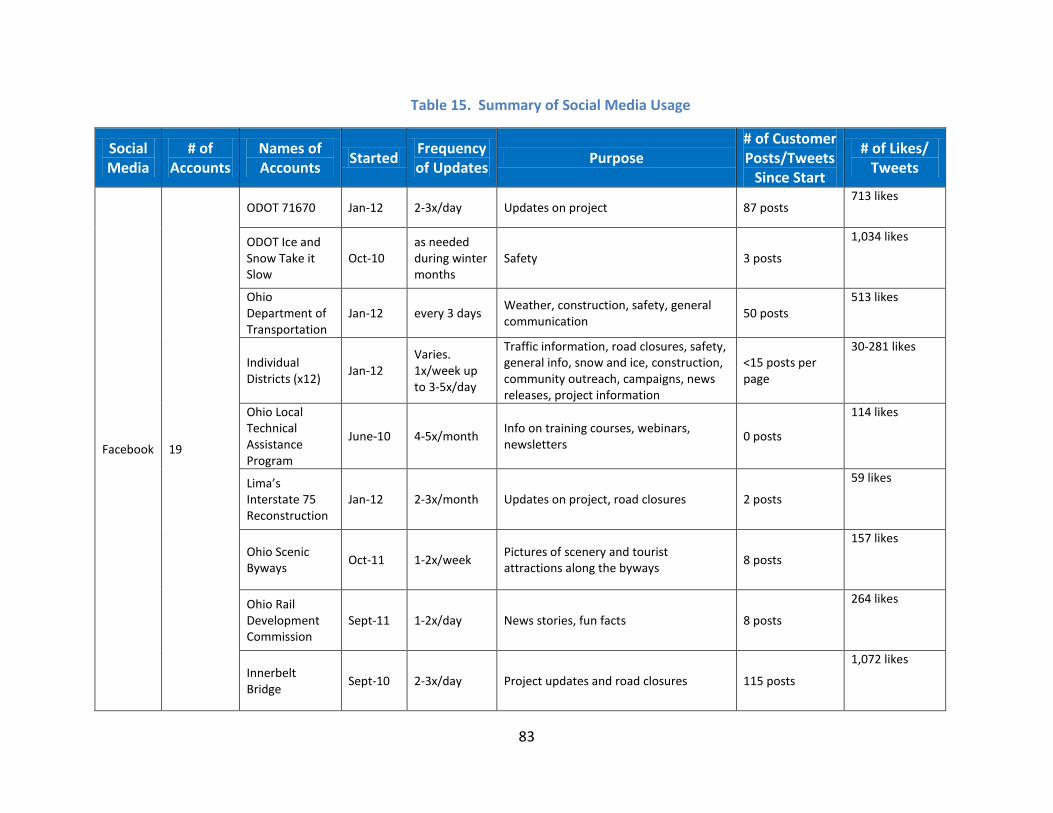
83
Table 15. Summary of Social Media Usage
Social Media
# of Accounts
Names of Accounts
Started Frequency of Updates
Purpose # of Customer Posts/Tweets
Since Start
# of Likes/ Tweets
Facebook 19
ODOT 71670 Jan-12 2-3x/day Updates on project 87 posts 713 likes
ODOT Ice and Snow Take it Slow
Oct-10 as needed during winter months
Safety 3 posts
1,034 likes
Ohio Department of Transportation
Jan-12 every 3 days Weather, construction, safety, general communication
50 posts 513 likes
Individual Districts (x12)
Jan-12 Varies. 1x/week up to 3-5x/day
Traffic information, road closures, safety, general info, snow and ice, construction, community outreach, campaigns, news releases, project information
<15 posts per page
30-281 likes
Ohio Local Technical Assistance Program
June-10 4-5x/month Info on training courses, webinars, newsletters
0 posts
114 likes
Lima’s Interstate 75 Reconstruction
Jan-12 2-3x/month Updates on project, road closures 2 posts
59 likes
Ohio Scenic Byways
Oct-11 1-2x/week Pictures of scenery and tourist attractions along the byways
8 posts
157 likes
Ohio Rail Development Commission
Sept-11 1-2x/day News stories, fun facts 8 posts
264 likes
Innerbelt Bridge
Sept-10 2-3x/day Project updates and road closures 115 posts
1,072 likes
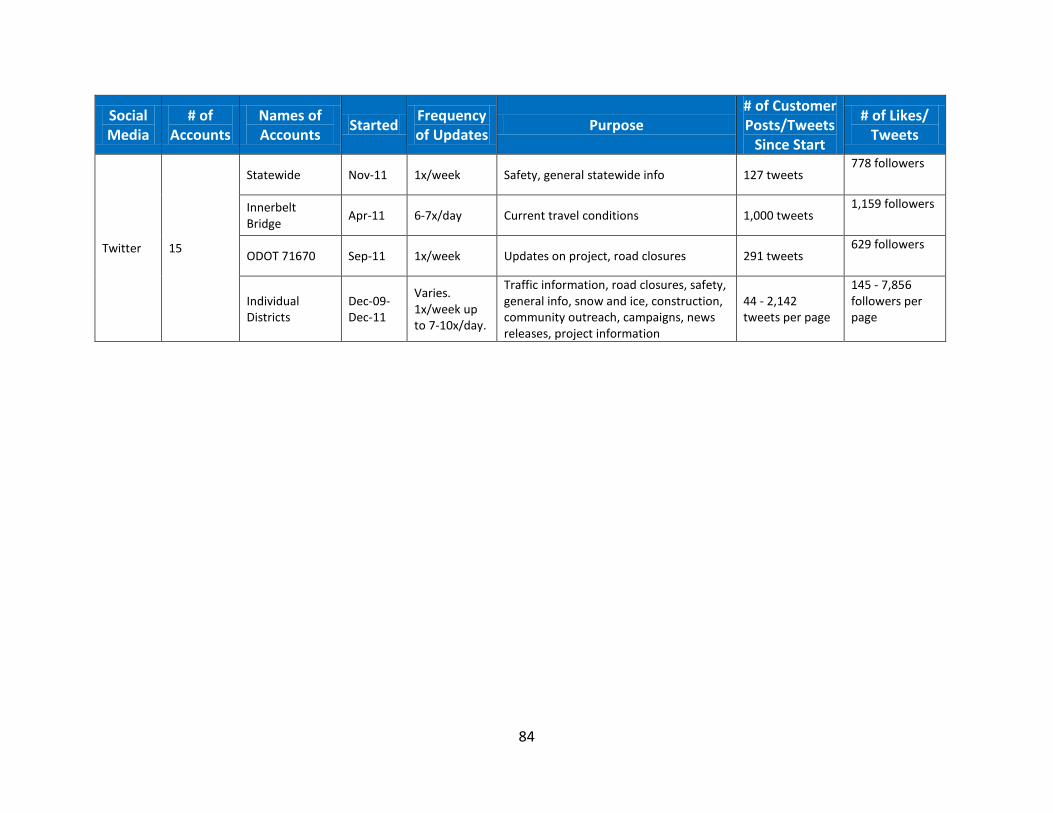
84
Social Media
# of Accounts
Names of Accounts
Started Frequency of Updates
Purpose # of Customer Posts/Tweets
Since Start
# of Likes/ Tweets
Twitter 15
Statewide Nov-11 1x/week Safety, general statewide info 127 tweets 778 followers
Innerbelt Bridge
Apr-11 6-7x/day Current travel conditions 1,000 tweets 1,159 followers
ODOT 71670 Sep-11 1x/week Updates on project, road closures 291 tweets 629 followers
Individual Districts
Dec-09-Dec-11
Varies. 1x/week up to 7-10x/day.
Traffic information, road closures, safety, general info, snow and ice, construction, community outreach, campaigns, news releases, project information
44 - 2,142 tweets per page
145 - 7,856 followers per page
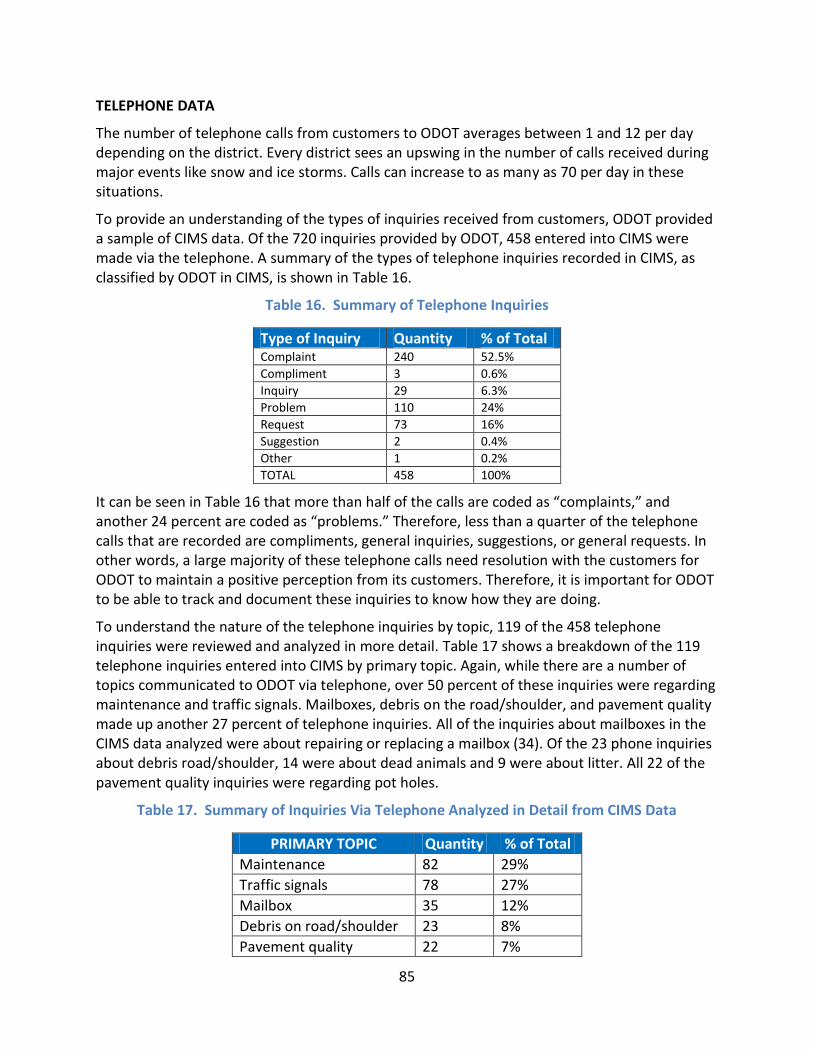
85
TELEPHONE DATA
The number of telephone calls from customers to ODOT averages between 1 and 12 per day depending on the district. Every district sees an upswing in the number of calls received during major events like snow and ice storms. Calls can increase to as many as 70 per day in these situations.
To provide an understanding of the types of inquiries received from customers, ODOT provided a sample of CIMS data. Of the 720 inquiries provided by ODOT, 458 entered into CIMS were made via the telephone. A summary of the types of telephone inquiries recorded in CIMS, as classified by ODOT in CIMS, is shown in Table 16.
Table 16. Summary of Telephone Inquiries
Type of Inquiry Quantity % of Total Complaint 240 52.5%
Compliment 3 0.6%
Inquiry 29 6.3%
Problem 110 24%
Request 73 16%
Suggestion 2 0.4%
Other 1 0.2%
TOTAL 458 100%
It can be seen in Table 16 that more than half of the calls are coded as “complaints,” and another 24 percent are coded as “problems.” Therefore, less than a quarter of the telephone calls that are recorded are compliments, general inquiries, suggestions, or general requests. In other words, a large majority of these telephone calls need resolution with the customers for ODOT to maintain a positive perception from its customers. Therefore, it is important for ODOT to be able to track and document these inquiries to know how they are doing.
To understand the nature of the telephone inquiries by topic, 119 of the 458 telephone inquiries were reviewed and analyzed in more detail. Table 17 shows a breakdown of the 119 telephone inquiries entered into CIMS by primary topic. Again, while there are a number of topics communicated to ODOT via telephone, over 50 percent of these inquiries were regarding maintenance and traffic signals. Mailboxes, debris on the road/shoulder, and pavement quality made up another 27 percent of telephone inquiries. All of the inquiries about mailboxes in the CIMS data analyzed were about repairing or replacing a mailbox (34). Of the 23 phone inquiries about debris road/shoulder, 14 were about dead animals and 9 were about litter. All 22 of the pavement quality inquiries were regarding pot holes.
Table 17. Summary of Inquiries Via Telephone Analyzed in Detail from CIMS Data
PRIMARY TOPIC Quantity % of Total
Maintenance 82 29%
Traffic signals 78 27%
Mailbox 35 12%
Debris on road/shoulder 23 8%
Pavement quality 22 7%
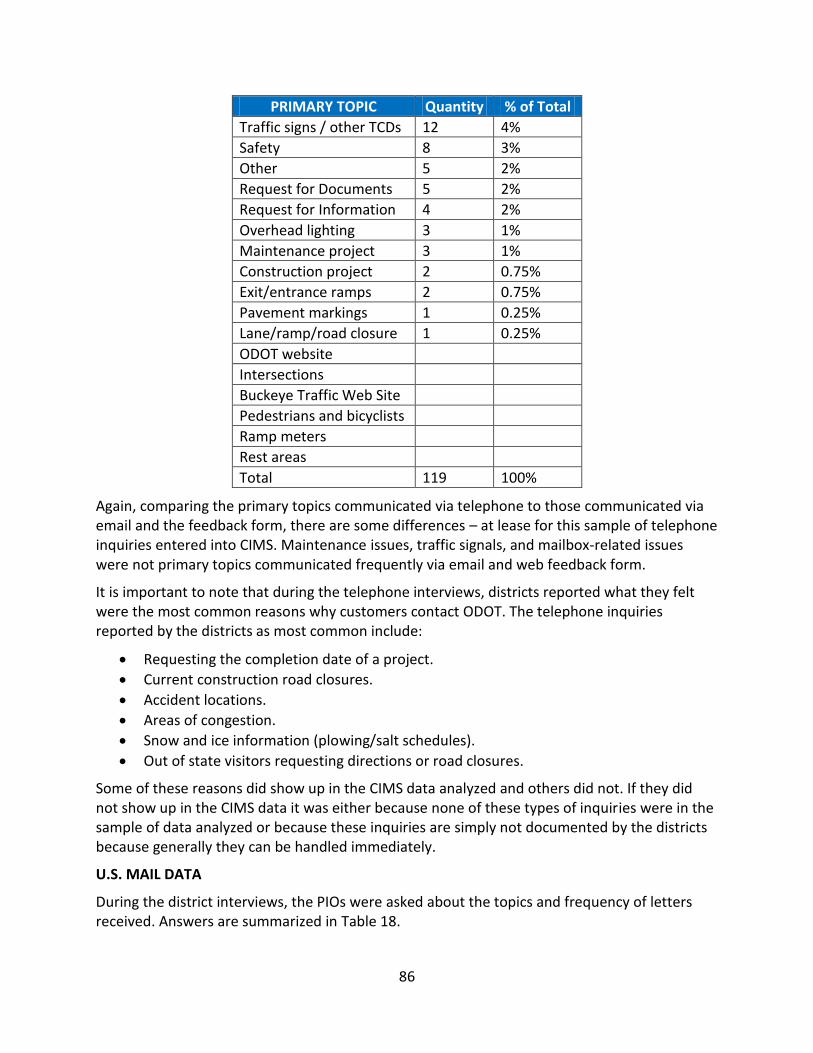
86
PRIMARY TOPIC Quantity % of Total
Traffic signs / other TCDs 12 4%
Safety 8 3%
Other 5 2%
Request for Documents 5 2%
Request for Information 4 2%
Overhead lighting 3 1%
Maintenance project 3 1%
Construction project 2 0.75%
Exit/entrance ramps 2 0.75%
Pavement markings 1 0.25%
Lane/ramp/road closure 1 0.25%
ODOT website
Intersections
Buckeye Traffic Web Site
Pedestrians and bicyclists
Ramp meters
Rest areas
Total 119 100%
Again, comparing the primary topics communicated via telephone to those communicated via email and the feedback form, there are some differences – at lease for this sample of telephone inquiries entered into CIMS. Maintenance issues, traffic signals, and mailbox-related issues were not primary topics communicated frequently via email and web feedback form.
It is important to note that during the telephone interviews, districts reported what they felt were the most common reasons why customers contact ODOT. The telephone inquiries reported by the districts as most common include:
Requesting the completion date of a project.
Current construction road closures.
Accident locations.
Areas of congestion.
Snow and ice information (plowing/salt schedules).
Out of state visitors requesting directions or road closures.
Some of these reasons did show up in the CIMS data analyzed and others did not. If they did not show up in the CIMS data it was either because none of these types of inquiries were in the sample of data analyzed or because these inquiries are simply not documented by the districts because generally they can be handled immediately.
U.S. MAIL DATA
During the district interviews, the PIOs were asked about the topics and frequency of letters received. Answers are summarized in Table 18.
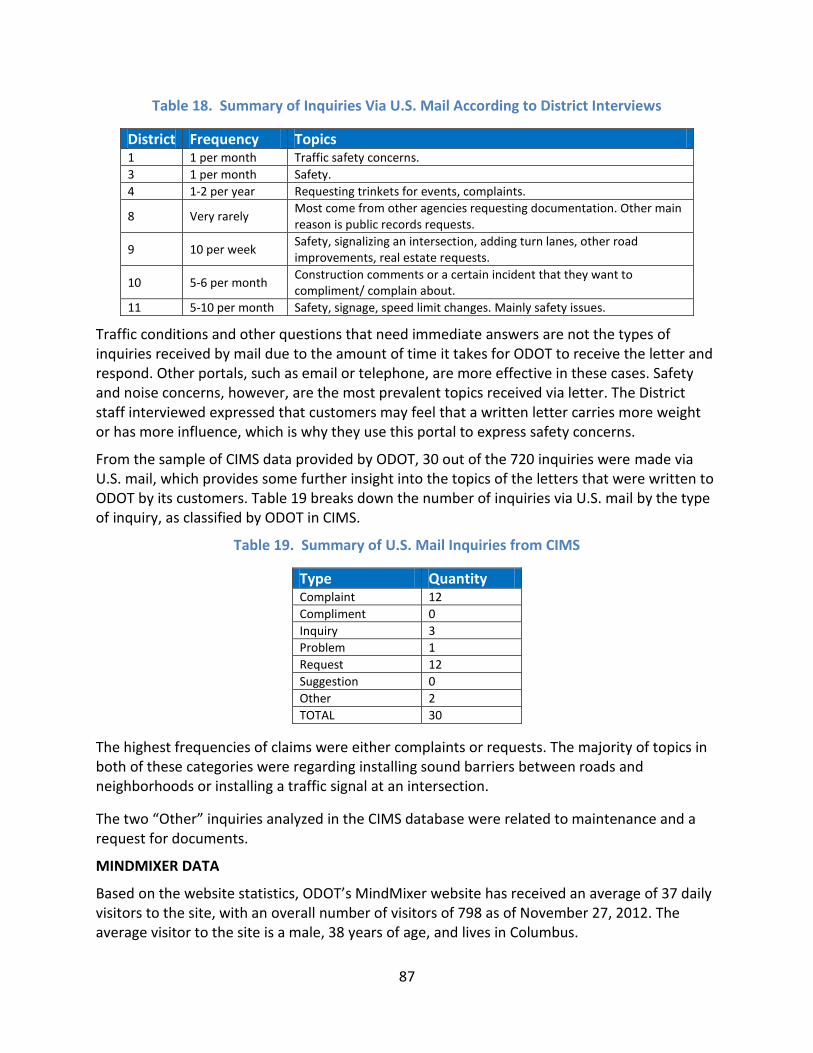
87
Table 18. Summary of Inquiries Via U.S. Mail According to District Interviews
District Frequency Topics 1 1 per month Traffic safety concerns.
3 1 per month Safety.
4 1-2 per year Requesting trinkets for events, complaints.
8 Very rarely Most come from other agencies requesting documentation. Other main reason is public records requests.
9 10 per week Safety, signalizing an intersection, adding turn lanes, other road improvements, real estate requests.
10 5-6 per month Construction comments or a certain incident that they want to compliment/ complain about.
11 5-10 per month Safety, signage, speed limit changes. Mainly safety issues.
Traffic conditions and other questions that need immediate answers are not the types of inquiries received by mail due to the amount of time it takes for ODOT to receive the letter and respond. Other portals, such as email or telephone, are more effective in these cases. Safety and noise concerns, however, are the most prevalent topics received via letter. The District staff interviewed expressed that customers may feel that a written letter carries more weight or has more influence, which is why they use this portal to express safety concerns.
From the sample of CIMS data provided by ODOT, 30 out of the 720 inquiries were made via U.S. mail, which provides some further insight into the topics of the letters that were written to ODOT by its customers. Table 19 breaks down the number of inquiries via U.S. mail by the type of inquiry, as classified by ODOT in CIMS.
Table 19. Summary of U.S. Mail Inquiries from CIMS
Type Quantity Complaint 12
Compliment 0
Inquiry 3
Problem 1
Request 12
Suggestion 0
Other 2
TOTAL 30
The highest frequencies of claims were either complaints or requests. The majority of topics in both of these categories were regarding installing sound barriers between roads and neighborhoods or installing a traffic signal at an intersection.
The two “Other” inquiries analyzed in the CIMS database were related to maintenance and a request for documents.
MINDMIXER DATA
Based on the website statistics, ODOT’s MindMixer website has received an average of 37 daily visitors to the site, with an overall number of visitors of 798 as of November 27, 2012. The average visitor to the site is a male, 38 years of age, and lives in Columbus.
88
The ideas submitted by ODOTs customers via the MindMixer website cover a wide range of topics. The most common topic is bicycles. This includes bicycle safety, bike shares, bike lanes and biking trails. There is a trend toward more sustainable transit options like pedestrian friendly roads and additional bus routes requested. Other suggestions include road improvement projects and requests for congestion relief in the urban areas of the state.
CUSTOMER INQUIRY MANAGEMENT SYSTEM
While CIMS is not a customer communications portal, it is used by half of the ODOT Districts to track their communications with customers. Along with the ability to track inquiries, CIMS includes a reporting tool that allows ODOT to assess and analyze the effectiveness of its customer service portals. The CIMS user manual states that the system was developed with the following objectives:
Centralize all inquiries received by the districts through various portals
Reduce the number of applications that require additional resources to maintain and enhance
Improve the quality of data that is collected and reported upon
Increase the efficiency of ODOT in generating clean data and accurate reports
Provide the ability to assign inquiries to specific individuals for more efficient problem resolution
Based on the telephone interviews, six of the twelve ODOT district PIOs currently do not use CIMS in any capacity; however, the Deputy Directors office does still use it in three of these districts. The primary reason reported by these districts for not using CIMS is that the system is time consuming and cumbersome. These districts also reported that they did not see a benefit to using CIMS. They feel that the amount of time it takes to enter the information into CIMS takes time away from actually addressing the inquiry, making the system ineffective.
Three of the districts currently use CIMS to some extent but not for the majority of their communications. In two districts, CIMS is only used to track public records, and in one District the PIO is the only one that uses it effectively. These districts are of the opinion that CIMS has the potential to be a good system with improvements to make it more user-friendly; however, the biggest impediment to more wide use of the system is education on the benefits of the system as well as enforcement of its use.
Three districts currently use CIMS regularly to track customer communications through the various communications portals. Although these districts expressed the same opinions as the other districts regarding the user-friendliness of the system, there is someone in the district that is enforcing the use of the system, which is the reason for its continued implementation.
The process that ODOT uses with CIMS varies by district. This section will discuss the processes that are in use by the six districts that use CIMS.
Two of the districts (1 & 3) use CIMS only to track public records requests (e.g., real estate, property information from citizens, attorneys, businesses). The reason for tracking the public records is due to the fact that multiple people/departments are involved in these requests. The

89
requests are generally completed within 48 hours. The PIO for the district is responsible for entering the request into CIMS, assigning it to the appropriate person, and ensuring the request gets completed. The PIOs for both of these districts run periodic reports to determine if there are any open requests that need to be completed. The person responsible for completing the request is emailed as a reminder of their open tickets. The PIO also closes the requests when completed.
The districts that do use CIMS to track their customer inquiries have staff that monitor the process to ensure all inquiries are eventually closed. The person responsible may be the PIO, an administrative assistant, or someone in the IT department. For these districts, the person that has initial contact with the customer, regardless of the portal used, is responsible for entering the inquiry into CIMS and assigning it to the appropriate person. The processes vary after this point. Some districts reported that whoever enters the claim is responsible for ensuring its completion, while other districts indicated that once an inquiry was assigned to a specific person, the responsibility to close the claim moves to that person. The timeframe within which inquiries are expected to be completed depends on the type of inquiry and the level of effort that will need to go towards resolving it. Simple inquiries are expected to be handled within 24 to 48 hours. More extensive inquiries are given completion timeframes of up to one week. In these districts, the monitors run reports either bi-weekly or monthly to identify open inquiries. They email the responsible person as a reminder to complete the inquiry in a timely manner.
Figure 5 is a screen shot of the searchable attributes within CIMS.
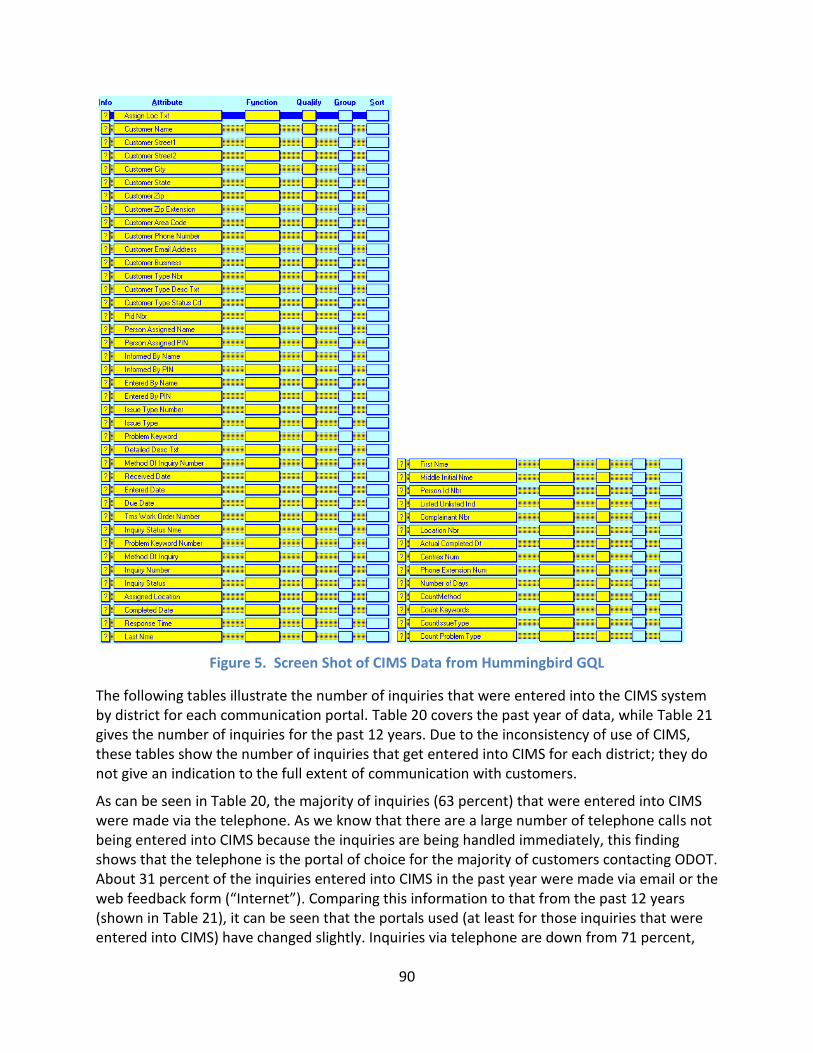
90
Figure 5. Screen Shot of CIMS Data from Hummingbird GQL
The following tables illustrate the number of inquiries that were entered into the CIMS system by district for each communication portal. Table 20 covers the past year of data, while Table 21 gives the number of inquiries for the past 12 years. Due to the inconsistency of use of CIMS, these tables show the number of inquiries that get entered into CIMS for each district; they do not give an indication to the full extent of communication with customers.
As can be seen in Table 20, the majority of inquiries (63 percent) that were entered into CIMS were made via the telephone. As we know that there are a large number of telephone calls not being entered into CIMS because the inquiries are being handled immediately, this finding shows that the telephone is the portal of choice for the majority of customers contacting ODOT. About 31 percent of the inquiries entered into CIMS in the past year were made via email or the web feedback form (“Internet”). Comparing this information to that from the past 12 years (shown in Table 21), it can be seen that the portals used (at least for those inquiries that were entered into CIMS) have changed slightly. Inquiries via telephone are down from 71 percent,
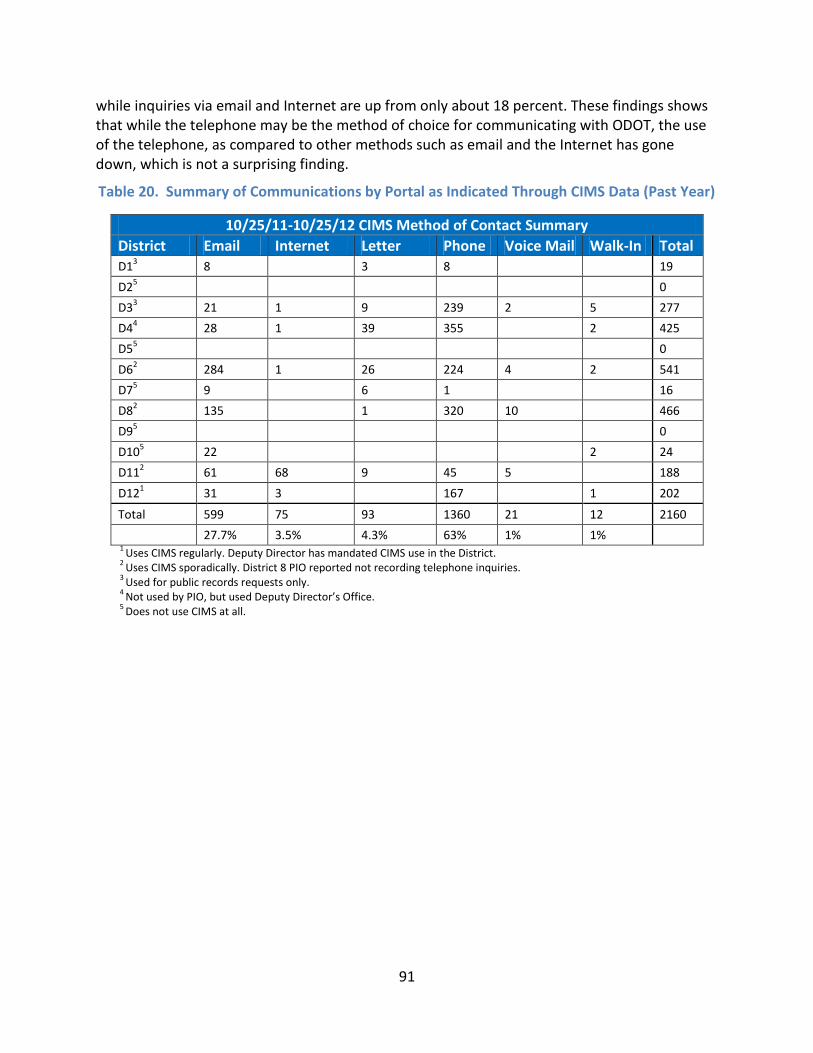
91
while inquiries via email and Internet are up from only about 18 percent. These findings shows that while the telephone may be the method of choice for communicating with ODOT, the use of the telephone, as compared to other methods such as email and the Internet has gone down, which is not a surprising finding.
Table 20. Summary of Communications by Portal as Indicated Through CIMS Data (Past Year)
10/25/11-10/25/12 CIMS Method of Contact Summary
District Email Internet Letter Phone Voice Mail Walk-In Total D1
3 8
3 8
19
D25
0
D33 21 1 9 239 2 5 277
D44
28 1 39 355
2 425
D55
0
D62 284 1 26 224 4 2 541
D75
9
6 1
16
D82 135
1 320 10
466
D95
0
D105
22
2 24
D112 61 68 9 45 5
188
D121 31 3
167
1 202
Total 599 75 93 1360 21 12 2160
27.7% 3.5% 4.3% 63% 1% 1% 1
Uses CIMS regularly. Deputy Director has mandated CIMS use in the District. 2
Uses CIMS sporadically. District 8 PIO reported not recording telephone inquiries. 3
Used for public records requests only. 4
Not used by PIO, but used Deputy Director’s Office. 5
Does not use CIMS at all.
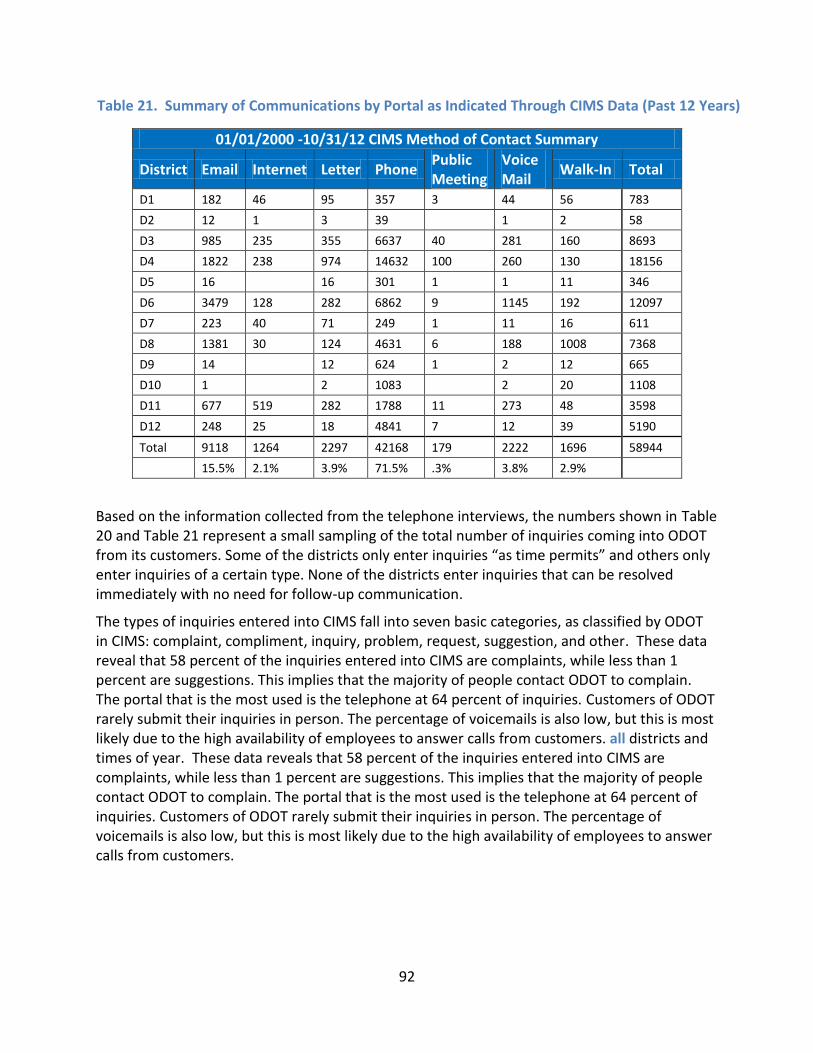
92
Table 21. Summary of Communications by Portal as Indicated Through CIMS Data (Past 12 Years)
01/01/2000 -10/31/12 CIMS Method of Contact Summary
District Email Internet Letter Phone Public Meeting
Voice Mail
Walk-In Total
D1 182 46 95 357 3 44 56 783
D2 12 1 3 39
1 2 58
D3 985 235 355 6637 40 281 160 8693
D4 1822 238 974 14632 100 260 130 18156
D5 16
16 301 1 1 11 346
D6 3479 128 282 6862 9 1145 192 12097
D7 223 40 71 249 1 11 16 611
D8 1381 30 124 4631 6 188 1008 7368
D9 14
12 624 1 2 12 665
D10 1
2 1083
2 20 1108
D11 677 519 282 1788 11 273 48 3598
D12 248 25 18 4841 7 12 39 5190
Total 9118 1264 2297 42168 179 2222 1696 58944
15.5% 2.1% 3.9% 71.5% .3% 3.8% 2.9%
Based on the information collected from the telephone interviews, the numbers shown in Table 20 and Table 21 represent a small sampling of the total number of inquiries coming into ODOT from its customers. Some of the districts only enter inquiries “as time permits” and others only enter inquiries of a certain type. None of the districts enter inquiries that can be resolved immediately with no need for follow-up communication.
The types of inquiries entered into CIMS fall into seven basic categories, as classified by ODOT in CIMS: complaint, compliment, inquiry, problem, request, suggestion, and other. These data reveal that 58 percent of the inquiries entered into CIMS are complaints, while less than 1 percent are suggestions. This implies that the majority of people contact ODOT to complain. The portal that is the most used is the telephone at 64 percent of inquiries. Customers of ODOT rarely submit their inquiries in person. The percentage of voicemails is also low, but this is most likely due to the high availability of employees to answer calls from customers. all districts and times of year. These data reveals that 58 percent of the inquiries entered into CIMS are complaints, while less than 1 percent are suggestions. This implies that the majority of people contact ODOT to complain. The portal that is the most used is the telephone at 64 percent of inquiries. Customers of ODOT rarely submit their inquiries in person. The percentage of voicemails is also low, but this is most likely due to the high availability of employees to answer calls from customers.

93
Table 22 shows the trend of contact methods per comment type based on 720 random inquiries that cover all districts and times of year. These data reveals that 58 percent of the inquiries entered into CIMS are complaints, while less than 1 percent are suggestions. This implies that the majority of people contact ODOT to complain. The portal that is the most used is the telephone at 64 percent of inquiries. Customers of ODOT rarely submit their inquiries in person. The percentage of voicemails is also low, but this is most likely due to the high availability of employees to answer calls from customers.
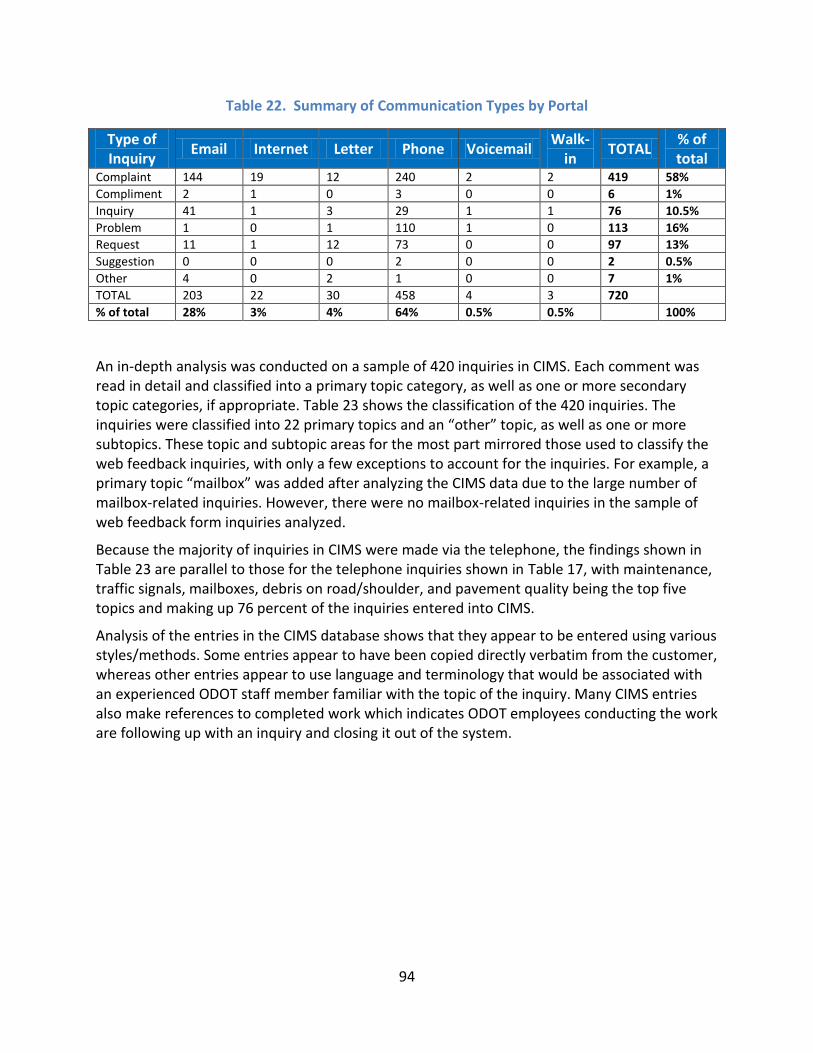
94
Table 22. Summary of Communication Types by Portal
Type of Inquiry
Email Internet Letter Phone Voicemail Walk-
in TOTAL
% of total
Complaint 144 19 12 240 2 2 419 58%
Compliment 2 1 0 3 0 0 6 1%
Inquiry 41 1 3 29 1 1 76 10.5%
Problem 1 0 1 110 1 0 113 16%
Request 11 1 12 73 0 0 97 13%
Suggestion 0 0 0 2 0 0 2 0.5%
Other 4 0 2 1 0 0 7 1%
TOTAL 203 22 30 458 4 3 720
% of total 28% 3% 4% 64% 0.5% 0.5% 100%
An in-depth analysis was conducted on a sample of 420 inquiries in CIMS. Each comment was read in detail and classified into a primary topic category, as well as one or more secondary topic categories, if appropriate. Table 23 shows the classification of the 420 inquiries. The inquiries were classified into 22 primary topics and an “other” topic, as well as one or more subtopics. These topic and subtopic areas for the most part mirrored those used to classify the web feedback inquiries, with only a few exceptions to account for the inquiries. For example, a primary topic “mailbox” was added after analyzing the CIMS data due to the large number of mailbox-related inquiries. However, there were no mailbox-related inquiries in the sample of web feedback form inquiries analyzed.
Because the majority of inquiries in CIMS were made via the telephone, the findings shown in Table 23 are parallel to those for the telephone inquiries shown in Table 17, with maintenance, traffic signals, mailboxes, debris on road/shoulder, and pavement quality being the top five topics and making up 76 percent of the inquiries entered into CIMS.
Analysis of the entries in the CIMS database shows that they appear to be entered using various styles/methods. Some entries appear to have been copied directly verbatim from the customer, whereas other entries appear to use language and terminology that would be associated with an experienced ODOT staff member familiar with the topic of the inquiry. Many CIMS entries also make references to completed work which indicates ODOT employees conducting the work are following up with an inquiry and closing it out of the system.
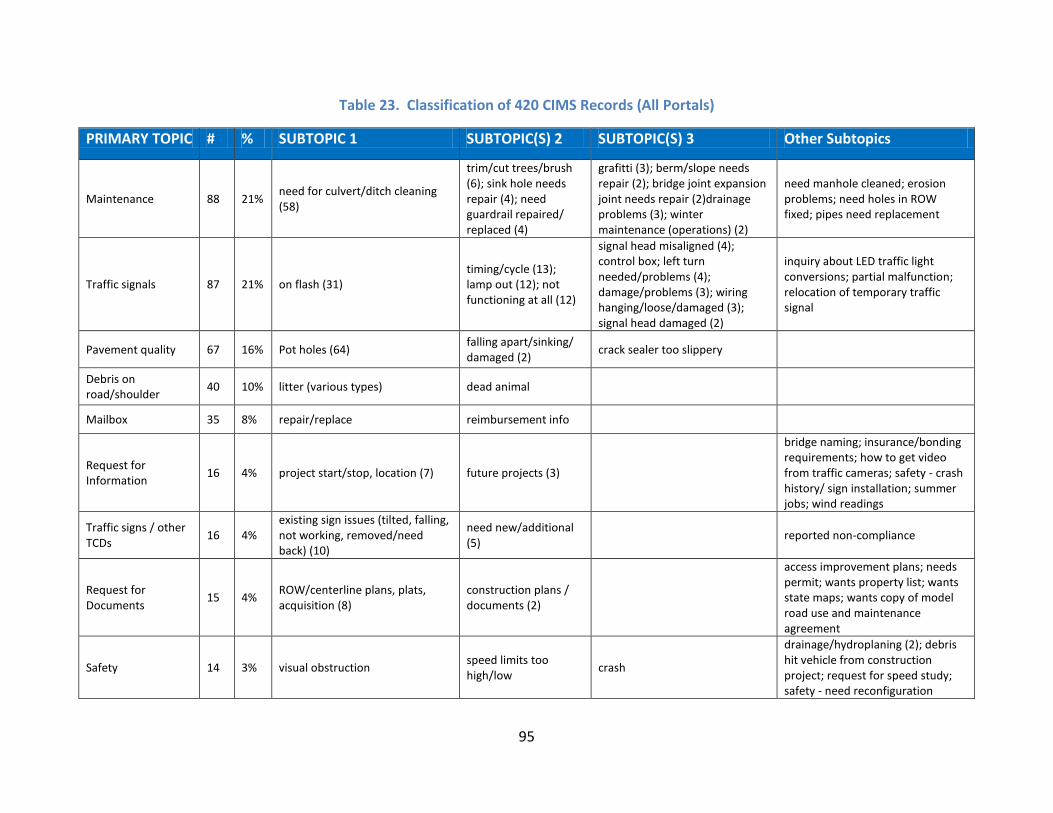
95
Table 23. Classification of 420 CIMS Records (All Portals)
PRIMARY TOPIC # % SUBTOPIC 1 SUBTOPIC(S) 2 SUBTOPIC(S) 3 Other Subtopics
Maintenance 88 21% need for culvert/ditch cleaning (58)
trim/cut trees/brush (6); sink hole needs repair (4); need guardrail repaired/ replaced (4)
grafitti (3); berm/slope needs repair (2); bridge joint expansion joint needs repair (2)drainage problems (3); winter maintenance (operations) (2)
need manhole cleaned; erosion problems; need holes in ROW fixed; pipes need replacement
Traffic signals 87 21% on flash (31) timing/cycle (13); lamp out (12); not functioning at all (12)
signal head misaligned (4); control box; left turn needed/problems (4); damage/problems (3); wiring hanging/loose/damaged (3); signal head damaged (2)
inquiry about LED traffic light conversions; partial malfunction; relocation of temporary traffic signal
Pavement quality 67 16% Pot holes (64) falling apart/sinking/ damaged (2)
crack sealer too slippery
Debris on road/shoulder
40 10% litter (various types) dead animal
Mailbox 35 8% repair/replace reimbursement info
Request for Information
16 4% project start/stop, location (7) future projects (3)
bridge naming; insurance/bonding requirements; how to get video from traffic cameras; safety - crash history/ sign installation; summer jobs; wind readings
Traffic signs / other TCDs
16 4% existing sign issues (tilted, falling, not working, removed/need back) (10)
need new/additional (5)
reported non-compliance
Request for Documents
15 4% ROW/centerline plans, plats, acquisition (8)
construction plans / documents (2)
access improvement plans; needs permit; wants property list; wants state maps; wants copy of model road use and maintenance agreement
Safety 14 3% visual obstruction speed limits too high/low
crash
drainage/hydroplaning (2); debris hit vehicle from construction project; request for speed study; safety - need reconfiguration
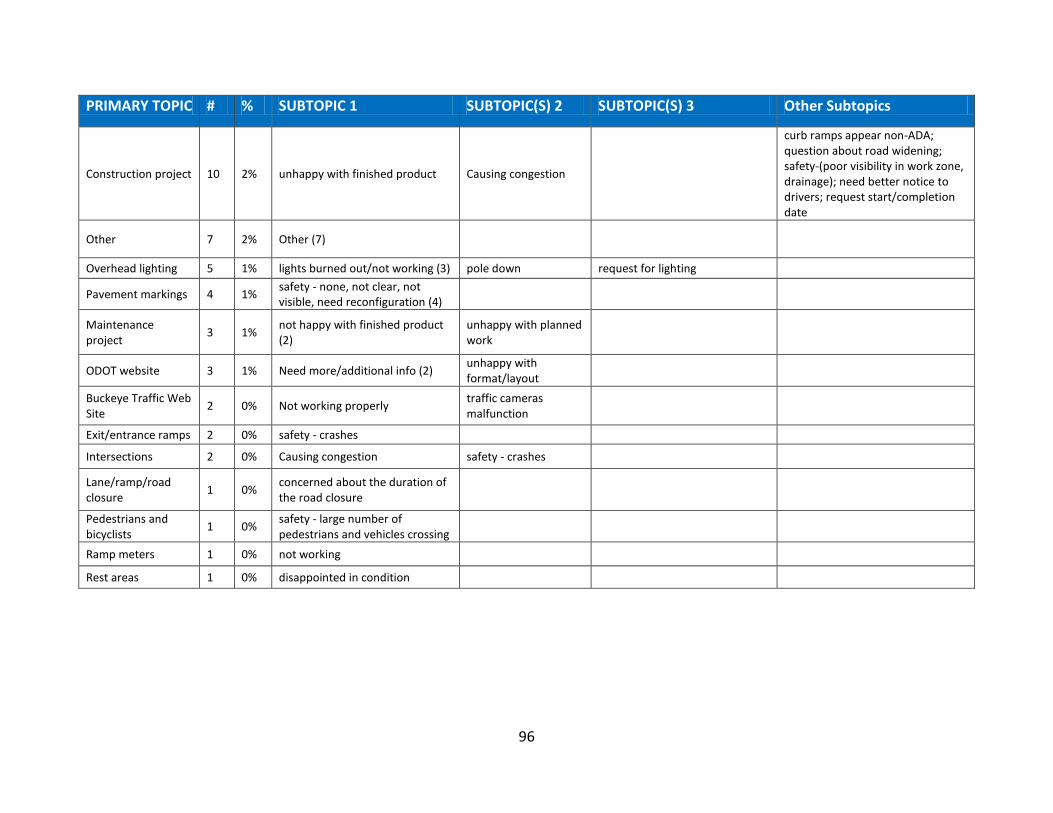
96
PRIMARY TOPIC # % SUBTOPIC 1 SUBTOPIC(S) 2 SUBTOPIC(S) 3 Other Subtopics
Construction project 10 2% unhappy with finished product Causing congestion
curb ramps appear non-ADA; question about road widening; safety-(poor visibility in work zone, drainage); need better notice to drivers; request start/completion date
Other 7 2% Other (7)
Overhead lighting 5 1% lights burned out/not working (3) pole down request for lighting
Pavement markings 4 1% safety - none, not clear, not visible, need reconfiguration (4)
Maintenance project
3 1% not happy with finished product (2)
unhappy with planned work
ODOT website 3 1% Need more/additional info (2) unhappy with format/layout
Buckeye Traffic Web Site
2 0% Not working properly traffic cameras malfunction
Exit/entrance ramps 2 0% safety - crashes
Intersections 2 0% Causing congestion safety - crashes
Lane/ramp/road closure
1 0% concerned about the duration of the road closure
Pedestrians and bicyclists
1 0% safety - large number of pedestrians and vehicles crossing
Ramp meters 1 0% not working
Rest areas 1 0% disappointed in condition
97
SUMMARY
Based on the telephone interviews and other data received from ODOT, it is apparent that a user-friendly, centralized system that will assist PIOs in their daily duties in communicating with customers via a variety of portals is needed. Inconsistency within districts, a lack of documentation, and nonexistent process uniformity throughout ODOT has made it difficult to analyze and track inquiries to improve customer service. A more consistent approach throughout ODOT that would allow for data to be analyzed centrally could allow ODOT to implement strategies and training that could lead to improved customer satisfaction.
The most apparent roadblock to this centralized system is the buy-in from the districts due to the general distaste for CIMS. Mandating the use of the system as well as training could help to ensure the use of a comprehensive system. Another roadblock to a centralized system is accommodating inquiries that can be easily and immediately resolved. Telephone inquiries and inquiries made via the web feedback form are the least likely to be documented if the issue is quickly resolved, which indicates that the proposed system must be easy to use so that documenting simple inquiries is not seen as cumbersome or unnecessary.
Social media is seen as the most beneficial form of communication, and the districts expressed a need for increased usage of this portal; however, updating social media sites can be a full-time task that all districts are not necessarily staffed to handle. Being able to incorporate social media site updates into a centralized communications system could allow for more frequent posts to keep the customers informed.
It appears that the telephone is the method of choice by customers when reaching out to ODOT. As reported by the districts, the majority of these telephone inquiries are never documented, making it impossible to do a detailed assessment of the reasons for these customer inquiries. An analysis of a sample of 337 inquiries via the web feedback form and 420 CIMS entries (the majority of which were inquiries via telephone) showed that a wide range of comments and requests are made via the various portals, and that the primary topics communicated through the various portals do differ between the portals. These findings show the importance of continuing to offer a range of portals through which customers can communicate with ODOT, as well as the need for an easy, centralized way of documenting the inquiries via the various portals.
Overall, the districts responded positively when introduced to the concept of a centralized system that would be able to incorporate all portals into a centralized location and be able to track and report on inquiries.
98
Appendix C - State DOT’s Customer Communications and Relations Best Practices
CUSTOMER RELATIONS MANAGEMENT (CRM), PERFORMANCE MEASURES, AND SOCIAL MEDIA
For over a decade, Customer Relationship Management (CRM) has evolved into a customer-centric philosophy that must permeate an entire organization. There are three key elements to a successful CRM initiative: people, process, and technology. It's a strategy used to learn more about customers' needs and behaviors in order to develop stronger relationships with them.7 Billions of dollars have been spent on establishing these systems, yet many of the adopting companies or public agencies are unhappy with the results. According to Becker, Greve, et al., (2010), two reasons may account for their dissatisfaction: first, CRM projects are either poorly implemented and thus do not perform accordingly, or, second, companies expect too much from CRM systems.8 Results of their research indicate that “…internal support is an important factor for the performance of CRM implementation, as well as developing a CRM system to specifically address diverse functions such as the acquisition, maintenance, and retention of customers and to tailor implementation effort to the needs of the major functions.”9
More recently, online social media tools have also had an effect on customer relationship management systems. Consequently, social CRM (SCRM) is emerging as a new paradigm for integrating social networking in more traditional CRM systems.10 Askool and Nakata (2011) created a model for exploring and predicting the acceptance of SCRM. State DOTs are using SCRM tools to increase transparency and respond to their stakeholders in quick, clear, personal ways. It has also worked great for crisis management. Customers can provide transit agencies with valuable information about conditions in the field. During a series of severe snowstorms that affected travel throughout the New York metropolitan area, messages from customers helped the Metropolitan Transportation Authority identify trouble spots.11 Some transit agencies, such as the Washington Metropolitan Area Transit Authority (WMATA), find Twitter especially well-suited for providing real-time service updates, while Vancouver’s TransLink uses the platform to provide two-way customer service.
7 “What is CRM?” Article posted February 2010. Customer Relationship Management website (from editors of CRM
magazine) http://www.destinationcrm.com/Articles/CRM-News/Daily-News/What-Is-CRM-46033.aspx Accessed December 3, 2012 8 Becker, J.U., Goetz, G., and S. Albers. Left Behind Expectations: How to Prevent CRM Implementations From
Failing. GfK MIR / Vol. 2, No. 2, 2010 / New Strategies. http://www.the-klu.org/fileadmin/downloads/Faculty/publications/Becker_Greve_Albers_GfK_MIR_2010.pdf 9 Ibid. p.35
10 Askool, S., and K. Nakata. (2011). A Conceptual Model for Acceptance of Social CRM Systems Based on a Scoping
Study. AI & Society, 26(3), 205-220. DOI 10.1007/s00146-010-0311-5 11
TCRP Synthesis 99. Uses of Social Media in Public Transportation. A Synthesis of Transit Practice. Washington, D.C. 2012 p.41 http://onlinepubs.trb.org/onlinepubs/tcrp/tcrp_syn_99.pdf
99
Organizations also use social media applications to support customer service and to obtain feedback from stakeholders on services and programs. On an everyday basis, when not being used for “crisis management,” social media benefits agencies such as the New York MTA by “…allowing the agency to distribute its message unfiltered by reporters or traditional media outlets and provides other channels for individuals to get information.”12 The agency’s public relations image became more personable and approachable. Interestingly, one challenge for public agencies using social media for dissemination of information and customer feedback is managing customer expectations. The more an agency uses its social media channels, the more the public expects. Regarding MTA, the agency posts a disclaimer on its social profile pages saying that the sites are only monitored during business hours, but perhaps because MTA’s service runs around the clock, customers still expect responses to their questions and comments on a 24/7 basis.13 Social media can provide agencies with unfiltered customer feedback.
Vancouver’s TransLink transit agency began using Twitter in preparation for the 2010 Olympic Winter Games. After the Olympics ended in February 2010, Twitter use declined and the account reverted to the media relations department with reduced staff coverage. Looking for other opportunities to use Twitter, employees saw an opportunity to tap into their experience connecting with riders during the Olympics. Staff proposed developing a Twitter communications channel to complement the agency’s customer service call center. They built a business case to get internal approval to add a dedicated position; including statistics about the growth in the volume of Twitter followers and the number of commendations the agency received lauding its social media efforts. 14
In November 2010, TransLink integrated Twitter into its customer service group for one-month pilot test, which was subsequently extended indefinitely. Now each customer service shift has one individual responsible for following and responding to customer comments and questions through Twitter. TransLink believes that social networking is not just a way for agencies to repackage their traditional customer communications. A key benefit of engaging customers is the unparalleled opportunity to gain insight into customer attitudes and priorities. According to TransLink, “Social media is a little like having a direct line into what customers are thinking.” Customer service staff dedicate about 200 hours per month to social media, as do marketing and communications personnel.15
Several state DOTs have adopted strategic performance measures to evaluate agency goals and level of service provided to the public. . Performance measures that DOTs use for analysis include customer service outcomes, which measures…. For example, the Missouri DOT (MoDOT) produces a customer service report titled, TRACKER: Measures of Departmental Performance. Each category of measurement includes the name of the employee responsible for its oversight (titled “result driver” and “measurement driver”), Purpose of the Measure,
12
Ibid., p34 13
Ibid. 14
Ibid., p.36 15
Ibid.
100
Measurement and Data Collection, and Improvement Status.16 The following is an example of a MnDOT’s “Customer Service Measurement”:
Category: Percent of overall customer satisfaction-5A
Purpose of the Measure: This measure tracks MoDOT’s progress toward the mission of delighting its customers.
Measurement and Data Collection: Data is collected through a telephone survey each May from interviews of approximately 3,500 randomly selected Missourians. This is an annual measure updated in July. Data compiled by the American Customer Satisfaction Index (including Apple, Inc., et al. with the highest customer satisfaction rate) was compared to the Missouri results as a benchmark.
Improvement Status: In 2012, overall customer satisfaction with MoDOT is 85 percent, up from 83 percent in 2011. This rate ties the record satisfaction level reported in 2009. It is also two percentage points higher than the current scores of the highest-rated companies listed in the American Customer Satisfaction Index. MoDOT’s continued efforts to improve road conditions, decrease highway fatalities, bring projects in on time and within budget, operate in an open and transparent manner and provide timely, accurate and understandable information have helped maintain high customer satisfaction ratings. MoDOT needs to sustain high customer service levels with decreased staff, facilities and equipment while maintaining outstanding customer service.17
Other examples of reporting categories in the TRACKER measurement include:
Percent of customers who are satisfied with feedback they receive from MoDOT after offering comments-5B
Percent of customers who believe completed projects are the right transportation solutions-5C
Percent of customers satisfied with transportation options-5D
Within Wisconsin Department of Transportation’s MAPSS Performance Dashboard Report can be found 23 separate measures that support the five strategic core goals of the agency. The contents reflect quarterly, year-to-date, and annual performance updates for a variety of programs and functions that hold the greatest interest to the public in demonstrating the performance of the transportation system.18
Texas Department of Transportation (TxDOT) also developed a performance measure tracking system titled “TxDOT Tracker.” The program consists of key measures and indicators that the public can use to gauge agency and system performance. The main Tracker page is designed to focus on the top 10 performance measures for which TxDOT receives regular requests for information. In addition, the main performance reports page reflects the measures that are
16
TRACKER. Measures of Departmental Performance. Outstanding Customer Service. October 2012. Missouri Department of Transportation website. http://www.modot.org/about/Tracker.htm 17
Ibid., p.5A 18
MAPSS Performance Dashboard Report. October 2012. Wisconsin Department of Transportation website. http://www.dot.state.wi.us/about/performance/index.htm
101
organized by the six strategic plan goals from the 2011-2015 TxDOT Strategic Plan, plus a list of additional budgetary measures not aligned with a goal.19 According to the website, TxDOT will report on performance measures semi-annually and annually, as appropriate.
CUSTOMER SERVICE SURVEYS, FEEDBACK FORMS, AND TECHNOLOGY
The more practical and popular tool that most state DOTs’ websites include are customer feedback forms and/or surveys. A limited scan of state DOT websites produced the following customer service tools: both Los Angeles DOT20 and Tennessee DOT21 websites include a survey to assess Customer Satisfaction. Connecticut DOT,22 Vancouver Translink (includes Customer Service Charter),23 Ohio DOT,24 and Washington State (ferries) and (tolling) DOT25 websites all include feedback forms and customer information links.
The District (District of Columbia) Department of Transportation website includes monthly customer grades (e.g., B+) assigned to the DOT based on an algorithm that scores public sentiment shared by web, text, or social media.26 According to its website, Grade.DC.gov gathers innovative analytical technology to improve customer service at participating DC government agencies (ten, including DDOT). Feedback is collected from the website and combined with data from comments posted on social media sites like Twitter and Facebook, which allows the DC government to form a grade for each agency. Customers can easily offer actionable feedback and help DC government agencies to improve the quality of customer service. News coverage of the innovative program has appeared on video and audio clips from local NBC News, Fox DC, and CBS stations. Print reports regarding the program appeared in the Washington Examiner, Post, and Times.27
Highlighting new technology as a customer service tool, the Delaware Department of Transportation’s Division of Motor Vehicles introduced self-service kiosks in three cities for driver’s license renewal or replacement. The kiosks incorporate scanners, digital cameras and
19
TxDOT Tracker. Semi-Annual Results - FY 2011. Texas Department of Transportation website. http://www.txdot.gov/about_us/sppm/txdot_tracker.htm 20
Los Angeles Department of Transportation (LADOT) Customer Satisfaction Survey. http://ladot.lacity.org/contact_us.htm 21
Tennessee Department of Transportation. Customer Service Survey. TDOT website http://www.tdot.state.tn.us/survey 22
Send a comment to the Connecticut Department of Transportation. CTDOT website. http://www.dotdata.ct.gov/contacts/contact.aspx 23
Translink Customer Service Charter (with Feedback form). Metro Vancouver website. http://www.translink.ca/en/Customer-Service/Customer-Service-Charter.aspx 24
ODOT Feedback Information/Tips. Ohio Department of Transportation. http://www.dot.state.oh.us/feedback/Pages/feedback.aspx 25
Washington State Ferries Feedback form. Washington State Department of Transportation website. http://www.wsdot.wa.gov/ferries/info_desk/index.cfm?fuseaction=customer_service and tolling customer service contact information, http://www.wsdot.wa.gov/GoodToGo/Contacts.htm 26
Grade.DC.Gov. District Department of Transportation website. http://grade.de.gov/page/ddot 27
Description about Grade.DC.Gov website. http://grade.dc.gov/about
102
sophisticated back office technology allowing Delaware to maintain a high level of security and expand upon other eGovernment services offered by the DMV.28
STATE DOT BEST PRACTICES SUMMARY
Similar to other public organizations, transportation agencies performance and accountability are tangible expectations of the constituents they serve. The available literature depicts examples of customer service applications in use by state DOTs or local transit agencies. This literature review sheds important insight into customer relations processes and technologies available for study and ultimately implementation, as appropriate. From the documents reviewed it appears that the need for internal support dedicated to carry out the programs and processes is important. This was also reiterated in interviews that were conducted with DOTs. One of the biggest obstacles of a successful program is getting the buy-in from the employees. Leadership must set an expectation and demonstrate that this is an important policy objective. Moreover, the responsible employees must recognize the overall benefits of having a successful system. In addition, a process for managing customer expectations is also critical. Combined, these two elements provide the foundation for an effective customer relations system.
In general, some parts of the ODOT customer relations system as described in the Chapter 2 compares favorably with best practices. Providing multiple means of contact, including social media, is well in line with best practices. The best practices review also provides examples for applications and opportunities that were explored.
28
Press Release – September 12, 2012. Introduction of Self-Service Kiosk is Latest Customer Service Benefit from DMV. http://deldot.gov/home/newsroom/release.shtml?id=4473
103
Appendix D – Assessment of Customer Relations/Communications Tools/Software
REVIEW OF SOFTWARE TOOLS FOR CUSTOMER RELATIONS AND COMMUNICATIONS
As part of this effort, a number of feedback management tools and systems were reviewed to evaluate potential applicability as a solution for the ODOT customer relations development system. These tools are provided by software companies that deliver software as a service (SaaS) platforms to collect, analyze, and measure feedback provided by website visitors. The range of tools and systems reviewed included very small providers and start-ups as well as large companies that generate millions of dollar of revenue annually. Large companies not only provide software tools to collect, analyze, and report customer feedback, but offer diverse services to develop integrated customer feedback solutions and may even provide services that allow businesses to outsource customer feedback management completely to a third party. Integrated solutions for customer feedback management are often referred to as enterprise feedback management (EFM).
A summary of the review is provided in the following section with more detailed descriptions of the specific applications and tools reviewed following the summary.
Basic Versus Integrated Solutions
The research suggests that small software companies, as included in this review, tend to provide simple products focused on one aspect of customer feedback management. Although these products can be very effective, they tend to offer limited customization and limited integration with existing Information Technology (IT) infrastructure. Typically, these providers do not offer consultancy to develop an enterprise solution and provide limited support, sometimes on email-basis only. A plus for these systems is that they typically offer extremely affordable service and maintenance terms.
Full-service providers tend to offer complete enterprise solutions that provide varying degrees of outsourcing the customer feedback management process to the provider. Using their experience with large-scale implementations, these providers may offer to design feedback systems from the ground up, design and oversee a plan for integrating the system, and develop a plan for monitoring, interpreting, and acting upon the data. The providers may even offer personnel to maintain the system and act upon customer feedback. These providers often work with large businesses that focus on integrated customer retention and business improvement solutions. Once implemented, a main portion of the service provided may focuses on analyzing feedback data, developing action plans, and the management of the data including customer service and response. Although all providers offer tools to collect, monitor, and act upon feedback data, some of them work with feedback tools that are already implemented at the customer’s site. As the level of the sophistication increases, solutions become more expensive to integrate and maintain.
104
There are also several providers that fall somewhere in between those two categories. Often these are providers who provide a feedback management tool with some support for integration, but can provide significant additional services upon request.
Targeted Feedback versus Idea Forum Tools
Feedback tools for the most part follow one of two main approaches to collect feedback, which can be described as targeted feedback and idea forums. Using targeted feedback, a company develops a survey or questionnaire that is typically short and consists of only one question or just a few questions. Surveys can be tied to and/or vary depending on a certain product, webpage, or search term. After answering the question, customers can typically provide additional feedback. This feedback can be provided anonymously, or an email address can be provided that allows the company to follow up on the comment.
Idea forums are more open in that they let customers provide comments to issues or ideas generated by the business, or let customers develop ideas that can be viewed and discussed among all customers. These tools are very useful to generate new ideas and get feedback from other customers. They also avoid duplication of certain issues, since customers can see the existing discussion if they encounter a problem or come up with an idea that is already being discussed. Customers can also vote on certain issues, ideas, or requests to help businesses prioritize. A drawback of these tools is that some of them can be subject to comments of a “vocal minority” of users, which some tools handle by limiting the number of votes each user has. The tools require a moderator to prevent typical issues such as trolling, spam, and profanity, although most tools provide built-in filters that filter the majority of profanity and spam. Users are also required to sign-up before participating in feedback and idea forums.
More recently, several tools have combined both approaches by providing a site-specific feedback button that includes a list of ideas that are being discussed in a related feedback forum, along with a link to participate in that forum.
Other Tools to Collect Feedback
In addition to targeted feedback and idea forums, there are several other tools or systems that can be used to collect customer feedback. These tools include mobile feedback, texting systems, and citizen request systems. Using mobile feedback, businesses often provide a quick response (QR) code that customers can scan using a smartphone. The code then brings up a website where customers can leave feedback using their mobile device. Texting systems can provide information and support to customers via text messages to mobile devices. These systems also allow users to text back with additional questions. Businesses can use the system to receive targeted feedback on certain questions. Citizen request systems use smart phone applications that allow customers to send request directly to the appropriate government department. Using a mapping interface, the customer may be able to provide the location of the problem, then add a description, and finally attach a picture before sending it off.
Tools and Providers Included in the Review
There are numerous tools and providers available to help with the development of customer feedback management systems. This section focuses on tools that have been successfully used
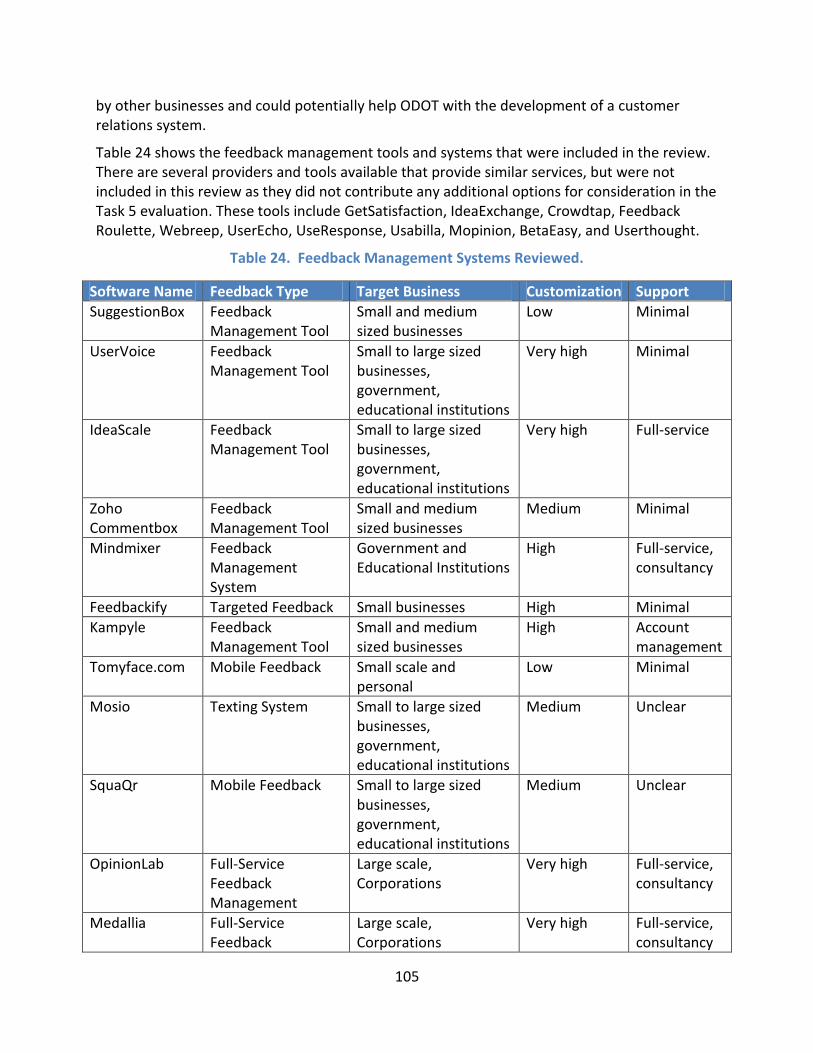
105
by other businesses and could potentially help ODOT with the development of a customer relations system.
Table 24 shows the feedback management tools and systems that were included in the review. There are several providers and tools available that provide similar services, but were not included in this review as they did not contribute any additional options for consideration in the Task 5 evaluation. These tools include GetSatisfaction, IdeaExchange, Crowdtap, Feedback Roulette, Webreep, UserEcho, UseResponse, Usabilla, Mopinion, BetaEasy, and Userthought.
Table 24. Feedback Management Systems Reviewed.
Software Name Feedback Type Target Business Customization Support
SuggestionBox Feedback Management Tool
Small and medium sized businesses
Low Minimal
UserVoice Feedback Management Tool
Small to large sized businesses, government, educational institutions
Very high Minimal
IdeaScale Feedback Management Tool
Small to large sized businesses, government, educational institutions
Very high Full-service
Zoho Commentbox
Feedback Management Tool
Small and medium sized businesses
Medium Minimal
Mindmixer Feedback Management System
Government and Educational Institutions
High Full-service, consultancy
Feedbackify Targeted Feedback Small businesses High Minimal
Kampyle Feedback Management Tool
Small and medium sized businesses
High Account management
Tomyface.com Mobile Feedback Small scale and personal
Low Minimal
Mosio Texting System Small to large sized businesses, government, educational institutions
Medium Unclear
SquaQr Mobile Feedback Small to large sized businesses, government, educational institutions
Medium Unclear
OpinionLab Full-Service Feedback Management
Large scale, Corporations
Very high Full-service, consultancy
Medallia Full-Service Feedback
Large scale, Corporations
Very high Full-service, consultancy
106
Management
Yourgov Citizen Request Tool Governments and Municipalities
Low Full-service, consultancy
The feedback management tools and systems vary considerably in terms of targeted business, level of customization, level of support, and cost to implement and maintain, among many other metrics. Table 24 provides a quick overview of some significant differences between the tools that the research team evaluated.
General Observations about Third-Party Applications
While reviewing software tools available to collect feedback, the research team took note of the following items, which may or may not be a concern for the development of a customer relations system at ODOT:
Some third-party software providers reserve the right to modify their terms and conditions and privacy policy at any time for any reason.
Some tools route users to a third-party site to provide feedback. Users may be reluctant to provide personal information using a third-party site for fear that the company may use or sell personal information to other companies. Often a provider’s privacy policy may include a provision that the site may share some or all of a user’s personal information with an affiliate company.
Depending on the provider, a site may or may not delete all information about a user from active databases and archives upon termination of an account.
Depending on the provider, service plans may be modified at any time, often simply by posting the change on the provider’s website. Continued use of the website after posting the changes may constitute acceptance of the new terms. Service plans and user accounts may also be subject to termination at any time without notice.
Personal information stored at the provider’s site is subject to security risks. The level of risk depends on the provider’s care to secure the data.
Sensitive data may travel through infrastructure that is outside of the control of the third-party software provider. Claims with respect to the security of the data may exclude the infrastructure which is outside of the control of the third-party software provider.
Service is typically provided “as is,” “where is,” “as available,” and “with all faults,” and providers typically refuse any responsibility or liability for the loss or deletion of any data stored or transmitted. As such, data that is stored on behalf of a business is usually excluded from claims, damages, and liabilities.
Liability of the third-party software provider is often limited to a year’s worth of fees collected for their services.
Agreement terms usually include a disclaimer that the software company makes no warranties with regard to limitation of service, platforms, or application programming interfaces.
Some sites require the use of temporary or persistent cookies to work correctly, and collect information about how users use the service via these cookies. Others use
107
services that collect data remotely by using "pixel tags," "web beacons," "clear GIFs," or similar technologies, such as Facebook Connect, Google +1, Twitter Badge, and others. Such technologies can recognize certain types of information on a web browser, check whether a user viewed a particular web page or email message, and determine, among other things, the time, date, and IP address of the computer from which they were viewed.
Few providers guarantee up time for the webpage or services provided.
The following review includes a description of each process, system, tool, or software to develop customer relations, followed by an account of the tools purpose, its features, apparent benefits, and apparent drawbacks. For each software provider, the research team also provides an assessment of general Internet reach and reputation using web metrics collected by alexa.com 29. These metrics include U.S. traffic rank, which is an estimate of a site’s popularity in the U.S. based on the average number of visitors to a site and the number of page views on the site. Another metric is site reputation, which counts the number of other sites that are linking to the site of interest. Each review concludes with an assessment of how applicable the process, system, tool, or software would be to ODOT.
REVIEW OF FEEDBACK MANAGEMENT SYSTEMS
SuggestionBox
Purpose
The purpose of the software is to provide a platform that allows business customers to provide suggestions using the Internet in addition to the commonly found physical suggestion boxes at business locations.
Features
The software lets users submit suggestions to business subscribers after registering with the site. The software requires that users provide the following at registration: name, email address, username, and password. Once registered, users select the business subscriber for which they want to provide a suggestion. If the business has not yet received suggestions via the site, the user can set up a new suggestion box for that business. To set up a new suggestion box, the user must provide a company email to which the suggestion should be sent.
Although all users of the site must register, suggestions can be submitted anonymously by clicking a checkbox. This allows the business subscriber to review the suggestion without receiving information about the person that submitted the suggestion. Users have their own email inbox where they can store suggestions and track the status of each. Business subscribers can reply directly to each suggestion.
Public suggestions can be viewed, followed, and rated by other users. If users follow suggestions they receive status updates. Public suggestions can be listed in the following categories: latest, top rated, under review, future, coming soon, implemented, and filed away.
29
http://www.alexa.com/
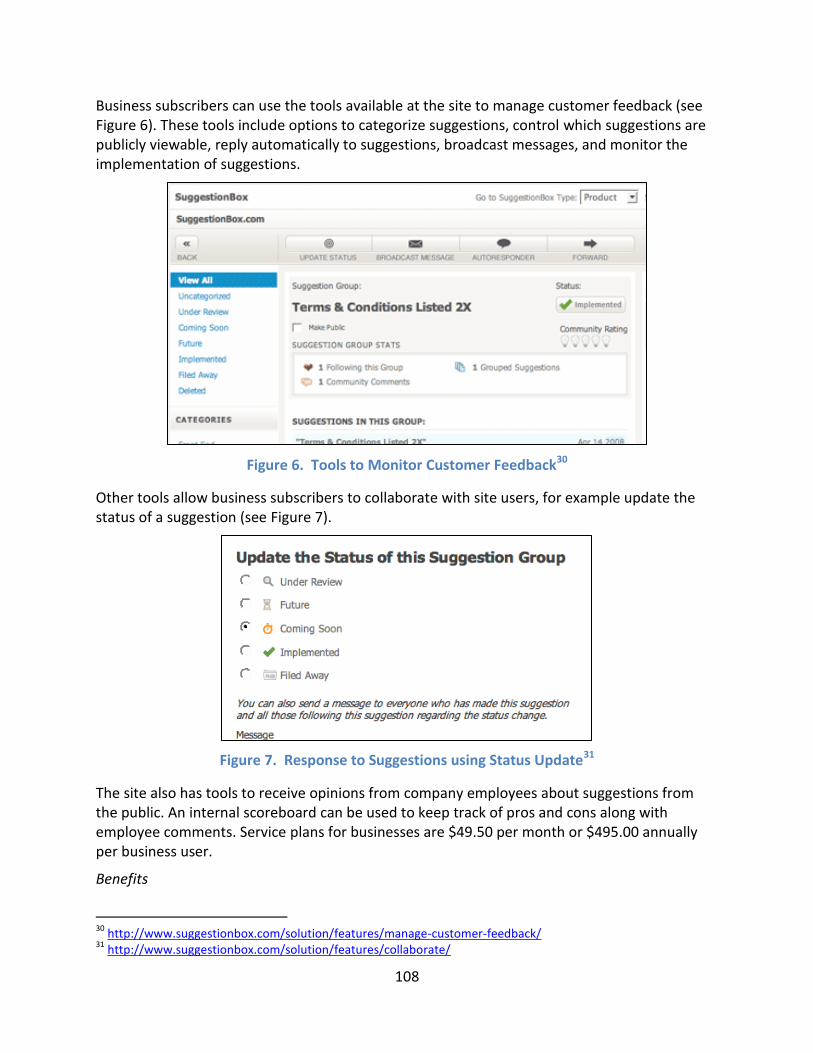
108
Business subscribers can use the tools available at the site to manage customer feedback (see Figure 6). These tools include options to categorize suggestions, control which suggestions are publicly viewable, reply automatically to suggestions, broadcast messages, and monitor the implementation of suggestions.
Figure 6. Tools to Monitor Customer Feedback30
Other tools allow business subscribers to collaborate with site users, for example update the status of a suggestion (see Figure 7).
Figure 7. Response to Suggestions using Status Update31
The site also has tools to receive opinions from company employees about suggestions from the public. An internal scoreboard can be used to keep track of pros and cons along with employee comments. Service plans for businesses are $49.50 per month or $495.00 annually per business user.
Benefits
30
http://www.suggestionbox.com/solution/features/manage-customer-feedback/ 31
http://www.suggestionbox.com/solution/features/collaborate/
109
Low implementation and maintenance cost.
Users may see suggestions from other users and can rate the suggestion and/or follow responses to the suggestion.
Drawbacks
This is a third-party application that reserves the right to modify their terms and conditions and privacy policy at any time for any reason.
Requires user registration.
Users may be reluctant to provide personal information using this site for fear that the company may use or sell personal information to other companies. The privacy policy includes a provision that the site “…may share some or all of your personal information with any parent company, subsidiary, joint venture partner, or other company under common control with us…” Upon termination of an account, the site will delete information about a user from active databases, but personal information may remain in archives maintained by the site.
Service plans may be modified at any time by posting changes to the company’s website. Use of the website after posting the changes automatically constitutes acceptance of the new terms. Service plans and user accounts can be terminated at any time without notice.
The site requires the use of temporary or persistent cookies to work correctly, and collects information about how users use the service via cookies. It appears that the site uses at a minimum CrazyEgg and Google Analytics trackers. Information collected via cookie may be provided to customers in form of audience tracking data.
While reviewing the site, performance was occasionally poor, and for some period of time the site was not reachable. There appear to be no performance guarantees for business subscribers.
Assessment of Applicability to ODOT
Using the tool would require a low investment, and implementation would be relatively straightforward.
Appears to be a follower/laggard in the field of feedback applications. It has an Alexa rank of 258,382 in the U.S. as of 11/27/2012.32
The long-term viability of the software provider is unclear.
Customers would provide feedback indirectly to ODOT via a third party, which may be a concern.
Performance of the software tool might be an issue.
The provider offers few guarantees and little support without a dedicated account manager.
UserVoice
Purpose
32
http://www.alexa.com/siteinfo/suggestionbox.com
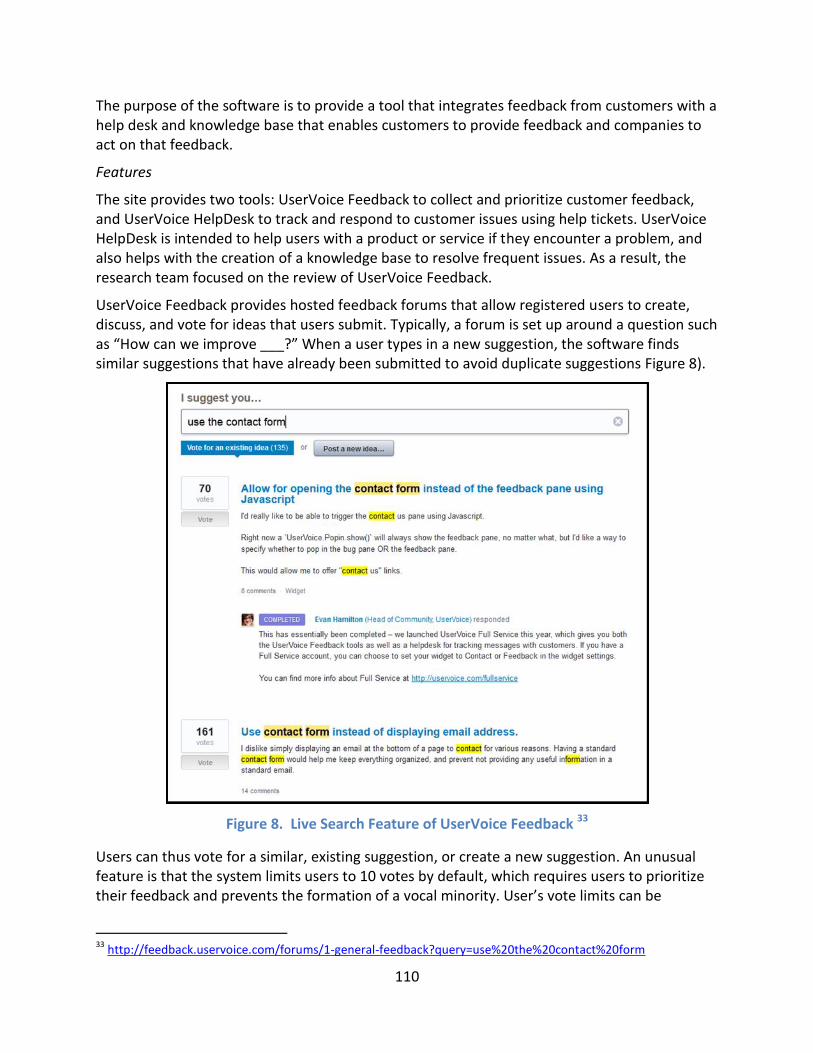
110
The purpose of the software is to provide a tool that integrates feedback from customers with a help desk and knowledge base that enables customers to provide feedback and companies to act on that feedback.
Features
The site provides two tools: UserVoice Feedback to collect and prioritize customer feedback, and UserVoice HelpDesk to track and respond to customer issues using help tickets. UserVoice HelpDesk is intended to help users with a product or service if they encounter a problem, and also helps with the creation of a knowledge base to resolve frequent issues. As a result, the research team focused on the review of UserVoice Feedback.
UserVoice Feedback provides hosted feedback forums that allow registered users to create, discuss, and vote for ideas that users submit. Typically, a forum is set up around a question such as “How can we improve ___?” When a user types in a new suggestion, the software finds similar suggestions that have already been submitted to avoid duplicate suggestions Figure 8).
Figure 8. Live Search Feature of UserVoice Feedback 33
Users can thus vote for a similar, existing suggestion, or create a new suggestion. An unusual feature is that the system limits users to 10 votes by default, which requires users to prioritize their feedback and prevents the formation of a vocal minority. User’s vote limits can be
33
http://feedback.uservoice.com/forums/1-general-feedback?query=use%20the%20contact%20form
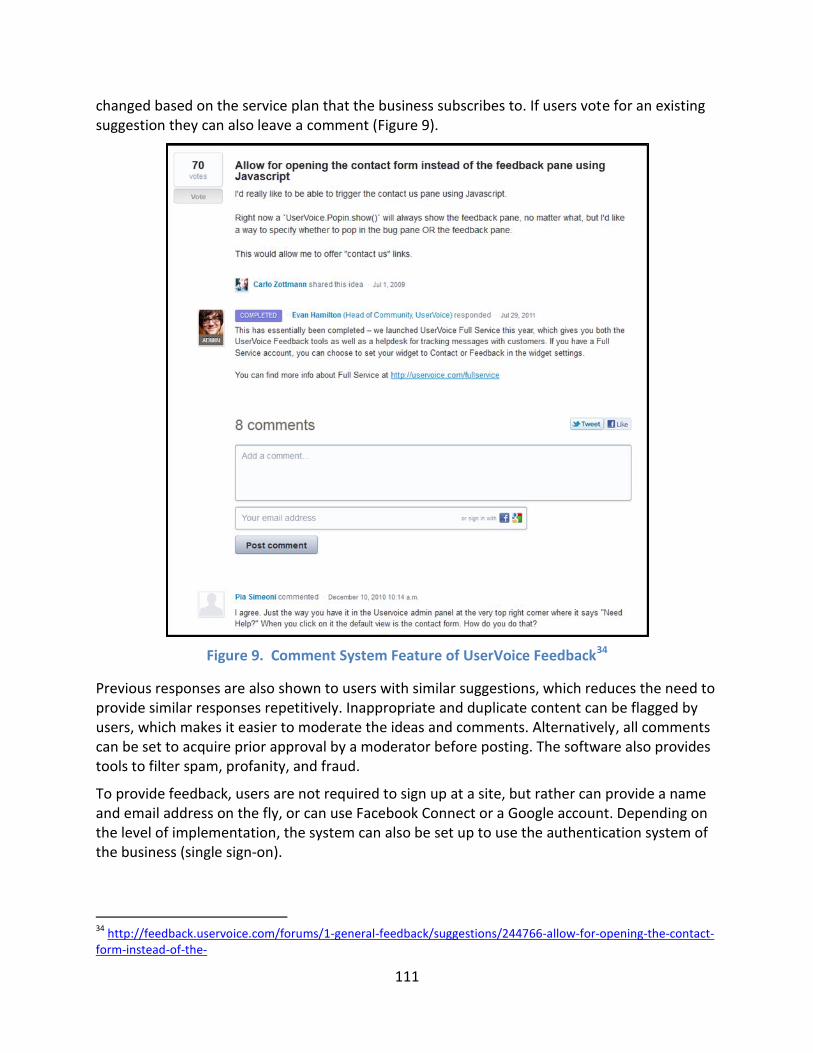
111
changed based on the service plan that the business subscribes to. If users vote for an existing suggestion they can also leave a comment (Figure 9).
Figure 9. Comment System Feature of UserVoice Feedback34
Previous responses are also shown to users with similar suggestions, which reduces the need to provide similar responses repetitively. Inappropriate and duplicate content can be flagged by users, which makes it easier to moderate the ideas and comments. Alternatively, all comments can be set to acquire prior approval by a moderator before posting. The software also provides tools to filter spam, profanity, and fraud.
To provide feedback, users are not required to sign up at a site, but rather can provide a name and email address on the fly, or can use Facebook Connect or a Google account. Depending on the level of implementation, the system can also be set up to use the authentication system of the business (single sign-on).
34
http://feedback.uservoice.com/forums/1-general-feedback/suggestions/244766-allow-for-opening-the-contact-form-instead-of-the-
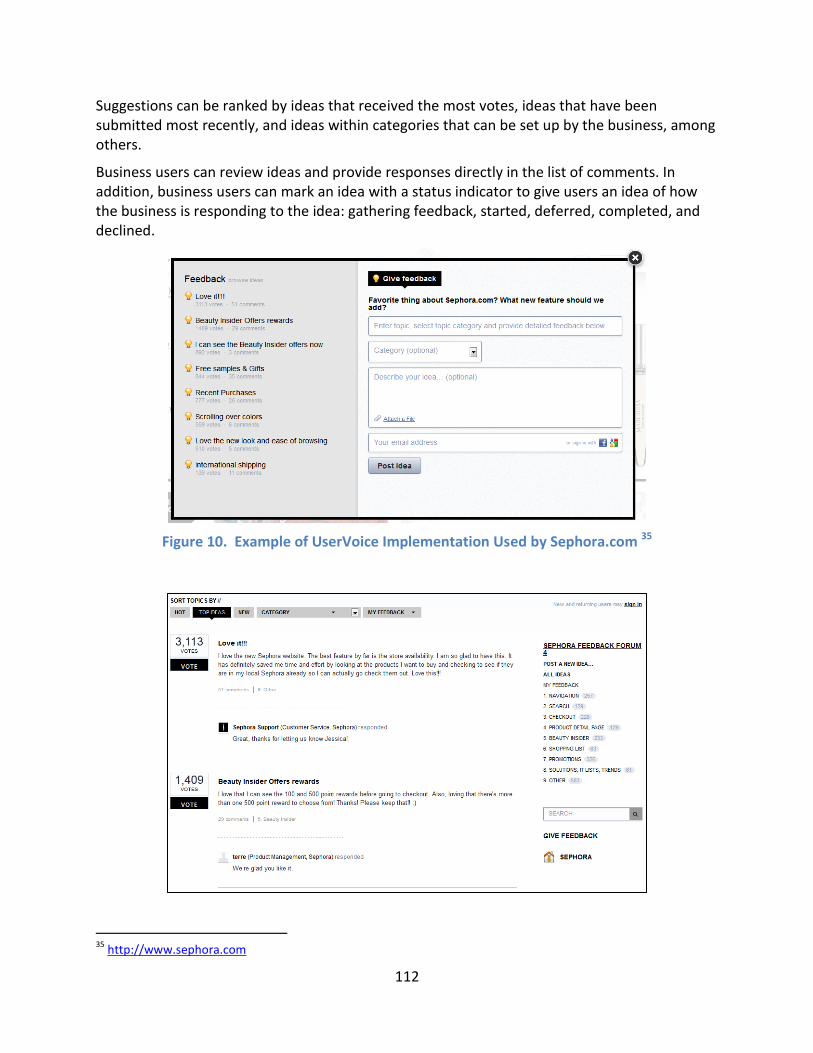
112
Suggestions can be ranked by ideas that received the most votes, ideas that have been submitted most recently, and ideas within categories that can be set up by the business, among others.
Business users can review ideas and provide responses directly in the list of comments. In addition, business users can mark an idea with a status indicator to give users an idea of how the business is responding to the idea: gathering feedback, started, deferred, completed, and declined.
Figure 10. Example of UserVoice Implementation Used by Sephora.com 35
35
http://www.sephora.com
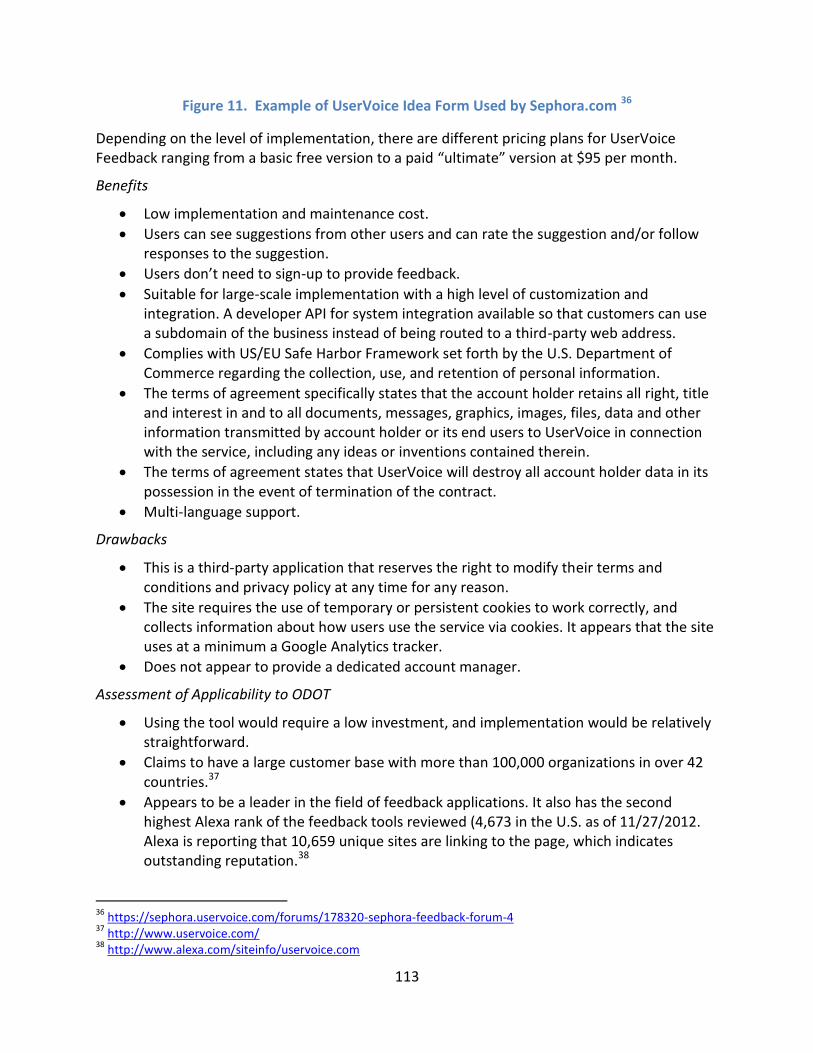
113
Figure 11. Example of UserVoice Idea Form Used by Sephora.com 36
Depending on the level of implementation, there are different pricing plans for UserVoice Feedback ranging from a basic free version to a paid “ultimate” version at $95 per month.
Benefits
Low implementation and maintenance cost.
Users can see suggestions from other users and can rate the suggestion and/or follow responses to the suggestion.
Users don’t need to sign-up to provide feedback.
Suitable for large-scale implementation with a high level of customization and integration. A developer API for system integration available so that customers can use a subdomain of the business instead of being routed to a third-party web address.
Complies with US/EU Safe Harbor Framework set forth by the U.S. Department of Commerce regarding the collection, use, and retention of personal information.
The terms of agreement specifically states that the account holder retains all right, title and interest in and to all documents, messages, graphics, images, files, data and other information transmitted by account holder or its end users to UserVoice in connection with the service, including any ideas or inventions contained therein.
The terms of agreement states that UserVoice will destroy all account holder data in its possession in the event of termination of the contract.
Multi-language support.
Drawbacks
This is a third-party application that reserves the right to modify their terms and conditions and privacy policy at any time for any reason.
The site requires the use of temporary or persistent cookies to work correctly, and collects information about how users use the service via cookies. It appears that the site uses at a minimum a Google Analytics tracker.
Does not appear to provide a dedicated account manager.
Assessment of Applicability to ODOT
Using the tool would require a low investment, and implementation would be relatively straightforward.
Claims to have a large customer base with more than 100,000 organizations in over 42 countries.37
Appears to be a leader in the field of feedback applications. It also has the second highest Alexa rank of the feedback tools reviewed (4,673 in the U.S. as of 11/27/2012. Alexa is reporting that 10,659 unique sites are linking to the page, which indicates outstanding reputation.38
36
https://sephora.uservoice.com/forums/178320-sephora-feedback-forum-4 37
http://www.uservoice.com/ 38
http://www.alexa.com/siteinfo/uservoice.com
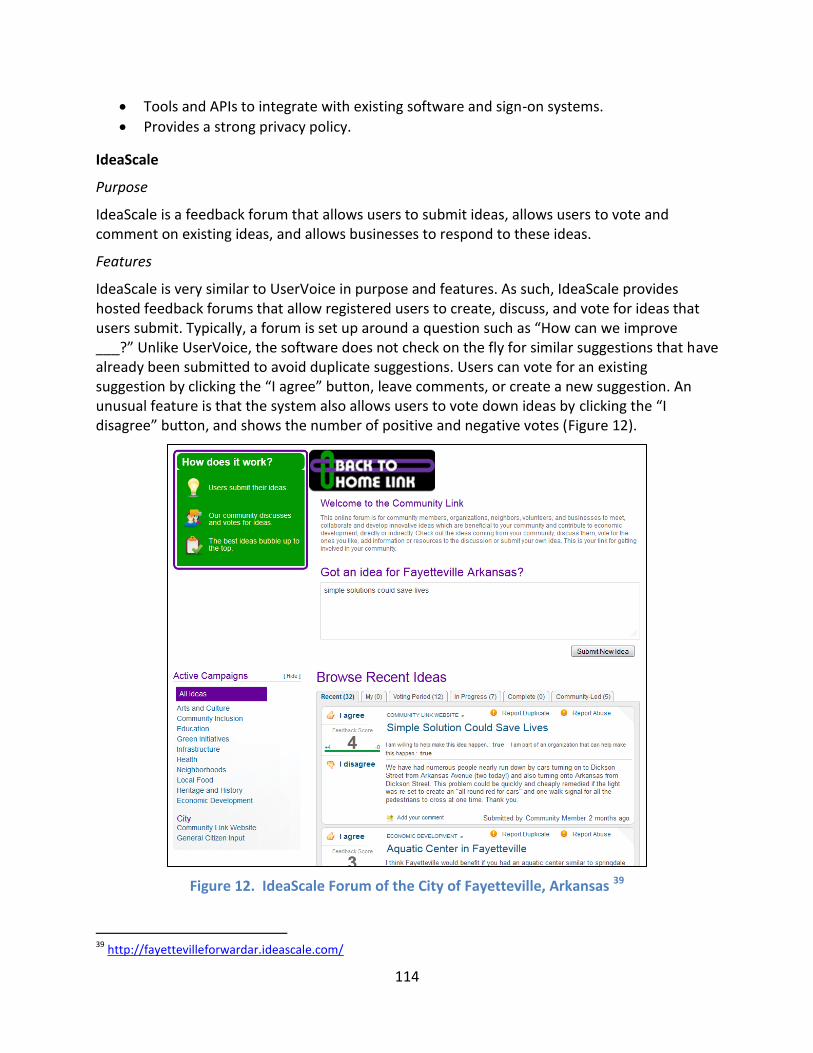
114
Tools and APIs to integrate with existing software and sign-on systems.
Provides a strong privacy policy.
IdeaScale
Purpose
IdeaScale is a feedback forum that allows users to submit ideas, allows users to vote and comment on existing ideas, and allows businesses to respond to these ideas.
Features
IdeaScale is very similar to UserVoice in purpose and features. As such, IdeaScale provides hosted feedback forums that allow registered users to create, discuss, and vote for ideas that users submit. Typically, a forum is set up around a question such as “How can we improve ___?” Unlike UserVoice, the software does not check on the fly for similar suggestions that have already been submitted to avoid duplicate suggestions. Users can vote for an existing suggestion by clicking the “I agree” button, leave comments, or create a new suggestion. An unusual feature is that the system also allows users to vote down ideas by clicking the “I disagree” button, and shows the number of positive and negative votes (Figure 12).
Figure 12. IdeaScale Forum of the City of Fayetteville, Arkansas 39
39
http://fayettevilleforwardar.ideascale.com/
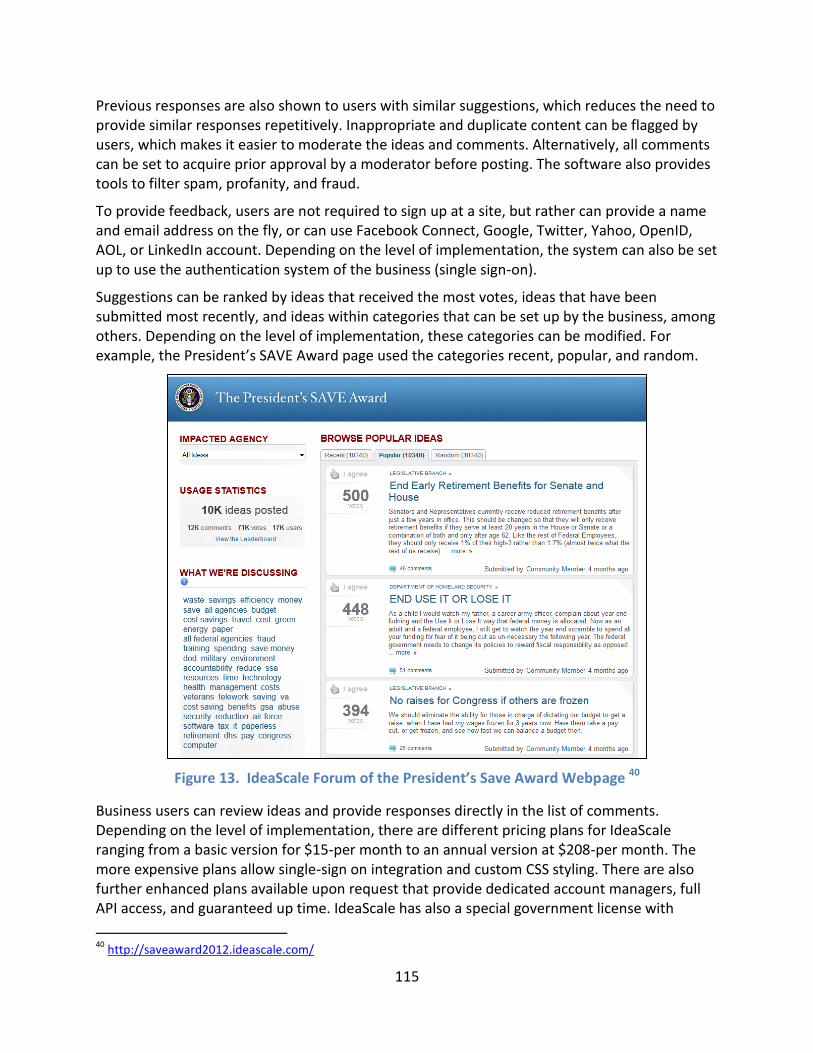
115
Previous responses are also shown to users with similar suggestions, which reduces the need to provide similar responses repetitively. Inappropriate and duplicate content can be flagged by users, which makes it easier to moderate the ideas and comments. Alternatively, all comments can be set to acquire prior approval by a moderator before posting. The software also provides tools to filter spam, profanity, and fraud.
To provide feedback, users are not required to sign up at a site, but rather can provide a name and email address on the fly, or can use Facebook Connect, Google, Twitter, Yahoo, OpenID, AOL, or LinkedIn account. Depending on the level of implementation, the system can also be set up to use the authentication system of the business (single sign-on).
Suggestions can be ranked by ideas that received the most votes, ideas that have been submitted most recently, and ideas within categories that can be set up by the business, among others. Depending on the level of implementation, these categories can be modified. For example, the President’s SAVE Award page used the categories recent, popular, and random.
Figure 13. IdeaScale Forum of the President’s Save Award Webpage 40
Business users can review ideas and provide responses directly in the list of comments. Depending on the level of implementation, there are different pricing plans for IdeaScale ranging from a basic version for $15-per month to an annual version at $208-per month. The more expensive plans allow single-sign on integration and custom CSS styling. There are also further enhanced plans available upon request that provide dedicated account managers, full API access, and guaranteed up time. IdeaScale has also a special government license with
40
http://saveaward2012.ideascale.com/
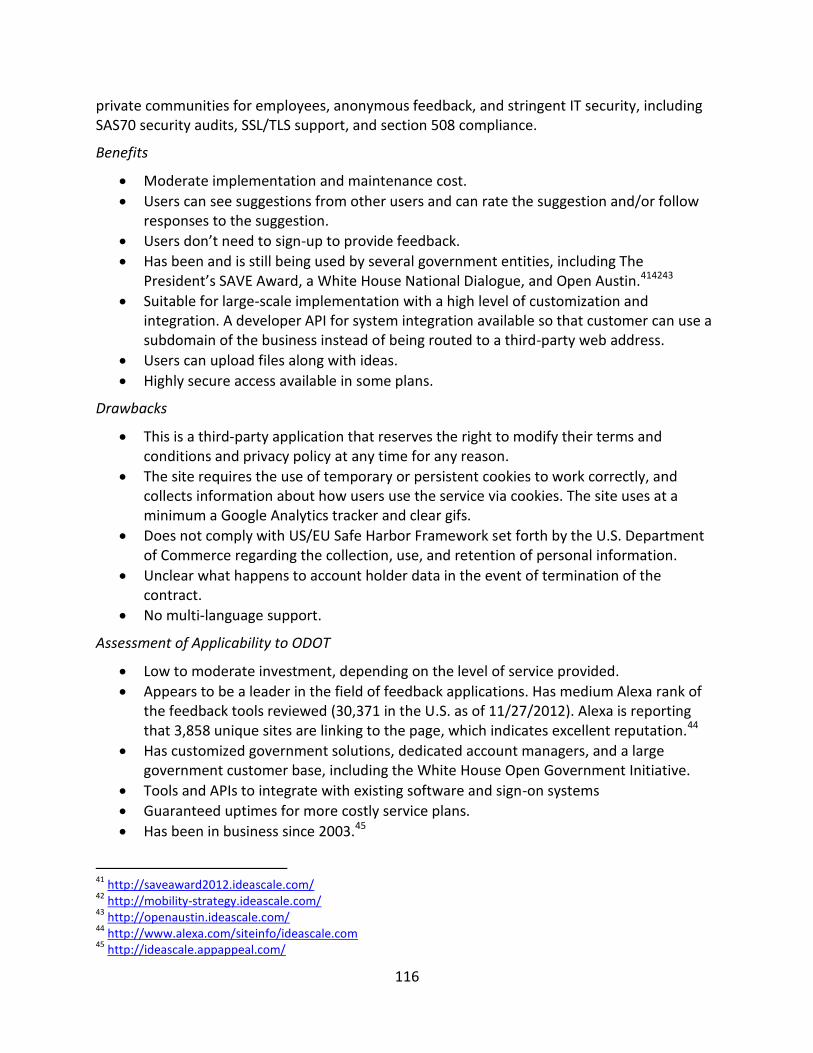
116
private communities for employees, anonymous feedback, and stringent IT security, including SAS70 security audits, SSL/TLS support, and section 508 compliance.
Benefits
Moderate implementation and maintenance cost.
Users can see suggestions from other users and can rate the suggestion and/or follow responses to the suggestion.
Users don’t need to sign-up to provide feedback.
Has been and is still being used by several government entities, including The President’s SAVE Award, a White House National Dialogue, and Open Austin.414243
Suitable for large-scale implementation with a high level of customization and integration. A developer API for system integration available so that customer can use a subdomain of the business instead of being routed to a third-party web address.
Users can upload files along with ideas.
Highly secure access available in some plans.
Drawbacks
This is a third-party application that reserves the right to modify their terms and conditions and privacy policy at any time for any reason.
The site requires the use of temporary or persistent cookies to work correctly, and collects information about how users use the service via cookies. The site uses at a minimum a Google Analytics tracker and clear gifs.
Does not comply with US/EU Safe Harbor Framework set forth by the U.S. Department of Commerce regarding the collection, use, and retention of personal information.
Unclear what happens to account holder data in the event of termination of the contract.
No multi-language support.
Assessment of Applicability to ODOT
Low to moderate investment, depending on the level of service provided.
Appears to be a leader in the field of feedback applications. Has medium Alexa rank of the feedback tools reviewed (30,371 in the U.S. as of 11/27/2012). Alexa is reporting that 3,858 unique sites are linking to the page, which indicates excellent reputation.44
Has customized government solutions, dedicated account managers, and a large government customer base, including the White House Open Government Initiative.
Tools and APIs to integrate with existing software and sign-on systems
Guaranteed uptimes for more costly service plans.
Has been in business since 2003.45
41
http://saveaward2012.ideascale.com/ 42
http://mobility-strategy.ideascale.com/ 43
http://openaustin.ideascale.com/ 44
http://www.alexa.com/siteinfo/ideascale.com 45
http://ideascale.appappeal.com/
117
Zoho Commentbox
Purpose
Zoho Commentbox is a hosted service to connect with customers and collect feedback.
Features
Zoho Commentbox is more recent software that was launched in April of 2012.46 Zoho Commentbox is similar to UserVoice and IdeaScale in purpose but with fewer features and options for customization. Zoho Commentbox provides hosted feedback forums that allow registered users to create, discuss, and vote for ideas that users submit. Zoho Commentbox is the latest addition to a suite of Zoho cloud applications, and is apparently an upgrade of a forum software called Zoho Discussions. A main benefit of Zoho Commentbox is its capability to integrate with Zoho CRM applications.
Users can vote for an existing suggestion by clicking a “thumbs up” button, leave comments, or create a new suggestion. An unusual feature is that the system categorizes feedback into problems, questions, ideas, and appreciations (Figure 14).
Figure 14. Zoho Commentbox Feedback Form47
Comments can be fully moderated or completely open, and users can flag inappropriate content. Businesses can provide a status for a topic to indicate how the business is working on resolving the issue.
46
http://www.zoho.com/commentbox/blog/announcing-zoho-commentbox-online-feedback-management-software.html 47
https://commentbox.zoho.com/
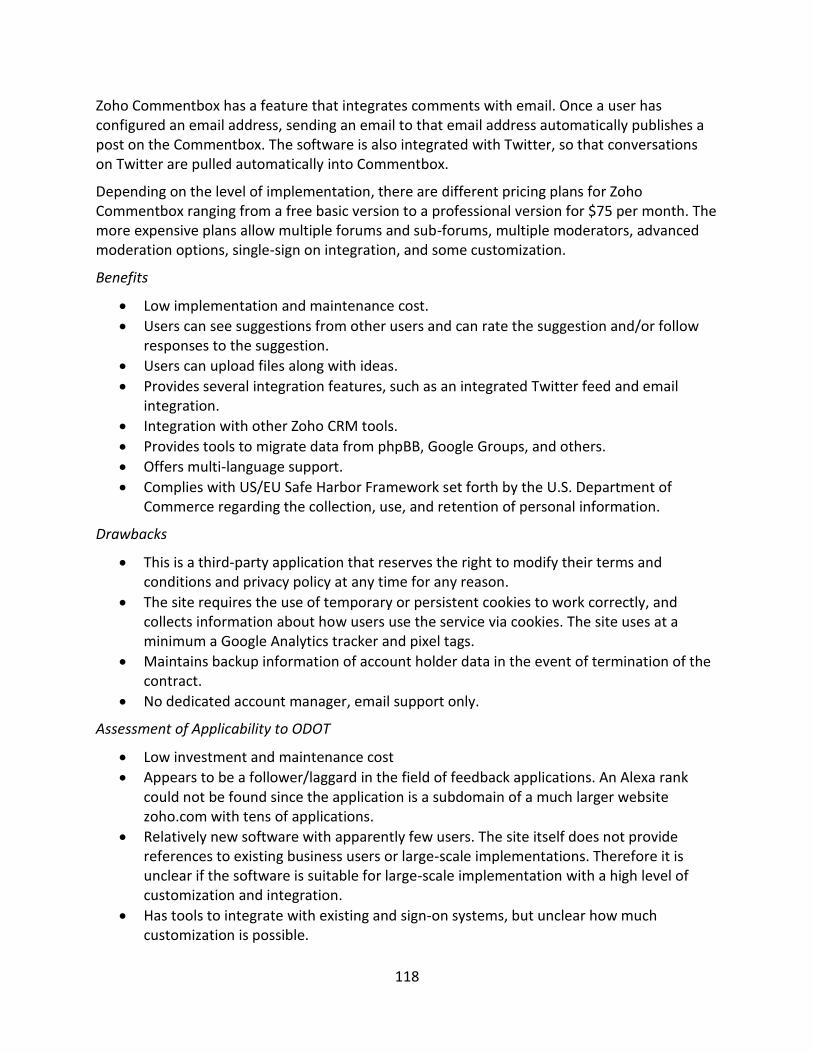
118
Zoho Commentbox has a feature that integrates comments with email. Once a user has configured an email address, sending an email to that email address automatically publishes a post on the Commentbox. The software is also integrated with Twitter, so that conversations on Twitter are pulled automatically into Commentbox.
Depending on the level of implementation, there are different pricing plans for Zoho Commentbox ranging from a free basic version to a professional version for $75 per month. The more expensive plans allow multiple forums and sub-forums, multiple moderators, advanced moderation options, single-sign on integration, and some customization.
Benefits
Low implementation and maintenance cost.
Users can see suggestions from other users and can rate the suggestion and/or follow responses to the suggestion.
Users can upload files along with ideas.
Provides several integration features, such as an integrated Twitter feed and email integration.
Integration with other Zoho CRM tools.
Provides tools to migrate data from phpBB, Google Groups, and others.
Offers multi-language support.
Complies with US/EU Safe Harbor Framework set forth by the U.S. Department of Commerce regarding the collection, use, and retention of personal information.
Drawbacks
This is a third-party application that reserves the right to modify their terms and conditions and privacy policy at any time for any reason.
The site requires the use of temporary or persistent cookies to work correctly, and collects information about how users use the service via cookies. The site uses at a minimum a Google Analytics tracker and pixel tags.
Maintains backup information of account holder data in the event of termination of the contract.
No dedicated account manager, email support only.
Assessment of Applicability to ODOT
Low investment and maintenance cost
Appears to be a follower/laggard in the field of feedback applications. An Alexa rank could not be found since the application is a subdomain of a much larger website zoho.com with tens of applications.
Relatively new software with apparently few users. The site itself does not provide references to existing business users or large-scale implementations. Therefore it is unclear if the software is suitable for large-scale implementation with a high level of customization and integration.
Has tools to integrate with existing and sign-on systems, but unclear how much customization is possible.
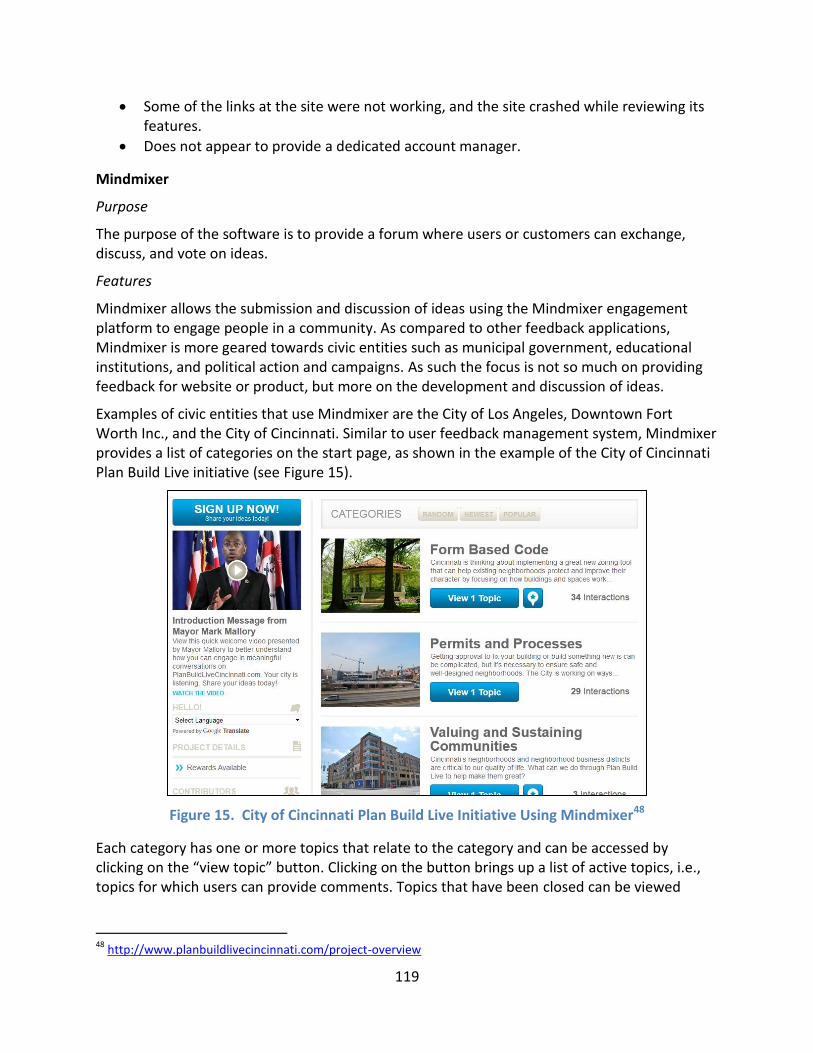
119
Some of the links at the site were not working, and the site crashed while reviewing its features.
Does not appear to provide a dedicated account manager.
Mindmixer
Purpose
The purpose of the software is to provide a forum where users or customers can exchange, discuss, and vote on ideas.
Features
Mindmixer allows the submission and discussion of ideas using the Mindmixer engagement platform to engage people in a community. As compared to other feedback applications, Mindmixer is more geared towards civic entities such as municipal government, educational institutions, and political action and campaigns. As such the focus is not so much on providing feedback for website or product, but more on the development and discussion of ideas.
Examples of civic entities that use Mindmixer are the City of Los Angeles, Downtown Fort Worth Inc., and the City of Cincinnati. Similar to user feedback management system, Mindmixer provides a list of categories on the start page, as shown in the example of the City of Cincinnati Plan Build Live initiative (see Figure 15).
Figure 15. City of Cincinnati Plan Build Live Initiative Using Mindmixer48
Each category has one or more topics that relate to the category and can be accessed by clicking on the “view topic” button. Clicking on the button brings up a list of active topics, i.e., topics for which users can provide comments. Topics that have been closed can be viewed
48
http://www.planbuildlivecincinnati.com/project-overview
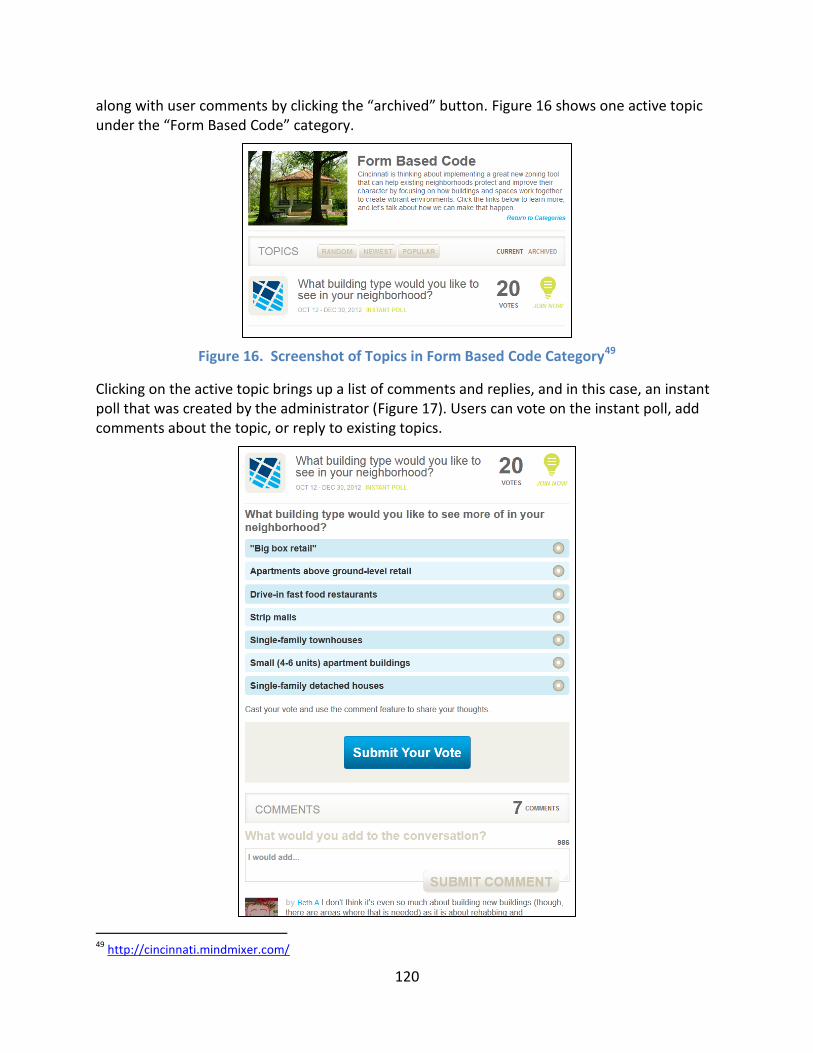
120
along with user comments by clicking the “archived” button. Figure 16 shows one active topic under the “Form Based Code” category.
Figure 16. Screenshot of Topics in Form Based Code Category49
Clicking on the active topic brings up a list of comments and replies, and in this case, an instant poll that was created by the administrator (Figure 17). Users can vote on the instant poll, add comments about the topic, or reply to existing topics.
49
http://cincinnati.mindmixer.com/
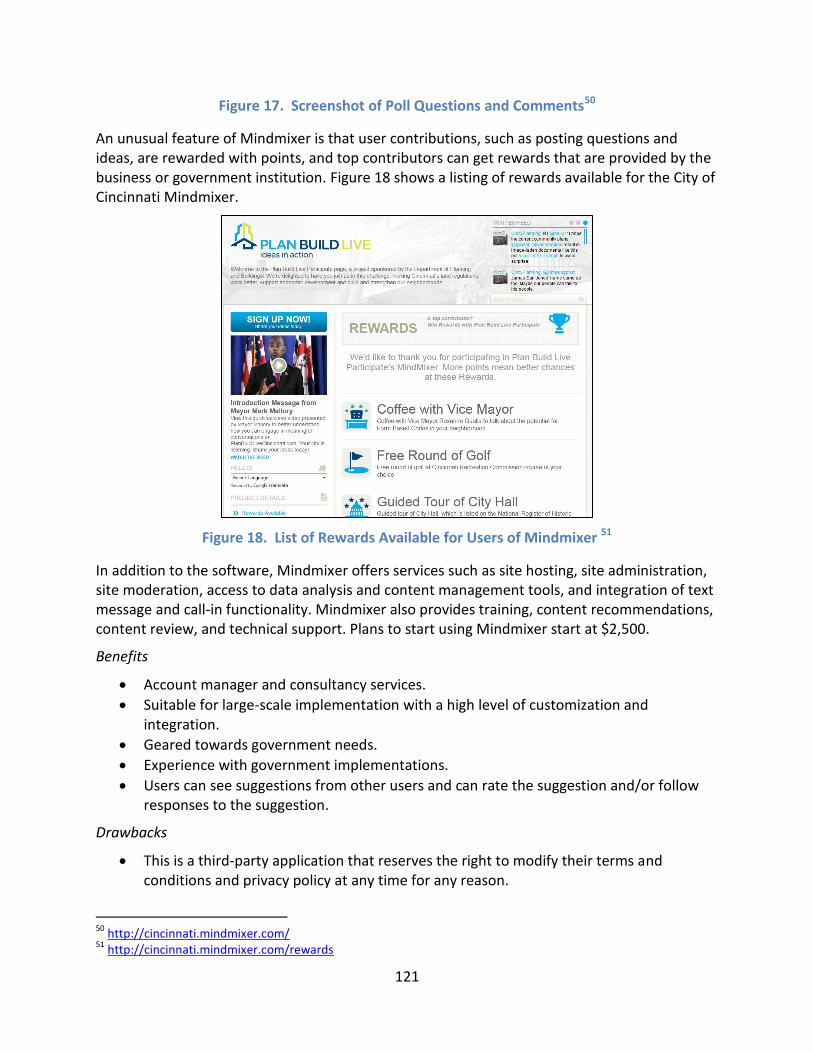
121
Figure 17. Screenshot of Poll Questions and Comments50
An unusual feature of Mindmixer is that user contributions, such as posting questions and ideas, are rewarded with points, and top contributors can get rewards that are provided by the business or government institution. Figure 18 shows a listing of rewards available for the City of Cincinnati Mindmixer.
Figure 18. List of Rewards Available for Users of Mindmixer 51
In addition to the software, Mindmixer offers services such as site hosting, site administration, site moderation, access to data analysis and content management tools, and integration of text message and call-in functionality. Mindmixer also provides training, content recommendations, content review, and technical support. Plans to start using Mindmixer start at $2,500.
Benefits
Account manager and consultancy services.
Suitable for large-scale implementation with a high level of customization and integration.
Geared towards government needs.
Experience with government implementations.
Users can see suggestions from other users and can rate the suggestion and/or follow responses to the suggestion.
Drawbacks
This is a third-party application that reserves the right to modify their terms and conditions and privacy policy at any time for any reason.
50
http://cincinnati.mindmixer.com/ 51
http://cincinnati.mindmixer.com/rewards
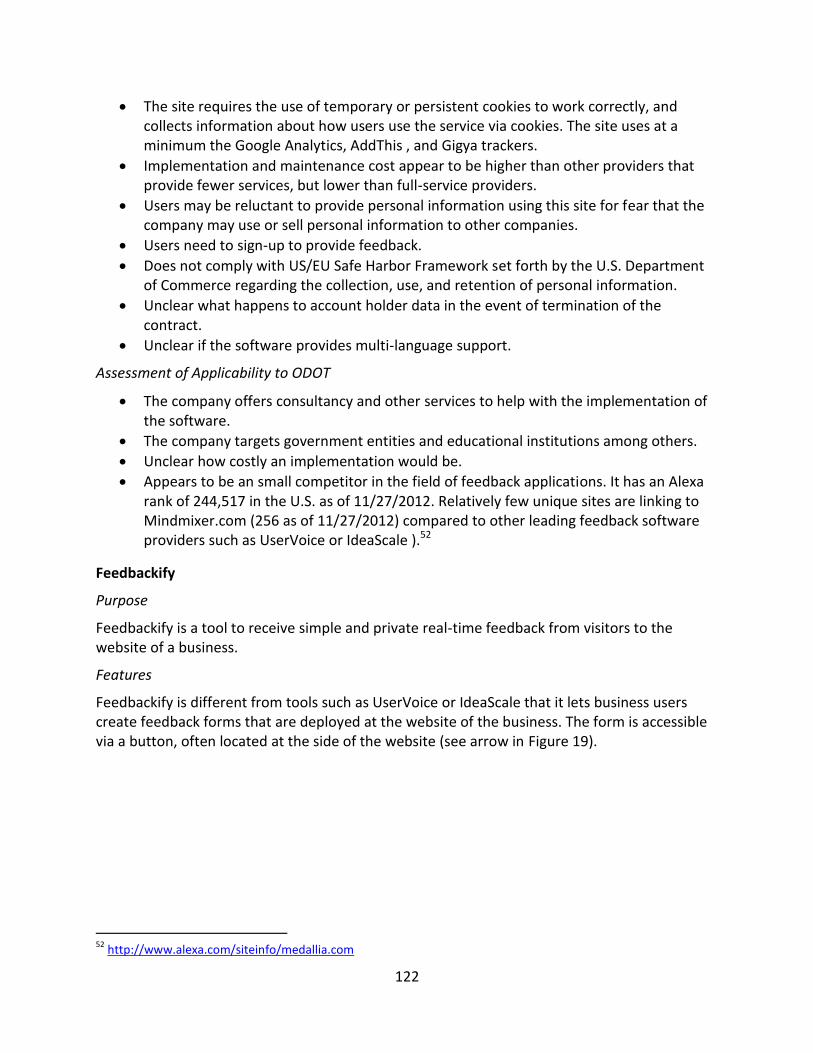
122
The site requires the use of temporary or persistent cookies to work correctly, and collects information about how users use the service via cookies. The site uses at a minimum the Google Analytics, AddThis , and Gigya trackers.
Implementation and maintenance cost appear to be higher than other providers that provide fewer services, but lower than full-service providers.
Users may be reluctant to provide personal information using this site for fear that the company may use or sell personal information to other companies.
Users need to sign-up to provide feedback.
Does not comply with US/EU Safe Harbor Framework set forth by the U.S. Department of Commerce regarding the collection, use, and retention of personal information.
Unclear what happens to account holder data in the event of termination of the contract.
Unclear if the software provides multi-language support.
Assessment of Applicability to ODOT
The company offers consultancy and other services to help with the implementation of the software.
The company targets government entities and educational institutions among others.
Unclear how costly an implementation would be.
Appears to be an small competitor in the field of feedback applications. It has an Alexa rank of 244,517 in the U.S. as of 11/27/2012. Relatively few unique sites are linking to Mindmixer.com (256 as of 11/27/2012) compared to other leading feedback software providers such as UserVoice or IdeaScale ).52
Feedbackify
Purpose
Feedbackify is a tool to receive simple and private real-time feedback from visitors to the website of a business.
Features
Feedbackify is different from tools such as UserVoice or IdeaScale that it lets business users create feedback forms that are deployed at the website of the business. The form is accessible via a button, often located at the side of the website (see arrow in Figure 19).
52
http://www.alexa.com/siteinfo/medallia.com
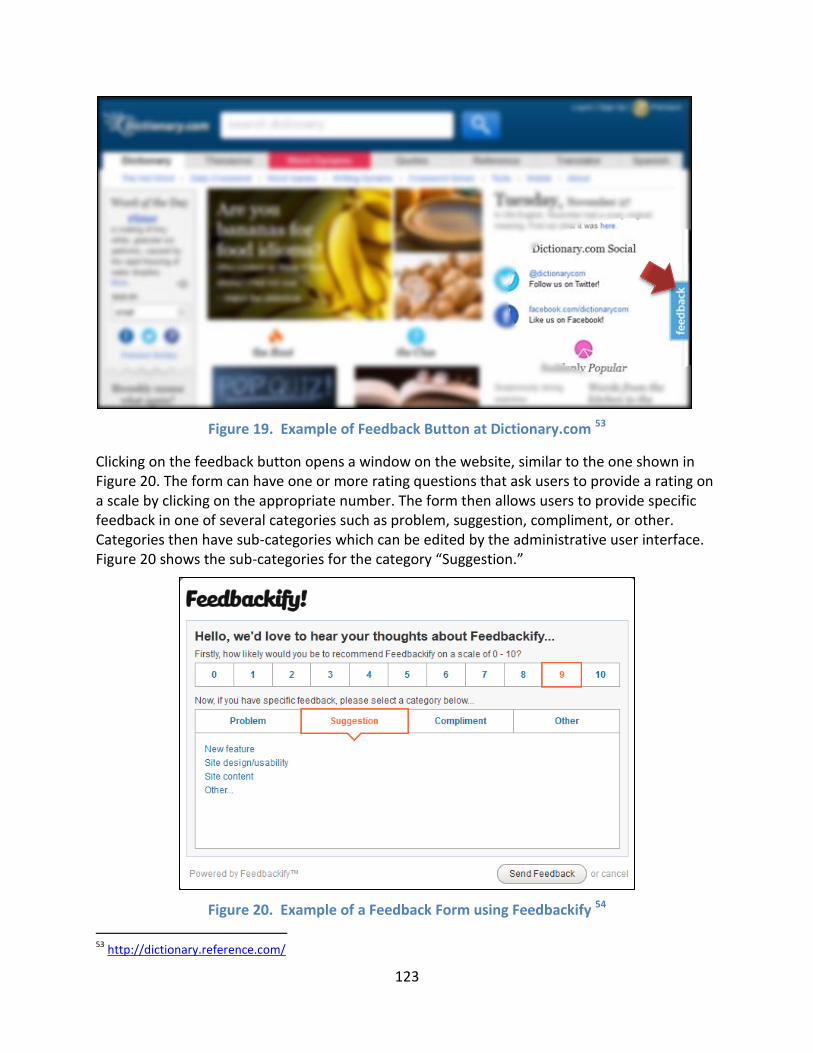
123
Figure 19. Example of Feedback Button at Dictionary.com 53
Clicking on the feedback button opens a window on the website, similar to the one shown in Figure 20. The form can have one or more rating questions that ask users to provide a rating on a scale by clicking on the appropriate number. The form then allows users to provide specific feedback in one of several categories such as problem, suggestion, compliment, or other. Categories then have sub-categories which can be edited by the administrative user interface. Figure 20 shows the sub-categories for the category “Suggestion.”
Figure 20. Example of a Feedback Form using Feedbackify 54
53
http://dictionary.reference.com/
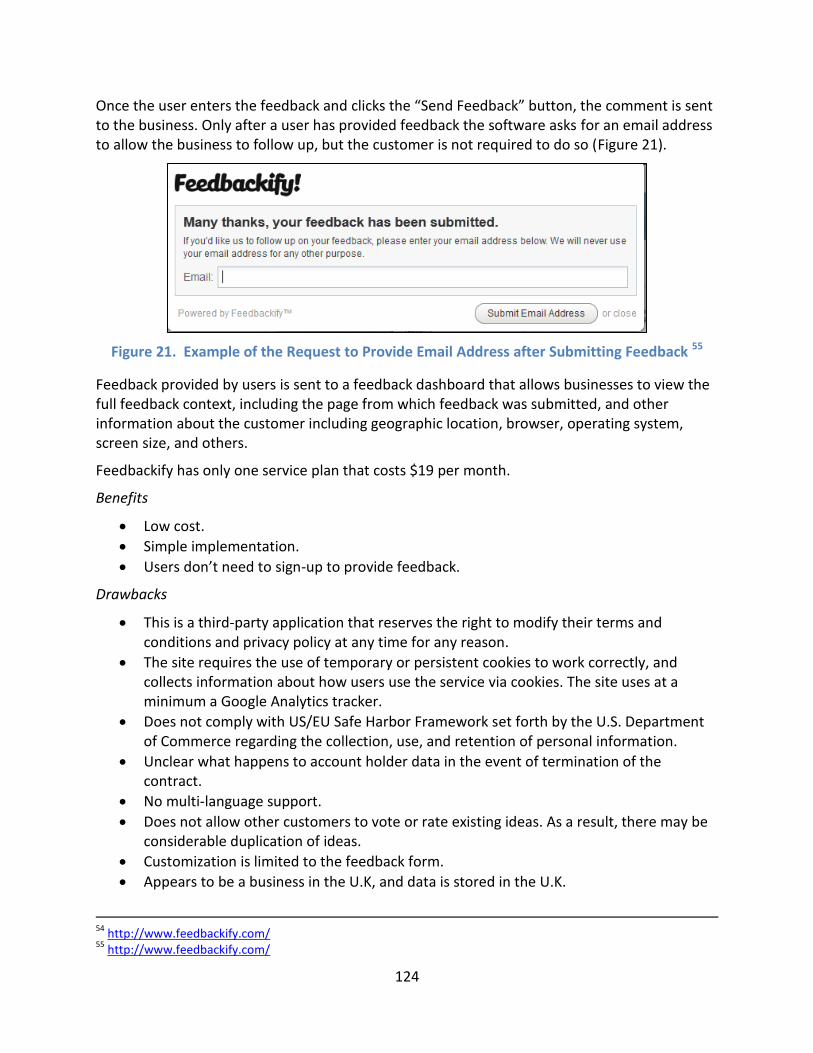
124
Once the user enters the feedback and clicks the “Send Feedback” button, the comment is sent to the business. Only after a user has provided feedback the software asks for an email address to allow the business to follow up, but the customer is not required to do so (Figure 21).
Figure 21. Example of the Request to Provide Email Address after Submitting Feedback 55
Feedback provided by users is sent to a feedback dashboard that allows businesses to view the full feedback context, including the page from which feedback was submitted, and other information about the customer including geographic location, browser, operating system, screen size, and others.
Feedbackify has only one service plan that costs $19 per month.
Benefits
Low cost.
Simple implementation.
Users don’t need to sign-up to provide feedback.
Drawbacks
This is a third-party application that reserves the right to modify their terms and conditions and privacy policy at any time for any reason.
The site requires the use of temporary or persistent cookies to work correctly, and collects information about how users use the service via cookies. The site uses at a minimum a Google Analytics tracker.
Does not comply with US/EU Safe Harbor Framework set forth by the U.S. Department of Commerce regarding the collection, use, and retention of personal information.
Unclear what happens to account holder data in the event of termination of the contract.
No multi-language support.
Does not allow other customers to vote or rate existing ideas. As a result, there may be considerable duplication of ideas.
Customization is limited to the feedback form.
Appears to be a business in the U.K, and data is stored in the U.K.
54
http://www.feedbackify.com/ 55
http://www.feedbackify.com/
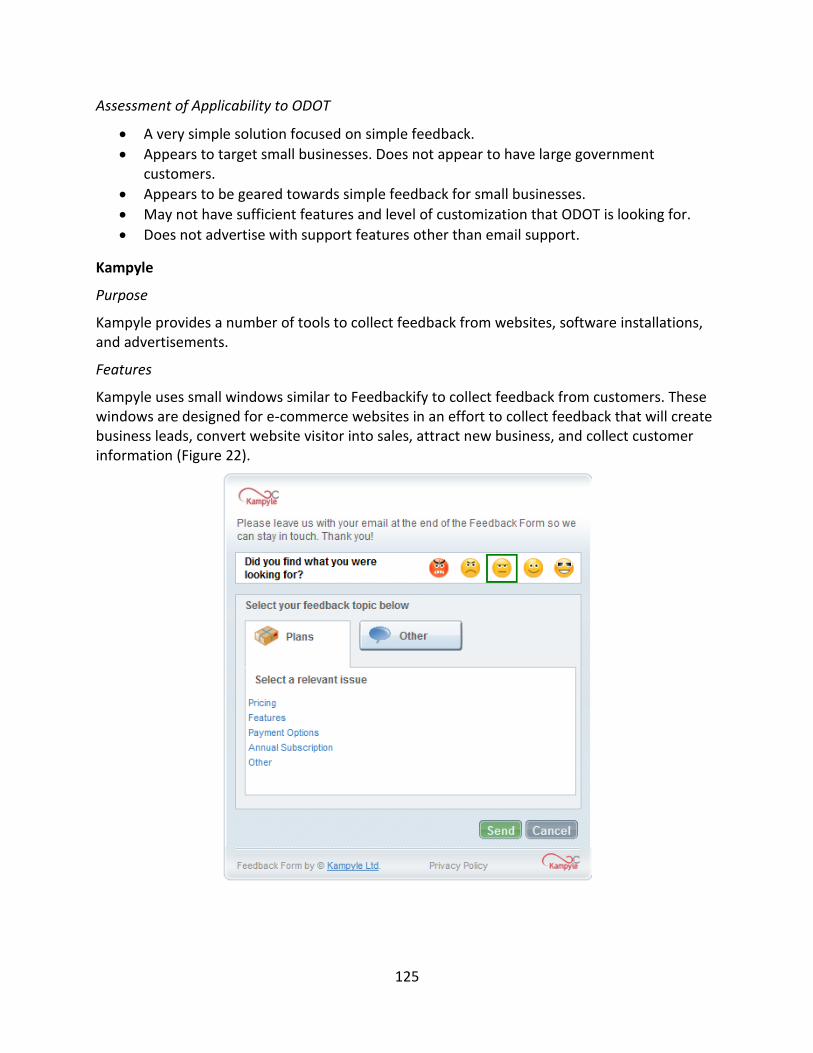
125
Assessment of Applicability to ODOT
A very simple solution focused on simple feedback.
Appears to target small businesses. Does not appear to have large government customers.
Appears to be geared towards simple feedback for small businesses.
May not have sufficient features and level of customization that ODOT is looking for.
Does not advertise with support features other than email support.
Kampyle
Purpose
Kampyle provides a number of tools to collect feedback from websites, software installations, and advertisements.
Features
Kampyle uses small windows similar to Feedbackify to collect feedback from customers. These windows are designed for e-commerce websites in an effort to collect feedback that will create business leads, convert website visitor into sales, attract new business, and collect customer information (Figure 22).
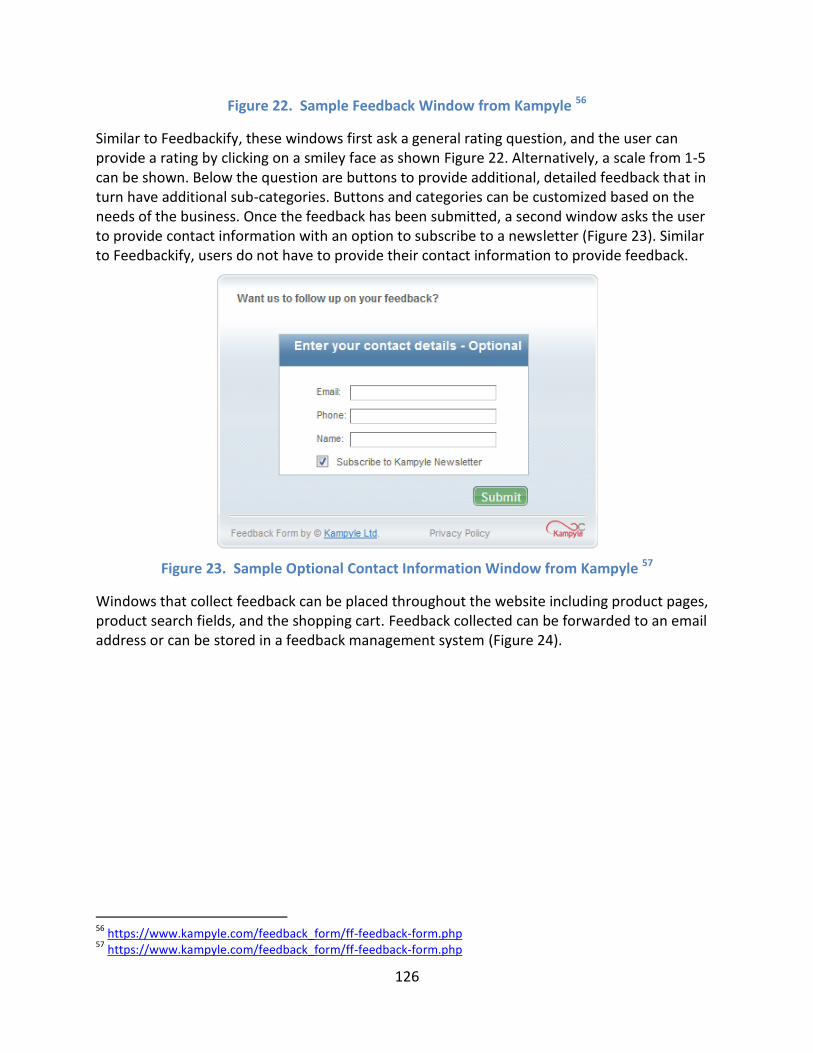
126
Figure 22. Sample Feedback Window from Kampyle 56
Similar to Feedbackify, these windows first ask a general rating question, and the user can provide a rating by clicking on a smiley face as shown Figure 22. Alternatively, a scale from 1-5 can be shown. Below the question are buttons to provide additional, detailed feedback that in turn have additional sub-categories. Buttons and categories can be customized based on the needs of the business. Once the feedback has been submitted, a second window asks the user to provide contact information with an option to subscribe to a newsletter (Figure 23). Similar to Feedbackify, users do not have to provide their contact information to provide feedback.
Figure 23. Sample Optional Contact Information Window from Kampyle 57
Windows that collect feedback can be placed throughout the website including product pages, product search fields, and the shopping cart. Feedback collected can be forwarded to an email address or can be stored in a feedback management system (Figure 24).
56
https://www.kampyle.com/feedback_form/ff-feedback-form.php 57
https://www.kampyle.com/feedback_form/ff-feedback-form.php
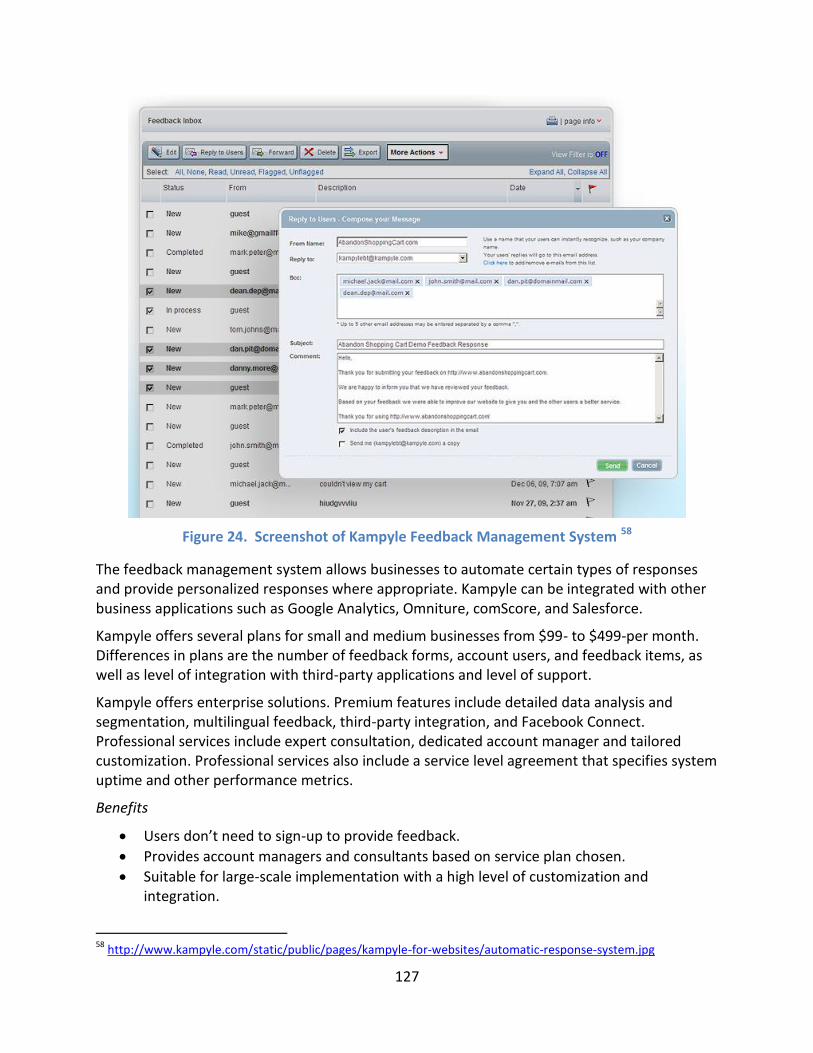
127
Figure 24. Screenshot of Kampyle Feedback Management System 58
The feedback management system allows businesses to automate certain types of responses and provide personalized responses where appropriate. Kampyle can be integrated with other business applications such as Google Analytics, Omniture, comScore, and Salesforce.
Kampyle offers several plans for small and medium businesses from $99- to $499-per month. Differences in plans are the number of feedback forms, account users, and feedback items, as well as level of integration with third-party applications and level of support.
Kampyle offers enterprise solutions. Premium features include detailed data analysis and segmentation, multilingual feedback, third-party integration, and Facebook Connect. Professional services include expert consultation, dedicated account manager and tailored customization. Professional services also include a service level agreement that specifies system uptime and other performance metrics.
Benefits
Users don’t need to sign-up to provide feedback.
Provides account managers and consultants based on service plan chosen.
Suitable for large-scale implementation with a high level of customization and integration.
58
http://www.kampyle.com/static/public/pages/kampyle-for-websites/automatic-response-system.jpg
128
Multi-language support.
Drawbacks
Higher cost than other feedback solutions.
This is a third-party application that reserves the right to modify their terms and conditions and privacy policy at any time for any reason.
The site uses temporary or persistent cookies and collects information about how users use the service via cookies. The site may or may not work without cookies enabled. The site uses at a minimum the Google Analytics and LivePerson trackers.
Does not comply with US/EU Safe Harbor Framework set forth by the U.S. Department of Commerce regarding the collection, use, and retention of personal information.
Unclear what happens to account holder data in the event of termination of the contract.
Does not allow other customers to vote or rate existing ideas. As a result, there may be considerable duplication of ideas.
Kampyle is a business in Israel, and data is being stored in the U.S. and Israel. All matters relating to the use of the site is apparently governed by the laws of the State of Israel.
Assessment of Applicability to ODOT
Geared towards e-commerce and companies whose main product is their website.
Appears to target all sizes of businesses, but does not appear to have large government customers.
Moderate to high cost.
Appears to be an intermediate competitor in the field of feedback applications. It has an Alexa rank of 27,106 in the U.S. as of 11/27/2012.59
Claims to have a large customer base with 55,000 organizations in 191 countries 60
Appears to have sufficient features, integration, and level of customization.
Could be an option for ODOT, but there appear to be better suited competitors.
Tomyface
Purpose
The purpose of Tomyface is to provide a site where businesses can collect and analyze targeted feedback during and immediately after an attendee and customer experience using a feedback ID.
Features
Tomyface provides a website that customers can go to and provide feedback. Businesses can create a feedback form and then use a unique feedback ID to direct customers or conference attendees to the site. Figure 25 shows an example of a feedback form in Tomyface.
59
http://www.alexa.com/siteinfo/kampyle.com 60
http://www.kampyle.com/privacy-policy
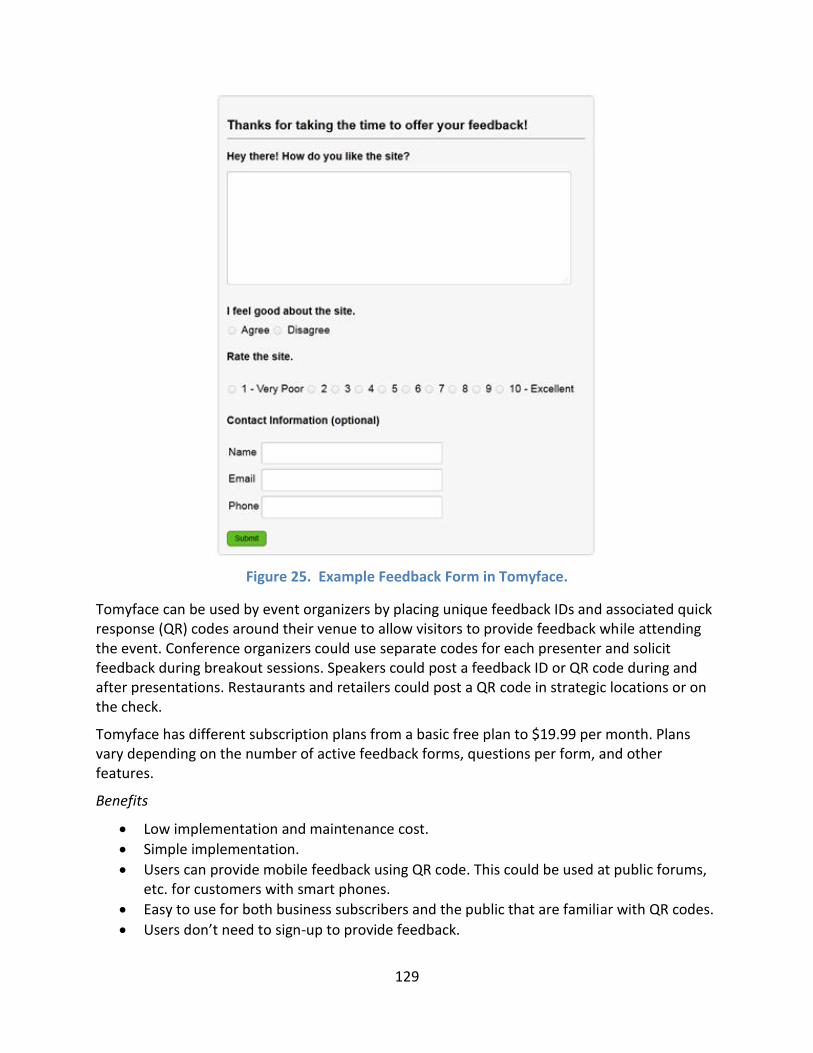
129
Figure 25. Example Feedback Form in Tomyface.
Tomyface can be used by event organizers by placing unique feedback IDs and associated quick response (QR) codes around their venue to allow visitors to provide feedback while attending the event. Conference organizers could use separate codes for each presenter and solicit feedback during breakout sessions. Speakers could post a feedback ID or QR code during and after presentations. Restaurants and retailers could post a QR code in strategic locations or on the check.
Tomyface has different subscription plans from a basic free plan to $19.99 per month. Plans vary depending on the number of active feedback forms, questions per form, and other features.
Benefits
Low implementation and maintenance cost.
Simple implementation.
Users can provide mobile feedback using QR code. This could be used at public forums, etc. for customers with smart phones.
Easy to use for both business subscribers and the public that are familiar with QR codes.
Users don’t need to sign-up to provide feedback.
130
Drawbacks
This is a third-party application that reserves the right to modify their terms and conditions and privacy policy at any time for any reason.
The site requires the use of temporary or persistent cookies to work correctly, and collects information about how users use the service via cookies. The site uses at a minimum a Google Analytics tracker.
Customers are directed to a third party site. Unclear if this can be integrated with existing ODOT systems.
Users may be reluctant to provide personal information using this site for fear that the company may use or sell personal information to other companies.
Does not comply with US/EU Safe Harbor Framework set forth by the U.S. Department of Commerce regarding the collection, use, and retention of personal information.
Customers need a code to provide feedback
Unclear what happens to account holder data in the event of termination of the contract.
No multi-language support.
Does not allow other customers to vote or rate existing ideas. As a result, there may be considerable duplication of ideas.
Customization is limited to the feedback form, email notification, and redirection after the form is filled out.
Assessment of Applicability to ODOT
A very simple solution focused on simple feedback and geared towards mobile uses.
Appears to target personal use and small businesses. Does not appear to have large government customers.
May not have sufficient features and level of customization that ODOT is looking for.
Does not advertise with support features other than email support.
Appears to be a very small competitor in the field of feedback applications. Alexa has no traffic rank for the site, but provides that only 5 sites have linked to the site as of 11/27/2012, which indicates a low site reputation 61
The use of QR codes may be of interest to ODOT to receive mobile feedback at public forums etc.
Mosio
Purpose
Mosio provides software for mobile questions and answers using text messages.
Features
Mosio can be used whenever there is a need to provide answers, alerts, reminders, or other support to customers via text messages. Mosio can also be used to conduct polls and surveys of customers, or provide text support to the workforce of a business. Examples of applications are
61
http://www.alexa.com/siteinfo/tomyface.com#
131
school and campus safety, audience polling, and helplines such as “text a librarian.” Mosio can also be used to collect feedback that customers provide via text messages.
Benefits
Users can provide mobile feedback using a text message. This could be used at public forums etc. for customers with phones that have texting capability.
Easy to use for both business subscribers and the public that have phones with texting capability.
Users don’t need to sign-up to provide feedback, but need to agree to terms of service.
Drawbacks
This is a third-party application that reserves the right to modify their terms and conditions and privacy policy at any time for any reason.
The site requires the use of temporary or persistent cookies to work correctly, and collects information about how users use the service via cookies. The site uses at a minimum a Google Analytics tracker.
It appears that the company does not comply with US/EU Safe Harbor Framework set forth by the U.S. Department of Commerce regarding the collection, use, and retention of personal information.
Service cost is potentially high. Message and data rates from telecommunication providers apply to every text message sent and received.
Requires a phone with texting capabilities on the user side to send or receive feedback.
Users may have to pay for the text messages received.
Unclear what happens to account holder data in the event of termination of the contract.
Multi-language support is unclear.
Voting or rating of existing ideas is very limited. As a result, there may be considerable duplication of ideas.
Assessment of Applicability to ODOT
The website does not provide any cost information. The cost to implement and maintain the system is potentially high based on the fact that it text message-based.
The company appears to have some government customers, e.g., schools that use the software to broadcast alerts at schools and campuses.
The software may not have sufficient features and a level of customization that ODOT is looking for. However, the software could provide additional benefit as part of a larger feedback implementation initiative.
Unclear what level of support the company can provide.
Alexa does not provide information about traffic and use of the site in the U.S. Most of the traffic generated for the site appears to come from India.62
62
http://www.alexa.com/siteinfo/mosio.com
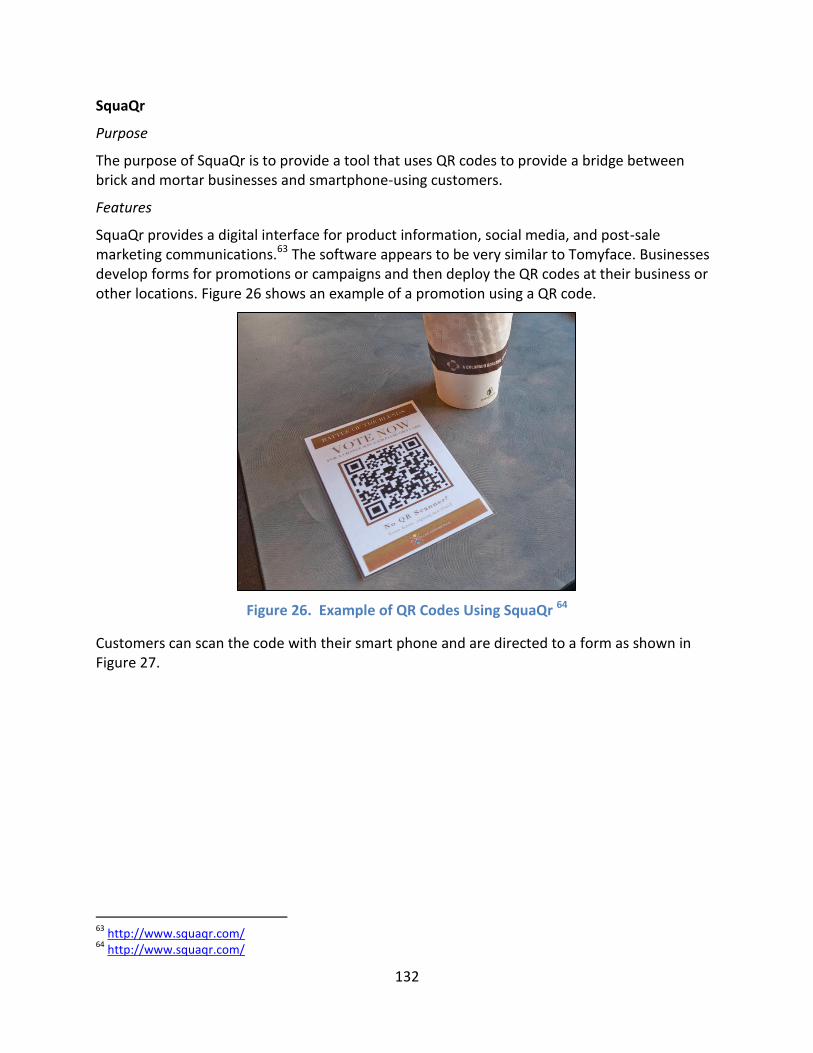
132
SquaQr
Purpose
The purpose of SquaQr is to provide a tool that uses QR codes to provide a bridge between brick and mortar businesses and smartphone-using customers.
Features
SquaQr provides a digital interface for product information, social media, and post-sale marketing communications.63 The software appears to be very similar to Tomyface. Businesses develop forms for promotions or campaigns and then deploy the QR codes at their business or other locations. Figure 26 shows an example of a promotion using a QR code.
Figure 26. Example of QR Codes Using SquaQr 64
Customers can scan the code with their smart phone and are directed to a form as shown in Figure 27.
63
http://www.squaqr.com/ 64
http://www.squaqr.com/
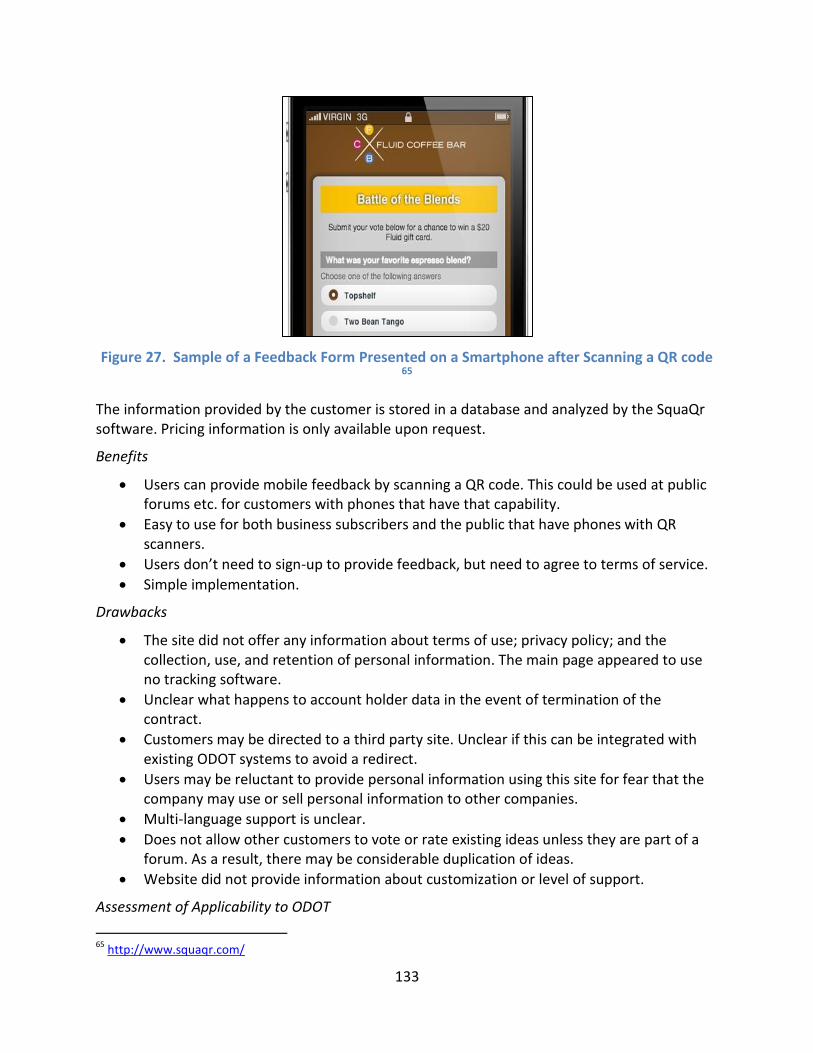
133
Figure 27. Sample of a Feedback Form Presented on a Smartphone after Scanning a QR code 65
The information provided by the customer is stored in a database and analyzed by the SquaQr software. Pricing information is only available upon request.
Benefits
Users can provide mobile feedback by scanning a QR code. This could be used at public forums etc. for customers with phones that have that capability.
Easy to use for both business subscribers and the public that have phones with QR scanners.
Users don’t need to sign-up to provide feedback, but need to agree to terms of service.
Simple implementation.
Drawbacks
The site did not offer any information about terms of use; privacy policy; and the collection, use, and retention of personal information. The main page appeared to use no tracking software.
Unclear what happens to account holder data in the event of termination of the contract.
Customers may be directed to a third party site. Unclear if this can be integrated with existing ODOT systems to avoid a redirect.
Users may be reluctant to provide personal information using this site for fear that the company may use or sell personal information to other companies.
Multi-language support is unclear.
Does not allow other customers to vote or rate existing ideas unless they are part of a forum. As a result, there may be considerable duplication of ideas.
Website did not provide information about customization or level of support.
Assessment of Applicability to ODOT
65
http://www.squaqr.com/
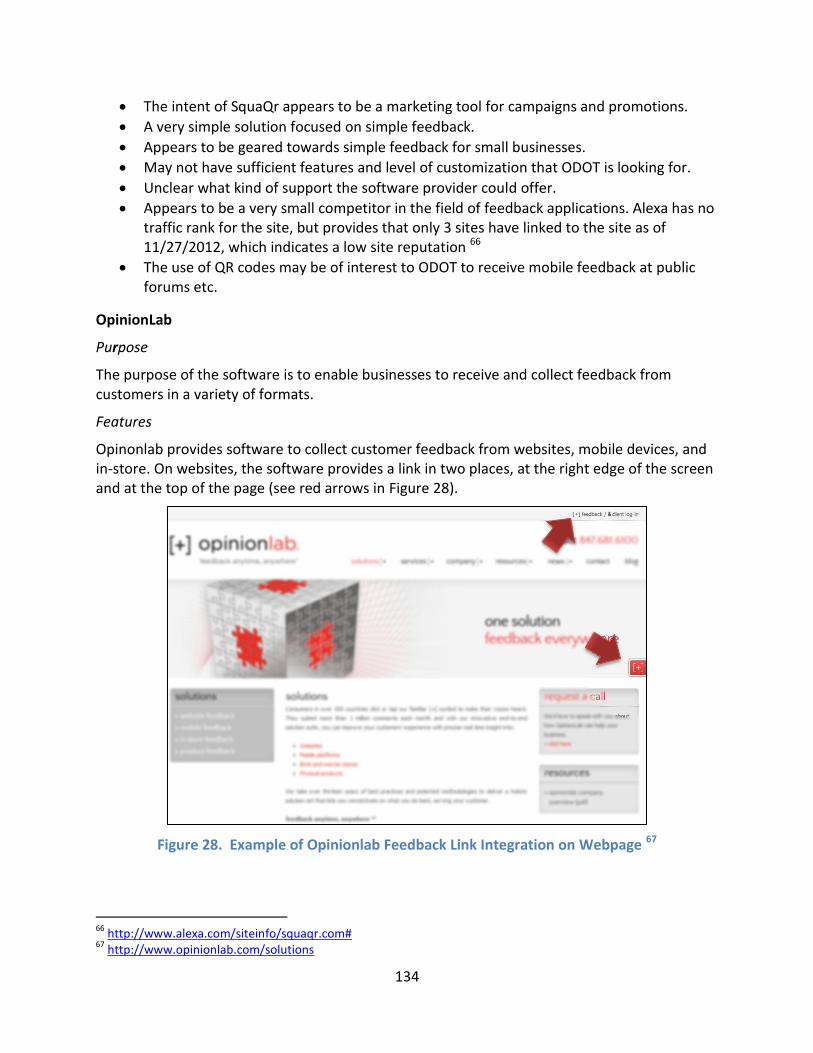
134
The intent of SquaQr appears to be a marketing tool for campaigns and promotions.
A very simple solution focused on simple feedback.
Appears to be geared towards simple feedback for small businesses.
May not have sufficient features and level of customization that ODOT is looking for.
Unclear what kind of support the software provider could offer.
Appears to be a very small competitor in the field of feedback applications. Alexa has no traffic rank for the site, but provides that only 3 sites have linked to the site as of 11/27/2012, which indicates a low site reputation 66
The use of QR codes may be of interest to ODOT to receive mobile feedback at public forums etc.
OpinionLab
Purpose
The purpose of the software is to enable businesses to receive and collect feedback from customers in a variety of formats.
Features
Opinonlab provides software to collect customer feedback from websites, mobile devices, and in-store. On websites, the software provides a link in two places, at the right edge of the screen and at the top of the page (see red arrows in Figure 28).
Figure 28. Example of Opinionlab Feedback Link Integration on Webpage 67
66
http://www.alexa.com/siteinfo/squaqr.com# 67
http://www.opinionlab.com/solutions
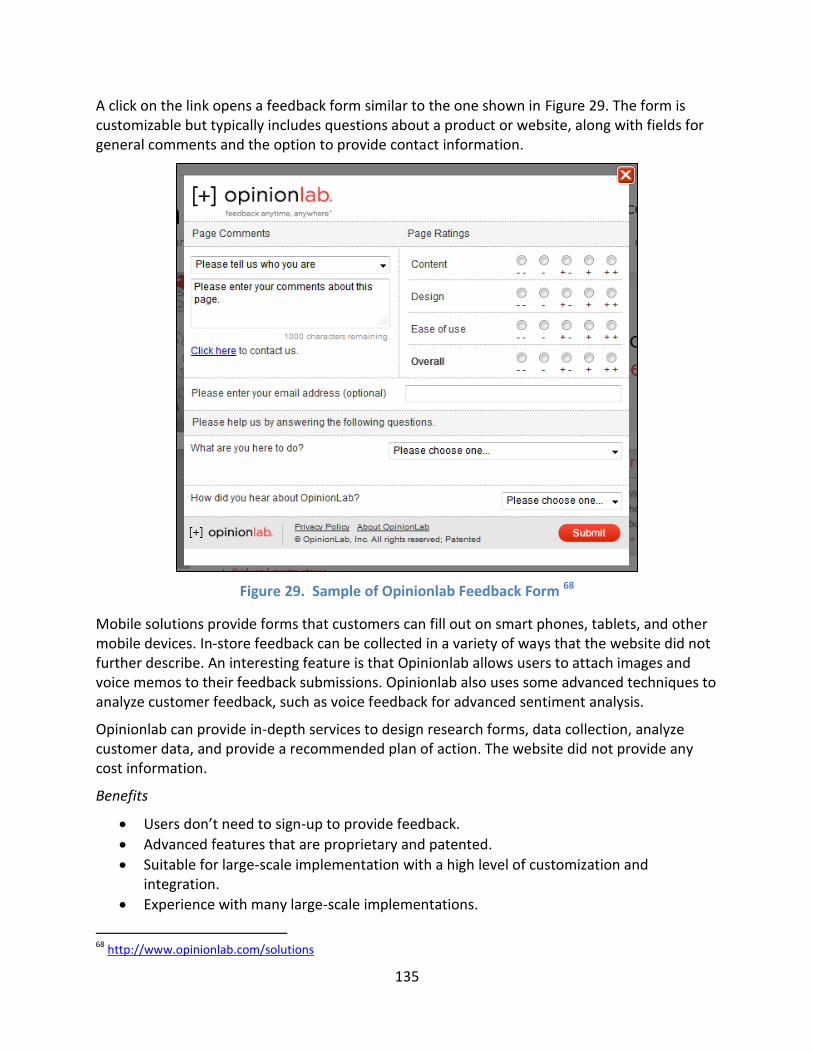
135
A click on the link opens a feedback form similar to the one shown in Figure 29. The form is customizable but typically includes questions about a product or website, along with fields for general comments and the option to provide contact information.
Figure 29. Sample of Opinionlab Feedback Form 68
Mobile solutions provide forms that customers can fill out on smart phones, tablets, and other mobile devices. In-store feedback can be collected in a variety of ways that the website did not further describe. An interesting feature is that Opinionlab allows users to attach images and voice memos to their feedback submissions. Opinionlab also uses some advanced techniques to analyze customer feedback, such as voice feedback for advanced sentiment analysis.
Opinionlab can provide in-depth services to design research forms, data collection, analyze customer data, and provide a recommended plan of action. The website did not provide any cost information.
Benefits
Users don’t need to sign-up to provide feedback.
Advanced features that are proprietary and patented.
Suitable for large-scale implementation with a high level of customization and integration.
Experience with many large-scale implementations.
68
http://www.opinionlab.com/solutions
136
The terms of agreement states that Opinionlab will destroy all account holder data in its possession in the event of termination of the contract.
Account manager and consultant support.
Drawbacks
This is a third-party application that reserves the right to modify their terms and conditions and privacy policy at any time for any reason.
The site requires the use of temporary or persistent cookies to work correctly, and collects information about how users use the service via cookies. The site uses at a minimum the Google Analytics, Clicktale, AddThis, and Dedicated Networks (AppNexus) trackers.
Does not comply with US/EU Safe Harbor Framework set forth by the U.S. Department of Commerce regarding the collection, use, and retention of personal information.
Cost of implementation and use is unclear.
Multi-language support unclear.
Does not allow other customers to vote or rate existing ideas. As a result, there may be considerable duplication of ideas.
Assessment of Applicability to ODOT
Unclear how costly an implementation would be.
Appears to be a leader in the field of feedback applications. It also has the highest Alexa rank of the feedback tools reviewed (4,306 in the U.S. as of 11/27/2012). However, relatively few unique sites are linking to opionlab.com (503 as of 11/27/2012) compared to other leading feedback software providers such as UserVoice or IdeaScale.69
Many Fortune 50 companies use Opinionlab according to the company. The company also claims to have a large customer base in over 200 countries that provide over a million comments each month.70
The company targets medium to large businesses and offers large-scale integrated solutions. It is unclear if the company had many government customers.
The company provides consultancy and many services from designing customized surveys to analyzing the data and providing action plans.
Medallia
Purpose
Medallia provides integrated solutions to collect, manage, and analyze customer feedback.
Features
Medallia is full service customer management provider that can provide service starting with customer experience audits and program roadmap development; including system design and goal setting; up to program operation, system integration, language translations, and user training. Data collection options include web-based surveys, telephone surveys, mail surveys,
69
http://www.alexa.com/siteinfo/opinionlab.com 70
http://www.opinionlab.com/solutions
137
on-premises comment cards, or mobile devices. Medallia offers tools to transfer, clean, and transform the data into an integrated database, and dashboarding tools to visualize goals and trends. Additional tools can create reports, benchmarks, and interact with customers based on criteria set by the business.
Medallia offers a 5-step process to improve customer relations and the business itself: capture, share, recover, discover, and improve. In the capture step, feedback is collected using various methods and distributed across the enterprise in step 2, tailored to a user’s roles and responsibilities. In the recover step, automated alerts and built-in communications are used to retain or bring back customers that the business is at-risk of losing. In the discover step, benchmarking and trend analysis is used to generate ideas and insights that are used in step 5 to improve the customer experience and improve the business.
Medallia also works with businesses that use other feedback management system and helps them develop a market strategy. For example, according to the Medallia website, one of their customers is Sephora.com, which uses the UserVoice platform to collect customer feedback.
The solution samples provided at the website focused on different types of industries and did not include a government case study. The website did not provide any cost information.
Direct competitors in terms of services offered and size of the company that were not reviewed include Allegiance (Engage VOCi Platform), Empathica Customer Experience, MarketTools CustomerSat, Mindshare, and Satmetrix Systems Xperience.71
Benefits
Full-service enterprise feedback management provider.
One of the largest providers of enterprise feedback management solutions.72
Fully customized and tailored solutions based on business needs.
Suitable for large-scale implementation with a high level of customization and integration.
Experience with many large-scale implementations.
Supports data from a variety of feedback management systems such as (UserVoice, IdeaScale, etc.)
Drawbacks
Cost of implementation, maintenance, and use is unclear.
Assessment of Applicability to ODOT
The company is a full-service provider that offers consultancy and many other services from designing customized surveys to analyzing the data and providing action plans.
The company targets medium to large businesses and offers large-scale integrated solutions. It is unclear if the company has many government customers.
Unclear how costly an implementation would be.
71
The Forrester Wave™: EFM Satisfaction And Loyalty Solutions, Q3 2011 by Andrew McInnes, September 27, 2011 72
The Forrester Wave™: EFM Satisfaction And Loyalty Solutions, Q3 2011 by Andrew McInnes, September 27, 2011
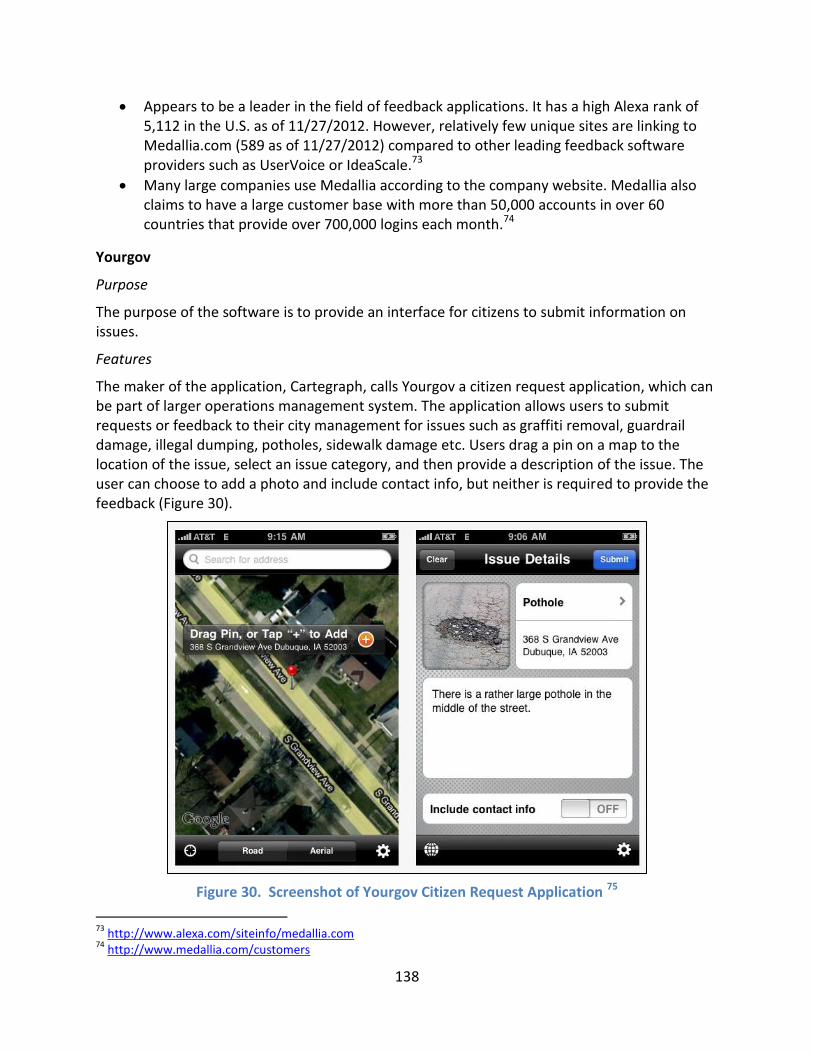
138
Appears to be a leader in the field of feedback applications. It has a high Alexa rank of 5,112 in the U.S. as of 11/27/2012. However, relatively few unique sites are linking to Medallia.com (589 as of 11/27/2012) compared to other leading feedback software providers such as UserVoice or IdeaScale.73
Many large companies use Medallia according to the company website. Medallia also claims to have a large customer base with more than 50,000 accounts in over 60 countries that provide over 700,000 logins each month.74
Yourgov
Purpose
The purpose of the software is to provide an interface for citizens to submit information on issues.
Features
The maker of the application, Cartegraph, calls Yourgov a citizen request application, which can be part of larger operations management system. The application allows users to submit requests or feedback to their city management for issues such as graffiti removal, guardrail damage, illegal dumping, potholes, sidewalk damage etc. Users drag a pin on a map to the location of the issue, select an issue category, and then provide a description of the issue. The user can choose to add a photo and include contact info, but neither is required to provide the feedback (Figure 30).
Figure 30. Screenshot of Yourgov Citizen Request Application 75
73
http://www.alexa.com/siteinfo/medallia.com 74
http://www.medallia.com/customers
139
Yourgov is being used by several cities including the City Golden, Colorado; Jeffersonville, Indiana; and Bexar County, Texas.76
Benefits
Allows user feedback for specific issues in a state or municipality.
Integrates with existing operations management systems.
Drawbacks
Requires smartphone to provide feedback.
Cost of implementation, maintenance, and use is unclear.
Assessment of Applicability to ODOT
The company is a full-service provider that offers consultancy and many other services to help integrate the system.
The company targets municipalities and offers large-scale integrated solutions. It is unclear if the company has any DOT customers.
Unclear how costly an implementation would be.
SUMMARY
Throughout this section a review of State DOT’s practices and of specific software tools was presented. The software tools vary based on whether they are a basic or integrated solution, and whether they collect targeted feedback or ideas. These are important questions and will rely on input from customers and staff as obtained in Task 4.
Simple products focus on one aspect of customer feedback management, and while they can be effective and affordable, they are limited in terms of integration and customization. Complete enterprise type solutions are another option, integrating key components and often tailored to the agency, but can be expensive. Another aspect to consider is the customer interface – do they perceive a difference and can this influence their expectations?
Consideration should also be given to the long-range plan for customer relations. Does ODOT anticipate only collecting targeted feedback, or at some point does the agency anticipate adding idea forums? This will influence the software needs as well.
Customer expectations may lead to the need to consider Smart Phone applications, mobile feedback, and texting options. These offer new portals, but require resources and support staff to ensure that the communications are addressed.
In sum, there are considerable options available to ODOT, with more expected to become available during the project’s timeframe. The Task 4 efforts will identify customer and staff expectations and requirements, which when combined with these software details and best practice standard will provide the detailed input necessary for a success benchmarking and evaluation in Task 5.
75
https://itunes.apple.com/us/app/yourgov/id374063726?mt=8 76
http://www.cartegraph.com/index.php/solutions/yourgov
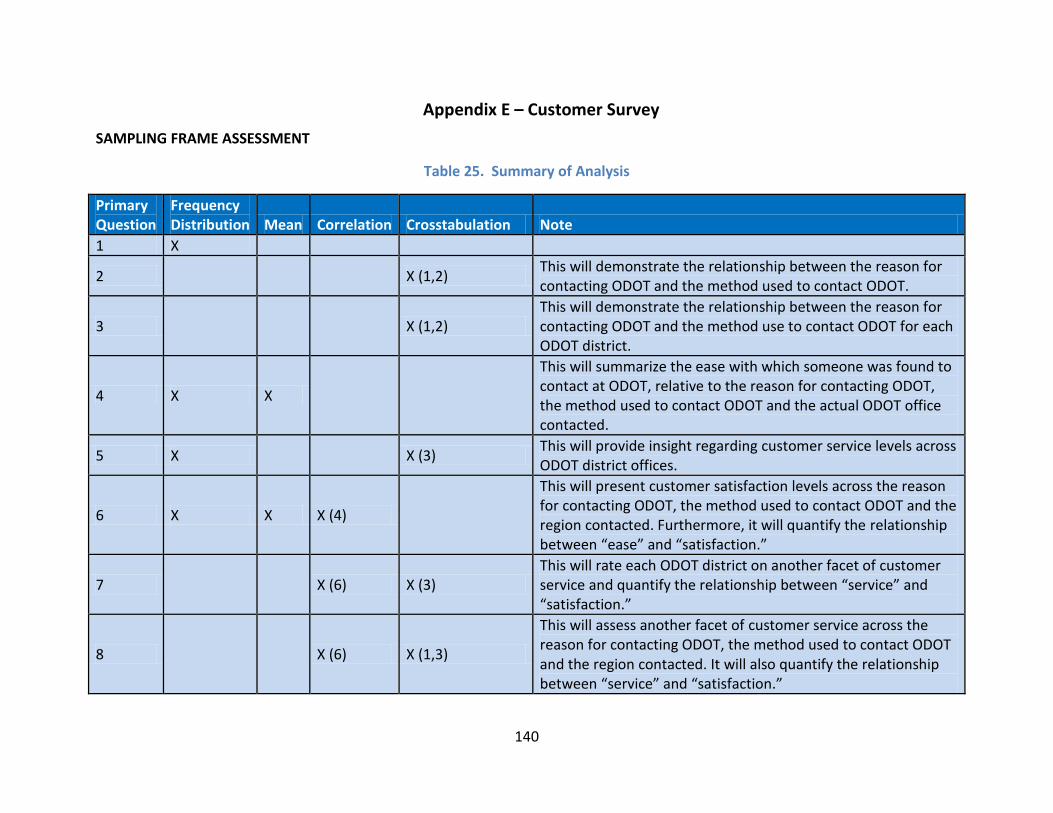
140
Appendix E – Customer Survey
SAMPLING FRAME ASSESSMENT
Table 25. Summary of Analysis
Primary Question
Frequency Distribution Mean Correlation Crosstabulation Note
1 X
2
X (1,2) This will demonstrate the relationship between the reason for contacting ODOT and the method used to contact ODOT.
3
X (1,2) This will demonstrate the relationship between the reason for contacting ODOT and the method use to contact ODOT for each ODOT district.
4 X X
This will summarize the ease with which someone was found to contact at ODOT, relative to the reason for contacting ODOT, the method used to contact ODOT and the actual ODOT office contacted.
5 X
X (3) This will provide insight regarding customer service levels across ODOT district offices.
6 X X X (4)
This will present customer satisfaction levels across the reason for contacting ODOT, the method used to contact ODOT and the region contacted. Furthermore, it will quantify the relationship between “ease” and “satisfaction.”
7
X (6) X (3) This will rate each ODOT district on another facet of customer service and quantify the relationship between “service” and “satisfaction.”
8
X (6) X (1,3)
This will assess another facet of customer service across the reason for contacting ODOT, the method used to contact ODOT and the region contacted. It will also quantify the relationship between “service” and “satisfaction.”
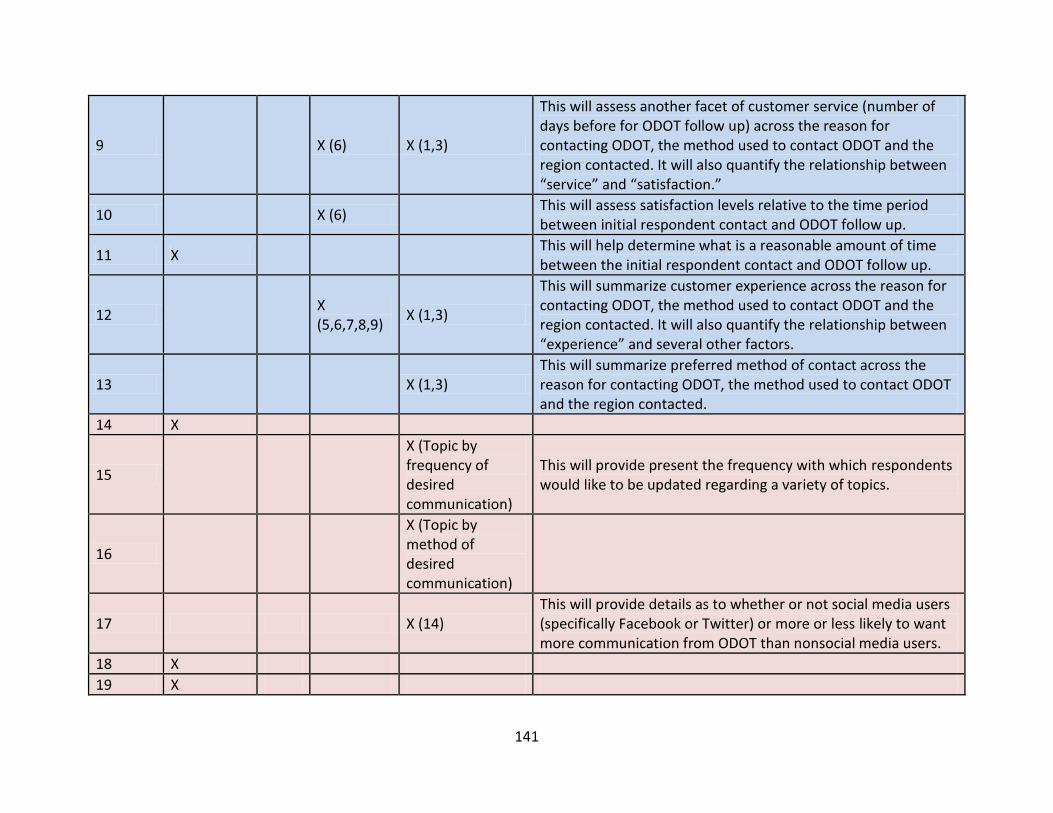
141
9
X (6) X (1,3)
This will assess another facet of customer service (number of days before for ODOT follow up) across the reason for contacting ODOT, the method used to contact ODOT and the region contacted. It will also quantify the relationship between “service” and “satisfaction.”
10
X (6)
This will assess satisfaction levels relative to the time period between initial respondent contact and ODOT follow up.
11 X
This will help determine what is a reasonable amount of time between the initial respondent contact and ODOT follow up.
12
X (5,6,7,8,9)
X (1,3)
This will summarize customer experience across the reason for contacting ODOT, the method used to contact ODOT and the region contacted. It will also quantify the relationship between “experience” and several other factors.
13
X (1,3) This will summarize preferred method of contact across the reason for contacting ODOT, the method used to contact ODOT and the region contacted.
14 X
15
X (Topic by frequency of desired communication)
This will provide present the frequency with which respondents would like to be updated regarding a variety of topics.
16
X (Topic by method of desired communication)
17 X (14) This will provide details as to whether or not social media users (specifically Facebook or Twitter) or more or less likely to want more communication from ODOT than nonsocial media users.
18 X
19 X
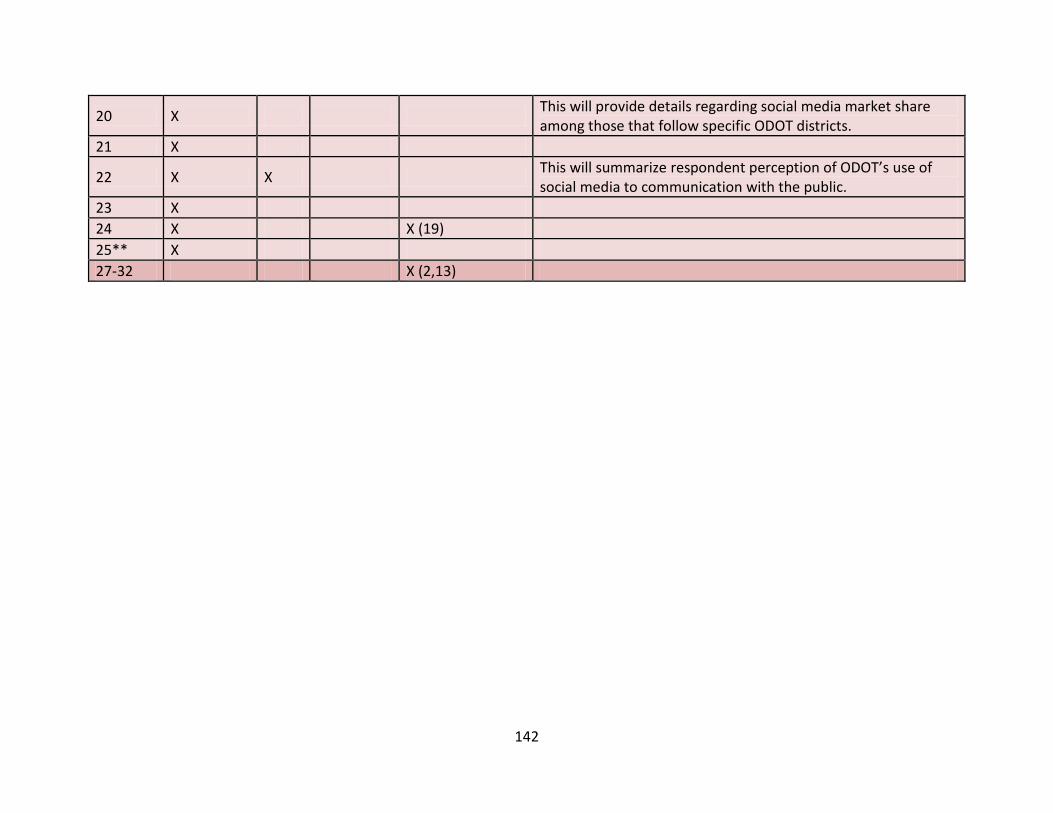
142
20 X This will provide details regarding social media market share among those that follow specific ODOT districts.
21 X
22 X X This will summarize respondent perception of ODOT’s use of social media to communication with the public.
23 X
24 X X (19)
25** X
27-32 X (2,13)
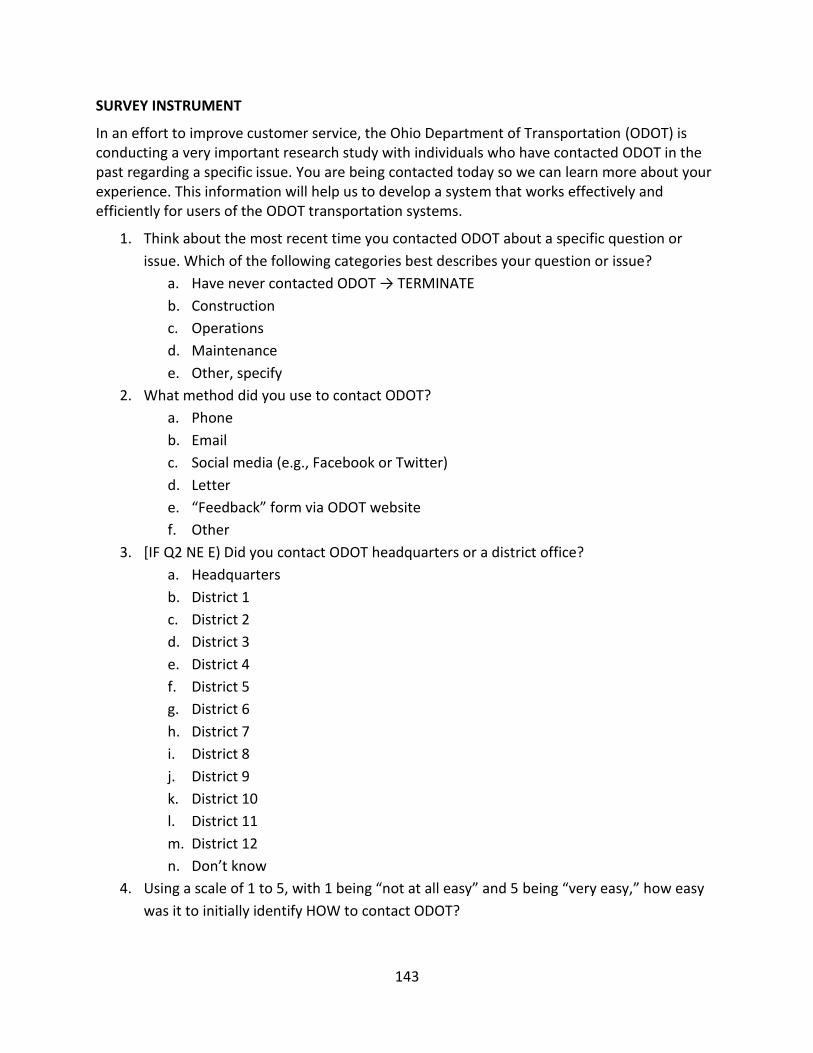
143
SURVEY INSTRUMENT
In an effort to improve customer service, the Ohio Department of Transportation (ODOT) is conducting a very important research study with individuals who have contacted ODOT in the past regarding a specific issue. You are being contacted today so we can learn more about your experience. This information will help us to develop a system that works effectively and efficiently for users of the ODOT transportation systems.
1. Think about the most recent time you contacted ODOT about a specific question or
issue. Which of the following categories best describes your question or issue?
a. Have never contacted ODOT → TERMINATE
b. Construction
c. Operations
d. Maintenance
e. Other, specify
2. What method did you use to contact ODOT?
a. Phone
b. Email
c. Social media (e.g., Facebook or Twitter)
d. Letter
e. “Feedback” form via ODOT website
f. Other
3. [IF Q2 NE E) Did you contact ODOT headquarters or a district office?
a. Headquarters
b. District 1
c. District 2
d. District 3
e. District 4
f. District 5
g. District 6
h. District 7
i. District 8
j. District 9
k. District 10
l. District 11
m. District 12
n. Don’t know
4. Using a scale of 1 to 5, with 1 being “not at all easy” and 5 being “very easy,” how easy
was it to initially identify HOW to contact ODOT?
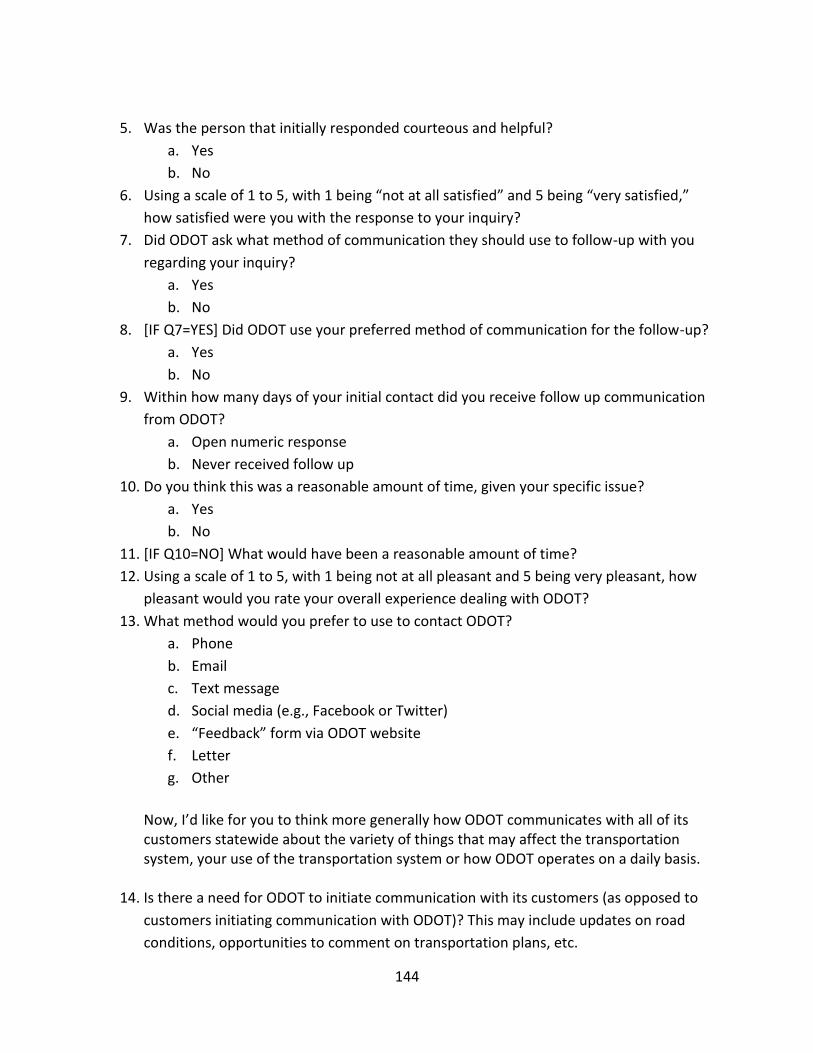
144
5. Was the person that initially responded courteous and helpful?
a. Yes
b. No
6. Using a scale of 1 to 5, with 1 being “not at all satisfied” and 5 being “very satisfied,”
how satisfied were you with the response to your inquiry?
7. Did ODOT ask what method of communication they should use to follow-up with you
regarding your inquiry?
a. Yes
b. No
8. [IF Q7=YES] Did ODOT use your preferred method of communication for the follow-up?
a. Yes
b. No
9. Within how many days of your initial contact did you receive follow up communication
from ODOT?
a. Open numeric response
b. Never received follow up
10. Do you think this was a reasonable amount of time, given your specific issue?
a. Yes
b. No
11. [IF Q10=NO] What would have been a reasonable amount of time?
12. Using a scale of 1 to 5, with 1 being not at all pleasant and 5 being very pleasant, how
pleasant would you rate your overall experience dealing with ODOT?
13. What method would you prefer to use to contact ODOT?
a. Phone
b. Email
c. Text message
d. Social media (e.g., Facebook or Twitter)
e. “Feedback” form via ODOT website
f. Letter
g. Other
Now, I’d like for you to think more generally how ODOT communicates with all of its customers statewide about the variety of things that may affect the transportation system, your use of the transportation system or how ODOT operates on a daily basis.
14. Is there a need for ODOT to initiate communication with its customers (as opposed to
customers initiating communication with ODOT)? This may include updates on road
conditions, opportunities to comment on transportation plans, etc.
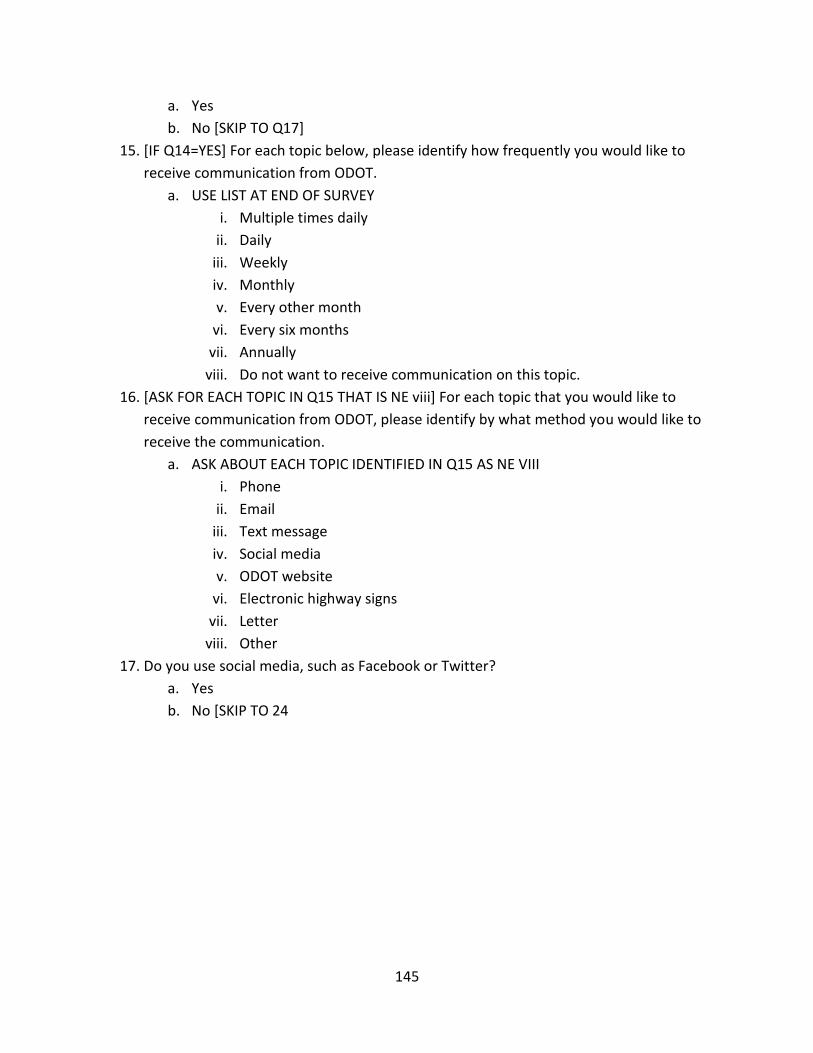
145
a. Yes
b. No [SKIP TO Q17]
15. [IF Q14=YES] For each topic below, please identify how frequently you would like to
receive communication from ODOT.
a. USE LIST AT END OF SURVEY
i. Multiple times daily
ii. Daily
iii. Weekly
iv. Monthly
v. Every other month
vi. Every six months
vii. Annually
viii. Do not want to receive communication on this topic.
16. [ASK FOR EACH TOPIC IN Q15 THAT IS NE viii] For each topic that you would like to
receive communication from ODOT, please identify by what method you would like to
receive the communication.
a. ASK ABOUT EACH TOPIC IDENTIFIED IN Q15 AS NE VIII
i. Phone
ii. Email
iii. Text message
iv. Social media
v. ODOT website
vi. Electronic highway signs
vii. Letter
viii. Other
17. Do you use social media, such as Facebook or Twitter?
a. Yes
b. No [SKIP TO 24
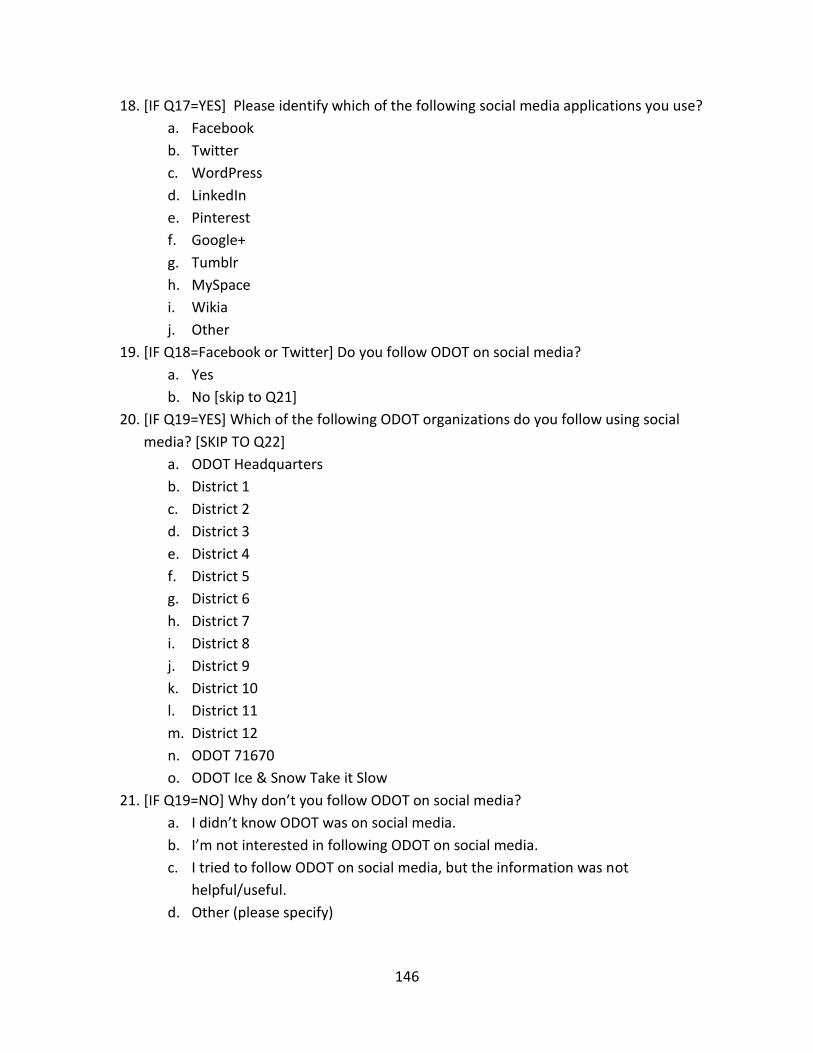
146
18. [IF Q17=YES] Please identify which of the following social media applications you use?
a. Facebook
b. Twitter
c. WordPress
d. LinkedIn
e. Pinterest
f. Google+
g. Tumblr
h. MySpace
i. Wikia
j. Other
19. [IF Q18=Facebook or Twitter] Do you follow ODOT on social media?
a. Yes
b. No [skip to Q21]
20. [IF Q19=YES] Which of the following ODOT organizations do you follow using social
media? [SKIP TO Q22]
a. ODOT Headquarters
b. District 1
c. District 2
d. District 3
e. District 4
f. District 5
g. District 6
h. District 7
i. District 8
j. District 9
k. District 10
l. District 11
m. District 12
n. ODOT 71670
o. ODOT Ice & Snow Take it Slow
21. [IF Q19=NO] Why don’t you follow ODOT on social media?
a. I didn’t know ODOT was on social media.
b. I’m not interested in following ODOT on social media.
c. I tried to follow ODOT on social media, but the information was not
helpful/useful.
d. Other (please specify)
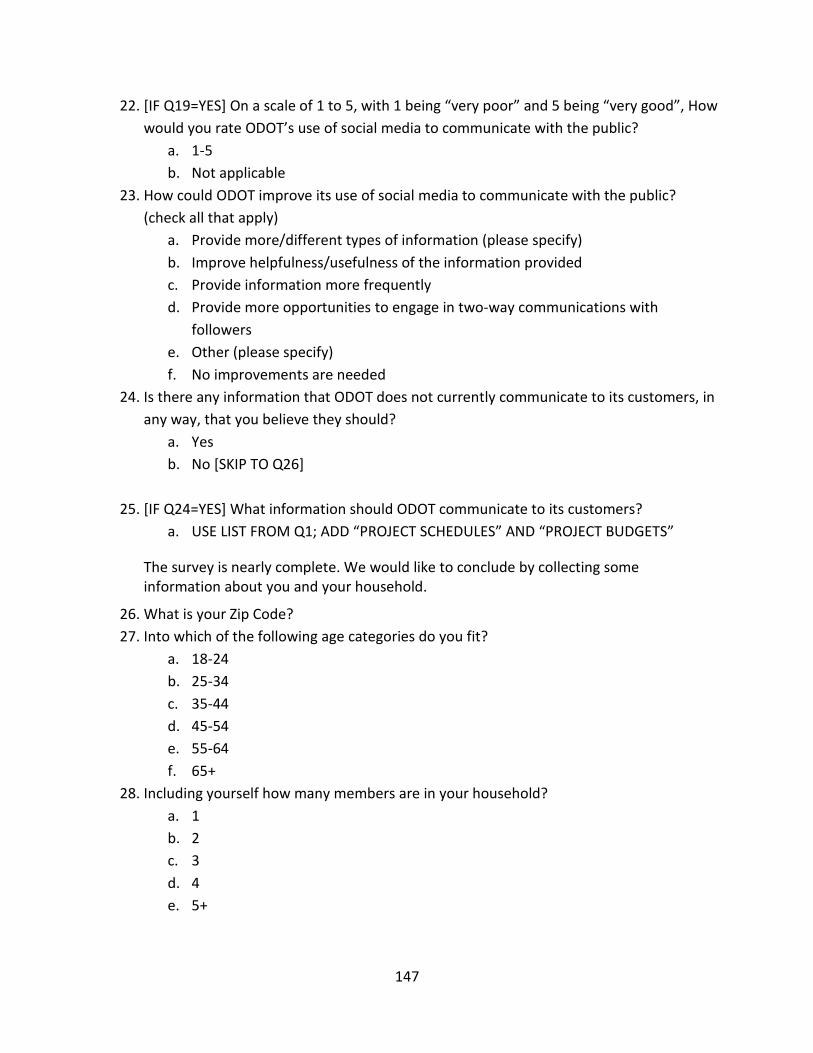
147
22. [IF Q19=YES] On a scale of 1 to 5, with 1 being “very poor” and 5 being “very good”, How
would you rate ODOT’s use of social media to communicate with the public?
a. 1-5
b. Not applicable
23. How could ODOT improve its use of social media to communicate with the public?
(check all that apply)
a. Provide more/different types of information (please specify)
b. Improve helpfulness/usefulness of the information provided
c. Provide information more frequently
d. Provide more opportunities to engage in two-way communications with
followers
e. Other (please specify)
f. No improvements are needed
24. Is there any information that ODOT does not currently communicate to its customers, in
any way, that you believe they should?
a. Yes
b. No [SKIP TO Q26]
25. [IF Q24=YES] What information should ODOT communicate to its customers?
a. USE LIST FROM Q1; ADD “PROJECT SCHEDULES” AND “PROJECT BUDGETS”
The survey is nearly complete. We would like to conclude by collecting some information about you and your household.
26. What is your Zip Code?
27. Into which of the following age categories do you fit?
a. 18-24
b. 25-34
c. 35-44
d. 45-54
e. 55-64
f. 65+
28. Including yourself how many members are in your household?
a. 1
b. 2
c. 3
d. 4
e. 5+
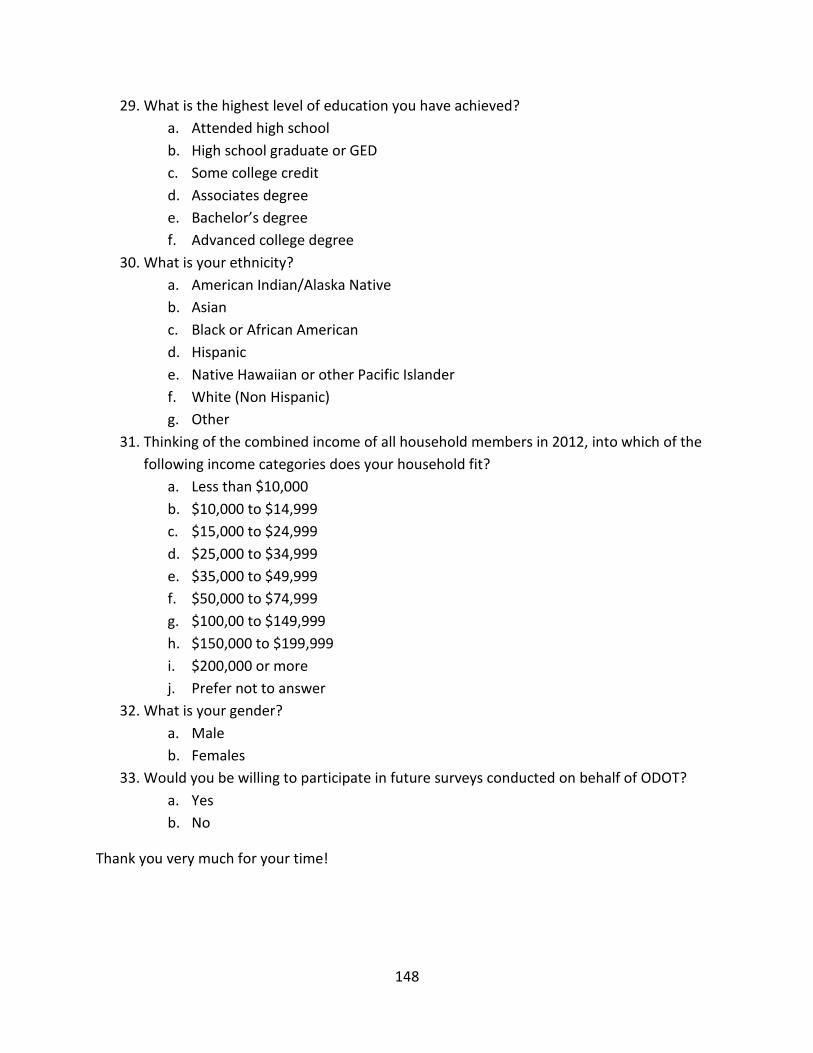
148
29. What is the highest level of education you have achieved?
a. Attended high school
b. High school graduate or GED
c. Some college credit
d. Associates degree
e. Bachelor’s degree
f. Advanced college degree
30. What is your ethnicity?
a. American Indian/Alaska Native
b. Asian
c. Black or African American
d. Hispanic
e. Native Hawaiian or other Pacific Islander
f. White (Non Hispanic)
g. Other
31. Thinking of the combined income of all household members in 2012, into which of the
following income categories does your household fit?
a. Less than $10,000
b. $10,000 to $14,999
c. $15,000 to $24,999
d. $25,000 to $34,999
e. $35,000 to $49,999
f. $50,000 to $74,999
g. $100,00 to $149,999
h. $150,000 to $199,999
i. $200,000 or more
j. Prefer not to answer
32. What is your gender?
a. Male
b. Females
33. Would you be willing to participate in future surveys conducted on behalf of ODOT?
a. Yes
b. No
Thank you very much for your time!
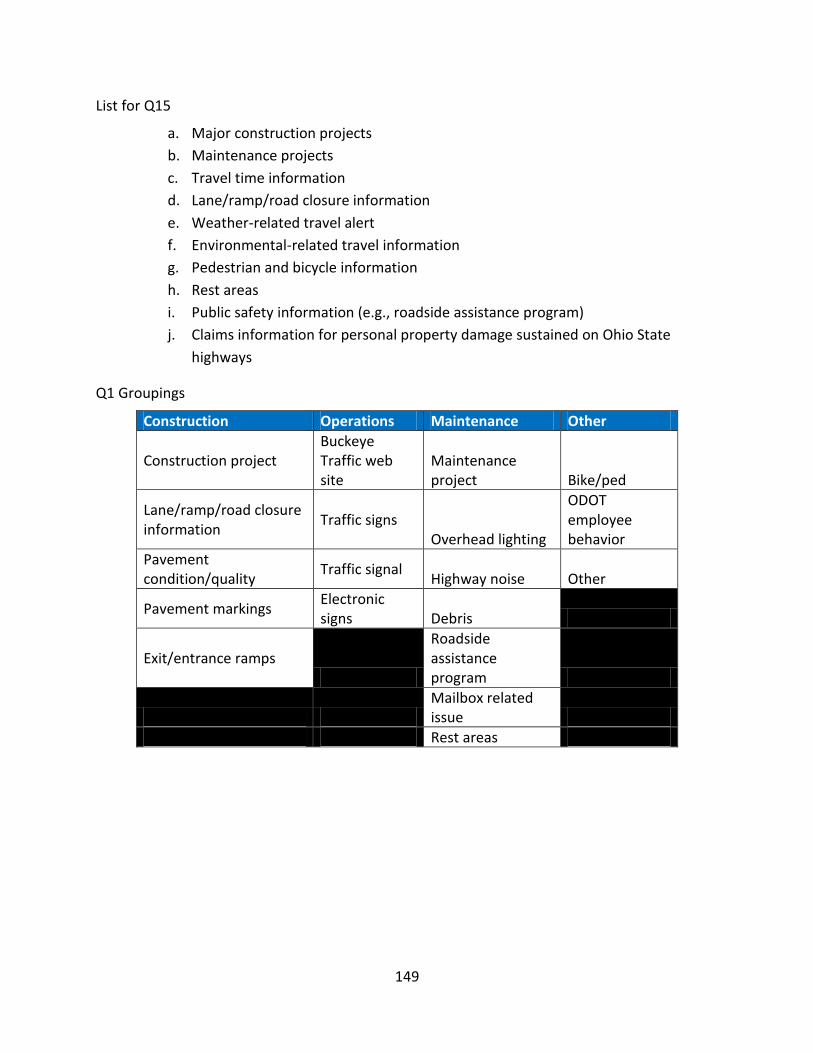
149
List for Q15
a. Major construction projects
b. Maintenance projects
c. Travel time information
d. Lane/ramp/road closure information
e. Weather-related travel alert
f. Environmental-related travel information
g. Pedestrian and bicycle information
h. Rest areas
i. Public safety information (e.g., roadside assistance program)
j. Claims information for personal property damage sustained on Ohio State
highways
Q1 Groupings
Construction Operations Maintenance Other
Construction project Buckeye Traffic web site
Maintenance project Bike/ped
Lane/ramp/road closure information
Traffic signs Overhead lighting
ODOT employee behavior
Pavement condition/quality
Traffic signal Highway noise Other
Pavement markings Electronic signs Debris
Exit/entrance ramps
Roadside assistance program
Mailbox related issue
Rest areas
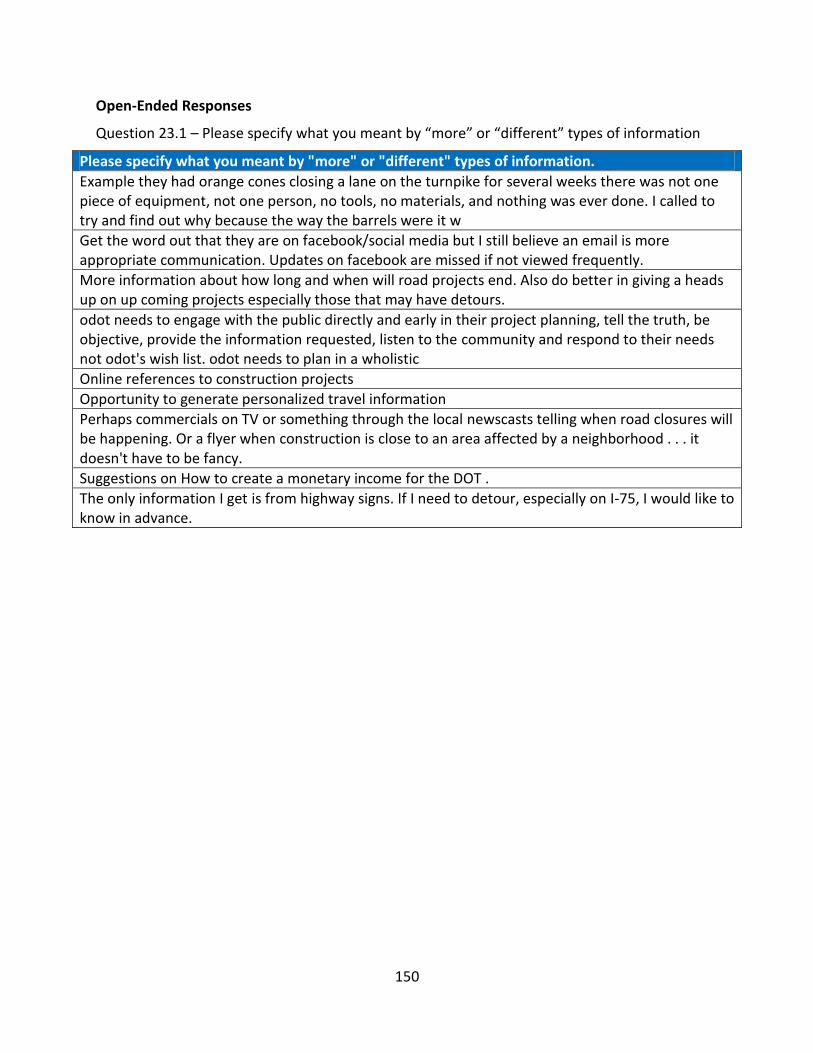
150
Open-Ended Responses
Question 23.1 – Please specify what you meant by “more” or “different” types of information
Please specify what you meant by "more" or "different" types of information.
Example they had orange cones closing a lane on the turnpike for several weeks there was not one piece of equipment, not one person, no tools, no materials, and nothing was ever done. I called to try and find out why because the way the barrels were it w
Get the word out that they are on facebook/social media but I still believe an email is more appropriate communication. Updates on facebook are missed if not viewed frequently.
More information about how long and when will road projects end. Also do better in giving a heads up on up coming projects especially those that may have detours.
odot needs to engage with the public directly and early in their project planning, tell the truth, be objective, provide the information requested, listen to the community and respond to their needs not odot's wish list. odot needs to plan in a wholistic
Online references to construction projects
Opportunity to generate personalized travel information
Perhaps commercials on TV or something through the local newscasts telling when road closures will be happening. Or a flyer when construction is close to an area affected by a neighborhood . . . it doesn't have to be fancy.
Suggestions on How to create a monetary income for the DOT .
The only information I get is from highway signs. If I need to detour, especially on I-75, I would like to know in advance.
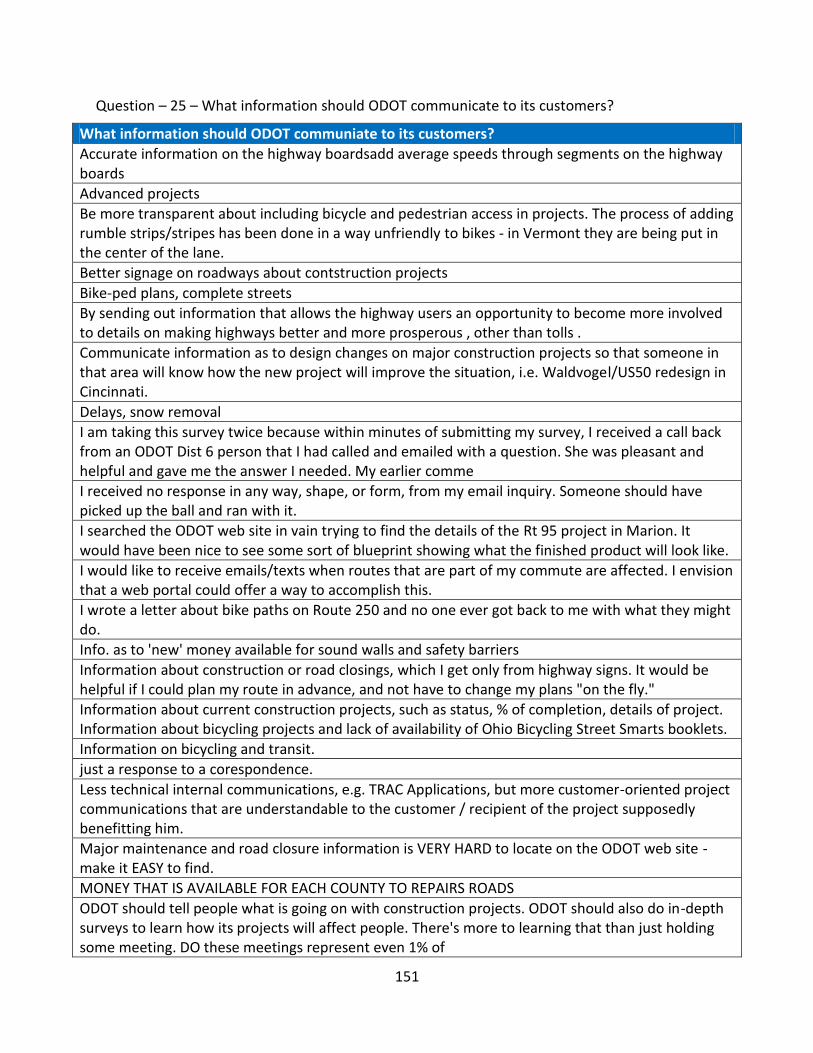
151
Question – 25 – What information should ODOT communicate to its customers?
What information should ODOT communiate to its customers?
Accurate information on the highway boardsadd average speeds through segments on the highway boards
Advanced projects
Be more transparent about including bicycle and pedestrian access in projects. The process of adding rumble strips/stripes has been done in a way unfriendly to bikes - in Vermont they are being put in the center of the lane.
Better signage on roadways about contstruction projects
Bike-ped plans, complete streets
By sending out information that allows the highway users an opportunity to become more involved to details on making highways better and more prosperous , other than tolls .
Communicate information as to design changes on major construction projects so that someone in that area will know how the new project will improve the situation, i.e. Waldvogel/US50 redesign in Cincinnati.
Delays, snow removal
I am taking this survey twice because within minutes of submitting my survey, I received a call back from an ODOT Dist 6 person that I had called and emailed with a question. She was pleasant and helpful and gave me the answer I needed. My earlier comme
I received no response in any way, shape, or form, from my email inquiry. Someone should have picked up the ball and ran with it.
I searched the ODOT web site in vain trying to find the details of the Rt 95 project in Marion. It would have been nice to see some sort of blueprint showing what the finished product will look like.
I would like to receive emails/texts when routes that are part of my commute are affected. I envision that a web portal could offer a way to accomplish this.
I wrote a letter about bike paths on Route 250 and no one ever got back to me with what they might do.
Info. as to 'new' money available for sound walls and safety barriers
Information about construction or road closings, which I get only from highway signs. It would be helpful if I could plan my route in advance, and not have to change my plans "on the fly."
Information about current construction projects, such as status, % of completion, details of project. Information about bicycling projects and lack of availability of Ohio Bicycling Street Smarts booklets.
Information on bicycling and transit.
just a response to a corespondence.
Less technical internal communications, e.g. TRAC Applications, but more customer-oriented project communications that are understandable to the customer / recipient of the project supposedly benefitting him.
Major maintenance and road closure information is VERY HARD to locate on the ODOT web site - make it EASY to find.
MONEY THAT IS AVAILABLE FOR EACH COUNTY TO REPAIRS ROADS
ODOT should tell people what is going on with construction projects. ODOT should also do in-depth surveys to learn how its projects will affect people. There's more to learning that than just holding some meeting. DO these meetings represent even 1% of
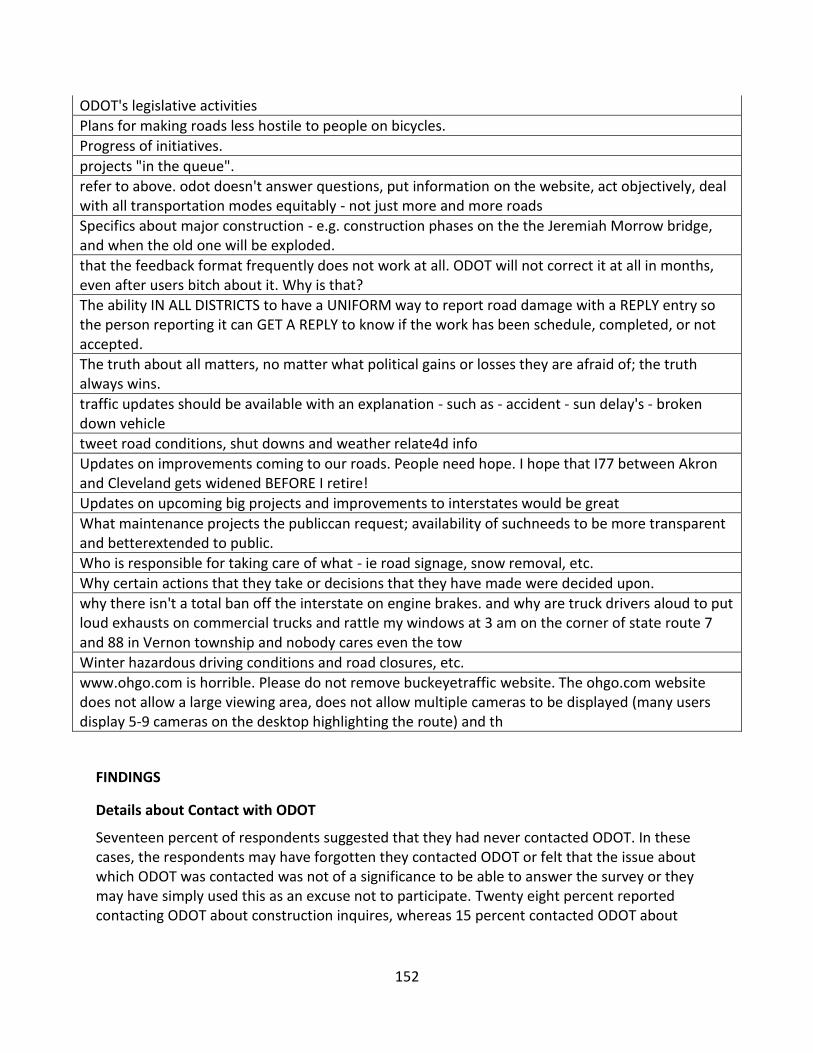
152
ODOT's legislative activities
Plans for making roads less hostile to people on bicycles.
Progress of initiatives.
projects "in the queue".
refer to above. odot doesn't answer questions, put information on the website, act objectively, deal with all transportation modes equitably - not just more and more roads
Specifics about major construction - e.g. construction phases on the the Jeremiah Morrow bridge, and when the old one will be exploded.
that the feedback format frequently does not work at all. ODOT will not correct it at all in months, even after users bitch about it. Why is that?
The ability IN ALL DISTRICTS to have a UNIFORM way to report road damage with a REPLY entry so the person reporting it can GET A REPLY to know if the work has been schedule, completed, or not accepted.
The truth about all matters, no matter what political gains or losses they are afraid of; the truth always wins.
traffic updates should be available with an explanation - such as - accident - sun delay's - broken down vehicle
tweet road conditions, shut downs and weather relate4d info
Updates on improvements coming to our roads. People need hope. I hope that I77 between Akron and Cleveland gets widened BEFORE I retire!
Updates on upcoming big projects and improvements to interstates would be great
What maintenance projects the publiccan request; availability of suchneeds to be more transparent and betterextended to public.
Who is responsible for taking care of what - ie road signage, snow removal, etc.
Why certain actions that they take or decisions that they have made were decided upon.
why there isn't a total ban off the interstate on engine brakes. and why are truck drivers aloud to put loud exhausts on commercial trucks and rattle my windows at 3 am on the corner of state route 7 and 88 in Vernon township and nobody cares even the tow
Winter hazardous driving conditions and road closures, etc.
www.ohgo.com is horrible. Please do not remove buckeyetraffic website. The ohgo.com website does not allow a large viewing area, does not allow multiple cameras to be displayed (many users display 5-9 cameras on the desktop highlighting the route) and th
FINDINGS
Details about Contact with ODOT
Seventeen percent of respondents suggested that they had never contacted ODOT. In these cases, the respondents may have forgotten they contacted ODOT or felt that the issue about which ODOT was contacted was not of a significance to be able to answer the survey or they may have simply used this as an excuse not to participate. Twenty eight percent reported contacting ODOT about construction inquires, whereas 15 percent contacted ODOT about
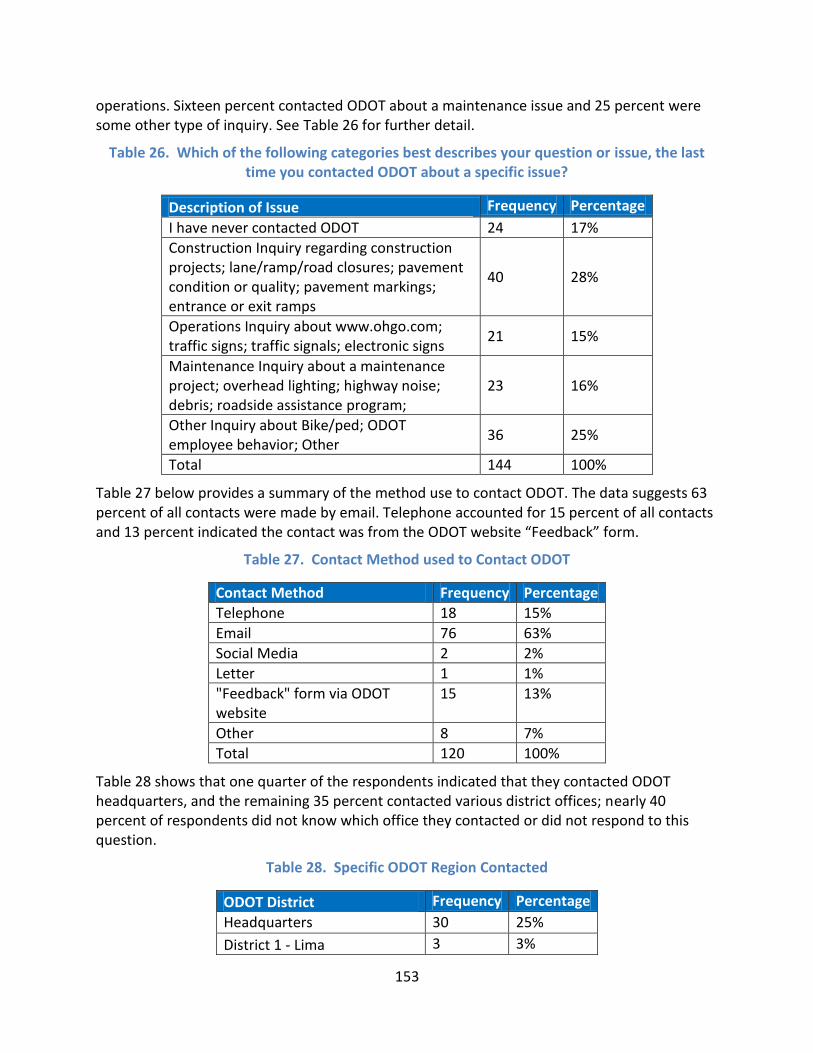
153
operations. Sixteen percent contacted ODOT about a maintenance issue and 25 percent were some other type of inquiry. See Table 26 for further detail.
Table 26. Which of the following categories best describes your question or issue, the last time you contacted ODOT about a specific issue?
Description of Issue Frequency Percentage
I have never contacted ODOT 24 17%
Construction Inquiry regarding construction projects; lane/ramp/road closures; pavement condition or quality; pavement markings; entrance or exit ramps
40 28%
Operations Inquiry about www.ohgo.com; traffic signs; traffic signals; electronic signs
21 15%
Maintenance Inquiry about a maintenance project; overhead lighting; highway noise; debris; roadside assistance program;
23 16%
Other Inquiry about Bike/ped; ODOT employee behavior; Other
36 25%
Total 144 100%
Table 27 below provides a summary of the method use to contact ODOT. The data suggests 63 percent of all contacts were made by email. Telephone accounted for 15 percent of all contacts and 13 percent indicated the contact was from the ODOT website “Feedback” form.
Table 27. Contact Method used to Contact ODOT
Contact Method Frequency Percentage
Telephone 18 15%
Email 76 63%
Social Media 2 2%
Letter 1 1%
"Feedback" form via ODOT website
15 13%
Other 8 7%
Total 120 100%
Table 28 shows that one quarter of the respondents indicated that they contacted ODOT headquarters, and the remaining 35 percent contacted various district offices; nearly 40 percent of respondents did not know which office they contacted or did not respond to this question.
Table 28. Specific ODOT Region Contacted
ODOT District Frequency Percentage
Headquarters 30 25%
District 1 - Lima 3 3%
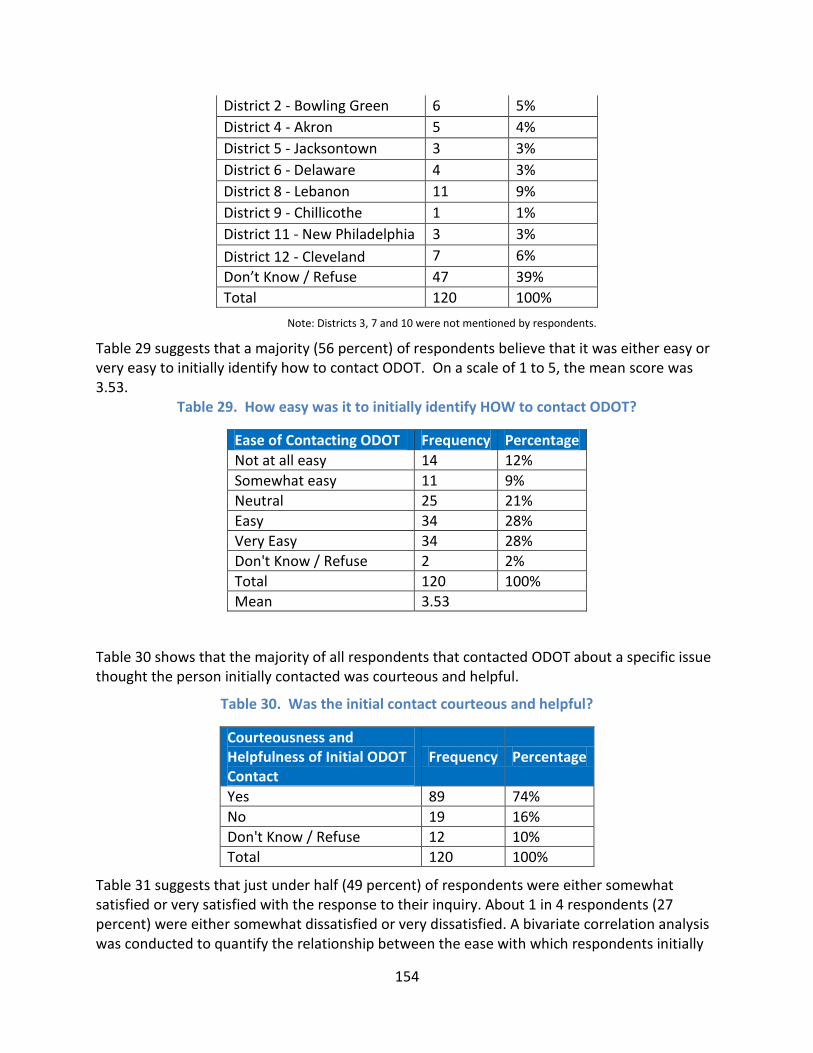
154
District 2 - Bowling Green 6 5%
District 4 - Akron 5 4%
District 5 - Jacksontown 3 3%
District 6 - Delaware 4 3%
District 8 - Lebanon 11 9%
District 9 - Chillicothe 1 1%
District 11 - New Philadelphia 3 3%
District 12 - Cleveland 7 6%
Don’t Know / Refuse 47 39%
Total 120 100%
Note: Districts 3, 7 and 10 were not mentioned by respondents.
Table 29 suggests that a majority (56 percent) of respondents believe that it was either easy or very easy to initially identify how to contact ODOT. On a scale of 1 to 5, the mean score was 3.53.
Table 29. How easy was it to initially identify HOW to contact ODOT?
Ease of Contacting ODOT Frequency Percentage
Not at all easy 14 12%
Somewhat easy 11 9%
Neutral 25 21%
Easy 34 28%
Very Easy 34 28%
Don't Know / Refuse 2 2%
Total 120 100%
Mean 3.53
Table 30 shows that the majority of all respondents that contacted ODOT about a specific issue thought the person initially contacted was courteous and helpful.
Table 30. Was the initial contact courteous and helpful?
Courteousness and Helpfulness of Initial ODOT Contact
Frequency Percentage
Yes 89 74%
No 19 16%
Don't Know / Refuse 12 10%
Total 120 100%
Table 31 suggests that just under half (49 percent) of respondents were either somewhat satisfied or very satisfied with the response to their inquiry. About 1 in 4 respondents (27 percent) were either somewhat dissatisfied or very dissatisfied. A bivariate correlation analysis was conducted to quantify the relationship between the ease with which respondents initially
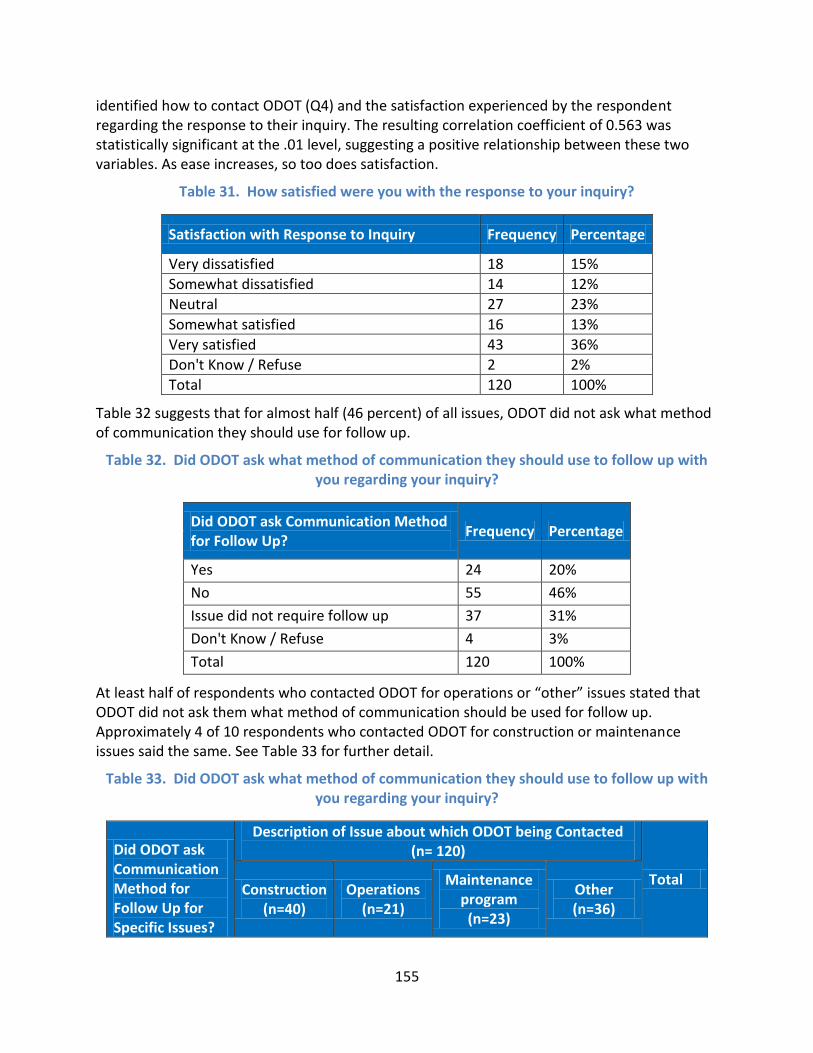
155
identified how to contact ODOT (Q4) and the satisfaction experienced by the respondent regarding the response to their inquiry. The resulting correlation coefficient of 0.563 was statistically significant at the .01 level, suggesting a positive relationship between these two variables. As ease increases, so too does satisfaction.
Table 31. How satisfied were you with the response to your inquiry?
Satisfaction with Response to Inquiry Frequency Percentage
Very dissatisfied 18 15%
Somewhat dissatisfied 14 12%
Neutral 27 23%
Somewhat satisfied 16 13%
Very satisfied 43 36%
Don't Know / Refuse 2 2%
Total 120 100%
Table 32 suggests that for almost half (46 percent) of all issues, ODOT did not ask what method of communication they should use for follow up.
Table 32. Did ODOT ask what method of communication they should use to follow up with you regarding your inquiry?
Did ODOT ask Communication Method for Follow Up?
Frequency Percentage
Yes 24 20%
No 55 46%
Issue did not require follow up 37 31%
Don't Know / Refuse 4 3%
Total 120 100%
At least half of respondents who contacted ODOT for operations or “other” issues stated that ODOT did not ask them what method of communication should be used for follow up. Approximately 4 of 10 respondents who contacted ODOT for construction or maintenance issues said the same. See Table 33 for further detail.
Table 33. Did ODOT ask what method of communication they should use to follow up with you regarding your inquiry?
Did ODOT ask Communication Method for Follow Up for Specific Issues?
Description of Issue about which ODOT being Contacted (n= 120)
Total Construction
(n=40) Operations
(n=21)
Maintenance program (n=23)
Other (n=36)
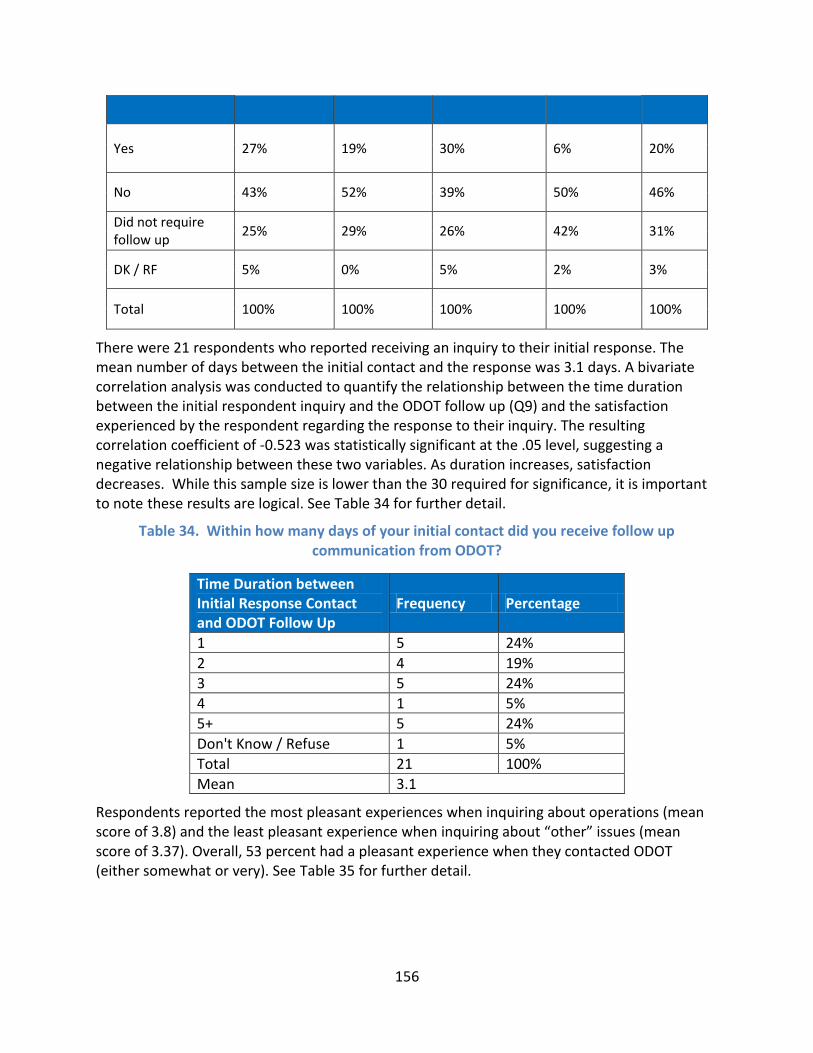
156
Yes 27% 19% 30% 6% 20%
No 43% 52% 39% 50% 46%
Did not require follow up
25% 29% 26% 42% 31%
DK / RF 5% 0% 5% 2% 3%
Total 100% 100% 100% 100% 100%
There were 21 respondents who reported receiving an inquiry to their initial response. The mean number of days between the initial contact and the response was 3.1 days. A bivariate correlation analysis was conducted to quantify the relationship between the time duration between the initial respondent inquiry and the ODOT follow up (Q9) and the satisfaction experienced by the respondent regarding the response to their inquiry. The resulting correlation coefficient of -0.523 was statistically significant at the .05 level, suggesting a negative relationship between these two variables. As duration increases, satisfaction decreases. While this sample size is lower than the 30 required for significance, it is important to note these results are logical. See Table 34 for further detail.
Table 34. Within how many days of your initial contact did you receive follow up communication from ODOT?
Time Duration between Initial Response Contact and ODOT Follow Up
Frequency Percentage
1 5 24%
2 4 19%
3 5 24%
4 1 5%
5+ 5 24%
Don't Know / Refuse 1 5%
Total 21 100%
Mean 3.1
Respondents reported the most pleasant experiences when inquiring about operations (mean score of 3.8) and the least pleasant experience when inquiring about “other” issues (mean score of 3.37). Overall, 53 percent had a pleasant experience when they contacted ODOT (either somewhat or very). See Table 35 for further detail.
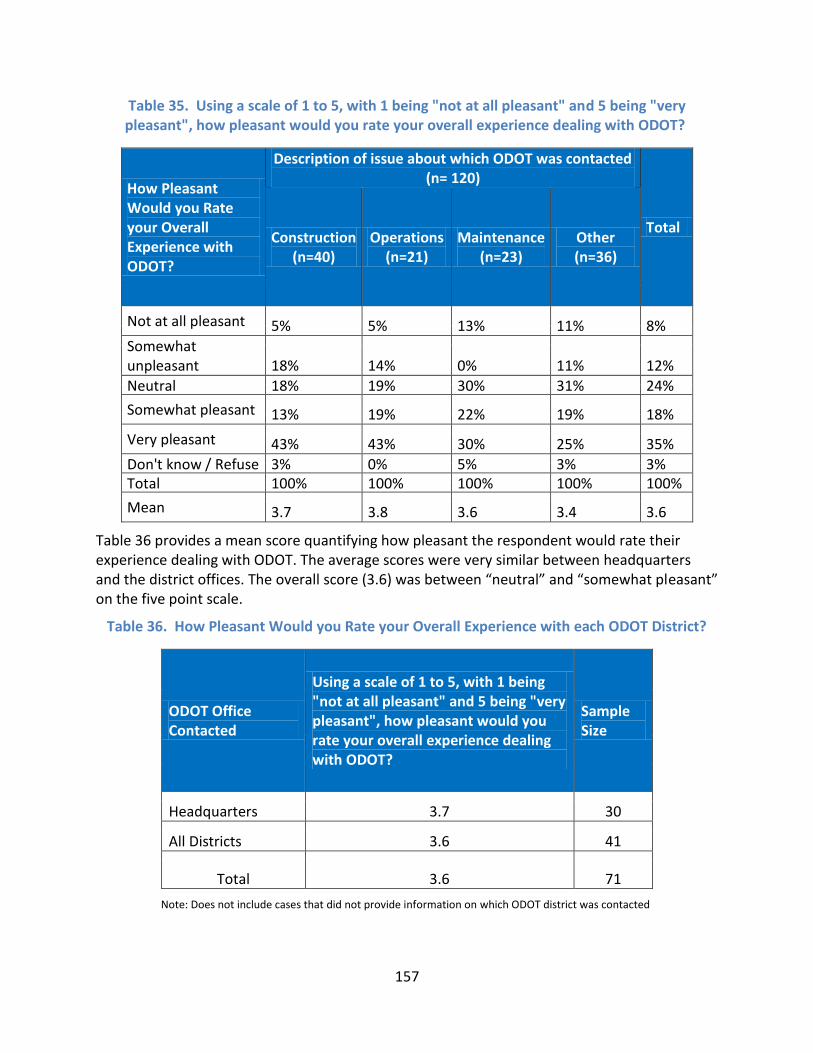
157
Table 35. Using a scale of 1 to 5, with 1 being "not at all pleasant" and 5 being "very pleasant", how pleasant would you rate your overall experience dealing with ODOT?
How Pleasant Would you Rate your Overall Experience with ODOT?
Description of issue about which ODOT was contacted (n= 120)
Total Construction
(n=40) Operations
(n=21) Maintenance
(n=23) Other (n=36)
Not at all pleasant 5% 5% 13% 11% 8%
Somewhat unpleasant 18% 14% 0% 11% 12%
Neutral 18% 19% 30% 31% 24%
Somewhat pleasant 13% 19% 22% 19% 18%
Very pleasant 43% 43% 30% 25% 35%
Don't know / Refuse 3% 0% 5% 3% 3% Total 100% 100% 100% 100% 100%
Mean 3.7 3.8 3.6 3.4 3.6
Table 36 provides a mean score quantifying how pleasant the respondent would rate their experience dealing with ODOT. The average scores were very similar between headquarters and the district offices. The overall score (3.6) was between “neutral” and “somewhat pleasant” on the five point scale.
Table 36. How Pleasant Would you Rate your Overall Experience with each ODOT District?
ODOT Office Contacted
Using a scale of 1 to 5, with 1 being "not at all pleasant" and 5 being "very pleasant", how pleasant would you rate your overall experience dealing with ODOT?
Sample Size
Headquarters 3.7 30
All Districts 3.6 41
Total 3.6 71
Note: Does not include cases that did not provide information on which ODOT district was contacted
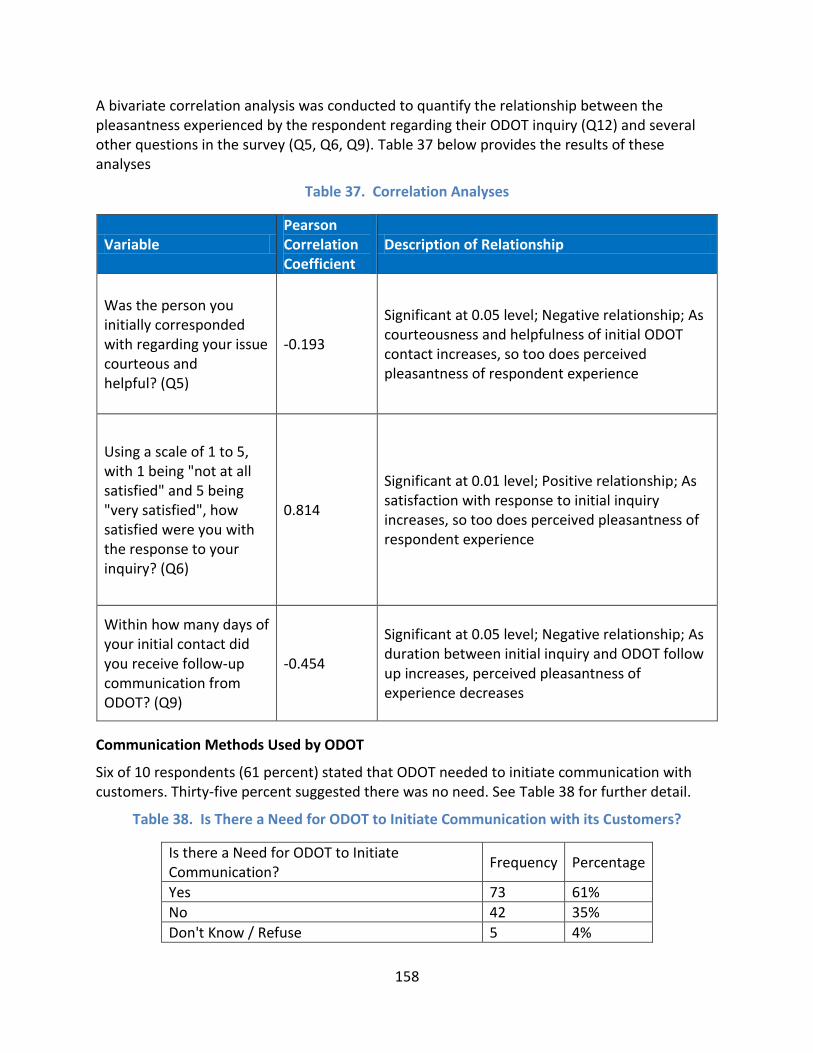
158
A bivariate correlation analysis was conducted to quantify the relationship between the pleasantness experienced by the respondent regarding their ODOT inquiry (Q12) and several other questions in the survey (Q5, Q6, Q9). Table 37 below provides the results of these analyses
Table 37. Correlation Analyses
Variable Pearson Correlation Coefficient
Description of Relationship
Was the person you initially corresponded with regarding your issue courteous and helpful? (Q5)
-0.193
Significant at 0.05 level; Negative relationship; As courteousness and helpfulness of initial ODOT contact increases, so too does perceived pleasantness of respondent experience
Using a scale of 1 to 5, with 1 being "not at all satisfied" and 5 being "very satisfied", how satisfied were you with the response to your inquiry? (Q6)
0.814
Significant at 0.01 level; Positive relationship; As satisfaction with response to initial inquiry increases, so too does perceived pleasantness of respondent experience
Within how many days of your initial contact did you receive follow-up communication from ODOT? (Q9)
-0.454
Significant at 0.05 level; Negative relationship; As duration between initial inquiry and ODOT follow up increases, perceived pleasantness of experience decreases
Communication Methods Used by ODOT
Six of 10 respondents (61 percent) stated that ODOT needed to initiate communication with customers. Thirty-five percent suggested there was no need. See Table 38 for further detail.
Table 38. Is There a Need for ODOT to Initiate Communication with its Customers?
Is there a Need for ODOT to Initiate Communication?
Frequency Percentage
Yes 73 61%
No 42 35%
Don't Know / Refuse 5 4%
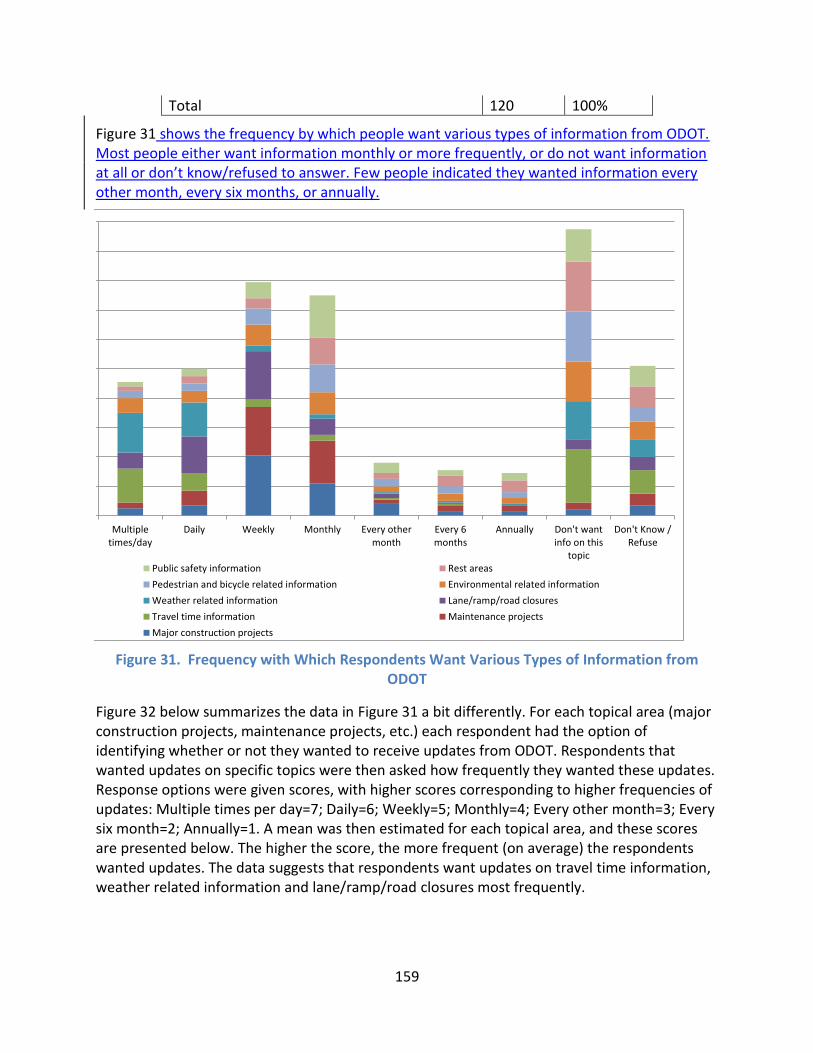
159
Total 120 100%
Figure 31 shows the frequency by which people want various types of information from ODOT. Most people either want information monthly or more frequently, or do not want information at all or don’t know/refused to answer. Few people indicated they wanted information every other month, every six months, or annually.
Figure 31. Frequency with Which Respondents Want Various Types of Information from ODOT
Figure 32 below summarizes the data in Figure 31 a bit differently. For each topical area (major construction projects, maintenance projects, etc.) each respondent had the option of identifying whether or not they wanted to receive updates from ODOT. Respondents that wanted updates on specific topics were then asked how frequently they wanted these updates. Response options were given scores, with higher scores corresponding to higher frequencies of updates: Multiple times per day=7; Daily=6; Weekly=5; Monthly=4; Every other month=3; Every six month=2; Annually=1. A mean was then estimated for each topical area, and these scores are presented below. The higher the score, the more frequent (on average) the respondents wanted updates. The data suggests that respondents want updates on travel time information, weather related information and lane/ramp/road closures most frequently.
0%
20%
40%
60%
80%
100%
120%
140%
160%
180%
200%
Multipletimes/day
Daily Weekly Monthly Every othermonth
Every 6months
Annually Don't wantinfo on this
topic
Don't Know /Refuse
Public safety information Rest areas
Pedestrian and bicycle related information Environmental related information
Weather related information Lane/ramp/road closures
Travel time information Maintenance projects
Major construction projects
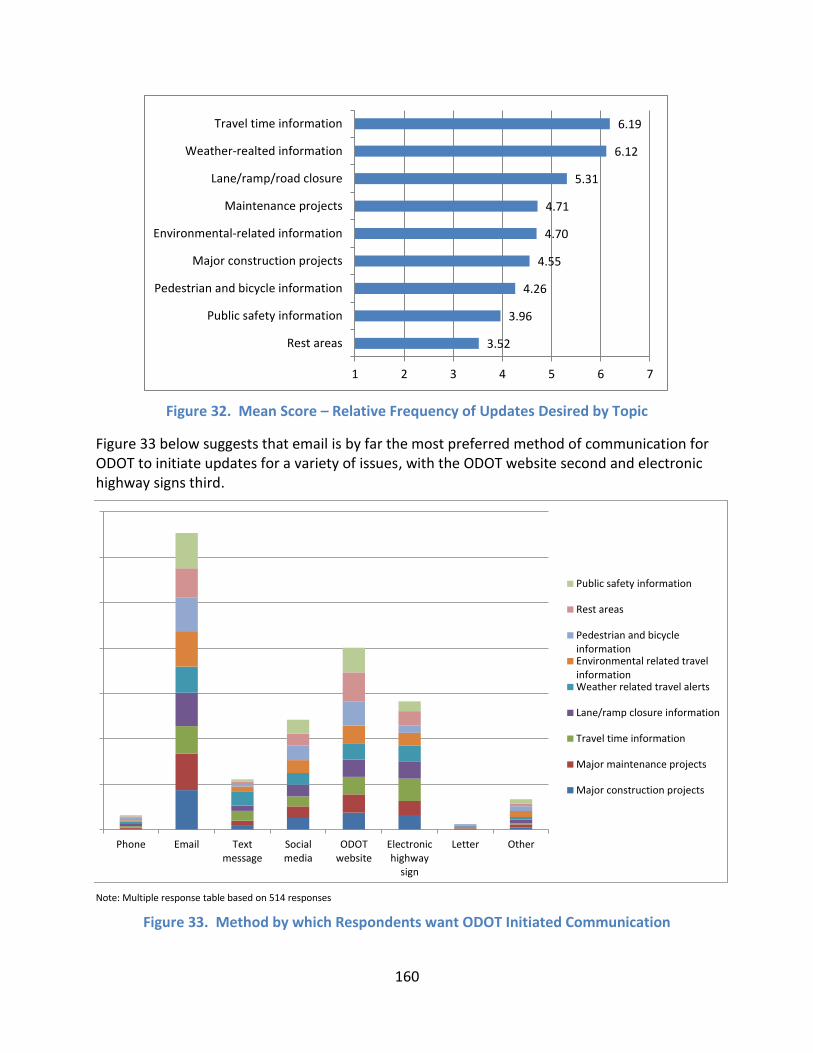
160
Figure 32. Mean Score – Relative Frequency of Updates Desired by Topic
Figure 33 below suggests that email is by far the most preferred method of communication for ODOT to initiate updates for a variety of issues, with the ODOT website second and electronic highway signs third.
Note: Multiple response table based on 514 responses
Figure 33. Method by which Respondents want ODOT Initiated Communication
3.52
3.96
4.26
4.55
4.70
4.71
5.31
6.12
6.19
1 2 3 4 5 6 7
Rest areas
Public safety information
Pedestrian and bicycle information
Major construction projects
Environmental-related information
Maintenance projects
Lane/ramp/road closure
Weather-realted information
Travel time information
0%
50%
100%
150%
200%
250%
300%
350%
Phone Email Textmessage
Socialmedia
ODOTwebsite
Electronichighway
sign
Letter Other
Public safety information
Rest areas
Pedestrian and bicycleinformationEnvironmental related travelinformationWeather related travel alerts
Lane/ramp closure information
Travel time information
Major maintenance projects
Major construction projects
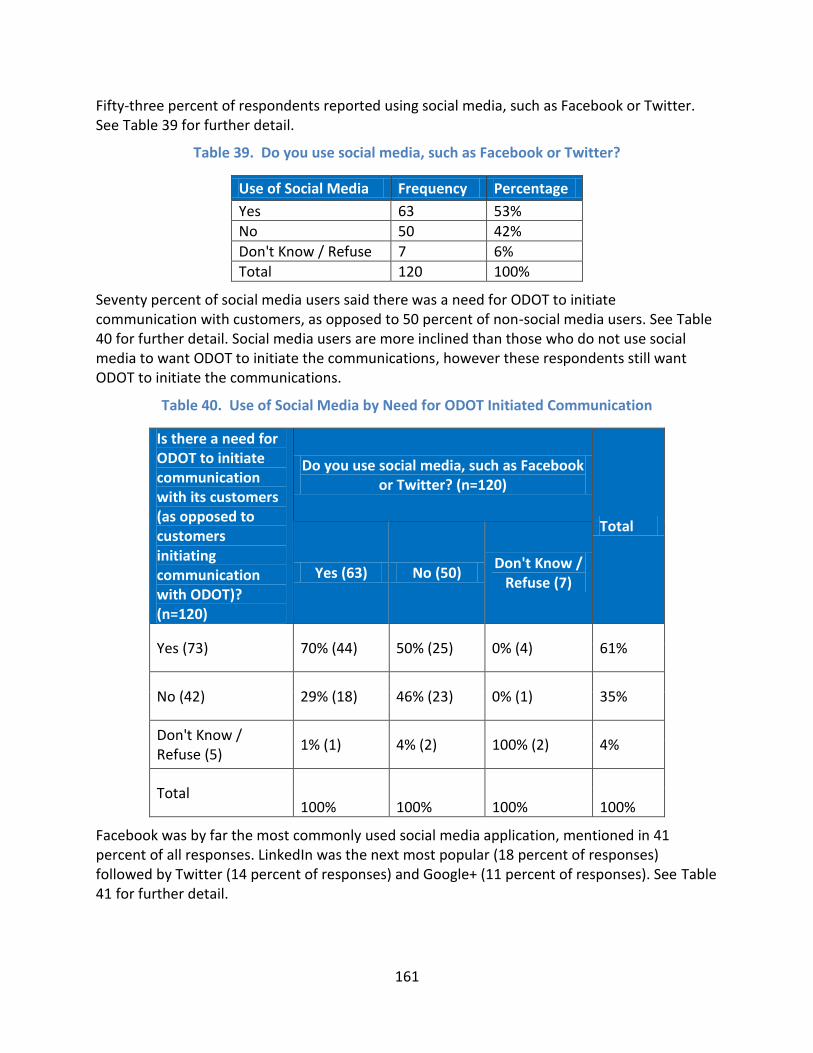
161
Fifty-three percent of respondents reported using social media, such as Facebook or Twitter. See Table 39 for further detail.
Table 39. Do you use social media, such as Facebook or Twitter?
Use of Social Media Frequency Percentage
Yes 63 53%
No 50 42%
Don't Know / Refuse 7 6%
Total 120 100%
Seventy percent of social media users said there was a need for ODOT to initiate communication with customers, as opposed to 50 percent of non-social media users. See Table 40 for further detail. Social media users are more inclined than those who do not use social media to want ODOT to initiate the communications, however these respondents still want ODOT to initiate the communications.
Table 40. Use of Social Media by Need for ODOT Initiated Communication
Is there a need for ODOT to initiate communication with its customers (as opposed to customers initiating communication with ODOT)? (n=120)
Do you use social media, such as Facebook or Twitter? (n=120)
Total
Yes (63) No (50) Don't Know /
Refuse (7)
Yes (73) 70% (44) 50% (25) 0% (4) 61%
No (42) 29% (18) 46% (23) 0% (1) 35%
Don't Know / Refuse (5)
1% (1) 4% (2) 100% (2) 4%
Total 100% 100% 100% 100%
Facebook was by far the most commonly used social media application, mentioned in 41 percent of all responses. LinkedIn was the next most popular (18 percent of responses) followed by Twitter (14 percent of responses) and Google+ (11 percent of responses). See Table 41 for further detail.
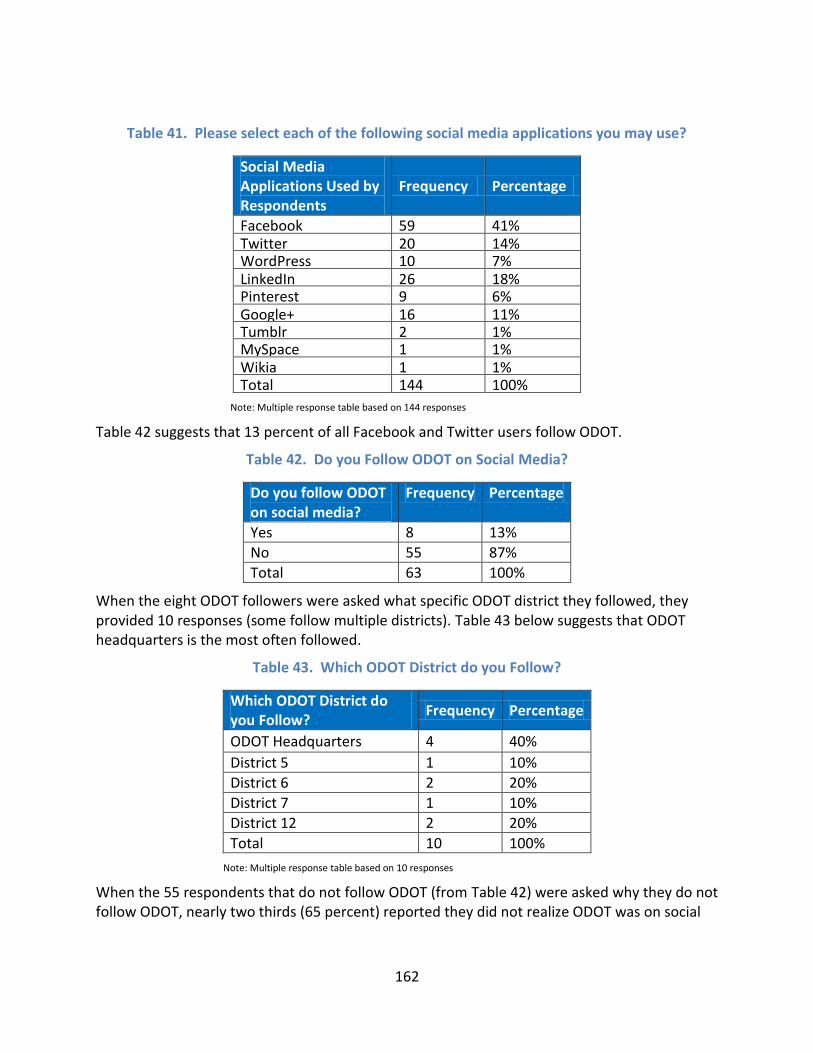
162
Table 41. Please select each of the following social media applications you may use?
Social Media Applications Used by Respondents
Frequency Percentage
Facebook 59 41% Twitter 20 14% WordPress 10 7% LinkedIn 26 18% Pinterest 9 6% Google+ 16 11% Tumblr 2 1% MySpace 1 1% Wikia 1 1% Total 144 100%
Note: Multiple response table based on 144 responses
Table 42 suggests that 13 percent of all Facebook and Twitter users follow ODOT.
Table 42. Do you Follow ODOT on Social Media?
Do you follow ODOT on social media?
Frequency Percentage
Yes 8 13%
No 55 87%
Total 63 100%
When the eight ODOT followers were asked what specific ODOT district they followed, they provided 10 responses (some follow multiple districts). Table 43 below suggests that ODOT headquarters is the most often followed.
Table 43. Which ODOT District do you Follow?
Which ODOT District do you Follow?
Frequency Percentage
ODOT Headquarters 4 40%
District 5 1 10%
District 6 2 20%
District 7 1 10%
District 12 2 20%
Total 10 100%
Note: Multiple response table based on 10 responses
When the 55 respondents that do not follow ODOT (from Table 42) were asked why they do not follow ODOT, nearly two thirds (65 percent) reported they did not realize ODOT was on social
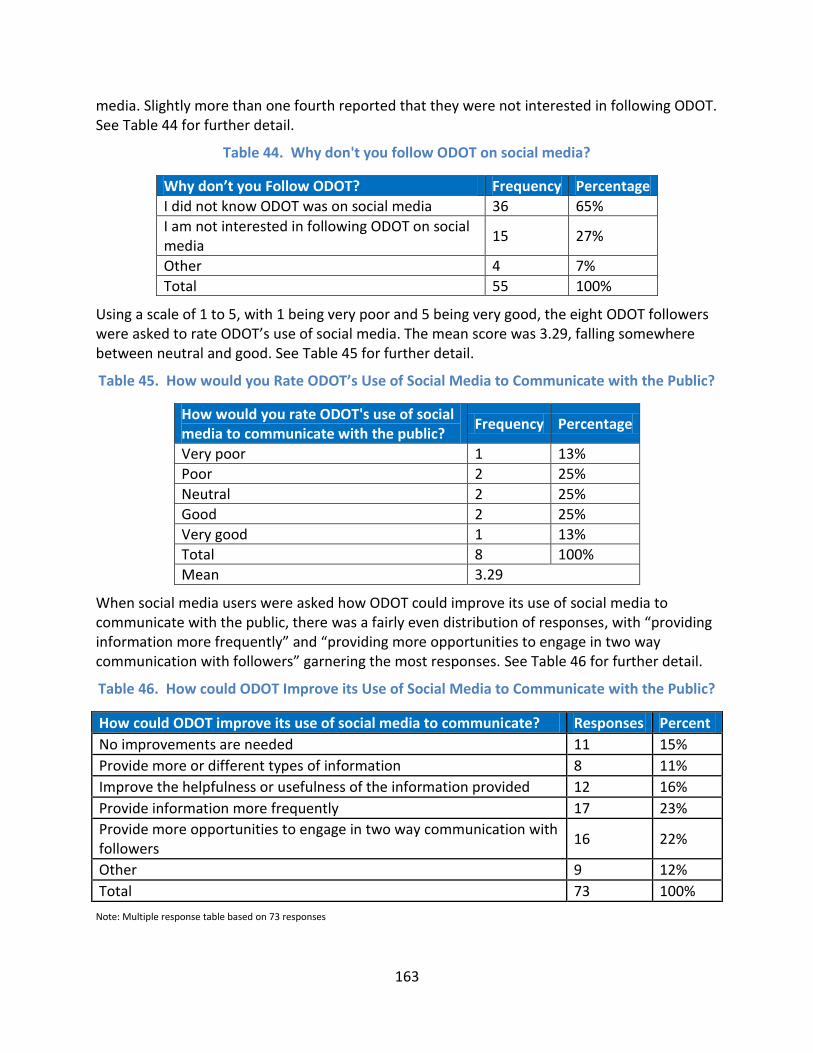
163
media. Slightly more than one fourth reported that they were not interested in following ODOT. See Table 44 for further detail.
Table 44. Why don't you follow ODOT on social media?
Why don’t you Follow ODOT? Frequency Percentage
I did not know ODOT was on social media 36 65%
I am not interested in following ODOT on social media
15 27%
Other 4 7%
Total 55 100%
Using a scale of 1 to 5, with 1 being very poor and 5 being very good, the eight ODOT followers were asked to rate ODOT’s use of social media. The mean score was 3.29, falling somewhere between neutral and good. See Table 45 for further detail.
Table 45. How would you Rate ODOT’s Use of Social Media to Communicate with the Public?
How would you rate ODOT's use of social media to communicate with the public?
Frequency Percentage
Very poor 1 13%
Poor 2 25%
Neutral 2 25%
Good 2 25%
Very good 1 13%
Total 8 100%
Mean 3.29
When social media users were asked how ODOT could improve its use of social media to communicate with the public, there was a fairly even distribution of responses, with “providing information more frequently” and “providing more opportunities to engage in two way communication with followers” garnering the most responses. See Table 46 for further detail.
Table 46. How could ODOT Improve its Use of Social Media to Communicate with the Public?
How could ODOT improve its use of social media to communicate? Responses Percent
No improvements are needed 11 15%
Provide more or different types of information 8 11%
Improve the helpfulness or usefulness of the information provided 12 16%
Provide information more frequently 17 23%
Provide more opportunities to engage in two way communication with followers
16 22%
Other 9 12%
Total 73 100%
Note: Multiple response table based on 73 responses
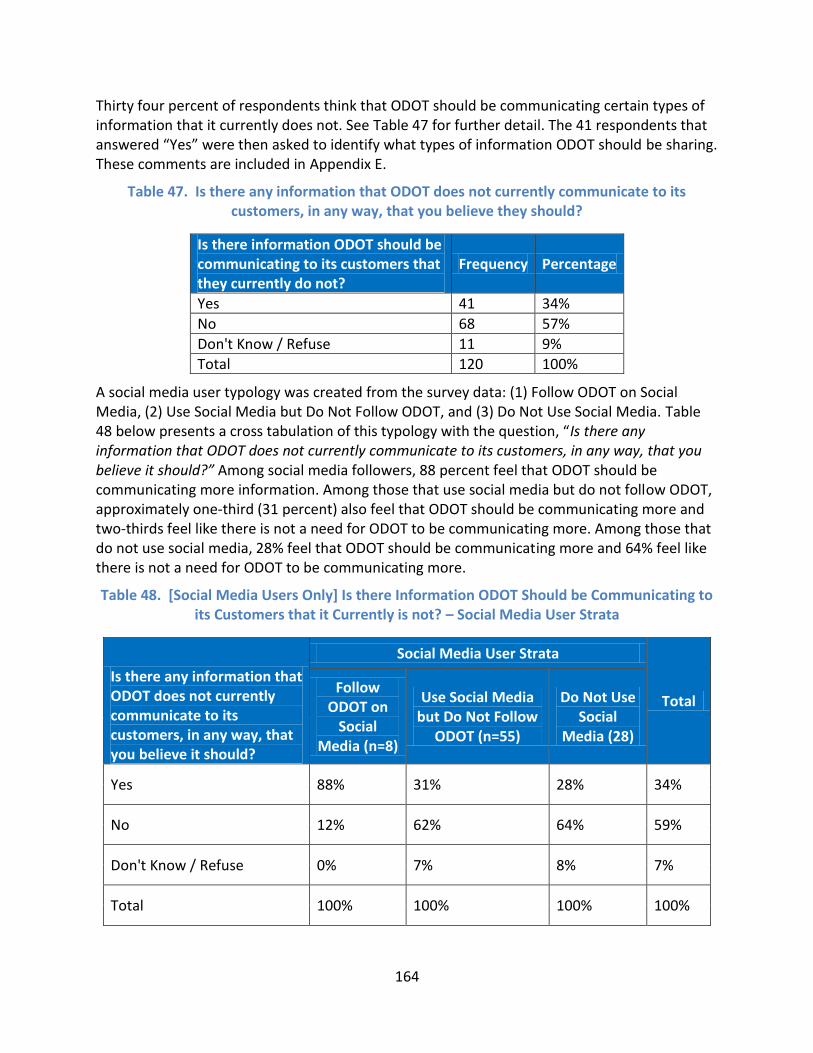
164
Thirty four percent of respondents think that ODOT should be communicating certain types of information that it currently does not. See Table 47 for further detail. The 41 respondents that answered “Yes” were then asked to identify what types of information ODOT should be sharing. These comments are included in Appendix E.
Table 47. Is there any information that ODOT does not currently communicate to its customers, in any way, that you believe they should?
Is there information ODOT should be communicating to its customers that they currently do not?
Frequency Percentage
Yes 41 34%
No 68 57%
Don't Know / Refuse 11 9%
Total 120 100%
A social media user typology was created from the survey data: (1) Follow ODOT on Social Media, (2) Use Social Media but Do Not Follow ODOT, and (3) Do Not Use Social Media. Table 48 below presents a cross tabulation of this typology with the question, “Is there any information that ODOT does not currently communicate to its customers, in any way, that you believe it should?” Among social media followers, 88 percent feel that ODOT should be communicating more information. Among those that use social media but do not follow ODOT, approximately one-third (31 percent) also feel that ODOT should be communicating more and two-thirds feel like there is not a need for ODOT to be communicating more. Among those that do not use social media, 28% feel that ODOT should be communicating more and 64% feel like there is not a need for ODOT to be communicating more.
Table 48. [Social Media Users Only] Is there Information ODOT Should be Communicating to its Customers that it Currently is not? – Social Media User Strata
Is there any information that ODOT does not currently communicate to its customers, in any way, that you believe it should?
Social Media User Strata
Total Follow
ODOT on Social
Media (n=8)
Use Social Media but Do Not Follow
ODOT (n=55)
Do Not Use Social
Media (28)
Yes 88% 31% 28% 34%
No 12% 62% 64% 59%
Don't Know / Refuse 0% 7% 8% 7%
Total 100% 100% 100% 100%
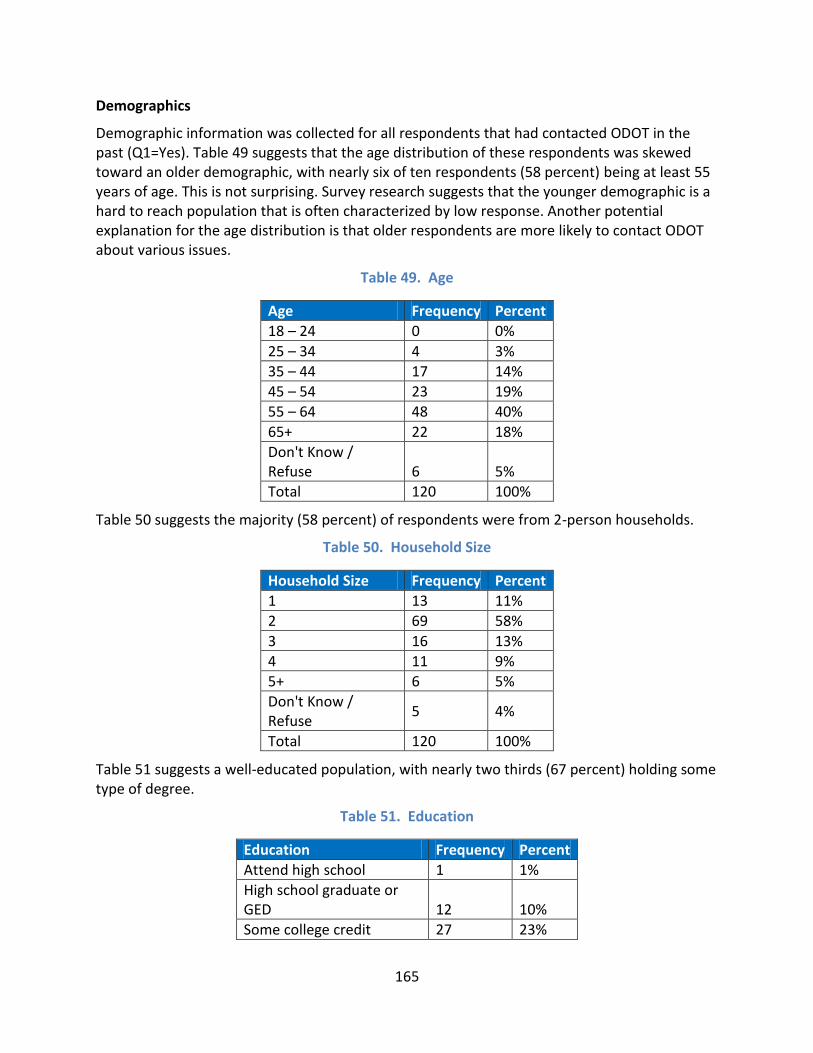
165
Demographics
Demographic information was collected for all respondents that had contacted ODOT in the past (Q1=Yes). Table 49 suggests that the age distribution of these respondents was skewed toward an older demographic, with nearly six of ten respondents (58 percent) being at least 55 years of age. This is not surprising. Survey research suggests that the younger demographic is a hard to reach population that is often characterized by low response. Another potential explanation for the age distribution is that older respondents are more likely to contact ODOT about various issues.
Table 49. Age
Age Frequency Percent
18 – 24 0 0%
25 – 34 4 3%
35 – 44 17 14%
45 – 54 23 19%
55 – 64 48 40%
65+ 22 18%
Don't Know / Refuse 6 5%
Total 120 100%
Table 50 suggests the majority (58 percent) of respondents were from 2-person households.
Table 50. Household Size
Household Size Frequency Percent
1 13 11%
2 69 58%
3 16 13%
4 11 9%
5+ 6 5%
Don't Know / Refuse
5 4%
Total 120 100%
Table 51 suggests a well-educated population, with nearly two thirds (67 percent) holding some type of degree.
Table 51. Education
Education Frequency Percent
Attend high school 1 1%
High school graduate or GED 12 10%
Some college credit 27 23%
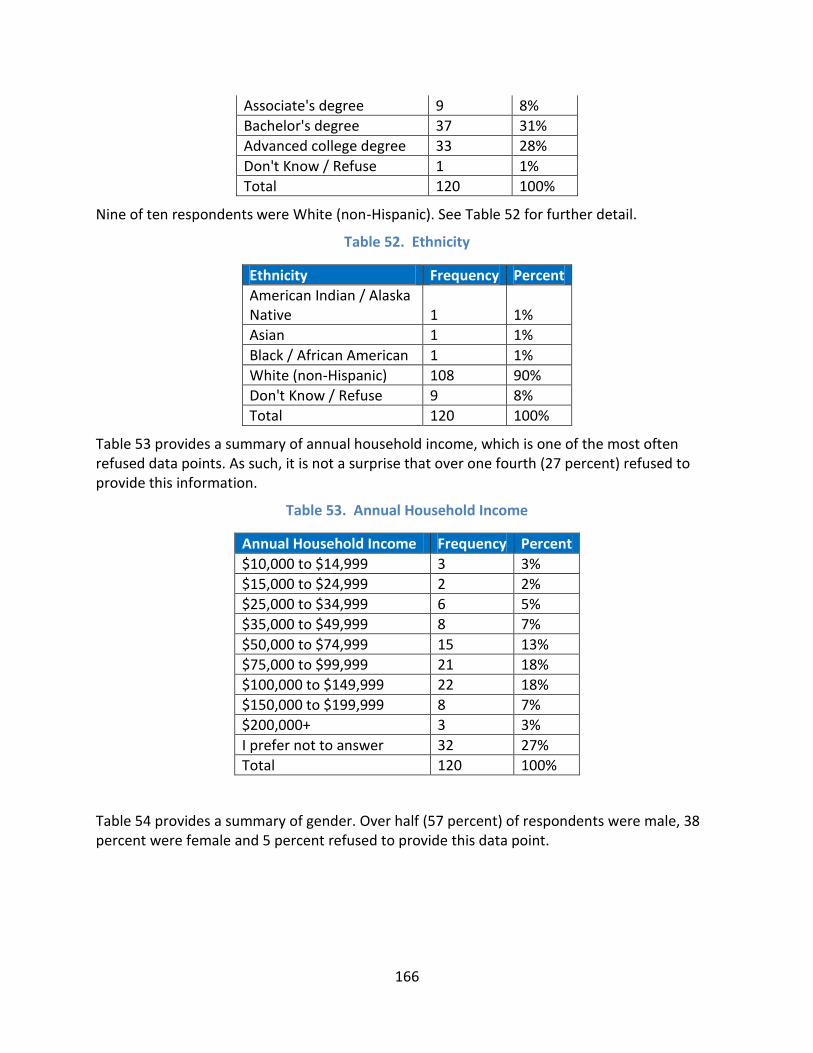
166
Associate's degree 9 8%
Bachelor's degree 37 31%
Advanced college degree 33 28%
Don't Know / Refuse 1 1%
Total 120 100%
Nine of ten respondents were White (non-Hispanic). See Table 52 for further detail.
Table 52. Ethnicity
Ethnicity Frequency Percent
American Indian / Alaska Native 1 1%
Asian 1 1%
Black / African American 1 1%
White (non-Hispanic) 108 90%
Don't Know / Refuse 9 8%
Total 120 100%
Table 53 provides a summary of annual household income, which is one of the most often refused data points. As such, it is not a surprise that over one fourth (27 percent) refused to provide this information.
Table 53. Annual Household Income
Annual Household Income Frequency Percent
$10,000 to $14,999 3 3%
$15,000 to $24,999 2 2%
$25,000 to $34,999 6 5%
$35,000 to $49,999 8 7%
$50,000 to $74,999 15 13%
$75,000 to $99,999 21 18%
$100,000 to $149,999 22 18%
$150,000 to $199,999 8 7%
$200,000+ 3 3%
I prefer not to answer 32 27%
Total 120 100%
Table 54 provides a summary of gender. Over half (57 percent) of respondents were male, 38 percent were female and 5 percent refused to provide this data point.
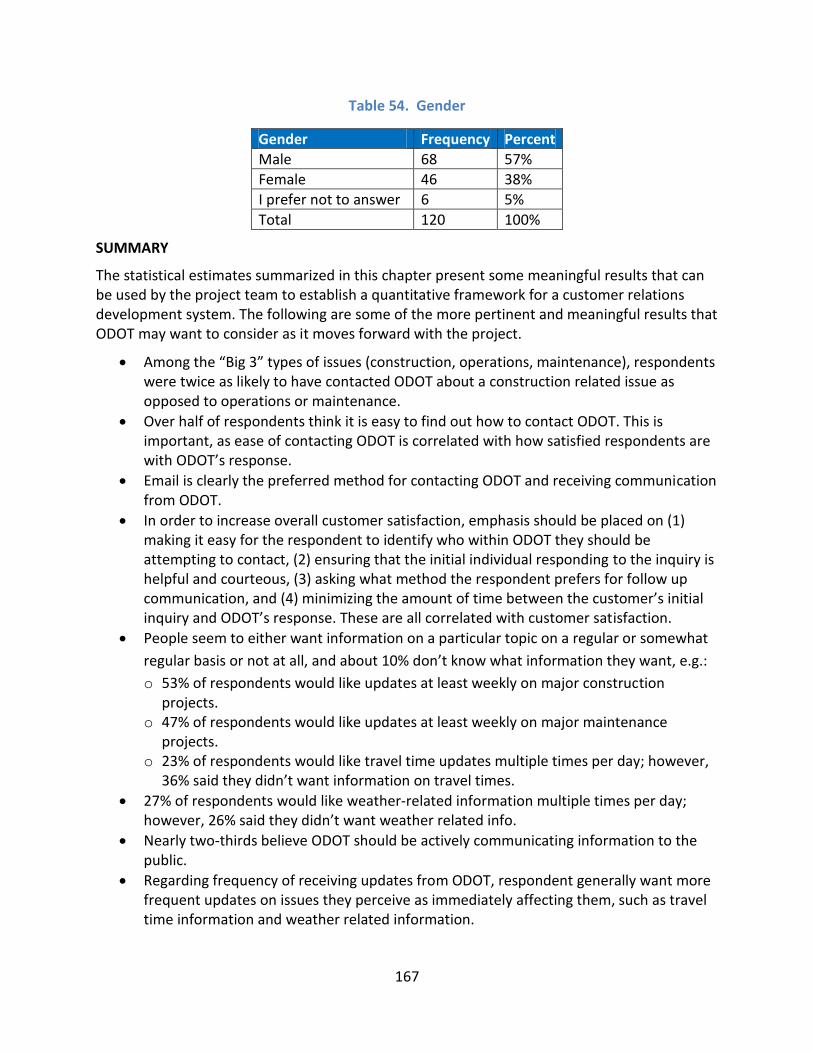
167
Table 54. Gender
Gender Frequency Percent
Male 68 57%
Female 46 38%
I prefer not to answer 6 5%
Total 120 100%
SUMMARY
The statistical estimates summarized in this chapter present some meaningful results that can be used by the project team to establish a quantitative framework for a customer relations development system. The following are some of the more pertinent and meaningful results that ODOT may want to consider as it moves forward with the project.
Among the “Big 3” types of issues (construction, operations, maintenance), respondents were twice as likely to have contacted ODOT about a construction related issue as opposed to operations or maintenance.
Over half of respondents think it is easy to find out how to contact ODOT. This is important, as ease of contacting ODOT is correlated with how satisfied respondents are with ODOT’s response.
Email is clearly the preferred method for contacting ODOT and receiving communication from ODOT.
In order to increase overall customer satisfaction, emphasis should be placed on (1) making it easy for the respondent to identify who within ODOT they should be attempting to contact, (2) ensuring that the initial individual responding to the inquiry is helpful and courteous, (3) asking what method the respondent prefers for follow up communication, and (4) minimizing the amount of time between the customer’s initial inquiry and ODOT’s response. These are all correlated with customer satisfaction.
People seem to either want information on a particular topic on a regular or somewhat
regular basis or not at all, and about 10% don’t know what information they want, e.g.:
o 53% of respondents would like updates at least weekly on major construction projects.
o 47% of respondents would like updates at least weekly on major maintenance projects.
o 23% of respondents would like travel time updates multiple times per day; however, 36% said they didn’t want information on travel times.
27% of respondents would like weather-related information multiple times per day; however, 26% said they didn’t want weather related info.
Nearly two-thirds believe ODOT should be actively communicating information to the public.
Regarding frequency of receiving updates from ODOT, respondent generally want more frequent updates on issues they perceive as immediately affecting them, such as travel time information and weather related information.

168
Social media users are hungrier for information than those that do not use social media. Among social media users, Facebook is by far the most widely used application. However, if ODOT wants to target a younger demographic, applications such as Twitter, Snapchat and Instagram should be considered.