phase relations in the system pbo-co, and … american mineralogist, vol. 49, september october,...
TRANSCRIPT

TIIE AMERICAN MINERALOGIST, VOL. 49, SEPTEMBER OCTOBER, 1964
PHASE RELATIONS IN THE SYSTEM PbO-CO, AND THEDECOMPOSITION OF CERUSSITEI
Devro A. GnrselB2 axn Wrrrrelr B. Wurro,Department oJ Geochemistry and. Minerology and. Materi.als ResearchL ab or ator y, T he P enns yla ani a' S t ate (J ni,v er sity, U ni.v er sity P ar k, P a.
Alsrucr
The decomposition of PbCOr has been investigated by equilibrium methods over therange of 200 to 900' C. and 15 to 1400 bars P66r. The four intermediate oxycarbonatephases are 2PbCO3.PbO, PbCO3.PbO, PbCOs.2PbO, and 4PbCOa.3PbO; these have beencharacterized by optical and:r-ray powder data. The P-T phase projection for the solid-vapor reactions in the system exhibits solid-vapor invariant points at 530o C. and 207 barsand at 570' C. and 380 bars. The liquidus temperature fails rapidly with increasing COrpressure and invariant points marking the intersection of SSV curves with the liquidusoccurr at 755o C. and 145 bars and at 670o C. and 1200 bars. Infrared spectra of the leadoxycarbonates have been obtained.
InrnooucrroN
Although the stability relations of many of the common carbonateminerals have been studied in detail, some of the more complicated sys-tems are not yet completely understood. One of these is cerussite. ThePbO-CO, system is complicated by the existence of a series of oxycarbon-ate compounds, intermediate in composition between PbCO3 and PbO.Very l itt le information is available concerning the composition, structureor even the number of these compounds.
Previous work on the PbO-CO2 system has uti l ized dynamic methods,namely differential thermal analysis and thermogravimetric analysis, tostudy the decomposition of cerussite. Warne and Bayliss (1962) havemade the most recent redetermination of the DTA pattern of cerussite.These authors give a complete discussion of the earlier literature whichneed not be repeated here.
A summary of the DTA and TGA results in the l iterature, is given inFig. 1. The effects of non-equil ibrium methods are clearly i l lustrated.Reactions conducted in COz are reasonably consistent at high tempera-tures but inconsistent at low temperatures as would be expected if thereactions were somewhat sluggish. Reactions conducted in air, in whichthe true vapor pressure of COz in the reaction vessel is not known, are al-most completely inconsistent. There is also considerable uncertaintyabout the number and composition of compounds within the system.
In the study reported here, we have attempted to overcome these prob-
1 Contribution Number 63-63, College of Mineral Industries, The Pennsylvania StateUniversity, University Park, Pennsylvania.
2 Now affiliated with the Department of Ceramic Technology.
1184

P,O-COZ SYSTEM 1185
lems by using equiiibrium rather than dynamic methods and by usingknown pressures of COz. In this way the equilibrium diagram can be ob-tained and the intermediate compounds characterized in some detail.
ExpBnrlrBwrar, MBrnops
The phase projection for the system PbO-COz was determined by react-ing both PbO and PbCOe in individual open gold capsules to a commonend product at high CO2 pressures followed by quenching and examina-tion of the products. The length of most runs was from 20 to 36 hours.
T E M P E R A T U R € (.cl
C ! r i ! . r r I R o r t 6 . d ( r 9 4 2 )O T A - o i r
r i c o l ( l 9 a a )T O I - o i ?
g . c r ( 1 9 ! O l
G o r n C X . . . l a . l 1 9 6 O l
c . 6 r n . . t r . r . r o r [ 9 2 5 ]r o a - c q
L ! n ! r . ( 1 9 ! ! )r 6 l - c o r
t . r . r r r { r l 3 7 lr G A - c g r
e l o t . . r | { o a . ' o t t g t }1 6 l - c o r
C . t . n O r . . r l . r ( t 9 6 O )I C a - C O a
f ! r n . A 6 . r l r . r ( 1 9 6 2 1o r ^ - c q
f - r r - l r , z l
l r z l e , s l z s l
-l t t lr zl ctol - Fb!o. ------l- Pbo
_ _ l s 3 l r r I r z _
P b o
P b o
Pbo
Frc. l. Comparison of decomposition temperatures of lead oxycarbonates reportedin the literature.
The high pressure "hydrothermal" apparatus used was similar to thatdescribed by Harker and Tuttle (1955). Measurements were made overthe range of 200-900' C. and 15 to 1400 bars of COz. Temperatures weremeasured by chromel-alumel thermocouples and should be accurate to+ 5o C. CO: was obtained from commerical tanks; pressure was measuredby stainless steel bourdon tube gauges and should be accurate to *5/6.To avoid the reduction of the lead compounds to metall ic lead by tracesof organic impurities the entire high pressure system was cleaned by aseries of acetone flushings and evacuations.
Products of all runs were examined under the petrographic microscopeand the phases determined by *-ray diffractometry. Precise r-ray powderdata reported here were obtained by scanning glass slide mounts in aNorelco diffractometer using silicon metal as an internal standard.
Infra-red spectra were obtained on a Perkin-Elmer Model 21 Spec-

1186 D. A, GRISAF]J. AND W, B. WIIITE
trophotometer equipped with KBr and NaCl prisms using the KBr disctechnique.
Formulae for the lead oxycarbonates were determined by gravimetricignition. Pure oxvcarbonate samples were placed in weighed platinumcapsules, dried to constant weight, and then heated to constant weight at650' C. in a nitrogen atmosphere. This yielded the per cent weight loss ofCOz and from this value the ratio of PbCOa to PbO was calculated.
CnenecrBnrzATroN ol rHE LBat Oxyc,qRBoNATES
The lead oxycarbonates are white and possess indices of refractiongreater than methylene iodide (1.736). COz pressures of the order of 700
TasLB 1. Wercnr Loss Arnnsss
Assigned Formula
2PbCOs PbO
Pbco3.Pbo
Pbco3.2Pbo
4PbCO3.3PbO
Preparation Conditions
P(psi) T(" C) Time
(% WeightLoss
(actual)
/6 WeightLoss
(theoretical)
1 s,ooo .sso110,000 s8s
1 r, roo 46s| 1 ,100 465
1 z,soo 62sI 8,200 675
frs,ooo 640I 15,000 635114,000 635
rveekweek
lveek2 weeks
week2 weeks
11 .69 \11.6s)
s .92\8 . e 1 J
6.13\6.28)
10. 1ol10.34 |e .e7 )
l l 62
8 . 9 7
6 . 1 6
1 0 . 1 3rn eeku'eeklveek
bars were used to prepare samples for optical studies since lower pressurepreparations tend to be poorly crystallized, appearing as cryptocrystal-line aggregates.
The compositions of the lead oxlrcarbonates as determined by weightIoss analysis are given in Table 1.
The lattice spacings are easily reproducible whiie intensities are at bestrough approximations since these vary appreciably with the P-T condi-tions of formation. The results for all the compounds are presented inTable 2. The data in Table 2 for PbCOe.PbO and PbCOa.2PbO are invery poor agreement with the d-spacings obtained by Peretti (1957).Since Peretti obtained his materials at low pressures and temperatures,they are poorly crystall ized as shown by the broadened peaks in hispowder photographs. This may ofier an explanation for the differences.

P^O.COZ SYSTEM LI87
2 PbCOz. PbO. This compound possesses the highest degree of crystall in-ity of ali the lead oxycarbonates. Optically, it is uniaxial negative andshows positive elongation. High pressure runs of relatively long duration,i.e. 700 bars for one week, showed an abundance of platy fragments.Many of these fragments showed partial or complete hexagonal outlineswhich yielded uniaxial optic axis interference figures thereby indicatinga hexagonal compound with a well developed basal cleavage.
Tesln 2A. X-rey Powonn Dar,l, 2PbCO:.PbO
6.9484 . 6 2 51.3823 .8603 . + 7 13 2712.6692 . 3 7 92 3r12 .28 t2 . 1 1 52.067r .82r
| . 7341 .6341 5601 .5411 504| .462
002100,003101t020041031 1 0105200,006201lt4203, 106r07210, tl62 t l2t3214300302303
1 .408t . 3 9 41 .3881 . 3 1 1 11.2825r .277 |1 . 2 3 6 21 -23161.2170I . I J O J
t . l2 I81 .10751.06121 .03981.03421 03160.99t20.9692o.9621
hkl
3o12t6
400403
. ' tzJ
I
101011
40OJ
65z
10031
304
I J
1010
IIL
30
1
24262126
I J
626+22+
2
J) ' ' ' . r 17
306,223,310J l l
J l J
The compound was indexed on a hexagonal unit ceil with parameters
ol a--5.339 A and c: 16.03 A. Almost all the l ines are accounted for usingthese parameters, but a few weak non-indexable reflections are present
thereby suggesting that the compound possibly has a hexagonal subcellfor a larger super-lattice. X-ray intensities also indicate a possible 100
cleavage. In both the h00 and 001 planes, the even numbered values of hand I are strong reflections while odd numbered values are very weak.
PbCq.PbO. The stabil ity f ield of this compound is well below the COzpressures used to prepare the other lead oxycarbonates. Although runs oftwo weeks duration produced very few observable crystal fragments, the
addition of water enhanced crystallinity to the point that optical exami-

1 188 D. A. GRISAFE AND W. B. WIIITE
Taer,r 28. X-nay Poworn Derl, PbCO: PbO
1.933 | 15 1 . 5 3 6| 4991 .4861.467l . + 4 11 . 4 2 31.3821 . 3 7 01 .348
1 . 9 1 0 | 3 51 . 8 8 7 | 7 B1 . 8 4 1 I 3 B
6 . 4 7 84 . 1 3 54.0243 . M 93 .3853 . 2 2 33 . 1 8 22.9352 859z . l J l
2.6522.5682.4982.+7r2.3282.2882 2532.1832.1602.0632.013
2030552
r.')100
95
30604
20406 B4 B
2030J . )
35I J
t . )
25
.3321
.31643084
1.2954
1.1963t . 1 7 r 71 . 1 5 6 71 . 1 4 6 81 1 n 1 1
1 . 1 1 5 71 .10051.09331 07931 .0700|.06231 .05021 . 0 3 7 21.0243| -ol+70.9881o.97 690.96660 .95390.9410
1 . 8 2 2 1 0
883A
o
7642n
75A
A
45I
J
A
1 . 8 1 1 I 9 B1 8 0 1 I 4 81 . 7 5 0 | 1 5t . 73 r | 25r .720 | 15t . 6 9 4 | 1 5
Remainder of peaksgenerally broad1.667 | 71 . 6 5 4 | 1 51 . 6 3 2 | 7r .619 | 61 . 6 0 8 I 61 . 5 9 7 | 3 01 . 5 8 0 I 1 51 . 5 5 8 | 4
1.2848t . z t J t
| .2611r.2533r.2483r.2396r .22541 .1995
nation was possible. The compound is biaxial negative, orthorhombic,shows positive elongation and possesses a rather large 2V estimated at60o-70o. Pinacoidal and dome cleavages are present, the dome being pre-ferred as indicated by a dominance of off-center acute bisectrix figures.
Diffractometer peaks were rounded and often occurred as clusters ofreflections whose resolution decreased at hieher angles.
Taerc 2C. X-nav Pomnn Dara, PbCOr'2PbO
7 .0705 . 5 5 34 5664.4574 . 0 1 53 . 5 9 83 . 5 2 33.0052.9392 . 8 7 5
2 . 7 7 62.6592 . 4 2 72.3682.3492.2802.1892.O48r .997r .847
I
1002L
3875
l . )
510
d
1 . 4 3 41 .4181 .386r . 2 9 2 31.18371.14 t91 . 1 2 2 01 1088
I
52
102335
I
15+
9
2,)
J J
2535
1.790 | 201 . 7 5 9 1 51 . 7 1 4 | 1 01 . 6 9 6 5
Remainder of peaksgenerally broad1.680 71 .640 91 . 5 7 1 I 1 5

PbO-CO, SYSTEM 1189
PbCq.2PbO. Optical examination of this compound shows it to bebiaxial, negative and orthorhombic with 2V:50' 55". Crystals showthree well defined pinacoidal cleavages and a platy habit. occasionalgroups of fragments were observed which showed cleavages and habit,appearing as stacked rectangular plates.
Teslr 2D. X-nev Powran Dara, 4pbCOr.3pbO
The r-ray data were not extended above 20:90o since the few peakswhich occurred above that angle were extremely broad and of very lowintensity thus making accurate 2d determination impossible.
4PbCOs.3PbO. This compound, stable at high P-T conditions, has neverbeen reported in literature and is the most difficult to studv of ail thesolid phases of the PbO-COr system.
1190 D. A. GRISAFE AND W. B. WHITE
Optically, it is biaxial, negative and possesses a 2Y of 50o* 10o. Prob-
ably its most distinctive optical feature is its irregular fracture as well as
the fact that it appears to possess the highest relief and birefringence of
all the lead oxycarbonates. Several cleavages were present which could
not be determined and there appeared to be an absence of BxO figures.
While it appeared that both parallel and inclined extinction were present'
suggesting a monoclinic crystal, there is some question as to whether the
former may not really be slightly inclined, but not sufficiently resolved
under the microscope. The latter condition indicates a triclinic compound
with interaxial angles close to 90o.Inconsistent intensities were obtained when powder mounts were made
by the usual method and a technique of sieving powder onto a thin film
of vaseline had to be adopted to obtain consistent intensities from speci-
men to specimen. The notable feature of the diffractometer patterns of
this compound are its clustered peaks. Many of the broad peaks are com-
posed of two to four reflections.
Sorrn-Vapon RB.q.cuoNs
The construction of the P-T projection required only the accurate
identification of the phases present in order to determine how far PbCOa
had decomposed and PbO carbonated. If both capsules had one phase
(plus vapor) in common, that phase was the stable one under the P-T
conditions of that particular run. Complete conversion was not necessary,
only the direction was needed to place the equilibrium point on the pro-
jection. If both starting materials had two solid phases (plus vapor) in
common, the P-T conditions were considered to lie on a univariant curve.
The stability fields of the solids and liquid phase of the system are
represented in the P-T projection (Figure 2) from 200o to 900" C. and 1.5
to 1400 bars. All the solid-vapor univariant curves possess a characteris-
tic positive slope while the liquidus slope is negative.
The following reactions are found to occur within the range of this
study:1. 3pbCO:e[2PbCO3. PbO]+CO,2. 2l2Pbcq' PbOl e+31p666,' PbOl + CO,3. 3[PbCO3.PbO]++2[PbCOB' 2PbO]+CO,4. [PbCOr' 2PbO]e+3PbO*CO:g. ple++Liquid6. [PbCO3' 2Pbo]eliquid7. [2PbCO3 ' PbO]++[PbCOB ' 2PbO]+ CO,8. 7[2PbCO3'Pbo]<+3[4Pbcos'3PbO]+2Co,9. 3[4PbCO3. 3PbO]<--+7[PbCOa' 2PbO] +5CO,
10. [4PbCOB'3Pbo]e+Liquid
From 17 to 145 bars the reaction sequence with increasing temperature
is 1++2e+3++4<+5, the univariant curve for reaction 5 being estimated.

PbO-CO, SYSTEM 1191
The lowest pressure invariant point occurs at 755o C. and 145 bars where1:2, PbO, Iiquid and vapor coexist. At 530'C. and 207 bars there is asecond invar iant point at which 2:1, 1:1 and 1:2 coexist wi th vapor.Between these invariant point pressures, the reaction sequence with in-creasing temperature is 1<+2<-+3++6. The third invariant point occurs at570" C. and 380 bars where 2: I , l :2 and 4:3 coexist wi th vapor and at
LIQ U ID
B O O
2@ 400 600 800T E M P E R A T U R E ( " C )
Frc. 2. P-T phase projection for the systern PbO-COz. Univariant curves arebased on the critical runs shown.
I tIII
aG
co
o
o-
o_N
o Pbcoso 2PbCOs.PbOE 4PbCOs.3PbOa Pbcos.Pbo
I Pbco3.2Pboo PboI Liquid
n
fo
II92 D. A. GRISAFE AND W, B. WHITE
pressures between 207 arrd 380 bars the reaction sequence is 1.-+7++6. A
fourth invariant point occurs at 670" C. and 1200 bars at which I;2, 4:3
and liquid coexist with vapor. The reaction sequence at pressures be-
tween 380 and 1200 bars occurs as 1+-+8<-+9e-+6. At pressures above the
last invariant point, the reaction sequence is 1++8+-+10, the univariant
curve of reaction 10 being estimated.
The liquidus curve of reaction 6 was located by the physical appear-
ance of the sample. When melting occurred, the sample underwent a
large apparent volume change and appeared as a small lump molded to
the capsule bottom. The negative slope of the curve implies that the
vapor is increasingly soluble in the liquid with increasing pressure'
Although no attempts were made to study reaction kinetics, r-ray
identification of the runs indicated the solid-vapor reaction to be rather
sluggish, complete conversion requiring a week's duration.
Runs were plotted on a COz pressure (log scale) versus reciprocal tem-
perature diagram and the resulting curves extrapolated to one bar COz in
order to compare the results of this study with those previously reported.
The plot and literature values are shown in Fig. 3 where, at one atmos-
phere, the horizontal lines represent the temperature ranges reported in
the literature for the various reactions while the vertical marks along
these lines indicate individual data. The reactions represented by four of
the authors are the successive formation of the 1'.1, l iz and PbO com-
pounds while Glasner and Hodara (1958) indicate two reactions to occur
within the reported formation temperature range of the 1: 1 compound.
Centnerswer's work was not included since it is wrong insofar as the reac-
tion sequence is concerned.The results of this study when extrapolated suggest the following reac-
tions and their respective temperatures at one atmosphere CO2:
3PbCOB<--)l2PbC03. PbOl + CO, 204' (+20) C.2[2PbCO3.PbO]e3[PbCO3'PbO]+CO, 283' (+15') C.
3[pbcoe.Pbo]++2lPbcor.2Pboltcor 373" (+15) C.
tPbcos 2Pbole3Pbo*coz 435" (+10 ' ) C .
The first reaction has never been reported while the last three reactions
are in close agreement to Garn and Kessler (1960) who reported 283',
380" and 430' C. resPectivelY'
The extrapoiated reaction temperatures are estimated to be accurate
to * 20oC. From the large range of reaction temperatures, it would ap-
pear that equilibrium was not attained in the previous studies. The de-
crease of temperature ranges with increasing temperature points to the
non-equilibrium conditions especially prevalent at lower temperatures
where reactions are naturally more sluggish. Even at elevated P-T condi

PbO-COZ SYSTEM 1193
tions complete conversion of starting materials generally required a week,thus, one can hardly hope to obtain equil ibrium in a DTA or TGA studyat one atmosphere CO2.
The above discussion points to the reason why the formation of2 PbCOe.PbO has never been reported. The wide range of reported for-mation temperatures of Pbcoa.Pbo results from the formation of both
T E M P E R A T U R E ( " C )
U)E.
c o l
No
co
t 8 0 t 6 0
I x to5 ( "K)
Frc. 3. coz pressure versus reciprocal temperature plot extrapolated to one bar coz forcomparison with literature values by: (1) Lamure (19s3), (2) peretti (1957), (3) Garn andKessler (1960), (4) Warne and Bayliss (1962), and (5) Glasner and Hodara (1958).
compounds since at low temperatures the two reactions overlap oneanother and appear as one reaction on DTA or TGA apparatus. In onlyone case (Glasner and Hodara, 1958) has the l iterature reported two reac-tions within the above mentioned temperature range, and as one wouldexpect, the recorded temperatures are considerably higher than those sug-gested by this study.
It would not be meaningful to extrapolate the curves of Fig. 3 to theCOz pressure in air (approximately 0.0035 bars) in order to attempt aninterpretation of the literature results since it is impossible to predict thecomposition of the ambient atmosphere surrounding the sample once thedecomposition has begun. I{owever, one can be relatively certain that
It94 D. A GRISAFE AND W. B WHITD
PbCOB.2PbO does not exist in equil ibrium with air on the basis of the
converging slopes of the third and fourth curves from the left in Fig. 3'
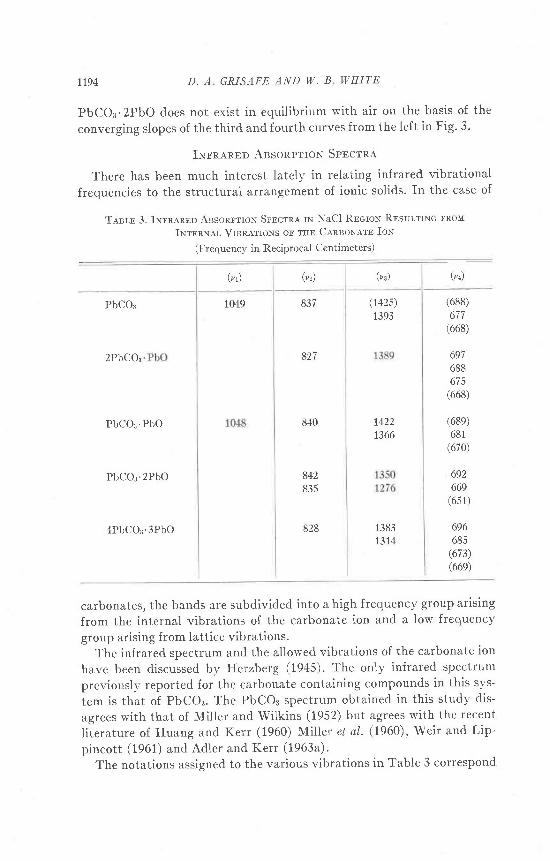
Ixrnanon AssonmroN SPocrne
There has been much interest lately in relating infrared vibrational
frequencies to the structural arrangement of ionic solids. In the case of
'I',rer-o 3. INlna.nr,n AesonptroN Sprcrnl rN NaCl Rrcros RnsutttNc rnolr
Ixrenxar, VrtnertoNs ol' tnr CansoN,tre IoN
(Frequency in Reciprocal Centimeters)
\v1 ) \Yz) \.4) (vi
PbCOe
2PbCO:
Pbco3.Pbo
Pbcos.2Pbo
4PbCO3.3PbO
t049 (142s)1393
1422t366
(688)677
(668)
697688675
(668)
(68e)681
(670)
692669
(6s1)
696685
(673)(66e)
837
827
840
842835
828 13831311
carbonates, the bands are subdivided into a high frequency group arising
from the internal vibrations of the carbonate ion and a low frequency
group arising from Iattice vibrations.The infrared spectrum and the allolved vibrations of the carbonate ion
have been discussed by Herzberg (1945). The only infrared spectrum
previously reported for the carbonate containing compounds in this slts-
tem is that of PbCO3. The PbCOs spectrum obtained in this study dis-
agrees with that of Mil ler and Wilkins (1952) but agrees with the recent
literature of Huang and Kerr (1960) Miller et al. (1960), Weir and Lip-
p incot t (1961) and Adler and Kerr (1963a).
The notations assisned to the various vibrations in Table 3 correspond

PbO-CO2 SYSTEM 1195
to those used by Herzberg. The free carbonate ion has six fundamentalvibrations of which two are nondegenerate and two are doubly degener-ate, giving rise to four expected vibration frequencies. The totaliy sym-metric stretching frequency (u1) and the out of plane bending frequency(rr) a.e nondegeneratewhile the asymmetrical stretching and planar bend-ing frequencies, u3 and u1 respectively, are doubly degenerate. The spec-tra of the carbonate containing solids in the PbO-CO2 system are so simi-lar to the spectrum of the free carbonate ion given by Herzberg that anunequivocal assignment of the internal vibrations can easily be made.
It is apparent from Fig. 4, that more than four fundamental vibrationsappear in the absorption spectrum of the lead carbonates. Most of thebands are split into several components. Such a splitt ing can result fromany of three causes:
(a) Removal of degeneracy of the vibration due to a Iow symmetry environment.(b) The existence of carbonate ions in two or more non-equivalent sites in the structure.(c) Coupling of the fundamental with a low frequency lattice vibration.
The removal of degeneracy occurs in many internal vibration spectrain solids. Adler and Kerr (1963b) have discussed the doubling of bandsthat occurs when carbonate ions occur in non-equivalent sites.
The symmetric stretching frequency (ur) of the free ion is infrared for-bidden. This frequency appears as a weak band in both PbCO: andPbCOs.PbO spectra near 1050 cm-r indicating that some breakdown ofthe selection rules does take place. For this mode to appear, the ion mustundergo a change in dipole moment during the vibration. The effectivemolecular symmetry must be lowered fuom D37, to Cg, or lower.
The out-of-plane bending frequency gives rise to only one absorptionpeak which is present in all the spectra in the neighborhood of 830 to 840cm-r. The unique doublet which occurs at this frequency in the PbCOs.2PbO spectrum cannot be due to a simpie removal of degeneracy andmust be explained as an interaction of the out-of-plane bending fre-quency with the lattice or to the carbonate ion being located in two dis-tinctly different lattice sites.
The asymmetrical stretching frequencv (u3) occurs in the neighbor-hood of 1300 to 1400 cm-l and is the strongest band in all these carbonatespectra. In the case of 2PbCOr.PbO only a single band appears. This isnot surprising since this compound possesses the highest symmetry of thesolid compounds in this system. The other spectra all show splitt ing ofthis absorption band implying that two-fold degeneracy has been re-moved in the lower symmetry lattices.
The same removal of degeneracy occurs in the case of the planar bend-ing frequency (ua) which occurs in the frequency range of 650 to 690 cm-l.
O
z
'o
o
o
o
F
IN
F
L H
dv
z ' - . ^
3 3E
o
a
I
Ri5
o
eU
E
RItr
o; - E
' 8zU Rr l (o
Er R
I
8o
@
gRY
--.1'
1=
o()(I
o().N
o!o-
oc
(I
o(J
(!
( s l l N n A U V U t t g u v ) 3 f , N v r r l t r l s N v 8 l 1 N 3 l U f d

P\O-COZ SYSTEM 1197
A series of bands also appear at longer wavelengths in tl ie KBr regionof the spectrum. Only two of these, the band at 420 cm-l in pbCOs.2pbOand the band (only half resolved within the l imitations of the availableinstrument) at 390 to 400 cm-l in 4PbCOa.3PbO appear from their inten-sity to be true lattice vibrations. The other weaker bands are l ikely over-tones and combination bands of lower-lying lattice modes.
TnnnlrooyNAMrcs or. rnn Sor-rl-Vlpon RolcrroNs
A relatively small amount of thermodynamic data have been publishedconcerning solid-vapor reactions of the type encountered in this system.For this reason as well as to supply additional information regarding thePbO-CO, system, fundamental thermodynamic quantit ies of reactions
Teer,n 4. Cnmcrs ol FrBn Er.rrncv, ENrnlrlv, aNoEnrnopy ol Rn,q.crrom .q,r 100 Bans
Tempera-ture
e K )
3PbCOze2PbCOa. PbO*CO:2[PbCO3. Pbo]e3lPbCOs. PbOl +CA3lPbcos. Pbole2 [Pbco3 2PbolPbcor 2Pboe3Pbo*cos
693743763980
10.3 . 51 0 4 . 3104.7107.O
a^tcal
mole
A Fkcalmole
- 6 3 9 ( + 0 .- 6 8 6 ( + 0- 7 . 0 5 ( + 0 .- 9 . 1 0 ( + 0 .
1 .s . s (+ I 6 )13 .6 (+ 1 . 6 )25 . 6 (+ 3 .6 )1 5 . 0 ( i 1 . 3 )
have been calculated, namely changes of free energy, enthalpy, andentropy at 100 bars pressure.
In order to calculate thermodynamic quantities for the reactions, aplot of fugacity (Majumdar and Roy, 1956) versus reciprocal tempera-ture was constructed. From this plot both the change of free energy ofreaction (AF) and heat of reaction (AH) could be calculated and fromthese two quantit ies the entropy change of reaction (AS) in accordancewith the following equations:
aF : - 2.303RT log f2.303 R(log f,/f1 r
i n : -1/Tt - l/Tz
^S : - {L-^sT
The results of the caiculations are eiven in Table 4.
AcrNowrnocEMENTS
This work was supported bv a fellowship (to DAG) from the Interna-tional Lead-Zinc Research organization. we are indebted to professorRustum Roy for much helpful advice.

1 198 D. A. GRISAFIl AND W. B. WHITE
Rnlrnn'Ncrs
Aolnn, Hlrs H. eNo P.tur, F. Krnn (1963a) Infrared absorption frequency trends for
anhydrous normal carbonates. Am. Mineral 48,124-137- - (1963b) Infrared absorption and structure relations of some carbonate minerals.
Arn. Minerol.48, 839 853.
Brcr, Caar- W. (1950) Differential thermal analysis curves of carbonate mlnerals. Am.
Mi.nuaI.35,985-1013.crrrNnnswen, M., G. Far-r AND A. AwERBucn (1925) uber die Dissoziation des Bleikar-
bonates. Zeit. Phys. Chem. L15,29-53.
Curnnrnr, F L. .qNn R. A. Rowr-eNo (19a7) Differential thermal analysis of some car-
bonate minerals. Am. Mineral'.32, 11l-716.
G,lnN, Peur. D. aNo JonN E. Krssr-nn (1960) Thermogravimetry in self-generated atmos-
pheres. Anal,. C hem. 32, 1563-1 565.
Gr.asNen, A aNn I. Hooau (1958) On the thermal decomposition of lead carbonate. Butrl.
Res. Council' I sroel 7 A. 66-7 3.
Henxen, R. I . n l lo O. I r . Turrr-e (1955)
The thermal dissociation of calcite,
209-224.Hrnzeenc, Grnnenn (1915) Molecular Spectra and. Moleatlor Structure II,Infrared and
Raman Spectra oJ Polyatomic Mol'ecules. D. Van Nostrand Company, Inc , New York'
Hu,rNc, C. K. aNl Paur. F. KERR (1960) Infrared study of the carbonate minerals. Am.
Mi.neral. 45, 316-32I.
LAMURE, Jur-rs (1953) Thermal decomposition of Pbcor. comptes rendus 236,926-927.
Ma;uunnn, A. J. eNo Rusruu Rov (1956) Fugacites and free energies of coz at high pres-
sures and temperature Geoehim. Cosmochim' Acto 10,311-315.
Mrr-rnn, Forr- A., Gnner-o L. Cenr-sox, FnnElr,tN F. BoNrlv AND WADE H. JoNas (1960)
Infrared spectra of inorganic ions in the cesium bromide region (700 300 cm-l)'
S pectr o chimica A cta 16, 135-235.
Mrr-r-nn, F. A. a1o C. H. Wrr-xrNs (1952) Infrared spectra and characteristic frequencies of
inorganic ions. Anal'. Chem.24, 1255-1263.
Nrcor, Ar-rnnr (1948) Preparation of lead sesquioxide by the action of heat on lead car-
bonate. Comptes r endus 226, 670-67 2
PrnErrr, E. A. (1957) Thermal decomposition of lead carbonate. rour . Am. Ceram. Soc.4O,
I I l - l 1 5 .
wenNn, S. Sr. J. aNo P. Bevlrss (1962) The differential thermal analysis of cerrusite
Am. Miner al'. 47, loll-1023.Wrrn, C. E. aNo R. Er-rrs Lippincott (1961) Infrared studies of carbonates and nitrates'
Jour. Res. Nal. Bur. Stand'.654, 17Gl78.
Manuscript receiaed, Januory 18, 1961; accepted Jor publication, ApfiI 15 ' 1961'
Studies in the system CaO-MgO-CO:, Part 1,
dolomite, and magnesite. Am. Jour. Sci.253,