corporate presentation pt garuda indonesia (persero) tbk · 0 corporate presentation pt garuda...
TRANSCRIPT

0
Corporate Presentation PT Garuda Indonesia (Persero) Tbk
DAIWA ASEAN Conference – IDX: Best of Indonesia 2013 Tokyo, 21 – 22 October 2013
Delivering Indonesia’s Best to the World

1
Agenda
1. Industry Overview
2. Company Overview
3. Recent Developments
4. 1H-2013 Performance
IMPORTANT DISCLAIMER:
Information contained in this document has been prepared from several sources and the Company does not confirm the accuracy and completeness of such data, particularly where the data is sourced from outside the Company. In addition, any forward looking
statements are subject to change as a result of market conditions and the final result may be different to that indicated. The Company makes no representation or warranty of any type whatsoever on the accuracy or completion of the information contained herein.

2
1. Industry Overview

3
Agenda
1.4 billion
Asia Pacific will have the biggest air passenger traffic volume
2009 2030
Source: Airport Development, IATA
4.9 billion
1.4 billion
2.7 billion
1.5 billion
2.4 billion
1.1 billion
0.4 billion
0.2 billion
0.4 billion

4
(50)
-
50
100
150
200
250
300
-
200
400
600
800
1,000
Indonesia Thailand Malaysia Singapore Philippines Vietnam Brunei Darussalam
Cambodia
GDP Population
-1.8 -0.2 -0.1 0.3 0.9
1.7 1.7 2.0 2.0 2.5 2.5 2.8 2.8 2.9 3.0 3.4
4.4 5.6
6.3
7.8
Ital
y
Fran
ce
Euro
pea
n U
nio
n
Ger
man
y
Un
ited
Kin
gdo
m
Can
ada
Un
ited
Sta
tes
Jap
an
Sou
th A
fric
a
Bra
zil
Ru
ssia
n F
eder
atio
n
Arg
enti
na
Ko
rea
Mex
ico
Au
stra
lia
Turk
ey
Sau
di A
rab
ia
Ind
ia
Ind
on
esia
Ch
ina
‘In terms of its fundamentals, INDONESIA IS IN A STRONG POSITION from which to navigate through current global macroeconomic uncertainties’ (IMF country report, Sep 2012)
Value in %
IMF predicts until 2017 Indonesia will enjoy the highest economic growth as compared to its ASEAN peers
Indonesia is the biggest economy in ASEAN
Source: The World Bank 2012 data, accessed in Oct 2013
Indonesia: 2nd Fastest GDP Growth among G20 countries in 2013
Source: IMF-World Economic Outlook, July 2013
USD billion Million people

5
Outlook of the Indonesia’s economy until 2030 is promising
current 2030
16th-largest economy in the world
7th-largest
45 million
members of the consuming class
135 million
55 million
skilled workers in the Indonesian economy
113 million
$ 0.5 trillion market opportunity
in consumer services, agriculture &
fisheries, resources, & education
$ 1.8 trillion
53% of the population in cities producing
71%
74% of GDP 86%

6
1.2 1.3 1.6
1.9 2.2 2.3
3.0 3.5 3.6
3.8 4.1
4.4 4.8
5.1 5.6
Source: IMF, World Economic Outlook (WEO), Apr 2013; World Bank
Indonesia: GDP per capita
Most populous country in the South East Asia (4th largest in the world) with people distributed across a number of medium - large cities and high density provinces
Largest archipelago in the world lending greater importance to air travel; potential for taking market-share from land / sea travel
Most populated cities in the region
Medan 2.0 million
Kuala Lumpur 1.6 million
Petaling 1.5 million
Jakarta & surrounding area 12.0 million
Singapore 4.6 million
Manila 1.7 million
Surabaya 2.6 million
Ujung Pandang 1.2 million
Indonesia : Unique opportunity within Asia
Sources: Bloomberg, Sep’ 2013
By Air
By Rail
By Sea
37.4
194.1
3.4
2008 71.2
202.2
2.8
2012 +17.5%
+1.0%
-4.7%
CAGR
Monthly traffic statistic 2005-May 2013
Indonesia: Transportation profile (in million)

7
2004 2005 2006 2007 2008 2009 2010 2011 2012 2013F 2014F 2015F
Premium Budget Traveler GA Pax
Indonesia is forecast to enjoy a solid air traffic growth for the next three years after a robust economic growth outlook
Domestic and International market size to grow at CAGRs of 15% and 10%, respectively, from 2004 – 2012 GA’s Domestic and international market share expected to reach 34.4% and 25.9% in 2015, respectively, up from 21.5% and 15.1% in 2012
28.8
43.8 51.6
60.0
71.2
94.1
108.3
34.0 39.2 37.4
23.8
81.9
Domestic Market Size (million)
2004 2005 2006 2007 2008 2009 2010 2011 2012 2013F 2014F 2015F
Business Leisure GA Pax
30.0
11.0 10.7 11.3 13.2
14.8 16.2 18.9
21.7 23.7
25.7 27.9
International Market Size (million)
Note: GA Pax, S-100 seater & Alliance Sources : Dephub, PT. AP I & II, IATA, PATA, Ministry Transportation, Garuda Forecast

8
Indonesia
Malaysia
Australia
In terms of air traffic, Indonesia has much room to grow
5.4
39 (722%)
Population
Air Traffic
Singapore
7.2
42 (583%)
Hong Kong
22.8
81 (355%)
Numbers are in million
63.1
171 (271%)
UK
29.0
48 (166%)
94.9 * (39%)
Sources: IATA, CAPA – Jun 2013 * DepHUb, IATA, PATA
9
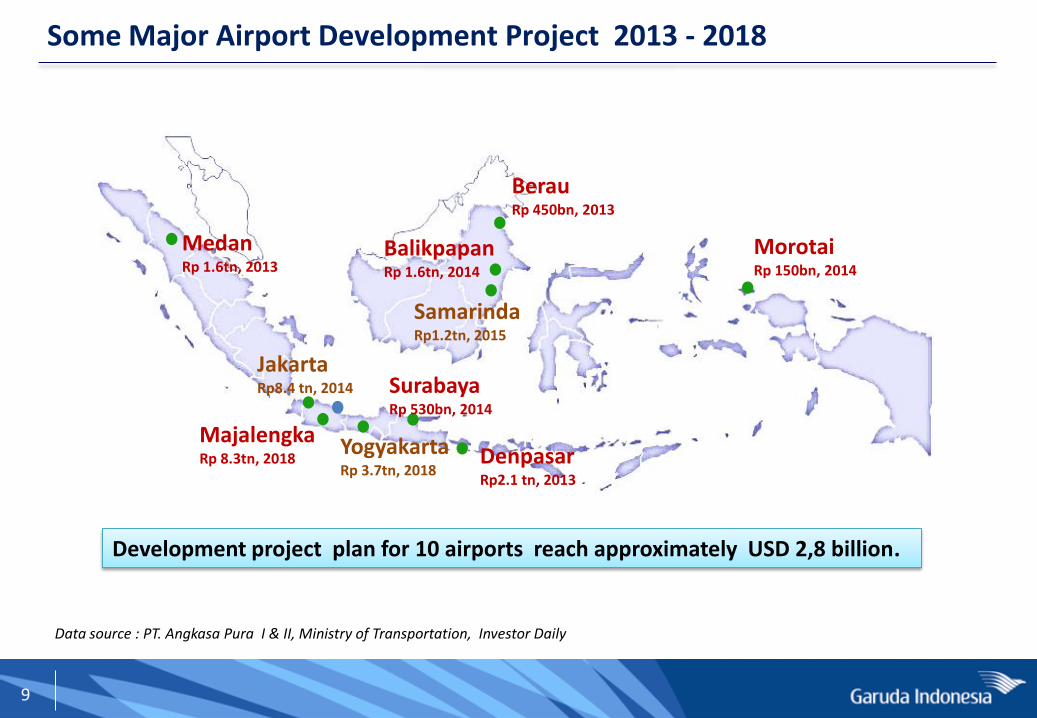
Some Major Airport Development Project 2013 - 2018
Morotai Rp 150bn, 2014
Medan Rp 1.6tn, 2013
Majalengka Rp 8.3tn, 2018
Yogyakarta Rp 3.7tn, 2018
Samarinda Rp1.2tn, 2015
Balikpapan Rp 1.6tn, 2014
Denpasar Rp2.1 tn, 2013
Jakarta Rp8.4 tn, 2014 Surabaya
Rp 530bn, 2014
Data source : PT. Angkasa Pura I & II, Ministry of Transportation, Investor Daily
Development project plan for 10 airports reach approximately USD 2,8 billion.
Berau Rp 450bn, 2013

10
• Government priority to develop and improved Airport and Aviation Infrastructures in Indonesia
• High competition in LCC domestic segment • High competition in FSC and LCC international
segment
• 2015: ASEAN Open Sky Policy
• Robust demand in domestic traffic • Growing international tourist traffic, by locals
and foreigners
• Strong Economic Growth • Large population • Low air travel penetration
In Summary : Indonesia has Large Market & Big Opportunity for Air Travel
Market
Traffic
Policy
Infrastructure
Competition

11
2. Company Overview
12
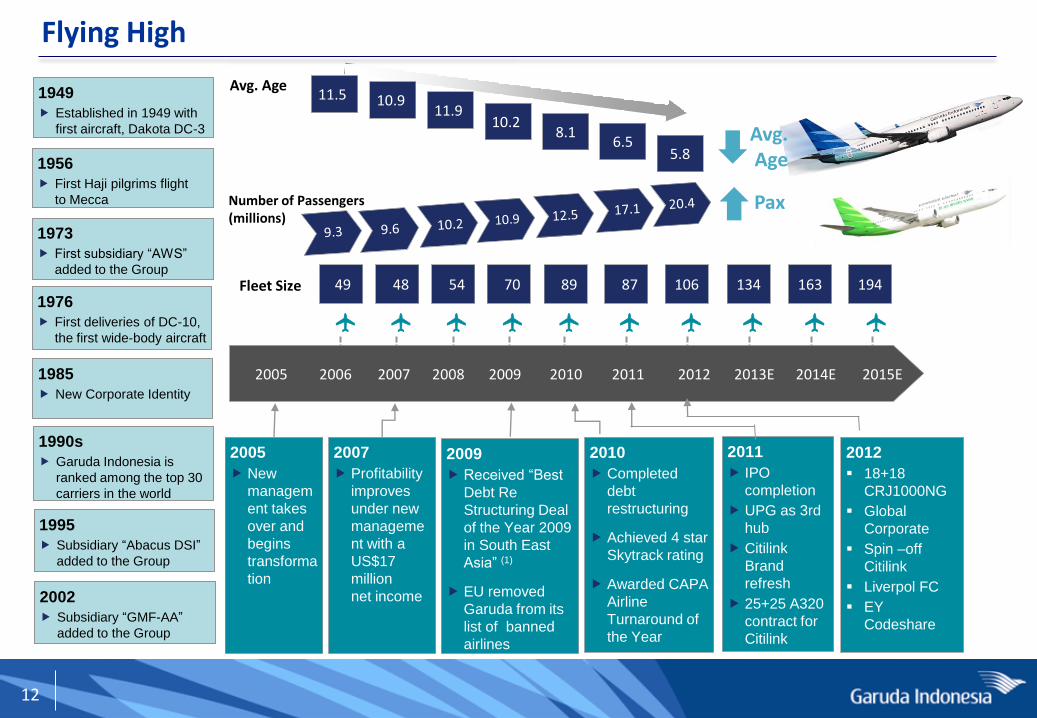
Flying High
Q
Q
Q
Q
Q
Q
Q
Q
Q
Q
2005 2006 2007 2008 2009 2010 2011 2012 2013E 2014E 2015E
1956
First Haji pilgrims flight
to Mecca
1976
First deliveries of DC-10,
the first wide-body aircraft
1973
First subsidiary “AWS”
added to the Group
1949
Established in 1949 with
first aircraft, Dakota DC-3
1990s
Garuda Indonesia is
ranked among the top 30
carriers in the world
2010
Completed
debt
restructuring
Achieved 4 star
Skytrack rating
Awarded CAPA
Airline
Turnaround of
the Year
2005
New
managem
ent takes
over and
begins
transforma
tion
2007
Profitability
improves
under new
manageme
nt with a
US$17
million
net income
2009
Received “Best
Debt Re
Structuring Deal
of the Year 2009
in South East
Asia” (1)
EU removed
Garuda from its
list of banned
airlines
Avg. Age
Fleet Size 49 48 54 70 89 134 163 87 194 106
Number of Passengers (millions)
2011
IPO
completion
UPG as 3rd
hub
Citilink
Brand
refresh
25+25 A320
contract for
Citilink
1985
New Corporate Identity
1995
Subsidiary “Abacus DSI”
added to the Group
2002
Subsidiary “GMF-AA”
added to the Group
11.5 10.9 11.9
10.2 8.1
6.5 5.8
2012
18+18
CRJ1000NG
Global
Corporate
Spin –off
Citilink
Liverpol FC
EY
Codeshare
Avg. Age
Pax

13
World Airline Awards – Global Airline Rankings
2013 Rank
Airline 2012 Rank
2011 Rank
1 Emirates 8 10
2 Qatar Airways* 1 1
3 Singapore Airlines* 3 2
4 ANA All Nippon Airways * 5 11
5 Asiana Airlines* 2 3
6 Cathay Pacific Airways* 4 4
7 Etihad Airways 6 6
8 Garuda Indonesia 11 19
9 Turkish Airlines 7 9
10 Qantas Airways 15 8
11 Lufthansa 14 15
12 EVA Air 13 16
13 Virgin Australia 12 32
14 Malaysia Airlines* 10 12
15 Thai Airways International 9 5
16 Swiss Int’l Air Lines 18 13
17 Korean Air 16 24
18 Air New Zealand 17 7
19 Hainan Airlines* 20 23
20 Air Canada 19 21
Since embarking on a transformation plan in 2005, GIAA has greatly improved its global and regional rankings and won several international accolades in recognition of its quality performance
* Airlines with 5-star skytrax rating
World’s Best Economy Class 2013
Best Economy Class Airline Seat 2013
GA quality has been perceived better from year to year
World Best Economy Class
2013 Rank
Airline 2012 Rank
1 Garuda Indonesia 4
2 Asiana Airlines* 3
3 Singapore Airlines* 1
4 Qatar Airways* 2
5 ANA All Nippon Airways * 5
6 Cathay Pacific Airways* 9
7 Turkish Airlines 7
8 Emirates n/a
9 Oman Air n/a
10 Qantas Airways n/a
34 Awards in 1H13: - DOM: 23 awards - INT’L: 11 awards
14
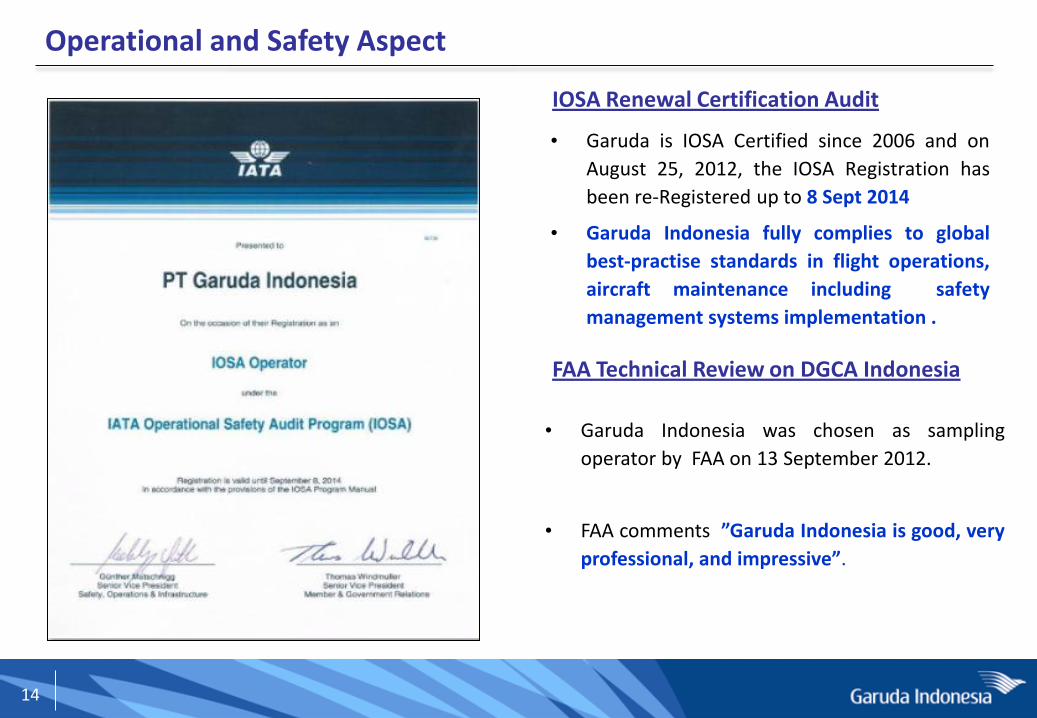
IOSA Renewal Certification Audit
• Garuda is IOSA Certified since 2006 and on
August 25, 2012, the IOSA Registration has
been re-Registered up to 8 Sept 2014
• Garuda Indonesia fully complies to global
best-practise standards in flight operations,
aircraft maintenance including safety
management systems implementation .
• Garuda Indonesia was chosen as sampling
operator by FAA on 13 September 2012.
• FAA comments ”Garuda Indonesia is good, very
professional, and impressive”.
FAA Technical Review on DGCA Indonesia
Operational and Safety Aspect

15
Domestic
Grow and dominate
full-service
International
Enormous upside
potential
2
Fleet
Expand, simplify and
rejuvenate Fleet
4
Brand
Stronger brand, better
product and services
5
LCC
Citilink to address the
LCC Opportunity
3 Human Capital
Right quality and
right quantity
7
Cost Discipline
Efficient in cost structure compared to
peers
6
Quantum Leap – 7 Strategies to Drive Growth
Management focuses on implementing the “Quantum Leap” with 7 main strategies to expand and dominate the Indonesian aviation market.
1

16
2005 Growth 2012 Growth 2015
Number of Aircraft 57 86% 106 83% 194
Average age (yr) 11.2 -48% 5.8 -14% 5
ASK/employee (000) 3,761 40% 5,250 56% 8,210
Passenger Carried 9.3 mio 119% 20.4 mio 123% 45.4 mio
Frequency/week 765 213% 2,400 242% 8,198
Skytrax Rating 3 star + 4 star + 5 star
Aiming to complete the 2nd journey in 2015
5 star skytrax airlines : 1. Asiana Airlines 2. Cathay Pacific Airways 3. Hainan Airlines 4. Qatar Airways 5. Singapore Airlines 6. Malaysia Airlines 7. All Nippon Airways
"The key factor behind 5-Star status is an airline's ability to deliver a truly consistent and high quality of Product and Service. A great product standard is not by itself the key to a 5-Star Airline ranking, and Skytrax focus deeply on the Quality of front-line service an airline provides. A 5-Star Airline ranking is centred on identifying airlines whose front-line staff (across the airport and onboard experience) deliver a true and consistent 5-Star standard of service delivery." Sources: skytrax website http://www.airlinequality.com/StarRanking/5star.htm
17
3. Recent Development

18
Garuda Indonesia Group 2012
IT Services
Aero
Systems
Hospitality
and Tourism
Aerowisata
Global
Distribution
Systems
Abacus
Ground
Handling
Gapura
Angkasa
MRO
Services
GMF
AeroAsia
Key Subsidiaries & Associated Companies
Cargo
Domestic Feeder
Hajj / Charter
International
Low Cost
Carries
Citilink
Indonesia
83%
8%
9%
Ops Revenue Contribution 2012
Scheduled Airlines Non-scheduled Airlines Others

19
5.31 5.34
1.7 1.9
Jan-Jun 2012 Jan-Jun 2013 Others GA Int'l
16.1 16.5
0.7 1.9 6.4
7.2
Jan-Jun 2012 Jan-Jun 2013 Others Citilink GA Dom
1.8 2.1
2.4 2.4 2.5 3.0 3.2 3.3 3.1 3.3 3.5 3.5 3.4 3.8 22%
24%
26% 25%
26%
29% 29% 29%
28% 28% 28% 29% 28.6% 27%
1Q10 2Q10 3Q10 4Q10 1Q11 2Q11 3Q11 4Q11 1Q12 2Q12 3Q12 4Q12 1Q13 2Q13
Total GA Passengers (in million) Market Share
0.5
0.6 0.7 0.6 0.7 0.8 0.8 0.8 0.8 0.9 0.9 0.9 0.9 0.95 18%
20% 20% 21%
22% 23% 23% 24% 24%
25% 24% 24%
26% 25.5%
1Q10 2Q10 3Q10 4Q10 1Q11 2Q11 3Q11 4Q11 1Q12 2Q12 3Q12 4Q12 1Q13 2Q13
Total GA Passengers (in million) Market Share
Competition on routes which GA flies – per Jun 2013
Source: Airport Authority & GA (traffic in/out CGK, DPS, SUB, UPG airports)
Garuda Domestic Passengers in/out Selected Airports Garuda International Passengers in/out Selected Airports
GA International Market Share 1H13: 25.7% incr. 1.6 ppts GA Domestic Market Share 1H13: 28.0% incr. 0.3 ppts
Traffic in million passenger Traffic in million passenger 7.2 7.0
0.5%
8.1%
2.3% 25.5 23.2
2.7%
11.1%
9.9%
162.3%
20
1271% 82%
-27% -65% -74%
-80%
-30%
20%
70%
120%
170%
10.87 9.47
2.91 1.62
-27.33
-30
-25
-20
-15
-10
-5
0
5
10
15
5%
2% 2%
-3% -3.7%
-4%
-3%
-2%
-1%
0%
1%
2%
3%
4%
5%
6%
12.1%
7.4%
2.5% 1.3%
-3.6%
-4%
-2%
0%
2%
4%
6%
8%
10%
12%
14%
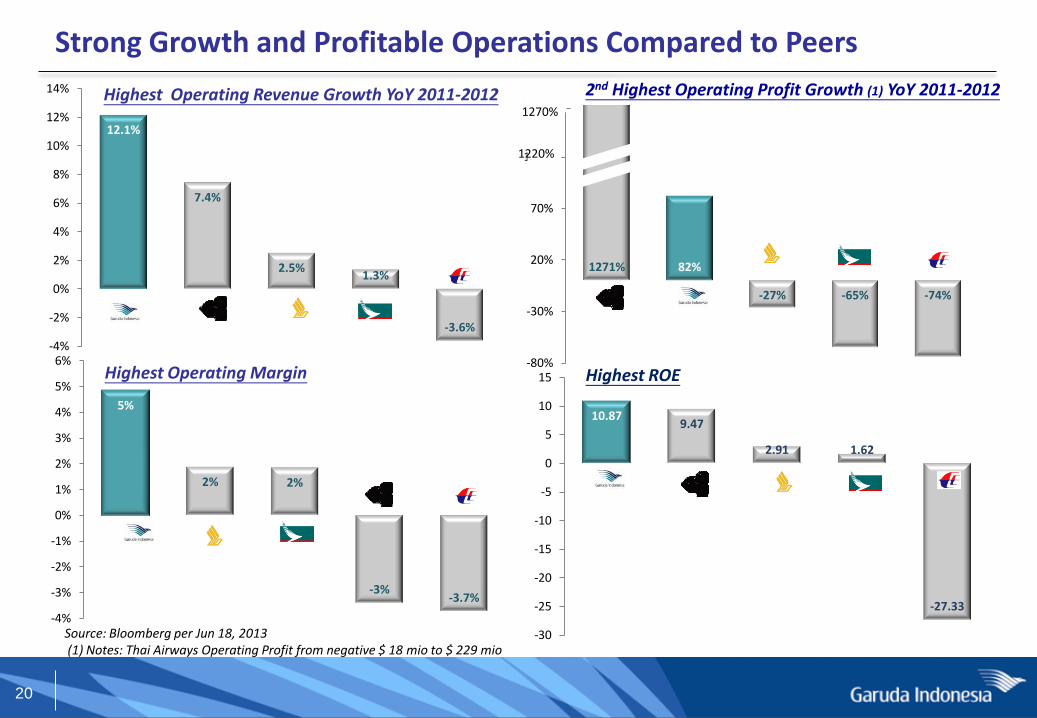
Strong Growth and Profitable Operations Compared to Peers
Source: Bloomberg per Jun 18, 2013 (1) Notes: Thai Airways Operating Profit from negative $ 18 mio to $ 229 mio
Highest Operating Revenue Growth YoY 2011-2012 2nd Highest Operating Profit Growth (1) YoY 2011-2012
Highest Operating Margin Highest ROE
12 1270%
12 1220%

21
Milestones 1H - 2013
• New Boards Members were appointed by the AGM
• Signing Agreement ALAFCO & Garuda Indonesia for Financing of 2 aircraft B777-300ER with Sharia principles
APR
• Garuda Indonesia named “The World’s Best Economy Class” by Skytrax at Paris Airshow
• Fully repaid the US$ 55 million syndicated – commercial loan from Citi Club Deal
• Welcome the 1st Delivery of Boeing 777-300ER aircraft
JUN
• New Destinations: Tanjung Pandan (Belitung) & Bengkulu
• Introduced Immigration On Board on the Shanghai – Jakarta service MAY
• Broaden flight network to 6 New destinations in Europe & Middle East (Frankfurt, Brussel, Milan, Dusseldorf, Munich, Bahrain) that served by Etihad Airways
• Extended “Immigration on Board” Agreement JAN
• “2012 Domestic Airlines of The Year” from Ray Morgan Research, Australia
• “ASEAN Premium Airline of The Year” from Frost & Sullilvan, USA MAR
•Garuda Indonesia and General Electric (NYSE:GE) launched the CFM56-7B engine shop capability for the Garuda Maintenance Facility (GMF AeroAsia) FEB

22
Introduced New Service Concepts 2 July 2013
Fly Liverpool FC for the LFC Tour 2013 17 July 2013
Moved from Polonia Airport to Kuala Namu International Airport - Medan
25 July 2013
Welcome the 2nd delivery of B777-300ER 31 July 2013
Recent Developments
Operation
Funding
IDR Bond: Listing in Indonesia Stock Exchange 8 July 2013
Garuda’s New Destinations: • Cengkareng – Bengkulu • Cengkareng – Tanjung Pandan • Medan – Penang • Cengkareng – Tanjung Pinang • Balikpapan – Berau
15 May 2013 15 May 2013 1 June 2013 3 Aug 2013 1 Aug 2013
88 Extra Flights during Eid-ul Fitr 5-16 Aug 2013
Network

23
4. 1H-2013 Performance

24
Indicator 1H13 Achievement D% YoY
11.9 million 23.4
172,262 tons 30.4
75.3 % 0.5 *
US$c 9.1 (3.5)
USD 1,725.4 million 14.1
USD 1,448.2 million 13.7
USD 14.3 million (0.6)
-USD 10.7 million n/a
1H-2013 Highlights
• Operating Indicator figures are for Garuda Indonesia and Citilink • Financial Indicator figures are for Garuda Indonesia Group • * in percentage points
Passenger Carried
Cargo Uplifted
Passenger Yield
Operating Revenue
Passenger Revenue
Operating Income
Income for the Period
Seat Load Factor
DOMESTIC
• Continued growth in traffic & capacity • Impacted by weakening IDR/USD
INTERNATIONAL
• Improved operational performance • Welcoming First B777-300ER
CITILINK
• Improved operational performance • Improved domestic market share • At an early stage of Investment
FINANCIAL
• Fully Repaid USD 55 million Citi Club Deal-1
25
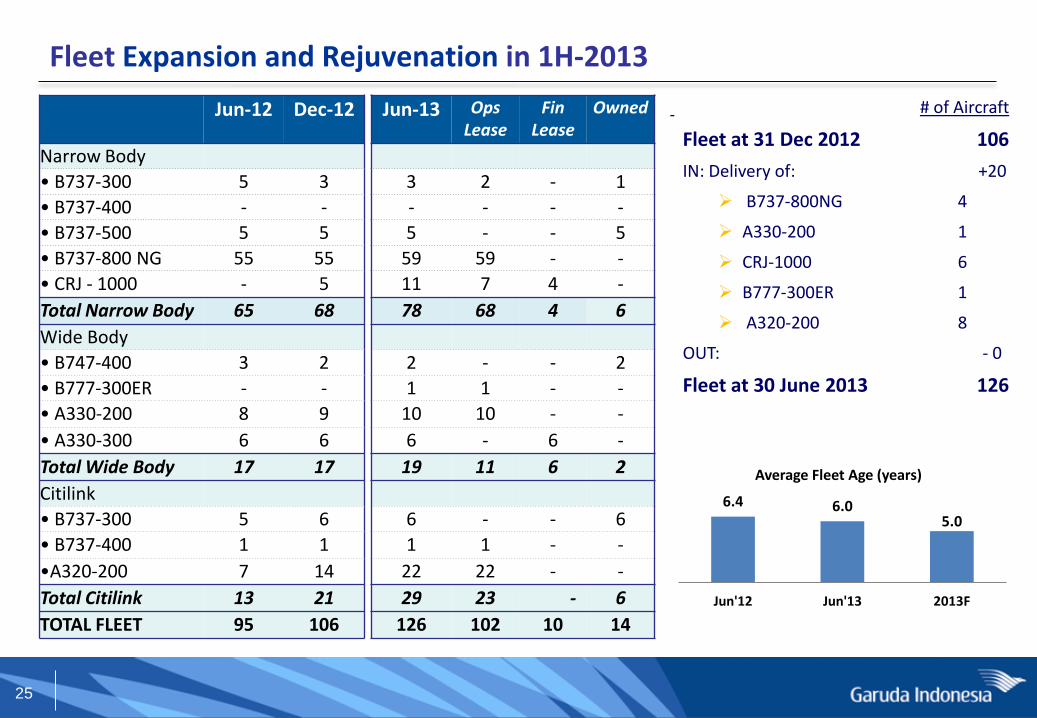
Fleet Expansion and Rejuvenation in 1H-2013
# of Aircraft
Fleet at 31 Dec 2012 106
IN: Delivery of: +20
B737-800NG 4
A330-200 1
CRJ-1000 6
B777-300ER 1
A320-200 8
OUT: - 0
Fleet at 30 June 2013 126
6.4 6.0 5.0
Jun'12 Jun'13 2013F
Average Fleet Age (years)
Jun-12 Dec-12 Jun-13 Ops Lease
Fin Lease
Owned
Narrow Body
• B737-300 5 3 3 2 - 1
• B737-400 - - - - - -
• B737-500 5 5 5 - - 5
• B737-800 NG 55 55 59 59 - -
• CRJ - 1000 - 5 11 7 4 -
Total Narrow Body 65 68 78 68 4 6
Wide Body
• B747-400 3 2 2 - - 2
• B777-300ER - - 1 1 - -
• A330-200 8 9 10 10 - -
• A330-300 6 6 6 - 6 -
Total Wide Body 17 17 19 11 6 2
Citilink
• B737-300 5 6 6 - - 6
• B737-400 1 1 1 1 - -
•A320-200 7 14 22 22 - -
Total Citilink 13 21 29 23 - 6
TOTAL FLEET 95 106 126 102 10 14

26
1H12 1H13 ∆ % YoY
Aircraft Utilization (Hours) 10:47 11:00 0:13
Frequencies 72,693 93,198 28.2
On Time Performance (%) 85.3 86.9 1.6 *
ASK (’000) 17,775,764 20,881,690 17.5
Average Fuel Price (USD/L) 0.92 0.88 (4.3)
Fuel Burn / ATK 0.251 0.250 (0.2)
Fuel Burn / Blockhours 4,053 3,481 (14.1)
Passenger Carried 9,617,568 11,869,439 23.4
RPK (‘000) 13,291,314 15,721,097 18.3
Seat Load Factor (%) 74.8 75.3 0.5 *
Passenger Yield (US¢) 9.4 9.1 (3.5)
Cargo/Mail Uplifted (Ton) 132,062 172,262 30.4
CASK (US¢) 7.9 7.5 (4.4)
CASK-excl Fuel (US¢) 4.6 4.4 (4.2)
Operating Indicators - Group
Notes: All figures include GA & Citilink, except aircraft Utilization and OTP are for GA Main Brand only * in percentage points
Operational
Passenger & Cargo
Financial
Efficiency
27
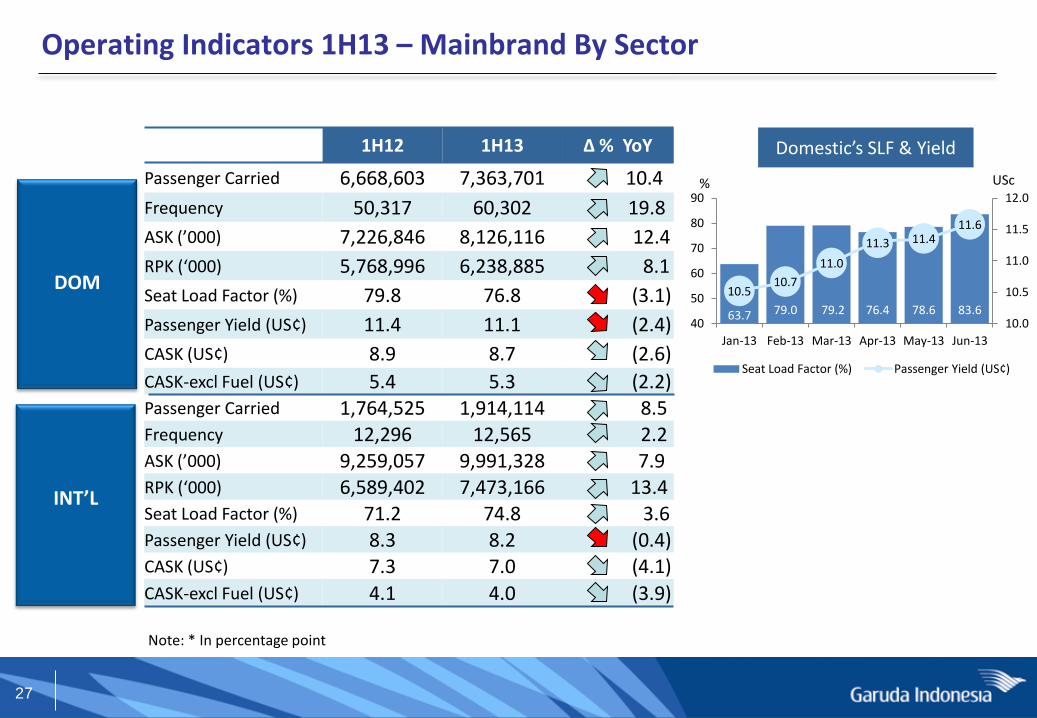
1H12 1H13 ∆ % YoY
Passenger Carried 6,668,603 7,363,701 10.4
Frequency 50,317 60,302 19.8
ASK (’000) 7,226,846 8,126,116 12.4
RPK (‘000) 5,768,996 6,238,885 8.1
Seat Load Factor (%) 79.8 76.8 (3.1)
Passenger Yield (US¢) 11.4 11.1 (2.4)
CASK (US¢) 8.9 8.7 (2.6)
CASK-excl Fuel (US¢) 5.4 5.3 (2.2) Passenger Carried 1,764,525 1,914,114 8.5 Frequency 12,296 12,565 2.2 ASK (’000) 9,259,057 9,991,328 7.9 RPK (‘000) 6,589,402 7,473,166 13.4 Seat Load Factor (%) 71.2 74.8 3.6 Passenger Yield (US¢) 8.3 8.2 (0.4) CASK (US¢) 7.3 7.0 (4.1) CASK-excl Fuel (US¢) 4.1 4.0 (3.9)
Operating Indicators 1H13 – Mainbrand By Sector
DOM
INT’L
Note: * In percentage point
Domestic’s SLF & Yield
63.7 79.0 79.2 76.4 78.6 83.6
10.5 10.7
11.0
11.3 11.4 11.6
10.0
10.5
11.0
11.5
12.0
40
50
60
70
80
90
Jan-13 Feb-13 Mar-13 Apr-13 May-13 Jun-13
Seat Load Factor (%) Passenger Yield (US¢)
% USc
28
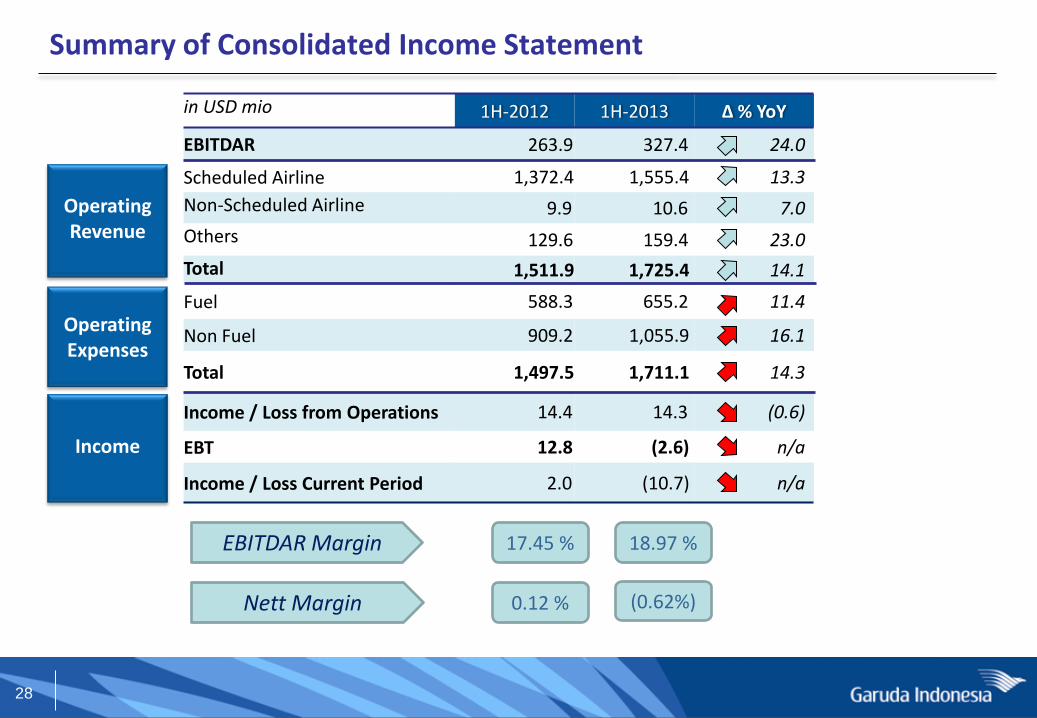
in USD mio 1H-2012 1H-2013 ∆ % YoY
EBITDAR 263.9 327.4 24.0
Scheduled Airline 1,372.4 1,555.4 13.3
Non-Scheduled Airline 9.9 10.6 7.0
Others 129.6 159.4 23.0
Total 1,511.9 1,725.4 14.1
Fuel 588.3 655.2 11.4
Non Fuel 909.2 1,055.9 16.1
Total 1,497.5 1,711.1 14.3
Income / Loss from Operations 14.4 14.3 (0.6)
EBT 12.8 (2.6) n/a
Income / Loss Current Period 2.0 (10.7) n/a
Summary of Consolidated Income Statement
Operating Revenue
Operating Expenses
Income
EBITDAR Margin
Nett Margin
17.45 % 18.97 %
0.12 % (0.62%)

29
in USD mio 1H-2012 1H-2013 ∆ % YoY
Scheduled Airline 1,372.7 1,430.3 4.2
Non-Scheduled Airline 9.9 10.6 7.0
Others 40.3 34.3 (14.8)
Total 1,423.0 1,475.2 3.7
Fuel 545.4 576.4 5.7
Non Fuel 872.3 855.2 (2.0)
Total 1,417.7 1,431.6 1.0
Income / Loss from Operations 5.2 43.6 736.0
EBT 3.2 28.4 778.4
Income / Loss Current Period (4.9) 20.9 525.2
Summary of Income Statement – Parent Company only
Operating Revenue
Operating Expenses
Income

30
in USD mio 31 Dec 2012 30 Jun 2013 ∆ %
Current Assets 636.6 655.4 3.0
Non-Current Assets 1,881.4 2,139.4 13.7
Total Assets 2,518.0 2,794.8 11.0
Current Liabilities 754.2 916.4 21.5
Non-Current Liabilities 648.8 774.1 19.3
Total Liabilities 1,403.0 1,690.5 20.5
Total Equities 1,115.0 1,104.3 (1.0)
Total Liabilities & Equities 2,518.0 2,794.8 11.0
Summary of Consolidated Balance Sheet
Asset
Liabilities
Equities
Lease Adjusted Net Debt/EBITDAR
Debt/Equity
4.7 x
0.7 x
4.4 x
0.6 x

31
in USD mio 30 Jun 2012 30 Jun 2013 ∆ % YoY
Beginning Cash/Cash Equivalents 417.3 325.8 (21.9)
•Operating Activities 122.6 111.6 (9.0)
•Investing Activities (242.2) (314.2) 29.7
•Financing Activities (36.9) 166.5 551.6
Net Increase (Decrease) in Cash/Cash Equivalents (156.4) (36.0) 77.0
Effect of Foreign Exchange Rate Changes (9.7) (5.9) 39.5
Ending Cash/Cash Equivalents 251.1 283.9 13.0
Summary of Consolidated Cash Flow
Operating Activities
Increased on interest & financial charges paid and income taxes paid
Investing Activities
USD 349.7 million was the payment for PDP & Maintenance Reserve Fund
USD 27.4 million was the payment for Security Deposit
USD 118.2 million was the refund of PDP and Maintenance Reserve Fund
Financing Activities
New Loan: $ 321.8 million Payment of long-term Loan & Bank
Loan: $ 153.3 million
32
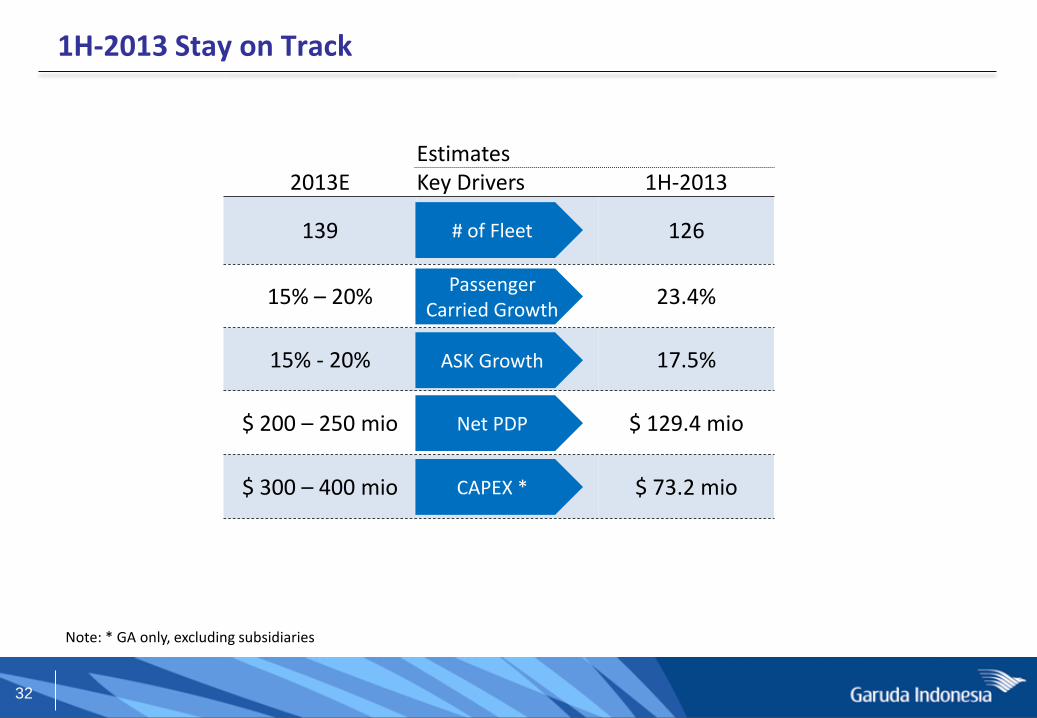
1H-2013 Stay on Track
Estimates 2013E Key Drivers 1H-2013
139 126
15% – 20% 23.4%
15% - 20% 17.5%
$ 200 – 250 mio $ 129.4 mio
$ 300 – 400 mio $ 73.2 mio
# of Fleet
Passenger Carried Growth
ASK Growth
CAPEX *
Net PDP
Note: * GA only, excluding subsidiaries
33
PT Garuda Indonesia (Persero) Tbk. Investor Relations Department 2nd Floor Management Building Garuda City Soekarno Hatta International Airport Phone : 62-21-2560 1201 Email : [email protected]
THANK YOU