analyst meeting pt garuda indonesia (persero) tbk · 1 analyst meeting pt garuda indonesia...
TRANSCRIPT

1
ANALYST MEETING PT GARUDA INDONESIA (PERSERO) Tbk.
9M2015 Result AnnouncementJakarta, 23 October 2015

2
1. Company Profile 3 – 8
2. Operational Performance 9 – 13
3. Financial Performance 14 – 20
4. Subsidiaries 21 – 23
Agenda Hal
Picture’s source: www.google.com

List of Shareholders as of 30 Sept 2015GIAA & JCI
Notes
Av. liquidity (IDR/day)
9M-2014
1.8 bio
9M-2015
4.2 bio
Av. close price (IDR) 453 482
Av. volume (shares/day) 3.9 mio 8.6 mio
Market cap (IDR) 10.7 trillion 7.9 trillionReal free float 15% - excluding Government of Indonesia and Trans Airways ownerships.
Share Performance
GIAA (RHS) JCI (LHS)
3
Number of Shares %
Domestic
Government of Indonesia 15,653,128,000 60.5
Retail 857,530,739 3.3
Employee 78,724,370 0.3
Institutional (Trans Airways) 6,370,697,372 24.6
Other institutional (less than 5%) 1,686,581,134 6.5
Total domestic 24,646,661,615 95.3
International
Retail 3,856,770 0.0
Institutional (less than 5%) 1,218,408,248 4.7
Total international 1,222,265,018 4.7
TOTAL 25,868,926,633 100.0
Percentage of Shares based on Real Free Float
Domestic 68.2%
International 31.8%
4
Picture’s source: www.google.com
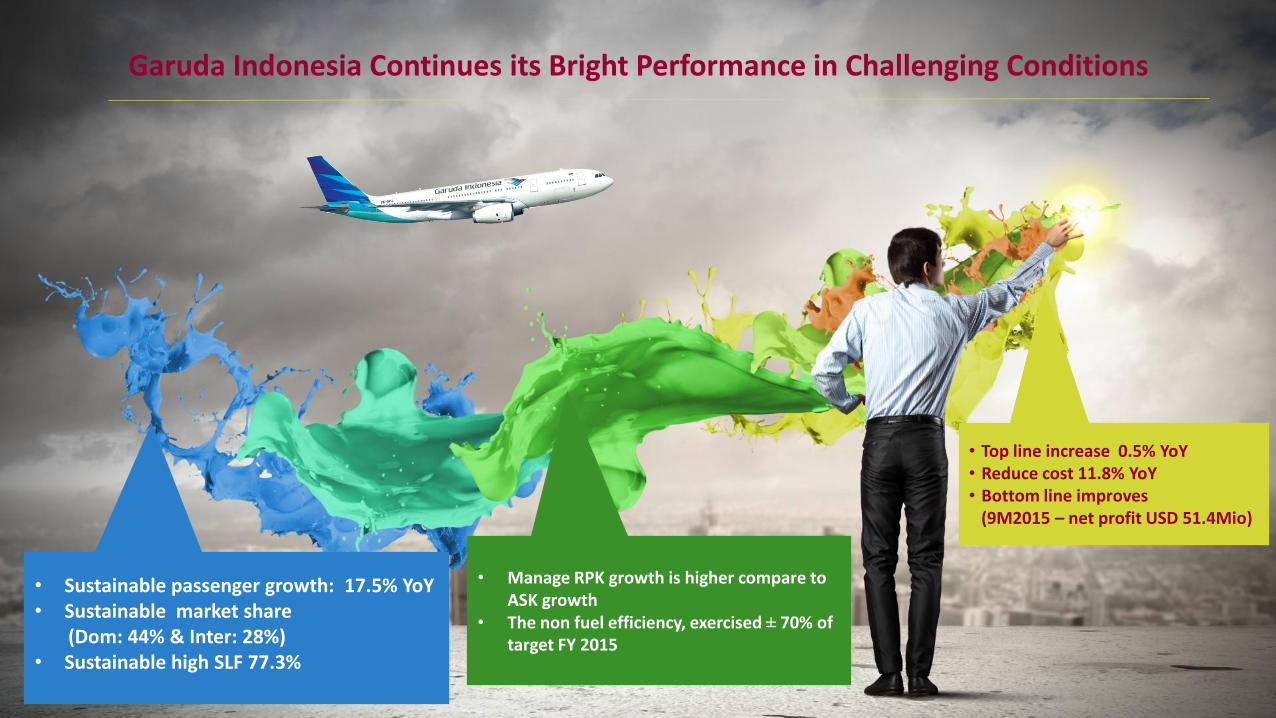
Garuda Indonesia Continues its Bright Performance in Challenging Conditions
• Sustainable passenger growth: 17.5% YoY• Sustainable market share
(Dom: 44% & Inter: 28%) • Sustainable high SLF 77.3%
• Manage RPK growth is higher compare to ASK growth
• The non fuel efficiency, exercised ± 70% of target FY 2015
• Top line increase 0.5% YoY• Reduce cost 11.8% YoY• Bottom line improves
(9M2015 – net profit USD 51.4Mio)

5
Awards
• Service: 17 awards• Commercial: 9 awards• Business: 7 awards• Corporate Transformation: 5 awards• Human Capital: 4 awards• People Management: 2 awards• GCG: 2 Awards
46 awards 2015:Domestic: 34 awards
International: 12 awards
• SKYTRAX Awards 2015 “The World’s Best Cabin Crew”• SKYTRAX Awards 2015 “World’s Best Airline” 8th Rank• FinanceAsia Awards 2015 “Asia’s Best Companies 2015”• Schipol Aviation Awards “Passenger Airline of the Year Award 2014-Intercontinental”• Indonesia Human Capital Award 2015 “1st in Human Resources Technology”• Indonesia Good Corporate Governance Award 2015 “Score A (Excellent)”• Pacific Asia Travel Association (PATA) “Gold Awards 2015 for Inflight Magazine”
Picture’s source: www.google.com

Milestones
6
First Quarter 2015• Garuda Indonesia implemented hedging cooperation through Cross Currency Swap (CCS) transactions with banks.
The first and the biggest CCS transaction, exercised by SOE in Indonesia.• Garuda Indonesia, BII-Maybank, and NBAD/DIB carried signing of bridging loan facility with the principles of Sharia
facility of $ 500 million.
Second Quarter 2015• Garuda Indonesia launched the "New Mobile Apps“• Garuda Indonesia and Cardig Air signed a cooperation of air cargo management and business development• Garuda Indonesia exercised “Reprofiling Debt” of “Quick Wins” strategy by issuing sukuk amounted $500 mio with
4 times booking order.
Third Quarter 2015• Garuda Indonesia ends the Hajj Flights 2015 with 92.38% On-Time Performance Rates.• The Inaugurations of Garuda Maintenance Facilities AeroAsia (GMF-AA) 4th Hangar • President & CEO of Garuda Indonesia appointed as President of Indonesia Marketing Association (IMA) for the
period 2015-2017
Picture’s source: www.google.com

7
Garuda Indonesia Group Market Share – YTD August 2015
2014 2015
15%17%
44%37%
41%46%
Others
GA Group
Lion Group
Garuda domestic market share group (including Citilink)These market share were calculated based on all Garuda Indonesia’s routesSource: Company Data
Domestic Market Share
2014 2015
72%78%
28%22%
Others
GA Main Brand
International Market Share
Garuda main brand international market shareThese market share were calculated based on all Garuda Indonesia’s routesSource: Company Data
Picture’s source: www.google.com

Note: YTD September 2015Sumber: Airline Website and Asia Pacific Data for August 2015
Passenger carried growth (%) 2014-2015
ASK growth (%) 2014 vs 2015 RPK growth (%) 2014 vs 2015
Asia Pacific
Passenger carried of AAPA – 2015Passenger Carried Growth
Asia Pasific
Asia Pacific
8
6.4
11.4 10.9
5.5
0.6
8.9
-
5.0
10.0
15.0
20.0
25.0
SouthEast
South NorthEast
Oceania Central AsiaPacific
17.5
13.1 10.6
8.5
1.7 1.1
8.9
-
5.00
10.00
15.00
20.00
25.00
16.5 14.8
8.8 7.3 6.1
(0.9)
8.3
-5.00
0.00
5.00
10.00
15.00
20.0014.5
6.0 3.7 5.0
(0.2) (0.9)
6.4
-5.00
0.00
5.00
10.00
15.00
20.00
25.00
Peers Comparison – Operational Performance YTD 9M2015

9
Operational Performance

Number of Fleets
5.85.0 4.5 4.7 4.3
2012 2013 2014 Sep-15 2015E
Average Age (year)
10
14-Dec Sep 15 Ops.lease Fin lease/
15-Decowned
Narrow body
• B737-500 4 1 - 1 -
• B737-800 NG 75 79 79 - 81
• CRJ - 1000 15 15 9 6 18
• ATR 72-600 8 10 10 - 11
Total narrow body 102 105 98 7 110
Wide Body
• B747-400 2 2 - 2 2
• B777-300 ER 6 8 8 - 9
• A330-200 11 10 10 - 9
• A330-300 11 12 6 6 13
Total wide body 30 32 24 8 33
Garuda main brand 132 137 122 15 143
Citilink
• B737-300 5 5 - 5 5
• B737-500 - 3 - 3 3
•A320-200 32 36 36 - 36
Total Citilink 37 44 36 8 44
Total fleets 169 181 158 23 187
Fleets per Dec 2014 169
In
* B737-800NG 5
* ATR 72-600 2
* B777-300 ER 2
* A320-200 4
* A330-300 1
Total 14
Out
* A330-200 1
* B737-800 1
Total 2
Fleets per Sept 2015 181

11
Operational Performance Garuda Group
Operational
Efficiency
Passenger & Cargo
Financial
9M-2014 9M-2015 ∆ %
Aircraft Utilization (Hours) 9:53 9:11 -0:42
Frequencies 165,642 186,105 12.4
On Time Performance - OTP (%) 89.6 88.2 (1.4)
ASK ('000) 36,902,810 38,748,407 5.0
Average Fuel Price (USD/L) 0.9 0.5 (37.9)
Fuel Burn/Blockhours 3,699 3,590 (2.9)
Passenger Carried 20,893,654 24,551,594 17.5
RPK ('000) 26,086,291 29,951,212 14.8
Seat Load Factor (%) 70.7 77.3 6.6
Passenger Yield (USc) 8.6 7.5 (13.7)
Cargo/Mail Uplifted (Ton) 292,888 257,304 (12.1)
CASK (Usc) 7.6 6.4 (15.3)
CASK-excl Fuel (Usc) 4.5 4.5 0.0
• The passenger yield decreased 13.7% due to IDR depreciation ±12.1% and lower international fares amidst unstable economic.
Yield decreased
• The utilization was going down to be 9:11 hours due to route restructuring of Quick Wins program, especially in international market.
Utilization decreased
• OTP decrease due to Mount Raung eruption and fire incident in SHIA Terminal 2
• Cargo capacity decrease due to the increase of passenger carried as Garuda Cargo is ‘belly cargo’ on Garuda Group.
Others

Operational Performance Domestic & International
Domestic
International
12
9M-2014 9M-2015 ∆ %
Passenger Carried 12,666,172 14,508,965 14.5
Frequency 106,581 118,607 11.3
ASK ('000) 14,779,378 16,448,716 11.3
RPK ('000) 10,915,976 12,675,797 16.1
Seat Load Factor (%) 73.9 77.1 3.20
Passenger Yield (Usc) 10.1 8.6 (14.5)
CASK (Usc) 8.6 7.1 (17.1)
CASK-excl Fuel (Usc) 5.3 5.0 (4.4)
Passenger Carried 2,897,051 3,176,986 9.7
Frequency 21,549 20,835 (3.3)
ASK ('000) 16,963,144 15,742,812 (7.2)
RPK ('000) 11,101,472 11,953,539 7.7
Seat Load Factor (%) 65.4 75.9 10.49
Passenger Yield (Usc) 8.0 6.9 (13.6)
CASK (Usc) 7.3 6.3 (13.6)
CASK-excl Fuel (Usc) 4.4 4.5 3.0
Garuda Indonesia main brand has 58 domestic destinations
17 international destinations
Picture’s source: www.google.com

Operational Performance Main Brand & Citilink
Main Brand
Citilink
13
9M-2014 9M-2015 ∆ %
Passenger Carried 15,563,223 17,685,951 13.6
Frequency 128,130 139,442 8.8
ASK ('000) 31,742,521 32,191,527 1.4
RPK ('000) 22,017,448 24,629,336 11.9
Seat Load Factor (%) 69.4 76.5 7.15
Passenger Yield (Usc) 9.1 7.8 (13.7)
CASK (Usc) 7.9 6.7 (14.9)
CASK-excl Fuel (Usc) 4.8 4.8 (0.2)
Passenger Carried 5,330,431 6,865,643 28.8
Frequency 37,512 46,663 24.4
ASK ('000) 5,160,289 6,556,880 27.1
RPK ('000) 4,068,844 5,321,876 30.8
Seat Load Factor (%) 78.9 81.2 2.31
Passenger Yield (Usc) 6.5 5.8 (10.7)
CASK (Usc) 5.7 5.0 (13.4)
CASK-excl Fuel (Usc) 2.9 3.2 11.2

14
Financial Performance

Summary of Consolidated Income Statement
Garuda GroupTop Line (USD, Bio)
Operating Revenue
Operating Expenses
Income
EBITDAR Margin 14.4% 32.3%
Garuda GroupNet Income (USD, Mio)
15
In USD Mio 9M14 9M15 ∆ % YoY
EBITDAR 406.3 918.4 126.0
Total revenues 2,831.3 2,845.7 0.5
Fuel 1,175.7 806.5 (31.4)
Aircraft rental and charter 530.1 659.9 24.5
Others 1,374.8 1,251.3 (9.0)
Total expenses 3,080.6 2,717.6 (11.8)
EBIT (249.3) 128.1 151.4
EBT (298.3) 81.3 127.3
Net income (220.1) 51.4 123.4
0.9 0.9
1.0
Q1 Q2 Q3
12.4 16.9
22.1
Q1 Q2 Q3

Operating Revenue
2,831.3
2,845.7
(2.4%)
2.4%0.5%
9M14 9M15
Schedule airline
Non Schedule Airline
Others
Operating Revenue Operating Revenue
• Lower yield due to IDR depreciation and unstable economic condition in regional
• Losing revenue potency due to challenging conditions such mount eruption, SHIA fire incident, and hazardous haze in indonesia surroundings
Scheduled airline decrease
• Sustainable increase of charter revenue to China market and Umrah (Middle East).
• Additional revenue from Hajj season
Non schedule airline increase
• Others revenue increased due to green performance of subsidiaries.
Others increase
In USD mio% Change
*PoT : Percentage of total
16
Operating Revenue *PoT
Schedule airline 84.60%
Non schedule airline 6.20%
Others 9.20%

Operating Expenses
2,717.6
3,080.6
(12.0%)
4.7% (1.6%)(0.3%)
(2.6%)
9M14 9M15Operating Expenses Operating Expenses
Fuel Fligh Ops + Maintenance +
User charge
Tickets + Passenger
Service
G&AOthers
In USD mio% change
*PoT : Percentage of total
• Fuel expenses decreased 31.4% to be USD 806.5miocompared to same period last year of USD 1.2bio due to fuel price declining 37.9% compare last year.
• Total operating expenses decreased 11.8% to be USD 2.7 bio compared to the same period last year USD 3.1bio.
• Fuel efficiency YTD 9M15 USD 369.3mio as impact of fuel price declining and fuel efficiency program
• Non fuel efficiency YTD 9M15 USD ±115.3mio
Decreasing expenses
• The rental cost increased 24.5% to be USD 659.9mio compared to the same period last year of USD 530.1 mio in line with the additional fleets.
• The maintenance cost increased by 9.5% to be USD 210.2mio compared to the same period last yearUSD 192.0mio in line with the additional fleets.
Increasing expenses
17
Operating Expenses PoT*
Fuel 28.97%
Flight ops + Rental + Maintenance + User charge 47.96%
Ticketing + Passenger Service 15.62%
G & A 5.89%
Others 1.55%

Summary of Consolidated Balance Sheet
Asset
Liability
Equity
Lease Adj. Net Debt/EBITDAR 10.1x 7.5x
18
FY14 9M15 ∆ % YoY
Current assets 810.5 843.5 4.1
Non current assets 2,302.6 2,238.5 (2.8)
Total Assets 3,113.1 3,082.0 (1.0)
Current liabilities 1,219.4 1,103.7 (9.5)
Non current liabilities 1,014.2 1,107.2 9.2
Total liabilities 2,233.6 2,210.9 (1.0)
Total equities 879.5 871.1 (0.9)
Total liabilities & Equities 3,113.1 3,082.0 (1.0)

Summary of Consolidated Cash Flow
Operating
Cash receipts from customers USD 2.8bio
Cash payments to suppliers USD 2.4bio
Payments of interest and financial expenses USD 45.2mio
Investing
Payments PDP & Maintenance Reserve Fund: USD 303.4mio
Security Deposit payment: USD 11.1mio Refund of PDP and Maintenance Reserve
Fund: USD 216.2mio Receipts of security Deposit : USD 9.0mio
Financing
Proceed of long term loan, bank loan, & financial institution and sukuk USD 1,4bio
Payment of long term loan, bank loan & financial institution: USD 1.3bio
19
Min 5% of Cash Ratio
Picture’s source: www.google.com
9M14 9M15 ∆ % YoY
Beginning cash 480.4 434.3 (9.6)
Cash from operating activities (180.9) 56.0 130.9
Cash from investing activities (189.6) (104.1) (45.1)
Cash from financing activities 271.2 44.8 (83.5)
Net increase (decrease) in cash (99.3) (3.1) n.a.
Ending cash 396.6 409.5 3.2

Cash and Net Gearing
20
464.9 464.0 409.5 1,313.2 1,305.8 1,212.7 856.6 864.4 853.4
0.99
0.97
0.94
0.90
0.92
0.94
0.96
0.98
1.00
1.02
1.04
1.06
0.0
200.0
400.0
600.0
800.0
1,000.0
1,200.0
1,400.0
3M15 6M15 9M15
Cash Debt Equity Net Gearing
In USD Mio
31%
60%
9%
Debt Structure 9M2015
Shor term loan Long term loan Lease
Max 2.5x of Debt to Equity Ratio
Min capital USD 800mio
Picture’s source: www.google.com

21
Subsidiaries

Subsidiaries
22
Aero Wisata (in IDR bio) Citilink (in USD 000)
9M2014 9M2015 ∆ % YoY 9M2014 9M2015 ∆ % YoY
Operating Revenue 2,331.4 2,317.0 (0.6) Operating Revenue 287,853.0 351,728.0 22.2
Operating Income 82.3 98.4 19.5 Operating Income (11,208.0) 12,561.0 212.1
Net Income 64.1 77.0 20.0 Net Income (12,134.0) 5,888.0 148.5
EBITDA 167.5 189.9 13.4 EBITDA (4,747.1) 22,249.6 568.7
Dec14 Sept15 ∆ % YoY Dec14 Sept15 ∆ % YoY
Asset 2,735.5 2,830.9 3.5 Asset 166,019.0 218,420.0 31.6
Liability 937.2 952.1 1.6 Liability 209,441.0 199,902.0 (4.6)
Equity 1,798.3 1,878.8 4.5 Equity (43,422.0) 18,519.0 142.6
Gapura Angkasa (in IDR bio) GMF Aero Asia (in USD 000)
9M2014 9M2015 ∆ % YoY 9M2014 9M2015 ∆ % YoY
Operating Revenue 883.0 983.2 11.4 Operating Revenue 189,431.7 213,355.5 12.6
Operating Income 15.6 76.3 389.0 Operating Income 19,925.1 40,716.9 104.3
Net Income 8.7 57.8 565.1 Net Income 14,638.9 28,536.6 94.9
EBITDA 63.2 125.2 98.1 EBITDA 25,530.9 46,106.7 80.6
Dec14 Sept15 ∆ % YoY Dec14 Sept15 ∆ % YoY
Asset 787.0 842.9 7.1 Asset 251,351.9 284,929.7 13.4
Liability 422.0 449.6 6.6 Liability 146,760.0 170,429.4 16.1
Equity 365.0 393.2 7.7 Equity 104,592.0 114,500.3 9.5
Subsidiaries
23
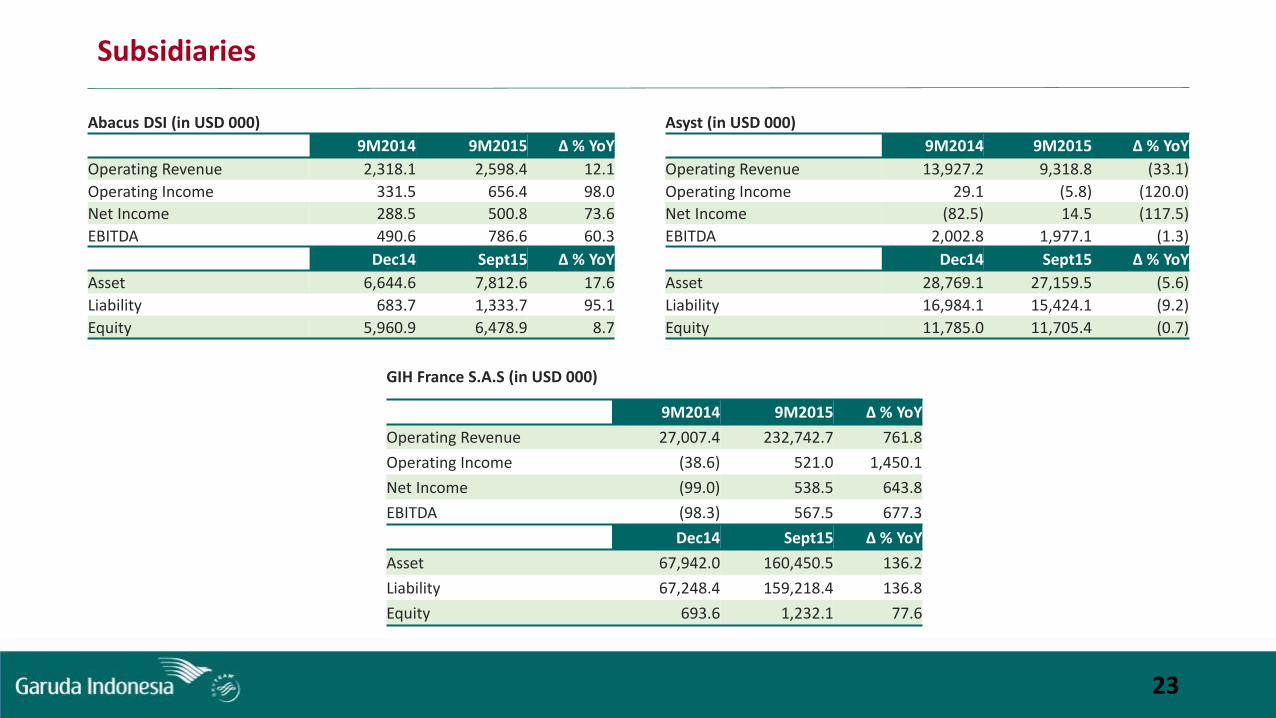
Abacus DSI (in USD 000) Asyst (in USD 000)
9M2014 9M2015 ∆ % YoY 9M2014 9M2015 ∆ % YoY
Operating Revenue 2,318.1 2,598.4 12.1 Operating Revenue 13,927.2 9,318.8 (33.1)
Operating Income 331.5 656.4 98.0 Operating Income 29.1 (5.8) (120.0)
Net Income 288.5 500.8 73.6 Net Income (82.5) 14.5 (117.5)
EBITDA 490.6 786.6 60.3 EBITDA 2,002.8 1,977.1 (1.3)
Dec14 Sept15 ∆ % YoY Dec14 Sept15 ∆ % YoY
Asset 6,644.6 7,812.6 17.6 Asset 28,769.1 27,159.5 (5.6)
Liability 683.7 1,333.7 95.1 Liability 16,984.1 15,424.1 (9.2)
Equity 5,960.9 6,478.9 8.7 Equity 11,785.0 11,705.4 (0.7)
GIH France S.A.S (in USD 000)
9M2014 9M2015 ∆ % YoY
Operating Revenue 27,007.4 232,742.7 761.8
Operating Income (38.6) 521.0 1,450.1
Net Income (99.0) 538.5 643.8
EBITDA (98.3) 567.5 677.3
Dec14 Sept15 ∆ % YoY
Asset 67,942.0 160,450.5 136.2
Liability 67,248.4 159,218.4 136.8
Equity 693.6 1,232.1 77.6

24
PT Garuda Indonesia (Persero) Tbk.Investor Relations Department
2nd Floor Management Building Garuda CitySoekarno-Hatta International AirportPhone: 62-21-2560 1201Email: [email protected]