corporate investment and cash flow sensitivity - european central
TRANSCRIPT

WORKING PAPER SER IESNO. 485 / MAY 2005
CORPORATE INVESTMENT AND CASHFLOW SENSITIVITY
WHAT DRIVES THERELATIONSHIP?
by Paul Mizen and Philip Vermeulen

In 2005 all ECB publications will feature
a motif taken from the
€50 banknote.
WORK ING PAPER S ER I E SNO. 485 / MAY 2005
This paper can be downloaded without charge from http://www.ecb.int or from the Social Science Research Network
electronic library at http://ssrn.com/abstract_id=711165.
CORPORATE INVESTMENT AND CASH
FLOW SENSITIVITY
WHAT DRIVES THERELATIONSHIP? 1
by Paul Mizen 2
and Philip Vermeulen 3
economist in DG Research, European Central Bank.We would like to thank Bob Chirinko,Alessandra Guariglia, Frank Smets and ananonymous referee.The statements in this paper are those of the authors and do not necessarily reáect the opinions of the ECB.
1 The first author was a Research Visitor to the European Central Bank and acknowledges their support.The second author is a Senior
3
European Central Bank, Kaiserstrasse 29, 60311 Frankfurt am Main, Germany; e-mail: [email protected]; - : z2 University of Nottingham, University Park, Nottingham, NG7 2RD, England e mail paul.mi [email protected]

© European Central Bank, 2005
AddressKaiserstrasse 2960311 Frankfurt am Main, Germany
Postal addressPostfach 16 03 1960066 Frankfurt am Main, Germany
Telephone+49 69 1344 0
Internethttp://www.ecb.int
Fax+49 69 1344 6000
Telex411 144 ecb d
All rights reserved.
Reproduction for educational and non-commercial purposes is permitted providedthat the source is acknowledged.
The views expressed in this paper do notnecessarily reflect those of the EuropeanCentral Bank.
The statement of purpose for the ECBWorking Paper Series is available fromthe ECB website, http://www.ecb.int.
ISSN 1561-0810 (print)ISSN 1725-2806 (online)

3ECB
Working Paper Series No. 485May 2005
CONTENTS
Abstract 4
5
1 Introduction 6
2 Literature 82.1 Investment and cash flow sensitivity 82.2 Cash flow sensitivity and the
financial system 92.3 Cash flow sensitivity and size 102.4 Cash flow sensitivity and industrial
structure 112.5 Cash flow sensitivity and creditworthiness 11
3 Methodology 123.1 Investment equation 123.2 Sampling procedure 13
4 Results 154.1 Data 154.2 Results from full sample of UK and
German firms 164.3 Cash flow sensitivity and financial
system 184.4 Cash flow sensitivity and size 214.5 Cash flow sensitivity and industrial
structure 234.6 Cash flow sensitivity and creditworthiness 27
5 Conclusions 29
References 30
6 Appendix 34
European Central Bank working paper series 38
Non-technical summary

Abstract
The excess sensitivity of investment to cash �ow has been demonstrated in numerous stud-ies. Recent research has identi�ed di¤erences in the degree of sensitivity across countries, whichit ascribes to the nature of the lender-borrower relationship in the �nancial systems of thosecountries. In this paper we o¤er new methods and results to determine whether di¤erences areassociated with structural explanations such as the nature of the �nancial system and industrialcomposition, or due to other �rm-speci�c determinants such as size or creditworthiness. Unlikeprevious research we are able to systematically control for competing explanations in our datafrom more than one country and thereby isolate what drives the relationship. We �nd thatcreditworthiness is the main driving force of cash �ow sensitivity.
Key words: corporate investment, cash �ow sensitivity, cross-country investmentstudiesJEL: E22, D92
4ECBWorking Paper Series No. 485May 2005

In the vast literature on the relationship between cash �ow and investment all but afew papers are based on sample-splitting between constrained and unconstrained �rms takenfrom a single country. Recent evidence provided in Bond et al. (2003) and Chatelain et al.(2003) does make a comparison between cash �ow sensitivity of investment in a range ofEuropean countries. Bond et al. (2003) shows investment of UK �rms to be more sensitiveto cash �ow �uctuations than the investment of �rms in other European countries, but mostnotably Germany. This paper seeks to explain why the the degree of sensitivity in the UKappears to be greater than that of Germany. This paper extends the literature by examiningfrom a number of perspectives the behaviour of �rms in these two European countries thatare regarded as polar cases of predominantly market-�nanced and bank-�nanced systems .
The paper proposes several hypotheses that are explored in turn. A �rst possible reasonis that �rms in market-oriented �nancial systems show greater sensitivity to cash �ow becauseborrowers and lenders operate at arms length compared to those in relationship-orientedsystems. A second possible cause for di¤erences in response to cash �ow across countries isthat the samples of �rms taken from each country might di¤er in composition with respect toparticular characteristics, for instance size. Equally, the industrial type may be an importantdeterminant of investment sensitivity to cash �ow since industries di¤er considerably in termsof the size of �rms, capital-intensity, borrowing capacity, openness and the durability of theiroutput.
In this paper we use samples of �rms derived from the AMADEUS database from Ger-many and the UK to investigate whether �nancial system, �rm size, or industrial structureare possible driving determinants of the investment cash �ow sensitivity. These can be seenas possible structural determinants of �nancing constraints but even if we �nd that one ofthese determinants is driving cash �ow sensitivity it is not su¢ cient to infer that these arecausal. A likely non-structural cause of responsiveness to cash �ow is the general creditwor-thiness of �rms and this might be correlated with size and industry. However this correlationwill vary over time and between countries at a given point in time.
Our �ndings on the possible determinants are as follows. First, we con�rm the resultof Bond et al. (2003) where cash �ow sensitivities are more pronounced in market-oriented�nancial systems, i.e. we �nd that in the full samples of corporate data for the UK andGermany, the UK �rms are more sensitive. But these results are sensitive to sample com-position, since the result obtained in the full sample is not found when the samples areclosely-matched to ensure that �rms have comparable size and industrial classi�cations. Weconclude that �nancial system is not the determinant of cash �ow sensitivity. Second, we donot �nd �rms�size to be a determinant of cash �ow sensitivity either in Germany or in theUK. Third, we �nd evidence that industrial characteristics are determinants of sensitivityin the UK but not in Germany. When investigating the economic performance we �nd thatthose industries with the weakest performance in the UK are most sensitive to cash �ow. Weconclude that the nature of the industry is important, but not in a purely structural sense,since it is the creditworthiness industry-by-industry that determines the availability of ex-ternal �nance and the sensitivity to cash �ow. Ultimately we conclude that creditworthinesson a range of measurable criteria is the driving force of the investment cash �ow sensitivityirrespective of the country of origin of the �rms concerned .
5ECB
Working Paper Series No. 485May 2005
Non-technical summary

1 Introduction
There is a large literature that identi�es an in�uence of �nancial market imperfections oncorporate investment and economic �uctuations. Beginning with Fazzari et al. (1988),this literature has documented the e¤ects of asymmetric information on access to external�nance, and has shown that �rms that are identi�ed a priori as �nancially constrained showgreater sensitivity in investment to the availability of internal �nance proxied by cash �ow.The sensitivity of �nancially constrained �rms to internal sources of �nance o¤ers supportfor the broad credit channel of monetary policy.
Most of these results are based on sample-splitting between constrained and uncon-strained �rms taken from the same country, but more recently evidence has been gatheredon investment sensitivity to cash �ow across a range of countries. For example, in a recentcomparative study between �rms in Belgium, France, Germany and the UK, Bond et al.(2003) present evidence that the investment of UK �rms is more sensitive to cash �ow �uc-tuations than the investment of �rms in the three continental European countries. However,not all of these countries showed the same degree of sensitivity in corporate investment tocash �ow variables (as we might have expected if the broad credit channel a¤ected �nanciallyconstrained �rms in each of the countries in exactly the same way), so the focus of attentionhas necessarily shifted to ascertain the reason for the di¤erences in the response to cash �owbetween countries.1
A �rst possible reason why the broad credit channel appears to be more powerful insome countries than in others is that the �nancial systems deal di¤erently with the asym-metric information problem. It is possible that �rms in market-oriented �nancial systemsshow greater sensitivity to cash �ow because borrowers and lenders operate at arms lengthcompared to relationship-oriented systems. For example, Allen and Gale (2000) indicatethat Germany and the UK, which show di¤erent sensitivities to cash �ow in the study byBond et al. (2003), are on opposite sides of the �nancial spectrum. In the UK, equity marketcapitalisation as a percentage of GDP is far higher than in Germany, and corporate control isexercised by the �nancial markets rather than banks, in contrast to Germany. The �nancialsystem argument proposes that the arrangement of �nancial systems is responsible for thedi¤erences in the importance of the broad lending channel relationships across countries andthis results in di¤erences in the estimated relationships between investment and cash �ow2.
1Mairesse and Dormont (1985) provide a comparative investment analysis for the period 1970-79 usingFrench, German and US large manufacturing �rms. They �nd relatively similar investment behaviour in thedi¤erent countries.
2While identifying the key di¤erences between �nancial systems, Allen and Gale (2000) do not go so faras to assert that this is the reason for di¤erences in cash �ow sensitivity. In fact they argue that �Giventhe importance of internal �nance in most countries, it could be argued that institutional di¤erences in the�nancial system are immaterial. This is one of the fundamental questions posed in comparing �nancial
6ECBWorking Paper Series No. 485May 2005
systems. �

Bond et al. (2003) take the �nancial system to be an important consideration in explainingcross-country di¤erences in cash �ow sensitivity, although they are careful to state that otherfactors might be the cause of the di¤erences, and state that more research is needed.
A second possible cause for di¤erences in response to cash �ow across countries is thatthe samples of �rms taken from each country might di¤er in composition with respect tocharacteristics such as �rm size. Firm size has been regarded as an important determinant of�nancial constraints in studies of the credit channel within countries (Gertler and Gilchrist,1994, Oliner and Rudebusch, 1996, Vermeulen 2002) and may explain di¤erences betweencountries. However it is not easy to determine whether �rms are �nancially constrainedbecause they are small, or small because they are �nancially constrained. Moreover, theultimate cause of the di¤ering sensitivities to monetary policy may re�ect deeper underlyinge¤ects associated with, for example, the industrial type and its cyclical nature (Eichenbaum,1994). Size is correlated with other characteristics that indicate �rms are less likely to obtainexternal �nance because small �rms are often young, poorly collateralized and risky.
A third possible cause for sensitivity di¤erences is that samples across countries mightdi¤er in industrial structure. A recent line of research suggests that di¤erences in industrycharacteristics are important determinants of investment sensitivity to cash �ow. Ganleyand Salmon (1997), Hayo and Uhlenbrock (2000), Dedola and Lippi (2004), and Peersmanand Smets (2004) have found that industries di¤er considerably in terms of the size of�rms, capital-intensity, borrowing capacity (de�ned by leverage and size), openness andthe durability of their output, and these have a signi�cant e¤ect on their �nancing andinvestment behavior. These di¤erences between industries are powerful enough to dominatethe di¤erences between countries according to Dedola and Lippi (2004) and Peersman andSmets (2004).
In this paper we use samples of �rms derived from the AMADEUS database from Ger-many and the UK to investigate whether �nancial system, �rm size, or industrial structureare possible driving determinants of the investment cash �ow sensitivity. These can be seenas possible structural determinants of �nancing constraints in the sense that they are semi-permanent features speci�c to each economy. However, even if we �nd that one (or possiblymore than one) of these determinants is driving cash �ow sensitivity it is not su¢ cient toinfer that these are causal. A likely non-structural cause of responsiveness to cash �ow isthe creditworthiness of �rms and this might be correlated with size and industry. Howeverthis correlation will vary over time and between countries at a given point in time. Someindustries (�rm size classes) might have healthy balance sheets at certain times, but weakones at other times. A �nding, in a given sample, that some industries are more sensitivethan others is therefore not su¢ cient evidence in favor of industry as a determinant of�nancing constraints. The comparison between the UK and Germany gives us a means toidentifying whether the true underlying cause of cash �ow sensitivity is due to structural ornon-structural determinants.
7ECB
Working Paper Series No. 485May 2005

We �rst investigate whether the �nancial system is a determinant of �nancing constraintsin the sense discussed above. If this is the case we should �nd that German �rms are lesssensitive than UK �rms, controlling for size and industry. We then investigate whether sizeor industry are determinants, irrespective of creditworthiness. If these are determinants weshould �nd that the cash �ow sensitivity di¤erences across size classes or across industrygroupings are similar for Germany and the UK. Essentially, if size and industry characteristicsare structural determinants of cash �ow sensitivity then these properties should be found inboth the UK and in Germany when comparing similar size and industry classes. We �nallycheck if creditworthiness might be at the core of the di¤erences we �nd.
Our �ndings on the possible determinants are as follows. First, we con�rm the resultof Bond et al. (2003) where cash �ow sensitivities are more pronounced in market-oriented�nancial systems, i.e. we �nd that in the full samples of corporate data for the UK andGermany, the UK �rms are more sensitive. But these results are sensitive to sample com-position, since the result obtained in the full sample is not found when the samples areclosely-matched to ensure that �rms have comparable size and industrial classi�cations. Weconclude that �nancial structure is not an important determinant of cash �ow sensitivity.Second, we do not �nd �rms�size to be a determinant of cash �ow sensitivity either in Ger-many or in the UK. Third, we �nd evidence that industrial characteristics are determinantsof sensitivity in the UK but not in Germany. When investigating the economic performancewe �nd that those industries with the weakest performance in the UK are most sensitive tocash �ow. We conclude that the nature of the industry is important, but not in a purelystructural sense, since it is the creditworthiness industry-by-industry that determines theavailability of external �nance and the sensitivity to cash �ow. Ultimately we conclude thatcreditworthiness is the driving force of the investment cash �ow sensitivity.
The next section discusses the background issues in the literature. In section 3 wediscuss our methodology for discriminating between the driving factors in the relationshipbetween corporate investment and �nancial constraints. Section 4 describes our data sourcesand then the results are reported in section 5.
2 Literature
2.1 Investment and cash �ow sensitivity
There is a large literature that estimates the impact of �nancial constraints on the investmentbehavior of �rms beginning with the seminal article by Fazzari, Hubbard and Petersen (1988).They classify �rms according to whether they were likely to be �nancially constrained on thebasis of their size, dividend payouts and capital structure and this characteristic determineswhether they are more sensitive to the supply of internal funds measured by cash �ow. Thehighest sensitivities to cash �ow are found for �rms categorized as �nancially constrained,and this is taken to indicate that �nancial constraints are binding in this case. Many furtherstudies have followed the same methodology including Chirinko and Schaller (1995), Hubbardet al. (1995), Calomiris and Hubbard (1995), as summarized by Hubbard (1998).
8ECBWorking Paper Series No. 485May 2005

More recently the literature has raised several new objections to this approach. Kaplanand Zingales (1997, 2000) have argued that the classi�cation adopted by Fazzari et al.(1988) tends to assign �rms incorrectly. They make use of more detailed information in�nancial statements from annual reports to classify the same �rms over an identical sampleperiod into three categories ��nancially constrained�, �possibly �nancially constrained�and�not �nancially constrained�. Using this classi�cation they �nd that �nancially constrained�rms have the lowest sensitivity of investment to cash �ow. On a larger dataset Cleary(1999) also �nds that the most constrained �rms have the lowest sensitivity. Recently,Allayannis and Mozumdar (2004) show that the �ndings of Kaplan and Zingales (1997) canbe explained by a few in�uential observations whereas the results of Cleary (1999) can beexplained by observations of �rms with negative cash �ows. One of the main messages ofthe work by Kaplan and Zingales and Clearly is that for �rms under distress the cash �owsensitivity might be reduced, so that for severely constrained �rms the usual relationshipfound in the literature might be reversed. We think that one of the more important reasonsto be cautious in interpreting cash �ow sensitivity as indicating �nancing constraints is thatcash �ow might forecast future pro�tability or sales growth. We check for this possibility,but as in Bond et al. (2003), our results indicate that it is not an important problem in oursample.
2.2 Cash �ow sensitivity and the �nancial system
The �nancial system of a country dictates how the common problem of asymmetric in-formation will be handled. The idea that the �nancial system has an important role toplay in economic �uctuations, and investment in particular, is an old one. (See Gertler(1988) for an overview.) Market-oriented �nancial systems where arms-length lenders of-fer funds through commercial paper, corporate bond and equity markets are more likelyto show greater sensitivity to cash �ow. Relationship-oriented systems are likely to fostercloser and more transparent arrangements that allow them to exercise greater scrutiny overborrowers, and as a result investors will be less sensitive to internal sources of funds. Anexcellent discussion of the principal di¤erences between the two structures is given in Rajanand Zingales (2003). The evidence in Allen and Gale (2000) indicates that Germany andthe UK, are good examples of the polar cases on the wide spectrum of �nancial systems inEurope. In the UK, market capitalisation as a percentage of GDP is some three times thatof Germany, and corporate control is exercised by the �nancial markets rather than banks,in contrast to Germany. Nevertheless bond markets are much less well developed in Ger-many and the UK versus the US. Although �rms in both countries rely heavily on internalfunds, and the development of market �nance has been signi�cant in the period 1995- 2004even in Germany (c.f. Rajan and Zingales, 2003), the impact of these systems could a¤ectthe sensitivity of investment to cash �ow. Analysis of these economies to internal funds atthe margin is expected to show investment will be more sensitive to internal funds (cash
9ECB
Working Paper Series No. 485May 2005
�ow) for countries where the �nancial system is relatively market-based, and vice versa,if the �nancial system is the driving force behind the importance of cash �ow. Bond etal. (2003) o¤er one of the few comparative studies of the impact of cash �ow on investmentacross several countries with di¤erent �nancial systems. Their results are based on estimatesof investment equations for four European countries (Belgium, France, Germany, and theUnited Kingdom), and o¤er some support for di¤erences between countries that are moremarket-oriented (United Kingdom) or relationship-oriented (Germany). They are quick toacknowledge, however, that other factors may have an important role to play.
2.3 Cash �ow sensitivity and size
Firm size has been used as an indicator of access to external �nance (Gertler and Gilchrist,1994). In addition small �rms are generally younger, with higher levels of �rm-speci�c risk,and less collateral, making them less likely to attract external �nance. The evidence suggeststhat small �rms are more sensitive to monetary policy tightening than larger �rms. Gertlerand Gilchrist (1994) document that indicators of monetary tightening such as Romer datesare highly signi�cant explanatory variables in time series estimates of small �rms� sales,inventory accumulation and short-term debt, in direct contrast to estimates for large �rms3.Gilchrist and Himmelberg (1995) �nd excess sensitivity for small �rms, and those with outa bond rating or commercial paper issue in their sample. According to Schaller (1993)small �rms and those that do not belong to a corporate group in Canada are more sensitiveto cash �ow than others. However not all evidence on size goes in the same direction. Intheir seminal study Fazzari, Hubbard and Petersen (1988) point out that when they splitsamples according to size, small �rms have relatively low cash �ow coe¢ cients. Also, Huand Schiantarelli (1998) �nd that larger �rms are more likely to be �nancially constrained. They explain their result by arguing that (at least in their sample of listed �rms) �rmsize may be inversely related to concentration of ownership, which tends to mitigate agencyproblems. On the basis of a formal framework that relates theory to empirical investmentmodels, Chirinko (1997) argues that �rm size (and retention behavior) are not appropriatecriteria for identifying �nancially constrained �rms.
One has to be careful in projecting the results obtained on US data to European �rms. Inthe US studies, the larger �rms are quite di¤erent from the small �rms in that the large �rmshave access to bond markets and the commercial paper market. The split really selects �rmsinto those that obtain external �nance from banks versus those that obtain external �nancefrom the markets. In contrast, in Germany and the UK, bond markets and commercial papermarkets are much less developed than in the US implying that a large-small �rm sample splitis less likely to generate a partition between bank versus market �nanced �rms. Rather both
3Although there are statistically signi�cant di¤erences in the response to monetary policy in relation to�rm size, and this has been strongly associated with �nancial constraints, it is di¢ cult to be sure about thedirection of causation. (Eichenbaum, 1994)
10ECBWorking Paper Series No. 485May 2005

small and large �rms will be mostly (even exclusively) bank �nanced. In a cross countrystudy of Germany, France, Italy and Spain, Chatelain et al. (2003) �nd a signi�cant largere¤ect of cash �ow for smaller �rms only in the Italian case. So a priori from the abovestudies it is di¢ cult to argue that small �rms are necessarily more likely to face �nancingconstraints in the UK and Germany compared to large �rms.
2.4 Cash �ow sensitivity and industrial structure
In a study of the regional e¤ects of monetary policy, Carlino and DeFina (1998) show thatthere are some signi�cant deviations from the average US response to monetary policychanges over the period 1958-1992 at the regional level. They argue that one potentialexplanation for the di¤erences in regional response to the federal funds rate is the di¤erentindustrial composition of the regions. Manufacturing industry intensive states are more sen-sitive to monetary policy shocks than states with a greater diversity of industries, and stateswith greater numbers of small �rms also are marginally more sensitive.
A new literature has taken up this theme making use of industrial characteristics todetermine whether these features are responsible for di¤erences in the output response tomonetary policy between countries. Barth and Ramey (2000) have linked the di¤erentiale¤ects of monetary policy shocks to the impact of �cost�and �demand�in�uences in monetarytransmission, which are connected to the exposure of particular types of industries to thesein�uences.
Dedola and Lippi (2004) and Peersman and Smets (2004) have shown that industrieswith characteristics such as greater investment intensity, openness and more durable goodsare more likely to show greater sensitivity to changing monetary policy because their �costside is more sensitive to the real cost of capital�. These industries are more interest sensitivethan others, enhancing the impact of the interest channel of monetary policy on the outputcycle. They also argue that industries that have greater di¢ culty in accessing �nancial mar-kets, with higher working capital requirements and greater borrowing capacity (as measuredby size and leverage) could be more prone to the broad credit channel e¤ects of monetarytransmission. The output response is reported from a structural VAR framework for 20industries in �ve OECD countries by Dedola and Lippi (2004) and from a single-equationautoregression of output growth for 74 industries in the euro area countries by Peersman andSmets (2004). Di¤erences in the policy e¤ects by industry are shown to be explained primar-ily by particular industry characteristics such as durability, openness and capital intensityof production.
2.5 Cash �ow sensitivity and creditworthiness
Di¤erences in cash �ow sensitivities by size and industry classes can ultimately be causedby di¤erences in creditworthiness by �rms. Hu and Schiantarelli (1998) �nd that �rms withweaker balance sheets are more likely constrained. Clearly (1999) �nds that pro�tability and
11ECB
Working Paper Series No. 485May 2005

sales growth are the two most important variables in a discriminant analysis used to select�rms that increase or decrease dividends (which he interprets as re�ecting the absence orpresence of �nancing constraints). We examine whether these indicators of creditworthinessare correlated with sensitivity to cash �ow in our industry and size classes. In other words,we determine whether there are some industries or some �rm classes that are more sensitiveto cash �ow than others (even if they are the same industries in di¤erent countries) becausetheir poor performance on these criteria makes them more reliant on internal �nance forinvestment at the margin.
We do not espouse any one model in this paper, rather we approach each literature froman agnostic point of view. The paper devises sample-splitting and sample-matching methodsto determine whether the predictions of each literature can be supported empirically. Byevaluating the models for more than one country and making comparisons between themwe hope to shed more light on the underlying reasons for cash �ow sensitivity in investmentequations. The next section explains our methodology in detail.
3 Methodology
3.1 Investment equation
Mairesse et al. (1999) and Bond et al. (2003) are two recent cross-country investmentstudies. We follow their methodology4 and model investment in a �exible error correctionmodel. For a neoclassical pro�t-maximizing �rm with a CES production function and noadjustment costs the capital stock is proportional to output,
ki;t = �yi;t + hit (1)
with ki;tand yi;t the log of the capital stock and the log of output. hit is a function ofthe user cost.
Assuming that the capital stock in the presence of adjustment costs evolves as anADL(2,2) model, equation 1 can be embedded as the long run solution and can be re-written in an error correction format (see Bean, 1981) and assuming the change in the cap-ital stock can be approximated by investment over previous capital stock less depreciation,�ki;t t Ii;t
Ki;t�1� � we can write in panel data format:
Ii;t
Ki;t�1= 1
Ii;t�1
Ki;t�2+ 2�yi;t+ 3�yi;t�1+�(ki;t�2�yi;t�2)+�1
cfitKit�1
+�2cfit�1Kit�2
+dt+�i+�i;t:
(2)
4When estimating an Euler speci�cation for data from a range of European countries, Bond et al. (2003)indicate that the model is �seriously mispeci�ed�and o¤er a distinctly lukewarm discussion of its performance.We therefore focus solely on the error correction model.
12ECBWorking Paper Series No. 485May 2005
The adjustment costs re�ect the sluggish adjustment of capital stock and rest on aproportional adjustment argument forwarded by Caballero, Engel and Haltiwanger (1995),which states that desired capital stock in the presence of adjustment costs is proportionalto the desired capital stock in the absence of adjustment costs. The variation in the usercost is controlled for by �rm speci�c e¤ects and time dummies. The importance of �nancialconstraints in this model can be ascertained by including cash �ow scaled by capital, as ameasure of the supply of internal funds, in the regression. We estimate the above equationusing �rst-di¤erence GMM (Arrelano and Bond, 1991). We use the lagged variables inlevels as instruments for the �rst di¤erences of the regressors. We use the Sargan-test ofoveridentifying restrictions as a joint test of model speci�cation and instrument selection.We also report the m1 and m2 test of serial correlation of the �rst di¤erenced residuals.Both the m1 and m2 test are asymptotically standard normal under the null of no serialcorrelation in �i;t:
3.2 Sampling procedure
Comparisons between countries can reasonably be expected to give di¤erent magnitudesto the coe¢ cients even if the investment behavior of �rms in each country is driven bythe same fundamental processes, but determining the root cause of these di¤erences is notstraightforward. The previous section has indicated that di¤erences in �nancial systems,size and industrial structure are potential explanations for response to �nancial constraintsacross countries. Unless we use methods that can isolate a single explanation by controllingfor the others it will be di¢ cult (if not impossible) to resolve the question of what drivesthe relationship between �nancial constraints and corporate investment. In this section wepropose two methods based on matching and sample-splitting to construct specially selectedsamples of data taken from corporate accounts in Germany and the United Kingdom toevaluate each of the competing explanations of the sensitivity of investment to cash �ow.
The �rst method seeks to control for size and industrial features in the samples fromeach country that could be responsible for the di¤erent sensitivities to cash �ow betweencountries. Comparisons of investment sensitivity to cash �ow are typically drawn from thepopulation of �rms from each country without a designated sampling criterion. The samplesare constructed by randomly drawing �rms from the population of each country, but wherethere are size or industrial characteristics that di¤er between the populations of each country,random sampling will re�ect these characteristics in the respective samples. It is possiblethat the di¤erent sensitivities to cash �ow in investment equations are a re�ection of thesefeatures in each country and not necessarily due to the in�uence of �nancial system. Onlyin the exceptional cases where the sample is very large or the composition uniform in bothcountries, could random sampling draw �rm conclusions that di¤erences in sensitivity aredue to the �nancial system argument and not one of the competing views.
Conclusions drawn over the importance of �nancial system on investment may provefragile if sample-speci�c features in the size of �rms or industrial structure are responsible
13ECB
Working Paper Series No. 485May 2005

for di¤erences in the response of investment to �nancial constraints in each country. To drawrobust conclusions about investment activity in di¤erent countries in relation to their �nan-cial structure we argue that steps should be taken to properly match �rms in each countrywithin the panel before making comparisons between them. While this will inevitably leadto a smaller panel of usable �rms, the results are likely to be more reliable as a comparisonof investment activity under �nancial constraints between countries.
Our �rst method recognizes the importance of matching the �rms in the panel by se-lecting �rm pairs from Germany and the UK to construct closely-matched samples. Thisensures that our �rms have common NACE codes for industrial classi�cation and similarsizes. These closely-matched samples only include those German �rms that have a closematch with a UK �rm and vice versa. We are able to determine whether the di¤erencesin the results between the UK and Germany in the random samples are an artefact of thecomposition by comparing them with the results of the closely-matched sample, and theseresults are reported in the next section. We then address the question whether investmentis more or less sensitive to cash �ow in the UK compared to Germany. If the �nancial struc-ture argument is correct then the signi�cance of the cash �ow variable in �market-oriented�as opposed to �relationship-oriented�economies will indicate that �nancial constraints bindeven when we control for the selection of �rms. If the sample composition is responsible forthe di¤erences between the UK and Germany we should �nd no di¤erences in sensitivity forthe sample that has been closely-matched for �rm type but clear di¤erences between therandom samples.
Our second method controls for sample characteristics - such as size and industrialstructure - that might be responsible for di¤erences in the sensitivity of investment to cash�ow in each country. When we consider the in�uence of size we take into account factors suchas absolute and relative size of the �rm, where the level of sales indicates absolute size, andrelative sales i.e. sales compared to the other �rms in the same industry re�ects relative size(because �rms may be large in relation to the average for their industry without being largein an absolute sense). Small �rms have long been regarded as more �nancially constrainedthan large �rms (c.f. Gertler and Gilchrist, 1994, Gilchrist and Himmelberg, 1995) and bycontrolling for this characteristic we can determine whether it is the proportion of small�rms versus large �rms in each country sample that is responsible for the sensitivity to cash�ow.
When we consider the in�uence of industrial structure we control for the nature of theindustry that might cause the �rms to be more sensitive to cash �ow. The literature hasindicated that intermediate producers might be more sensitive to cash �ow than �nal goodsproducers due to the scale and duration of their investment projects. Likewise �rms thatoperate in more closed industries that have less import competition or are more domesti-cally oriented may also be more sensitive to �nancial constraints than �rms in more openindustries. We control for these features across countries to evaluate whether these criteriaare responsible for the di¤erent sensitivities of investment to cash �ow between countries.
14ECBWorking Paper Series No. 485May 2005
cash �ow then samples selected to include and exclude these features should show the samedegree of sensitivity irrespective of the country from which they were drawn. For example,if size or openness is the characteristic that determines excess sensitivity of investment tocash �ow then both German and UK �rms that are smaller than the average or less openshould show excess sensitivity, and larger than average �rms or those in more open industriesshould show less sensitivity. This may con�rm that size or industrial grouping is responsiblefor the sensitivity to cash �ow, as opposed to the nature of the �nancial system.
4 Results
4.1 Data
Our data are taken from the AMADEUS database. We only use variables that are compara-ble across countries such as the capital stock, investment, sales and cash �ow and these aretaken from balance sheets for manufacturing �rms. The details of how these variables wereconstructed are described in the Appendix. From this database we �rst construct two fullsamples: a sample of German �rms and a sample of UK �rms. We clean by dropping the1 % outliers from the investment to capital ratio, cash �ow to capital ratio, and the errorcorrection term. We have a consecutive run of at least �ve observations for each �rm overthe period 1993-99.
After cleaning, the full samples of British and the German �rms contain 2103 �rm-yearobservations from 378 UK �rms and 804 �rm-year observations from 145 German �rms. Thesummary statistics are given in Table 1. The full German and UK samples do not di¤ermuch between countries in terms of average investment (It=Kt�1,), sales growth (�yt) andcash �ow to capital ratio (CFt=Kt�1). Although the average German �rm in our sample ismuch larger than the average UK �rm when measured by sales. There is a large dispersionwithin both samples in terms of size.5
As is quite usual with �rm panel data, �rms within each country tend to show moresubstantial di¤erences compared to the averages across countries in terms of the level ofinvestment, sales growth and the cash �ow-to-capital ratio. The relative variation is of thesame order in Germany as in the UK. On the basis of these summary statistics used in theinvestment regressions the two samples look very similar and it would be hard to predictthat the investment regressions would di¤er across countries.
5The main reason for the smaller average of sales in the UK is the presence of many more smaller �rms.Our use of consolidated accounts limits us in the selection of German �rms. Consolidation is common in theUK among all �rms, in Germany only the larger ones consolidate.
If one of these features is responsible for the excess sensitivity of corporate investment to
15ECB
Working Paper Series No. 485May 2005

Table 1 - Summary statistics of full samplesGermany UKmean (st.dev.) min max mean (st.dev.) min max
It=Kt�1 0.16 (0.14) -0.35 0.94 0.14 (0.17) -0.83 0.99�yt 0.04 (0.11) -0.68 0.60 0.03 (0.16) -1.01 0.95CFt=Kt�1 0.23 (0.23) -0.24 2.04 0.22 (0.22) -0.50 1.82(k � y)t�2 -1.05 (.49) -2.57 0.13 -1.12 (.63) -3.22 0.68sales (£ m) 1550 (4470) 15.6 44900 241 (814) 7.1 8720N. Obs. 804 2103N. �rms 145 378Sales are in millions of pounds sterling at 1995 prices.German sales are converted to pounds sterling using DM2.63 = £ 1
4.2 Results from full sample of UK and German �rms
In this section we report the estimates of an error correction model using full samples ofdata from the UK and Germany. These are reported in Table 2. The Sargan p-value andthe m1 and m2 statistics indicate that the model is well speci�ed both for Germany andthe UK. There is a positive and signi�cant in�uence from current and lagged sales growth inGermany and from current sales growth in the UK. The error correction term is signi�cantand of the right sign in Germany, while it is insigni�cant in the UK. Cash �ow has a positiveand signi�cant e¤ect on investment in the UK, while in Germany cash �ow is not signi�cant.Interestingly, in a comparative study by the European System of Central Banks, using morethan 5000 observation for Germany, Chatelain et al. (2003) �nd that none of the four cash�ow terms is signi�cant using an autoregressive distributed lag for investment. We �nd somesimilarities in the qualitative results between our error correction model for investment inthe 1990s and the same model of Bond et al. (2003) for the 1980s, although the magnitudeof the coe¢ cients in the 1990s is substantially higher than the 1980s. Nevertheless, Bond etal. (2003) do �nd some small positive signi�cant e¤ect (albeit smaller than the UK) of cash�ow in Germany.
Cummins et al. (1999) and Bond and Cummins (2001) show that the inclusion ofearnings data from securities analysts as an indicator of returns to investment results in amuch reduced correlation between investment and cash �ow. This suggests that there is apossibility that cash �ow is a proxy for information on earnings in the investment equation.Gilchrist and Himmelberg (1995) also indicate that if cash �ow is a proxy for future earnings,sales or pro�tability we may not be measuring the sensitivity to internal �nance at all. Sincecash �ow could be a proxy for other determinants of investment such as future sales growth orexpected pro�tability that are not captured by current and past sales growth we investigatethe possibility that cash �ow may forecast future sales growth. The hypothesis that cash�ow predicts future sales growth can be tested directly by creating forecast equations forsales. Bond et al. (2003) have found cash �ow does help predict sales growth in three of their
16ECBWorking Paper Series No. 485May 2005

four countries, but there are no noticeable di¤erences in the explanatory power between thecountries (as we would expect if the omitted variable argument were true). In our study,cash �ow is marginally signi�cant in the sales growth equation for Germany, but cash �owdid not appear to be important to corporate investment in Germany. There is no evidencethat cash �ow helps predict future sales growth in the UK where cash �ow was an importantdeterminant of investment.6
Our results from the full sample indicate that there are systematic di¤erences betweencash �ow sensitivity in Germany and the UK. One conclusion we could draw is that the UK�nancial system is less able to resolve asymmetric information problems and this createsgreater sensitivity to cash �ow as a result. There are however competing arguments thatwe would need to assess before we could draw this conclusion. The di¤erence in cash �owsensitivity could be caused by di¤erences in absolute or relative �rm sizes across countriessince UK �rms are typically smaller on average than the German �rms. If smaller �rmsare more �nancially constrained, then the UK �rms would show higher cash �ow sensitivitythan larger German �rms because of their size, irrespective of the fact that �nancial systemsare di¤erent. Another possibility is that the di¤erence could be a re�ection of industrialstructure, particularly if certain industrial sectors with greater investment intensity facemore exposure to changes in monetary policy through interest and credit channels in theUK than in Germany. Just as size could be responsible for the increased sensitivity of �rmsin one country (the UK) compared to another (Germany), so industrial features could alsobe the driving force. Finally, the creditworthiness of (at least some �rms in the UK sample)could cause a higher sensitivity for the UK sample. The next section tests these possibleexplanations of the cash �ow sensitivity of investment discovered in the full samples. Theseare based on industrial structure and size using appropriately constructed samples drawnfrom the UK and Germany to control for the competing views.
6In all our subsequent regressions for matched samples and split-samples we ran regressions to determinewhether cash �ow was a predictor of future sales growth. We have not reported these results in the paperbut in all cases we found that there was no explanatory power. Details are available from the authors onrequest.
17ECB
Working Paper Series No. 485May 2005

Table 2 - Investment and cash �ow sensitivity (full sample)Dependent variable It=Kt�1 Full Sample
Germany U.K.It�1=Kt�2 -0.51 (0.13)** -0.24 (0.11)*�yt 0.60 (0.17)** 0.67 (0.17)**�yt�1 0.62 (0.14)** 0.15 (0.12)(k � y)t�2 -0.59 (0.15)** -0.16 (0.11)CFt=Kt�1 -0.15 (0.16) -0.02 (0.16)CFt�1=Kt�2 -0.23 (0.12) 0.28 (0.09)**m1 -3.98 -6.07m2 -0.69 0.14Sargan p-value 0.64 0.65N obs 490 1230N �rms 145 378Dependent variable �ytIt�1=Kt�2 0.17 (0.43)** 0.17 (0.03)**It�2=Kt�3 0.06 (0.04) -0.02 (0.03)�yt�1 0.07 (0.06) 0.18 (0.03)�yt�2 -0.01 (0.05) 0.03 (0.03)CFt�1=Kt�2 0.12 (0.05)* 0.02 (0.03)CFt�2=Kt�3 -0.10 (0.05)* -0.10 (0.03)
Notes: Parameter estimates and robust standard errors from one-step Arrelano-Bond; year-dummies and constant included. Signi�cance reported at 1% (**), 5% (*) levels. Sargan test of over-identifying restrictions from two-step Arrelano and Bond estimates. Instruments set { It�2
Kt�3; It�3Kt�4
; It�4Kt�5
;
�yt�2;�yt�3;�yt�4;(k�y)t�2;(k�y)t�3;(k�y)t�4;CFt�2=Kt�3; CFt�3=Kt�4; CFt�4=Kt�5; timedummiesg:OLS sales regression.
4.3 Cash �ow sensitivity and �nancial system
The results reported in this section are derived from samples that control for size and in-dustrial activity by ensuring that the German and British �rms are closely matched. Theremaining di¤erences between them should not result from di¤erences in the size of �rms ortheir area of industrial activity. Having controlled for these features, we should �nd that ourearlier result that UK �rms are more sensitive to cash �ow than German �rms is upheld inthe matched samples if the nature of the �nancial system is the main determinant of cash�ow sensitivity.
From the full samples, two matched samples are constructed. The matching process isas follows. The �rms in each sample are divided into homogeneous industries (NACE - 3digit) and are then sorted according to size. The largest German �rm in a homogeneousindustry is then matched with the largest UK �rm in the same industry, the second largest is
18ECBWorking Paper Series No. 485May 2005

then matched with the second largest, and so on. We also insure that the �rms are observedduring the same years. This matching process leads to a sample of 528 �rm-year observationsfor both Germany and the UK and gives the closest matched sample that is possible whilestill maintaining a su¢ ciently large dataset to make inferences, given the speci�c de�nitionof an industry that we employ.7.
Table 3 shows the results for the matched German and UK samples. The results indicatethat there are no di¤erences in the response of investment to cash �ow in the matchedsamples. This is a striking result because it reverses the result reported in the previoussection for the full sample and suggests that there are not statistically signi�cant di¤erencesin the response to cash �ow once we have controlled for size and industrial activity. Inall other respects the matched sample results appear stronger than the full sample resultsbecause the estimated coe¢ cients on sales growth and the error correction term are largerin absolute value and have a higher level of statistical signi�cance, cash �ow excepted. Theequations also seem well speci�ed, since the error correction term is negative and signi�cantfor both samples, suggesting stabilizing feedback in investment dynamics for both countries.The most notable changes are to be found in the UK equation since far more UK �rmswere discarded on the grounds that they did not have a matching German company in thesample8.
The main result from these equations is that the coe¢ cient on the cash �ow variable inthe merged sample is now insigni�cant in both cases whereas previously it was a signi�cantdeterminant of corporate investment for the UK. This �nding is important because it suggeststhat the source of the di¤erence between the German and British �rms does not lie inthe orientation of the �nancial systems because we do not �nd evidence for di¤erences insensitivity once we control for size and industrial structure.
Having found that we can eliminate the distinction between UK and German �rms bycontrolling for �rm-size and industry by matching, this suggests that di¤erences between thetwo countries in one or both of these factors is potentially the source of the signi�cance ofcash �ow for investment in the full samples of randomly-selected data from each country.The change in the signi�cance of the cash �ow coe¢ cients between the full sample and thematched sample indicates that the full sample data set contains �rms that are in�uenced bycash �ow while the matched data set does not.
To con�rm this fact, we can attempt to reinstate the cash �ow sensitivity in the corporateinvestment equation for the UK by considering the �rms that were unmatched9. These �rms
7For our purpose we match on the third digit e.g. we have a matched UK and German �rms in NACE 15at the three digit level so that we pair �rm in industry 151 (production, processing and preserving of meatand meat products) etc.The summary statistics of the matched sample are in the appendix.
8The actual numbers indicate a reduction from 2103 �rm-observations for the UK to 528, compared witha reduction from 804 �rm-observations to 528 for Germany.
9Due to the fact that the German sample is smaller there are insu¢ cient unmatched �rms to examinethis hypothesis in the German case, but with the larger sample of UK �rms we are able to examine cash
19ECB
Working Paper Series No. 485May 2005

do not have a German counterpart in terms of size or industrial activity. When we examinethe sample of �rms that could not be matched we �nd that the unmatched �rms are sensitiveto cash �ow. Table 3 reports the responses to cash �ow for the unmatched sample of UK�rms in the �nal column and from these results we discover that cash �ow is again important.In fact the cash �ow variable is highly signi�cant at the 1% level, and has a similar coe¢ cientvalue to the full sample results for UK �rms. We can infer from this that characteristics inthe unmatched �rms are responsible for the cash �ow sensitivity in the full sample.
Table 3 - Investment and cash �ow sensitivityon matched versus unmatched samples
Dep. var. It=Kt�1 Matched Sample Unmatched SampleIt=Kt�1 Germany U.K. U.K.It�1=Kt�2 -0.72 (0.15)** -0.34 (0.15)* -0.24 (0.13)�yt 0.76 (0.20)** 0.63 (0.15)** 0.48 (0.18)**�yt�1 0.72 (0.20)** 0.45 (0.15)** 0.11 (0.14)(k � y)t�2 -0.73 (0.20)** -0.54 (0.17)** -0.12 (0.12)CFt=Kt�1 -0.22 (0.14) 0.15 (0.13) 0.08 (0.15)CFt�1=Kt�2 -0.14 (0.10) 0.04 (0.15) 0.29 (0.10)**m1 -3.30 -3.19 -5.54m2 0.38 0.14 -0.12Sargan p-value 0.43 0.22 0.6127N obs 314 314 916N �rms 97 97 281
Notes: Parameter estimates and robust standard errors from one-step Arrelano-Bond; year-dummies and constant included. Signi�cance reported at 1% (**), 5% (*) levels. Sargan test of over-identifying restrictions from two-step Arrelano and Bond estimates. Instruments set { It�2
Kt�3; It�3Kt�4
; It�4Kt�5
;
�yt�2;�yt�3;�yt�4;(k�y)t�2;(k�y)t�3;(k�y)t�4;CFt�2=Kt�3; CFt�3=Kt�4; CFt�4=Kt�5; timedummiesg
While the evidence in Table 2 might have been interpreted as an indication that certaincountries face more binding �nancial constraints than others, and these di¤erences mightalso be associated with the di¤erent �nancial systems in those countries (the UK beingrelatively market-oriented and Germany being more relationship-oriented), our results inTable 3 rule out this interpretation. Based on a closely-matched sample of �rms chosen tobe directly comparable Table 3 shows that there are no di¤erences in the response to cash�ow in the investment equations across countries compared to the full sample. The reasonswhy cash �ow is important for the full sample but not the closely-matched sample may liein the composition of the samples for each country with particular reference to the size and
�ow sensitivity of investment for the remaining sample of unmatched �rms.
20ECBWorking Paper Series No. 485May 2005

industrial structure. Systemic features like the prevalence of market- versus relationship-oriented �nancial systems are not responsible for the di¤erences in the impact of �nancialconstraints on investment.
In the next two sections we look at the varying responses of investment to cash �owwhen splitting sample according to size and industrial characteristics. If the response tocash �ow varies with size and industry-speci�c features then it strenghtens the argumentthat it is these features rather than �nancial system that explain the di¤erent sensitivitiesof investment to cash �ow between Germany and the UK.
4.4 Cash �ow sensitivity and size
The papers by Gertler and Gilchrist (1994) and Gilchrist and Himmelberg (1995) illustratethat small �rms are more sensitive to cash �ow than larger �rms. The theoretical argumentto support these empirical results is that larger �rms have greater access to external �nance,and particularly non-bank external �nance. In this section we split the sample of �rms in thefull sample on the basis of absolute and relative size to determine whether the responsivenessof corporate investment varies with that characteristic.
If there are di¤erences in the sensitivity between the small and large �rms within theUK or in Germany then it is most unlikely that the common �nancial system is responsiblefor the di¤erent responses to cash �ow. It is much more likely that absolute or relative size isresponsible for the di¤erences in the sensitivity to cash �ow. To the extent that di¤erencesexist between countries, such that one country has greater sensitivity to cash �ow thananother, this may arise from the dominance of sensitive types of �rms e.g. smaller �rmswithin the population of one country relative to another.
When we examine the behavior of �rms that are larger or smaller than the median (onthe basis of log real sales) for the UK and for Germany we discover that our earlier resultsare robust to sample splitting. In Table 4 the coe¢ cient for cash �ow in regressions for smalland large �rms in Germany is insigni�cant, giving a similar interpretation of no in�uence ofcash �ow on investment that we found before we split the sample on the basis of size10. Forthe UK the results indicate that cash �ow has a positive and signi�cant e¤ect on investmentfor large and small �rms, where the di¤erence is not statistically signi�cant, indicating thatcash �ow a¤ects investment for both classes of �rms as we found in the previous section.
This �nding is robust to the rede�nition of size based on the relative scale in the industry.Table 5 reports the results when we de�ne size in a relative sense by the ranking of the �rmwithin its industry. The results when we split the sample into relatively large and relativelysmall �rms on this basis give the same qualitative results as Table 4. 11
10In principal, size is also an endogenous characteristic of a �rm. So strictly speaking it should be treatedas a predetermined variable rather than a strict exogenous one on which one can do sample splits. Howeverin most �rm panels (as in ours) size of �rms changes only little from year to year and is a semi-permanentfeature of most �rms.11We do not report the results for the unmatched �rms because we do not have a su¢ ciently large sample
21ECB
Working Paper Series No. 485May 2005

Table 4 - Cash �ow sensitivity and absolute size (full sample)Dep. var. It=Kt�1 Germany U.K.
Large Firms Small Firms Large Firms Small FirmsIt�1=Kt�2 -0.64 (0.17)** -0.24(0.10)* -0.37 (0.13)** -0.18 (0.15)�yt 0.49 (0.16)** 0.47 (0.15)** 0.67 (0.14)** 0.21 (0.13)�yt�1 0.79 (0.18)** 0.28 (0.09)** 0.27 (0.14) 0.12 (0.16)(k � y)t�2 -0.64 (0.19)** -0.37 (0.10)** -0.32 (0.14)** -0.14 (0.17)CFt=Kt�1 -0.21 (0.21) -0.03 (0.18) 0.21 (0.18) 0.12 (0.12)CFt�1=Kt�2 -0.02 (0.16) -0.19 (0.10) 0.31 (0.13)* 0.21 (0.09)*m1 -3.08 -3.12 -3.95 -4.16m2 -0.60 -1.68 0.34 0.52Sargan 0.45 0.39 0.37 0.68N obs 249 241 617 613N �rms 73 72 188 190
Notes: Parameter estimates and robust standard errors from one-step Arrelano-Bond; year-dummies and constant included. Signi�cance reported at 1% (**), 5% (*) levels. Sargan test of over-identifying restrictions from two-step Arrelano and Bond estimates. Instruments set { It�2
Kt�3; It�3Kt�4
; It�4Kt�5
;
�yt�2;�yt�3;�yt�4;(k�y)t�2;(k�y)t�3;(k�y)t�4;CFt�2=Kt�3; CFt�3=Kt�4; CFt�4=Kt�5; timedummiesg:
Table 5 - Cash �ow sensitivity and relative size (full sample)Dep. var. Germany U.K.It/Kt�1 Large Firms Small Firms Large Firms Small FirmsIt�1/Kt�2 -0.51 (0.22)* -0.53(0.15)** -0.30 (0.15)* -0.28 (0.13)*�yt 0.69 (0.20)** 0.70 (0.12)** 0.45 (0.16)** 0.53 (0.15)**�yt�1 0.51 (0.23)* 0.69 (0.16)** 0.27 (0.15) 0.24 (0.15)(k-y)t�2 -0.56 (0.22)** -0.58 (0.19)** -0.26 (0.15)** -0.27 (0.15)CFt/Kt�1 -0.14 (0.20) -0.23 (0.16) 0.01 (0.16) 0.10 (0.16)CFt�1/Kt�2 -0.20 (0.17) -0.10 (0.11) 0.19 (0.09)* 0.28 (0.12)*m1 -3.33 -2.78 -3.88 -3.98m2 -1.21 1.37 -0.17 -0.49Sargan 0.50 0.75 0.61 0.55N obs 295 195 675 555N �rms 89 56 203 175
Notes: Parameter estimates and robust standard errors from one-step Arrelano-Bond; year-dummies and constant included. Signi�cance reported at 1% (**), 5% (*) levels. Sargan test of over-identifying restrictions from two-step Arrelano and Bond estimates. Instruments set { It�2
Kt�3; It�3Kt�4
; It�4Kt�5
;
of German �rms to give meaningful results, but the results for the UK unmatched �rms have a similarresponse to Tables 4 and 5 i.e. both small and large �rms are cash �ow sensitive.
22ECBWorking Paper Series No. 485May 2005

�yt�2;�yt�3;�yt�4;(k�y)t�2;(k�y)t�3;(k�y)t�4;CFt�2=Kt�3; CFt�3=Kt�4; CFt�4=Kt�5; timedummiesg:
A known feature of our two country samples is that German �rms are typically largerthan their UK counterparts. It is possible therefore that size could be the characteristic thataccounts for the di¤erence in the sensitivity to cash �ow reported in the previous sectionbetween the full sample and the matched sample. However, the fact that even large �rmsin the UK are sensitive to cash �ow indicates that size is not likely important. The resultsin this section are in line with the results in Chatelain et al (2003), von Kalckreuth (2003)and Devereux and Schiantarelli (1990). In comparing results from Austria, Belgium, France,Germany, Italy and Luxembourg Chatelain et al. (2003) state that size in itself does not seemto be su¢ cient to capture the presence of di¤erences in external �nance premia. Similarlyvon Kalckreuth (2003) �nds no di¤erences in cash �ow e¤ects when comparing large andsmall German �rms and argues that "being small is something essentially di¤erent frombeing badly rated and credit constrained in Germany ". Devereux and Schiantarelli (1990)using a UK sample and splitting the sample also according to absolute and relative size �ndno statistical di¤erence in cash �ow sensitivity between large and small �rms (although theyargue that based on the point estimates cash �ow "appears " to play a more importantrole for larger �rms). Size is likely to be correlated with industrial structure (Gertler andGilchrist, 1994). In the next section we look at industrial structure.
4.5 Cash �ow sensitivity and industrial structure
There is a growing body of evidence that shows monetary policy has di¤erent e¤ects onseparate industries (c.f. Ganley and Salmon (1997) for the UK and Hayo and Uhlenbrock(1999) for Germany) and on regions within countries (see Carlino and DeFina (1998) andPeersman and Smets, (2004)). Since industries may be concentrated within particular regionsor countries, the literature that documents industry and regional e¤ects may have discovereda potential cause of country di¤erences. Country e¤ects may be one re�ection of industrialcomposition. However, Dedola and Lippi (2004) have shown that when examining di¤eringelasticities of output in response to monetary policy by group e¤ects for industries andcountries, industry e¤ects dominate the country e¤ects. If the explanation for the di¤erencesbetween countries was due to industrial compositions, then industry-e¤ects should not bemore important than country-e¤ects, but this does not rule out that some of the di¤erencesbetween countries may re�ect composition e¤ects due to industrial structure. Some industriesmay face di¤erent �nancing constraints than others due to the scale of their investmentprojects, the competition within their industry or usefulness (resale value) of their collateral,but this is could be an important part of the puzzle over the role of cash �ow on investmentacross countries. In what follows we investigate these lines of inquiry.
As before we rely on sample-splitting strategy to determine whether industrial structureis the factor that determines cash �ow sensitivity. We identify several respects in which theindustrial classi�cations of our samples di¤er and evaluate in this section whether sample-
23ECB
Working Paper Series No. 485May 2005

splitting on the basis of these features gives rise to di¤erences in response to cash �ow. Weexpect on the basis of the papers discussed above that �rms that are �nal goods producersor in more open export-oriented or import-competing industries should not maintain theoriginal �ndings (i.e. they should have less cash �ow sensitivity even though we draw the �rmsfrom the full and the unmatched samples that previously demonstrated cash �ow sensitivity).
First we split the full UK and German samples into intermediate goods producers and�nal goods producers. We then compare the response of the cash �ow sensitivity in theinvestment equations for each sample. The calculation of the extent to which �rms are pro-ducers of intermediate or �nal goods is based on the share of total industry output that isan intermediate input by industry using the input-output tables for each country. We areable to do this at the NACE 3 level for the UK, and at the NACE 2 level for Germany.After ranking the industries by the proportion of the output that is an intermediate input toanother industry we can identify the industries where �nal goods production exceeds inter-mediate goods production by separating the industries at the 50% mark.12 The investmentequations for �nal goods producers and intermediate goods producers are reported in Table6.
For UK industries, there is no di¤erence between intermediate and �nal goods producers�sensitivity to cash �ow in investment equations - both are sensitive to cash �ow - while forGerman industries, both intermediate goods and �nal producers are not sensitive to cash �ow,con�rming the full sample result. While there are clear di¤erences in the sensitivity to cash�ow between countries, as before, the sensitivity does not alter according to this industrialcharacteristic. This is despite the fact that many of our intermediate goods producers arefound in the durable and heavy industrial goods category that were more investment intensiveand were expected to show greater sensitivity than the lighter industries ( Ganley and Salmon(1997), Dedola and Lippi (2004), Hayo and Uhlenbrock (2000) and Peersman and Smets(2004)). Our cross-country evidence does not pick up a consistent pattern of sensitivities forthese types of industries
12We want to be able to make inferences on the split samples. The constraints we face is to have enoughobservations in all 4 subsamples. We also want to use the sample split-o¤ point for both the UK andGermany. Therefore the 50% mark is chosen so that we approximately split the German and UK samples,simultaneously, into two equally sized samples.
24ECBWorking Paper Series No. 485May 2005

.
Table 6 - Cash �ow sensitivity for intermediateversus �nal goods producers (full sample)Germany UKinter. goods �nal goods inter. goods �nal goods
It�1=Kt�2 -0.38 (0.15)* -0.25 (0.16) -0.32 (0.12)* -0.27 (0.17)�yt 0.41 (0.17)* 0.06 (0.18) 0.54 (0.17)** 0.28 (0.15)�yt�1 0.42 (0.15)** 0.32 (0.17) 0.28 (0.13)* 0.20 (0.22)(k � y)t�2 -0.32 (0.18) 0.35 (0.18) -0.26 (0.13)* -0.28 (0.20)CFt=Kt�1 -0.22 (0.13) -0.09 (0.19) 0.07 (0.15) 0.22 (0.17)CFt�1=Kt�2 -0.15 (0.12) -0.04 (0.11) 0.21 (0.10)* 0.23 (0.10)*N obs 205 285 746 484N �rms 63 82 228 150m1 -3.61 -3.07 -4.64 -4.08m2 -0.47 -0.13 -0.8 1.01Sargan p value 0.53 0.15 0.78 0.09
Notes: Parameter estimates and robust standard errors from one-step Arrelano-Bond; year-dummies and constant included. Signi�cance reported at 1% (**), 5% (*) levels. Sargan test of over-identifying restrictions from two-step Arrelano and Bond estimates. Instruments set { It�2
Kt�3; It�3Kt�4
; It�4Kt�5
;
�yt�2;�yt�3;�yt�4;(k�y)t�2;(k�y)t�3;(k�y)t�4;CFt�2=Kt�3; CFt�3=Kt�4; CFt�4=Kt�5; timedummiesg:
25ECB
Working Paper Series No. 485May 2005

Table 7 -Cash �ow sensitivity for open versusclosed industries (full samples)
Germany UKImports import non import import non import
-competing -competing -competing -competingIt�1=Kt�2 -0.50 (0.8)** -0.38 (0.15)** -0.35 (0.11)** -0.33 (0.13) *�yt 0.53 (0.18)** 0.39 (0.16)* 0.63 (0.14)** 0.42 (0.12)**�yt�1 0.25 (0.12)* 0.55 (0.15)** 0.37 (0.13)** 0.12 (0.16)(k � y)t�2 0.28 (0.15) � -0.34 (0.12) ** -0.24 (0.17)CFt=Kt�1 -0.16 (0.15) 0.15 (0.21) 0.01 (0.12) 0.20 (0.16)CFt�1=Kt�2 0.05 (0.15) -0.28 (0.14)* 0.12 (0.08) 0.32 (0.12)**m1 -3.49 -2.99 -3.97 -4.65m2 -0.74 -0.32 0.15 -0.48Sargan 0.79 0.54 0.47 0.15N obs 177 313 662 568N �rms 55 90 203 175Exports export domestic export domestic
-oriented -oriented -oriented -orientedIt�1=Kt�2 -0.49 (0.12)** -0.35 (0.14)* -0.42 (0.12)** -0.36 (0.13)**�yt 0.47 (0.13)** 0.31 (0.16) 0.58 (0.15)** 0.46 (0.12) **�yt�1 0.52 (0.14)** 0.40 (0.14)** 0.45 (0.14)** 0.19 (0.16)(k � y)t�2 -0.41 (0.15)** -0.50 (0.14)** -0.47 (0.13)** -0.26 (0.15)CFt=Kt�1 -0.17 (0.10) -0.08 (0.25) -0.09 (0.15) 0.17 (0.12)CFt�1=Kt�2 0.04 (0.12) -0.01 (0.13) 0.12 (0.08) 0.27 (0.12)*m1 -3.70 -2.73 -3.43 -4.45m2 -0.61 -0.37 0.24 -0.47Sargan 0.66 0.96 0.48 0.19N obs 319 171 578 652N �rms 95 50 176 202
Notes: Parameter estimates and robust standard errors from one-step Arrelano-Bond; year-dummies and constant included. Signi�cance reported at 1% (**), 5% (*) levels. Sargan test of over-identifying restrictions from two-step Arrelano and Bond estimates. Instruments set { It�2
Kt�3; It�3Kt�4
; It�4Kt�5
;
�yt�2;�yt�3;�yt�4;(k�y)t�2;(k�y)t�3;(k�y)t�4;CFt�2=Kt�3; CFt�3=Kt�4; CFt�4=Kt�5; timedummiesg:
Second, we compare the impact of openness using a similar sample-splitting strat-egy, ranking industries by the share of total production derived from imports (import-competing industries versus non-import-competing industries) and exports (export-orientedversus domestically-oriented industries). We again use the input-output tables to calculatethese shares and take our cut-o¤ levels at 25% to de�ne import intensive industries andexport intensive industries. We expect that �rms in more closed industries that are less
26ECBWorking Paper Series No. 485May 2005

dependent on demand from foreign countries are more tied to the domestic cycle than �rmsin more open industries. These industries should be more sensitive to domestic monetarypolicy through the interest channel, and through the �nancial accelerator e¤ect may becomemore sensitive to cash �ow as their eligibility for external �nance deteriorates.We �nd support for this argument for the UK. The non-import-competing and domestically-
oriented industries are more sensitive to cash �ow. However in Germany, again none of thefour subsamples shows sensitivity to cash �ow (with a strange exception of a negative sen-sitivity for the non-import-competing industry.) Thus we do �nd results that are consistentwith the idea that openness to imports or orientation towards exports has some importancefor the sensitivity of cash �ow in investment equations at least in the UK.
Taking into account the industrial features that might predispose investment in an in-dustry to be more responsive to cash �ow does not reveal the consistent results we wouldexpect across countries if these characteristics were the driving process for the investment-cash �ow relationship. Instead what we �nd is that the intermediate-�nal goods producerdistinction hardly matters at all, and that German industry exhibits a consistent insensi-tivity to cash �ow across any split in the sample that is undertaken on industrial grounds.This downgrades much of the evidence that these industrial features are responsible for thedi¤erences in the response to cash �ow.
4.6 Cash �ow sensitivity and creditworthiness
The sample splits according to structural features (size and industry characteristics) did noshow consistent results across Germany and the UK. This casts doubt on the thesis thatstructural features are determinants of cash �ow sensitivity and hence �nancing constraints.In this section we check whether the previous sample splits were implicitely dividing �rmsalong the dimension of creditworthiness. Cleary (1999) shows that on the basis of a discrim-inant analysis two indicators of creditworthiness, namely sales growth and net pro�t margin,were the most signi�cant. Following Cleary (1999), we use sales growth and operating prof-its (as a percentage of the capital stock) as indicators of creditworthiness for sub-samples of�rms such as small versus large �rms, intermediate versus �nal goods producing industriesetc. Due to the endogenous nature of sales growth and net pro�t margin we cannot use thesame sample splitting methodology to compare the responses to cash �ow in sub-samples.Instead we calculate the average performance in terms of these creditworthiness variablesfor our previous sub-samples i.e. small versus large �rms, intermediate versus �nal goodsproducers etc. We then perform a t-test of the signi�cance of the di¤erence in average salesgrowth and operating pro�ts within countries across sample splits. If creditworthiness byindustry is the key driver of the relationship between investment and �nancial constraintsthen there will be noticeable di¤erences in the signi�cance of coe¢ cients across sample splitswithin countries indicating that sensitivities to cash �ow are the result of balance sheetconsiderations. We would expect that these results would be consistent irrespective of the
27ECB
Working Paper Series No. 485May 2005

indicator of creditworthiness that we use. Table 8 reports the results.Table 8 -Tests of signi�cant di¤erences in creditworthiness
Germany UK
Sales growth oper. pro�ts ^ Sales growth oper. pro�ts ^
Large vs. small (absolute) 0.02 (0.01) -0.01 (0.02) 0.00 (0.01) 0.01 (0 .01)
Large vs. small (relative) -0.01 (0.01) 0.01 (0.02) 0.00 (0.01) -0.01 (0.01)
interm vs. �nal -0.01 (0.01) -0.05 (0.02)** 0.00 (0.01) 0.00 (0.01)
import-comp vs. non import comp 0.01 (0 .01) -0.03 (0.02) 0.01 (0 .01) 0.03 (0.01)**
export-oriented vs. dom. oriented 0.03 (0.01)** -0.07 (0.02)** 0.02 (0.01)** 0.04 (0.01)**
^Operating pro�ts as a percentage of the capital stock.
The table reports the di¤erence in average sales growth and operating pro�ts with standard errors in brackets
For Germany, when splitting samples, none of the sub-samples of industries or sizeclasses has a better performance on both average sales growth and average pro�ts relativeto the counterpart sub-sample. For instance, large versus small �rms show the same per-formance. The export-oriented industry has a better performance on sales growth but aworse performance on operating pro�ts. Insigni�cant di¤erences and absence of cash �owsensitivity in Germany across sample splits are consistent with the absence of signi�cantcreditworthiness di¤erences.
In the UK however, the �nding on the lower sensitivity of export oriented industriesis con�rmed with better performance on both average sales growth and operating pro�ts.The �nding on the lower sensitivity of the import-competing industries is con�rmed by thebetter performance on the operating pro�ts (but the average sales growth is not signi�cantlydi¤erent)
A consistent pattern emerges across countries and across industries that identi�es thoseindustries with higher proportions of �rms with lower sales growth and lower levels of oper-ating pro�ts (i.e. worse performance on both measures of creditworthiness at the same time)to be more sensitive to cash �ow. While there is more robust evidence to support creditwor-thiness arguments elsewhere, we demonstrate here that while the structural interpretationsof di¤erent cash �ow sensitivities can be rejected using our panels of British and German�rms, the creditworthiness interpretation cannot be dismissed so easily 13. We conclude fromthis that the balance sheet channel proposed by Bernanke and Gertler (1989) and Bernankeat al. (1996, 1999) receives some support, since ultimately indicators of creditworthiness atthe industry level is associated with the extent to which a �rm depends on internal �nanceto fund investment.13Our results contrasts with the results of Clearly who �nds that �rms with high �nancial health were
more sensitive to the available funds than less creditworthy �rms. However, it is possible that Cleary resultcan be explained by �rms in �nancial distress. These �rms are restricted to use cash �ow for investmentpurposes by debt covenant imposed by bond holders or banks, implying a lower sensitivity of investment tocash �ow. This critique has also been given by Fazzari et al (2000) to the Kaplan and Zingales results (1997)
28ECBWorking Paper Series No. 485May 2005

5 Conclusions
Much of the puzzle over the driving forces behind the relationship between cash �ow andinvestment arises from the correlation between indicators of �nancial structure, industrialstructure, size and creditworthiness. Many of these indicators are good proxies for theothers and therefore can easily be confused empirically as drivers of the investment-cash�ow relationship. The purpose of this paper is to suggest one means of discriminatingbetween them by underscoring the importance of appropriate sample selection when doingcomparative studies of corporate investment and �nancial constraints across countries. Wetake pains to ensure we make fair comparisons across countries by controlling for di¤erencesbetween countries and within samples.
Some samples of our data can provide evidence that is consistent with the idea that �rmsin more market-oriented �nancial systems such as the UK have greater cash �ow sensitivitythan �rms in more relationship-oriented systems such as Germany. But this evidence isdrawn from samples where no particular attention is given to selecting �rms on the basisthat they are comparable in terms of size and industrial activity. When we select our sampleto ensure comparability we can show that this is a sample-speci�c result; and one that canbe overturned by taking samples that control for industry and size to ensure that the �rmsdrawn from each country are as similar as possible. In this case we �nd there is no di¤erencein sensitivity to cash �ow in each country, so that once comparability is made the basis forselection there is no di¤erence in the sensitivity of German or British �rms to cash �ow andtherefore no reason to suppose that the �nancial systems of each country are responsible forthe di¤erences in cash �ow sensitivity of investment.
The same argument is taken further to explore other potential drivers such as �rmsize or industrial structure. We �nd, after controlling for other determinants of cash �owsensitivity, that neither absolute or relative size, nor the type of industrial structure underwhich the �rms operate, such as openness to import competition or orientation to exportmarkets, or production of �nal versus intermediary goods drives the investment-cash �owrelationship. Instead we present new results to demonstrate that industries in which ahigher proportion of �rms with high sales growth and operating pro�ts (i.e. those withobservable high performance) are insensitive to cash �ow, while industries where a higherproportion of �rms are observably performing less well are more sensitive to cash �ow. It isreasonable to suppose that �rms in industries with healthy �nancial performance have lessdi¢ culty obtaining external funds and therefore are relatively less sensitive to the availabilityof internal �nance when undertaking investment. We conclude that it is the performance ofcertain types of industries, in terms of sales and pro�ts, that opens up access for �rms inthose industries to external �nance, and this in turn reduces dependence of investment oncash �ow.
29ECB
Working Paper Series No. 485May 2005

References
[1] Allayannis, George and Abon Muzumdar (2004), �The Impact of Negative Cash Flowand In�uential Observations on Investment-Cash Flow Sensitivity Estimates�, Journalof Banking and Finance, 28, 901-930.
[2] Allen, Franklin and Douglas Gale (2000), Comparing Financial Systems, MIT Press,Cambridge MA.
[3] Arrelano, Manuel and Stephen Bond (1991), �Some Tests of Speci�cation for PanelData: Monte Carlo Evidence and an Application to Employment Equations�, Reviewof Economic Studies, 58, 277-297.
[4] Barth, Marvin J. and Valerie A. Ramey (2000), �The Cost Channel of Monetary Trans-mission�, NBER working paper 7675.
[5] Bean, Charles (1981), �An Econometric Model of Manufacturing Investment in theUK�, Economic Journal, 91, 106-121.
[6] Bernanke, Ben S. and Mark Gertler (1989), �Agency Costs, Net Worth and BusinessFluctuations�, American Economic Review 79, 14-31.
[7] Bernanke, Ben S., Mark Gertler and Simon Gilchrist (1996), �The Financial Acceleratorand the Flight to Quality�, Review of Economics and Statistics 78, 1-15.
[8] Bernanke, Ben S., Mark Gertler and Simon Gilchrist (1999), �The Financial Acceleratorin a Quantitative Business Cycle Framework�, in Handbook of Macroeconomics, VolumeI, John.B. Taylor and Michael Woodford (Eds) North Holland, Amsterdam.
[9] Bond Stephen, and Jason G. Cummins (2001), �Noisy Share Prices and the Q Modelof Investment�, Institute for Fiscal Studies discussion paper no. 22.
[10] Bond, Stephen, Julie Ann Elston, Jacques Mairesse and Benoit Mulkay (2003) ,�Finan-cial Factors and Investment in Belgium, France, Germany, and the United Kingdom:A Comparison Using Company Panel Data�, Review of Economics and Statistics, 85,153-165.
[11] Caballero, Ricardo, Eduardo Engel and John Haltiwanger (1995), �Plant Level Adjust-ment and Aggregate Investment Dynamics�, Brookings Papers on Economic Activity,2, 1-54.
[12] Calomiris, Charles and R. Glenn Hubbard (1995), �Internal Finance and Firm-Level In-vestment: Evidene from the Undistributed Pro�ts Tax of 1894-1909�, Quarterly Journalof Economics, 104, 429-52.
30ECBWorking Paper Series No. 485May 2005

[13] Carlino, Gerald and Robert DeFina (1998), �The Di¤erential Regional E¤ects of Mon-etary Policy�, Review of Economics and Statistics 80, 572-587.
[14] Chatelain, Jean-Bernard, Michael Ehrmann, Andrea Generale, Jorge Martinez-Pages,Philip Vermeulen and Andreas Worms (2003), �Monetary Transmission in the EuroArea: New Evidence from Micro Data on Firms and Banks�, Journal of the EuropeanEconomic Association, 1, 731-742.
[15] Chirinko, Robert and Schaller Huntley (1995), �Why does Liquidity matter in Invest-ment Equations�, Journal of Money, Credit and Banking, Vol 27, no 2, 527-547.
[16] Chirinko, Robert (1997), �Finance Constraints, Liquidity, and Investment Spending:Theoretical Restrictions and International Evidence�, Journal of the Japanse and In-ternational Economies, Vol 11, 185-207.
[17] Cleary, Sean (1999), �The Relationship Between Firm Investments and Financial Sta-tus�, Journal of Finance, 54, 673-92.
[18] Cummins Jason G., Kevin Hasset and Stephen R. Oliner (1999), �Investment Behav-ior, Observable Expectations, and Internal Funds�, Board of Governors of the FederalReserve System, Finance and Economics Discussion Paper Series No. 99/27.
[19] Dedola, Luca and Francesco Lippi (2005), �The Monetary Transmission Mechanism:Evidence from the Industry Data of Five OECD Countries�, forthcoming EuropeanEconomic Review.
[20] Devereux Michael and Fabio Schiantarelli (1990), �Investment, �nancial factors, andcash �ow: evidence from UK Panel data�, in Assymetric Information, Corporate Fi-nance and Investment, ed. R. G. Hubbard , Chicago, University Press. 279-306.
[21] Eichenbaum, Martin (1994), �Comment�in Monetary Policy: Studies in Business Cy-cles, Greg Mankiw (Ed) University of Chicago Press, Chicago IL.
[22] Fazzari, Steven M., Glenn R. Hubbard and Bruce C. Petersen (1988), �Financing Con-straints and Corporate Investment.�Brookings Papers on Economic Activity, 1, 141-195.
[23] Fazzari, Steven M., Glenn R. Hubbard , and Bruce C. Petersen (2000), �Investment-Cash �ow Sensitivities are useful: a Comment on Kaplan and Zingales�, The QuarterlyJournal of Economics, May, 695-705.
[24] Ganley, Joe and Salmon, Chris (1997), �The Industrial Impact of Monetary PolicyShocks: Some Stylised Facts�, Bank of England working paper 68.
[25] Gertler, Mark (1988), �Financial Structure and Aggregate Economic Activity : AnOverview�, Journal of Money, Credit, and Banking, 20, 559-588.
31ECB
Working Paper Series No. 485May 2005

[26] Gertler, Mark and Simon Gilchrist (1994),�Monetary Policy, Business Cycles, and TheBehavior of Small Manufacturing Firms�, Quarterly Journal of Economics, 109, 309-340.
[27] Gilchrist, Simon and Charles P. Himmelberg (1995), �Evidence on the Role of CashFlow for Investment.�, Journal of Monetary Economics, 36, 541-572.
[28] Hayo, Bernd and Birgit Uhlenbrock (2000), �Industry E¤ects of Monetary Policy inGermany�, Regional Aspects of Monetary Policy in Europe Juergen von Hagen and CWaller (Eds), 127-158.
[29] Hu, Xiaoqiang and Fabio Schiantarelli (1998), �Investment and Capital Market Imper-fections: A Switching Regression Approach Using U.S. Firm Panel Data.�Review ofEconomics and Statistics, 80, 466-479.
[30] Hubbard, R. Glenn (1998), �Capital-Market Imperfections and Investment�Journal ofEconomic Literature, 36, 193-225.
[31] Hubbard, R. Glenn Anil K. Kashyap and Toni M. Whited (1995), �Internal Financeand Firm Investment.�, Journal of Money, Credit and Banking, 27, 683-701.
[32] Kaplan, Steven N. and Luigi Zingales (1997), �Do Investment Cash Flow SensitiveProvide Useful Measure of Financing Constraints?�, Quarterly Journal of Economics,112, 169-215.
[33] Kaplan, Steven N. and Luigi Zingales (2000), �Investment-Cash Flow Sensitivities AreNot Valid Measures of Financing Constraints�, Quarterly Journal of Economics, 115,707-712
[34] Mairesse, Jacques and Brigitte Dormont (1985), �Labor and investment demand atthe �rm level: A comparison of French, German and US Manufacturing 1970-1979�,European Economic Review, 28,201-231.
[35] Mairesse, Jacques, Bronwyn H. Hall, and Benoit Mulkay (1999), �Firm-level investmentin France and the United States:An exploration of what we have learned in Twentyyears�, Annales d�Economie et de Statistique 55/66, 27-67.
[36] Oliner, Stephen R and Glenn D. Rudebusch (1996), �Monetary Policy and Credit Con-ditions: Evidence from the Composition of External Finance: Comment�, AmericanEconomic Review, 86, 300-309.
[37] Peersman, Gert and Frank Smets (2005), �The Industry E¤ects of Monetary Policy inthe Euro Area�, Economic Journal, forthcoming.
32ECBWorking Paper Series No. 485May 2005
[38] Rajan, Raghuram, G. and Luigi Zingales (2003), �Banks and Mergers: The ChangingCharacter of European Finance�, NBER working paper no 9595, March 2003.
[39] Schaller, Huntley (1993), �Asymmetric Information, Liquidity Constraints and Cana-dian Investment�, Canadian Journal of Economics, 26, 552-574.
[40] Vermeulen, Philip (2002), �Business Fixed Investment: Evidence of a Financial Accel-erator in Europe�, Oxford Bulletin of Economics and Statistics,64,217-235.
[41] von Kalckreuth, Ulf (2003), �Investment and monetary transmission in Germany: amicroeconometric investigation�, in Monetary Policy Transmission in the Euro Area,Ignazio Angeloni, Anil Kashyap, Benoit Mojon (eds.)
33ECB
Working Paper Series No. 485May 2005
6 Appendix
6.1 Data Sources
The primary source of the data is the AMADEUS database from Bureau Van Dijk. We use thefollowing two releases: the CD-rom June 2001 and the CD-rom September 1997. The databaseincludes �rm balance sheet and pro�t and loss information. We only select �rms that have consol-idated data; this means that data are all on the group level ( capital stock, assets, turnover, etc.)This makes our study more comparable with US studies based on Compustat, which also reportsconsolidated data. In addition unconsolidated accounts can give a very misleading picture of thetrue nature of the �rm. It is customary that the output of a large �rm is usually produced overmultiple plants, each (or a few taken together) with own legal identity and own unconsolidatedaccount. For instance, BASF AG, has a consolidated turnover of around 30 billion euro, whereit has an unconsolidated one of around 11 billion euro. Second, the true �nancial boundaries ofthe �rms are the group not the individual plants. For instance for investment purposes, cash �owgenerated by one plant can easily be transferred to other plants. For each �rm and each year,we extract from the database turnover, pro�t/loss, operating results, deprecation and book valueof �xed capital and nace-2 and 3 digit code. We de�ne nominal cash �ow as pro�t/loss plusdepreciation.
6.2 Variable Construction
We de�ne nominal operating pro�ts as operating results + depreciation. We de�ate turnover,nominal cash �ow and nominal operating pro�ts by the industry output de�ator. The industryoutput de�ators at the 2 digit NACE level are obtained from the UK O¢ ce for National Statisticsand Statistisch Bundesambt Deutschland. ( The UK series are: PP Indices MM22, Table 2: Priceindices of UK output all manufacturing and selected industries- SIC (92). The German seriesare Segment 3783 Index der Erzeugerpreise gewerblicher Produkte(1995=100) : insgesamt, nachGütergruppen, -Zweigen, -Klassen und-Arten des GP, Ausgabe 1995(Deutschland) (1994 bis 2002).
Nominal investment NIt+1of year t+1 is constructed as the di¤erence between book value of�xed capital of (end of) year t+1 and end of year t adding depreciation of year t+1. De�atorsof nominal investment are constructed from current and constant prices investment series at theindustry level (for the UK: Business investment (release of the UK statistical o¢ ce), revised results-2nd quarter 2002) (For Germany: Segment 7721 Bruttoanlageinvestitionen(in jeweiligen Preisen),Segment 7724 Bruttoanlageinvestitionen(in Preisen von 1995).
The real capital stock Kt is constructed using the traditional perpetual inventory method.Since the book values of �xed capital for the �rst year of observation for each �rm are at historicalprices we multiply the initial book value of �xed capital by a factor to account for historical in�ationto get replacement values (i.e. price at time t) for the initial value of the capital stock. The capital(end of period) of future years is then obtained by the perpetual inventory formula
34ECBWorking Paper Series No. 485May 2005

Kt+1 = (1� �)Kt +NIt+1Pit+1
Intermediate goods versus �nal goods industries. For the UK industries we refer to the NACE3 level of industrial classi�cation. The demand for industry output by other industries (ID) iscalculated less the demand from the same industry (OD), hence total demand for the output byother industries is calculated by subtracting own demand on the diagnonal of the input-outputtable (ID-OD). This intermediate demand is divided by total domestic output (DY) taken from theUK 1995 input-output table. All �gures are in 1995 basic prices in sterling millions. The �guresare converted to a percentage and are ranked. The industries with the largest share of intermediatedemand to total output are regarded as intermediate good producing industries, and those withthe smallest share are the �nal good producing industries. The cut o¤ value is 50% to re�ect thefact that for �rms below the cut o¤ the majority of the �rms�output is destined for intermediateconsumption, and for those above the majority is destined for �nal consumption. Hence
100*(M/Y)> 50% �nal good producing industries100*(M/Y)<= 50% intermediate good producing industriesFor the German industries the same procedure is followed at the NACE 2 level of industrial
classi�cation (NACE 3 being unavailable). The data for intermediate demand is taken from the use1995 table and domestic output is taken from the domestic 1995 table of the input-output tablefor 1995. Figures are in 1995 basic prices in euro millions.
Recalculations using total output (Y), which is the sum of domestic output (DY) plus im-ports (M = MEU+MNEU) did not signi�cantly alter the rank orderings and the divide betweenintermediate and �nal goods producing industries was unchanged for both countries.
Import-intensive versus non-import intensive industries. For the UK industries we refer to theNACE 3 level of industrial classi�cation. The data on import-intensity are derived by summingthe imports (M) from the EU (MEU) and non-EU (MNUE) countries. Imports are divided by thetotal output of the industry (Y) which is the sum of total domestic output (DY) plus imports (M= MEU+MNEU) taken from the UK 1995 input-output table. All �gures are in 1995 basic pricesin sterling millions. The �gures are converted to a percentage and are ranked. The industries withthe largest share of imports to total output are regarded as import-intensive industries, and thosewith the smallest share are the non-import intensive industries. The measure of import-intensiveand non-import-intensive industries is a relative measure, and to capture this fact we set the cuto¤ value at 25% to split the sample with an indication of relative exposure to imports. Hence
100*(M/Y)> 25% import intensive100*(M/Y)<= 25% non import intensiveFor the German industries the same procedure is followed at the NACE 2 level of industrial
classi�cation (NACE 3 being unavailable). The data for imports and output are taken from thesupply95 table of the input-output table for 1995. Figures are in 1995 basic prices in euro millions.Imports are calculated on a carriage, insurance and freight (c.i.f.) basis.
Export-oriented versus domestically-oriented industries.For UK industries we refer to theNACE 3 level of industrial classi�cation. The data on orientation of sales are derived by cal-culating the exports (X) as the sum of the EU (XEU) and non-EU (XNUE) exports taken from
35ECB
Working Paper Series No. 485May 2005

the UK input-output table for 1995. The total export �gure is divided by the total output of theindustry (Y), which is the sum of domestic output (DY) plus imports (M = MEU+MNEU). All�gures are in 1995 basic prices in sterling millions. The �gures are converted to a percentage andare ranked. The industries with the largest share of exports to total output are regarded as export-oriented industries, and those with the smallest share are the domestic-oriented industries. Asabove, the measure of export-oriented and domestic-oriented is a relative measure, and to capturethis fact we set the cut o¤ value at 25% to split the sample with an indication of relative orientationto exports. Hence
100*(X/Y)> 25% export-oriented100*(X/Y)<= 25% domestic-orientedFor the German industries the same procedure is followed at the NACE 2 level of industrial
classi�cation(NACE 3 being unavailable). The data for output is taken from the supply95 tableand data for exports is taken from the use1995 table of the input-output table for 1995. Figuresare in 1995 basic prices in euro millions. Exports are calcualted on a free on board (f.o.b.) basis
6.3 Summary Statistics of Matched and Unmatched Samples
The summary statistics of the matched samples are given in Table A.1. Again the matched Germanand the matched UK sample are very much alike, and the matched sample statistics do not seemto be particularly di¤erent from the full sample statistics. A potential problem of matchingcould be that one incurs a big loss in terms of the numbers of sub-industries in manufacturing.This does not happen in our sample because Germany and the UK both have a broad base ofmanufacturing. The matched sample is diverse in terms of number of di¤erent 3-digit NACEindustries since the matched sample contains �rms from 41 di¤erent NACE three digit industries,where no single industry dominates the sample14. Table A.1 also provides the summary statistics ofthe �rms without a match. Again the summary statistics of the unmatched samples are relativelysimilar across countries and relatively similar to the full sample statistics.We conclude that, thefull, matched and unmatched samples look very much alike in terms of the levels and standarddeviations of the variables. If we �nd di¤erences accross sample in the estimation results, it has tobe due to other reasons than the level of the variables themselves.14The largest number of �rm-year observations are from the manufacture of beverages industry
(NACE 159), 8.9 %, the second largest is the manufacture of other special purpose machinery(NACE 295) 7.6%, the third largest is the manufacturing of machinery for the production and useof mechanical power (NACE 291) 7%.
36ECBWorking Paper Series No. 485May 2005
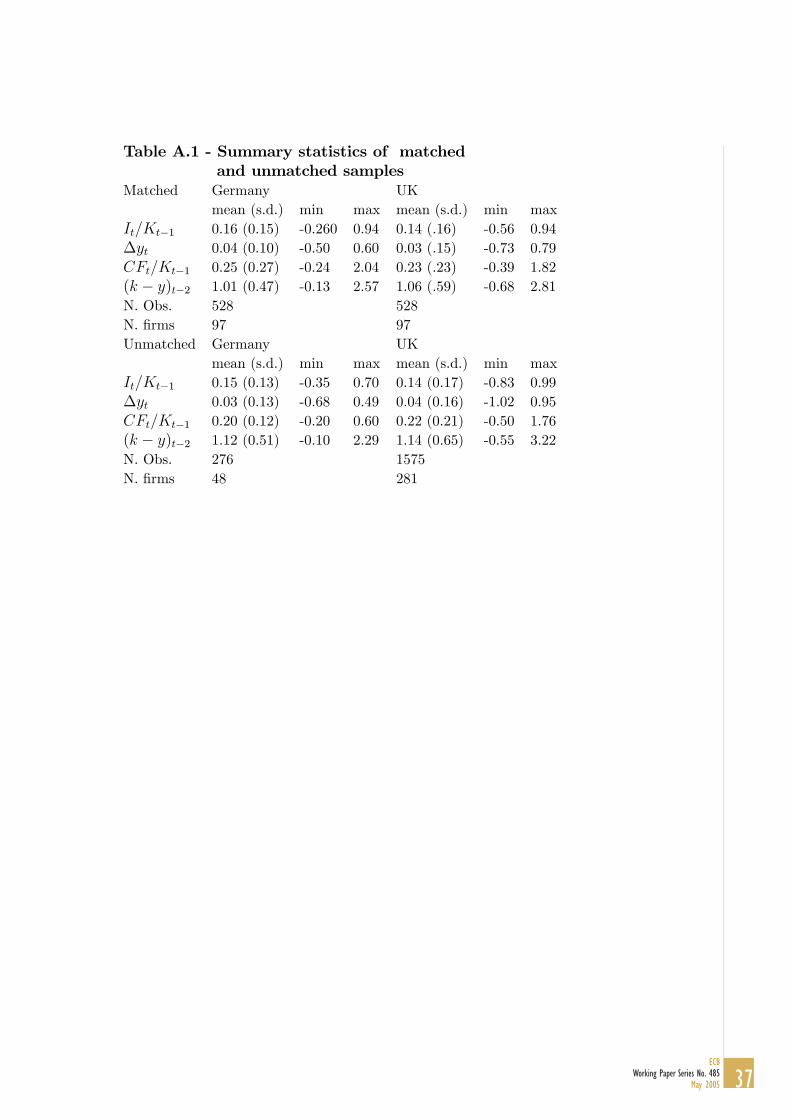
Table A.1 - Summary statistics of matchedand unmatched samples
Matched Germany UKmean (s.d.) min max mean (s.d.) min max
It=Kt�1 0.16 (0.15) -0.260 0.94 0.14 (.16) -0.56 0.94�yt 0.04 (0.10) -0.50 0.60 0.03 (.15) -0.73 0.79CFt=Kt�1 0.25 (0.27) -0.24 2.04 0.23 (.23) -0.39 1.82(k � y)t�2 1.01 (0.47) -0.13 2.57 1.06 (.59) -0.68 2.81N. Obs. 528 528N. �rms 97 97Unmatched Germany UK
mean (s.d.) min max mean (s.d.) min maxIt=Kt�1 0.15 (0.13) -0.35 0.70 0.14 (0.17) -0.83 0.99�yt 0.03 (0.13) -0.68 0.49 0.04 (0.16) -1.02 0.95CFt=Kt�1 0.20 (0.12) -0.20 0.60 0.22 (0.21) -0.50 1.76(k � y)t�2 1.12 (0.51) -0.10 2.29 1.14 (0.65) -0.55 3.22N. Obs. 276 1575N. �rms 48 281
37ECB
Working Paper Series No. 485May 2005
38ECBWorking Paper Series No. 485May 2005
European Central Bank working paper series
For a complete list of Working Papers published by the ECB, please visit the ECB’s website(http://www.ecb.int)
435 “Reforming public expenditure in industrialised countries: are there trade-offs?”by L. Schuknecht and V. Tanzi, February 2005.
436 “Measuring market and inflation risk premia in France and in Germany”by L. Cappiello and S. Guéné, February 2005.
437 “What drives international bank flows? Politics, institutions and other determinants”by E. Papaioannou, February 2005.
438 “Quality of public finances and growth” by A. Afonso, W. Ebert, L. Schuknecht and M. Thöne,February 2005.
439 “A look at intraday frictions in the euro area overnight deposit market”by V. Brousseau and A. Manzanares, February 2005.
440 “Estimating and analysing currency options implied risk-neutral density functions for the largestnew EU member states” by O. Castrén, February 2005.
441 “The Phillips curve and long-term unemployment” by R. Llaudes, February 2005.
442 “Why do financial systems differ? History matters” by C. Monnet and E. Quintin, February 2005.
443 “Explaining cross-border large-value payment flows: evidence from TARGET and EURO1 data”by S. Rosati and S. Secola, February 2005.
444 “Keeping up with the Joneses, reference dependence, and equilibrium indeterminacy” by L. Straccaand Ali al-Nowaihi, February 2005.
445 “Welfare implications of joining a common currency” by M. Ca’ Zorzi, R. A. De Santis and F. Zampolli,February 2005.
446 “Trade effects of the euro: evidence from sectoral data” by R. Baldwin, F. Skudelny and D. Taglioni,February 2005.
447 “Foreign exchange option and returns based correlation forecasts: evaluation and two applications”by O. Castrén and S. Mazzotta, February 2005.
448 “Price-setting behaviour in Belgium: what can be learned from an ad hoc survey?”by L. Aucremanne and M. Druant, March 2005.
449 “Consumer price behaviour in Italy: evidence from micro CPI data” by G. Veronese, S. Fabiani,A. Gattulli and R. Sabbatini, March 2005.
450 “Using mean reversion as a measure of persistence” by D. Dias and C. R. Marques, March 2005.
451 “Breaks in the mean of inflation: how they happen and what to do with them” by S. Corvoisierand B. Mojon, March 2005.
452 “Stocks, bonds, money markets and exchange rates: measuring international financial transmission” by M. Ehrmann, M. Fratzscher and R. Rigobon, March 2005.

39ECB
Working Paper Series No. 485May 2005
453 “Does product market competition reduce inflation? Evidence from EU countries and sectors” by M. Przybyla and M. Roma, March 2005.
454 “European women: why do(n’t) they work?” by V. Genre, R. G. Salvador and A. Lamo, March 2005.
455 “Central bank transparency and private information in a dynamic macroeconomic model”by J. G. Pearlman, March 2005.
456 “The French block of the ESCB multi-country model” by F. Boissay and J.-P. Villetelle, March 2005.
457
458 “Money demand and macroeconomic stability revisited” by A. Schabert and C. Stoltenberg, March 2005.
459 “Capital flows and the US ‘New Economy’: consumption smoothing and risk exposure”by M. Miller, O. Castrén and L. Zhang, March 2005.
460 “Part-time work in EU countries: labour market mobility, entry and exit” by H. Buddelmeyer, G. Mourreand M. Ward, March 2005.
461 “Do decreasing hazard functions for price changes make any sense?” by L. J. Álvarez, P. Burrieland I. Hernando, March 2005.
462 “Time-dependent versus state-dependent pricing: a panel data approach to the determinants of Belgianconsumer price changes” by L. Aucremanne and E. Dhyne, March 2005.
463 “Break in the mean and persistence of inflation: a sectoral analysis of French CPI” by L. Bilke, March 2005.
464 “The price-setting behavior of Austrian firms: some survey evidence” by C. Kwapil, J. Baumgartnerand J. Scharler, March 2005.
465 “Determinants and consequences of the unification of dual-class shares” by A. Pajuste, March 2005.
466 “Regulated and services’ prices and inflation persistence” by P. Lünnemann and T. Y. Mathä,April 2005.
467 “Socio-economic development and fiscal policy: lessons from the cohesion countries for the newmember states” by A. N. Mehrotra and T. A. Peltonen, April 2005.
468 “Endogeneities of optimum currency areas: what brings countries sharing a single currencycloser together?” by P. De Grauwe and F. P. Mongelli, April 2005.
469 “Money and prices in models of bounded rationality in high inflation economies”by A. Marcet and J. P. Nicolini, April 2005.
470 “Structural filters for monetary analysis: the inflationary movements of money in the euro area”by A. Bruggeman, G. Camba-Méndez, B. Fischer and J. Sousa, April 2005.
471 “Real wages and local unemployment in the euro area” by A. Sanz de Galdeano and J. Turunen,April 2005.
472 “Yield curve prediction for the strategic investor” by C. Bernadell, J. Coche and K. Nyholm,April 2005.
“Transparency, disclosure and the Federal Reserve” by M. Ehrmann and M. Fratzscher, March 2005.

40ECBWorking Paper Series No. 485May 2005
473 “Fiscal consolidations in the Central and Eastern European countries” by A. Afonso, C. Nickeland P. Rother, April 2005.
474 “Calvo pricing and imperfect common knowledge: a forward looking model of rational inflationinertia” by K. P. Nimark, April 2005.
475 “Monetary policy analysis with potentially misspecified models” by M. Del Negro andF. Schorfheide, April 2005.
476 “Monetary policy with judgment: forecast targeting” by L. E. O. Svensson, April 2005.
477 “Parameter misspecification and robust monetary policy rules” by C. E. Walsh, April 2005.
478T. J. Sargent, April 2005.
479 “The performance and robustness of interest-rate rules in models of the euro area”by R. Adalid, G. Coenen, P. McAdam and S. Siviero, April 2005.
480 “Insurance policies for monetary policy in the euro area” by K. Küster and V. Wieland,April 2005.
481 “Output and inflation responses to credit shocks: are there threshold effects in the euro area?”by A. Calza and J. Sousa, April 2005.
482by A. Banerjee, M. Marcellino and I. Masten, May 2005.
483 “Money supply and the implementation of interest rate targets” by A. Schabert, May 2005.
484 “Fiscal federalism and public inputs provision: vertical externalities matter” by D. Martínez-López,May 2005.
485 “Corporate investment and cash flow sensitivity: what drives the relationship?” by P. Mizenand P. Vermeulen, May 2005.
“The conquest of U.S. inflation: learning and robustness to model uncertainty” by T. Cogley and
“Forecasting macroeconomic variables for the new member states of the European Union”
