copyright © 2013 pearson education, inc. publishing as prentice hall. 10- 1 chapter 10 the tools of...
TRANSCRIPT

Copyright © 2013 Pearson Education, Inc. Publishing as Prentice Hall.10- 1
Chapter 10
The Tools of Quality

Copyright © 2013 Pearson Education, Inc. Publishing as Prentice Hall.10- 2
Strategic Quality PlanningThe Tools of Quality Chapter 10
Improving the systemIshikawa’s basic seven tools of qualitySeven new tools for improvementOther tools for performance measurement

Copyright © 2013 Pearson Education, Inc. Publishing as Prentice Hall.10- 3
Strategic Quality PlanningThe Tools of Quality Improving the System
The business must balance the needs of the basic functional areas:Supply Chain ManagementMarketingAccountingHuman ResourcesOperationsEngineeringStrategy
Copyright © 2013 Pearson Education, Inc. Publishing as Prentice Hall.10- 4
Strategic Quality PlanningThe Tools of Quality Improving the System
A quality system uses the business model with a focus on the customer and includes the dynamics of continual improvement, change, planning and renewal.

Copyright © 2013 Pearson Education, Inc. Publishing as Prentice Hall.10- 5
Strategic Quality PlanningThe Tools of Quality Improving the System
Quality System Model

Copyright © 2013 Pearson Education, Inc. Publishing as Prentice Hall.10- 6
Strategic Quality PlanningThe Tools of Quality Ishikawa’s Seven Basic Tools of Quality
1. Process maps A closer look at Quality
2. Check sheets
3. Histograms
4. Scatter plots
5. Control charts
6. Cause and effect diagrams
7. Pareto analysis And - Seven new tools for improvement
(N7)

Copyright © 2013 Pearson Education, Inc. Publishing as Prentice Hall.10- 7
Strategic Quality PlanningThe Tools of Quality Ishikawa’s Seven Basic Tools of Quality
Logical Map of the Order of the Basic Seven (B7) Tools

Copyright © 2013 Pearson Education, Inc. Publishing as Prentice Hall.10- 8
Strategic Quality PlanningThe Tools of Quality Ishikawa’s Seven Basic Tools of Quality
1. Process maps
A picture of the process
The first step of the process is to create a map of the process as it exists.

Copyright © 2013 Pearson Education, Inc. Publishing as Prentice Hall.10- 9
Strategic Quality PlanningThe Tools of Quality Ishikawa’s Seven Basic Tools of Quality
1. Process maps
A picture of the process
Using simple symbols chart the process from the beginning.
Basic Mapping Symbols

Copyright © 2013 Pearson Education, Inc. Publishing as Prentice Hall.10- 10
Strategic Quality PlanningThe Tools of Quality Ishikawa’s Seven Basic Tools of Quality
1. Process maps
A picture of the process
Develop a general process map and then fill it out by adding more detail or a subflowchart to each of the elements

Copyright © 2013 Pearson Education, Inc. Publishing as Prentice Hall.10- 11
Strategic Quality PlanningThe Tools of Quality Ishikawa’s Seven Basic Tools of Quality
1. Process maps
A picture of the process
Step through the process by interviewing those who perform it- as they do the work

Copyright © 2013 Pearson Education, Inc. Publishing as Prentice Hall.10- 12
Strategic Quality PlanningThe Tools of Quality Ishikawa’s Seven Basic Tools of Quality
1. Process maps
A picture of the process
Determine which steps add value to the process and which don’t in an effort to simplify the work.

Copyright © 2013 Pearson Education, Inc. Publishing as Prentice Hall.10- 13
Strategic Quality PlanningThe Tools of Quality Ishikawa’s Seven Basic Tools of Quality
1. Process maps
A picture of the process
Before simplifying work, determine whether the work really needs to be done in the first place.

Copyright © 2013 Pearson Education, Inc. Publishing as Prentice Hall.10- 14
Strategic Quality PlanningThe Tools of Quality Ishikawa’s Seven Basic Tools of Quality
Process Mapping: Home Occupation Process- Current

Copyright © 2013 Pearson Education, Inc. Publishing as Prentice Hall.10- 15
Strategic Quality PlanningThe Tools of Quality Ishikawa’s Seven Basic Tools of Quality
Process Mapping: Home Occupation Process- Proposed

Copyright © 2013 Pearson Education, Inc. Publishing as Prentice Hall.10- 16
Strategic Quality PlanningThe Tools of Quality Ishikawa’s Seven Basic Tools of Quality
Steps in Process Mapping include:
1. Settling on a standard set of process mapping symbols to be used.
2. Clearly communicating the purpose of the process map to all the individuals involved in the exercise.
3. Observing the work being performed by shadowing the workers performing the work.
4. Developing a map of the process.5. Reviewing the process map with the employees to make needed
changes and adjustments to the process map.6. Develop a map of the improved process.

Copyright © 2013 Pearson Education, Inc. Publishing as Prentice Hall.10- 17
Process Map with Responsibility of Existing Process

Copyright © 2013 Pearson Education, Inc. Publishing as Prentice Hall.10- 18
Process Map with Responsibility of Existing Process

Copyright © 2013 Pearson Education, Inc. Publishing as Prentice Hall.10- 19
Strategic Quality PlanningThe Tools of Quality Ishikawa’s Seven Basic Tools of Quality
A closer look at quality Extended Process Mapping of Supply
Chains Map
Supplier process Receiving Internal Processes Shipping Customer service processes

Copyright © 2013 Pearson Education, Inc. Publishing as Prentice Hall.10- 20
Supply Chain Map for Global Corp.

Copyright © 2013 Pearson Education, Inc. Publishing as Prentice Hall.10- 21
Improved Supply Chain Map

Copyright © 2013 Pearson Education, Inc. Publishing as Prentice Hall.10- 22
Strategic Quality PlanningThe Tools of Quality Ishikawa’s Seven Basic Tools of Quality
2. Check Sheets Data gathering tools
that can be used in forming histograms
They can be either tabular or schematic
Copier Project Check Sheet

Copyright © 2013 Pearson Education, Inc. Publishing as Prentice Hall.10- 23
Strategic Quality PlanningThe Tools of Quality Ishikawa’s Seven Basic Tools of Quality
3. Histograms A
representation of data in a bar chart format
Also used to observe the shape of data.
“How are the data distributed?”

Copyright © 2013 Pearson Education, Inc. Publishing as Prentice Hall.10- 24
Strategic Quality PlanningThe Tools of Quality Ishikawa’s Seven Basic Tools of Quality
3. Histograms The are several rules for developing
histograms
1. The width of the histogram bars must be consistent
2. The classes mutually exclusive and all-inclusive or collective exhaustive

Copyright © 2013 Pearson Education, Inc. Publishing as Prentice Hall.10- 25
Strategic Quality PlanningThe Tools of Quality Ishikawa’s Seven Basic Tools of Quality
A rule of thumb for the number of classes:
# of Observations
# of Classes
9 to 16 4
17 to 32 5
33 to 64 6
65 to 128 7
129 to 256 8

Copyright © 2013 Pearson Education, Inc. Publishing as Prentice Hall.10- 26
Strategic Quality PlanningThe Tools of Quality Ishikawa’s Seven Basic Tools of Quality
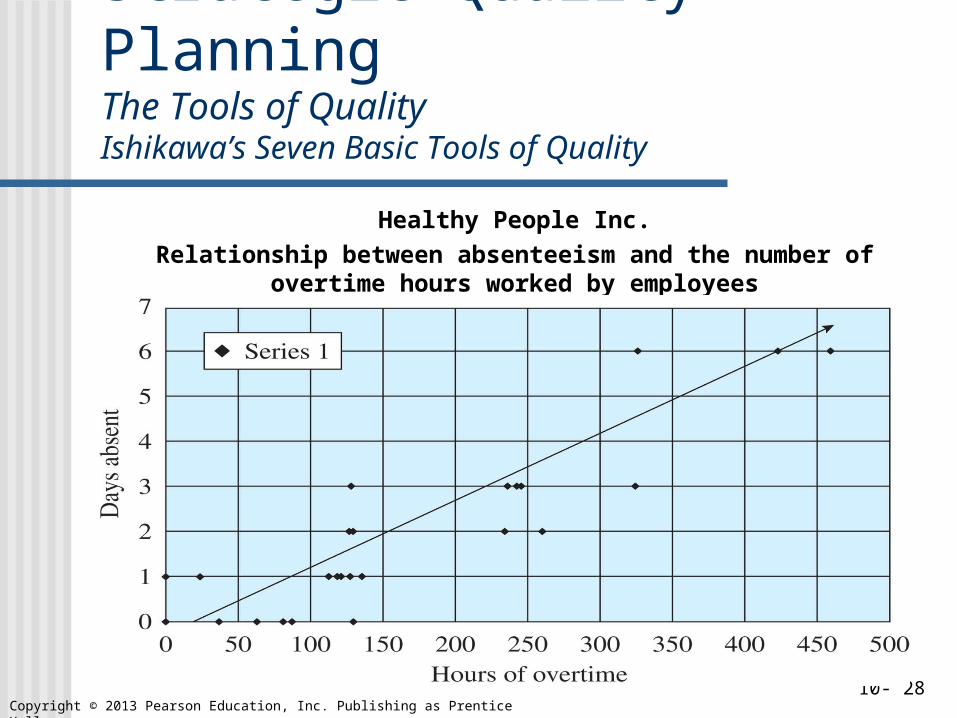
4. Scatter Diagrams Used to examine the relationship between
variables. Sometimes used to identify indicator variables in
organization. Quite easy to develop using the charting facilities
in spreadsheets packages such as Excel.

Copyright © 2013 Pearson Education, Inc. Publishing as Prentice Hall.10- 27
Strategic Quality PlanningThe Tools of Quality Ishikawa’s Seven Basic Tools of Quality
Scatter plot of the relationship between conformance data and prevention and appraisal quality related costs
Copyright © 2013 Pearson Education, Inc. Publishing as Prentice Hall.10- 28
Strategic Quality PlanningThe Tools of Quality Ishikawa’s Seven Basic Tools of Quality
Healthy People Inc.
Relationship between absenteeism and the number of overtime hours worked by employees

Copyright © 2013 Pearson Education, Inc. Publishing as Prentice Hall.10- 29
Strategic Quality PlanningThe Tools of Quality Ishikawa’s Seven Basic Tools of Quality
5. Control charts
Used to determine whether a process will produce a product or service with consistent measurable properties.
Two Control Charts usually used together
Copyright © 2013 Pearson Education, Inc. Publishing as Prentice Hall.10- 30
Strategic Quality PlanningThe Tools of Quality Ishikawa’s Seven Basic Tools of Quality
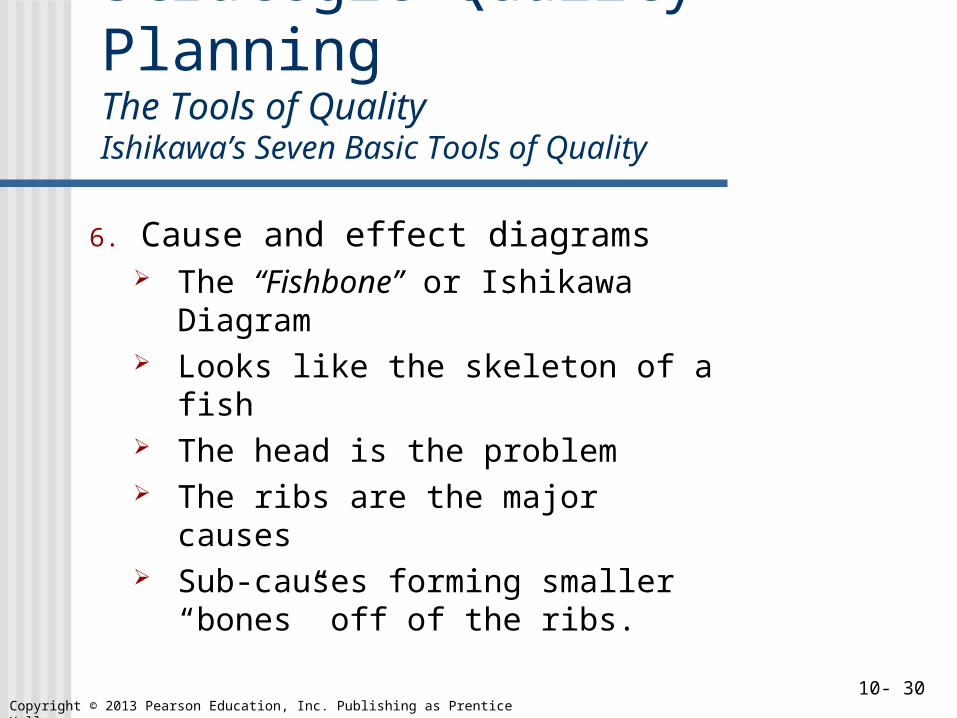
6. Cause and effect diagrams The “Fishbone” or Ishikawa
Diagram Looks like the skeleton of a fish The head is the problem The ribs are the major causes Sub-causes forming smaller
“bones” off of the ribs.

Copyright © 2013 Pearson Education, Inc. Publishing as Prentice Hall.10- 31
Strategic Quality PlanningThe Tools of Quality Ishikawa’s Seven Basic Tools of Quality
6. Cause and effect diagrams State the problem clearly in the head of
the fish Draw the backbone and ribs Ask the participants to identify the
major causes of the problem Continue to fill out the diagram asking
“Why?” about each problem or cause

Copyright © 2013 Pearson Education, Inc. Publishing as Prentice Hall.10- 32
Strategic Quality PlanningThe Tools of Quality Ishikawa’s Seven Basic Tools of Quality
6. Cause and effect diagrams It usually takes no more than five
levels of questioning … “Five why’s”
View the diagram and identify core causes
Set goals to address the core causes

Copyright © 2013 Pearson Education, Inc. Publishing as Prentice Hall.10- 33
Strategic Quality PlanningThe Tools of Quality Ishikawa’s Seven Basic Tools of Quality
Ishikawa diagram for a wood mill experiencing problems with
wobbling blades in its saws

Copyright © 2013 Pearson Education, Inc. Publishing as Prentice Hall.10- 34
Strategic Quality PlanningThe Tools of Quality Ishikawa’s Seven Basic Tools of Quality

Copyright © 2013 Pearson Education, Inc. Publishing as Prentice Hall.10- 35
Strategic Quality PlanningThe Tools of Quality Ishikawa’s Seven Basic Tools of Quality
7. Pareto Analysis
Used to identify and prioritize problems to be solved
Aided by the 80/20 rule 80% of the problems are created
by … 20% of the causes

Copyright © 2013 Pearson Education, Inc. Publishing as Prentice Hall.10- 36
Strategic Quality PlanningThe Tools of Quality Ishikawa’s Seven Basic Tools of Quality
7. Pareto Analysis
Information must be selected based on types or classification of defects
Data must be collected and classified into categories
A frequency chart is constructed showing the number of occurrences

Copyright © 2013 Pearson Education, Inc. Publishing as Prentice Hall.10- 37
Strategic Quality PlanningThe Tools of Quality Ishikawa’s Seven Basic Tools of Quality
7. Pareto Analysis Steps used include:
1. Gathering categorical data relating to quality problems
2. Drawing a frequency chart
3. Focusing on the tallest bars of the frequency chart first

Copyright © 2013 Pearson Education, Inc. Publishing as Prentice Hall.10- 38
Strategic Quality PlanningThe Tools of Quality Ishikawa’s Seven Basic Tools of Quality
Pareto Chart showing non-standardized procedures for setting up copying
jobs are the most frequently occurring problem causing slow setups

Copyright © 2013 Pearson Education, Inc. Publishing as Prentice Hall.10- 39
Strategic Quality PlanningThe Tools of Quality Ishikawa’s Seven Basic Tools of Quality
Seven new tools for improvement (N7)
GOAL/QPC recommends that the N7 tools be used in a “Cycle of Activity”

Copyright © 2013 Pearson Education, Inc. Publishing as Prentice Hall.10- 40
Strategic Quality PlanningThe Tools of Quality Ishikawa’s Seven Basic Tools of Quality
Seven new tools for improvement (N7)

Copyright © 2013 Pearson Education, Inc. Publishing as Prentice Hall.10- 41
Strategic Quality PlanningThe Tools of Quality Ishikawa’s Seven Basic Tools of Quality
Seven management and planning tools: typical flow

Copyright © 2013 Pearson Education, Inc. Publishing as Prentice Hall.10- 42
Strategic Quality PlanningThe Tools of Quality Ishikawa’s Seven Basic Tools of Quality
The Affinity Diagram creates a hierarchy of ideas
1. Identify the problem
2. Have the team members write down issues
3. Allow 10 minutes for this activity
4. Lay out the written cards on a flat surface so that all can see them

Copyright © 2013 Pearson Education, Inc. Publishing as Prentice Hall.10- 43
Strategic Quality PlanningThe Tools of Quality Ishikawa’s Seven Basic Tools of Quality
The Affinity Diagram creates a hierarchy of ideas
5. Let everyone move the cards into groups silently
6. If you disagree – say nothing but move the card
7. You have reached consensus when all cards are in groups and no one is moving them
8. Draw the affinity diagram

Copyright © 2013 Pearson Education, Inc. Publishing as Prentice Hall.10- 44
Strategic Quality PlanningThe Tools of Quality Ishikawa’s Seven Basic Tools of Quality
Affinity Diagram

Copyright © 2013 Pearson Education, Inc. Publishing as Prentice Hall.10- 45
Strategic Quality PlanningThe Tools of Quality Ishikawa’s Seven Basic Tools of Quality

Copyright © 2013 Pearson Education, Inc. Publishing as Prentice Hall.10- 46
Strategic Quality PlanningThe Tools of Quality Ishikawa’s Seven Basic Tools of Quality
Seven new tools for improvement (N7)
The Interrelationship Digraph after completing the affinity diagram
1. Construct an affinity diagram
2. Examine the cards one by one asking “What other issues are caused or influenced by this issue?” Draw a one way arrow from the first issue to the second

Copyright © 2013 Pearson Education, Inc. Publishing as Prentice Hall.10- 47
Strategic Quality PlanningThe Tools of Quality Ishikawa’s Seven Basic Tools of Quality
Seven new tools for improvement (N7)
The Interrelationship Digraph after completing the affinity diagram
3. Count the number of arrows pointing to each note
4. Identify the cards with the most issues as the “key factors”

Copyright © 2013 Pearson Education, Inc. Publishing as Prentice Hall.10- 48
Strategic Quality PlanningThe Tools of Quality Ishikawa’s Seven Basic Tools of Quality
Seven new tools for improvement (N7)
The Interrelationship Digraph after completing the affinity diagram
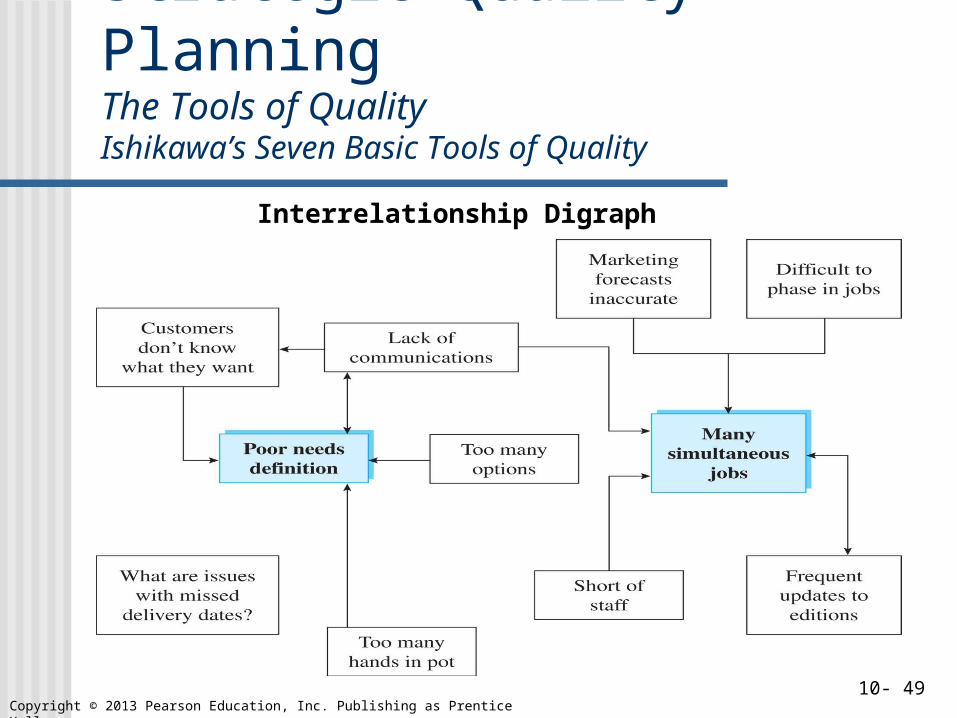
5. Draw a double box around the key factors and brainstorm ways to address these issues
Copyright © 2013 Pearson Education, Inc. Publishing as Prentice Hall.10- 49
Strategic Quality PlanningThe Tools of Quality Ishikawa’s Seven Basic Tools of Quality
Interrelationship Digraph

Copyright © 2013 Pearson Education, Inc. Publishing as Prentice Hall.10- 50
Strategic Quality PlanningThe Tools of Quality Ishikawa’s Seven Basic Tools of Quality
Interrelationship Digraph

Copyright © 2013 Pearson Education, Inc. Publishing as Prentice Hall.10- 51
Strategic Quality PlanningThe Tools of Quality Ishikawa’s Seven Basic Tools of Quality
Seven new tools for improvement (N7)
The Tree Diagram is useful to identify the steps needed to address the given problem

Copyright © 2013 Pearson Education, Inc. Publishing as Prentice Hall.10- 52
Strategic Quality PlanningThe Tools of Quality Ishikawa’s Seven Basic Tools of Quality
Seven new tools for improvement (N7)
The Prioritization Grid is used to make decisions based on multiple criteria. It involves assigning percentages and weights to each criterion and ranking them.

Copyright © 2013 Pearson Education, Inc. Publishing as Prentice Hall.10- 53
Strategic Quality PlanningThe Tools of Quality Ishikawa’s Seven Basic Tools of Quality
Seven new tools for improvement (N7)
The Matrix Diagram is similar to the quality function deployment
It is used as a brainstorming tool

Copyright © 2013 Pearson Education, Inc. Publishing as Prentice Hall.10- 54
Strategic Quality PlanningThe Tools of Quality Ishikawa’s Seven Basic Tools of Quality
Seven new tools for improvement (N7)
The Process Decision Program Chart is a tool to help brainstorm possible contingencies. Steps are:
1. Develop a tree chart, placing first level boxes in sequential order
2. Moving the second level list implementation details at a fairly high level

Copyright © 2013 Pearson Education, Inc. Publishing as Prentice Hall.10- 55
Strategic Quality PlanningThe Tools of Quality Ishikawa’s Seven Basic Tools of Quality
Seven new tools for improvement (N7) The Process Decision Program Chart is a tool
to help brainstorm possible contingencies. Steps are:
3. At the third level ask “What could go awry?”
4. At the fourth level Brainstorm counter measures to the third level
5. Evaluate the countermeasures for feasibility

Copyright © 2013 Pearson Education, Inc. Publishing as Prentice Hall.10- 56
Strategic Quality PlanningThe Tools of Quality Ishikawa’s Seven Basic Tools of Quality
Process Decision Program Chart

Copyright © 2013 Pearson Education, Inc. Publishing as Prentice Hall.10- 57
Strategic Quality PlanningThe Tools of Quality Ishikawa’s Seven Basic Tools of Quality
Seven new tools for improvement (N7)
The Activity Network Diagram is used in controlling projects
Also known as PERT (program evaluation and review technique)
Copyright © 2013 Pearson Education, Inc. Publishing as Prentice Hall.10- 58
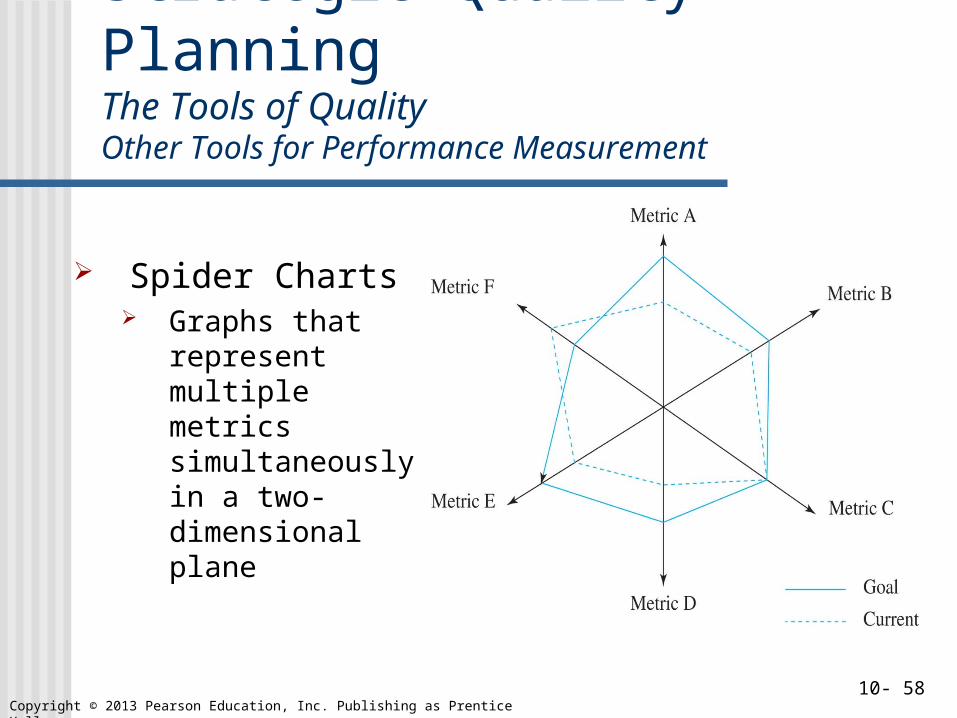
Strategic Quality PlanningThe Tools of Quality Other Tools for Performance Measurement
Spider Charts
Graphs that represent multiple metrics simultaneously in a two-dimensional plane

Copyright © 2013 Pearson Education, Inc. Publishing as Prentice Hall.10- 59
Strategic Quality PlanningThe Tools of Quality Other Tools for Performance Measurement
Balanced Scorecards
Important tool for measuring performance Usually spreadsheets

Copyright © 2013 Pearson Education, Inc. Publishing as Prentice Hall.10- 60
Strategic Quality PlanningThe Tools of Quality Other Tools for Performance Measurement
Dashboards Quickly
communicate performance levels

Copyright © 2013 Pearson Education, Inc. Publishing as Prentice Hall.10- 61
Strategic Quality PlanningThe Tools of Quality Summary
Improving the systemIshikawa’s basic seven tools of qualitySeven new tools for improvementOther tools for performance measurement

Copyright © 2013 Pearson Education, Inc. Publishing as Prentice Hall.10- 62
All rights reserved. No part of this publication may be reproduced, stored in a retrieval system, or transmitted, in any form or by any means, electronic, mechanical, photocopying, recording, or
otherwise, without the prior written permission of the publisher. Printed in the United States of America.