10-1 copyright © 2013 pearson education, inc. publishing as prentice hall nonlinear programming...
TRANSCRIPT

10-1Copyright © 2013 Pearson Education, Inc. Publishing as Prentice Hall
Nonlinear Programming
Chapter 10

10-2Copyright © 2013 Pearson Education, Inc. Publishing as Prentice Hall
■Nonlinear Profit Analysis
■Constrained Optimization
■Solution of Nonlinear Programming
Problems with Excel
■Nonlinear Programming Model with
Multiple Constraints
■Nonlinear Model Examples
Chapter Topics

10-3Copyright © 2013 Pearson Education, Inc. Publishing as Prentice Hall
■ Problems that fit the general linear programming format but contain nonlinear functions are termed nonlinear programming (NLP) problems.
■ Solution methods are more complex than linear programming methods.
■ Determining an optimal solution is often difficult, if not impossible.
■ Solution techniques generally involve searching a solution surface for high or low points requiring the use of advanced mathematics.
Overview

10-4Copyright © 2013 Pearson Education, Inc. Publishing as Prentice Hall
Profit function, Z, with volume independent of price:
Z = vp - cf - vcv
where v = sales volumep = pricecf = unit fixed
costcv = unit variable
cost
Add volume/price relationship:
v = 1,500 - 24.6p
Nonlinear Profit AnalysisOptimal Value of a Single Nonlinear Function
Figure 10.1 Linear relationship of volume to price

10-5Copyright © 2013 Pearson Education, Inc. Publishing as Prentice Hall
With fixed cost (cf = $10,000) and variable cost (cv = $8):
Profit, Z = 1,696.8p - 24.6p2 - 22,000
Optimal Value of a Single Nonlinear Function
Figure 10.2 The nonlinear profit function

10-6Copyright © 2013 Pearson Education, Inc. Publishing as Prentice Hall
■ The slope of a curve at any point is equal to the derivative of the curve’s function.
■ The slope of a curve at its highest point equals zero.
Figure 10.3 Maximum profit for the profit function
Optimal Value of a Single Nonlinear FunctionMaximum Point on a Curve

10-7Copyright © 2013 Pearson Education, Inc. Publishing as Prentice Hall
Figure 10.4 Maximum profit, optimal price and optimal volume
Optimal Value of a Single Nonlinear FunctionSolution Using Calculus
Z = 1,696.8p - 24.6p2 - 2,000
dZ/dp = 1,696.8 - 49.2p
= 0
p = 1696.8/49.2
= $34.49
v = 1,500 - 24.6p
v = 651.6 pairs of jeans
Z = $7,259.45

10-8Copyright © 2013 Pearson Education, Inc. Publishing as Prentice Hall
■ A nonlinear problem containing one or more
constraints becomes a constrained optimization
model or a nonlinear programming (NLP) model.
■ A nonlinear programming model has the same
general form as the linear programming model
except that the objective function and/or the
constraint(s) are nonlinear.
■ Solution procedures are much more complex and
no guaranteed procedure exists for all NLP models.
Constrained Optimization in Nonlinear ProblemsDefinition

10-9Copyright © 2013 Pearson Education, Inc. Publishing as Prentice Hall
Effect of adding constraints to nonlinear problem:
Figure 10.5 Nonlinear profit curve for the profit analysis model
Constrained Optimization in Nonlinear ProblemsGraphical Interpretation (1 of 3)

10-10
Copyright © 2013 Pearson Education, Inc. Publishing as Prentice Hall
Figure 10.6 A constrained optimization model
Constrained Optimization in Nonlinear ProblemsGraphical Interpretation (2 of 3)

10-11
Copyright © 2013 Pearson Education, Inc. Publishing as Prentice Hall
Figure 10.7 A constrained optimization model with a solution point not on the constraint boundary
Constrained Optimization in Nonlinear ProblemsGraphical Interpretation (3 of 3)

10-12
Copyright © 2013 Pearson Education, Inc. Publishing as Prentice Hall
■ Unlike linear programming, the solution is often
not on the boundary of the feasible solution
space.
■ Cannot simply look at points on the solution space
boundary but must consider other points on the
surface of the objective function.
■ This greatly complicates solution approaches.
■ Solution techniques can be very complex.
Constrained Optimization in Nonlinear ProblemsCharacteristics

10-13
Copyright © 2013 Pearson Education, Inc. Publishing as Prentice Hall
Exhibit 10.1
Western Clothing ProblemSolution Using Excel (1 of 3)
Formula for profit
=1500-24.6*C5

10-14
Copyright © 2013 Pearson Education, Inc. Publishing as Prentice Hall
Exhibit 10.2
Western Clothing ProblemSolution Using Excel (2 of 3)
Click on “GRG Nonlinear”

10-15
Copyright © 2013 Pearson Education, Inc. Publishing as Prentice Hall
Exhibit 10.3
Western Clothing ProblemSolution Using Excel (3 of 3)

10-16
Copyright © 2013 Pearson Education, Inc. Publishing as Prentice Hall
Maximize Z = $(4 - 0.1x1)x1 + (5 - 0.2x2)x2
subject to: x1 + 2x2 = 40
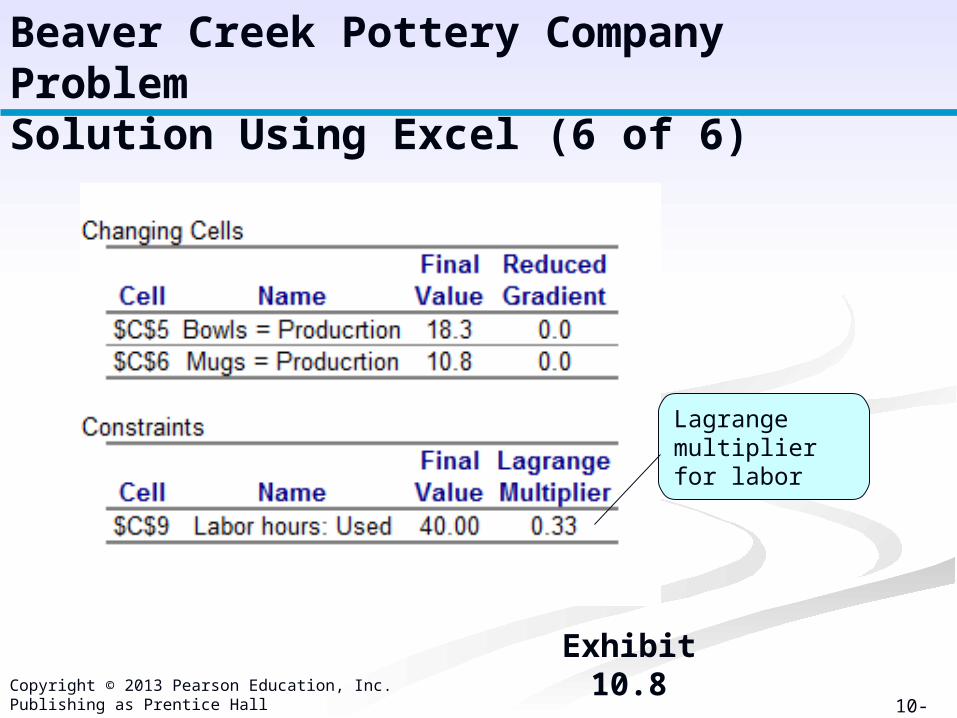
Where: x1 = number of bowls producedx2 = number of mugs produced
4 – 0.1X1 = profit ($) per bowl5 – 0.2X2 = profit ($) per mug
Beaver Creek Pottery Company ProblemSolution Using Excel (1 of 6)

10-17
Copyright © 2013 Pearson Education, Inc. Publishing as Prentice Hall
Exhibit 10.4
Beaver Creek Pottery Company ProblemSolution Using Excel (2 of 6)
=C5+2*C6
=SUMPRODUCT (C5:C6,D5:D6)

10-18
Copyright © 2013 Pearson Education, Inc. Publishing as Prentice Hall
Exhibit 10.5
Beaver Creek Pottery Company ProblemSolution Using Excel (3 of 6)

10-19
Copyright © 2013 Pearson Education, Inc. Publishing as Prentice Hall
Exhibit 10.6
Beaver Creek Pottery Company ProblemSolution Using Excel (4 of 6)

10-20
Copyright © 2013 Pearson Education, Inc. Publishing as Prentice Hall
Exhibit 10.7
Beaver Creek Pottery Company ProblemSolution Using Excel (5 of 6)
Select “Sensitivity”
10-21
Copyright © 2013 Pearson Education, Inc. Publishing as Prentice Hall
Exhibit 10.8
Beaver Creek Pottery Company ProblemSolution Using Excel (6 of 6)
Lagrange multiplier for labor

10-22
Copyright © 2013 Pearson Education, Inc. Publishing as Prentice Hall
Maximize Z = (p1 - 12)x1 + (p2 - 9)x2
subject to:2x1 + 2.7x2 6,000
3.6x1 + 2.9x2 8,500 7.2x1 + 8.5x2 15,000
where:x1 = 1,500 - 24.6p1
x2 = 2,700 - 63.8p2
p1 = price of designer jeansp2 = price of straight jeans
Western Clothing Company ProblemSolution Using Excel (1 of 4)

10-23
Copyright © 2013 Pearson Education, Inc. Publishing as Prentice Hall
Exhibit 10.9
Western Clothing Company ProblemSolution Using Excel (2 of 4)
=D5-12
=SUMPRODUCT (C5:C6,E5:E6)
=2*C5+2.7*C6

10-24
Copyright © 2013 Pearson Education, Inc. Publishing as Prentice Hall
Exhibit 10.10
Western Clothing Company ProblemSolution Using Excel (3 of 4)

10-25
Copyright © 2013 Pearson Education, Inc. Publishing as Prentice Hall
Exhibit 10.11
Western Clothing Company ProblemSolution Using Excel (4 of 4)

10-26
Copyright © 2013 Pearson Education, Inc. Publishing as Prentice Hall
Centrally locate a facility that serves several customers or other facilities in order to minimize distance or miles traveled (d) between facility and customers.
Where:(x,y) = coordinates of proposed facility(xi,yi) = coordinates of customer or location
facility i
Minimize total miles d = diti
Where:di = distance to town iti =annual trips to town i
Facility Location Example ProblemProblem Definition and Data (1 of 2)
2 2( ) ( )i id x x y y

10-27
Copyright © 2013 Pearson Education, Inc. Publishing as Prentice Hall
Coordinates Town x y Annual Trips Abbeville Benton Clayton Dunnig Eden
20 10 25 32 10
20 35 9
15 8
75 105 135 60 90
Facility Location Example ProblemProblem Definition and Data (2 of 2)

10-28
Copyright © 2013 Pearson Education, Inc. Publishing as Prentice Hall
Exhibit 10.12
Facility Location Example ProblemSolution Using Excel
=SQRT((B6-C14)^2+(C6-C15)^2)

10-29
Copyright © 2013 Pearson Education, Inc. Publishing as Prentice Hall
Figure 10.8 Rescue squad facility location
Facility Location Example ProblemSolution Map

10-30
Copyright © 2013 Pearson Education, Inc. Publishing as Prentice Hall
Investment Portfolio Selection Example ProblemDefinition and Model Formulation (1 of 2)Objective of the portfolio selection model is:
■ to minimize some measure of portfolio risk (variance in the return on investment)
■ while achieving some specified minimum return on the total portfolio investment.

10-31
Copyright © 2013 Pearson Education, Inc. Publishing as Prentice Hall
Minimize S = x12s1
2 + x22s2
2 + … +xn2sn
2 + xixjrijsisj
where:S = variance of annual return of the portfolioxi,xj = the proportion of money invested in
investments i or jsi
2 = the variance for investment irij = the correlation between returns on
investments i and jsi,sj = the std. dev. of returns for investments i
and jsubject to:
r1x1 + r2x2 + … + rnxn rm
x1 + x2 + …xn = 1.0
where:ri = expected annual return on investment irm = the minimum desired annual return from
the portfolio
Investment Portfolio Selection Example ProblemDefinition and Model Formulation (2 of 2) i≠j
10-32
Copyright © 2013 Pearson Education, Inc. Publishing as Prentice Hall
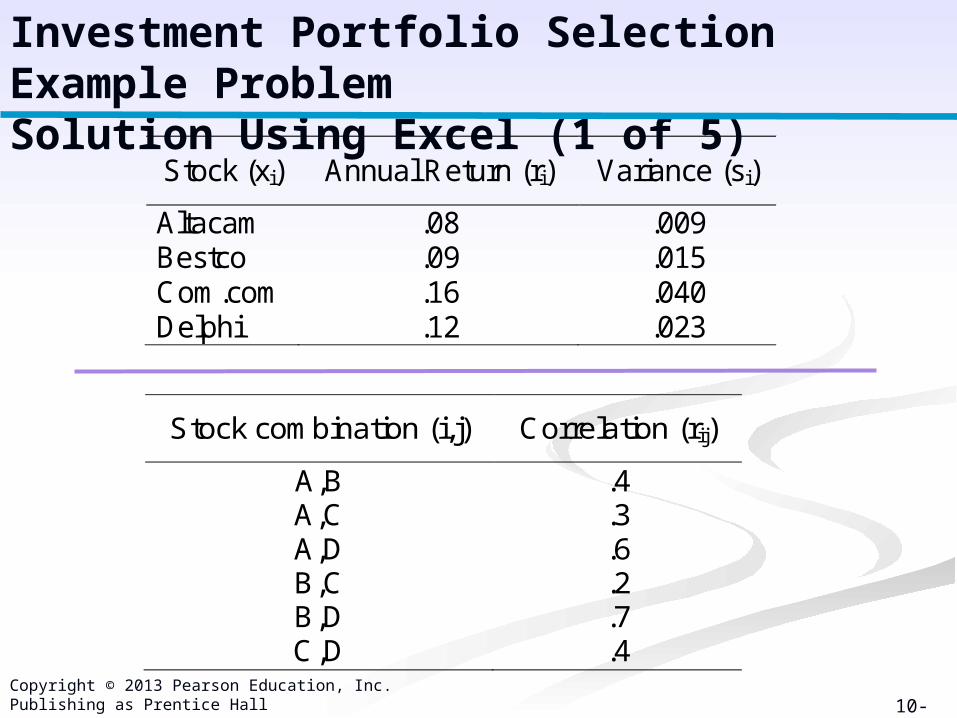
Stock (xi) Annual Return (ri) Variance (si)
Altacam Bestco Com.com Delphi
.08
.09
.16
.12
.009
.015
.040
.023
Stock combination (i,j) Correlation (rij)
A,B A,C A,D B,C B,D C,D
.4
.3
.6
.2
.7
.4
Investment Portfolio Selection Example ProblemSolution Using Excel (1 of 5)

10-33
Copyright © 2013 Pearson Education, Inc. Publishing as Prentice Hall
Four stocks, desired annual return of at least 0.11.Minimize Z = S = x1
2(.009) + x22(.015) + x3
2(.040) + X4
2(.023) + x1x2 (.4)(.009)1/2(0.015)1/2 + x1x3(.3)(.009)1/2(.040)1/2 + x1x4(.6)(.009)1/2(.023)1/2 + x2x3(.2)(.015)1/2(.040)1/2 + x2x4(.7)(.015)1/2(.023)1/2 + x3x4(.4)(.040)1/2(.023)1/2 + x2x1(.4)(.015)1/2(.009)1/2 + x3x1(.3)(.040)1/2 + (.009)1/2 + x4x1(.6)(.023)1/2(.009)1/2 + x3x2(.2)(.040)1/2(.015)1/2 + x4x2(.7)(.023)1/2(.015)1/2 + x4x3(.4)(.023)1/2(.040)1/2
subject to:.08x1 + .09x2 + .16x3 + .12x4 0.11
x1 + x2 + x3 + x4 = 1.00 xi 0
Investment Portfolio Selection Example ProblemSolution Using Excel (2 of 5)

10-34
Copyright © 2013 Pearson Education, Inc. Publishing as Prentice Hall
Exhibit 10.13
Investment Portfolio Selection Example ProblemSolution Using Excel (3 of 5)
Doubling covariances will include all investment pairs
=SUMPRODUCT9B6:B9,E6:E9)
=SUM(E6:E9)

10-35
Copyright © 2013 Pearson Education, Inc. Publishing as Prentice Hall
Exhibit 10.14
Investment Portfolio Selection Example ProblemSolution Using Excel (4 of 5)
All money is invested constraint
Investment return constraint

10-36
Copyright © 2013 Pearson Education, Inc. Publishing as Prentice Hall
Investment Portfolio Selection Example ProblemSolution Using Excel (5 of 5)
Exhibit 10.15

10-37
Copyright © 2013 Pearson Education, Inc. Publishing as Prentice Hall
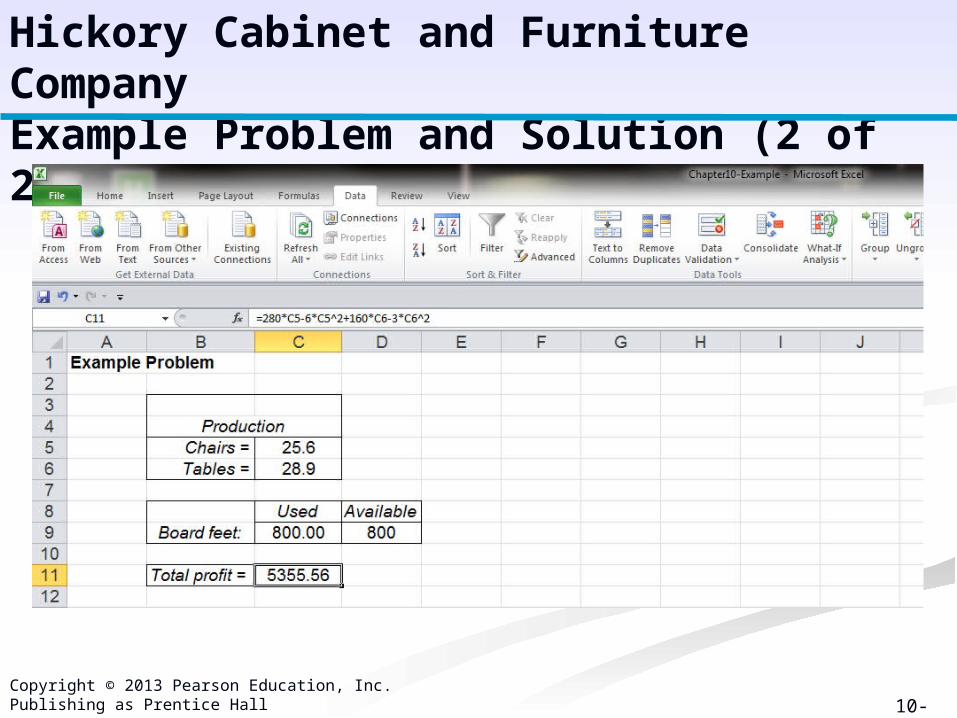
The Hickory Cabinet and Furniture Company makes chairs and tables. The company has developed the following nonlinear programming model to determine the optimal number of chairs and tables to produce each day to maximize profit. Determine the solution using Excel.
Model:
Maximize Z = $280x1 - 6x12 + 160x2 - 3x2
2
subject to:20x1 + 10x2 = 800 board ft.
Where:x1 = number of chairsx2 = number of tables
Hickory Cabinet and Furniture CompanyExample Problem and Solution (1 of 2)
10-38
Copyright © 2013 Pearson Education, Inc. Publishing as Prentice Hall
Hickory Cabinet and Furniture CompanyExample Problem and Solution (2 of 2)

10-39
Copyright © 2013 Pearson Education, Inc. Publishing as Prentice Hall
All rights reserved. No part of this publication may be reproduced, stored in a retrieval system, or transmitted, in any form or by any means, electronic, mechanical, photocopying,
recording, or otherwise, without the prior written permission of the publisher. Printed in the United States of America.