computer and internet access by households · computer and internet access by households ......
TRANSCRIPT

128128 OECD FACTBOOKOECD FACTBOOKOECD F 2005 – ISBN 92-64-01869-7 – © OECD 2005 OECD FACTBOOKOECD FACTBOOKOECD F 2005 – ISBN 92-64-01869-7 – © OECD 2005 129
COMPUTER AND INTERNET ACCESS BY HOUSEHOLDS
Computers are increasingly present in homes in OECD countries, both in countries that already have high penetration rates and in those where adoption has lagged.
Defi nitionThe table shows the number of households that reported having at least one personal computer in working order in their household. The second part of the table shows the percentage of households who reported that they had access to the Internet. In almost all cases this access is via a personal computer either using a telephone modem or ADSL-type broadband access.
ComparabilityOver a very short period, national statistical offi ces have made great progress in providing indicators of the use of information and communication technology. From an international perspective, the major drawback of offi cial statistics on ICT use is that they remain based on different standards and measure rapidly changing behaviour at different points in time. Most countries use existing surveys, such as labour force, time use, household expenditure or general social surveys. Others rely on special surveys.
Another issue for international comparability is the choice between households and individuals as the survey unit. Household surveys generally provide information on both the household and the individuals in the household. Person-based data typically provide information on the number of individuals with access to a technology, those using the technology, the location at which they use it and the purpose of use.
Statistics on ICT use by households may run into problems of international comparability because of structural differences in the composition of households. On the other hand, statistics on individuals may use different age groups, and age is an important determinant of ICT use. Household- and person-based measures yield different fi gures in terms of levels and growth rates. Such differences complicate international comparisons and make benchmarking exercises based on a single indicator of Internet access or use misleading, since country rankings change according to the indicator used.
The OECD has addressed issues of international comparability by developing a model survey on ICT use in households/by individuals. The model survey is designed to be fl exible; it uses modules addressing different topics so that additional components can be added as technologies refl ecting usage practices and policy interests change.
Long-term trendsPenetration rates are high in Denmark, Korea, Norway, Sweden, Switzerland and, Canada where approximately two-thirds of households had access to a home computer by 2003. On the other hand, shares in the Czech Republic, France, Ireland, Mexico and Portugal were below 50%. Between 2000 and 2003, the percentages of households with access to a home computer increased particularly sharply in Austria, France and Japan..
The picture with regard to Internet access is similar. In Canada, Denmark, Japan, Korea, Sweden and the United States, more than half of households had Internet access by 2003. In the Czech Republic, Mexico and Portugal, on the other hand, only about one-fi fth or less had Internet access by 2003.
Data on Internet access by household composition are available for the United Kingdom, Finland, Austria and Germany. They show that more households with children have Internet access than households without children.
SourceOECD (2004), Information Technology Outlook, OECD, Paris.
Further information• Analytical publicationsOECD (2003), Communications Outlook, OECD, Paris.
OECD (2003), OECD Science, Technology and Industry Scoreboard, OECD, Paris.
OECD (2004), Access Pricing in Telecommunications, OECD, Paris.
• Statistical publicationsOECD (2003), OECD Telecommunications Database, OECD, Paris.
• Web sitesOECD Science, Technology and Industry: www.oecd.org/sti.
OECD Telecommunications and Internet Policy www.oecd.org/sti/telecom.
StatLink: 00.0000/000000000000
StatLink: 00.0000/000000000000
SCIENCE AND TECHNOLOGY • ICT
COMPUTER AND INTERNET ACCESS BY HOUSEHOLDS
2002 2001 2000
Mexico
Turke
yFra
nce
Italy
Portug
al
Irelan
d
Austria
Japa
n
New Ze
aland
Finlan
d
United
Kingdo
m
United
States
Austra
lia
German
y
Sweden
Switzerl
and
Canad
a
Netherl
ands
Denmark
Korea
0
10
20
30
40
50
60
70
80
90
SCIENCE AND TECHNOLOGY • ICT
Households with access to home computers and the Internet Percentage of households with access to a home computer Percentage of households with access to the Internet
2000 2001 2002 2003 2000 2001 2002 2003
Australia 53.0 58.0 61.0 .. 32.0 42.0 46.0 ..
Austria 34.0 .. 45.4 49.3 32.0 42.0 46.0 ..
Belgium .. .. 44.6 .. .. 28.0 .. ..
Canada 61.3 64.0 .. .. 40.1 48.7 51.4 54.5
Czech Republic .. .. 24.6 .. .. .. 16.4 ..
Denmark 65.0 69.6 72.0 .. 46.0 48.0 59.0 ..
Finland 47.0 52.9 54.5 .. 30.0 39.5 44.3 ..
France 27.0 32.4 36.6 41.0 11.9 18.1 23.0 28.0
Germany 53.4 57.2 57.9 .. 27.3 36.0 43.3 ..
Ireland 32.4 .. .. 42.3 20.4 .. .. 33.6
Italy 29.4 .. .. .. 18.8 .. .. ..
Japan 38.6 50.1 57.2 63.3 34.0 35.1 48.8 52.0
Korea 71.0 76.9 78.6 77.9 .. 39.9 51.3 ..
Mexico 10.4 11.6 15.2 .. .. 6.2 .. ..
Netherlands 64.0 69.0 .. .. 41.0 .. .. ..
New Zealand 42.8 46.6 52.0 .. .. 37.4 .. ..
Norway .. .. .. 68.0 .. .. .. 55.0
Portugal 29.4 39.0 .. 38.3 9.0 13.0 .. 21.7
Spain 30.4 .. .. .. .. .. .. ..
Sweden 59.9 69.2 .. .. 48.2 53.3 .. ..
Switzerland 59.9 69.2 .. .. 36.5 .. .. ..
Turkey 12.3 .. .. .. 6.9 .. .. ..
United Kingdom 47.0 52.9 54.5 .. 27.0 38.0 44.0 48.0
United States 51.0 56.5 .. .. 41.5 50.5 .. ..
Households with access to home computerPercentage of all households, 2002 or most recent available year
130130 OECD FACTBOOKOECD FACTBOOKOECD F 2005 – ISBN 92-64-01869-7 – © OECD 2005 OECD FACTBOOKOECD FACTBOOKOECD F 2005 – ISBN 92-64-01869-7 – © OECD 2005 131
HIGH-TECHNOLOGY EXPORTS
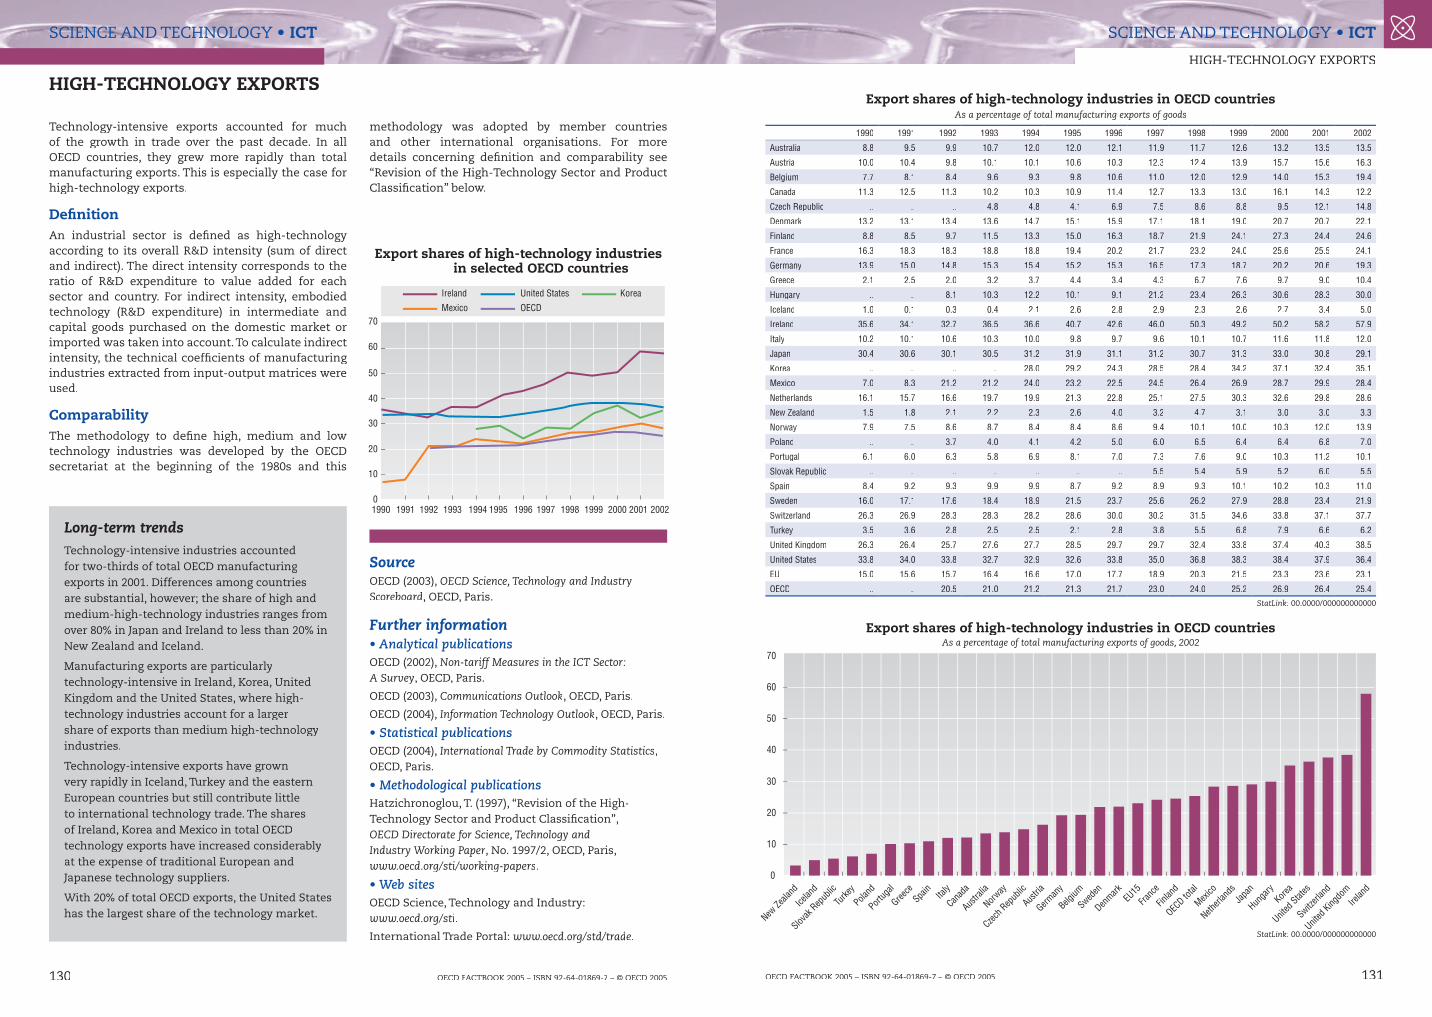
Technology-intensive exports accounted for much of the growth in trade over the past decade. In all OECD countries, they grew more rapidly than total manufacturing exports. This is especially the case for high-technology exports.
Defi nitionAn industrial sector is defi ned as high-technology according to its overall R&D intensity (sum of direct and indirect). The direct intensity corresponds to the ratio of R&D expenditure to value added for each sector and country. For indirect intensity, embodied technology (R&D expenditure) in intermediate and capital goods purchased on the domestic market or imported was taken into account. To calculate indirect intensity, the technical coeffi cients of manufacturing industries extracted from input-output matrices were used.
ComparabilityThe methodology to defi ne high, medium and low technology industries was developed by the OECD secretariat at the beginning of the 1980s and this
methodology was adopted by member countries and other international organisations. For more details concerning defi nition and comparability see “Revision of the High-Technology Sector and Product Classifi cation” below.
Long-term trendsTechnology-intensive industries accounted for two-thirds of total OECD manufacturing exports in 2001. Differences among countries are substantial, however; the share of high and medium-high-technology industries ranges from over 80% in Japan and Ireland to less than 20% in New Zealand and Iceland.
Manufacturing exports are particularly technology-intensive in Ireland, Korea, United Kingdom and the United States, where high-technology industries account for a larger share of exports than medium high-technology industries.
Technology-intensive exports have grown very rapidly in Iceland, Turkey and the eastern European countries but still contribute little to international technology trade. The shares of Ireland, Korea and Mexico in total OECD technology exports have increased considerably at the expense of traditional European and Japanese technology suppliers.
With 20% of total OECD exports, the United States has the largest share of the technology market.
SourceOECD (2003), OECD Science, Technology and Industry Scoreboard, OECD, Paris.
Further information• Analytical publicationsOECD (2002), Non-tariff Measures in the ICT Sector: A Survey, OECD, Paris.
OECD (2003), Communications Outlook, OECD, Paris.
OECD (2004), Information Technology Outlook, OECD, Paris.
• Statistical publicationsOECD (2004), International Trade by Commodity Statistics, OECD, Paris.
• Methodological publicationsHatzichronoglou, T. (1997), “Revision of the High-Technology Sector and Product Classifi cation”, OECD Directorate for Science, Technology and Industry Working Paper, No. 1997/2, OECD, Paris, www.oecd.org/sti/working-papers.
• Web sitesOECD Science, Technology and Industry: www.oecd.org/sti.
International Trade Portal: www.oecd.org/std/trade.
Export shares of high-technology industries in OECD countriesAs a percentage of total manufacturing exports of goods
1990 1991 1992 1993 1994 1995 1996 1997 1998 1999 2000 2001 2002
Australia 8.8 9.5 9.9 10.7 12.0 12.0 12.1 11.9 11.7 12.6 13.2 13.5 13.5
Austria 10.0 10.4 9.8 10.1 10.1 10.6 10.3 12.3 12.4 13.9 15.7 15.6 16.3
Belgium 7.7 8.1 8.4 9.6 9.3 9.8 10.6 11.0 12.0 12.9 14.0 15.3 19.4
Canada 11.3 12.5 11.3 10.2 10.3 10.9 11.4 12.7 13.3 13.0 16.1 14.3 12.2
Czech Republic .. .. .. 4.8 4.8 4.1 6.9 7.5 8.6 8.8 9.5 12.1 14.8
Denmark 13.2 13.1 13.4 13.6 14.7 15.1 15.9 17.1 18.1 19.0 20.7 20.7 22.1
Finland 8.8 8.5 9.7 11.5 13.3 15.0 16.3 18.7 21.9 24.1 27.3 24.4 24.6
France 16.3 18.3 18.3 18.8 18.8 19.4 20.2 21.7 23.2 24.0 25.6 25.5 24.1
Germany 13.9 15.0 14.8 15.3 15.4 15.2 15.3 16.5 17.3 18.7 20.2 20.6 19.3
Greece 2.1 2.5 2.0 3.2 3.7 4.4 3.4 4.3 6.7 7.6 9.7 9.0 10.4
Hungary .. .. 8.1 10.3 12.2 10.1 9.1 21.2 23.4 26.3 30.6 28.3 30.0
Iceland 1.0 0.1 0.3 0.4 2.1 2.6 2.8 2.9 2.3 2.6 2.7 3.4 5.0
Ireland 35.6 34.1 32.7 36.5 36.6 40.7 42.6 46.0 50.3 49.2 50.2 58.2 57.9
Italy 10.2 10.1 10.6 10.3 10.0 9.8 9.7 9.6 10.1 10.7 11.6 11.8 12.0
Japan 30.4 30.6 30.1 30.5 31.2 31.9 31.1 31.2 30.7 31.3 33.0 30.8 29.1
Korea .. .. .. .. 28.0 29.2 24.3 28.5 28.4 34.2 37.1 32.4 35.1
Mexico 7.0 8.3 21.2 21.2 24.0 23.2 22.5 24.5 26.4 26.9 28.7 29.9 28.4
Netherlands 16.1 15.7 16.6 19.7 19.9 21.3 22.8 25.1 27.5 30.3 32.6 29.8 28.6
New Zealand 1.5 1.8 2.1 2.2 2.3 2.6 4.0 3.2 4.7 3.1 3.0 3.0 3.3
Norway 7.9 7.5 8.6 8.7 8.4 8.4 8.6 9.4 10.1 10.0 10.3 12.0 13.9
Poland .. .. 3.7 4.0 4.1 4.2 5.0 6.0 6.5 6.4 6.4 6.8 7.0
Portugal 6.1 6.0 6.3 5.8 6.9 8.1 7.0 7.3 7.6 9.0 10.3 11.2 10.1
Slovak Republic .. .. .. .. .. .. .. 5.5 5.4 5.9 5.2 6.0 5.5
Spain 8.4 9.2 9.3 9.9 9.9 8.7 9.2 8.9 9.3 10.1 10.2 10.3 11.0
Sweden 16.0 17.1 17.6 18.4 18.9 21.5 23.7 25.6 26.2 27.9 28.8 23.4 21.9
Switzerland 26.3 26.9 28.3 28.3 28.2 28.6 30.0 30.2 31.5 34.6 33.8 37.1 37.7
Turkey 3.5 3.6 2.8 2.5 2.5 2.1 2.8 3.8 5.5 6.8 7.9 6.6 6.2
United Kingdom 26.3 26.4 25.7 27.6 27.7 28.5 29.7 29.7 32.4 33.8 37.4 40.3 38.5
United States 33.8 34.0 33.8 32.7 32.9 32.6 33.8 35.0 36.8 38.3 38.4 37.9 36.4
EU 15.0 15.6 15.7 16.4 16.6 17.0 17.7 18.9 20.3 21.5 23.3 23.6 23.1
OECD .. .. 20.5 21.0 21.2 21.3 21.7 23.0 24.0 25.2 26.9 26.4 25.4StatLink: 00.0000/000000000000
StatLink: 00.0000/000000000000
SCIENCE AND TECHNOLOGY • ICT SCIENCE AND TECHNOLOGY • ICT
HIGH-TECHNOLOGY EXPORTS
New Ze
aland
Icelan
d
Slovak
Repub
lic
Turke
y
Poland
Portug
al
Greece
Spain
Italy
Canad
a
Austra
lia
Norway
Czech R
epub
lic
Austria
German
y
Belgium
Sweden
Denmark
EU15
Franc
e
Finlan
d
OECD to
tal
Mexico
Netherl
ands
Japa
n
Hunga
ryKore
a
United
States
Switzerl
and
United
Kingdo
mIre
land
0
10
20
30
40
50
60
70
1990 1991
70
60
50
40
30
20
10
01992 1993 1994 1995 1996 1997 1998 1999 2000 2001 2002
Ireland United States
Mexico OECD
Korea
Export shares of high-technology industries in OECD countriesAs a percentage of total manufacturing exports of goods, 2002
Export shares of high-technology industries in selected OECD countries