computational modeling of nonmonotonic dose … · nonmonotonic dose-response: insight into minimum...
TRANSCRIPT

Computational modeling of nonmonotonic dose-response:
Insight into minimum requirements
0
Rory Conolly
Low Dose Effects and Non-Monotonic Dose Responses for Endocrine Active Chemicals: Science to Practice
An International WorkshopSeptember 11-13, 2012
Charité Universitätsmedizin, Berlin, Germany
Disclaimer
This is a presentation of the opinions of Rory Conolly, and may opinions of Rory Conolly, and may not represent official policies of the US EPA.
Goal of presentation
To describe some biological mechanisms that can generate nonlinear and nonmonotonic dose-responses.that can generate nonlinear and nonmonotonic dose-responses.
2
Goal of presentation
� To describe some biological mechanisms that can generate nonlinear and nonmonotonic dose-responses.that can generate nonlinear and nonmonotonic dose-responses.
� To illustrate principles� won’t focus exclusively on endocrine
effects.
3
Outline
� Extrapolation, risk assessment, and uncertainty
� Review of determinants of dose-� Review of determinants of dose-response� Pharmacokinetics
� Tissue/cellular responses
� Nonmonotonicity
4

Historically, the data haven’t answered the question
Res
pons
eR
espo
nse
Dose
Interspecies

Extrapolation
� Extrapolation below the doses for which we have data is typical, no matter the actual shape of the dose-response curve.curve.� Some exceptions with epidemiological data
and newer tox. studies
� How much uncertainty we are willing to live with?
6

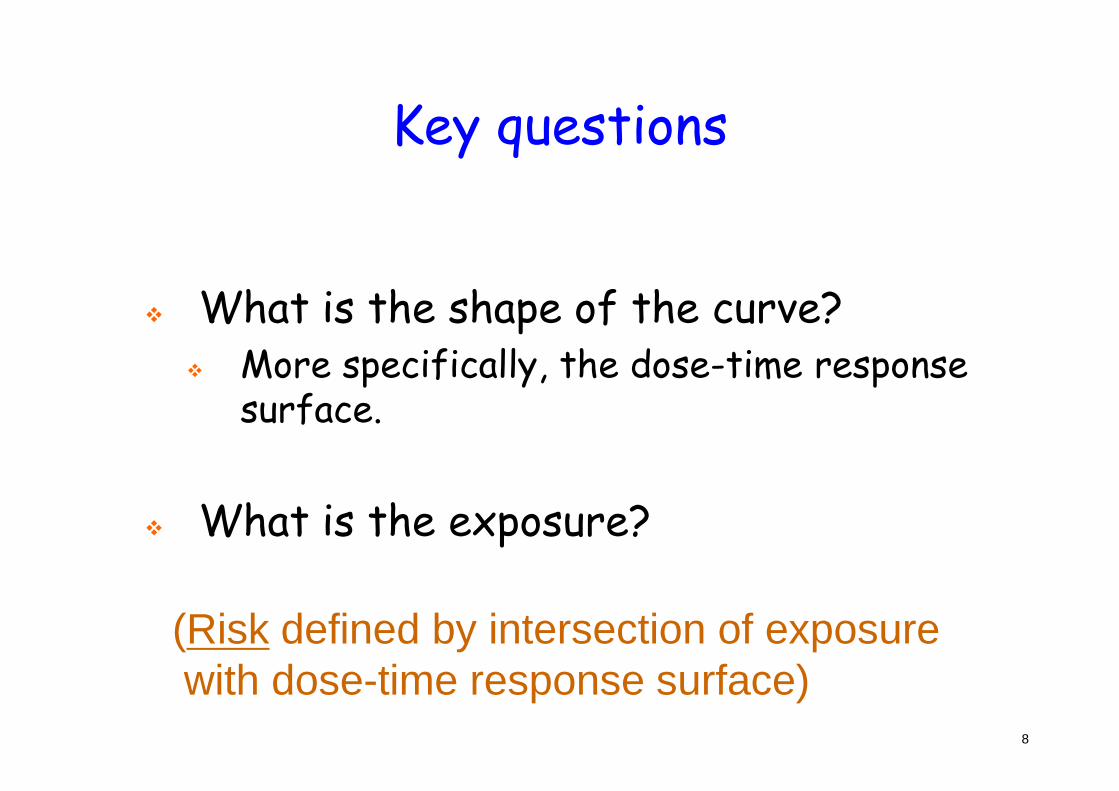
Key questions
� What is the shape of the curve?� More specifically, the dose-time response
surface.surface.
� What is the exposure?
7
Key questions
� What is the shape of the curve?� More specifically, the dose-time response
surface.surface.
� What is the exposure?
8
(Risk defined by intersection of exposurewith dose-time response surface)

Biological mechanismsdetermine dose-response
Exposure Tissuedose
Tissueinteraction
Pharmacokinetics
dose interaction
Tissueinteraction
Early tissueresponse
Irreversiblepathology
Pharmacodynamics

Biological mechanismsdetermine dose-response
Exposure Tissuedose
Tissueinteraction
Pharmacokinetics
dose interaction
Tissueinteraction
Early tissueresponse
Irreversiblepathology
Pharmacodynamics

11
12

Vinyl chloride: Saturable bioactivation by CYP2E1
CYP2E1
13
CYP2E1

14

Nonmonotonicity and dose relevancerelevance
9/21/2012 15

Environmental Estrogen-induced luciferase expressionin vitro in MDA KBluc cells
80
100
Serum level inrats treated
High in vitro concentrations,unattainable in vivo,
causing a NMDRC
Per
cen
t of M
axim
um
Est
rog
enic
res
po
nse
-16-15-14-13-12-11-10 -9 -8 -7 -6 -5 -4 -30
20
40
60 rats treatedwith a very
high oral doseof a potentestrogen
Conc in waterblocking fishreproduction
Concentration (M)
Per
cen
t of M
axim
um
Est
rog
enic
res
po
nse
Earl Gray

Nonlinearity in PK,Dose relevance
� Not new concepts, but easy to ignore
17
� Not new concepts, but easy to ignore
� Important, especially considering the growing emphasis on in vitro studies

Biological mechanismsdetermine dose-response
Exposure Tissuedose
Tissueinteraction
Pharmacokinetics
dose interaction
Tissueinteraction
Early tissueresponse
Irreversiblepathology
Pharmacodynamics
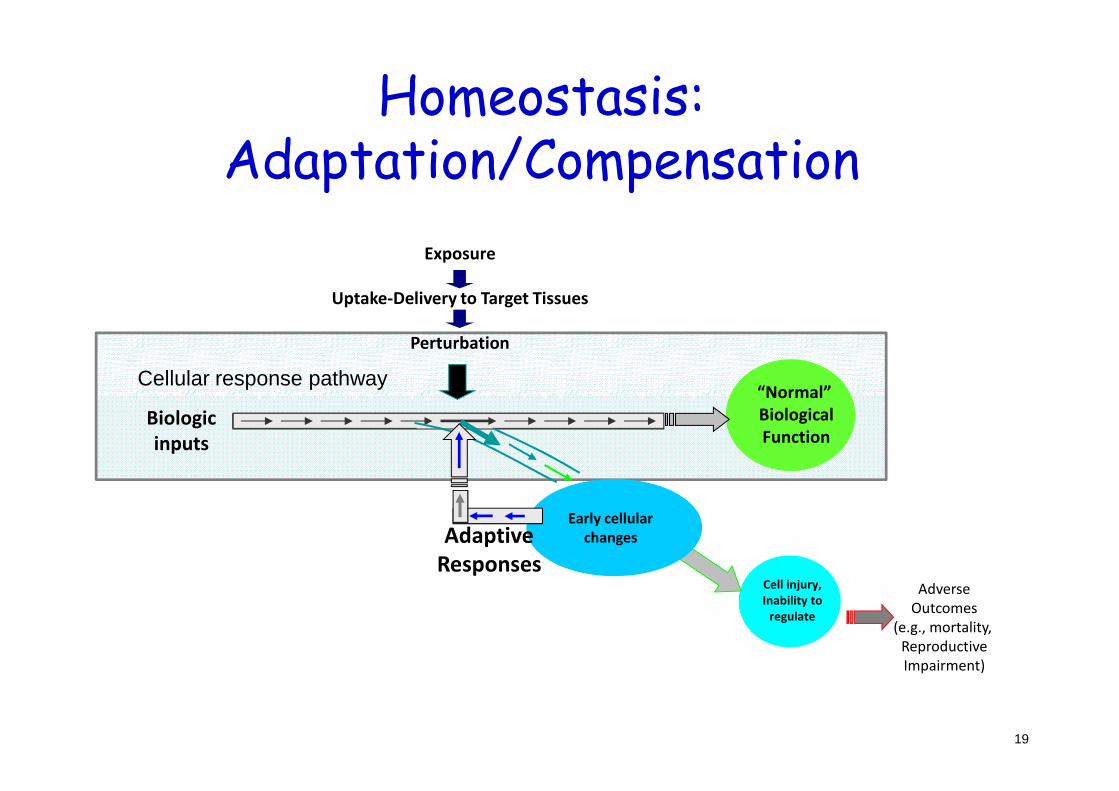
“Normal”
Exposure
Uptake-Delivery to Target Tissues
Perturbation
Cellular response pathway
Homeostasis:Adaptation/Compensation
19
Biologic
inputs
“Normal”
Biological
Function
Adverse
Outcomes
(e.g., mortality,
Reproductive
Impairment)
Cell injury,
Inability to
regulate
Adaptive
Responses
Early cellular
changes

200
250
300
200
250
300L
abeling index
200
250
300
200
250
300L
abeling index
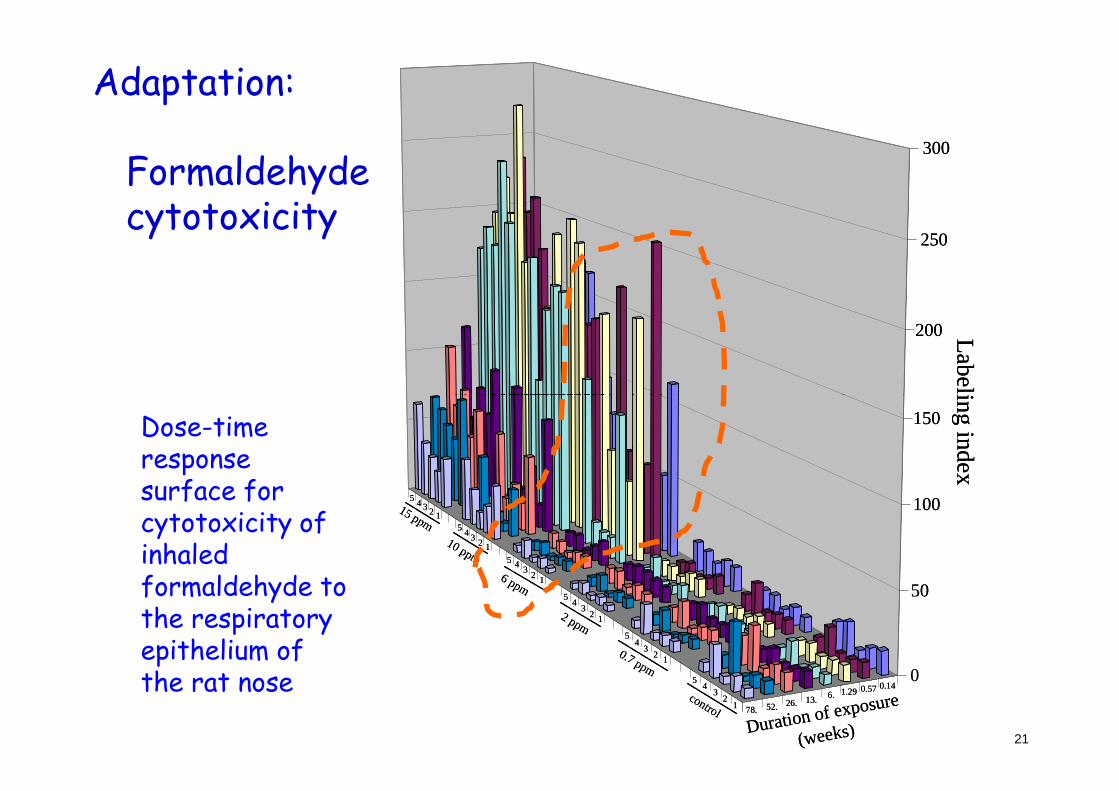
Adaptation:
Formaldehydecytotoxicity
Dose-time response surface for cytotoxicity of inhaled formaldehyde to the respiratory epithelium of the rat nose
20A
1A2A3A4A
5
B1B2B3B4B5
C1C2C3C4C5
D1D2D3D4D5E
1E2E3E4E5F
1F2F3F4F5
0. 1 4
0. 5 7
1 . 2 9
6 . 00
1 3 . 00
2 6 . 00
5 2 . 00
7 8 . 00
0
50
100
150
Duration of exposure
(weeks)
0.140.571.296.13.26.52.78.12
34
5
23
45
1
23
45
1
23
45
1
2345
1
234
5
1
control
0.7 ppm
2 ppm
6 ppm
10 ppm
15 ppm
0
50
100
150
Labeling index
A1A
2A3A4A
5
B1B2B3B4B5
C1C2C3C4C5
D1D2D3D4D5E
1E2E3E4E5F
1F2F3F4F5
0. 1 4
0. 5 7
1 . 2 9
6 . 00
1 3 . 00
2 6 . 00
5 2 . 00
7 8 . 00
0
50
100
150
Duration of exposure
(weeks)
0.140.571.296.13.26.52.78.12
34
5
23
45
1
23
45
1
23
45
1
2345
1
234
5
1
control
0.7 ppm
2 ppm
6 ppm
10 ppm
15 ppm
0
50
100
150
Labeling index
200
250
300
200
250
300L
abeling index
200
250
300
200
250
300L
abeling index
Adaptation:
Formaldehydecytotoxicity
Dose-time response surface for cytotoxicity of inhaled formaldehyde to the respiratory epithelium of the rat nose
21A
1A2A3A4A
5
B1B2B3B4B5
C1C2C3C4C5
D1D2D3D4D5E
1E2E3E4E5F
1F2F3F4F5
0. 1 4
0. 5 7
1 . 2 9
6 . 00
1 3 . 00
2 6 . 00
5 2 . 00
7 8 . 00
0
50
100
150
Duration of exposure
(weeks)
0.140.571.296.13.26.52.78.12
34
5
23
45
1
23
45
1
23
45
1
2345
1
234
5
1
control
0.7 ppm
2 ppm
6 ppm
10 ppm
15 ppm
0
50
100
150
Labeling index
A1A
2A3A4A
5
B1B2B3B4B5
C1C2C3C4C5
D1D2D3D4D5E
1E2E3E4E5F
1F2F3F4F5
0. 1 4
0. 5 7
1 . 2 9
6 . 00
1 3 . 00
2 6 . 00
5 2 . 00
7 8 . 00
0
50
100
150
Duration of exposure
(weeks)
0.140.571.296.13.26.52.78.12
34
5
23
45
1
23
45
1
23
45
1
2345
1
234
5
1
control
0.7 ppm
2 ppm
6 ppm
10 ppm
15 ppm
0
50
100
150
Labeling index

Adaptation: Plasma estradiol in fathead minnows exposed to fadrazole
0
1
2 CONFAD-3FAD-30*
Pla
sma
E2
(fol
d-ch
ange
rel
ativ
e to
con
trol
; lo
g 2)
22
0 2 4 6 8-4
-3
-2
-1
10 12 14 16
#
##
#
*
*Pla
sma
E2
(fol
d-ch
ange
rel
ativ
e to
con
trol
; lo
g 2)
direct effect
compensation recoveryVilleneuve et al. (2010) EHP
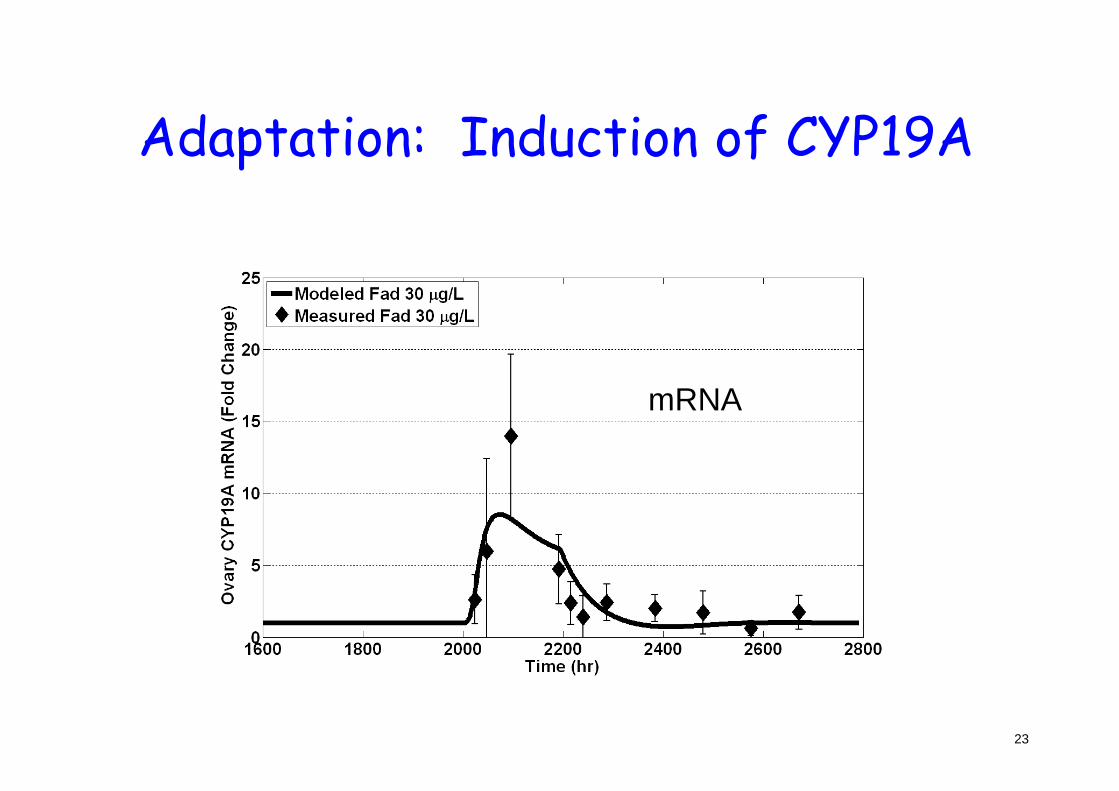
Adaptation: Induction of CYP19A
mRNA
23
mRNA

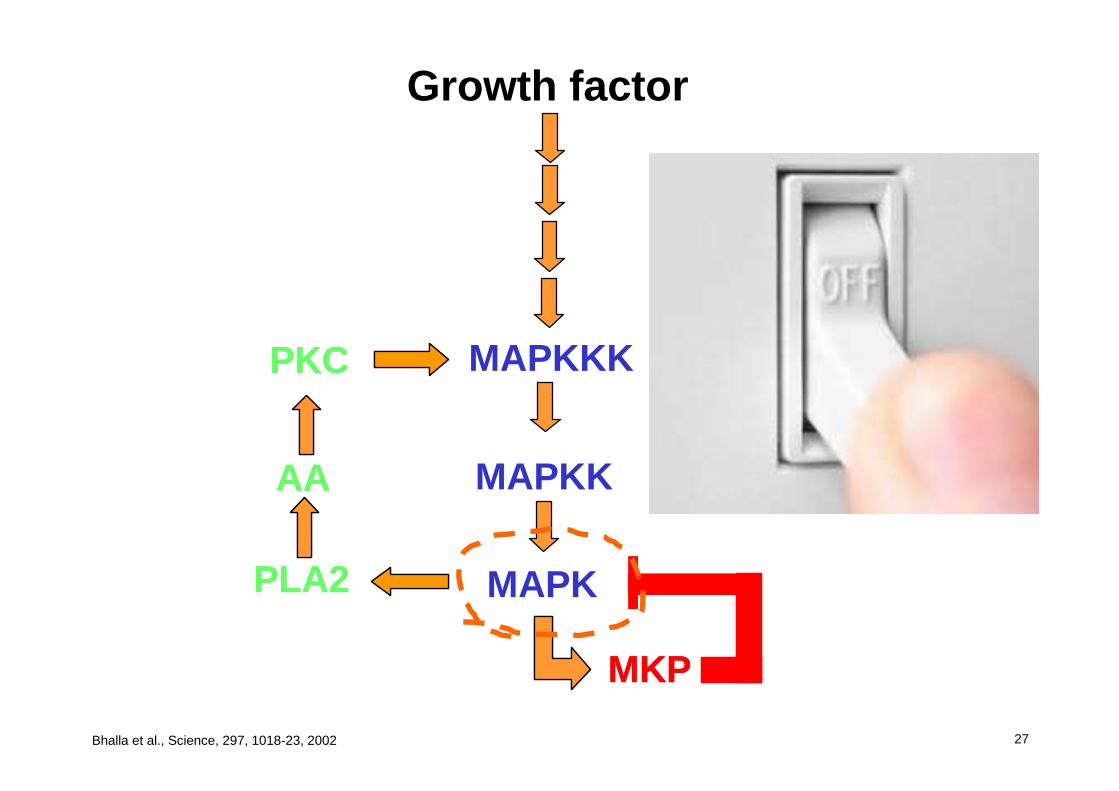
Nonlinear intracellular signaling
Bifurcation in a MAPK signaling pathway
24
Bifurcation in a MAPK signaling pathway due to a positive feedback loop
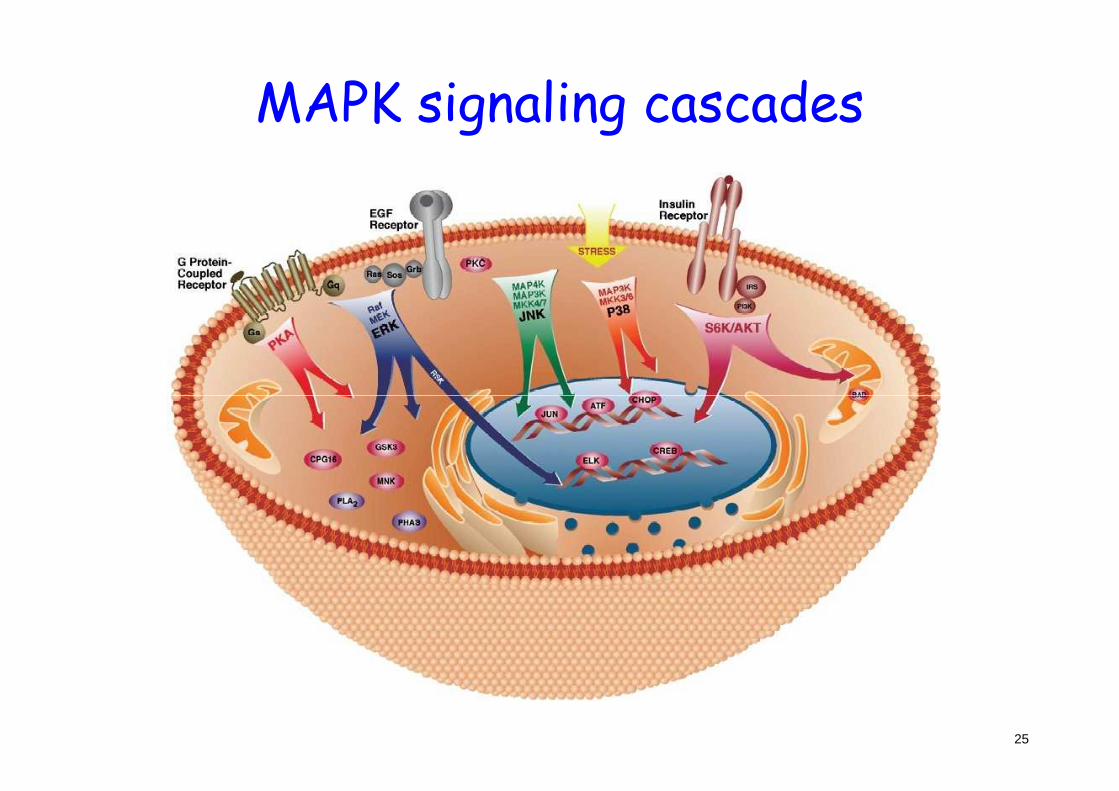
MAPK signaling cascades
25http://www.weizmann.ac.il/Biology/open_day/book/rony_seger.pdf

Growth factor
MAPKKKPKCPKC
26
MAPKK
MAPKPLA2
AA
PLA2
AA
MKPMKP
Bhalla et al., Science, 297, 1018-23, 2002
Growth factor
MAPKKKPKCPKC
27
MAPKK
MAPKPLA2
AA
PLA2
AA
MKPMKP
Bhalla et al., Science, 297, 1018-23, 2002
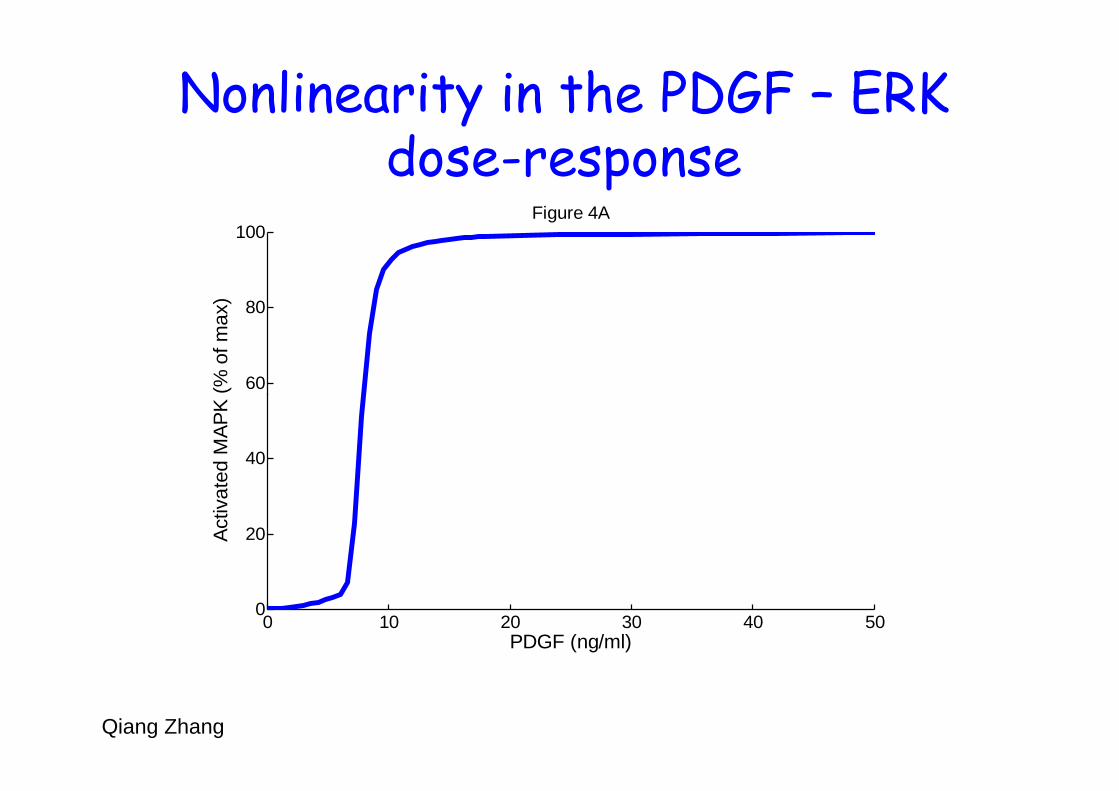
60
80
100A
ctiv
ated
MA
PK
(%
of m
ax)
Figure 4A
Nonlinearity in the PDGF – ERK dose-response
0 10 20 30 40 500
20
40
PDGF (ng/ml)
Act
ivat
ed M
AP
K (
% o
f max
)
Qiang Zhang
29

Inhibition of ERK reduces CYP1A1 induction by TCDD
30
Nonmonotonic dose-response
31
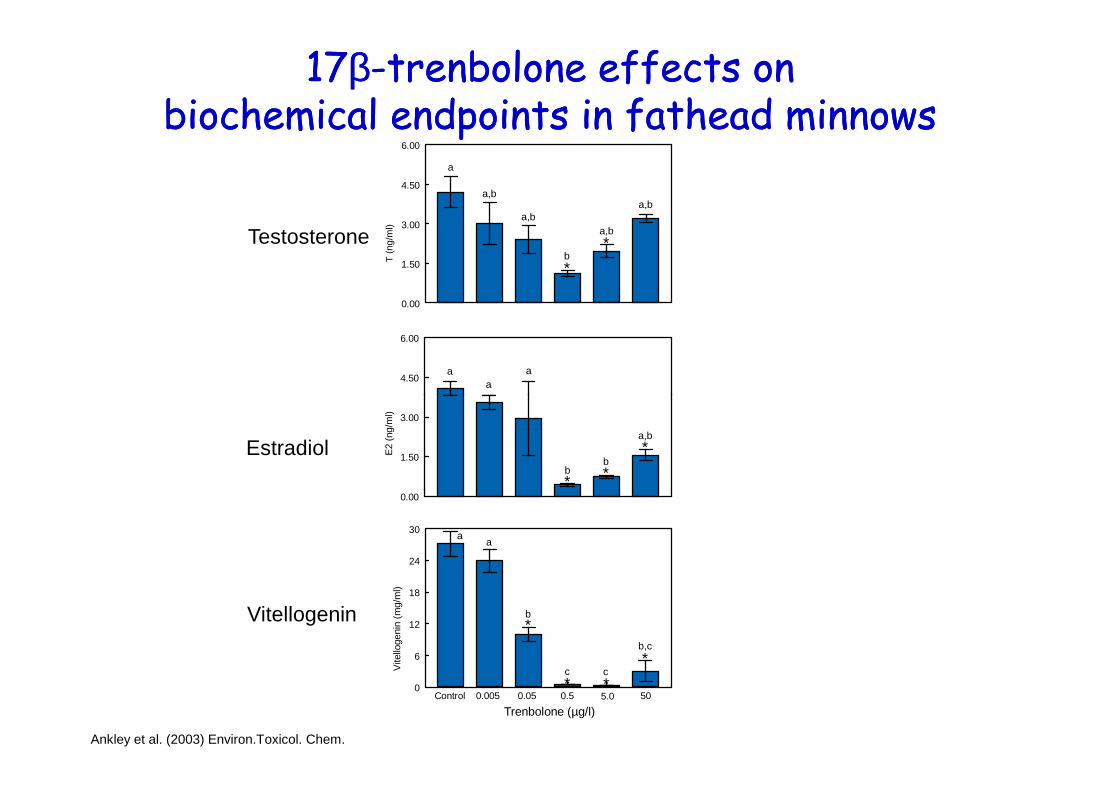
1717ββ--trenbolone effects trenbolone effects on on biochemical endpoints in fathead minnowsbiochemical endpoints in fathead minnows
0.00
1.50
3.00
4.50
6.00
T (
ng/m
l)
a
a,b
a,b
b
a,b
a,b
4.50
6.00
aa
a
*
*Testosterone
0.00
1.50
3.00
E2
(ng/
ml)
b
a,b
b
Control 0.005 0.05 0.5 5.0 500
6
12
18
24
30
Vite
lloge
nin
(mg/
ml)
aa
b
c c
b,c
Trenbolone (µg/l)
* *
*
*
* *
*
Ankley et al. (2003) Environ.Toxicol. Chem.
Estradiol
Vitellogenin
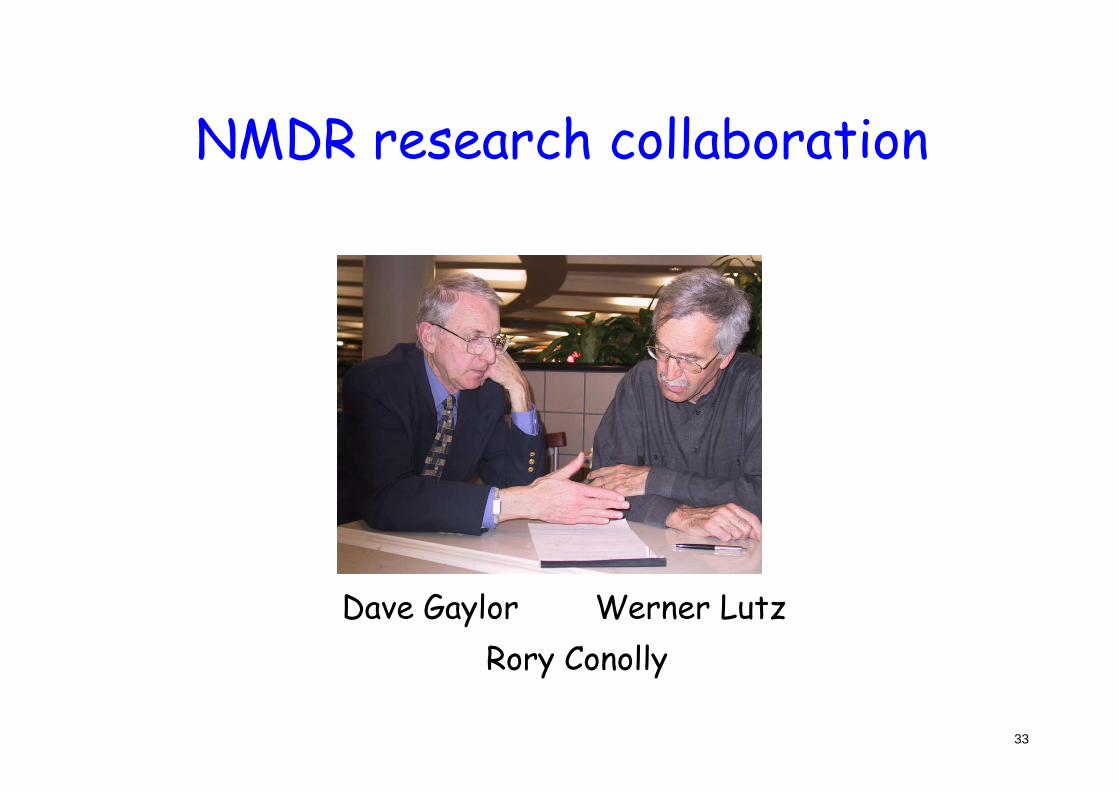
NMDR research collaboration
Dave Gaylor Werner Lutz
33
Rory Conolly
34

35
“Dose-response curves for the first interaction of a chemical with a biochemical target molecule are usu ally monotonic; i.e., they increase or decrease over the entire dose range.”
- Werner Lutz

DimerizationDimerization of the estrogen receptorof the estrogen receptor
Edwards & Boonvaratanakomkit, Molec. Interventions doi: 10.1124/mi.3.1.12 MI February 2003 vol. 3 no. 1 12-15 36

Maness et at., Toxicol. Appl. Pharmacol. 151, 135-142, 1998 37
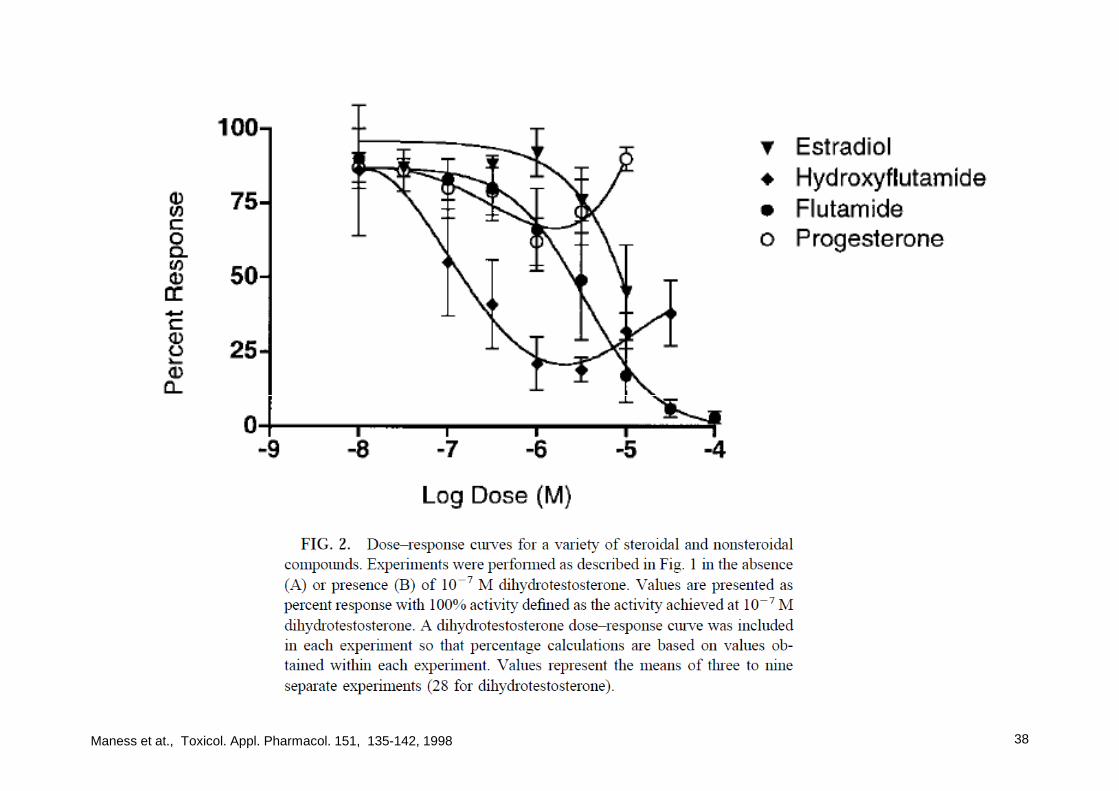
Maness et at., Toxicol. Appl. Pharmacol. 151, 135-142, 1998 38
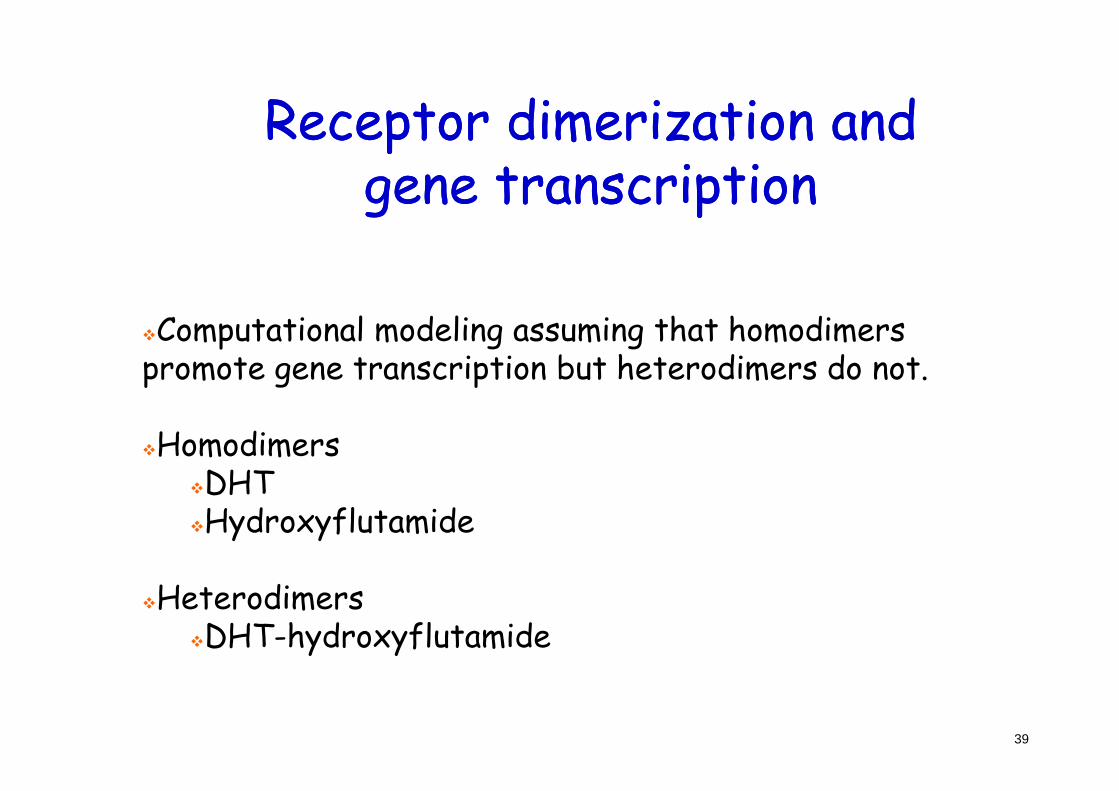
�Computational modeling assuming that homodimers promote gene transcription but heterodimers do not.
Receptor dimerization and Receptor dimerization and gene transcriptiongene transcription
39
�Homodimers�DHT�Hydroxyflutamide
�Heterodimers�DHT-hydroxyflutamide

Conolly & Lutz. Toxicol. Sci. 77, 151-157, 2004 40
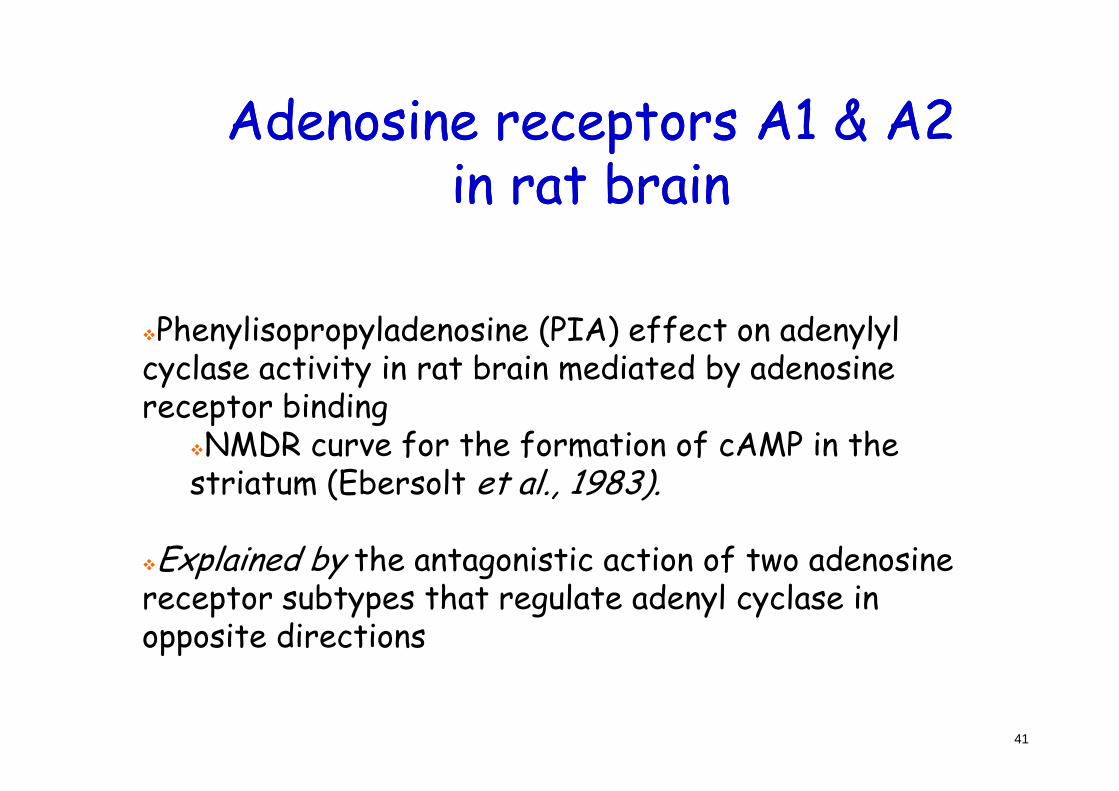
�Phenylisopropyladenosine (PIA) effect on adenylyl cyclase activity in rat brain mediated by adenosine receptor binding
Adenosine receptors A1 & A2 Adenosine receptors A1 & A2 in rat brainin rat brain
41
receptor binding�NMDR curve for the formation of cAMP in the striatum (Ebersolt et al., 1983).
�Explained by the antagonistic action of two adenosine receptor subtypes that regulate adenyl cyclase in opposite directions
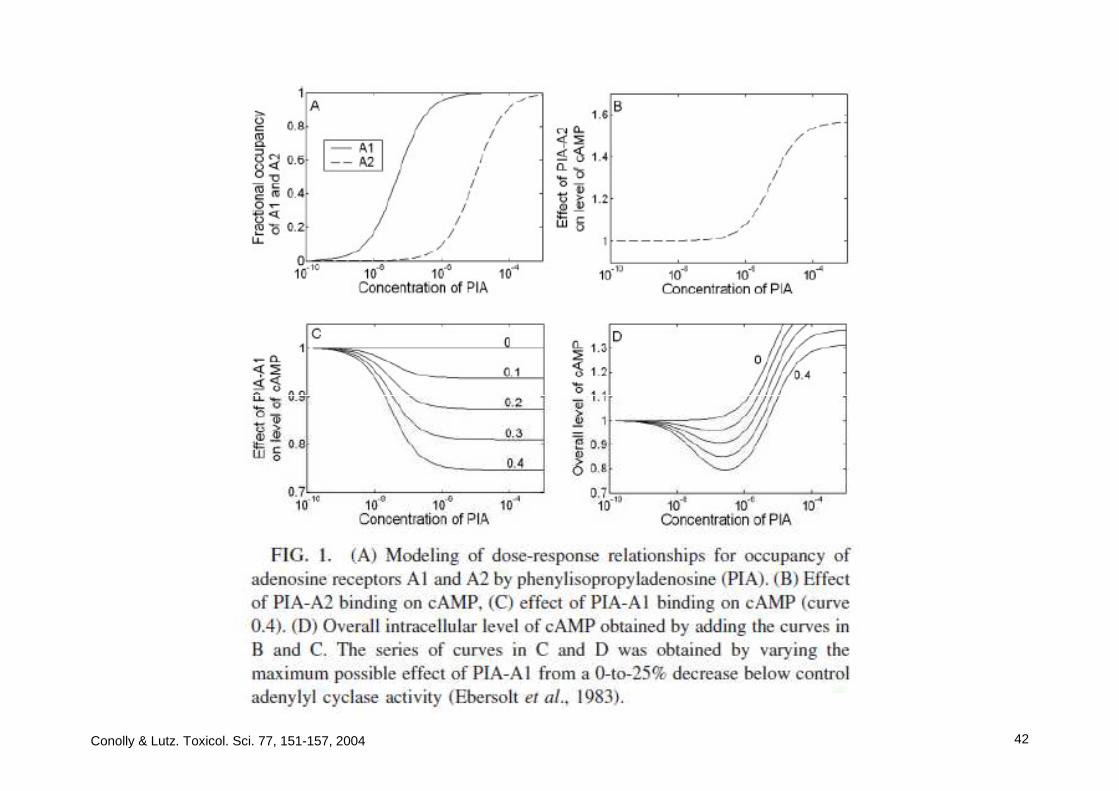
42Conolly & Lutz. Toxicol. Sci. 77, 151-157, 2004
Induction of DNA repairInduction of DNA repair
43

Induction
44

Conolly & Lutz. Toxicol. Sci. 77, 151-157, 2004 45
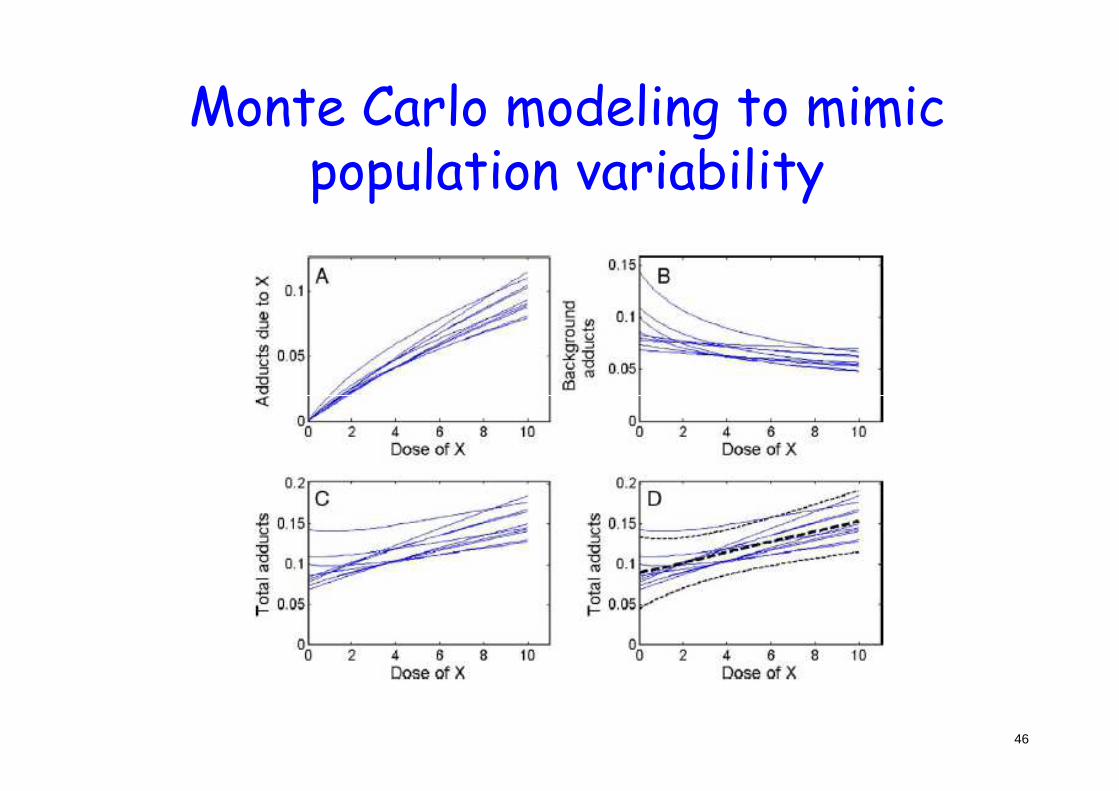
Monte Carlo modeling to mimic population variability
46

DNA damage, cell cycle checkpoint control, and mutation
47

Monte Carlo: DNA damage, cell cycle checkpoint control, and mutation
48

Sources of nonmonotonicity
� Feedback loops� And other kinds of regulatory modules
� When the chemical interacts � When the chemical interacts differently with different parts of the system
� When the target site dose elicits induction of a compensatory response
� Etc, etc…
49
Both qualitative and quantitative issues matter
� Examples show that quantitative factors (e.g., degree of induction of factors (e.g., degree of induction of DNA repair) can determine if the dose-response curve is monotonic, an (apparent) threshold, or nonmonotonic
50
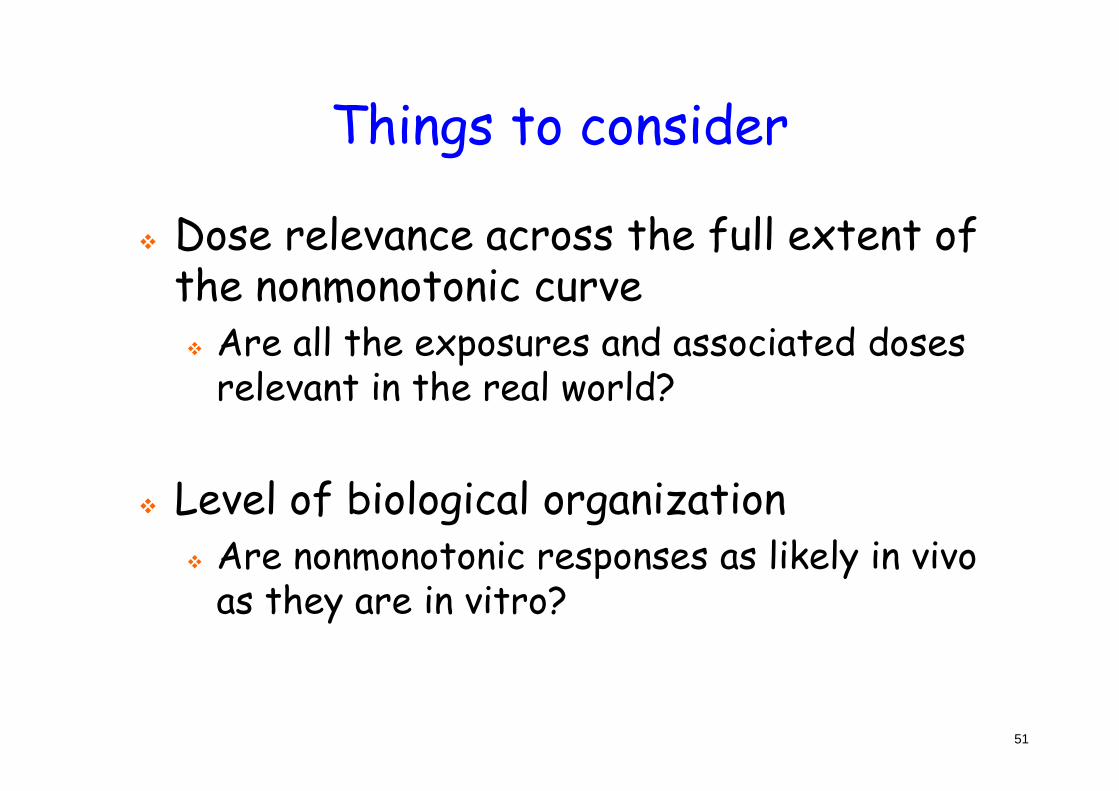
Things to consider
� Dose relevance across the full extent of the nonmonotonic curve� Are all the exposures and associated doses
relevant in the real world?relevant in the real world?
� Level of biological organization� Are nonmonotonic responses as likely in vivo
as they are in vitro?
51
GnRHNeuronal
System
GABA Dopamine
Brain
Gonadotroph
Pituitary
D1 R
D2 R
?
?
Y2 R
NPY
Y1 R
GnRH R
?
GABAA
R
GABAB
RY2 R
D2 R
GnRH
PACAP
Follistatin
Activin PAC1 R
Activin R
FSHββββ LHββββ
GPαααα
Circulating LH, FSH
FSH RLH R
Circulating LDL, HDL
LDL R
HDL R
Outer mitochondrial membrane
StAR
Cholesterol
3
4
5
6
Blood
Compartment
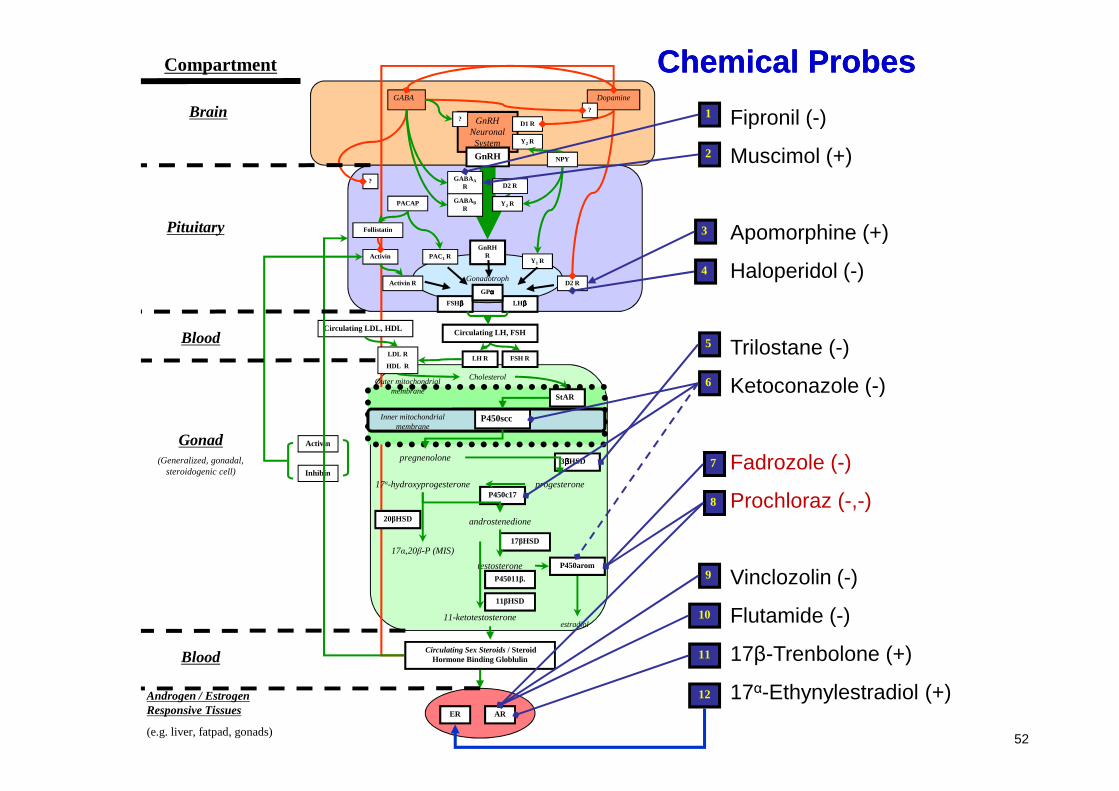
Fipronil (-)
Muscimol (+)
Apomorphine (+)
Haloperidol (-)
Trilostane (-)
Ketoconazole (-)
2
1
Chemical ProbesChemical Probes
52
11βHSD
P45011β.
Activin
Inhibin
Circulating Sex Steroids / Steroid Hormone Binding Globlulin
Inner mitochondrial membrane
StAR
P450scc
pregnenolone 3ββββHSD
P450c17
androstenedione
testosterone
estradiol
Gonad(Generalized, gonadal,
steroidogenic cell)
Androgen / Estrogen Responsive Tissues
(e.g. liver, fatpad, gonads)
ARER
Blood
17βHSD
P450arom
11-ketotestosterone
progesterone17α-hydroxyprogesterone
17α,20β-P (MIS)
20βHSD
Ketoconazole (-)
Fadrozole (-)
Prochloraz (-,-)
Vinclozolin (-)
Flutamide (-)
17β-Trenbolone (+)
17α-Ethynylestradiol (+)
7
8
9
10
11
12

http://sbw.kgi.edu/
Acknowledgements
� Werner Lutz
� David Gaylor
� Gary Ankley� Gary Ankley
� Dan Villeneuve
� Earl Gray
� Miyuki Breen
� Qiang Zhang
54

EndEnd
55