nonmonotonic variation with salt concentration of the second
TRANSCRIPT

PHYSICAL REVIEW E 67, 051404 ~2003!
Nonmonotonic variation with salt concentration of the second virial coefficient in protein solutions
E. Allahyarov,1 H. Lowen,2 J. P. Hansen,3 and A. A. Louis31Institut fur Festkorperforschung, Forschungszentrum Ju¨lich, D-52425 Ju¨lich, Germany
2Institut fur Theoretische Physik II, Heinrich-Heine-Universita¨t Dusseldorf, D-40225 Du¨sseldorf, Germany3Department of Chemistry, Lensfield Road, Cambridge CB2 1EW, United Kingdom
~Received 21 February 2003; published 16 May 2003!
The osmotic virial coefficientB2 of globular protein solutions is calculated as a function of added saltconcentration at fixedpH by computer simulations of the ‘‘primitive model.’’ The salt and counterions as wellas a discrete charge pattern on the protein surface are explicitly incorporated. For parameters roughly corre-sponding to lysozyme, we find thatB2 first decreases with added salt concentration up to a threshold concen-tration, then increases to a maximum, and then decreases again upon further raising the ionic strength. Ourstudies demonstrate that the existence of a discrete charge pattern on the protein surface profoundly influencesthe effective interactions and that linear and nonlinear Poisson Boltzmann theories fail for large ionic strength.The observed nonmonotonicity ofB2 is compared with experiments. Implications for protein crystallization arediscussed.
DOI: 10.1103/PhysRevE.67.051404 PACS number~s!: 82.70.Dd, 61.20.Qg, 87.15.Aa
teaulioo
une
tiath-d
dindbenc
a
geefdiwi
u
tiannoey.ofde
oar-ersuslyins.idrac-ar-
inshecol-ns,canrgedm-
ll asctionthe
nday
tly,otics,
er-er,
s ofin
-her
I. INTRODUCTION
Interactions between proteins in aqueous solutions demine their collective behavior, in particular, their aggregtion, their complexation with other macromolecules, andtimately their phase behavior, including phase separatprecipitation, and crystallization. Any theoretical analysisthe properties of protein solutions must rely on a clearderstanding of their interactions. A good example is providby the control of protein crystallization, which is an essenprerequisite for the determination of protein structure byx-ray diffraction @1,2#. While at present protein crystallization is still mostly achieved experimentally by ‘‘trial anerror,’’ and on the basis of a number of empirical rules@3#,there is clearly a need for a more fundamental understanof the mechanisms controlling protein crystallization, athis obviously requires a good knowledge of the forcestween protein molecules in solution, and of their dependeon solution conditions, includingpH and salt concentration@1,4–6#.
Protein interactions have various origins, and one mconveniently distinguish between direct and induced~or ef-fective! contributions. Direct interactions include short-ranrepulsive forces, which control steric excluded volumefects, reflecting the shape of the protein van der Waalspersion forces, and electrostatic forces associatedpH-dependent electric charges and higher electrostatic mtipoles carried by the protein residues@7#. Other, effective,interactions depend on the degree of coarse graining instatistical description and result from the tracing out of mcroscopic degrees of freedom associated with the solventadded electrolyte, i.e., the water molecules and microioTracing out the solvent results in hydrophobic attraction ahydration forces, while integrating over microion degreesfreedom leads to screened electrostatic interactions betwresidues, the range of which is controlled by the Debscreening length, and hence by electrolyte concentration
However, while coarse graining through eliminationmicroscopic degrees of freedom, leading to state-depen
1063-651X/2003/67~5!/051404~13!/$20.00 67 0514
r---n,f-dle
ng
-e
y
-s-thl-
he-nds.dfene
nt
effective interactions isa priori a reasonable procedure tdescribe highly asymmetric colloidal systems, where pticles have diameters of typically hundreds of nanometand carry thousands of elementary charges, this is obvioless justified for the much smaller and less charged proteIn particular, the assumption of uniformly charged collosurfaces, leading to spherically symmetric, screened intetions between the electric double layers around colloid pticles, as epitomized by the classic DLVO~Derjaguin-Landau-Verwey-Overbeek! potential @8#, ceases to be areasonable approximation at the level of nanometric protecarrying typically of the order of 10 elementary charges. Treason is that length scales that are widely separated inloidal assemblies, become comparable in protein solutiowhile the discreteness of charge distributions on proteinsno longer be ignored, since the distance between two charesidues on the protein surface is no longer negligible copared to the protein diameter. Thus, electrostatic, as weother~e.g., hydrophobic! interactions are much more specifiin proteins, and must be associated with several interacsites, rather than merely with the centers of mass as iscase for~spherical! colloidal particles.
Another very important distinction between colloids aprotein solutions is that the forces between the former mbe measured directly, using optical means@9–11#, while in-teractions between proteins can only be inferred indirecfrom measurements by static light scattering of the osmequation of state which, at sufficiently low concentrationyields the second osmotic virial coefficientB2 @3,12–14#, themain focus of the present paper. The variation ofB2 withsolution conditions yields valuable information on the undlying effective pair interactions between proteins. Moreovit was shown empirically by George and Wilson@3# thatthere is a strong correlation between the measured valueB2 and the range of solution conditions that favor protecrystallization @12,15,16#. Crystallization can only beachieved if the measured value ofB2 falls within a welldefined ‘‘slot.’’ If B2 is too large, repulsive interactions predominate, leading to slow crystallization rates. On the ot
©2003 The American Physical Society04-1
to
isic
seear
ae
y,cala
tioe
i
nea
eniv
to
-in
g
f
an
n
rO
sr’s,
he
in
n
hin
-thgednte-
theno
ex-mayry,rac-
re of
doticn. Inly
rgeter-a
ur-rm-othhef
eye-
areare
he
as
ed,
med
onel’’
ard
s’thehe
ALLAHYAROV et al. PHYSICAL REVIEW E 67, 051404 ~2003!
hand, if B2 is highly negative, strong attractions leadamorphous aggregation.
The correlation betweenB2 and crystallization may berationalized by noting that protein crystals generally coexwith a fairly dilute protein solution, the thermodynamproperties~and, in particular, the free energy! of which areessentially determined byB2. Coexistence between a densolid phase and a dilute fluid phase is generally a signatura very short-ranged attraction between particles as compto their diameter@16–19#.
For such short-ranged attractive interactions, the phseparation into dilute and concentrated proteins solutionspected on the basis of a mean-field van der Waals theorin fact preempted by the freezing transition, i.e., the criti~or ‘‘cloud’’ ! point lies below the freezing line. The criticafluctuations associated with this metastable cloud point mlead to a significant enhancement of the crystal nuclearate @20#, while the position of the cloud point in thconcentration-temperature plane is strongly correlated wthe virial coefficientB2 @16#.
The present paper focuses on the variation ofB2 withionic strength of added salt. This is a particularly importaissue since ‘‘salting out’’ of protein solutions is one of thstandard methods used to induce crystallization. An increin salt concentration reduces the screening length and hthe electrostatic repulsion, allowing short-range attractforces~e.g., of hydrophobic or van der Waals origin! to comeinto play which will ultimately trigger nucleation. Recenexperiments and theoretical considerations point to a nmonotonic variation ofB2 with increasing ionic strength@21–25#, or to a pronounced shoulder in theB2 versus ionicstrength curve@26# in lysozyme solutions. A similar nonmonotonic variation has recently been reportedb-lactoglobulinA solutions@27#. Closely related findings arethe observation of a nonmonotonic cloud point@28–30#, andof a minimum in the solubility of lysozyme with increasinsalt concentration@31,32#; the solubility is obviously relatedto the osmotic virial coefficient@33,34#. Similarly, the attrac-tive interaction parameterl, which controls the variation othe measured protein diffusion coefficientD with volumefraction, was found to exhibit a sharp minimum uponincrease of ionic strength of lysozyme solutions@35#; again,this interaction parameter strongly correlates withB2@36,37#.
Traditional models for the protein-protein interaction canot easily reproduce such nonmonotonic behavior ofB2 orrelated quantities. The ‘‘colloidal’’ approach based on sphecal particles interacting via the screened Coulomb DLVpotential @8# can only predict a monotonic decrease ofB2with ionic strength @5,38#. The same is true for model@5,12,15# accounting for short-range attractions via Baxte‘‘adhesive sphere’’ representation@39#. In these modelswhich assume central pairwise interactions,B2 reduces to asimple integral of the Mayer function associated with tspherically symmetric potential@40,41#. More recent calcu-lations account for the asymmetric shape of proteins@22,42#,or include several ‘‘sticky’’ sites at the surface of the prote@43,44#.
In these traditional calculations, electrostatic interactio
05140
t
ofed
sex-isl
yn
th
t
secee
n-
-
i-
s
between proteins and microions are routinely treated witmean-field Poisson-Boltzmann~PB! theory, generally in itslinearized version~as is the case for the classic DLVO potential!. However, as explained earlier, all relevant lengscales~i.e., protein diameter, mean distance between charsites on the protein surface, and between coions and courions, as well as the Debye screening length! are comparablein protein solutions, so that the discrete nature of bothinteraction sites, and of the coions and counterions, canlonger be ignored. Moreover, Coulomb correlations arepected to be enhanced on the protein length scales andlead to strong deviations from the predictions of PB theowhich have recently been shown to induce short-range atttions, even between much larger colloidal particles@28,45–48#.
The present paper takes into account the discrete natuthe microions within a ‘‘primitive model’’ description of theelectrolyte, and presents results of molecular dynamics~MD!calculations of the equilibrium distribution of coions ancounterions around two proteins and of the resulting osmvirial coefficientB2. Two models of the charge distributioon the surface of the spherical proteins will be consideredthe colloidlike model the charge is assumed to be uniformdistributed over the surface, while in the discrete chamodel, the charges are attached to a small number of inaction sites. The latter model will be shown to lead todistinctly nonmonotonic variation ofB2 with ionic strength,as observed experimentally. During preparation of the crent paper, Strioloet al. @49# published a study, where similacolloidal models for proteins were considered. They exained a colloid that comprises of discrete charges of bsigns to account for nonuniform charge distribution. Tsimulation results of Ref.@49# show a strong influence odipolar interactions on effective forces.
The paper is organized as follows. The model and kphysical quantities are introduced in Sec. II. Simulation dtails are described in Sec. III. Results of the simulationspresented and discussed in Sec. IV, while conclusionssummarized in Sec. V. A preliminary account of parts of tresults was briefly reported elsewhere@50#.
II. MODELS, EFFECTIVE FORCES, AND SECONDVIRIAL COEFFICIENT
The globular proteins under consideration are modeledhard spheres of diametersp , carrying a total~negative!charge2Ze. Within a primitive model representation@51#,the molecular granularity of the aqueous solvent is ignorand replaced by a continuum of dielectric permittivitye,while the monovalent counterions and salt ions are assuto have equal diametersss and chargesqs56e.
Two models are considered for the charge distributionthe surface of the protein. In the ‘‘smeared charge mod~SCM!, the total charge2Ze is assumed to be uniformlydistributed over the spherical surface, which is the standmodel for charge-stabilized colloidal suspensions@28,45–48#, involving highly charged objects. According to Gaustheorem, the SCM is equivalent to the assumption thattotal chargeZe is placed at the center of the sphere. In t
4-2

u
edo
oneob
tr
ge
orar
o
ly
,
llye
n
keureeeicth-
e
la-
of-
is-
yf thethe-the
de-.
ter-
nllypair
ro-o-
NONMONOTONIC VARIATION WITH SALT . . . PHYSICAL REVIEW E 67, 051404 ~2003!
‘‘discrete charge model’’~DCM!, point charges (2e) aredistributed over a sphere of diametersd5asp , in such away as to minimize the electrostatic energy of the distribtion. Obviously, for very smalla, the DCM model will tendto coincide with the SCM model. In practice, the ionizresidues are near the protein surface, and the precise chof a is made according to a Coulomb coupling criterielaborated at the end of Sec. III. The resulting optimizcharge pattern, well known from the classic Thompson prlem ~see Ref.@52# for a recent review!, is kept fixed through-out. Such Thompson patterns do not correspond to thecharge distribution on any specific protein~see Refs.@53,54#,where a simple toy model of lysozyme with different chardistribution corresponding to solutions of differentpH isconstructed! but do provide a well defined discrete model fany value ofZ. Note that the discrete distributions are chacterized by nonvanishing multipole moments, dependingthe symmetry of the distribution for any specific value ofZ,while the SCM implies vanishing multipoles of all orders.
At this stage the SCM and DCM models involve onexcluded volume and bare Coulomb interactions~reduced bya factor 1/e to account for the solvent! between all particlesproteins as well as microions.
The following physical quantities were systematicacomputed in the course of the MD simulations, to be dscribed in the following section.
~a! The density profiles of coions and counterions aroua single globular protein is defined via
r6~rW !5K (j
d~rW j62rW !L . ~1!
Here, rW j6 is the position of thej th microion of species
6 relative to the protein center, while the angular bracdenotes a canonical average over the microion configtions. For an isolated SCM protein these profiles are sphcally symmetric, and depend only on the radial distancr
5urWu. For isolated DCM proteins the profiles are no longspherically symmetric, and may be expanded in spherharmonics. The anisotropy turns out to be weak, and onlyspherically symmetric component@corresponding to averaging r6(rW) over protein orientations# will be shown in thefollowing.
E
05140
-
ice
d-
ue
-n
-
d
ta-ri-
rale
~b! The second quantity, which will be the key input in thcalculation ofB2, is the microion averaged total forceFW 15
2FW 2 acting on the centers of two proteins, placed at a retive positionrW5rW12rW2; the forceFW 1 is a function ofrW. Itsstatistical definition was discussed earlier in the contextcharged colloids@45,55,56#, and it involves three contributions
FW 15FW 1(1)1FW 1
(2)1FW 1(3) . ~2!
FW 1(1) is the direct Coulomb repulsion between the charge d
tributions on the two proteins;FW 1(2) is the microion induced
electrostatic force, whileFW 1(3) is the depletion force that ma
be traced back to the inbalance of the osmotic pressure omicroions acting on the opposite sides of protein 1 due topresence of protein 2.FW 1
(3) is directly expressible as the integral of the microion contact density over the surface ofprotein @57,58#.
In the case of the SCM, the microion averaged forcepends only on the distancer 5urW12u between the two proteinsFor the DCM, on the other hand,FW 1 is a function ofthe relative orientations of the two proteins, as characized by the sets of Euler anglesVW 1 and VW 2, i.e., FW 1
5FW 1(rW,VW 1 ,VW 2).~c! Once the forceFW 1 has been determined as a functio
of rW, VW 1, andVW 2, one may then calculate an orientationaaveraged, but distance resolved, effective protein-proteinpotential according to
V~r !5Er
`
dr8K rW8
urWu•FW 1~rW8,VW 1 ,VW 2!L
VW 1 ,VW 2
, ~3!
where the angular brackets^•••&VW 1VW 2refer to a canonical
statistical average over mutual orientations of the two pteins weighted by the Boltzmann factor of the effective ptential Ve f f(rW,VW 1 ,VW 2) such that ]Ve f f(rW,VW 1 ,VW 2)/]rW5
2FW 1(rW,VW 1 ,VW 2). Explicitly, for any quantityA(rW,VW 1 ,VW 2),
^A&VW 1 ,VW 25
E dVW 1dVW 2A~rW,VW 1 ,VW 2!exp$~2Ve f f~rW,VW 1 ,VW 2!/kBT!%
E dVW 1dVW 2exp$2Ve f f~rW,VW 1 ,VW 2!/kBT%
. ~4!
In practice, the anisotropy ofVe f f turns out to be sufficientlyweak so as to justify an unweighted angular average in~4!, i.e., to set the Boltzmann factor equal to 1.
~d! The second virial coefficientB2 finally follows fromthe expression
q. B251
2E drW@12b~r !#, ~5!
where
4-3

M
o-
d
ng
ee
son
d
nhedddi
otr
g-ics
mo
nn-
ng,
di--
en-ye
salt
u-
iswor sur-heare
e
ALLAHYAROV et al. PHYSICAL REVIEW E 67, 051404 ~2003!
b~r !5S 1
8p2D 2E dVW 1dVW 2exp@2Ve f f~rW,VW 1 ,VW 2!/kBT#.
~6!
The angular integrations are trivial in the case of the SCwhereVe f f depends only onr. In the case of the DCM, onemay use the identity
b~r !5expF2Er
`
dr8d
dr8@ ln b~r 8!#G , ~7!
to show thatB2 may be cast in a form similar to that apprpriate for the SCM, namely,
B251
2E drW@12exp$2V~r !/kBT%#, ~8!
whereV(r ) is the potential of the orientationally averageprojected force, as defined in Eq.~3!. As pointed out earlier,B2 is directly accessible experimentally by extrapolatilight scattering data to small wave vectors@41# or by takingderivatives of osmotic pressure data with respect to conctration @13,14#. Results will be presented in the form of threduced second virial coefficientB2* 5B2 /B2
(HS) , whereB2
(HS)52psp3/3, i.e.,
B2* 5113
sp3Esp
`
r 2dr@12exp$2V~r !/kBT%#. ~9!
III. SIMULATION DETAILS
We study a pair (Np52) of spherical proteins withcenter-to-center separationr, confined in a cubic box oflength L54sp , which also contained monovalent coionand counterions in numbers determined by their bulk ccentrations and overall charge neutrality. There areZNpcounterions dissociated from the protein surface, andNsadded salt ion pairs such that the screening of proteins isto N15Ns coions andN25Ns1ZNp counterions in thesimulation box. A snapshot of a typical equilibrium microioconfiguration around two proteins is shown in Fig. 1 for tprotein charge numberZ515. The two proteins were placesymmetrically with respect to the center along the bodyagonal of a cubic simulation cell; periodic boundary contions in three dimensions were adopted.L was chosen suchthat the box length is much larger than the range of the t~effective! protein-protein interaction, so that the results aindependent ofL for nonzero salt concentration. The lonrange electrostatic interactions between two charged partin the simulation box with periodic boundary conditionwere modified using the Lekner summation method of iages@59#. For our model to be a rough representationlysozyme, we chosesp54 nm, and three different proteichargesZ56,10, and 15, corresponding to three differevalues of the solutionpH. The microion diameter was chosen to besc5sp/1550.267 nm.
For both the SCM and the DCM, the contact coupliparameter between a protein and a microion, namelyG
05140
,
n-
-
ue
i--
ale
les
-f
t
52e2/@ekBT(sp2sd1sc)# for the DCM, and G52Ze2/@ekBT(sp1sc)# for the SCM, are comparable, anof the order ofG'3 at room temperature. We fixed the delectric constant of water to bee581 and the system temperature to beT5298 K. Varying salt concentration for fixedprotein chargeZ corresponds to a fixed solutionpH @60#.
Details of the runs corresponding to different salt conctrations are summarized in Table I. Note that the Debscreening lengthr D , defined by
r D5A ekBTV
8p~Ns1Z!qse2
~10!
is less than 10 Å for salt concentration beyond 0.1M . Here,V is the accessible volume for salt ions such that the
FIG. 1. Snapshot of a typical MD-generated microion configration around two proteins, separated byr 51.7sp . The proteinscarry 15 discrete charges2e and the monovalent salt densityCs50.206 mol/l. The globular protein molecules are shown as tlarge gray spheres. The embedded small dark spheres on theiface mimic the discrete protein charges in the DCM model. Tsmall gray spheres are counterions, while the black spherescoions.
TABLE I. Parameters used for the different simulation runs.Ns
is the number of salt ion pairs in simulation box,Cs is the saltconcentration in mol/l, the Debye screening lengthr D is defined byEq. ~10!, and r s5„3V/4p(2Ns12Z)…1/3 is the average distancbetween salt ions for a given salt concentration.
Run Ns Cs ~mol/l! r D /sp r s /sp
1 0 0 0 02 125 0.05 0.34 0.393 250 0.103 0.24 0.314 500 0.206 0.17 0.255 1000 0.412 0.12 0.26 1500 0.62 0.1 0.177 2000 0.824 0.085 0.168 2500 1.03 0.077 0.159 3000 1.24 0.07 0.1410 4000 1.65 0.06 0.12411 5000 2.061 0.054 0.118
4-4

e
celcs
te
-tsin
nnda
coy.cei-
cturt
tetr
is
heuaT
tailseen
rds
berun-nd
o-ive
ortedred
cursic-n-airehis
n-
,
theeonith
NONMONOTONIC VARIATION WITH SALT . . . PHYSICAL REVIEW E 67, 051404 ~2003!
concentrationCs is Ns /V. Thus, the point charges on thprotein surface are effectively screened from each other@29#.For each of the runs indicated in Table I, the distanresolved effective forces and interaction potentials are calated according to Eqs.~2! and ~3!. The statistical averageover microion configurations leading toFW 1
(2) and FW 1(3) were
evaluated from time averages in the MD simulations.
IV. MICROION DISTRIBUTIONS AROUNDA SINGLE PROTEIN
First, as a reference, consider a single protein (Np51)placed at the center of the simulation box. We calculaspherically averaged, radial microion density profilesr(r )5r1(r )1r2(r ) in the immediate vicinity of the protein surface. For a singleneutral sphere in a salted solution, resulfor r(r ) are drawn in Fig. 2. There is a marked depletionthe microion density, signaled by a minimum ofr(r ) at con-tact, well below the asymptotic bulk value. For low salt cocentration, the observed depletion zone of salt ions arouneutral sphere is in qualitative agreement with the standanalysis based on the linearized theory which involves arection;2exp(22r/rD)/r2 @61# to the homogeneous densitThe depletion is enhanced upon increasing the salt contration. At sufficiently high salt concentrations, this minmum is followed by a weak, but detectable, ion layer~seecorresponding lines for runs 7 and 9 in Fig. 2!. The forma-tion of a depletion zone isnot a consequence of the dire~hard-core! interaction between salt ions and the protein sface, since the position of the observed layer is significanfurther away from the protein surface than one ion diameA rough estimate for the distance between layer and neusphere gives a value of 2.5ss , or equivalently 0.17sp . Forruns 7 and 9, where the ion layer emerges, this distancethe order of an average ion separationr s in the system andtwice the Debye screening lengthr D as well ~see Table I!.Obviously, it is the small ion correlations that lead to tpeak formation in the salt density profiles. An intuitive argment is that the lack of mutual polarization in a dense ssolution near neutral surfaces causes ion depletion.
FIG. 2. Normalized total salt density profilesr(r ) near a singleneutral sphere. r05Ns /V is the bulk density. The added salt cocentration is increased from top to bottom~see the arrow, whichrefers to the density near the protein surface! according to runs 1–57, 9.
05140
-u-
d
-a
rdr-
n-
-lyr.al
of
-lthe
physical meaning of this depletion is discussed in more dein Ref. @61#. Qualitatively similar depleted density profilewere observed in Lennard-Jones system confined betwneutral planes@62# and in Yukawa mixtures@63#. Further-more, an effective force that pushes a single ion towaregions of higher salinity is predicted within Debye-Hu¨ckeltheory for interfacial geometries@64#.
Next we consider a protein sphere with charge numZ510. The total salt densities, as sums of coions and coterion densities, are shown in Fig. 3 for both the SCM aDCM. At the lower salt concentrations~up to run 5! the SCMand DCM models both yield an accumulation of the micrion density near ion-protein contact, in semiquantitatagreement with the prediction of standard PB theory. Frising ionic strength, the total microion density gets deplenear the protein surfaces, as in the previously considecase of a neutral sphere. Remarkably, this depletion ocboth with the SCM and DCM and contradicts the PB predtion. The intuitive picture is that a microscopic layer of couterions is formed around the proteins. An additional salt pnow profits more from the bulk polarization than from thprotein surface polarization and is thus excluded from t
FIG. 3. Total salt density near a single protein surface forSCM ~a! and the DCM~b! models and runs 2–5, 7, 9, 11. Tharrow ~in the direction of an increase in added salt concentrati!applies to all runs except run 11, which is shown as a solid line wsymbols.
4-5

ty,3
CMta
eonl isaorrfa
it
P
ns
ateodna
ala
onhereulthio-bebn
tiogsd
re-
inco-the
rce
for
s-re-
-
in-hed
the
ALLAHYAROV et al. PHYSICAL REVIEW E 67, 051404 ~2003!
layer. By normalizing the profiles to the total bulk densithis effect becomes visible as a depletion zone in Fig.where a noticeable difference between the SCM and Dprofiles also emerges. Whereas the DCM predicts a convalue rc„r 5(sp1sc)/2… larger than the bulk value, thSCM predicts a much stronger microion depletion near ctact. More generally, the contact value of the DCM modealways larger than that of the SCM model for the sameconcentrations. This finding illustrates the sensitivity of crelation effects to the assumed charge pattern at the suof a protein. This correlation effect is, of course, absentlinear and nonlinear PB theories, which always predicmonotonically decreasing density profiler(r ). A direct com-parison between the SCM, DCM models and nonlineartheory solved in a spherical cell within the SCM@65# isshown in Fig. 4 for two of the higher salt concentratiofrom Fig. 3. For the intermediate salt concentrationCs50.206 mol/l ~run 4! both simulation and theory predictmonotonic decrease of salt density away from the prosurface. Surprisingly, the PB result for the SCM is in goagreement with the simulation result for the DCM. This tedency is observed up to run 5, we believe that it is due toartificial cancellation of errors in the PB treatment of smion densities. It is a well known fact that near a colloidsurface the PB densities are higher than the simulatedfor the traditional SCM colloids. On the other hand, tDCM densities are systematically larger than the SCMsults at ion-protein contact, as shown in Fig. 3. As a resthe PB results turn out to be closer to the DCM than toSCM densities. In the case of the higher salt concentratCs50.824 mol/l ~run 7!, the simulation results strongly deviate from the PB predictions. Note that the long-rangehavior of the concentration profiles is not well reproducedthe PB cell model. A comparison between the SCM aDCM results for run 7~solid and dashed lines in Fig. 4!reveals a strong colloidal charge-counterion pair associafor the DCM. This result is in accordance with the findinof Ref. @66#, where a significant influence of the colloi
FIG. 4. Total density profilesr(r ) of salt ions around a singleprotein with Z510, for run 4 ~bottom set of curves! and run 7~upper set of curves!, comparing the DCM simulations~solid line!,the SCM simulations ~dashed line!, and nonlinear PoissonBoltzmann theory of the SCM~squares connected by lines!.
05140
,
ct
-slt-ce
na
B
in
-nlles
-t,en,
-yd
n
charge discretization on the counterion distribution isvealed.
A multipole expansion of the total salt number densitythe DCM, demonstrates that the higher order expansionefficients are strongly damped and much weaker thanzero-order homogeneous term shown in Figs. 3 and 4.
Effective force and B2 for a protein pair
Next we consider the angularly averaged effective foF(r )52dV(r )/dr and potentialV(r ) between two proteinsembedded in a sea of small salt ions. Simulation resultsthe simpler case of the SCM are plotted in Fig. 5 forZ510 and compared with the DLVO theory. There is a sytematic deviation between the theoretical and simulationsults. While the DLVO@8# potential
U (DLVO)~r !5ZDLVO
2 e2
erexp~2r /r D!, ~11!
FIG. 5. Total forceF(r ) ~a! and interaction potentialV(r ) ~b!versus dimensionless distancer /sp within the SCM, for a proteinchargeZ510. The force is divided byF05kBT/lB , where lB
5e2/ekBT is the Bjerrum length. The added salt concentrationcreases from top to bottom, according to runs 1, 3, 5, 11. Daslines correspond to the DLVO theory. The inset in~b! shows inmore detail the differences between the SCM simulations andDLVO potential for run 11.
4-6

tha-
io
tisee
eg
roeit
-
thf
tro-teri-
wo
be-oratoro-
eninns
lesre-,
-
ss in
r a
NONMONOTONIC VARIATION WITH SALT . . . PHYSICAL REVIEW E 67, 051404 ~2003!
whereZDLVO5Z exp@(sp1sc)/2r D#/@11(sp1sc)/2r D#, al-ways results in a repulsive force, the simulations indicatepossibility of an attraction between proteins for large sconcentrations. The forceF(r ) at the higher salt concentrationsCs shows a maximum at a distancer nearly equal to theion diameter. Note that, for the highest salt concentratconsidered,Cs52.061 mol/l~run 11!, where the electrostaticinteractions are almost completely screened out, the effecforceF(r ) is dominated by entropic effects, see also the inin Fig. 5~b!; it is reminiscent of the entropic depletion forcof hard sphere system. The corresponding potential is ntive at short distances, as shown in the inset of Fig. 5~b!, andis related to the depletion in the microion total density pfiles r(r ) around an isolated protein, shown in Fig. 3. Wnote that such an entropic attraction is not containedDLVO theory. Its origin is also different from the salting-oueffect studied in Refs.@12,67–70# or the macroion over-charging effect studied in Ref.@71#. In Fig. 6, the salt dependence of the total interaction forceF(r ) @Eq. ~2!# is brokenup into its componentsF (2) andF (3) for two values ofr. Thishelps to show that at large salt concentrations it is indeedentropic component that causes the force to be attractive
FIG. 6. The total forceF ~circles! and its electrostaticF (2)
~squares! and entropicF (3) ~triangles! components versus salt concentration. The separation distance is fixed at~a! r /sp51 and~b!r /sp51.1. The simulations are for the SCM withZ510, and showthat at high salt concentrations, the entropic force dominates.
05140
elt
n
vet
a-
-
n
eor
run 11 in Figs. 5~a! and 6~a!. Finally, we mention that therange of attraction observed here will depend on the eleclyte ~salt ion! size@72#. This feature of our model may hint aa cause for the salt specificity observed in salting-out expments on protein crystallization@73#.
The same calculations were carried out for the other tprotein charges in the SCM model,Z56 andZ515, withqualitatively similar results to those obtained forZ510. Forall charges and salt densities considered, the long-rangehavior of interaction forces and potentials is always in poquantitative agreement with the DLVO predictions. Forbetter match of theory and simulation, one would havecarry out an additional rescaling procedure of the bare ptein chargeZ @in Eq. ~11!#.
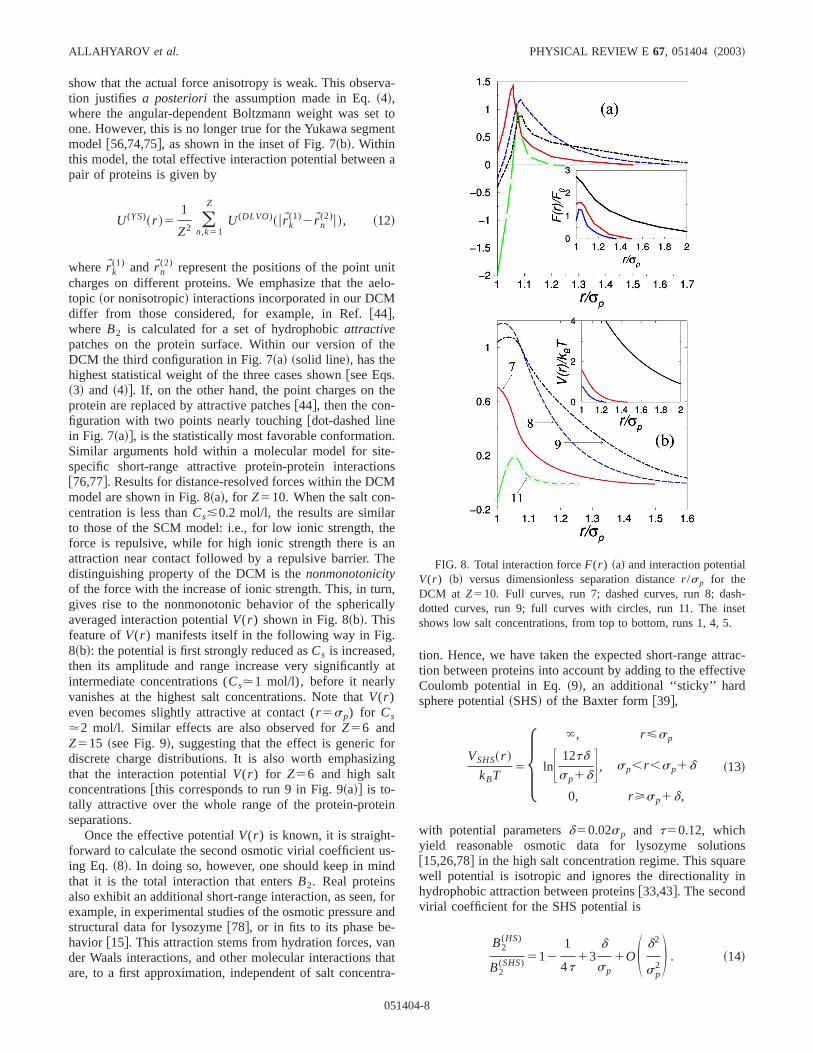
It is clear that the effective forces and potentials betwetwo proteins will no longer be spherically symmetric withthe DCM model. Three distinguishable mutual orientatioof the two proteins are schematically outlined in Fig. 7~a!,corresponding to particular configurations of the Euler angVW 1 ,VW 2 of the two proteins. Nevertheless, our simulationsults, presented in Fig. 7~b!, for these three orientations
FIG. 7. ~a! An illustration of three different mutual orientationof two proteins. Points inside spheres represent protein chargethe DCM. ~b! Total interaction forceF(r ) versus dimensionlessseparation distancer /sp for mutual orientations shown in~a! forrun 5 andZ510 in the DCM. The inset shows the same, but foYukawa segment model.
4-7
rv
ten
n
ite
th
he
n.e-nM
-rheanh
rnll
.
a
orin
in
usnd
, fa
-anthtr
trac-ive
nsrein
l
sh-et
.
ALLAHYAROV et al. PHYSICAL REVIEW E 67, 051404 ~2003!
show that the actual force anisotropy is weak. This obsetion justifies a posteriori the assumption made in Eq.~4!,where the angular-dependent Boltzmann weight was seone. However, this is no longer true for the Yukawa segmmodel @56,74,75#, as shown in the inset of Fig. 7~b!. Withinthis model, the total effective interaction potential betweepair of proteins is given by
U (YS)~r !51
Z2 (n,k51
Z
U (DLVO)~ urWk(1)2rWn
(2)u!, ~12!
whererWk(1) and rWn
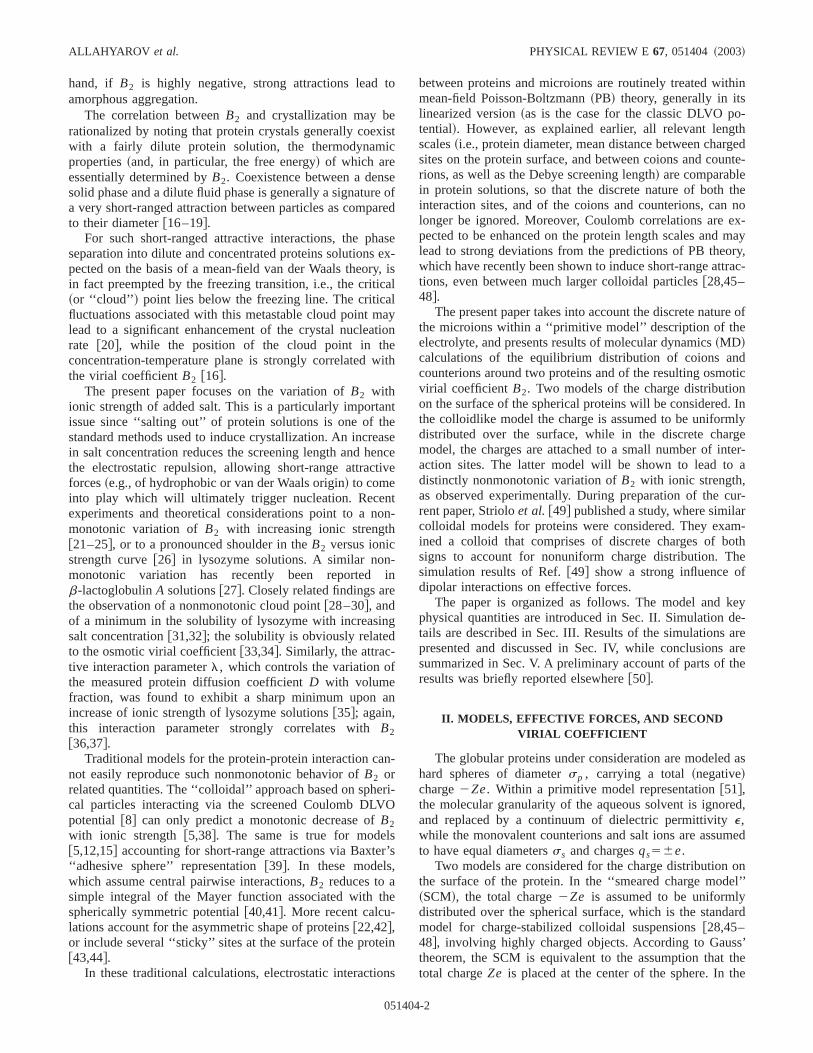
(2) represent the positions of the point uncharges on different proteins. We emphasize that the atopic ~or nonisotropic! interactions incorporated in our DCMdiffer from those considered, for example, in Ref.@44#,where B2 is calculated for a set of hydrophobicattractivepatches on the protein surface. Within our version ofDCM the third configuration in Fig. 7~a! ~solid line!, has thehighest statistical weight of the three cases shown@see Eqs.~3! and ~4!#. If, on the other hand, the point charges on tprotein are replaced by attractive patches@44#, then the con-figuration with two points nearly touching@dot-dashed linein Fig. 7~a!#, is the statistically most favorable conformatioSimilar arguments hold within a molecular model for sitspecific short-range attractive protein-protein interactio@76,77#. Results for distance-resolved forces within the DCmodel are shown in Fig. 8~a!, for Z510. When the salt concentration is less thanCs&0.2 mol/l, the results are similato those of the SCM model: i.e., for low ionic strength, tforce is repulsive, while for high ionic strength there isattraction near contact followed by a repulsive barrier. Tdistinguishing property of the DCM is thenonmonotonicityof the force with the increase of ionic strength. This, in tugives rise to the nonmonotonic behavior of the sphericaaveraged interaction potentialV(r ) shown in Fig. 8~b!. Thisfeature ofV(r ) manifests itself in the following way in Fig8~b!: the potential is first strongly reduced asCs is increased,then its amplitude and range increase very significantlyintermediate concentrations (Cs.1 mol/l), before it nearlyvanishes at the highest salt concentrations. Note thatV(r )even becomes slightly attractive at contact (r 5sp) for Cs.2 mol/l. Similar effects are also observed forZ56 andZ515 ~see Fig. 9!, suggesting that the effect is generic fdiscrete charge distributions. It is also worth emphasizthat the interaction potentialV(r ) for Z56 and high saltconcentrations@this corresponds to run 9 in Fig. 9~a!# is to-tally attractive over the whole range of the protein-proteseparations.
Once the effective potentialV(r ) is known, it is straight-forward to calculate the second osmotic virial coefficienting Eq. ~8!. In doing so, however, one should keep in mithat it is the total interaction that entersB2. Real proteinsalso exhibit an additional short-range interaction, as seenexample, in experimental studies of the osmotic pressurestructural data for lysozyme@78#, or in fits to its phase behavior @15#. This attraction stems from hydration forces, vder Waals interactions, and other molecular interactionsare, to a first approximation, independent of salt concen
05140
a-
tot
a
lo-
e
s
e
,y
t
g
-
ornd
ata-
tion. Hence, we have taken the expected short-range attion between proteins into account by adding to the effectCoulomb potential in Eq.~9!, an additional ‘‘sticky’’ hardsphere potential~SHS! of the Baxter form@39#,
VSHS~r !
kBT5H `, r<sp
lnF 12td
sp1dG , sp,r ,sp1d
0, r>sp1d,
~13!
with potential parametersd50.02sp and t50.12, whichyield reasonable osmotic data for lysozyme solutio@15,26,78# in the high salt concentration regime. This squawell potential is isotropic and ignores the directionalityhydrophobic attraction between proteins@33,43#. The secondvirial coefficient for the SHS potential is
B2(HS)
B2(SHS) 512
1
4t13
d
sp
1OS d2
sp2D . ~14!
FIG. 8. Total interaction forceF(r ) ~a! and interaction potentiaV(r ) ~b! versus dimensionless separation distancer /sp for theDCM at Z510. Full curves, run 7; dashed curves, run 8; dadotted curves, run 9; full curves with circles, run 11. The insshows low salt concentrations, from top to bottom, runs 1, 4, 5
4-8

iore-tht
in
tye-
en
re
ia
g
eing-
ro-al
etial.
nged
re
,
Ooni-ple
NONMONOTONIC VARIATION WITH SALT . . . PHYSICAL REVIEW E 67, 051404 ~2003!
Short-range attractions lead to ‘‘energetic fluid’’ behav@79#, where the crystallization is driven primarily by the dtails of the interactions, instead of being dominated byusual entropic hard-core exclusions. This suggests thatdirectionality may be very important for details of the protecrystallization behavior@43#. However, for the physicallysimpler behavior of the virial coefficient, the directionalican be ignored in a first approximation. For simplicity, wassume the parametert to be independent of electrolyte conditions, although a weak dependence based on experimobservations is reported in Refs.@26,77#. The addition ofVSHS(r ) strongly magnifies the nonmonotonicity ofB2 stem-ming from the nonmonotonic behavior ofV(r ) near contact.
Results forB2* as a function of salt concentration ashown in Fig. 10 for three different protein charges@80#.There is a considerablequalitative difference between thepredictions of the SCM and the DCM models for the vartion of B2* with monovalent salt concentrationCs for eachprotein chargeZ. Whereas the SCM~curves with symbols inFig. 10! predicts a monotonic decay ofB2* with Cs , the
FIG. 9. The same as in Fig. 8 but now for protein charges~a!Z56 and ~b! Z515. The run numbers are placed next to corsponding curves. The result for run 1 in~a! is reduced four times tofit the y-axis scale. The inset in~b! shows low salt concentrationsfrom top to bottom, runs 1, 4, 5, 7.
05140
ehe
tal
-
DCM leads to a markedly nonmonotonic variation, involvinan initial decay towards a minimum~salting out! followed bya subsequent increase to a maximum~salting in! and a finaldecrease at highCs values~salting out!. The location of thelocal minima shifts to higher or lower values ofCs for largeror smaller protein chargesZ. Thus, for larger protein chargone needs a higher salt concentration to achieve the ‘‘saltout’’ conditions conducive to protein crystallization@41#.Even though the effective Coulomb potential between pteins is weak, with an amplitude of the order of the thermenergykBT, its effect onB2 is dramatically enhanced by thpresence of the strong short-range attractive Baxter potenWe remark that the nonmonotonicity inB2 occurs at thesame salt concentrations in the absence of the short-ra
- FIG. 10. Normalized second virial coefficientB2* 5B2 /B2(HS) of
a protein solution versus salt concentrationCs . The lines with~without! symbols correspond to the SCM~DCM! model. In~a! theresults are shown for protein chargesZ56 ~dashed lines! and Z515 ~solid lines!. Results forZ510 are given in~b! together witha normalized second virial coefficient corresponding to the DLVpotential. Whereas the SCM virial coefficients decrease monotcally with increasing salt concentration, as expected from simscreening arguments, the DCM shows a markednonmonotonicin-crease ofB2 at intermediate salt concentrations.
4-9

inthst
s
um
oofd
tMtFiffith
ith
e
sy
ofblerms
ichn atctsen-fto
Wed tox-ara-
ter-the-
pro-ta-
bysalttricuch
.g.,
a-ive
eine
r’’
ityof
ins.f
ig.
sitecan
eence
v-
altno-krgs.ws:
ba
b-
d
ALLAHYAROV et al. PHYSICAL REVIEW E 67, 051404 ~2003!
attraction; but the difference between the maximal and mmal B2 in this case is only about 10% as compared todata of Fig. 10. Different short-range potentials would julead to different levels of enhancement but would not leadqualitative changes.
It has recently been proposed@41# that the following‘‘bare’’ second osmotic virial coefficient of protein solutionshould be independent of the protein chargeZ and the saltconcentrationCs , for not too lowCs , namely,
B2(0)5B22Z2/4Cs . ~15!
This remarkable scaling, which has been observed for a nber of experimental conditions@41#, may be explained bysimple arguments based on Donnan equilibrium@81#. Asshown, for example, in Fig. 1 of Ref.@81#, this simple rela-tion holds remarkably well above a salt concentration ofCs'0.25 M for a wide range of experimental measurementsB2 for lysozyme, which all tend to a plateau valueB2
0/B2(HS)'(22.760.2). One implication of this observe
scaling is that the attractive interactions that governB2(0) are
indeed roughly independent of salt concentrations aboveCs'0.25 M . When the same scaling procedure is appliedour B2 curves, a similar plateau develops for both the DCand the SCM models, albeit withB2
(0) less negative than thafound in the experiments, as seen in Fig. 11. The inset to11 shows that the bare SCM and DCM second virial coecients forZ510 go over to a plateau value determined by‘‘sticky sphere’’ result~14!.
One could, of course, very easily match our data wexperiments by adjusting the value oft, but in keeping withour earlier work@50# this is not attempted here. Clearly thscaling does bring the DCM and SCMB2’s close together fora givenZ, but for differentZ the scaling collapse is not agood as that seen in experiments, since it sets in onl
FIG. 11. The same data as in Fig. 10 are shown here for thevirial coefficient defined by@B22Z2/4Cs#/B2
(HS) . The arrow is aguide to the eye for the direction of increasing protein chargeZ. Thescaling collapse at highCs has been related to a Donnan equilirium effect @81#. In the inset, results for the DCM~solid line! andSCM ~symbols! for Z510 are compared with the result corresponing to the sticky hard sphere potential, Eq.~14!, alone ~dashedlines!.
05140
i-eto
-
f
o
g.-e
at
larger Cs . Nevertheless, considering the high densitycoions and counterions in the simulation, it is remarkathat a simple Donnan argument based on ideal gas teperforms so well.
The origin of the nonmonotonic variation ofB2* with Cs
can be traced back to the subtle correlation effects whcause an enhancement of the effective Coulomb repulsiointermediate salt concentrations in the DCM. These effecannot be rationalized in terms of simple mean-field screing arguments@54#. The protein-microion correlations are oa different nature than those in the SCM, where they leada much more conventional, monotonic decay ofB2 with Cs ,similar to that expected from a simple screening picture.emphasize that the observed nonmonotonicity is unrelatethe mutual protein orientations illustrated in Fig. 7. It is eplicitly shown in Fig. 7~b! that mutual orientations havesignificant influence on the interaction force at small sepation distancesr ,1.025sp . However, Fig. 8~a! reveals thatthe range of distances where a nonmonotonicity of the inaction force versus added salt is apparent is fairly beyonddistancer .1.1sp . Thus, the interaction force is nonmonotonic versus added salt at distances about 8 Å from thetein surface, where the influence of mutual protein orientions is negligible. The relatively long-range behavior~ascompared to the linear Debye screening lengthr D) of thenonmonotonicity of the force versus added salt is entailedthe strong coupling between protein surface charge andions in the DCM model and correlations between the elecdouble layers associated with these surface charges. Scorrelations could result in long-range interactions, due, eto an overcharging effect~see Ref.@82#!.
In order to gain further insight into the physical mechnism responsible for the unusual variation of the effectinteraction potential and ofB2 with salt concentration in theDCM, we consider the influence of a second nearby proton the microion distribution close to a central protein. Whave computed the difference between ‘‘inner’’ and ‘‘outeshell microion contact densities forZ510, as schematicallyillustrated in the inset in Fig. 12. The local microion densis no longer spherically symmetric, due to the interferencethe electric double layers associated with the two proteThe differenceDr5r in2rout between the mean number omicroions within a fraction of a spherical shell of radiusR50.6sp subtended by opposite 60° cones, is plotted in F12 versus salt concentration.Dr is always positive, indicat-ing that microions~ mainly counterions! tend to cluster in theregion between the proteins, rather than on the opposides. This may be understood because the counterionslower the total electrostatic energy by being shared betwtwo proteins. However, there is a very significant differenin the variation ofDr with salt concentrationCs , betweenthe SCM and the DCM models. Both exhibit similar behaior for lower salt concentrationsCs<0.5 mol/l; for example,both show a small maximum around 0.2 mol/l. But for sconcentrations above 0.5 mol/l, the SCM predicts a motonic decrease ofDr, while the DCM leads to a sharp peain Dr for Cs.1 mol/l. This highly nonmonotonic behavioclearly correlates with the nonmonotonicity observed in Fi8–10. The basic mechanism can be summarized as follo
re
-
4-10

the,e
rgt
herand
c-
i-arsedis-
icardse
PBthei-
eved
ins
oresD
eryto
ticedon.uchfitya-t’’pos--
e-r
n
G., D.ns;
an-
ur
o
ethel
a
res p
NONMONOTONIC VARIATION WITH SALT . . . PHYSICAL REVIEW E 67, 051404 ~2003!
For the DCM, the excess number of microions betweentwo proteins leads to an excess entropic pressure or forcdemonstrated in Fig. 13, which is the origin of the increasrepulsion between proteins aroundCs51 mol/l. The en-hanced microion density arises from subtle crowded chacorrelation effects that cannot easily be understood a
FIG. 12. Difference in the microion densities between and oside two proteins near contact,Dr, versus salt concentration foprotein chargeZ510 at a protein-protein separation ofr 51.2sp .The solid and dashed lines correspond to the DCM and SCM mels, respectively. The inset shows the angular range over whichDris averaged~see text!. The nonmonotonic density profile for thDCM lies at the origin of the nonmonotonic behavior seen forforces, potentials, and virial coefficients calculated for this mod
FIG. 13. The electrostatic~dashed lines! and entropic~solidlines! components of the protein-protein interaction force atprotein-protein separationr 51.2sp , in units of kBT/lB , versussalt concentrationCs , for a protein charge ofZ510. Lines with orwithout symbols correspond to SCM or DCM results. This figudemonstrates that the difference between the two models arisemarily from the contributions of the entropic force.
05140
easd
ea
mean-field level. It was suggested in Ref.@32# that such anenhancement of the cation density around lysozyme at higsalt concentrations could increase the net protein chargelead to nonmonotonicity in the lysozyme solubility.
V. CONCLUSIONS
In conclusion, we have calculated the effective interations and the second osmotic virial coefficientB2 of proteinsolutions incorporating the electrostatics within the ‘‘primtive’’ model of electrolytes. In this way, we include nonlinescreening, overscreening, and correlation effects miswithin the standard Poisson-Boltzmann description. For dcrete charge distributions, the interactions and relatedB2vary in a nonmonotonic fashion with increasing ionstrength, while for the smeared charge model, a standworkhorse of colloidal physics, this effect is absent. Thecorrelation-induced effects are missed within nonlineartheory, and similar coarse-graining techniques taken fromtheory of colloids. In addition to this, our simulations indcatethe necessity of taking entropic forces into accountwhentreating systems on the nanoscale. These forces are belito be essential in the salting-out effect@73,83# and could leadto an attraction even between neutral globular prote@28,84#.
Our MD calculations can easily be extended to the mcomplex (pH dependent! charge patterns of realistic protein@85#. In fact, in some cases it may be easier to do a full Msimulation than to solve the nonlinear PB equations in a vcomplicated geometry. We expect mechanisms similarthose found for the DCM to carry over to the more realisprotein models, leading, for example, to an enhancprotein-protein repulsion at intermediate salt concentratiSince the second osmotic virial coefficient determines mof the excess~nonideal! part of the chemical potential osemidilute protein solutions, we expect the nonmonotonicof B2 to have a significant influence on protein crystalliztion from such solutions in the course of a ‘‘salting-ouprocess. The nonmonotonic behavior also suggests thesibility of an inverse, ‘‘salting-in’’ effect, whereby a reduction of salt concentration may bringB2 into the ‘‘crystalliza-tion slot’’ @3,12#. The sensitivity ofB2 to ion-correlationeffects may help to explain the salt specificity of thHofmeister series@73#. Finally, we stress that our nonmonotonicity is qualitatively different from that observed foadded nonadsorbing@86,87# and adsorbing@88# polymers orthat which result from incorporating repulsive hydratioforces at higher salt concentrations@23,24#.
ACKNOWLEDGMENTS
The authors are grateful to R. Piazza, I. L. Alberts, P.Bolhuis, G. Bricogne, J. Clarke, S. Egelhaaf, J. F. JoannyRowan, R. Blaak, and W. C. K. Poon for useful discussioand to the German Science Foundation~DFG!, SchlumbergerCambridge Research, and the Isaac Newton Trust for fincial support.
t-
d-
e.
ri-
4-11

l.,l.
as
ys
d
itz
e
ys
.
J
Zu
m
E
k-
r.,
,D:
em.
d
L.
d.
sica
d
-
.
ALLAHYAROV et al. PHYSICAL REVIEW E 67, 051404 ~2003!
@1# S.D. Durbin and G. Feher, Annu. Rev. Phys. Chem.47, 171~1996!.
@2# A. Tardieu, A. Le Verge, M. Malfois, F. Bonnete´, S. Finet, M.Ries-Kautt, and L. Belloni, J. Cryst. Growth196, 193 ~1999!.
@3# A. George and W. Wilson, Acta Crystallogr., Sect. D: BioCrystallogr.D50, 361 ~1994!; A. George, Y. Chiang, B. GuoA. Arabshahi, Z. Cai, and W.W. Wilson, Methods Enzymo276, 100 ~1997!.
@4# F. Rosenberger, P.G. Vekilov, M. Muschol, and B.R. ThomJ. Cryst. Growth168, 1 ~1996!.
@5# R. Piazza, Curr. Opin. Colloid Interface Sci.5, 38 ~2000!.@6# K.A. Dill, Nature ~London! 400, 309 ~1999!.@7# S. Tamashima, Biopolymers58, 398 ~2001!.@8# B.V. Derjaguin and L.D. Landau, Acta Physicochim. URSS14,
633 ~1941!; E. J. W. Verwey and J.T.G. Overbeek,Theory ofthe Stability of Lyophobic Colloids~Elsevier, Amsterdam,1948!.
@9# G.M. Kepler and S. Fraden, Phys. Rev. Lett.73, 356 ~1994!.@10# A.E. Larsen and D.G. Grier, Nature~London! 385, 230~1997!.@11# R. Verma, J.C. Crocker, T.C. Lubensky, and A.G. Yodh, Ph
Rev. Lett.81, 4004~1998!.@12# D.F. Rosenbaum and C.F. Zukoski, J. Cryst. Growth169, 752
~1996!.@13# Y.U. Moon, R.A. Curtis, C.O. Anderson, H.W. Blanch, an
J.M. Prausnitz, J. Solution Chem.29, 699 ~2000!.@14# Y.U. Moon, C.O. Anderson, H.W. Blanch, and J.M. Prausn
Fluid Phase Equilib.168, 229 ~2000!.@15# D. Rosenbaum, P.C. Zamora, and C.F. Zukoski, Phys. R
Lett. 76, 150 ~1995!.@16# G.A. Vliegenthart and H.N.W. Lekkerkerker, J. Chem. Ph
112, 5364~2000!.@17# M.H.J. Hagen and D. Frenkel, J. Chem. Phys.101, 4093
~1994!.@18# M. Muschol and F. Rosenberger, J. Chem. Phys.107, 1953
~1997!.@19# M. Malfois, F. Bonnete´, L. Belloni, and A. Tardieu, J. Chem
Phys.105, 3290~1996!.@20# P.R. ten Wolde and D. Frenkel, Theor. Chem. Acc.101, 205
~1999!.@21# P.M. Tessier, A.M. Lenhoff, and S.I. Sandler, Biophys. J.82,
1620 ~2002!.@22# N. Sun and J.Y. Walz, J. Colloid Interface Sci.234, 90 ~2001!.@23# D.N. Petsev and P.G. Vekilov, Phys. Rev. Lett.84, 1339
~2000!.@24# M. Manciu and E. Ruckenstein, Langmuir18, 8910~2002!.@25# V.N. Paunov, E.W. Kaler, S.I. Sandler, and D.N. Petsev,
Colloid Interface Sci.240, 640 ~2001!.@26# D.F. Rosenbaum, A. Kulkarni, S. Ramakrishnan, and C.F.
koski, J. Chem. Phys.111, 9882~1999!.@27# R. Piazza, S. Iacopini, and M. Galliano, Europhys. Lett.59,
149 ~2002!.@28# J. Wu, D. Bratko, H.W. Blanch, and J.M. Prausnitz, J. Che
Phys.111, 7084~1999!; Phys. Rev. E62, 5273~2000!.@29# M.L. Broide, T.M. Tominc, and M.D. Saxowsky, Phys. Rev.
53, 6325~1996!.@30# V.G. Taratuta, A. Holschbach, G.M. Thurston, D. Blan
schtein, and G.B. Benedek, J. Phys. Chem.94, 2140~1990!.@31# T. Arakawa, R. Bhat, and S.N. Timasheff, Biochemistry29,
1914 ~1990!.
05140
,
.
,
v.
.
.
-
.
@32# P. Benas, L. Legrand, and M. Ries-Kautt, Acta CrystallogSect. D: Biol. Crystallogr.D58, 1582~2002!.
@33# C. Haas, J. Drenth, and W.W. Wilson, J. Phys. Chem. B103,2808 ~1999!.
@34# K. Demoruelle, B. Guo, S. Kao, H.M. McDonald, D. NikicS.C. Holman, and W.W. Wilson, Acta Crystallogr., Sect.Biol. Crystallogr.D58, 1544~2002!.
@35# J.J. Grigsby, H.W. Blanch, and J.M. Prausnitz, J. Phys. ChB 104, 3645~2000!.
@36# B. Guo, S. Kao, H. McDonald, A. Asanov, L.L. Combs, anW.W. Wilson, J. Cryst. Growth196, 424 ~1999!.
@37# F. Bonnete´, S. Finet, and A. Tardieu, J. Cryst. Growth196, 403~1999!.
@38# R. Piazza, J. Cryst. Growth196, 415 ~1999!.@39# R.J. Baxter, J. Chem. Phys.49, 2770~1968!.@40# W.C.K. Poon, Phys. Rev. E55, 3762~1997!.@41# W.C.K. Poon, S.U. Egelhaaf, P.A. Beales, A. Salonen, and
Sawyer, J. Phys.: Condens. Matter12, L569 ~2000!.@42# B.L. Neal, D. Asthagiri, and A.M. Lenhoff, Biophys. J.75,
2469 ~1998!; B.L. Neal, D. Asthagiri, O.D. Velev, A.M. Len-hoff, and E.W. Kaler, J. Cryst. Growth196, 377 ~1999!.
@43# R.P. Sear, J. Chem. Phys.111, 4800~1999!.@44# A. Lomakin, N. Asherie, and G.B. Benedek, Proc. Natl. Aca
Sci. U.S.A.96, 9465~1999!.@45# E. Allahyarov, I. D’Amico, and H. Lo¨wen, Phys. Rev. Lett.81,
1334 ~1998!.@46# P. Linse and V. Lobaskin, Phys. Rev. Lett.83, 4208~1999!; J.
Chem. Phys.112, 3917~2000!.@47# N. Gro”nbech-Jensen, K.M. Beardmore, and P. Pincus, Phy
A 261, 74 ~1998!.@48# J.P. Hansen and H. Lo¨wen, Annu. Rev. Phys. Chem.51, 209
~2000!.@49# A. Striolo, D. Bratko, J.Z. Wu, N. Elvassore, H.W. Blanch, an
J.M. Prausnitz, J. Chem. Phys.116, 7733~2002!.@50# E. Allahyarov, H. Lowen, J.P. Hansen, and A.A. Louis, Euro
phys. Lett.57, 731 ~2002!.@51# H.L. Friedman, Ionic Solution Theory~Wiley Interscience,
New York, 1962!.@52# T. Erber and G.M. Hockney, Adv. Chem. Phys.98, 495~1997!.@53# F. Carlsson, P. Linse, and M. Malmsten, J. Phys. Chem. B105,
9040 ~2001!.@54# F. Carlsson, M. Malmsten, and P. Linse, J. Phys. Chem. B105,
12189~2001!.@55# E. Allahyarov, H. Lowen, and S. Trigger, Phys. Rev. E57,
5818 ~1998!.@56# E. Allahyarov and H. Lo¨wen, Phys. Rev. E62, 5542~2000!.@57# P. Attard, J. Chem. Phys.91, 3083~1989!.@58# J. Piasecki, L. Bocquet, and J.P. Hansen, Physica A218, 125
~1995!.@59# J. Lekner, Physica A176, 485 ~1991!; Mol. Simul. 20, 357
~1998!.@60# C. Tanford and R. Roxby, Biochemistry11, 2192~1972!.@61# L. Belloni and O. Spalla, J. Chem. Phys.107, 465 ~1997!; O.
Spalla and L. Belloni,ibid. 95, 7689~1991!.@62# D.R. Berard, P. Attard, and G.N. Patey, J. Chem. Phys.98,
7236 ~1993!.@63# A.A. Louis, E. Allahyarov, H. Lo¨wen, and R. Roth, Phys. Rev
E 65, 061407~2002!.@64# R.R. Netz, Phys. Rev. E60, 3174~1999!.
4-12

u
J
,
tal
us
g
u-
.
NONMONOTONIC VARIATION WITH SALT . . . PHYSICAL REVIEW E 67, 051404 ~2003!
@65# S. Alexander, P.M. Chaikin, P. Grant, G.J. Morales, P. Pincand D. Hone, J. Chem. Phys.80, 5776~1984!.
@66# R. Messina, C. Holm, and K. Kremer, Eur. Phys. J. E4, 363~2001!; R. Messina, Physica A308, 59 ~2002!.
@67# P.C. Zamora and C.F. Zukoski, Langmuir12, 3541~1996!.@68# S.B. Howard, P.J. Twigg, J.K. Baird, and E.J. Meehan,
Cryst. Growth90, 94 ~1988!.@69# F. Rosenberger, S.B. Howard, J.W. Sowers, and T.A. Nyce
Cryst. Growth129, 1 ~1993!.@70# E. Cacioppo and M.L. Pusey, J. Cryst. Growth144, 286
~1991!.@71# R. Messina, C. Holm, and K. Kremer, Phys. Rev. Lett.85, 872
~2000!.@72# A. Tardieu, F. Bonnete, S. Finet, and D. Vivares, Acta Crys
logr., Sect. D: Biol. Crystallogr.D58, 1549~2002!.@73# R. Piazza and M. Pierno, J. Phys.: Condens. Matter12, A443
~2000!.@74# D. Stigter, Biopolymers46, 503 ~1998!.@75# J.J. Delrow, J.A. Gebe, and J.M. Schurr, Biopolymers42, 455
~1997!.@76# C. Vega and P.A. Monson, J. Chem. Phys.109, 9938~1998!.@77# C.O. Anderson, J.F.M. Niesen, H.W. Blanch, and J.M. Pra
nitz, Biophys. Chem.84, 177 ~2000!.
05140
s,
.
J.
-
-
@78# R. Piazza, V. Peyre, and V. Degiorgio, Phys. Rev. E58, R2733~1998!.
@79# A.A. Louis, Philos. Trans. R. Soc. London, Ser. A359, 939~2001!.
@80# We remark that these data correct those in Ref.@50#.@81# P.B. Warren, J. Phys.: Condens. Matter14, 7617~2002!.@82# J.C.G. Montoro and J.L.F. Abascal, J. Chem. Phys.103, 8273
~1995!; J.L.F. Abascal and J.C.G. Montoro,ibid. 114, 4277~2001!; S. Gavryushov and P. Zielenkiewicz, Biophys. J.75,2732 ~1998!; A.P. Lyubartsev and L. Nordenskio¨ld, J. Phys.Chem. B101, 4335~1997!.
@83# V. Vlachy, H.W. Blanch, and J.M. Prausnitz, Adv. ImaginElectron Phys.39, 215 ~1993!; C.J. Coen, H.W. Blanch, andJ.M. Prausnitz,ibid. 41, 996 ~1995!.
@84# F. Bonnete, S. Finet, and A. Tardieu, J. Cryst. Growth196, 403~1999!.
@85# M. Boyer, M.-O. Roy, M. Jullien, F. Bonnete`, and A. Tardieu,J. Cryst. Growth196, 185 ~1999!.
@86# A.M. Kulkarni, A.P. Chatterjee, K.S. Schweizer, and C.F. Zkoski, Phys. Rev. Lett.83, 4554~1999!.
@87# E. Eisenriegler, J. Chem. Phys.113, 5091~2000!.@88# L.V. Zherenkova, D.A. Mologin, P.G. Khalatur, and A.R
Khokhlov, Colloid Polym. Sci.276, 753 ~1998!.
4-13