comprehensive annual financial report - city of … cafr... · property tax levies and collections...
TRANSCRIPT

Comprehensive AnnualFinancial Report
FOR THE FISCAL YEAR ENDEDDECEMBER 31, 2016

Comprehensive Annual
Financial Report
of the City of
Bloomington, Minnesota
For the Year Ended
December 31, 2016
Prepared by the Finance Department

- 1 -
CITY OF BLOOMINGTON, MINNESOTA
Comprehensive Annual Financial Report For the Year Ended December 31, 2016
SECTION I
INTRODUCTORY SECTION

- 2 -
CITY OF BLOOMINGTON, MINNESOTA
COMPREHENSIVE ANNUAL FINANCIAL REPORT YEAR ENDED DECEMBER 31, 2016
TABLE OF CONTENTS
I. INTRODUCTORY SECTION Page
Organizational Chart 5 Principal Officials 6 Transmittal Letter 7-18 Certificate of Achievement 19 II. FINANCIAL SECTION Exhibit Page
Independent Auditor’s Report 23-25 Management’s Discussion and Analysis (Unaudited) 27-39 A. Basic Financial Statements Government-Wide Financial Statements: Statement of Net Position 1 42 Statement of Activities 2 43 Fund Financial Statements: Governmental Funds: Balance Sheet 3 46-47 Reconciliation of the Governmental Funds Balance Sheet to the Balance Sheet to the Statement of Net Position 4 49 Statement of Revenues, Expenditures, and Changes in Fund Balances 5 50-51 Reconciliation of the Statement of Revenues, Expenditures, and Changes in Fund Balances of Governmental Funds to the Statement of Activities 6 53 Proprietary Funds: Statement of Fund Net Position 7 56-57 Statement of Revenues, Expenses, and Changes in Fund Net Position 8 58-59 Statement of Cash Flows 9 60-61 Fiduciary Funds: Statement of Fiduciary Net Position 10 64 Statement of Changes in Fiduciary Net Position 11 65 Notes to the Basic Financial Statements 68-120
B. Required Supplementary Information Schedule of Revenues, Expenditures, and Changes in Fund Balances – Budget and Actual – General Fund A-1 123 Schedule of Revenues, Expenditures, and Changes in Fund Balances – Budget and Actual – Community Development Block Grant A-2 124 Schedule of Funding Progress – Retiree Health Plan A-3 125 Schedule of Proportionate Share of Net Pension Liability - General Employees Retirement Fund A-4 126 Schedule of Pension Contributions - General Employees Retirement Fund A-5 127

- 3 -
TABLE OF CONTENTS (CONTINUED)
II. FINANCIAL SECTION (CONTINUED) Exhibit Page
Schedule of Proportionate Share of Net Pension Liability - Public Employees Police and Fire Fund A-6 128 Schedule of Pension Contributions - Public Employees Police and Fire Fund A-7 129
Schedule of Changes in the Net Pension Liability (Asset) and Related Ratios - Public Employees Police and Fire Fund A-8 130
Schedule of Pension Contributions - Bloomington Fire Department Relief Association A-9 131 Note to Required Supplementary Information 132
C. Supplementary Information Nonmajor Governmental Funds: Combining Balance Sheet B-1 136-137 Combining Statement of Revenues, Expenditures, and Changes in Fund Balances B-2 138-139
Schedule of Revenues, Expenditures, and Changes in Fund Balances – Budget and Actual – Special Revenue Funds:
Public Health C-1 140 Public Safety C-2 141 Communications C-3 142 Park Grants C-4 143 South Loop Revolving Development Services C-5 144 Creative Placemaking C-6 145 Cemetery Trust C-7 146 Nonmajor Enterprise Funds: Combining Statement of Fund Net Position D-1 148 Combining Statement of Revenues, Expenses, and Changes in Fund Net Position D-2 149 Combining Statement of Cash Flows D-3 150 Internal Service Funds: Combining Statement of Fund Net Position E-1 152-153 Combining Statement of Revenues, Expenses, and Changes in Fund Net Position E-2 154-155 Combining Statement of Cash Flows E-3 156-157 Fiduciary Funds: Combining Statement of Fiduciary Net Position F-1 159 Combining Statement of Changes in Fiduciary Assets and Liabilities – Agency Funds F-2 160 D. Other Supplementary Information – Component Units Port Authority: Schedule of Assets, Liabilities, and Fund Balances G-1 162 Schedule of Revenues, Expenditures, and Changes in Fund Balances G-2 163

- 4 -
TABLE OF CONTENTS (CONTINUED)
II. FINANCIAL SECTION (CONTINUED) Exhibit Page Housing and Redevelopment Authority: Schedule of Net Position H-1 164 Schedule of Activities H-2 165 Schedule of Assets, Liabilities, and Fund Balances – Governmental Funds H-3 166-167 Reconciliation of the Governmental Funds Schedule of Assets, Liabilities, and Fund Balances to the Schedule of Net Position H-4 168 Schedule of Revenues, Expenditures, and Changes in Fund Balances - Governmental Funds H-5 170-171 Reconciliation of the Schedule of Revenues, Expenditures, and Changes in Fund Balances of Governmental Funds to the Schedule of Activities H-6 172 Schedule of Fund Net Position – Proprietary Funds H-7 173 Schedule of Revenues, Expenses, and Changes in Fund Net Position – Proprietary Funds H-8 174 Schedule of Cash Flows – Proprietary Funds H-9 175 Schedule of Revenues, Expenditures, and Changes in Fund Balances – Budget and Actual: General Fund H-10 176 Housing Development Fund H-11 177 Section 8 Vouchers Fund H-12 178 Housing Rehabilitation Fund H-13 179 Combining Schedule of Assets, Liabilities, and Fund Balances – TIF Special Revenue Fund H-14 180-181 Combining Schedule of Revenues, Expenditures, and Changes in Fund Balances – TIF Special Revenue Fund H-15 182-183 III. STATISTICAL SECTION (UNAUDITED) Table Page
Net Position by Component 1 188-189 Changes in Net Position 2 190-191 Fund Balances, Governmental Funds 3 192-193 Changes in Fund Balances, Governmental Funds 4 194-195 Tax Capacity Value and Estimated Market Value of Taxable Property 5 196-197 Direct and Overlapping Property Tax Rates 6 198 Principal Property Taxpayers 7 199 Property Tax Levies and Collections 8 200 Ratios of Outstanding Debt by Type 9 201 Ratios of General Bonded Debt Outstanding 10 202 Direct and Overlapping Governmental Activities Debt 11 203 Legal Debt Margin Information 12 204-205 Pledged-Revenue Coverage 13 206-207 Demographic and Economic Statistics 14 208 Principal Employers 15 209 Full-time Equivalent City Government Employees by Function/Program 16 210-211 Operating Indicators by Function/Program 17 212-213 Capital Asset Statistics by Function/Program 18 214-215
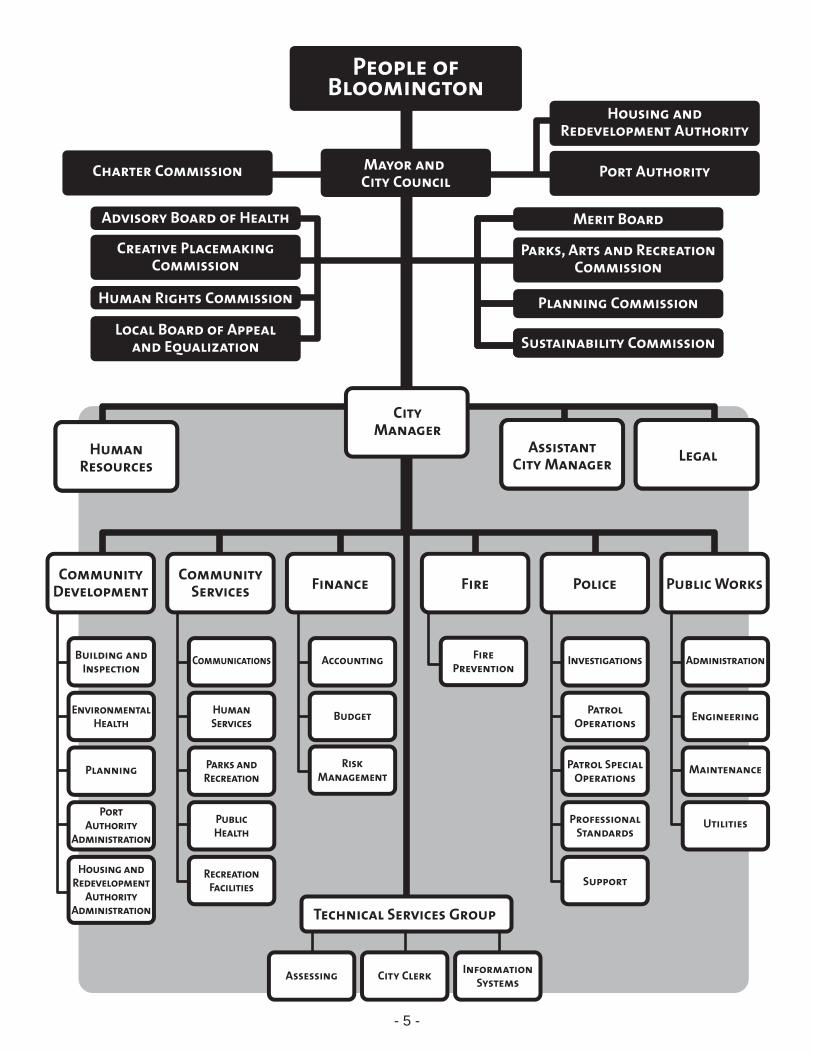
People ofBloomington
Mayor and City Council
Housing andRedevelopment Authority
Port AuthorityCharter Commission
Parks, Arts and RecreationCommission
Planning Commission
Sustainability Commission
Merit Board
Human Rights Commission
Creative PlacemakingCommission
Local Board of Appealand Equalization
Advisory Board of Health
HumanResources
CommunityDevelopment
Building andInspection
EnvironmentalHealth
FirePrevention
Planning
PortAuthority
Administration
Housing andRedevelopment
AuthorityAdministration
CommunityServices Finance Fire Police Public Works
LegalAssistantCity Manager
CityManager
Communications
HumanServices
Parks andRecreation
PublicHealth
RecreationFacilities
Assessing City Clerk InformationSystems
Accounting
Budget
RiskManagement
PatrolOperations
Patrol SpecialOperations
ProfessionalStandards
Support
Administration
Engineering
Maintenance
Utilities
Technical Services Group
Investigations
- 5 -

- 6 -
CITY OF BLOOMINGTON, MINNESOTA
DECEMBER 31, 2016
PRINCIPAL OFFICIALS
GENE WINSTEAD, MAYOR
JACK BALOGA ......................................... COUNCILMEMBER TIM BUSSE ................................................ COUNCILMEMBER ANDREW CARLSON ............................... COUNCILMEMBER DWAYNE LOWMAN ............................... COUNCILMEMBER JON OLESON ............................................ COUNCILMEMBER KIM VLAISAVLJEVICH .......................... COUNCILMEMBER
JAMIE VERBRUGGE, CITY MANAGER

- 7 -
June 16, 2017 To the Citizens of the City of Bloomington, Mayor, Council Members, and City Manager The Comprehensive Annual Financial Report (CAFR) of the City of Bloomington, Minnesota (the City) for the fiscal year ended December 31, 2016 is hereby submitted. The purpose of this report is to provide the Mayor, City Council, City staff, citizens, bondholders, and other interested parties with useful information concerning the City’s operations and financial position. This report was prepared by the City’s Finance Department. Management assumes full responsibility for the accuracy of the presented data and the completeness and fairness of the presentation, including all disclosures, supporting schedules, and statistical tables contained in this report, based upon a comprehensive framework of internal controls that has been established for that purpose. Because the cost of internal control should not exceed the anticipated benefits, the objective is to provide reasonable, rather than absolute, assurance that the financial statements are free of material misstatement. We believe the data, as presented, is accurate in all material respects; that it fairly sets forth the financial position and results of City operations as measured by the financial activity of its various funds; and that all disclosures necessary to enable the reader to gain the maximum understanding of the City’s financial affairs have been included. Generally accepted accounting principles (GAAP) require that management provide a narrative introduction, overview, and analysis to accompany the basic financial statements in the form of Management’s Discussion and Analysis (MD&A). This letter of transmittal is designed to complement the MD&A and should be read in conjunction with it. The City of Bloomington’s MD&A can be found immediately following the Independent Auditors’ Report. The organization, form and contents of this report were prepared in accordance with the standards prescribed by the Governmental Accounting Standards Board (GASB), the Government Finance Officers Association of the United States and Canada (GFOA), the American Institute of Certified Public Accountants, the Minnesota Office of the State Auditor, and the City Charter.

- 8 -
The City and the City’s Housing and Redevelopment Authority (HRA), a discrete component unit of the City, are required to undergo an annual single audit in conformity with the provisions of the Single Audit Act of 1996 and U.S. Office of Management and Title 2 U.S. Code of Federal Regulations Part 200, Uniform Administrative Requirements, Cost Principles, and Audit Requirements for Federal Awards (Uniform Guidance). Information related to this single audit, including the schedule of expenditures of federal awards, findings and questioned costs, independent auditor’s report on compliance and on internal control over financial reporting based upon the audit of the basic financial statements performed in accordance with Government Auditing Standards, and independent auditor’s report on compliance and internal control over compliance applicable to each major federal award program, are included in a separate single audit report.
Other Reporting Entity Components In accordance with GASB pronouncements, the City’s financial statements include all funds and departments of the City (the primary government) and its component units. Component units are included in the City’s reporting entity because of the significance of their operational or financial relationship with the City. As a result of applying the entity definition criteria of GASB, the following organizations have been included in the City’s financial statements:
1. The Port Authority of the City of Bloomington (Port Authority) 2. Housing and Redevelopment Authority (HRA)
Note 1 to the financial statements gives further information about the component units included in the financial statements. Note 15 to the financial statements presents disclosure information for each of the discretely presented component units. The financial schedules of the Port Authority and the Housing and Redevelopment Authority are included within the City’s CAFR in the Other Supplementary Information section under the Component Units tab.
Economic Condition and Outlook Bloomington covers an area of 38.3 square miles and is situated wholly in Hennepin County. In six decades, Bloomington has grown from a rural village beyond the developing edge of Minneapolis to its current status as Minnesota’s fourth largest city and the region’s hospitality and retail hub. This growth was spurred by freeways reaching out from the metropolitan downtowns and further enhanced by its proximity to the Minneapolis/St. Paul International Airport and the Minnesota Valley National Wildlife Refuge. Bloomington is also the terminus for the 12-mile METRO Blue Line (Hiawatha) light rail line which opened in 2004 to connect several popular Twin Cities destinations including Mall of America, VA Medical Center, Minneapolis/St. Paul International Airport, Minnehaha Park, 11 neighborhoods, and Downtown Minneapolis.

- 9 -
The city has many well-known national and international corporations within its boundaries, including HealthPartners, Seagate Technology, Toro Company, Donaldson Company, Express Scripts, Thermo King, Cypress Semiconductors, Ceridian Corporation, Polar Semiconductors, and Ziegler, Inc. Bloomington is home to the largest shopping and entertainment complex in the United States, Mall of America®. It employs approximately 13,000 and attracts 42 million visitors each year. As the state’s number one tourist attraction, Mall of America actually attracts more visitors than all other Minnesota tourist destinations combined. In addition, with many entertainment facilities and 9,389 hotel/motel rooms, Bloomington is a major regional and national business and meeting center, employing an estimated 10,000 workers in the hospitality industry. Housing is well-maintained throughout the city and Bloomington is fortunate to have a diversified tax base, currently composed of approximately 53.7% commercial/industrial, 38.1% residential, and 8.2% apartments. Shopping areas are efficiently distributed, and Bloomington businesses provide two jobs for every Bloomington resident in the workforce. Bloomington also has plenty of room for new multi-family residential and commercial development and is experiencing significant additional growth in three districts located along I-494. Current City Development After record years in 2014 and 2015, 2016 was a more typical year for construction in Bloomington as measured in permit valuation. Total valuation for all building permits was $185,368,384. Most of new development continues to focus on the I-494 corridor, where excellent access to employment, improving transit service, and focused land use plans position the City well for future growth. In 2016, the following development either opened or was under construction in Bloomington:
The Luxembourg, a 282-unit upscale apartment development west of Normandale Boulevard and north of West 84th Street opened for occupancy.
Hyatt Regency, a 302-room hotel opened in the South Loop District.
OATI, a software company serving the energy sector, continued construction on their five-story, 110,000 square foot office building and data center along I-494 at Computer Avenue.
The remainder of Penn American Phase II, a mixed use project in the Penn American District, opened. The project includes:
o A 107-room, five-story Home2 Suites by Hilton extended stay hotel. o A 28,600 square foot Fresh Thyme grocery. o A Red Robin restaurant. o Over 9,000 square feet of ground level retail.

- 10 -
Marriott AC, a 148-room, five-story hotel, continued construction in the South Loop District.
Indigo by Lennar, a 395-unit, six story apartment building, opened in the South Loop District.
Park Place on France, a 20,676 square foot multi-tenant retail building, opened on the corner of France Avenue and Old Shakopee Road. The development is anchored by the restaurant Willy McCoy’s, Bloomington’s first restaurant with rooftop seating.
Masonic Homes opened a 53,000 square foot theater, museum, library and lodge on Normandale Boulevard.
Hoglund Bus opened a new 17,000 square foot bus sales and maintenance facility in the Central Industrial Area.
The Preserve at Normandale Lake, a five-story, 179-unit apartment building, began construction in the Normandale Lake District.
Yardscapes began construction of a 6,000 square foot office warehouse building in the Central Industrial Area.
Phase II of the Alpha B project, an 11,800 square foot multi-tenant center anchored by the restaurant Hazelwood, began construction in the South Loop District.
Mall of America Development Mall of America, the largest shopping mall in the country, opened its doors in August 1992 and has become one of the most visited tourist destinations in the world. Mall of America has three anchor department stores: Macy’s, Nordstrom, and Sears, as well as more than 50 eateries and 520 specialty shops. In 2016, Mall of America welcomed Jimmy Buffett’s Margaritaville, TOMS, Zara, Cowboy Jack’s, Tim Hortons, Anthropology, Smaaash, Melt Shop and Shake Shack. Mall of America also teamed up with ridesharing leader Uber to ease navigation to and from the mall. Two connected luxury hotels, the 500-room Radisson Blu that opened on the south side in 2013 and the 342-room JW Marriott hotel that opened on the north side in 2015, offer outstanding amenities such as meeting rooms, on-site dining, fitness centers and more.

- 11 -
Mall of America also features an extensive entertainment complex that includes Nickelodeon Universe, a 7-acre indoor theme park. Newer attractions in the park include the longest indoor zip line in North America, flying thrill-seeking guests 405 feet across Nickelodeon Universe, and Shredders Mutant Masher, a giant pendulum ride that spins and swings riders more than 50 feet in the air. Other attractions at the mall include a nightly lightshow called “Universe of Light” that takes place in Nickelodeon Universe every evening, the newly-renovated LEGO Imagination Center featuring a LEGO Robot towering over 34 feet tall, several destination restaurants, as well as SEALIFE, a 1.2 million-gallon walk-through aquarium featuring four different lake and sea environments. Free parking is provided in two, 6,000-space, seven-level public parking facilities. Mall of America is a regional asset, attracting 42 million visitors a year and generating significant income and sales tax revenues for the State of Minnesota. The Port Authority of the City of Bloomington financed the initial land acquisition and on-site improvements. The total Phase I project was $789 million, of which, the Port Authority provided approximately $152 million in public improvements: $11 million in site work, $93 million in parking facilities, $20 million in structural roadway and bridge work, and $28 million in land acquisition. The mall is expanding in phases. Phase IC began in 2014 and construction was completed in 2015. In November 2015, Mall of America opened a $325 million expansion on the north side, increasing total area to 5.6 million square feet. The 555,000 square foot integrated expansion includes a 342-room JW Marriott hotel, a ten-story office building to be anchored by the supercomputing company Cray, and 161,000 square feet of additional retail, restaurants, and a large event space. Mall of America anticipates several additional expansion phases including Phase IIB to the north, which is anticipated to start construction in 2018 and will include additional retail, a third hotel, a second office building and residential units. The City has completed significant infrastructure improvements, such as the lowering of Lindau Lane, to facilitate further expansion of the mall.

- 12 -
Major Initiatives Garbage and Recycling Program Implementation On October 3, 2016, Bloomington joined more than 72 percent of cities nationwide in providing coordinated solid waste collection services to its community. The new Garbage and Recycling Program offers household garbage, recycling, and yard waste collections. It also offers collection of hard-to-dispose-of items such as electronics and furniture and it continues operation of the annual Curbside Cleanup program. Coordinated collection aims to reduce the number of garbage trucks on collection day, mitigate air and noise pollution, minimize wear and tear on the roadways, ensure that all residents have access to proper disposal of solid waste and, in most cases, save households money. This new program serves approximately 21,800 residential dwelling units. The efforts to implement this program required cross-collaboration among many City departments: Community Development, Community Services, Finance, Information Systems, Legal and Public Works. Various committees were developed to strategize, coordinate, and execute the work involved in launching the new program. These included the Executive Steering, City Billing, Communications, and Cart Roll-Out committees. The City originally collaborated with seven licensed haulers to ensure a smooth transition to the new system. Six garbage haulers remained as the “Consortium” when the program launched: Aspen, Garbageman, Randy’s, Republic, Vierkant and Waste Management. These haulers provided their industry expertise to develop the contract and provide input on operational planning. Bloomington is the only major city in Minnesota to implement a coordinated service on this scale. The implementation process encompassed constant communications and engagement with residents. The Bloomington Briefing played a major role in disseminating program information to the public. In 2016, five articles relating to garbage, recycling and yard waste details were published in approximately 190,000 newsletters. Residents were also informed via the City’s webpage and social media updates. In 2016 about 2,107 individuals signed up with E-Subscribe, receiving email notifications when new program information is shared. During an eight week timeframe from August to September 2016, Consortium members delivered approximately 60,000 carts to residents. This new program provided solid waste service to all residential homes. While in the process of launching this program, staff identified 1,736 households that previously did not have garbage service. Enrolling these households in the program ensured that all solid waste generated would be disposed of properly. As the new program is moving forward, City leaders and staff are hearing positive feedback from residents who enjoy the benefits of the Garbage and Recycling Program. Roadways are much less congested, quieter, and safer. Residents are grateful for the reduction in monthly costs. The City anticipates that the new program will bring long-term savings and many environmental benefits to the community.

- 13 -
Old Cedar Avenue Bridge Rehabilitation Built in 1920, the Old Cedar Avenue Bridge is a historic five-span, 865-foot-long, steel truss bridge crossing over Long Meadow Lake in Bloomington, adjacent to the Minnesota River. Due to decay, the bridge was closed to motor vehicles and converted to a bicycle/pedestrian facility in 1993. However, significant deterioration and safety concerns led to full closure in 2002, setting off an effort to permanently restore the scenic bridge as part of a trail system for nature lovers and outdoor recreational enthusiasts.
In 2013 the City Council approved the renovation project. The $15.8 million bridge financing was put together using a variety of sources including a $2,000,000 Sarbanes Federal grant, $3,300,000 Minnesota state bonding, $10,320,000 in tax increment financing, and $180,000 City Strategic Priorities funding. Project goals included restoring pedestrian/bicycle connectivity to the regional trail system, meeting standards for rehabilitation given that the structure was listed on the National Register of Historic Places in 2013, and meeting structural loading and safety standards while minimizing future maintenance costs. To meet these goals and address challenges with access through the Minnesota Valley National Wildlife Refuge, the City of Bloomington and the project team worked closely with stakeholders throughout design and construction. Limiting impacts to the environment was a priority. Soils were tested for contamination following removal and disposal of the existing lead-based paint. Other provisions such as noise restrictions, storm water BMPs, and restoration with native seed mixtures were also utilized to protect the environment. The rehabilitation work included steel truss repairs, substructure repair and reconstruction, deck and railing replacement, and repainting. The location posed permitting and site access issues as well as the threat of flooding since it is hydraulically connected to the Minnesota River. Poor soil conditions complicated the design and construction process, and severe deterioration of the bridge made rehabilitation challenging. To complicate matters further, the restoration had to work with numerous utilities in close proximity to the bridge; these included dual 40” siphon sewers, a fiber optic line that serves the airport and the 911 system, and a 20” high-pressure natural gas main. As the bridge is considered historic, measures were taken to restore it to its original appearance and condition while preserving the integrity of the structure. Historians studied paint colors using old photos and historical records of 1920’s standards to select the final color for the bridge. A specialty lightweight concrete deck was installed to address the loading concerns of the structure.

- 14 -
Rehabilitation was completed and the bridge was opened to the public in October 2016. The project received several awards including the City Engineers Association of Minnesota Municipal Project of the Year Award for 2016. Based on initial usage in the fall of 2016, an estimated 26,000 pedestrians and 3,500 bicyclists will enjoy its recreational functionality annually.
Relevant Financial Policies In accordance with the City’s Budgetary and Financial Control Policy, the City strives to maintain a fund balance in the General Fund for working capital purposes of 35-40% of the following year’s General Fund total budgeted revenues or expenditures. The City also reviews and updates the schedule of fund balances, reserves, and working capital in all other operating funds and determine adequacy of those money balances, using specified guidelines and criteria in conjunction with the budgets set annually. The City’s Debt Policy confines long-term borrowing to capital improvements, equipment or projects that have a life of more than four years and cannot be financed from current revenues. The City endeavors to keep the total maturity length of general obligation bonds below twenty years and at least 50% of the principal is retired within ten years. Total net general obligation debt (after deducting sinking funds and reserves and net of any portion supported by utilities or others such as the State) shall not exceed 75% of the dollars per capita debt limit per year.
Budget Process The City Council is required to adopt a final budget no later than December 31 for the next year. Formal budgetary integration is employed as a management control device during the year for the general fund, special revenue funds, enterprise funds, and internal service funds. The general fund, special revenue funds, enterprise funds, and internal service funds have legally adopted annual budgets. All appropriation changes that occur during the year are approved by the City Council. Capital projects are approved on a project-by-project basis.

- 15 -
Liquidity The following table shows previous year-end fund balances for the General Fund, as compared to original budget appropriations for the following year.
General Fund Budget
Fund Balance Beginning of Year
Appropriations Amount % of Budget 2013 $59,687,288 $20,691,737 34.7% 2014 61,452,110 20,915,301 34.0 2015 63,990,692 24,643,306 38.5 2016 68,155,122 27,959,764 41.0 2017 70,996,190 28,809,712 40.6
The City’s General Fund working capital balance of $27,759,919 at December 31, 2016 includes amounts committed for encumbrances, carryovers, and fair value adjustments for investments, which brings the total fund balance to $28,809,712. The City anticipates that the 2017 year-end General Fund balance will remain constant (plus any commitments for carryovers or encumbrances), based upon budgeted 2017 revenues and expenditures and one-time transfers of fund balance to other funds for specific projects.
Debt Administration General obligation bond debt statistics for the City of Bloomington at December 31, 2016 are as follows (primary government only): Bonded Debt per Capita
Amount % Market
Value Current
Year Prior
Year General Obligation Bonded Debt $ 7,180,000 Improvement Bonds 55,489,159 General Obligation Tax Increment 4,770,000 Net Total 67,439,159 Less Debt Service Funds (23,725,327) Total Net Bonded Debt 43,713,832 .38% $ 512 $ 496 Overlapping Debt (1) 142,670,944 1.25 1,672 1,546 Total – 2016 Year-End $ 186,384,776 1.63% $ 2,184 Total - Prior Year-End $ 176,438,145 1.69% $ 2,042 (1) School, County, and other local taxing entities - see Table 11.

- 16 -
In 2016, the City retired $5,940,000 of improvement, $1,485,000 of general obligation, and $125,000 of general obligation tax increment bonds. The City issued $6,115,000 of improvement bonds and $3,730,000 of refunding improvement bonds in 2016. The following table presents general obligation bonds issued during the recent fiscal years:
Date of Issue
Amount
Type
Average
Life
Net Interest
Rate
Interest Cost Per Borrowed
Dollar
11/20/13 $4,180,000 Improvement 5.92 years 1.89% $.14 11/20/13 5,135,000 Refunding Improvement 6.15 2.16 .18 12/18/14 6,695,000 Improvement 5.70 1.79 .12 12/18/14 770,000 Refunding Improvement 1.58 .84 .03 10/13/15 5,355,000 Improvement 6.65 1.81 .19 12/08/16 6,115,000 Improvement 6.85 2.01 .18 12/08/16 3,730,000 Refunding Improvement 6.44 1.92 .17
The City’s bonds are rated Aaa by Moody’s Investors Service (Moody’s highest rating, upgraded from Aa1 in November 1998), AAA by Standard and Poor’s (S&P’s highest rating, upgraded in October 2000), and AAA by Fitch Ratings (Fitch’s highest rating, awarded in October 2004). These “Triple Triple A” bond ratings were reaffirmed at the most recent bond issuance. The City believes that its 2016 financial results, combined with its prospects for the future, will result in continued excellent bond ratings. These excellent ratings have had a positive effect on the sale of the City’s bonds, by broadening the City’s market and lowering the interest rates for borrowing.
5-Year Capital Improvement Plan The proceeds of general obligation bond issues; federal, state and local grants; and other local funding sources for capital projects are accounted for in capital projects funds until the particular projects are completed. The City utilizes a five-year Capital Improvement Plan, outlining projected costs and sources of funding for proposed capital improvement projects. Any unrestricted fund balances of the Park Development Fund and the Facility and Parks Maintenance Fund are identified for use as proposed in the Capital Improvement Plan, when and if such projects are ordered by the City Council.

- 17 -
The City’s latest five-year Capital Improvement Plan indicated the following totals for the five-year period of 2017-2021:
Project Category
Estimated Amount (in millions)
Approximate Sources of Funding
City Facilities, Parks and Park Development
$ 104
Cash on Hand Bonds Park Donations Grants, Other
29% 68 1 2
Alternative/Surface Transportation
115
Federal Funds Other Governments P.I.R. Bonds Municipal State Aid Other Franchise Fee
16% 18 29 13 12 12
Water, Sewer, and Stormwater Facilities
42
Cash on Hand Bonds Tax Abatement Other
53% 30 9 8
Economic Development and Redevelopment
29
Liquor/Lodging Tax
100%
Total $ 290
Certificate of Achievement The GFOA awarded a Certificate of Achievement for Excellence in Financial Reporting to the City of Bloomington, Minnesota, for its Comprehensive Annual Financial Report for the fiscal year ended December 31, 2015. The Certificate of Achievement is a prestigious national award that recognizes conformance with the highest standards for preparation of state and local government financial reports. In order to be awarded a Certificate of Achievement, a governmental unit must publish an easily readable and efficiently organized Comprehensive Annual Financial Report, whose contents conform to program standards. Such reports must satisfy both generally accepted accounting principles and applicable legal requirements. A Certificate of Achievement is valid for a period of one year only. The City of Bloomington has received a Certificate of Achievement for the last 45 consecutive years. We believe this 2016 CAFR continues to conform to Certificate of Achievement Program requirements, and we will be submitting it to GFOA.

- 18 -
Independent Audit
State law provides that the City may arrange for examination of its books, records, accounts and affairs, or any part thereof, by the state auditor, or by certified public accountants. It has been a long-standing policy of the City to provide for a complete annual audit of City records by certified public accountants. The Independent Auditors’ Report is included in the Financial Section of this report.
Acknowledgments We wish to express our appreciation to the Finance Department staff, in particular Rose Ackerman, Jan Almquist, Kari Carlson, Mary Lee, and Amy Sevig, for their diligent work in preparing this report. We appreciate the cooperation and support from other City departments both in the preparation of this report and in budget management throughout the year. We also wish to thank the Mayor, members of the City Council, and the City Manager for their continued interest and support in planning and conducting the financial operations of the City in a responsible and progressive manner. Respectfully submitted,
Lori Economy-Scholler, Chief Financial Officer Juliana H. Vogel, Finance Manager Finance Department Finance Department

Government Finance Officers Association
Certificate of Achievement for Excellence
in Financial Reporting
Presented to
City of Bloomington
Minnesota
For its Comprehensive Annual Financial Report
for the Fiscal Year Ended
December 31, 2015
Executive Director/CEO
- 19 -

- 20 -

- 21 -
CITY OF BLOOMINGTON, MINNESOTA
Comprehensive Annual Financial Report For The Year Ended December 31, 2016
SECTION II
FINANCIAL SECTION

- 22 -

4810 White Bear Parkway, St. Paul, MN, 55110 651.426.7000 www.redpathcpas.com - 23 -
INDEPENDENT AUDITOR'S REPORT
To the Honorable Mayor and Members of the City Council City of Bloomington, Minnesota
Report on the Financial Statements
We have audited the accompanying financial statements of the governmental activities, the business-type activities, the aggregate discretely presented component units, each major fund and the aggregate remaining fund information of the City of Bloomington, Minnesota, as of and for the year ended December 31, 2016, and the related notes to the financial statements, which collectively comprise the City of Bloomington, Minnesota’s basic financial statements as listed in the table of contents.
Management’s Responsibility for the Financial Statements
Management is responsible for the preparation and fair presentation of these financial statements in accordance with accounting principles generally accepted in the United States of America; this includes the design, implementation, and maintenance of internal control relevant to the preparation and fair presentation of financial statements that are free from material misstatement, whether due to fraud or error.
Auditor’s Responsibility
Our responsibility is to express opinions on these financial statements based on our audit. We conducted our audit in accordance with auditing standards generally accepted in the United States of America and the standards applicable to financial audits contained in Government Auditing Standards, issued by the Comptroller General of the United States. Those standards require that we plan and perform the audit to obtain reasonable assurance about whether the financial statements are free of material misstatement.
An audit involves performing procedures to obtain audit evidence about the amounts and disclosures in the financial statements. The procedures selected depend on the auditor’s judgment, including the assessment of the risks of material misstatement of the financial statements, whether due to fraud or error. In making those risk assessments, the auditor considers internal control relevant to the entity’s preparation and fair presentation of the financial statements in order to design audit procedures that are appropriate in the circumstances, but not for the purpose of expressing an opinion on the effectiveness of the entity’s internal control. Accordingly, we express no such opinion. An audit also includes evaluating the appropriateness of accounting policies used and the reasonableness of significant accounting estimates made by management, as well as evaluating the overall presentation of the financial statements.
We believe that the audit evidence we have obtained is sufficient and appropriate to provide a basis for our audit opinions.

- 24 -
Opinions
In our opinion, the financial statements referred to above present fairly, in all material respects, the respective financial position of the governmental activities, the business-type activities, the aggregate discretely presented component units, each major fund and the aggregate remaining fund information of the City of Bloomington, Minnesota, as of December 31, 2016, and the respective changes in financial position, and, where applicable, cash flows thereof for the year then ended in accordance with accounting principles generally accepted in the United States of America.
Other Matters
Required Supplementary Information
Accounting principles generally accepted in the United States of America require that the management’s discussion and analysis, budgetary comparison information and the schedule of funding progress, the schedules of proportionate share of net pension liability, the schedules of pension contributions and the schedule of changes in the net pension liability (asset) and related ratios, as listed in the table of contents, be presented to supplement the basic financial statements. Such information, although not a part of the basic financial statements, is required by the Governmental Accounting Standards Board, who considers it to be an essential part of financial reporting for placing the basic financial statements in an appropriate operational, economic, or historical context. We have applied certain limited procedures to the required supplementary information in accordance with auditing standards generally accepted in the United States of America, which consisted of inquiries of management about the methods of preparing the information and comparing the information for consistency with management’s responses to our inquiries, the basic financial statements, and other knowledge we obtained during our audit of the basic financial statements. We do not express an opinion or provide any assurance on the information because the limited procedures do not provide us with sufficient evidence to express an opinion or provide any assurance.
Other Information
Our audit was conducted for the purpose of forming opinions on the financial statements that collectively comprise the City of Bloomington, Minnesota’s basic financial statements. The introductory section, supplementary information, other supplementary information and the statistical section are not a required part of the basic financial statements.
The supplementary information and other supplementary information are the responsibility of management and were derived from and relate directly to the underlying accounting and other records used to prepare the basic financial statements. Such information has been subjected to the auditing procedures applied in the audit of the basic financial statements and certain additional procedures, including comparing and reconciling such information directly to the underlying accounting and other records used to prepare the basic financial statements or to the basic financial statements themselves, and other additional procedures in accordance with auditing standards generally accepted in the United States of America. In our opinion, the supplementary information and other supplementary information are fairly stated in all material respects in relation to the basic financial statements as a whole.

- 25 -
The introductory and statistical sections have not been subjected to the auditing procedures applied in the audit of the basic financial statements and, accordingly, we do not express an opinion or provide any assurance on them.
Other Reporting Required by Government Auditing Standards
In accordance with Government Auditing Standards, we have also issued our report dated June 16, 2017, on our consideration of the City of Bloomington, Minnesota’s internal control over financial reporting and on our tests of its compliance with certain provisions of laws, regulations, contracts, and grant agreements and other matters. The purpose of that report is to describe the scope of our testing of internal control over financial reporting and compliance and the results of that testing, and not to provide an opinion on internal control over financial reporting or on compliance. That report is an integral part of an audit performed in accordance with Government Auditing Standards in considering the City of Bloomington, Minnesota’s internal control over financial reporting and compliance.
REDPATH AND COMPANY, LTD. St. Paul, Minnesota
June 16, 2017

- 26 -

- 27 -
CITY OF BLOOMINGTON, MINNESOTA
MANAGEMENT’S DISCUSSION AND ANALYSIS (UNAUDITED) As management of the City of Bloomington (the City), we offer readers of the City's financial statements a discussion and analysis of the City’s financial performance during the fiscal year ended December 31, 2016. This discussion and analysis should be read in conjunction with the transmittal letter, which can be found on pages 7 - 18 of this report, and the City’s basic financial statements following this section. FINANCIAL HIGHLIGHTS The assets and deferred outflows of the City exceeded liabilities and deferred inflows at the
close of the 2016 fiscal year by $549.3 million (net position). Of this amount, $79.7 million (unrestricted net position) may be used to meet ongoing obligations to citizens and creditors, $40.7 million is restricted for debt service, $23.5 million is restricted for tax increment, $4.5 million is restricted for street reconstruction, $4.7 million is restricted for other purposes, and $396.1 million is the City’s net investment in capital assets.
The City’s net position increased by $13.5 million. The largest reasons for the increase in net position within General Revenues was Property Taxes of $2.4 million from a levy increase and Business Taxes increased $2.5 million due to strong Lodging and Admission taxes; and Program Revenues Capital Grants and Contributions included $8.5 million from the restoration project of the Old Cedar Avenue Bridge.
As of December 31, 2016, the City’s governmental funds had combined fund balances of $118.3 million, an increase of $10.6 million in comparison with the prior year. Approximately 52% of the combined committed, assigned, and unassigned fund balances are available to meet the City’s current and future needs. The remaining 48% is restricted for mostly grants, debt service, and capital projects.
At the end of the current fiscal year, total fund balance for the General Fund was $28.8
million, or 43% of actual total General Fund expenditures. This compares to $28.0 million from the prior year, an increase of roughly $800,000. The General Fund working capital goal policy states the City will strive to maintain a fund balance in the General Fund for working capital purposes of 35-40% of the following year’s General Fund total budgeted revenues or expenditures. As of December 31, 2016, the fund balance of the General Fund was within this range. $1,179,000 of this positive performance has been committed for budgeted carryover amounts unspent in 2016 and encumbrances for open purchase order contracts at the end of 2016 that were carried over to the 2017 budget.
In 2016 the Net Pension liability increased $54.7 million due to significant changes in
actuarial assumptions mostly with the Public Employers Police and Fire Fund. The pension related deferred outflows increased $47.2 million effectively offsetting the large increase in the net pension liability.

CITY OF BLOOMINGTON, MINNESOTA
MANAGEMENT’S DISCUSSION AND ANALYSIS (UNAUDITED)
- 28 -
The estimated market value for all taxable property is at $11.5 billion for assessment year 2015 (payable in 2016). After fifteen years of steadily increasing market values peaking in 2008 at $11.8 billion, values declined as a result of the worldwide “Great Recession” before bottoming in assessment years 2012 and 2013 at $9.9 billion. Total market value has been growing since and is now at a level just 2.5% below the 2008 peak. This growth trend is continuing as real estate markets have strengthened and significant new development is occurring.
Entity-wide, the City recorded $17.9 million in depreciation expense on its capital assets. OVERVIEW OF THE FINANCIAL STATEMENTS This discussion and analysis is intended to serve as an introduction to the City’s basic financial statements. The City’s basic financial statements comprise three components: (1) government-wide financial statements, (2) fund financial statements, and (3) notes to the basic financial statements. This report also contains other supplementary information in addition to the basic financial statements themselves. Government-wide Financial Statements. The government-wide financial statements are designed to provide readers with a broad overview of the City's finances in a manner similar to a private-sector business. The Statement of Net Position presents information on all of the City’s assets, deferred outflows, liabilities, and deferred inflows with the difference between them reported as net position. Over time, increases or decreases in net position may serve as a useful indicator of whether the financial position of the City is improving or deteriorating. The Statement of Activities presents information showing how net position changed during the most recent fiscal year. All changes in net position are reported as soon as the underlying event giving rise to the change occurs, regardless of the timing of related cash flows. Thus, revenues and expenses are reported in this statement for some items that will only result in cash flows in future fiscal periods (e.g., uncollected taxes and earned, but unused, vacation leave). Both of these government-wide financial statements distinguish functions of the City that are principally supported by taxes and intergovernmental revenues (governmental activities) from other functions that are intended to recover all or a significant portion of their costs through user fees and charges (business-type activities). The governmental activities of the City include general services, development services, public works, public safety, and community services. The business-type activities of the City include water/wastewater, storm water, solid waste management, recreational facilities, contractual police services, and motor vehicle operations. The government-wide financial statements include not only the City (known as the primary government), but also two legally separate entities for which the City is financially accountable. The component units are the Bloomington Housing and Redevelopment Authority and the Bloomington Port Authority. Financial information for these component units is reported separately from the financial information presented for the primary government. The government-wide financial statements can be found on Exhibits 1 and 2 of this report.

CITY OF BLOOMINGTON, MINNESOTA
MANAGEMENT’S DISCUSSION AND ANALYSIS (UNAUDITED)
- 29 -
Fund Financial Statements A fund is a grouping of related accounts that is used to maintain control over resources that have been segregated for specific activities or objectives. The City, like other state and local governments, uses fund accounting to ensure and demonstrate finance-related legal compliance. All of the funds of the City can be divided into three categories: governmental funds, proprietary funds, and fiduciary funds. Governmental Funds. Governmental funds are used to account for essentially the same functions reported as governmental activities in the government-wide financial statements. However, unlike the government-wide financial statements, governmental fund financial statements focus on near-term inflows and outflows of spendable resources, as well as on balances of spendable resources available at the end of the fiscal year. Such information may be useful in evaluating a government’s near-term financing requirements. Because the focus of governmental funds is narrower than that of the government-wide financial statements, it is useful to compare the information presented for governmental funds with similar information presented for governmental activities in the government-wide financial statements. By doing so, readers may better understand the long-term impact of the government’s near-term financial decisions. Both the governmental fund balance sheet and the governmental fund statement of revenues, expenditures, and changes in fund balances provide a reconciliation to facilitate this comparison between governmental funds and governmental activities. The City externally reports five major and ten nonmajor governmental funds. Information is presented separately in the governmental fund balance sheet and in the governmental fund statement of revenues, expenditures, and changes in fund balances for the General Fund, Community Development Block Grant, Improvement Bonds, Capital Projects, and Improvement Construction, all of which are considered to be major funds. Data from the other governmental funds are combined into a single, aggregated presentation. Individual fund data for each of these nonmajor governmental funds is provided in the form of combining statements elsewhere in this report. The basic governmental fund financial statements can be found on Exhibits 3 through 6 of this report. Proprietary Funds. The City maintains two different types of proprietary funds: enterprise and internal service. Enterprise funds are used to report the same functions presented as business-type activities in the government-wide financial statements. The City uses enterprise funds to account for its water/wastewater, storm water, recreational facilities, solid waste, contractual police, and motor vehicle operations. Internal service funds are used to allocate costs internally among the City’s various functions. The City uses internal service funds to account for its support services, information systems, equipment, public safety radio, self-insurance, insured benefits, benefit accrual, facilities and parks maintenance, and PERA pension. Because these services predominately benefit governmental rather than business-type activities, they have been included within governmental activities in the government-wide financial statements; however, some allocations have been

CITY OF BLOOMINGTON, MINNESOTA
MANAGEMENT’S DISCUSSION AND ANALYSIS (UNAUDITED)
- 30 -
made to business-type activities. All internal service funds are combined into a single, aggregated presentation in the proprietary fund financial statements. The proprietary fund financial statements provide separate information for water/wastewater, storm water, recreational facilities (which are considered to be major funds of the City), and solid waste, contractual police, and motor vehicle operations are combined and presented as nonmajor funds. The City’s enterprise funds are the same as the business-type activities reported in the government-wide statements (except for internal service fund amounts which are allocated to both the governmental and business-type activities) but provide more detail and additional information, such as cash flows, for proprietary funds. The basic proprietary fund financial statements can be found on Exhibits 7 through 9 of this report. Fiduciary Funds. Fiduciary funds are used to account for resources held for the benefit of parties outside of the government. Fiduciary funds are not reflected in the government-wide financial statements because the resources of those funds are not available to support the City's own programs. The accounting used for fiduciary funds is much like that used for proprietary funds. The basic fiduciary fund financial statements can be found on Exhibits 10 and 11 of this report. Notes to the basic financial statements The notes provide additional information that is essential to a full understanding of the data provided in the government-wide and fund financial statements. The notes to the basic financial statements can be found on pages 68 – 120 of this report. Other Information In addition to the basic financial statements and accompanying notes, this report also presents certain required supplementary information. Required supplementary information can be found on Exhibits A-1 through A-9 of this report. The combining statements referred to earlier in connection with nonmajor funds and internal service funds are presented in the supplementary information section. Combining and individual fund statements and schedules can be found on Exhibits B-1 through F-2 of this report. The other supplementary section includes additional information on the two component units. GOVERNMENT-WIDE FINANCIAL ANALYSIS An analysis of the City’s financial position begins with a review of the Statement of Net Position and the Statement of Activities. These two statements report the City’s net position and changes therein. It should be noted that the financial position can also be affected by non-financial factors, including economic conditions, population growth, and new regulations.

CITY OF BLOOMINGTON, MINNESOTA
MANAGEMENT’S DISCUSSION AND ANALYSIS (UNAUDITED)
- 31 -
As noted earlier, net position may serve over time as a useful indicator of a government’s financial position. In the case of the City, assets and deferred outflows exceeded liabilities and deferred inflows by $549,257,684 at December 31, 2016, as compared to $535,740,400 at the end of 2015.
CITY OF BLOOMINGTON'S NET POSITIONTotal
Governmental activities Business-type activities Total Percentage2016 2015 2016 2015 2016 2015 Change
Assets:Current and other assets 226,844,246$ 210,012,720$ 15,018,821$ 14,101,959$ 241,863,067$ 224,114,679$ 7.9%Capital assets 373,420,088 357,852,758 85,359,140 85,388,894 458,779,228 443,241,652 3.5%
Total assets 600,264,334 567,865,478 100,377,961 99,490,853 700,642,295 667,356,331 5.0%
Deferred outflows:Deferred outflows 62,740,968 15,503,997 - 85,388,894 62,740,968 100,892,891 100.0%
Total assets and deferred outflows 663,005,302 583,369,475 100,377,961 184,879,747 763,383,263 768,249,222 (0.6)%
Liabilities:Current and other liabilities 8,305,597 8,781,821 2,666,684 1,700,286 10,972,281 10,482,107 4.7%Noncurrent liabilities 188,030,659 125,536,590 - - 188,030,659 125,536,590 49.8%
Total liabilities 196,336,256 134,318,411 2,666,684 1,700,286 199,002,940 136,018,697 46.3%
Deferred inflows:Deferred inflows 15,122,639 11,101,231 - - 15,122,639 11,101,231 100.0%
Total liabilities and deferred inflows 211,458,895 145,419,642 2,666,684 1,700,286 214,125,579 147,119,928 45.5%
Net position:Net investment in capital assets 310,750,929 300,117,784 85,359,140 85,388,894 396,110,069 385,506,678 2.8%Restricted 73,405,143 68,599,352 - - 73,405,143 68,599,352 7.0%Unrestricted 67,390,335 69,232,697 12,352,137 12,401,673 79,742,472 81,634,370 (2.3)%
Total net position 451,546,407$ 437,949,833$ 97,711,277$ 97,790,567$ 549,257,684$ 535,740,400$
As of December 31, 2016, the City had a positive net position balance for the government as a whole. By far, the largest portion of the City’s net position, $396,110,069 (approximately 72%), reflects the City’s net investment in capital assets (e.g., land, buildings and structures, machinery and equipment, distribution system, improvements, and infrastructure) less any related debt used to acquire those assets. The City uses these capital assets as an integral part of providing services to citizens; consequently, these are not “liquid” assets and are not available for future spending. Although the City's investment in its capital assets is reported net of related debt, it should be noted that the resources needed to repay this debt must be provided from other sources, since the capital assets themselves cannot be used to liquidate these liabilities. An additional portion of the City’s net position, $73,405,143 (approximately 13%), represents resources that are subject to external restrictions on how they may be used. The remaining balance of unrestricted net position, $79,742,472 (approximately 15%), may be used to meet the government’s ongoing obligation to citizens and creditors.

CITY OF BLOOMINGTON, MINNESOTA
MANAGEMENT’S DISCUSSION AND ANALYSIS (UNAUDITED)
- 32 -
The following schedule provides a summary of the City’s operations for the year ended December 31, 2016:
CITY OF BLOOMINGTON'S CHANGES IN NET POSITIONYear Ended December 31, 2016
TotalGovernmental Activities Business-Type Activities Total Percent
2016 2015 2016 2015 2016 2015 ChangeREVENUES:
Program revenues:Charges for services 10,609,600$ 12,424,605$ 38,083,291$ 34,009,753$ 48,692,891$ 46,434,358$ 4.9 %Operating grants and contributions 7,838,532 7,103,296 335,884 519,824 8,174,416 7,623,120 7.2 %Capital grants and contributions 27,077,936 17,377,334 584,363 245,654 27,662,299 17,622,988 57.0 %
General revenues:Property taxes 51,260,264 48,881,455 1,427,984 1,414,133 52,688,248 50,295,588 4.8 %Business taxes 16,936,341 14,412,263 - - 16,936,341 14,412,263 17.5 %Grants and contributions not restricted 1,977,371 2,877,947 - - 1,977,371 2,877,947 (31.3)%Gain on sale of capital assets 87,942 163,564 21,000 - 108,942 163,564 (33.4)%Interest and investment earnings 901,701 1,061,308 53,740 78,237 955,441 1,139,545 (16.2)%
Total revenues 116,689,687 104,301,772 40,506,262 36,267,601 157,195,949 140,569,373 11.8 %
EXPENSES:General services 9,615,471 7,574,572 - - 9,615,471 7,574,572 26.9 %Development services 18,533,117 11,120,055 - - 18,533,117 11,120,055 66.7 %Public works 19,389,393 15,922,887 - - 19,389,393 15,922,887 21.8 %Public safety 35,429,025 30,927,415 - - 35,429,025 30,927,415 14.6 %Community services 18,455,451 15,987,952 - - 18,455,451 15,987,952 15.4 %Interest on long-term debt 1,537,926 1,587,935 - - 1,537,926 1,587,935 (3.1)%Water/wastewater utility - - 24,967,519 23,091,127 24,967,519 23,091,127 8.1 %Storm water utility - - 3,693,302 3,453,095 3,693,302 3,453,095 7.0 %Recreational facilities - - 6,269,405 5,620,253 6,269,405 5,620,253 11.6 %Solid waste management - - 3,263,225 1,895,481 3,263,225 1,895,481 72.2 %Contractual police services - - 1,801,638 1,717,906 1,801,638 1,717,906 4.9 %Motor vehicle - - 723,193 672,289 723,193 672,289 7.6 %
Total expenses 102,960,383 83,120,816 40,718,282 36,450,151 143,678,665 119,570,967 20.2 %
Change in net position before transfers 13,729,304 21,180,956 (212,020) (182,550) 13,517,284 20,998,406 (35.6)%
Transfers (132,730) (5,267) 132,730 5,267 - - - %
Change in net position 13,596,574 21,175,689 (79,290) (177,283) 13,517,284 20,998,406 (35.6)%
Net position - January 1 437,949,833 438,166,782 97,790,567 97,967,850 535,740,400 536,134,632 (0.1)%Prior period adjustment - (21,392,638) - - - (21,392,638) - %Net position - January 1, as restated 437,949,833 416,774,144 97,790,567 97,967,850 535,740,400 514,741,994 4.1 %
Net position - December 31 451,546,407$ 437,949,833$ 97,711,277$ 97,790,567$ 549,257,684$ 535,740,400$ 2.5 %
Expenses above include $13,977,238 of depreciation expense for governmental activities under the full accrual basis of accounting.

CITY OF BLOOMINGTON, MINNESOTA
MANAGEMENT’S DISCUSSION AND ANALYSIS (UNAUDITED)
- 33 -
Governmental activities As part of GASB Statement No. 34 reporting changes, internal service fund charges for services (program revenues of $43,396,258) and expenses ($52,336,078) were allocated to all the governmental and business-type activities. A comparison of revenue and expense changes from 2015 to 2016 follows: Overall, governmental activities revenues increased by $12.4 million. Within this increase, general revenues increased overall by $3.8 million in 2016 due to a combination of the following factors. Property taxes increased by $2.4 million as a result of the levy and market value increases, and business taxes increased by $2.5 million due to new hotels and entertainment opening. Program revenues increased by $8.6 million in 2016. Charges for services decreased by $1.8 million as a result of less building permits issued. Operating grants and contribution increased by $735 thousand primarily due to Fire grant for firefighters’ training. Capital grants and contributions increased by $7.8 million as a result of increased capital projects. Development services expenses increased by $7.4 million due to an increase in capital improvement project spending.
Property taxes44.0%
Business taxes14.5%
Grants and contributions
31.7%
Charges for services
9.1%
Other0.7%
City of Bloomington2016 Revenue Sources - Governmental Activities

CITY OF BLOOMINGTON, MINNESOTA
MANAGEMENT’S DISCUSSION AND ANALYSIS (UNAUDITED)
- 34 -
Business-type activities Business-type expenses increased in 2016 by $4.3 million. These expenses include depreciation of capital assets that were funded in prior years. Where expenses exceeded revenues, there was a planned spend-down of net position.
$-
$5
$10
$15
$20
$25
$30
Water/Wastewater Storm Water RecreationalFacilities
Solid Waste Contractual Police Motor Vehicle
$ M
illi
on
s
City of Bloomington2016 Expenses and Program Revenues - Business-Type Activities
Revenues
Expenses
FINANCIAL ANALYSIS OF THE GOVERNMENT’S FUNDS As noted earlier, the City uses fund accounting to ensure and demonstrate compliance with finance-related legal requirements. Governmental Funds. The general government functions are contained in the General, Special Revenue, Debt Service, and Capital Projects funds. The focus of the City’s governmental funds is to provide information on near-term inflows, outflows, and balances of spendable resources. Such information is useful in assessing the City’s financial requirements. In particular, unrestricted fund balance may serve as a useful measure of a government’s net resources available at the end of the fiscal year.

CITY OF BLOOMINGTON, MINNESOTA
MANAGEMENT’S DISCUSSION AND ANALYSIS (UNAUDITED)
- 35 -
At December 31, 2016, the City’s governmental funds reported combined ending fund balances of $118,278,182, an increase of $10.6 million in comparison with the prior year. Fund balance of $56.5 million is restricted due to externally enforceable legal restrictions (creditors, grantors, contributors, and by law through constitutional provisions or enabling regulations). Approximately, $61.8 million or 52% of total fund balance constitutes unrestricted fund balance which is the total of committed fund balance (amounts that can be used only for the specific purposes by a formal action of the City Council), assigned fund balance (amounts that are to be used for a specific purpose as expressed by an official that has been delegated authority from the City Council), and unassigned fund balance (amounts that are available for any purpose in the General Fund). The following presents the amounts of unrestricted fund balance by various fund types:
Fund Type
Unrestricted Fund Balance
General fund $ 28,805,375 Special revenue funds 2,199,884 Capital projects funds 6,030,453 Improvement construction funds 24,766,339 Total $ 61,802,051
The following tables provide an overview of revenues by source and expenditures by function for all governmental funds:
Revenues by Source Governmental Funds
2016 2015 Increase
Amount Percent of Total
Amount
Percent of Total
(Decrease) Amount
Revenues by source: Taxes $ 68,213,503 60.9% $ 63,264,449 59.3% $ 4,949,054 Special assessments 3,943,212 3.5 4,469,106 4.2 (525,894) Business licenses 4,743,748 4.2 6,241,921 5.8 (1,498,173) Fines and forfeitures 1,057,518 .9 1,251,693 1.2 (194,175) Intergovernmental 14,435,816 12.9 17,553,679 16.5 (3,117,863) Program income 2,908,551 2.6 3,116,814 2.9 (208,263) Interest and investment income 701,235 .6 833,337 .8 (132,102) Franchise fees 5,139,279 4.6 1,400,108 1.3 3,739,171 Contractual component unit 8,626,710 7.7 3,383,930 3.2 5,242,780 Other 2,290,467 2.1 5,085,993 4.8 (2,795,526) Total $ 112,060,039 100.0% $ 106,601,030 100.0% $ 5,459,009

CITY OF BLOOMINGTON, MINNESOTA
MANAGEMENT’S DISCUSSION AND ANALYSIS (UNAUDITED)
- 36 -
Expenditures by Function
Governmental Funds
2016 2015 Increase
Amount Percent of Total
Amount
Percent of Total
(Decrease) Amount
Expenditures by Function General services $ 7,431,274 6.5% $ 6,741,110 6.4% $ 690,164 Development services 14,926,374 13.1 8,479,242 8.1 6,447,132 Public works 10,778,986 9.5 9,989,225 9.5 789,761 Public safety 32,045,686 28.2 29,692,500 28.3 2,353,186 Community services 16,131,465 14.2 15,396,539 14.7 734,926 Debt service 8,655,180 7.6 9,592,056 9.1 (936,876) Capital outlay 23,736,119 20.9 25,111,728 23.9 (1,375,609) Total $ 113,705,084 100.0% $ 105,002,400 100.0% $ 8,702,684 Please note that the governmental fund information shown above is presented on the modified accrual basis of accounting. The information on the government-wide statements is presented on the full accrual basis. The two formats are prepared differently as required by generally accepted accounting principles (GAAP). See the reconciliations of these statements on Exhibits 4 and 6. Following is a discussion of the major governmental funds that had large increases or decreases of fund balances: The General Fund is the chief operating fund of the City. At the end of the current fiscal year, fund balance of the General Fund was $28,809,712 which was comprised of $1,179,421 of committed fund balance, $4,337 of nonspendable fund balance and $27,625,954 of unassigned fund balance. As a measure of the General Fund’s liquidity it is useful to compare unassigned fund balance to total General Fund expenditures. Unassigned fund balance represents 43% of total General Fund expenditures. It is important to note that the General Fund unassigned fund balance of $27,625,954 is designated in its entirety for a working capital goal of $27,759,919. The committed amount of $1,179,421 consists of a budget carryover amount of $355,302, and encumbrance rollover amount of $824,119. The budget carryover represents 2016 budgeted amounts that were unspent in 2016 and were carried over to the 2017 budget. The encumbrance rollover amount represents encumbrances for open purchase order contracts at the end of 2016 that were carried over to the 2017 budget. Overall, General Fund revenues increased from $63.7 million in 2015 to $66.2 million in 2016. Of this increase, that largest factor was an increase in property tax revenue by $2.8 million as a result of increased market values and tax levy. There were also increases in lodging and admission tax revenues of $1.5 million due to a continued improvement in the local economy which contributed to increased lodging and entertainment. General Fund expenditures increased from $62.4 million in 2015 to $67.2 million in 2016.

CITY OF BLOOMINGTON, MINNESOTA
MANAGEMENT’S DISCUSSION AND ANALYSIS (UNAUDITED)
- 37 -
The Improvement Bonds Funds fund balance had a net increase of $4.3 million, a large part due to $3.9 million of bond debt issuance in 2016 that will be used to refund Series 41 & Series 42 bonds in 2018. The Improvement Construction fund balance increased $3.8 million due to bond debt issuance in 2016 for Series 50 Bonds. The fund balance of the City’s Nonmajor Governmental Funds increased by $1.7 million due to refunding of the 2007 Art Center Bonds. Proprietary Funds. The City’s proprietary funds provide the same type of information found in the government-wide financial statements, but in more detail. As discussed earlier, the City reports two types of proprietary funds: enterprise funds and internal service funds. The following sections describe the key balances and transactions for the different fund types. The net position of the enterprise funds increased by $1.3 million during the current fiscal year. Key factors in this change include: The Water/Wastewater Utility Fund had a decrease in net position of $2.0 million due to a
decrease in service charges. The Solid Waste Fund in the Non-Major Governmental Funds increased $1.4 million due to
transfers in. The Storm Water Fund had an increase in net position of $2.3 million due mostly to a modest
increase in charges for services to finance future storm water improvements.
The net position of the internal service funds decreased by $8.9 million during the current fiscal year. Key factors in this change include: The Equipment Division Fund had an increase of $1.3 million due to delays in projects. Facilities Parks and Maintenance net position increased $1.5 million as some projects were
delayed. PERA Pension decreased $10.1 million due to an increase in PERA benefits expense.
GENERAL FUND BUDGETARY HIGHLIGHTS Differences between the original budget and the final amended budget resulted in a $1.6 million increase in appropriations and can be briefly summarized as follows: The council approved transfers out to Strategic Priorities in the amount of $1.4 million as a
result of 2015 positive performance.
The actual results compared to the final budget showed a $2.3 million favorable variance due to better than budgeted revenues as well as conservative spending. Significant details are as follows:

CITY OF BLOOMINGTON, MINNESOTA
MANAGEMENT’S DISCUSSION AND ANALYSIS (UNAUDITED)
- 38 -
Lodging and admissions tax revenue exceeded budget by $1.3 million due to a better than expected recovery in the local hotel and entertainment industries as well as new hotels opening.
Public Safety expenditures were $303,000 under budget due to a spending reduction in administrative expenditures and savings from unfilled positions.
Community Development and Community Services expenditures budget were $437,000 under budget due to savings from unfilled positions.
CAPITAL ASSETS AND DEBT ADMINISTRATION Capital Assets The City’s capital assets for its governmental and business-type activities as of December 31, 2016 amount to $458,779,228 (net of accumulated depreciation). This investment in capital assets includes land, infrastructure, buildings and structures, machinery and equipment, and distribution systems. Major capital asset additions during the fiscal year include the following: The City’s Utilities Division improved the water, wastewater, and storm water distribution
systems at a cost of $3,270,510. The 2016 Pavement Management Program expended $8,751,053. These improvements
included 4.06 miles of reconstructed streets and 6.47 miles of overlaid streets. The City’s State Aid Construction Fund spent $3,376,856 on street improvement projects in
2016. The City’s infrastructure assets are recorded at historical cost in the government-wide financial statements. Additional information on the City’s capital assets can be found in Note 3. Long-term Debt At the end of the current fiscal year, the City had total bonded debt outstanding of $65,250,000 as compared to $59,300,000 in the prior year. This amount is comprised of $65,250,000 related to governmental activities and no debt related to business-type activities. It should be noted that $5,340,000 of the total bonded debt outstanding is refunding debt which will refund other bonded debt in February of 2017 and February of 2018. In 2016, the City issued $6,115,000 of General Obligation Permanent Improvement Revolving (PIR) Bonds. In addition the City issued $2,045,000 of Taxable General Obligation Tax Increment Bonds, $1,610,000 of General Obligation Arts Center Refunding Bonds and $3,730,000 of General Obligation Permanent Improvement Revolving Fund Refunding Bonds. In 2016 the City retired a total of $7,550,000 resulting in $65,250,000 in bonds payable as of December 31, 2016. The City maintains an “Aaa” rating from Moody’s, an “AAA” rating from Standard & Poor’s, and an “AAA” rating from Fitch Ratings. The City is one of only 32 cities nationwide to hold this “Triple A” bond ratings combination. Additional information on the City’s long-term debt can be found in Note 6.

CITY OF BLOOMINGTON, MINNESOTA
MANAGEMENT’S DISCUSSION AND ANALYSIS (UNAUDITED)
- 39 -
ECONOMIC FACTORS AND NEXT YEAR’S BUDGET AND RATES The following key indicators provide highlights of the City’s economic outlook and future budget impact: At December 2016, the unemployment rate in Bloomington was 3.4%, up 0.5% from a year
ago. This compares favorably to the state’s December unemployment rate of 4.1% and the national rate of 4.6%.
As of January 2016 the assessor’s estimated market value for Bloomington turned up an additional 5.4% on top of 9.8% growth in 2015 to a total of $12.1 billion. This is a 67% increase in total City market value since 2000, and the total is now 2.5% above the previous peak in 2008. The City’s diverse tax base, approximately half commercial and half residential, will provide stability in the coming year.
The City’s contract with its health care provider included a rate decrease of 6.5% for the year 2017 and a 10% rate cap for 2018.
The proposed Public Employees Retirement Association (PERA) pension costs to the City for 2017 are estimated at roughly $4.51 million.
Property tax reforms and budget deficits at the state level significantly reduced general state government aid and market value homestead credit payments made to the City. In the late 1990s, the City created a prioritized list of downturn strategies. Starting with the 2002 budget process to address the “dot.com” downturn, the City has conservatively utilized these strategies to mitigate large fluctuations in the year-to-year revenues and expenditures. These strategies were again used during the most recent recession. The budgets, starting with the year 2013, began replenishing reserve funds used for the downturn.
The 2017 budget was approved without the need to reduce existing service levels. In the approved 2017 budget, there was a 2.75% salary increase for City employees.
The City uses a ten-year General Fund financial model to determine levels of service and to respond to short-term economic and financial changes to make good decisions for the long term. Other funds are modeled for ten to fifteen years to moderate fee increases and to plan for pay-as-you-go capital improvements.
All of these factors were considered in preparing the City of Bloomington’s budget for the 2017 fiscal year. REQUESTS FOR INFORMATION This financial report is designed to provide a general overview of the City’s finances for all those with an interest in the government’s finances. Questions concerning any of the information provided in this report or the requests for additional financial information should be addressed to the Chief Financial Officer, Bloomington Civic Plaza, 1800 West Old Shakopee Road, Bloomington, Minnesota, 55431.

- 40 -

- 41 -
BASIC FINANCIAL
STATEMENTS

Housing and Governmental Business-type Port Redevelopment
Activities Activities Total Authority AuthorityASSETSCash, cash equivalents, and investments 147,322,212$ 10,629,120$ 157,951,332$ 56,512,465$ 5,771,810$ Cash with escrow agent 4,691,761 - 4,691,761 - - Receivables, net 37,786,943 8,674,836 46,461,779 2,079,284 9,091,924 Prepaid items 895,394 30,786 926,180 - 359,159 Due from primary government - - - 429,476 111,335 Due from component units 7,938,476 - 7,938,476 - - Due from other governments - - - 2,483 6,256 Inventory 8,192,456 - 8,192,456 17,150,000 4,289,149 Internal balances 4,315,921 (4,315,921) - - - Net pension asset 15,701,083 - 15,701,083 - - Capital assets:
Capital assets - nondepreciable 99,276,863 4,762,271 104,039,134 - 1,600,300 Capital assets - net of accumulated depr 274,143,225 80,596,869 354,740,094 - 1,202,009 Net capital assets 373,420,088 85,359,140 458,779,228 - 2,802,309
Total assets 600,264,334 100,377,961 700,642,295 76,173,708 22,431,942
DEFERRED OUTFLOWS OF RESOURCESDeferred outflows of resources 62,740,968 - 62,740,968 - -
Total assets and deferred outflows of resources 663,005,302 100,377,961 763,383,263 76,173,708 22,431,942
LIABILITIESAccounts payable and other current liabilities 6,182,980 2,514,805 8,697,785 2,256,287 134,983 Accrued interest payable 672,803 - 672,803 90,935 - Unearned revenue 909,003 151,879 1,060,882 - 371,533 Due to component units 540,811 - 540,811 - - Due to primary government - - - 2,944,953 281,831 Noncurrent liabilities:
Due to primary government - Bonds payable due in more than one year - - - - 4,711,692 Due within one year 11,409,480 - 11,409,480 - - Due in more than one year 79,327,631 - 79,327,631 7,150,000 1,574,720 Net pension liability 97,293,548 - 97,293,548 - -
Total liabilities 196,336,256 2,666,684 199,002,940 12,442,175 7,074,759
DEFERRED INFLOWS OF RESOURCESDeferred inflow of resources 15,122,639 - 15,122,639 - -
Total liabilities and deferred inflows of resources 211,458,895 2,666,684 214,125,579 12,442,175 7,074,759
NET POSITIONNet investment in capital assets 310,750,929 85,359,140 396,110,069 - 1,227,589 Restricted for:
Debt service 40,675,676 - 40,675,676 - - Tax increment 23,517,614 - 23,517,614 63,694,783 1,388,956 Street reconstruction 4,494,474 - 4,494,474 - - Restricted - other 4,717,379 - 4,717,379 - 71,445
Unrestricted 67,390,335 12,352,137 79,742,472 36,750 12,669,193 Total net position 451,546,407$ 97,711,277$ 549,257,684$ 63,731,533$ 15,357,183$
See notes to the basic financial statements.
CITY OF BLOOMINGTON, MINNESOTAStatement of Net Position
December 31, 2016
Primary Government Component Units
EXHIBIT 1
-42 -

Net (Expense) Revenue and Changes in Net Position
Operating Capital Housing andCharges for Grants and Grants and Governmental Business-type Port Redevelopment
Functions/Programs Expenses Services Contributions Contributions Activities Activities Total Authority Authority
Primary Government: Governmental activities:
General Services 9,615,471$ 3,084,579$ 508,798$ 71,738$ (5,950,356)$ -$ (5,950,356)$ -$ -$ Development Services 18,533,117 4,551,060 924,307 13,226,650 168,900 - 168,900 - - Public Works 19,389,393 216,346 - 13,630,967 (5,542,080) - (5,542,080) - - Public Safety 35,429,025 578,786 2,461,420 27,875 (32,360,944) - (32,360,944) - - Community Services 18,455,451 2,178,829 3,944,007 120,706 (12,211,909) - (12,211,909) - - Interest on long-term debt 1,537,926 - - - (1,537,926) - (1,537,926) - - Total governmental activities 102,960,383 10,609,600 7,838,532 27,077,936 (57,434,315) - (57,434,315) - -
Business-type activities:Water/Wastewater Utility 24,967,519 23,562,178 - 224,508 - (1,180,833) (1,180,833) - - Storm Water Utility 3,693,302 5,528,944 - 328,044 - 2,163,686 2,163,686 - - Recreational Facilities 6,269,405 3,749,856 49,649 - - (2,469,900) (2,469,900) - - Solid Waste Management 3,263,225 2,496,610 236,504 31,811 - (498,300) (498,300) - - Contractual Police 1,801,638 2,031,178 49,731 - - 279,271 279,271 - - Motor Vehicle 723,193 714,525 - - - (8,668) (8,668) - - Total business-type activities 40,718,282 38,083,291 335,884 584,363 - (1,714,744) (1,714,744) - -
Total primary government 143,678,665$ 48,692,891$ 8,174,416$ 27,662,299$ (57,434,315) (1,714,744) (59,149,059) - -
Component units:Port Authority 19,762,213$ 1,010$ 290,000$ -$ - - - (19,471,203) - Housing and Redevelopment Authority 8,843,991 2,450,858 5,469,879 - - - - - (923,254)
Total component units 28,606,204$ 2,451,868$ 5,759,879$ -$ - - - (19,471,203) (923,254)
General revenues: Property taxes 51,260,264 1,427,984 52,688,248 27,297,579 3,080,068 Business taxes 16,936,341 - 16,936,341 - - Grants and contributions not restricted 1,977,371 - 1,977,371 - - Gain on sale of capital assets 87,942 21,000 108,942 - - Interest and investment earnings 901,701 53,740 955,441 461,280 7,689Transfers (132,730) 132,730 - - - Total general revenues and transfers 71,030,889 1,635,454 72,666,343 27,758,859 3,087,757
Change in net position 13,596,574 (79,290) 13,517,284 8,287,656 2,164,503
Net position - January 1 437,949,833 97,790,567 535,740,400 55,443,877 13,192,680
Net position - December 31 451,546,407$ 97,711,277$ 549,257,684$ 63,731,533$ 15,357,183$
See notes to the basic financial statements.
Primary Government Component Units
CITY OF BLOOMINGTON, MINNESOTAStatement of Activities
Year Ended December 31, 2016
Program Revenues
EXHIBIT 2
-43 -

- 44 -

- 45 -
CITY OF BLOOMINGTON, MINNESOTA MAJOR GOVERNMENTAL FUNDS GENERAL FUND This fund accounts for all unrestricted resources except those required to be accounted for in another fund. SPECIAL REVENUE FUNDS Special revenue funds are established to account for taxes and other revenues set aside for a particular purpose. Community Development Block Grant Fund - This fund was established to account for funds received under Title I of the Housing and Community Development Act of 1974. DEBT SERVICE FUNDS Debt service funds account for the accumulation of resources for and payment of general long-term debt principal and interest. Improvement Bonds Fund – This fund is used to account for the accumulation of resources for payment of principal and interest on general obligation improvement bonds. CAPITAL PROJECTS FUNDS Capital projects funds are used to account for the construction and financing of large capital projects. Capital Projects Fund – This fund accounts for funds and monies required for financing land acquisitions, park development, and construction and equipment related to public facilities. Improvement Construction Fund – This fund accounts for the proceeds of bonds sold for the purpose of street, trails, sewer, water, and state aid construction.

CITY OF BLOOMINGTON, MINNESOTABalance Sheet
Governmental FundsDecember 31, 2016
CommunityGeneral Development Improvement
Fund Block Grant BondsASSETS Cash, cash equivalents and investments 28,779,993$ 2,260$ 16,320,010$ Cash with fiscal agent - - 4,691,761 Accrued interest receivable 83,581 (326) 42,572 Taxes receivable 621,021 - 24,642 Accounts receivable 1,769,631 - - Loan receivable - - - Mortgages receivable - 10,143,689 - Prepaids items 4,337 - - Land held for resale - - - Due from other funds 216,000 - - Due from component units 157,309 - - Due from other governments 260,899 166,510 - Special assessments receivable 39,125 - 17,623,152
Total assets 31,931,896$ 10,312,133$ 38,702,137$
LIABILITIES Accounts payable 2,154,450$ 19,109$ 29,424$ Retainage payable - - - Due to other funds - 38,000 - Due to component units - 111,335 - Due to other governments - - - Unearned revenue 515,261 - - Accrued interest payable - - - Deposits payable 7,332 - - Total liabilities 2,677,043 168,444 29,424
DEFERRED INFLOWS OF RESOURCES Deferred inflows - mortgages - 10,143,689 - Deferred inflows - taxes 406,016 - - Deferred inflows - state aid - - - Deferred inflows - special assessments 39,125 - 17,623,152 Deferred inflows - land held for resale - - - Total deferred inflows of resources 445,141 10,143,689 17,623,152
FUND BALANCES Nonspendable 4,337 - - Restricted - - 21,049,561 Committed 1,179,421 - - Assigned - - - Unassigned 27,625,954 - - Total fund balances 28,809,712 - 21,049,561
Total liabilities, deferred inflows of resources, and fund balances 31,931,896$ 10,312,133$ 38,702,137$
See notes to the basic financial statements.
- 46 -

Nonmajor TotalCapital Improvement Governmental GovernmentalProjects Construction Funds Funds
26,051,454$ 30,111,223$ 7,922,322$ 109,187,262$ - - - 4,691,761
52,438 90,190 20,575 289,030 1,947 2,961 4,394 654,965
105,016 1,254,687 449,082 3,578,416 437,956 - - 437,956
- - - 10,143,689 17,000 - - 21,337
7,418,047 606,477 - 8,024,524 474,000 - - 690,000
2,934,474 - - 3,091,783 7,329 2,832,198 281,450 3,548,386
1,564,350 - - 19,226,627
39,064,011$ 34,897,736$ 8,677,823$ 163,585,736$
444,215$ 493,866$ 329,656$ 3,470,720$ 112,203 513,222 - 625,425
- 474,000 58,000 570,000 429,476 - - 540,811
16,851 - - 16,851 - - 318,740 834,001 - - - -
21,635 - 461,921 490,888 1,024,380 1,481,088 1,168,317 6,548,696
- - - 10,143,689 - - - 406,016 - 958,002 - 958,002
1,564,350 - - 19,226,627 7,418,047 606,477 - 8,024,524 8,982,397 1,564,479 - 38,758,858
17,000 - - 21,337 23,619,015 7,085,830 4,700,388 56,454,794 5,421,219 - 1,955,447 8,556,087
- 24,766,339 853,671 25,620,010 - - - 27,625,954
29,057,234 31,852,169 7,509,506 118,278,182
39,064,011$ 34,897,736$ 8,677,823$ 163,585,736$
EXHIBIT 3
- 47 -

- 48 -

CITY OF BLOOMINGTON, MINNESOTAReconciliation of the Governmental Funds Balance Sheet
to the Statement of Net PositionDecember 31, 2016
FUND BALANCE - TOTAL GOVERNMENTAL FUNDS 118,278,182$
Amounts reported for governmental activities in the Statement of Net Positionare different because:
Capital assets used in governmental funds are not current financial resourcesand, therefore, are not reported as assets in governmental funds:
Cost of capital assets 473,033,558$ Less accumulated depreciation (148,624,271) 324,409,287
Governmental funds do not report a liability for accrued interest until due and payable. (644,169)
Internal service funds are used by management to charge the costs ofvarious services provided to individual funds. The assets and liabilities ofthe internal service funds are included in governmental activities in theStatement of Net Position.
Internal service fund net position per statements 15,938,503 Add allocation to business-type activities 4,555,449 20,493,952
Long-term liabilities, including bonds payable, are not due and payable in the current period and, therefore, are not reported in the funds. (62,165,000)
A portion of the annual required contribution for other post employment benefits wasnot paid in the current period and, therefore, not reported in the governmental funds. (6,960,825)
Bond premiums are reported as other financing sources inthe governmental funds at the time of issuance. In the Statement of Net Position,these costs are amortized over the life of the debt issue. (2,189,159)
Amounts due from component units-bonds payable are not reflected in thegovernmental funds and, therefore, must be added to reconcile to the totalnet position of governmental activities. 4,844,389
Amounts pertaining to the Bloomington Fire Relief Association pension plan are not current financial resources and, therefore, are not reported in governemental funds:
Net pension asset 15,701,083 Deferred outflows of resources 4,772,550 Deferred inflows of resources (3,552,740) 16,920,893
Other long-term assets related to delinquent property taxes, land held for resale, and special assessments are not available to pay for current period expenditures and, therefore, are unavailable in the governmental funds. 38,558,857
NET POSITION OF GOVERNMENTAL ACTIVITIES 451,546,407$
See notes to the basic financial statements.
EXHIBIT 4
- 49 -

CITY OF BLOOMINGTON, MINNESOTAStatement of Revenues, Expenditures, and Changes in Fund Balances
Governmental FundsYear Ended December 31, 2016
CommunityGeneral Development Improvement
Fund Block Grant BondsREVENUES Property taxes 41,913,743$ -$ 3,109,309$ Fiscal disparities 3,154,786 - 230,511 Special assessments 24,142 - 3,752,488 Lodging and admissions tax 9,807,314 - - Business licenses 4,743,748 - - Fines and forfeitures 831,429 - - Intergovernmental 2,607,348 581,836 - Program income 2,084,458 568,021 - Interest 185,793 - 110,808 Net change in fair value of investments (105,202) - (50,181) Other 982,120 - 33,472 Franchise fees - - - Contractual payments from component unit - - - Total revenues 66,229,679 1,149,857 7,186,407
EXPENDITURES Current: General services 7,028,368 - 149,706 Development services 6,707,431 1,117,426 - Public works 10,772,478 - - Public safety 28,861,580 - - Community services 13,796,127 - - Debt service: Interest - - 1,320,498 Principal retirement - - 5,940,000 Capital outlay: General services - - - Development services - - - Public works 59,950 - - Public safety 15,899 - - Community services 263 - - Total expenditures 67,242,096 1,117,426 7,410,204
Excess (deficiency) of revenues over (under) expenditures (1,012,417) 32,431 (223,797)
OTHER FINANCING SOURCES (USES) Transfers from other funds 3,615,169 - 955,672 Transfers to other funds (1,752,804) (32,431) (458,656) Issuance of debt - - 3,791,099 Premium on bonds issued - - 187,550 Total other financing sources (uses) 1,862,365 (32,431) 4,475,665
Net change in fund balance 849,948 - 4,251,868
Fund balance - January 1 27,959,764 - 16,797,693
Fund balance - December 31 28,809,712$ -$ 21,049,561$
Note: The General Fund is budgeted at the department level, as reported on Exhibit A-1, rather than by function.See notes to the basic financial statements.
- 50 -

Nonmajor TotalCapital Improvement Governmental GovernmentalProjects Construction Funds Funds
952,466$ 750,465$ 1,003,885$ 47,729,868$ 35,226 53,561 73,199 3,547,283
166,582 - - 3,943,212 7,129,038 - - 16,936,352
- - - 4,743,748 - - 226,089 1,057,518
1,818,836 6,180,718 3,247,078 14,435,816 - - 256,072 2,908,551
408,002 300,585 54,752 1,059,940 (69,810) (99,582) (33,930) (358,705) 726,070 161,308 342,497 2,245,467
- 3,668,522 1,470,757 5,139,279 8,671,710 - - 8,671,710
19,838,120 11,015,577 6,640,399 112,060,039
- 81,786 171,414 7,431,274 6,716,548 9,043 375,926 14,926,374
- 6,508 - 10,778,986 - - 3,184,106 32,045,686
516 - 2,334,822 16,131,465
35,039 107,553 217,090 1,680,180 - - 1,035,000 6,975,000
- - 278,450 278,450 9,907,641 608,595 39,500 10,555,736
- 12,254,955 - 12,314,905 - - 74,530 90,429
262,169 - 234,167 496,599 16,921,913 13,068,440 7,945,005 113,705,084
2,916,207 (2,052,863) (1,304,606) (1,645,045)
1,599,992 458,656 1,433,883 8,063,372 (4,564,107) (955,672) (162,284) (7,925,954)
- 6,053,901 1,610,000 11,455,000 - 323,287 126,512 637,349
(2,964,115) 5,880,172 3,008,111 12,229,767
(47,908) 3,827,309 1,703,505 10,584,722
29,105,142 28,024,860 5,806,001 107,693,460
29,057,234$ 31,852,169$ 7,509,506$ 118,278,182$
EXHIBIT 5
- 51 -

- 52 -

CITY OF BLOOMINGTON, MINNESOTAReconciliation of the Statement of Revenues,
Expenditures, and Changes in Fund Balances ofGovernmental Funds to the Statement of Activities
Year Ended December 31, 2016
NET CHANGE IN FUND BALANCES - TOTAL GOVERNMENTAL FUNDS 10,584,722$
Amounts reported for governmental activities in the Statement of Activitiesare different because:
Governmental funds report capital outlay as expenditures. However, in theStatement of Activities, the cost of these assets is capitalized (subject to the City's capitalization policy) and depreciated over their estimated useful lives and reportedas depreciation expense.
Capital outlays 23,736,119$ Capital outlay not capitalized (124,293) Capital Contribution from Component Unit 3,027,000 Depreciation expense (9,986,159) Loss on disposal of assets (391,100) 16,261,567
The issuance of long-term debt (e.g., bonds payable) provides current financial resources to governmental funds, while the repayment of the principal oflong-term debt consumes the current financial resources of governmental funds.Neither transaction, however, has any effect on net position.
Debt issued (11,455,000) Principal paid 6,975,000 (4,480,000)
Governmental funds report the effect of premiums and discounts when debt is first issued, whereas these amounts are deferred and amortized in the Statement of Activities. (637,349)
Some expenses reported in the Statement of Activities do not require the use of current financial resources and, therefore, are not reported as expenditures in the governmental (620,583) funds. This includes the change in accrued interest payable and the net other post employment benefits (OPEB) obligation.
Internal service funds are used by management to charge the costs ofvarious services provided to individual funds. The net revenues of certain activities of internal service funds are reported with governmental activities.
Change in internal service fund net position per statements (8,854,125) Add allocation to business-type activities 1,340,973 (7,513,152)
Revenues in the Statement of Activities that do not provide current financial resourcesare not reported as revenues in the funds. 820,786
Interest revenue on Due from Component Units is not recorded in the governmental fundsuntil received but reported in the Statement of Activities when earned. (2,127)
Governmental Funds report Fire Department pension contribution as expenditures, howeverpension expense is reported in the statement of activities. This is the amount by which pension expense exceeded pension contributions.
Pension Expense (692,290)
Repayments of Due from Component Units are treated as revenues in the governmental fundsbut reported as a reduction of the receivable in the Statement of Net Position. Bond proceedsloaned to the component unit are treated as expenditures in the governmental fundsbut reported as an increase in the receivable in the Statement of Net Position. (125,000)
CHANGE IN NET POSITION OF GOVERNMENTAL ACTIVITIES 13,596,574$
See notes to the basic financial statements.
EXHIBIT 6
- 53 -

- 54 -

- 55 -
CITY OF BLOOMINGTON, MINNESOTA MAJOR PROPRIETARY FUNDS ENTERPRISE FUNDS Enterprise funds are used to account for operations that are financed and operated in a manner similar to private business enterprises where the intent is that the costs are to be recovered primarily through user charges. Water/Wastewater Utility Fund - This fund accounts for the operations of the City-owned water and sewer systems. Storm Water Utility Fund - This fund accounts for the operations and improvements of the storm water drainage system. Recreational Facilities Fund - This fund accounts for the operations of the City's ice garden, golf courses, aquatic recreation facilities and art center operations.

CITY OF BLOOMINGTON, MINNESOTAStatement of Fund Net Position
Proprietary FundsDecember 31, 2016
Business-type Activities - Enterprise Funds
Water/Wastewater Storm WaterUtility Utility
ASSETSCurrent assets: Cash and cash equivalents 1,627,844$ 5,668,113$ Accrued interest receivable 6,600 15,326 Taxes receivable 194,052 - Accounts receivable 5,019,138 1,381,335 Prepaid items 30,786 - Due from other funds 359,530 - Due from other governments 47,110 55,422 Inventory - - Total current assets 7,285,060 7,120,196 Noncurrent assets: Land 2,280,001 478,858 Buildings and structures 18,436,732 791,498 Machinery and equipment 1,461,686 179,571 Improvements 2,133,283 1,850,326 Distribution system 94,947,337 42,441,627 Construction in progress 47,655 - Accumulated depreciation (72,970,190) (16,015,953) Total noncurrent assets 46,336,504 29,725,927 Total assets 53,621,564 36,846,123
DEFERRED OUTFLOWS OF RESOURCES Deferred outflows - related to pensions - - Total deferred inflows of resources - -
LIABILITIESCurrent liabilities: Accounts payable 869,863 123,259 Estimated claims payable - - Benefits payable - - Due to other funds - - Retainage payable - 5,000 Unearned revenue 118,472 - Bonds payable - - Accrued interest payable - - Deposits payable 9,882 - Total current liabilities 998,217 128,259 Noncurrent liabilities: Benefits payable - - Bonds payable - - Estimated claims payable - - Net pension liability - - Total noncurrent liabilities - - Total liabilities 998,217 128,259
DEFERRED INFLOWS OF RESOURCES Deferred inflows - related to pensions - - Total deferred inflows of resources - -
NET POSITION Net investment in capital assets 46,336,504 29,725,927 Unrestricted 6,286,843 6,991,937 Total net position 52,623,347$ 36,717,864$
See notes to the basic financial statements.
- 56 -

GovernmentalActivities -
Nonmajor InternalRecreational Proprietary Service
Facilities Funds Total Funds
987,005$ 2,346,158$ 10,629,120$ 38,134,950$ 3,042 6,141 31,109 100,006 5,100 38,213 237,365 -
265,522 1,509,992 8,175,987 1,828 - - 30,786 874,057 - - 359,530 - - 127,847 230,379 8,349 - - - 167,932
1,260,669 4,028,351 19,694,276 39,287,122
1,955,757 - 4,714,616 11,432,262 16,933,137 - 36,161,367 40,151,539 1,439,289 24,229 3,104,775 36,418,509 2,665,441 - 6,649,050 1,940,444
- - 137,388,964 - - - 47,655 212,925
(13,696,914) (24,229) (102,707,286) (41,144,876) 9,296,710 - 85,359,141 49,010,803
10,557,379 4,028,351 105,053,417 88,297,925
- - - 57,968,418 - - - 57,968,418
138,505 1,363,102 2,494,729 1,558,013 - - - 897,200 - - - 717,705 - 120,000 120,000 359,530 - - 5,000 -
29,089 4,319 151,880 75,000 - - - 595,000 - - - 28,634 - 5,200 15,082 21,088
167,594 1,492,621 2,786,691 4,252,170
- - - 13,636,385 - - - 2,490,000 - - - 1,085,837 - - - 97,293,548 - - - 114,505,770
167,594 1,492,621 2,786,691 118,757,940
- - - 11,569,900 - - - 11,569,900
9,296,710 - 85,359,141 45,925,803 1,093,075 2,535,730 16,907,585 (29,987,300)
10,389,785$ 2,535,730$ 102,266,726 15,938,503$
Adjustment to reflect the consolidation of internal service fund activities related to enterprise funds. (4,555,449) Net position of business-type activities 97,711,277$
EXHIBIT 7
- 57 -

CITY OF BLOOMINGTON, MINNESOTAStatement of Revenues, Expenses, and Changes in Fund Net Position
Proprietary FundsYear Ended December 31, 2016
Business-type Activities - Enterprise Funds
Water/Wastewater Storm WaterUtility Utility
Operating revenues: Charges for services 23,559,640$ 5,524,196$ Other 2,538 4,748 Total operating revenues 23,562,178 5,528,944
Operating expenses: Salaries and benefits 5,342,572 1,259,770 Materials, supplies and service 6,578,915 954,119 Depreciation 2,143,553 1,381,631 Water purchased 3,418,349 - Wastewater disposal cost 6,862,050 - Total operating expenses 24,345,439 3,595,520
Operating income (loss) (783,261) 1,933,424
Nonoperating revenues (expenses): Taxes 177,399 - Fiscal disparities - - Intergovernmental 47,109 328,044 Interest income 20,061 54,138 Net change in fair value of investments (3,571) (19,922) Gain (loss) on sale of capital assets - - Other - - Interest expense - - Total nonoperating revenues (expenses) 240,998 362,260
Income (loss) before transfers (542,263) 2,295,684
Transfers from other funds - - Transfers to other funds (1,553,000) -
Change in net position (2,095,263) 2,295,684 Total net position - January 1 54,718,610 34,422,180
Total net position - December 31 52,623,347$ 36,717,864$
See notes to the basic financial statements.
- 58 -

GovernmentalActivities -
Nonmajor InternalRecreational Proprietary Service
Facilities Funds Total Funds
3,749,856$ 5,220,211$ 38,053,903$ 43,351,688$ - 22,101 29,387 44,570
3,749,856 5,242,312 38,083,290 43,396,258
2,428,747 2,510,796 11,541,885 33,597,583 2,837,869 3,202,307 13,573,210 14,747,416
455,420 1,211 3,981,815 3,991,079 - - 3,418,349 - - - 6,862,050 -
5,722,036 5,714,314 39,377,309 52,336,078
(1,972,180) (472,002) (1,294,019) (8,939,820)
1,383,387 31,812 1,592,598 - 44,595 - 44,595 - 30,899 286,235 692,287 296,196 6,794 14,382 95,375 331,911
(1,317) (16,823) (41,633) (129,334) 21,000 - 21,000 (73,488) 18,750 - 18,750 -
- - - (69,442) 1,504,108 315,606 2,422,972 355,843
(468,072) (156,396) 1,128,953 (8,583,977)
225,000 1,850,004 2,075,004 257,876 - (389,274) (1,942,274) (528,024)
(243,072) 1,304,334 1,261,683 (8,854,125)
10,632,857 1,231,396 24,792,628
10,389,785$ 2,535,730$ 15,938,503$
Adjustment to reflect the consolidation of internal service fund activities related to enterprise funds. (1,340,973) Change in net position of business-type activities (Exh. 2) (79,290)$
EXHIBIT 8
- 59 -

CITY OF BLOOMINGTON, MINNESOTAStatement of Cash Flows
Proprietary FundsYear Ended December 31, 2016
Business-type Activities - Enterprise Funds
Water/Wastewater StormwaterUtility Utility
CASH FLOWS FROM OPERATING ACTIVITIES Cash from interfund services provided 35,953$ -$ Cash receipts from customers 22,408,671 5,232,560 Cash payments to other funds (3,209,940) (1,078,493) Payments to employees (5,344,451) (1,157,576) Payments to suppliers (13,541,556) - Net cash provided by (used in) operating activities 348,677 2,996,491
CASH FLOWS FROM NONCAPITAL FINANCING ACTIVITIES Grants 8,665 278,044 Transfers from other funds - - Transfers to other funds (1,553,000) - Subsidy from endowment fund - - Taxes 177,399 - Net cash provided by noncapital financing activities (1,366,936) 278,044
CASH FLOWS FROM CAPITAL AND RELATED FINANCING ACTIVITIES Bond payments - - Interest and other payments - - Proceeds from sale of capital assets - - Purchase of capital assets (682,895) (2,885,414) Net cash used in capital and related financing activities (682,895) (2,885,414)
CASH FLOWS FROM INVESTING ACTIVITIES Investment income 16,490 34,213 Net cash provided by investing activities 16,490 34,213
Net increase (decrease) in cash and cash equivalents (1,684,664) 423,334
Cash and cash equivalents - January 1 3,312,508 5,244,779
Cash and cash equivalents - December 31 1,627,844$ 5,668,113$
Reconciliation of operating income (loss) to net cash provided by (used in) operating activities: Operating income (loss) (783,261)$ 1,933,424$
Adjustments to reconcile operating income (loss) to net cash provided by operating activities: Depreciation 2,143,553 1,381,631 Changes in assets and liabilities: Accounts receivable (1,156,160) (297,925) Other operating receivables 2,655 1,541 Interfund receipts 35,953 - Inventory - - Accounts payable 105,937 (22,180) Interfund payables - - Net pension liabilty - - Deferred outflows of resources - - Deferred inflows of resources - - Net cash provided by (used in) operating activities 348,677$ 2,996,491$
Noncash Investing, Capital & Financing Activities- Conversion of Interfund Loan to Operating Transfer -$ -$
See notes to the basic financial statements.- 60 -

GovernmentalActivities -
Nonmajor InternalRecreational Proprietary Service
Facilities Funds Total Funds
-$ -$ 35,953$ 43,189,118$ 3,696,508 4,600,202 35,937,941 -
(1,793,887) (628,604) (6,710,924) (4,835,898) (2,418,256) (2,474,968) (11,395,251) (22,846,036) (1,047,901) (2,033,458) (16,622,915) (9,545,103) (1,563,536) (536,828) 1,244,804 5,962,081
30,899 238,797 556,405 288,397 225,000 1,850,004 2,075,004 257,876
- (389,274) (1,942,274) (528,024) 8,750 - 8,750 -
1,427,982 31,812 1,637,193 - 1,702,631 1,731,339 2,345,078 18,249
- - - (575,000) - - - (69,442) - - - 199,075
(362,750) - (3,931,059) (3,569,401)
(362,750) - (3,931,059) (4,014,768)
5,476 (2,438) 53,741 202,578 5,476 (2,438) 53,741 202,578
(218,179) 1,192,073 (287,436) 2,168,140
1,205,184 1,154,085 10,916,556 35,966,810
987,005$ 2,346,158$ 10,629,120$ 38,134,950$
(1,972,180)$ (472,002)$ (1,294,019)$ (8,939,820)$
455,420 1,211 3,981,815 3,991,079
(54,700) (642,111) (2,150,896) (217,464) 1,353 - 5,549 10,325
- - 35,953 - - - - 10,429
6,571 876,074 966,402 1,041,275 - (300,000) (300,000) (35,953) - - - 56,500,728 - - - (57,968,418) - - - 11,569,900
(1,563,536)$ (536,828)$ 1,244,804$ 5,962,081$
-$ -$ -$ -$
EXHIBIT 9
- 61 -

- 62 -
- 63 -
CITY OF BLOOMINGTON, MINNESOTA FIDUCIARY FUNDS Fiduciary funds are used to account for resources held by the City as trustee or agent for the benefit of parties outside of the government. Private-Purpose Trust Fund – This fund was established with the receipt of a $1,000,000 donation to the City. The interest earnings from this endowment fund are to be used to offset operating costs of the Bloomington Center for the Arts. Agency Funds – These funds account for the collection and disbursement of funds received and disbursed for other parties and governmental units.

City of BloomingtonStatement of Fiduciary Net Position
Fiduciary FundsDecember 31, 2016
Private-Purpose AgencyTrust Funds
ASSETS Cash and cash equivalents 997,689$ 825,520$ Accounts receivable - 344,175 Accrued interest receivable 2,694 - Total assets 1,000,383 1,169,695
LIABILITIESCurrent liabilities - Accounts payable - 1,169,695
NET POSITION Held in trust 1,000,383$ -$
See notes to the basic financial statements.
EXHIBIT 10
- 64 -

City of BloomingtonStatement of Changes in Fiduciary Net Position
Fiduciary FundsYear Ended December 31, 2016
Private-PurposeTrust
ADDITIONS Investment earnings - Interest 9,799$
DEDUCTIONS Current: General services 9,584
Change in net position 215
Net position - January 1 1,000,168
Net position - December 31 1,000,383$
See notes to the basic financial statements.
EXHIBIT 11
- 65 -

- 66 -

- 67 -
NOTES TO THE BASIC
FINANCIAL STATEMENTS

- 68 -
CITY OF BLOOMINGTON, MINNESOTA
NOTES TO THE BASIC FINANCIAL STATEMENTS FOR THE YEAR ENDED DECEMBER 31, 2016
1. SUMMARY OF SIGNIFICANT ACCOUNTING POLICIES
The City of Bloomington, Minnesota (the City) operates pursuant to applicable Minnesota laws and statutes. The governing body (the City Council) consists of six council members and the Mayor. Four of the council members are elected by district and two of the council members and the Mayor are elected at large. All serve four-year staggered terms, subject to redistricting every ten years, which results in two 2-year terms through that transition. The City Manager, the chief administrative officer, is selected by the City Council to serve an indefinite term. The City Manager controls and directs the administration of the City’s affairs and supervises all departments and divisions.
The financial statements of the City have been prepared in conformity with accounting principles generally accepted in the United States of America (generally accepted accounting principles), as applied to governmental units by the Governmental Accounting Standards Board (GASB). The more significant of the City’s accounting policies are described below.
A. REPORTING ENTITY
In accordance with GASB pronouncements and generally accepted accounting principles, the City’s financial statements include all funds, organizations, and departments of the City and the City’s component units. The component units discussed below are included in the City’s reporting entity because of the significance of their operational or financial relationship with the City. The City is considered financially accountable for a component unit if it appoints a voting majority of the organization’s governing body, and it is able to impose its will on the organization by significantly influencing the programs, projects, activities, or level of services performed or provided by the organization, or there is a potential for the organization to provide specific financial benefits to, or impose specific financial burdens on, the City.
As a result of applying the entity definition criteria established by GASB, certain organizations have been included with the City’s financial statements, as follows:
Discretely Presented Component Units - Entails reporting the component unit financial data in columns separate from the financial data of the City:
- 69 -
Port Authority of the City of Bloomington (Port Authority)
The Port Authority was created by the City in 1981 to provide a coordinated, cost-effective approach for private and public development within various development districts that may be established throughout the City. This goal is accomplished in many cases through the use of Tax Increment Financing, to be issued as needed to effect orderly development. The Port Authority is governed by commissioners appointed by the Mayor and confirmed by the City Council, and its boundaries encompass the entire City of Bloomington. The Port Authority has limited taxing powers, but extensive authority to issue bonds or notes for public improvements and land development. These are subject to approval by the City Council prior to issuance. The City Council appoints the Port Authority board, guarantees certain Port Authority debt, and contractually provides staff to manage the Port Authority’s day-to-day operations; it is, therefore, considered a discretely presented component unit of the City.
Housing and Redevelopment Authority in and for the City of Bloomington (HRA)
The HRA is a statutory organization established in 1971 to provide housing and redevelopment assistance to Bloomington citizens. Assistance is provided through the administration of various programs. The HRA’s boundaries encompass the entire City of Bloomington. The City Council appoints the members of the HRA board, and City employees on contract to the HRA manage the HRA’s day-to-day operations; it is, therefore, considered a discretely presented component unit of the City.
Financial information for the Port Authority and HRA is provided in the Other Supplementary section of the City’s comprehensive annual financial report. Separate financial statements are not issued for the component units.
B. GOVERNMENT-WIDE AND FUND ACCOUNTING The basic financial statements include both government-wide (based on the City as a whole) and fund financial statements. Both the government-wide and fund financial statements (within the basic financial statements) categorize primary activities as either governmental or business-type. The government-wide statement of net position is designed to display the financial position of the primary government in the two categories of governmental and business-type activities. In this statement, both the governmental and business-type activities columns are reflected on a full accrual, economic resources measurement focus, which incorporates long-term assets and receivables as well as long-term debt and obligations. Governments report all capital assets, including infrastructure, in the government-wide statement of net position and report depreciation expense - the cost of “using up” capital assets - in the statement of activities. The net position of the government is broken down into three categories: (1) net investment in capital assets, (2) restricted, and (3) unrestricted. The City generally first uses restricted assets for expenses incurred for which both restricted and unrestricted assets are available. The City may defer the use of restricted assets based on a review of the specific transaction. The government-wide statement of activities reports expenses and revenues in a format that focuses on the cost of each of the government’s activities. This statement demonstrates the degree to which the direct expenses of a given function or segment are offset by program revenues. Direct expenses are those that are clearly identifiable with a specific function or segment. Program revenues include (1) charges to customers or applicants who purchase, use or directly benefit from goods, services or privileges provided by a given function or segment, and (2) grants and contributions that are restricted to meeting the operational or capital requirements of a particular function or segment. Taxes and other items not included among program revenues are reported as general revenues.
- 70 -
The operating grants and contributions column includes operating-specific and discretionary (either operating or capital) grants while the capital grants and contributions column includes capital-specific grants. The governmental funds’ major fund statements in the fund financial statements are presented using the current financial resources measurement focus and the modified accrual basis of accounting. This is the manner in which these funds are normally budgeted. Since the governmental fund statements are presented using a different measurement focus and basis of accounting than the government-wide statements’ governmental column, reconciliations are presented which briefly explain the adjustments necessary to reconcile both the ending net position and the change in net position. The focus of the government-wide and fund accounting reporting model is on the City as a whole and the City’s major funds, including both governmental funds and proprietary funds. Each presentation provides valuable information that can be analyzed and compared to enhance the usefulness of the information. In the fund financial statements, financial transactions and accounts of the City are organized on the basis of funds. The operation of each fund is considered to be an independent fiscal and separate accounting entity, with a self-balancing set of accounts recording cash and/or other financial resources together with all related liabilities and residual equities or balances, and changes therein, which are segregated for the purpose of carrying on specific activities or attaining certain objectives in accordance with special regulations, restrictions, or limitations. As a general rule, the effect of interfund activity has been eliminated from the government-wide financial statements. Exceptions to this general rule are charges between the City’s enterprise funds and various other functions of government. Elimination of these charges would distort the direct costs and program revenues reported for the various functions concerned. Major governmental funds - The City reports the following major governmental funds:
General Fund - The General Fund is the general operating fund of the City. It is used to account for
all financial resources except those required to be accounted for in another fund. This fund records revenues such as property tax revenues, licenses and permits, fines and penalties, intergovernmental revenues, and interest earnings. Most of the current day-to-day operations of the governmental units are financed from this fund.
Community Development Block Grant Fund - This fund was established to account for funds received
under Title I of the Housing and Community Development Act of 1974. Revenues of the fund are restricted for housing and development purposes.
Improvement Bonds Fund - This fund is used to account for the accumulation of resources for
payment of principal and interest on general obligation improvement bonds.
Capital Projects Fund - This fund accounts for funds and monies required for financing land acquisitions, construction, park development, and equipment related to public facilities. This fund also accounts for the state allotment of gasoline tax collections for road construction and for transitional costs for capital construction.
Improvement Construction Fund - This fund accounts for the proceeds of bonds sold for the purpose
of street, sewer, water, and state aid construction.

- 71 -
Major proprietary funds - The City reports the following major proprietary funds: Water/Wastewater Utility Fund - This fund accounts for the operations of the City-owned water and
sewer systems. Storm Water Utility Fund - This fund accounts for the operations and improvements of the storm
water drainage system. Recreational Facilities Fund - This fund accounts for the operations of the City’s ice garden, golf
courses, aquatic recreation facilities, and art center operations. Other funds - The City reports the following other funds: Internal Service Funds - The Internal Service Funds are used to account for support services, information systems, equipment, public safety radios, self-insurance, insured benefits, benefit accruals, facilities and parks maintenance, and PERA pension, all provided by one department to other departments of the City on a cost-reimbursement basis. The City has allocated the statement of fund net position and the statement of revenues, expenses, and changes in fund balances between various governmental and business-type activities in the government-wide statements. Private-Purpose Trust and Agency Funds - The Private-Purpose Trust Fund is used to report the trust activity with the Bloomington Arts Center which benefits from the income earned on the principal of the endowment. The Agency Funds are custodial in nature (assets equal liabilities) and do not involve measurement of results of operations. They account for collection and disbursement of lodging taxes for the Bloomington Visitors and Convention Bureau, State pass-through loans, and funds received for other parties and governments. These fiduciary funds are not reflected in the government-wide financial statements because the resources of those funds are not available to support the City’s programs.
C. BASIS OF ACCOUNTING
The accounting and reporting treatment applied to a fund is determined by its measurement focus. Governmental Funds: Measurement Focus - Governmental funds are accounted for using a current financial resources measurement focus. With this measurement focus, only current assets and current liabilities are generally included on the balance sheet. Reported fund balance is considered a measure of “available spendable resources.” Governmental fund operating statements represent increases (i.e., revenues and other financing sources) and decreases (i.e., expenditures and other financing uses) in fund balance.
Basis of Accounting - Governmental funds are accounted for using the modified accrual basis of accounting. Their revenues are recognized when susceptible to accrual (i.e., when they become measurable and available). “Measurable” means the amount of the transaction can be determined and “available” means collectible within the current period or soon enough thereafter to be used to pay liabilities of the current period. For this purpose, the government considers all revenues, except reimbursement grants, to be available if they are collected within 60 days of the end of the current fiscal period. Reimbursement grants are considered available if they are collected within one year of the end of the current fiscal period. Expenditures are generally recorded when a liability is incurred, as under accrual accounting.

- 72 -
Revenues - Major revenues that are susceptible to accrual include property taxes (excluding delinquent taxes received over 60 days after year-end), special assessments, intergovernmental revenues, charges for services, and interest on investments. Major revenues that are not susceptible to accrual include fees and miscellaneous revenues; such revenues are recorded only as received because they are not measurable until collected. Unavailable Revenues – Unavailable revenues arise when potential revenue does not meet both the “measurable” and “available” criteria for recognition in the current period. Such amounts are classified as deferred inflows of resources within governmental funds.
Unearned Revenues – Unearned revenues arise when resources are received by the City before it has a legal claim to them, as when grant monies are received prior to the incurrence of qualifying expenditures. In subsequent periods, when all revenue recognition criteria are met, the liability for unearned revenue is removed and revenue is recognized. Expenditures - Expenditures are generally recognized under the modified accrual basis of accounting when the related fund liability is incurred, except for principal and interest on general long-term debt which is recognized when due. Proprietary and Fiduciary Funds: Measurement Focus - Proprietary funds and fiduciary funds are accounted for on a flow of economic resources measurement focus. This means that all assets, including capital assets, and all liabilities, including long-term liabilities, associated with fund activity are included on the statement of net position. The net position of the fund is broken down into three categories: (1) net investment in capital assets, (2) restricted, and (3) unrestricted. Proprietary fund type operating statements present increases (i.e., revenues) and decreases (i.e., expenses) in total net position. Basis of Accounting - All proprietary funds and fiduciary funds are accounted for using the accrual basis of accounting. Revenues are recognized when earned, and expenses are recorded at the time liabilities are incurred. Unbilled utility service receivables are recorded at year-end. All applicable GASB pronouncements have been applied to the proprietary funds. Operating versus Non-operating Items - Proprietary funds distinguish operating revenues and expenses from non-operating items. Operating revenues and expenses generally result from providing services and producing and delivering goods in connection with a proprietary fund’s principal ongoing operations. The principal operating revenue of the City’s enterprise funds and internal service funds are charges to customers for sales and services. Operating expenses for enterprise funds and internal service funds include the cost of sales and services, administrative expenses, and depreciation on capital assets. All revenues and expenses not meeting this definition are reported as non-operating revenues and expenses.
D. BUDGETS
Budgets are adopted on a basis consistent with generally accepted accounting principles. Annual appropriated budgets are legally adopted for the General and the following special revenue funds: Community Development Block Grant, Public Health, Public Safety, Communications, Park Grants, South Loop Revolving Development Services, Creative Placemaking, and Cemetery Trust. Budgeted amounts are reported as originally adopted and as amended by the City Council, if such action was taken. Budgeted expenditure appropriations lapse at year-end. During the year, several supplementary appropriations are approved by the City Council.

- 73 -
Encumbrances represent purchase commitments. Encumbrances outstanding at year-end are reported as committed fund balances. Carryovers of prior-year budget appropriations are allowed when projects have been approved, but not completed, and funding has not been provided in the following year’s budget. Budget carryovers at year-end are reported as committed fund balances. Legal Compliance - Budgets
The City follows the procedures below in establishing the budget reflected in the accompanying financial statements:
1. The City Manager submits to the City Council a proposed operating budget for the fiscal year
commencing the following January 1. The operating budget includes proposed expenditures and the means of financing them. The General and special revenue funds are legally adopted through the budgetary process as documented herein.
2. Public hearings are conducted to obtain taxpayer comments. 3. Both the General Fund and special revenue fund budgets are legally enacted through passage of
resolutions. 4. Monitoring of budgets is maintained at the expenditure category level within each activity.
Budgetary monitoring, by department, division, and by category is required by the City Charter. Management may alter the budget within a department but cannot exceed the total budgeted expenditures for that department unless approved by the City Council. The City Council may authorize transfer of budgeted amounts between departments or funds. These budget amendments must be approved by the City Council.
5. Formal budgetary integration is employed as a management control device during the year for the
general and special revenue funds. Formal budgetary integration is not employed for debt service funds because effective budgetary control is alternatively achieved through general obligation bond indenture provisions. Budgetary control for capital projects funds is accomplished through the use of project controls.
6. General Fund expenditures may not legally exceed budgeted appropriations at the departmental level.
Special revenue fund expenditures may not legally exceed budgeted appropriations at the fund level. For year ended 2016 the South Loop Revolving Development Services Fund had expenditures exceeding budgeted appropriations in the amount of $80,703. The expenditures exceeding budget were funded by available fund balance.
E. CASH, CASH EQUIVALENTS, AND INVESTMENTS
Cash balances from all funds are combined and invested to the extent available in authorized investments (see Note 2). Earnings from such investments are allocated to the respective funds on the basis of applicable cash balance participation by each fund. Investments are stated at fair value, based upon quoted market prices at the reporting date, except for investments in external investment pools that meet GASB 79 requirements, which are stated at amortized cost. Cash and cash equivalents consist of available cash, cash deposits, and highly liquid investments with an original maturity date at the time of purchase of three months or less. The City accounts for its investments in an entity-wide cash management pool, which is used essentially as a demand deposit account. Restricted cash and investments are included with cash equivalents for purposes of the statement of cash flows.

- 74 -
F. SHORT-TERM INTERFUND RECEIVABLES/PAYABLES
During the course of operations, numerous transactions occur between individual funds and between the primary government and component units for goods provided or services rendered. These receivables and payables are classified as “due from other funds” or “due from primary government/component unit” and “due to other funds” or “due to primary government/component unit,” respectively, on the balance sheet (see Note 8).
G. INVENTORIES AND PREPAID ITEMS
Inventory is valued at average cost based on physical counts for all fund types. In the General Fund, inventory is not significant and is recorded as an expenditure at the time of purchase. In the proprietary funds, inventory is recorded as an expense when consumed. Certain payments to vendors reflect costs applicable to future accounting periods and are recorded as prepaid items in both government-wide and fund financial statements. Prepaid items are reported using the consumption method and recorded as expenditures/expenses at the time of consumption.
H. CAPITAL ASSETS
Capital outlays are recorded as expenditures in the City’s fund financial statements, which use the modified accrual basis of accounting. Capital outlays are capitalized in the City’s government-wide statement of net position, which uses the full accrual basis of accounting. Infrastructure has been capitalized retroactively to 1980. Carrying value of prior infrastructure assets is considered to be insignificant to the overall value of capital assets of the City. Depreciation on the City’s capital assets (including infrastructure) is recorded on a government-wide basis. All capital assets are recorded at historical cost or estimated historical cost if actual cost was not available. Donated capital assets are valued at the fair market value as of the date received. The City’s policy is to only capitalize capital assets exceeding $10,000. Depreciation has been provided over the estimated useful lives using the straight-line method. The estimated useful lives are as follows: Years Land improvements 20-50 Buildings and structures 15-95 Distribution system 36 Equipment 3-15 Infrastructure 5-48
I. COMPENSATED ABSENCES
The City compensates all employees upon termination for unused vacation up to a maximum of 480 hours based upon length of service. The City also compensates employees for unused personal time up to a maximum of 1,000 hours. Personal leave balances in excess of 600 hours upon termination are converted to a health care retirement account with the State Board of Investments. Such pay is accrued as an expenditure/expense as it is earned in all funds. The liability for all compensated absences is recorded in the Benefit Accrual Fund within the internal service funds.

- 75 -
J. LONG-TERM OBLIGATIONS
Long-term obligations are recorded in the City’s government-wide statement of net position when they become a liability of the City. Long-term obligations are recognized as a liability of a governmental fund only when due, or when resources have been accumulated in a debt service fund for payment early in the following year. Long-term obligations expected to be financed from proprietary funds are accounted for in those funds. In the fund financial statements, governmental fund types recognize bond premiums and discounts, as well as bond issuance costs, during the current period. The face amount of debt issued is reported as other financing sources. Premiums received on debt issuances are reported as other financing sources while discounts on debt issuances are reported as other financing uses. Issuance costs, whether or not withheld from the actual debt proceeds received, are reported as debt service expenditures.
K. CONDUIT DEBT OBLIGATIONS
From time to time, the City has issued Industrial and Housing Revenue Bonds to provide financial assistance to private-sector entities for the acquisition and construction of industrial, housing, and commercial facilities deemed to be in the public interest. The bonds are secured by the property financed and are payable solely from payments received on the underlying mortgage loans. A bank or financing institution finances this transaction, and the terms and conditions are contracted between the lender and the borrower. Neither the City, nor the State, nor any political subdivision thereof is obligated in any manner for repayment of the bonds. Accordingly, the bonds are not reported as liabilities in the accompanying financial statements. As of December 31, 2016, there were seven series of Industrial and Housing Revenue Bonds outstanding, with an aggregate principal amount payable of approximately $96 million.
L. FUND BALANCE CLASSIFICATIONS
In the fund financial statements, governmental funds report fund balance in classifications that disclose constraints for which amounts in those funds can be spent. These classifications are as follows:
Nonspendable - consists of amounts that are not in spendable form, such as prepaid items. Restricted - consists of amounts related to externally imposed constraints established by creditors, grantors or contributors; or constraints imposed by state statutory provisions. Committed - consists of internally imposed constraints. These constraints are established by Resolution of City Council.
Assigned – consists of internally imposed constraints for the specific purpose of the City’s intended use. Pursuant to the City’s Fund Balance Classification Policy, intent can be expressed by the government body or by an official or body to which the governing body delegates the authority. At this time the City Council has not delegated the authority to assign fund balance. Unassigned – is the residual classification for the general fund and also reflects negative residual amounts in other funds.
When both restricted and unrestricted resources are available for use, it is the City’s policy to first use restricted resources, and then use unrestricted resources as they are needed. When committed, assigned or unassigned resources are available for use, it is the City’s policy to use resources in the following order: 1) committed, 2) assigned and 3) unassigned.

- 76 -
M. INTERFUND TRANSACTIONS
Transactions that constitute reimbursements to a fund for expenditures initially made from it that are properly applicable to another fund are recorded as expenditures in the reimbursing fund and as reductions of expenditures in the fund that is reimbursed. All other interfund transactions are reported as transfers. Interfund transactions within the respective categories of governmental activities and business-type activities in the government-wide statement of activities are eliminated. The internal balances caption on the government-wide statement of net position represents interfund receivables or payables between the two types of activities: governmental and business-type.
N. PROPERTY TAXES
Property tax levies are set by the City Council in December of each year and are certified to Hennepin County (the County) for collection in the following year. In the state of Minnesota, counties act as collection agents for all property taxes.
The County spreads all levies over taxable property. Such taxes become a lien on January 1 and are recorded as receivables by the City at that date. Property taxes are accrued and recognized as revenue in the fund financial statements for collections within 60 days after year-end, net of delinquencies.
Real property taxes are required by state statute to be paid by taxpayers in two equal installments on May 15 and October 15. Personal property taxes are required to be paid on February 28 and June 30. The County provides tax settlements to cities and other taxing districts in July, December, and January. Taxes levied which remain unpaid at December 31 are classified as taxes receivable and are fully offset by deferred inflows in the fund financial statements because they are not known to be available to finance current expenditures. Delinquent property taxes are recorded as earned in the government-wide statements, less a $200,000 allowance for uncollectible accounts.
O. RECLASSIFICATIONS
Certain amounts presented in the prior year data have been reclassified in order to be consistent with the current year’s presentation. Such reclassifications did not have an effect on fund net position or change in net position, as previously reported.
P. DEFICIT NET POSITION AND FUND BALANCE
The PERA Pension internal service fund had a negative net position balance of $50,895,030 on December 31, 2016 as a result of the implementation of GASB 68. Future pension contributions and investment earnings will reduce the negative net position in the PERA Pension internal service fund. The Benefit Accrual internal service fund had a negative net position balance of $2,002,906 on December 31, 2016. This fund accounts for the compensated personal and vacation leave balances. Over the next few years, the City will increase internal charges and transfer funds to eliminate the deficit in this fund. The HRA TIF Special Revenue fund had a negative balance of $2,365,827 as of December 31, 2016. This fund accounts for Tax Increment Financing (TIF) districts’ activity. The negative balance will be covered in the future, primarily by TIF funding.

- 77 -
Q. USE OF ESTIMATES
The preparation of financial statements in accordance with generally accepted accounting principles (GAAP) requires management to make estimates that affect amounts reported on the financial statements during the reporting period. Actual results could differ from such estimates.
R. PUBLIC EMPLOYEES RETIREMENT ASSOCIATION (PERA)
Pensions. For purposes of measuring the net pension liability, deferred outflows/inflows of resources, and pension expense, information about the fiduciary net position of the Public Employees Retirement Association (PERA) and additions to/deductions from PERA’s fiduciary net position have been determined on the same basis as they are reported by PERA except that PERA’s fiscal year end is June 30. For this purpose, plan contributions are recognized as of employer payroll paid dates and benefit payments and refunds are recognized when due and payable in accordance with the benefit terms. Investments are reported at fair value.
2. CASH, CASH EQUIVALENTS, AND INVESTMENTS
A. DEPOSITS
In accordance with Minnesota Statutes, the City maintains deposits at national or state banks within the state, as authorized by the City Council. At December 31, 2016, the carrying amount of the City’s deposits with financial institutions was $84,761 and the bank balances totaled $603,050. Custodial Credit Risk-Deposits – Custodial credit risk is the risk that in event of a bank failure, the City’s deposits may not be returned to it. Minnesota Statutes require that all City deposits be protected by insurance, surety bond, or collateral. The fair value of collateral pledged must equal 110% of the deposits not covered by insurance or bonds. Minnesota Statutes require that securities pledged as collateral be held in safekeeping by the City treasury or in a financial institution other than that furnishing the collateral. City policy does not further add any restrictions to address custodial credit risk. As of December 31, 2016, the bank balance of the City’s deposits was covered by federal depository insurance or covered by collateral pledged and held in the City’s name.
B. INVESTMENTS
The City may also invest funds as authorized by Minnesota Statutes and its investment policy as follows:
U.S. Treasury obligations including bonds, notes, Treasury bills, or other securities which are direct obligations of the United States. Instruments sold and issued by the U.S. Government carry the full faith guarantee of the U.S. Government. These instruments provide the highest quality available to purchase and are highly liquid.
U.S. Agency securities Government Sponsored Enterprises (GSE’s) are instrumentalities, or organizations created by an act of Congress. GSE securities have the implied guarantee of the United States Government and are privileged to certain access to capital and support of government programs. The most common GSE issuers are Federal Home Loan Bank (FHLB), Federal Home Loan Mortgage Corporation (FHLMC), Federal Farm Credit Bureau (FFCB), and Federal National Mortgage Association (FNMA).
General obligation bonds of state or local governments must have a taxing power rating of A, AA, or AAA. Tax exempt or taxable bonds qualify as long as they meet the rating standards.

- 78 -
Banker’s acceptances of United States banks, eligible for purchase by the Federal Reserve System, that mature in 270 days or less. Evaluation of the financial strength of the accepting bank is necessary through purchasing acceptances only from banks with a minimum A (very strong bank) rating by a nationally recognized rating agency.
Money market mutual funds which are rated Aa or higher by at least one nationally recognized statistical rating organization, invests in securities with a final maturity no longer than 13 months and for which the Investment Committee has obtained and reviewed the fund prospectus.
Savings/demand deposits. A financial institution that is qualified as a “depository” of public funds of government entities. The City may hold balances in qualified bank deposits. Funds may be held in savings accounts at approved depository banks. If balances are greater than the FDIC limit, collateral of 110 percent will be held for the excess balances.
Commercial paper is short term unsecured debt which has been issued by a United States corporation or their Canadian subsidiaries and is not a limited liability corporation (LLC) to fund their day-to-day operational needs. Maturities typically range from one day to 270 days. The City may only buy paper that meets the Minnesota Statute 118A with the exception that no Asset Backed or Structured Investment Vehicle (SIV) Commercial Paper are allowed. Only commercial paper with the highest quality rating of A1, P1, F1 and the underlying issuer of the commercial paper must have a long-term debt rating of AAA to be utilized.
The City may enter into repurchase agreements and reverse repurchase agreements consisting of collateral allowable in Minnesota Statute, Chapter 118A.
Investment products that are considered as derivatives are specifically excluded from approved direct investment purchases at this time.
As of December 31, 2016, the City had the following investments and maturities:
Investment Type
Fair Value
Less than One Year
One Year to Five Years
Five Years to Ten Years
Money Market $ 19,674,953 $ 19,674,953 $ - $ - Commercial Paper 24,934,710 24,934,710 Commercial Paper Sweep 465,666 465,666 - - Treasury Notes 13,743,711 5,053,762 8,689,949 - Federal Agriculture Mortgage Corporation
13,152,370
10,077,550
3,074,820
-
Federal Farm Credit Bank 11,886,199 - 11,886,199 - Federal Home Loan Bank 14,703,399 1,000,390 13,703,009 - Federal Home Loan Mortgage Corporation
14,826,800
-
14,826,800
-
Federal National Mortgage Association
21,478,967
4,991,400
16,487,567
-
Municipal Bonds 29,514,766 8,812,697 14,727,081 5,974,988 Total investments 164,381,541 $ 75,011,128 $ 83,395,425 $ 5,974,988 Total deposits 84,761 Total investments and deposits $ 164,466,302 The City categorizes its fair value measurements within the fair value hierarchy established by generally accepted accounting principles. The hierarchy is based on the valuation inputs used to measure the fair value of the asset. The hierarchy has three levels. Level 1 investments are valued using inputs that are based on quoted prices in active markets for identical assets. Level 2 investments are valued using inputs that are based on quoted prices for similar assets or inputs that are observable, either directly or indirectly. Level 3 investments are valued using inputs that are unobservable.

- 79 -
The City has the following recurring fair value measurements as of December 31, 2016: Fair Value Measurements Using Investments by fair value level 12/31/16 Level 1 Level 2 Level 3 Commercial Paper $ 24,934,710 $ - $ 24,934,710 $ - Commercial Paper Sweep 465,666 465,666 Treasury Notes 13,743,711 - 13,743,711 - Federal Agriculture Mortgage Corporation
13,152,370
-
13,152,370
-
Federal Farm Credit Bank 11,886,199 - 11,886,199 - Federal Home Loan Bank 14,703,399 - 14,703,399 - Federal Home Loan Mortgage Corporation
14,826,800
-
14,826,800
-
Federal National Mortgage Association
21,478,967
-
21,478,967
-
Municipal Bonds 29,514,766 - 29,514,766 - Subtotal 144,706,588 $ - $ 144,706,588 $ - Investments not categorized External investment pools: US Bank Money Market 2,175,277 4M Fund Money Market 17,499,676 Bank Deposits 84,761 Total $ 164,466,302 Custodial Credit Risk-Investments – For investments in securities, custodial credit risk is the risk that in the event of a failure of the counterparty, the City will not be able to recover the value of its investments that are in possession of an outside party. As of December 31, 2016, all investments of the City were insured, registered, and held by the City or its agent in the City’s name. Investments in money market accounts are not evidenced by securities that exist in physical or book entry form, and therefore are not subject to custodial credit risk. The City has no policy for credit risk beyond what is provided by Minnesota state law. Interest Rate Risk – The City’s investment policy requires the City to diversify its investment portfolio to eliminate the risk of loss resulting from over concentration of assets in a specific maturity. The policy also states the City’s investment portfolio will remain sufficiently liquid to enable the City to meet all operating requirements which might be reasonably anticipated. As a means of limiting its exposure to fair value losses arising from rising interest rates, the City will attempt to match its investment maturities with anticipated cash flow liquidity demands (static liquidity). Reserve funds may be invested in securities exceeding 5 years if the maturities of such investments are made to coincide as nearly as practicable with the expected use of the funds. In no event does the City invest in securities with maturities exceeding 10 years. Credit Risk – State law limits investments in commercial paper to the top rating issued by at least two of the nationally recognized statistical rating organizations. At December 31, 2016, the City held $24,934,710 of investments in commercial paper rated in the top ratings as required under state law. Also, the City’s investments in money market funds, Federal Farm Credit, Federal Home Loan Banks, Federal Home Loan Mortgage Corporation, Federal Agricultural Mortgage Corporation, and Federal National Mortgage Association Notes were all rated AA+ by Standard & Poor’s and Aaa by Moody’s Investors Service and the municipal investments are all rated A+ or better by Standard & Poor’s and Moody’s Investors Service. The City does not have a policy on credit risk beyond State law.

- 80 -
The City’s external investment pool investment is with the 4M fund which is regulated by Minnesota Statutes and the Board of Directors of the League of Minnesota Cities. The 4M fund is an unrated pool and the fair value of the position in the pool is the same as the value of pool shares. The pool is managed to maintain a portfolio weighted average maturity of no greater than 60 days and seeks to maintain a constant net asset value (NAV) per share of $1. The pool measures their investments in accordance with Government Accounting Standards Board Statement No. 79, at amortized cost. The 4M Liquid Asset Fund has no redemption requirements. The 4M Plus Fund requires funds to be deposited for a minimum of 14 calendar days. Withdrawals prior to the 14-day restriction period are subject to a penalty equal to 7 days interest on the amount withdrawn. Concentration of Credit Risk - The City diversifies its investments to substantially reduce the risk of loss resulting from the over-concentration of assets in a specific maturity, issuer, institution, or class of securities, with the exception of U.S. Treasury securities and authorized pools. No more than 50% of the entity’s total investment portfolio is invested in a single security type or with a single financial institution. More than 5% of the City’s investments are in the following governmental agencies: Federal Agricultural Mortgage Corporation (8%), Federal Farm Credit (7%), Federal Home Loan Bank (9%), Federal Home Loan Mortgage Corporation (9%), Federal National Mortgage Association (13%), United States Treasuries (8%), and municipals (23%). Securities Lending Transactions - Minnesota State Statutes authorize governmental entities to enter into securities lending agreements with specified institutions. At no time during 2016 did the City have any activity or balance in this type of an investment. The following table reconciles cash, cash equivalents, and investments to the basic financial statements at December 31, 2016: Governmental funds $ 109,187,262Proprietary funds: Enterprise 10,629,120 Internal service 38,134,950Government-wide 157,951,332Fiduciary funds 1,823,209Total cash, cash equivalents, and investment 159,774,541Add: restricted cash and investments 4,691,761Net cash, cash equivalents, and investments $ 164,466,302

- 81 -
3. CAPITAL ASSETS
During 2016 the City’s capitalization threshold was $10,000. Capital asset activity for the year ended December 31, 2016 was as follows:
Primary GovernmentBalance at Balance at
1/1/16 Additions Retirements 12/31/16
Governmental activities:Capital assets not being depreciated -
Land 95,463,055 3,112,350 - 98,575,405 Construction in progress 7,740,775 596,943 (7,636,261) 701,457
Total capital assets not being depreciated 103,203,830 3,709,293 (7,636,261) 99,276,862 Capital assets being depreciated:
Buildings and structures 69,031,635 136,090 (291,648) 68,876,077 Machinery and equipment 42,213,713 3,482,089 (2,434,637) 43,261,165 Improvements 13,275,062 978,316 - 14,253,378 Infrastructure 307,983,045 29,538,703 - 337,521,748
Total capital assets being depreciated 432,503,455 34,135,198 (2,726,285) 463,912,368 Less accumulated depreciation for:
Buildings and structures (37,057,562) (1,450,993) 55,880 (38,452,675) Machinery and equipment (29,665,036) (3,039,808) 2,002,043 (30,702,801) Improvements (5,438,357) (611,682) 4,700 (6,045,339) Infrastructure (105,693,574) (8,874,755) - (114,568,329)
Total accumulated depreciation (177,854,529) (13,977,238) 2,062,623 (189,769,144) Total capital assets being depreciated, net 254,648,926 20,157,960 (663,662) 274,143,224
Governmental capital assets, net 357,852,756 23,867,253 (8,299,923) 373,420,086
Business-type activities:Capital assets not being depreciated -
Land 4,714,616 - - 4,714,616 Construction in progress 187,665 47,655 (187,665) 47,655
Total capital assets not being depreciated 4,902,281 47,655 (187,665) 4,762,271 Capital assets being depreciated:
Buildings and structures 36,131,837 29,530 - 36,161,367 Machinery and equipment 2,778,871 427,577 (101,673) 3,104,775 Distribution system 134,118,454 3,270,510 - 137,388,964 Improvements 6,342,692 364,458 (58,100) 6,649,050
Total capital assets being depreciated 179,371,854 4,092,075 (159,773) 183,304,156 Less accumulated depreciation for:
Buildings and structures (15,899,122) (612,507) - (16,511,629) Machinery and equipment (2,033,071) (103,685) 101,672 (2,035,084) Distribution system (76,931,106) (3,172,133) - (80,103,239) Improvements (4,021,943) (93,490) 58,099 (4,057,334)
Total accumulated depreciation (98,885,242) (3,981,815) 159,771 (102,707,286) Total capital assets being depreciated, net 80,486,612 110,260 (2) 80,596,870
Business-type activities capital assets, net 85,388,893 157,915 (187,667) 85,359,141
Depreciation expense was charged to governmental functions at December 31, 2016 as follows: General services $ 1,579,995Development services 2,845,700Public works 8,134,922Public safety 791,112Community services 625,509 Total depreciation expense $ 13,977,238

- 82 -
4. COMMITMENTS
At December 31, 2016 encumbrances totaled $824,119 and are reported within the General Fund. At December 31, 2016, the City had commitments for eleven uncompleted construction contracts with a remaining balance of $13,113,906.
5. RISK MANAGEMENT
The City acts as a self-insurer for workers’ compensation claims. Property, casualty, and automobile insurance coverage are provided through a pooled insurance program through the League of Minnesota Cities Insurance Trust (LMCIT). The City pays an annual premium to the LMCIT. The City is subject to supplemental assessments if deemed necessary by the LMCIT. The LMCIT reinsures through commercial companies for claims in excess of various amounts. The City retains risk for the deductible portions. These deductibles are considered immaterial to the financial statements. The risk management activities of the City are accounted for by the Self-Insurance Fund, an internal service fund that charges its costs to user departments. There were no significant reductions in insurance coverages from coverage in the prior year. No settlement amounts exceeded insurance coverage for the past three fiscal years.
The liability recorded in the Self-Insurance Fund includes estimated settlements for claims reported but not settled as of year-end, as well as an estimate of claims incurred but not reported. When a new claim is filed with the City, the League of Minnesota Cities Insurance Trust establishes an estimated loss reserve. This reserve is expensed at year end and then increased or decreased annually.
2015 2016 Unpaid claims at beginning of year $2,432,551 $1,888,849 Claims paid (515,374) (1,279,025) New claims (28,328) 1,373,213 Unpaid claims at end of year $1,888,849 $1,983,037
6. LONG-TERM LIABILITIES
The long-term debt obligations outstanding at year-end are summarized as follows: Type of Bonds
Maturities
Rates
Balance at 12/31/16
Governmental activities: Governmental funds: General obligation (G.O.) bonds 2017-2021 1.00 - 4.00% $ 4,095,000 G.O. improvement bonds 2017-2031 .80 - 5.70 53,300,000 G.O. tax increment bonds 2017-2032 3.00 - 4.30 4,770,000 Total governmental funds 62,165,000 Internal service funds: G.O. capital improvement bonds 2017-2021 .60 - 2.60 3,085,000 Total bonds $ 65,250,000

- 83 -
Changes in long-term liabilities during 2016 are summarized as follows:
Balance at 01/01/16
Additions
Retirements
Balance at 12/31/16
Due Within One Year
Governmental activities: G.O. bonds $ 7,055,000 $ 1,610,000 $ 1,485,000 $ 7,180,000 $ 3,080,000 G.O. improvement bonds 49,395,000 9,845,000 5,940,000 53,300,000 6,330,000 G.O. tax increment bonds 2,850,000 2,045,000 125,000 4,770,000 135,000 Unamortized bond prems 1,744,974 637,348 193,163 2,189,159 249,575 Benefits payable 13,900,349 1,878,366 1,424,625 14,354,090 717,705 Estimated claims payable 1,888,849 1,373,213 1,279,025 1,983,037 897,200 OPEB liability 6,127,767 1,186,529 353,471 6,960,825 - Net pension liability 42,574,651 59,408,409 4,689,512 97,293,548 - Total governmental 125,536,590 77,983,865 15,489,796 188,030,659 11,409,480Business-type activities - Total business-type - - - - - Total $ 125,536,590 $ 77,983,865 $ 15,489,796 $ 188,030,659 $ 11,409,480
The benefits payable are generally liquidated by the Benefit Accrual Internal Service Fund. It is not practicable to determine the specific year for payment of benefits payable. The OPEB liability is generally liquidated by the Insured Benefits Internal Service Fund.
Long-term debt maturities (including interest of $7,794,336) are as follows:
Governmental Activities Business-type Activities Year Ending December 31
Principal
Interest
Principal
Interest
Total
2017 $ 9,545,000 $ 1,626,180 $ - $ - $ 11,171,1802018 12,760,000 1,385,480 - - 14,145,4802019 7,395,000 1,071,841 - - 8,466,8412020 7,005,000 883,972 - - 7,888,9722021 6,695,000 697,846 - - 7,392,8462022-2026 17,295,000 1,702,521 - - 18,997,5212027-2031 3,820,000 375,923 - - 4,195,9232032-2036 675,000 49,673 - - 724,6732037 60,000 900 - - 60,900 Total $ 65,250,000 $ 7,794,336 $ - $ - $ 73,044,336 On December 8 2016, the City issued $6,115,000 of General Obligation Permanent Improvement Revolving Fund Bonds, Series 49 with an effective rate of 2.0%, the proceeds of which were used to provide funding for public improvements. On behalf of the Housing and Redevelopment Authority the City issued $2,045,000 of Taxable General Obligation Tax Increment Bonds, Series 2016A with an effective rate of 1.46%, the proceeds of which were used to provide funding for a housing development. In addition the City issued two refunding bonds; $1,610,000 of General Obligation Arts Center Refunding Bonds with an effective rate of 1.24%, the proceeds and cash on hand will refund the 2007 Art Center Bonds in February 1, 2017. $3,730,000 of General Obligation Permanent Improvement Fund Refunding Bonds with an effective rate of 1.92%, the proceeds and cash on hand will refund the 2007 PIR, Forty-One Series and the 2008 PIR, Forty-Two Series bonds on February 1, 2018.

- 84 -
The following is a schedule of bonds payable at December 31, 2016:
Original Balance atType of Bonds Amount Maturities Rates 12/31/16
Governmental Activities:General Obligation (G.O.) Bonds:
2007 Art Center Refunding 5,590,000$ 2017-2021 4.00% 2,485,000$ 2010 Capital Improvement 5,900,000 2017-2021 .60 - 2.60% 3,085,000 2016 Art Center Refunding 1,610,000 2018-2021 4.00% 1,610,000
Total G.O. Bonds 13,100,000 7,180,000
General Obligation (G.O.) Improvement Bonds:2007 PIR, Forty-One Series 5,915,000 2017-2028 4.00 - 4.50% 1,910,000 2008 PIR, Forty-Two Series 9,570,000 2017-2029 3.25 - 5.00% 5,170,000 2010 PIR, Forty-Four Series 6,235,000 2017-2021 .80 - 3.50% 3,245,000 2011 PIR Refunding, Thirty-Eight Series 2,080,000 2017-2018 2.00 - 2.50% 675,000 2011 PIR, Forty-Five Series 7,545,000 2017-2031 2.00 - 3.375% 4,695,000 2012 PIR Refunding, Thirty-Nine Series 5,900,000 2017-2025 3.00% 4,655,000 2012 PIR, Forty-Six Series 5,615,000 2017-2023 2.00 - 3.00% 3,900,000 2013 PIR Refunding, Forty-Three Series 5,135,000 2017-2030 2.40 - 3.25% 3,995,000 2013 PIR, Forty-Seven Series 4,180,000 2017-2024 2.10 - 3.00% 3,440,000 2014 PIR, Forty-Eight Series 7,465,000 2017-2025 2.00 - 2.50% 6,415,000 2015 PIR, Forty-Nine Series 5,355,000 2017-2036 2.00 - 3.00% 5,355,000 2016 PIR, Fifty Series 6,115,000 2018-2037 2.00 - 3.00% 6,115,000 2016 PIR, Refunding, Forty-One and
Forty-Two Series 3,730,000 2019-2029 2.00 - 3.00% 3,730,000 Total G.O. Improvement Bonds 74,840,000 53,300,000
General Obligation (G.O.) Tax Increment Bonds:2011 Serial Refunding Bonds 3,095,000 2017-2032 3.00 - 4.30% 2,725,000 2016 Serial Bonds 2,045,000 2018-2022 .80 - 1.60% 2,045,000
Total G.O. Tax Increment Bonds 5,140,000 4,770,000
Total governmental activities 93,080,000 65,250,000
Total bonds payable 93,080,000$ 65,250,000$
PIR = Permanent Improvement Revolving The City issues general obligation bonds to provide funds for the acquisition and construction of major capital projects and facilities. General obligation bonds have been issued for both general government and business-type activities. Bonds issued for business-type activities are reported in the proprietary funds if they are expected to be repaid from proprietary fund revenues. General obligation bonds are direct obligations and pledge the full faith and credit of the City.

- 85 -
Revenues pledged are as follows:
Percent of Debt service Remaining Principal PledgedUse of total as a % of Term of Principal and Interest Revenue
Bond Issue Proceeds Type debt service net revenues Pledge and Interest paid received
Governmental Activities:General Obligation (G.O.) Bonds:
2007 G.O. Arts Center Refunding Bds Refund 2000 Arts Center Debt Service Tax Levy 100% n/a 2007 - 2021 2,534,700$ 558,400$ 558,400$ Feb-07 Bonds - Crossover
2010 Capital Improvement Bonds Paid Port Authority Debt Service Tax Levy 100% n/a 2012 - 2021 3,272,001 648,035 648,035 Nov-10 Lease Revenue Bonds
2016 G.O. Arts Center Refunding Refund 2007 Arts Center Debt Service Tax Levy 100% n/a 2018 - 2021 1,784,081 - - Nov-10 Bonds - Crossover
General Obligation (G.O.) Improvement Bonds:
2007 PIR Bonds, Forty-One Series Infrastructure Improvements Special Assessments 55% n/a 2007 - 2018 2,006,353 613,869 613,869 Dec-07 Debt Service Tax Levy 45% n/a
2008 PIR Bonds, Forty-Tw o Series Infrastructure Improvements Special Assessments 76% n/a 2008 - 2018 5,498,901 921,067 921,067 Oct-08 Debt Service Tax Levy 24% n/a
2010 PIR Bonds, Forty-Four Series Infrastructure Improvements Special Assessments 39% n/a 2012 - 2021 3,509,344 717,613 717,613 Nov-10 Debt Service Tax Levy 61% n/a
2011 PIR Refunding, Thirty-Eight Srs Refunding 2003 PIR Bonds Special Assessments 12% n/a 2013 - 2018 691,938 351,000 351,000 Nov-11 Infrastructure Improvements Debt Service Tax Levy 88% n/a
2011 PIR Bonds, Forty-Five Series Infrastructure Improvements Special Assessments 28% n/a 2013 - 2031 5,162,325 815,188 815,188 Nov-11 Debt Service Tax Levy 72% n/a
2012 PIR Refunding, Thirty-Nine Srs Refunding 2004 PIR Bonds Special Assessments 57% n/a 2015 - 2025 5,281,025 652,225 652,225 Jun-12 Infrastructure Improvements Debt Service Tax Levy 43% n/a
2012 PIR Bonds, Forty-Six Srs Infrastructure Improvements Special Assessments 48% n/a 2014 - 2023 4,285,563 677,275 677,275 Jun-12 Debt Service Tax Levy 52% n/a
2013 PIR Refunding, Forty-Three Srs Refunding 2009 PIR Bonds Special Assessments 90% n/a 2015 - 2030 4,550,160 717,009 717,009 Nov-13 Current Refunding Debt Service Tax Levy 10% n/a
2013 PIR Bonds, Forty-Seven Srs Infrastructure Improvements Special Assessments 24% n/a 2015 - 2024 3,880,266 483,768 483,768 Nov-13 Debt Service Tax Levy 76% n/a
2014 PIR Bonds, Forty-Eight Srs Infrastructure Improvements & Special Assessments 32% n/a 2016-2025 6,993,437 767,775 767,775 Dec-14 Refunding 2006 PIR Bonds Debt Service Tax Levy 68% n/a
2015 PIR Bonds, Forty-Nine Srs Infrastructure Improvements Special Assessments 43% n/a 2017 - 2036 6,239,313 117,458 117,458 Oct-15 Debt Service Tax Levy 57% n/a
2016 PIR Bonds, Fif ty Srs Infrastructure Improvements Special Assessments 41% n/a 2018 - 2037 7,244,870 - - Dec-16 Debt Service Tax Levy 59% n/a
2015 PIR Refunding Bonds, Forty-One Refunding 2007 PIR and Special Assessments 100% n/a 2019 - 2029 4,357,908 - - and Forty-Tw o Srs 2008 PIR PIR bondsDec-16 Advanced Refunding
General Obligation (G.O.) Tax Increment Bonds:
2011 Serial G.O. TIF Refunding Bds Refund 2003 & 2004 TIF Bds TIF Revenue 100% n/a 2013 - 2032 3,679,453 229,090 229,090 Nov-11 Crossover Refunding
2016 Serial G.O. TIF Bonds Housing development TIF Revenue 100% n/a 2018 - 2022 2,132,697 - -
Revenue Pledged Current Year

- 86 -
General Obligation (G.O.) Bonds: 2007 Art Center Refunding. The City has pledged future tax ad valorem revenue to repay the $5,590,000
bonds issued in February 2007. Proceeds from the bonds refunded the 2000 Arts Center Bonds on February 1, 2008. Tax levies were projected to produce 100% of the debt service requirements over the life of the bonds. Total principal and interest remaining on the bonds is $2,534,700, payable through February 2021. For the current year, principal and interest paid and total tax levy revenues were $558,400 and $558,400, respectively. These bonds were refunded on February 1, 2017 with available cash and proceeds from the 2016 Art Center Refunding Bonds.
2010 Capital Improvement Bonds. The City has pledged future tax ad valorem revenue to repay the
$5,900,000 bonds issued in November 2010. Proceeds from the bonds were used to acquire certain facilities previously leased to the City by the Port Authority. User charges through the Facilities and Parks Maintenance Fund are appropriated to pay debt service payments through the life of the bonds. Total principal and interest remaining on the bonds is $3,272,001, payable through February 2021. For the current year, principal and interest paid and total tax levy revenues were $648,035 and $648,035, respectively.
2016 Art Center Refunding. The City has pledged future tax ad valorem revenue to repay the $1,610,000 bonds issued in December 2016. Proceeds from the bonds will refund the 2007 Arts Center Bonds on February 1, 2017. Tax levies were projected to produce 100% of the debt service requirements over the life of the bonds. Total principal and interest remaining on the bonds is $1,784,081, payable through February 2021. For the current year, principal and interest paid and total tax levy revenues were $0 and $0, respectively.
General Obligation (G.O.) Improvement Bonds: 2007 PIR, Forty-One Series. The City has pledged future ad valorem tax levies and special assessments
to repay the $5,915,000 bonds issued in December 2007. Proceeds from the bonds provided financing for various infrastructure improvements. Tax levies were projected to produce 45% and special assessments were projected to produce 55% of the debt service requirements over the life of the bonds. Total principal and interest remaining on the bonds is $2,006,353, payable through February 2028. These bonds will be refunded on February 1, 2018 with available cash and proceeds from the 2016 Refunding Bonds. For the current year, principal and interest paid and total tax levy and special assessment revenues were $613,869 and $613,869, respectively.
2008 PIR, Forty-Two Series. The City has pledged future ad valorem tax levies and special assessments to repay the $9,570,000 bonds issued in October 2008. Proceeds from the bonds provided financing for various infrastructure improvements. Tax levies were projected to produce 24% and special assessments were projected to produce 76% of the debt service requirements over the life of the bonds. Total principal and interest remaining on the bonds is $5,498,901, payable through February 2029. These bonds will be refunded on February 1, 2018 with available cash and proceeds from the 2016 Refunding Bonds. For the current year, principal and interest paid and total tax levy and special assessment revenues were $921,067 and $921,067 respectively.
2010 PIR, Forty-Four Series. The City has pledged future ad valorem tax levies and special assessments
to repay the $6,235,000 bonds issued in November 2010. Proceeds from the bonds provided financing for various infrastructure improvements. Tax levies were projected to produce 61% and special assessments were projected to produce 39% of the debt service requirements over the life of the bonds. Total principal and interest remaining on the bonds is $3,509,344, payable through February 2021. For the current year, principal and interest paid and total tax levy and special assessment revenues were $717,613 and $717,613, respectively.

- 87 -
2011 PIR Refunding, Thirty-Eight Series. The City has pledged future tax ad valorem revenue to repay the $2,080,000 bonds issued in November 2011. Proceeds from the bonds refunded the 2003 PIR, 38 Series Bonds on February 1, 2012. Tax levies were projected to produce 88% and special assessments were projected to produce 12% of the debt service requirements over the life of the bonds. Total principal and interest remaining on the bonds is $691,938, payable through February 2018. For the current year, principal and interest paid and total tax levy and special assessment revenues were $351,000 and $351,000, respectively.
2011 PIR, Forty-Five Series. The City has pledged future ad valorem tax levies and special assessments
to repay the $7,545,000 bonds issued in November 2011. Proceeds from the bonds provided financing for various infrastructure improvements. Tax levies were projected to produce 72% and special assessments were projected to produce 28% of the debt service requirements over the life of the bonds. Total principal and interest remaining on the bonds is $5,162,325, payable through February 2031. For the current year, principal and interest paid and total tax levy and special assessment revenues were $815,188 and $815,188, respectively.
2012 PIR Refunding, Thirty-Nine Series. The City has pledged future tax ad valorem revenue to repay
the $5,900,000 bonds issued in June 2012. Proceeds from the bonds refunded the 2004 PIR, 39 Series Bonds on February 1, 2014. Tax levies were projected to produce 43% and special assessments were projected to produce 57% of the debt service requirements over the life of the bonds. Total principal and interest remaining on the bonds is $5,281,025, payable through February 2025. For the current year, principal and interest paid and total tax levy and special assessment revenues were $652,225 and $652,225, respectively.
2012 PIR, Forty-Six Series. The City has pledged future ad valorem tax levies and special assessments to
repay the $5,615,000 bonds issued in June 2012. Proceeds from the bonds provided financing for various infrastructure improvements. Tax levies were projected to produce 52% and special assessments were projected to produce 48% of the debt service requirements over the life of the bonds. Total principal and interest remaining on the bonds is $4,285,563, payable through February 2023. For the current year, principal and interest paid and total tax levy and special assessment revenues were $677,275 and $677,275, respectively.
2013 PIR Refunding, Forty-Three Series. The City has pledged future tax ad valorem revenue to repay
the $5,135,000 bonds issued in November 2013. Proceeds from the bonds refunded the 2009 PIR, 43 Series Bonds on February 1, 2014. Tax levies were projected to produce 10% and special assessments were projected to produce 90% of the debt service requirements over the life of the bonds. Total principal and interest remaining on the bonds is $4,550,160, payable through February 2030. For the current year, principal and interest paid and total tax levy and special assessment revenues were $717,009 and $717,009, respectively.
2013 PIR, Forty-Seven Series. The City has pledged future ad valorem tax levies and special assessments
to repay the $4,180,000 bonds issued in November 2013. Proceeds from the bonds provided financing for various infrastructure improvements. Tax levies were projected to produce 76% and special assessments were projected to produce 24% of the debt service requirements over the life of the bonds. Total principal and interest remaining on the bonds is $3,880,266, payable through February 2024. For the current year, principal and interest paid and total tax levy and special assessment revenues were $483,768 and $483,768, respectively.

- 88 -
2014 PIR, Forty-Eight Series. The City has pledged future ad valorem tax levies and special assessments to repay the $7,465,000 bonds issued in December 2014. Proceeds from the bonds partially refunded the 2006 PIR, 40 Series Bonds on February 1, 2015 and provided financing for various infrastructure improvements. Tax levies were projected to produce 68% and special assessments were projected to produce 32% of the debt service requirements over the life of the bonds. Total principal and interest remaining on the bonds is $6,993,437 payable through February 2025. For the current year, principal and interest paid and total tax levy and special assessment revenues were $767,775 and $767,775, respectively.
2015 PIR, Forty-Nine Series. The City has pledged future ad valorem tax levies and special assessments
to repay the $5,355,000 bonds issued in October 2015. Proceeds from the bonds provided financing for various infrastructure improvements. Tax levies were projected to produce 57% and special assessments were projected to produce 43% of the debt service requirements over the life of the bonds. Total principal and interest remaining on the bonds is $6,239,313 payable through February 2036. For the current year, principal and interest paid and total tax levy and special assessment revenues were $117,458 and $117,458, respectively.
2016 PIR, Fifty Series. The City has pledged future ad valorem tax levies and special assessments to repay the $6,115,000 bonds issued in December 2016. Proceeds from the bonds provided financing for various infrastructure improvements. Tax levies were projected to produce 59% and special assessments were projected to produce 41% of the debt service requirements over the life of the bonds. Total principal and interest remaining on the bonds is $7,244,870, payable through February 2037. For the current year, principal and interest paid and total tax levy and special assessment revenues were $0 and $0, respectively.
2016 PIR Refunding, Forty-One Series and Forty-Two Series. The City has pledged future tax ad
valorem revenue to repay the $3,730,000 bonds issued in December 2016. Available cash and proceeds from the bonds will refund the 2007 PIR, 41 Series Bonds and the 2008 PIR, 42 Series Bonds on February 1, 2018. Special assessments were projected to produce 100% of the debt service requirements over the life of the bonds. Total principal and interest remaining on the bonds is $4,357,908, payable through February 2029. For the current year, principal and interest paid and total tax levy and special assessment revenues were $0 and $0, respectively.
General Obligation (G.O.) Tax Increment Bonds: 2011 Serial Refunding Bonds. The City has pledged tax increment revenue to repay the $3,095,000
bonds issued in November 2011. Proceeds from the bonds refunded the 2003 G.O. TIF Bonds and the 2004 G.O. TIF Bonds on February 1, 2013. Incremental property taxes were projected to produce 100% of the debt service requirements over the life of the bond issue. Total principal and interest remaining on the bonds is $3,679,453, payable through February 2032. For the current year, principal and interest paid and total tax increment revenues were $229,090 and $229,090, respectively.
2016 Serial Bonds. The City has pledged tax increment revenue to repay the $2,045,000 bonds issued in
December 2016. Proceeds from the bonds provided funding for housing developments. Incremental property taxes were projected to produce 100% of the debt service requirements over the life of the bond issue. Total principal and interest remaining on the bonds is $2,132,697, payable through February 2022. For the current year, principal and interest paid and total tax increment revenues were $0 and $0, respectively.

- 89 -
7. FUND BALANCE/NET POSITION A. GOVERNMENTAL CLASSIFICATIONS
At December 31, 2016, a summary of the governmental fund balance classifications is as follows:
Nonmajor TotalGeneral Improvement Capital Improvement Governmental Governmental
Fund Bonds Projects Construction Funds FundsNonspendable:
Prepaid items, inventory 4,337$ -$ 17,000$ -$ -$ 21,337$
Restricted for:Debt service - 21,049,561 - - 2,675,766 23,725,327 Abatement purposes - - - 2,591,356 - 2,591,356 Tax increment purposes - - 23,517,614 - - 23,517,614 Public safety - - - - 1,131,721 1,131,721 Public health - - - - 151,484 151,484 Grant purposes - - - - 19,577 19,577 Art Center - - 101,401 - - 101,401 Cemetery - - - - 620,463 620,463 Communication - - - - 101,377 101,377 Street reconstruction - - - 4,494,474 - 4,494,474
Total restricted - 21,049,561 23,619,015 7,085,830 4,700,388 56,454,794
Committed:Encumbrances* 824,119 - - - - 824,119 Budget carryovers 355,302 - - - - 355,302 Capital purposes - - - - 43,090 43,090 Park development - - 996,591 - - 996,591 Public safety - - - - 1,252,491 1,252,491 Future projects - - 4,424,628 - - 4,424,628 Communications - - - - 659,866 659,866
Total committed 1,179,421 - 5,421,219 - 1,955,447 8,556,087
Assigned for:Capital purposes - - - - 853,671 853,671 Street reconstruction - - - 24,766,339 - 24,766,339
Total assigned - - - 24,766,339 853,671 25,620,010
Unassigned 27,625,954 - - - - 27,625,954
Total fund balances 28,809,712$ 21,049,561$ 29,057,234$ 31,852,169$ 7,509,506$ 118,278,182$
*The largest encumbrance is for a $501,234 sodium chloride purchase order; the remaining $322,885 in encumbrancesare for various purchase orders made across all functions.
B. WORKING CAPITAL FUND BALANCE POLICY
The City Council has formally adopted a policy regarding the working capital fund balance for the General Fund. The most significant revenue source of the General Fund is property taxes, the second largest is lodging and admission taxes.

- 90 -
The policy states the City will strive to maintain a fund balance in the General Fund for working capital purposes of 35-40% of the following year’s General Fund total budgeted revenues or expenditures. At December 31, 2016, the fund balance of the General Fund was $28,809,712, which sufficiently meets the working capital goal described above.
8. INTERFUND RECEIVABLES, PAYABLES, AND TRANSFERS
The following is a schedule of interfund receivables and payables as of December 31, 2016:
Fund/Component Unit Receivable Payable General Fund (1) $ 216,000 $ - Capital Projects (1) 474,000 - Improvement Construction (1) - 474,000 Enterprise Funds: Water/Wastewater Fund (2) 359,530 - Internal Service Fund (2) - 359,530 Nonmajor enterprise funds (1) - 120,000 Nonmajor governmental funds (1) - 96,000 Total 1,049,530 1,049,530 Primary Government: General Fund Community Development Block Grant Fund Capital Projects Fund Bonds receivable – due: Within one year In more than one year
$ 157,309 - 2,934,474 135,000 4,711,692
$ - 111,335 429,476 - -
Component Units: Housing and Redevelopment Authority: Primary government Bonds payable – due: Within one year In more than one year Port Authority
111,335 - - 429,476
146,831 135,000 4,711,692 2,944,952
$ 8,479,286 $ 8,479,286
Interfund receivables and payables represent (1) lending/borrowing arrangements to cover deficit cash balances at the end of the fiscal year and (2) a loan to an Internal Service Fund for facilities construction.

- 91 -
The following is a schedule of interfund transfers for the year ended December 31, 2016:
Fund Transferred To Fund Transferred From Amount General Community Dev. Block Grant $ 32,431 Capital Projects 2,920,956 Nonmajor Governmental 72,504 Nonmajor Enterprise 389,274 Internal Service 200,004 Total General 3,615,169 Capital Projects Internal Service 199,992 General Fund 1,400,000 Total Capital Projects 1,599,992 Nonmajor Governmental Internal Service 128,028 Capital Projects 1,305,855 Total Nonmajor Governmental 1,433,883 Nonmajor Enterprise General Fund 350,004 Enterprise 1,500,000 Total Nonmajor Enterprise 1,850,004 Improvement Bonds Improvement Construction 955,672 Improvement Construction Improvement Bonds 458,656 Internal Service Nonmajor Governmental 89,780 Water 53,000 General Fund 2,800 Capital Projects 112,296 Total Internal Service 257,876 Enterprise Capital Projects 225,000 Total $ 10,396,252
Generally, transfers are used to move revenues from the fund that collects them to the fund that the budget requires to expend them.
9. SEGMENT INFORMATION The City maintains six enterprise funds that account for the water/wastewater utilities, storm water utilities, recreational facilities, solid waste management, contractual police services, and motor vehicle services. The City considers each of its enterprise funds to be a segment. Since the required segment information is already included in the City’s proprietary funds’ statement of net position and statement of revenues, expenses, and changes in net position (and combining statements thereof), this information has not been repeated in the notes to the basic financial statements.

- 92 -
10. CONTINGENCIES
There are several lawsuits pending in which the City is involved. The City Attorney estimates that the potential claims against the City not covered by insurance resulting from such litigation would not materially affect the financial statements of the City. A. FEDERAL AND STATE FUNDS
The City receives financial assistance from federal and state governmental agencies in the form of grants. The disbursement of funds received under these programs generally requires compliance with the terms and conditions specified in the grant agreements and it is subject to audit by the grantor agencies. Any disallowed claims resulting from such audits could become a liability of the applicable fund. However, in the opinion of management, any such disallowed claims will not have a material effect on any of the financial statements of the individual fund types included herein or on the overall financial position of the City at December 31, 2016.
B. TAX INCREMENT DISTRICTS
The City’s tax increment districts are subject to review by the Minnesota Office of the State Auditor (OSA). Any disallowed claims or misuse of tax increments could become a liability of the applicable fund. Based on external legal advice and external independent auditor interpretations, management has indicated that they are not aware of any instances of noncompliance which would have a material effect on the financial statements.
11. DEFINED PENSION BENEFIT PLANS
A. PUBLIC EMPLOYEES RETIREMENT ASSOCIATION (PERA)
PLAN DESCRIPTION The City participates in the following cost-sharing multiple-employer defined benefit pension plans administered by the Public Employees Retirement Association of Minnesota (PERA). PERA’s defined benefit pension plans are established and administered in accordance with Minnesota Statutes, Chapters 353 and 356. PERA’s defined benefit pension plans are tax qualified plans under Section 401 (a) of the Internal Revenue Code. 1. General Employees Retirement Fund (GERF)
All full-time (with the exception of employees covered by PEPFF) and certain part-time employees of the City are covered by the General Employees Retirement Fund (GERF). GERF members belong to either the Coordinated Plan or the Basic Plan. Coordinated Plan members are covered by Social Security and Basic Plan members are not. The Basic Plan was closed to new members in 1967. All new members must participate in the Coordinated Plan.
2. Public Employees Police and Fire Fund (PEPFF) The PEPFF, originally established for police officers and firefighters not covered by a local relief association, now covers all police officers and firefighters hired since 1980. Effective July 1, 1999, the PEPFF also covers police officers and firefighters belonging to a local relief association that elected to merge with and transfer assets and administration to PERA.

- 93 -
BENEFITS PROVIDED PERA provides retirement, disability, and death benefits. Benefit provisions are established by state statute and can only be modified by the state legislature. Benefit increases are provided to benefit recipients each January. Increases are related to the funding ratio of the plan. Members in plans that are at least 90 percent funded for two consecutive years are given 2.5% increases. Members in plans that have not exceeded 90% funded, or have fallen below 80%, are given 1% increases. The benefit provisions stated in the following paragraphs of this section are current provisions and apply to active plan participants. Vested, terminated employees who are entitled to benefits but are not receiving them yet are bound by the provisions in effect at the time they last terminated their public service. 1. GERF Benefits
Benefits are based on a member’s highest average salary for any five successive years of allowable service, age, and years of credit at termination of service. Two methods are used to compute benefits for PERA's Coordinated and Basic Plan members. The retiring member receives the higher of a step-rate benefit accrual formula (Method 1) or a level accrual formula (Method 2). Under Method 1, the annuity accrual rate for a Basic Plan member is 2.2% of average salary for each of the first ten years of service and 2.7% for each remaining year. The annuity accrual rate for a Coordinated Plan member is 1.2% of average salary for each of the first ten years and 1.7% for each remaining year. Under Method 2, the annuity accrual rate is 2.7% of average salary for Basic Plan members and 1.7% for Coordinated Plan members for each year of service. For members hired prior to July 1, 1989, a full annuity is available when age plus years of service equal 90 and normal retirement age is 65. For members hired on or after July 1, 1989, normal retirement age is the age for unreduced Social Security benefits capped at 66.
2. PEPFF Benefits Benefits for the PEPFF members first hired after June 30, 2010, but before July 1, 2014, vest on a prorated basis from 50% after five years up to 100% after ten years of credited service. Benefits for PEPFF members first hired after June 30, 2014, vest on a prorated basis from 50% after ten years up to 100% after twenty years of credited service. The annuity accrual rate is 3% of average salary for each year of service. For PEPFF members who were first hired prior to July 1, 1989, a full annuity is available when age plus years of service equal at least 90.
CONTRIBUTIONS Minnesota Statutes Chapter 353 sets the rates for employer and employee contributions. Contribution rates can only be modified by the state legislature. 1. GERF Contributions
Basic Plan members and Coordinated Plan members were required to contribute 9.1% and 6.50%, respectively, of their annual covered salary in calendar year 2016. The City was required to contribute 11.78% of pay for Basic Plan members and 7.50% for Coordinated Plan members in calendar year 2016. The City’s contributions to the GERF for the year ended December 31, 2016, were $2,499,700. The City’s contributions were equal to the required contributions as set by state statute.

- 94 -
2. PEPFF Contributions Plan members were required to contribute 10.8% of their annual covered salary in calendar year 2016. The City was required to contribute 16.20% of pay for PEPFF members in calendar year 2016. The City’s contributions to the PEPFF for the year ended December 31, 2016, were $2,164,062. The City’s contributions were equal to the required contributions as set by state statute.
PENSION COSTS
1. GERF Pension Costs
At December 31, 2016, the City reported a liability of $42,513,723 for its proportionate share of the GERF’s net pension liability. The City’s net pension liability reflected a reduction due to the State of Minnesota’s contribution of $6 million to the fund in 2016. The state of Minnesota is considered a non-employer contributing entity and the state’s contribution meets the definition of a special funding situation. The State of Minnesota’s proportionate share of the net pension liability associated with the City totaled $555,205. The net pension liability was measured as of June 30, 2016, and the total pension liability used to calculate the net pension liability was determined by an actuarial valuation as of that date. The City’s proportion of the net pension liability was based on the City’s contributions received by PERA during the measurement period for employer payroll paid dates from July 1, 2015, through June 30, 2016, relative to the total employer contributions received from all of PERA’s participating employers. At June 30, 2016, the City’s proportion was .5236% which was a decrease of .0153% from its proportion measured as of June 30, 2015. For the year ended December 31, 2016, the City recognized pension expense of $5,254,284 for its proportionate share of the GERF’s pension expense. In addition, the City recognized an additional $165,547 as pension expense (and grant revenue) for its proportionate share of the State of Minnesota’s contribution of $6 million to the General Employees Fund. At December 31, 2016, the City reported its proportionate share of the GERF’s deferred outflows of resources and deferred inflows of resources related to pensions from the following sources:
Deferred Outflows of Resources
Deferred Inflows of Resources
Differences between expected and actual economic experience
$ -
$ 3,453,610
Changes in actuarial assumptions 8,324,224 - Difference between projected and actual actual investment earnings
8,069,287
-
Changes in proportion - 1,832,008 Contributions paid to PERA subsequent to the measurement date
1,268,841
-
Total
$ 17,662,352
$ 5,285,618
$1,268,841 reported as deferred outflows of resources related to pensions resulting from City contributions subsequent to the measurement date will be recognized as a reduction of the net pension liability in the year ended December 31, 2017. Other amounts reported as deferred outflows and inflows of resources related to pensions will be recognized in pension expense as follows:
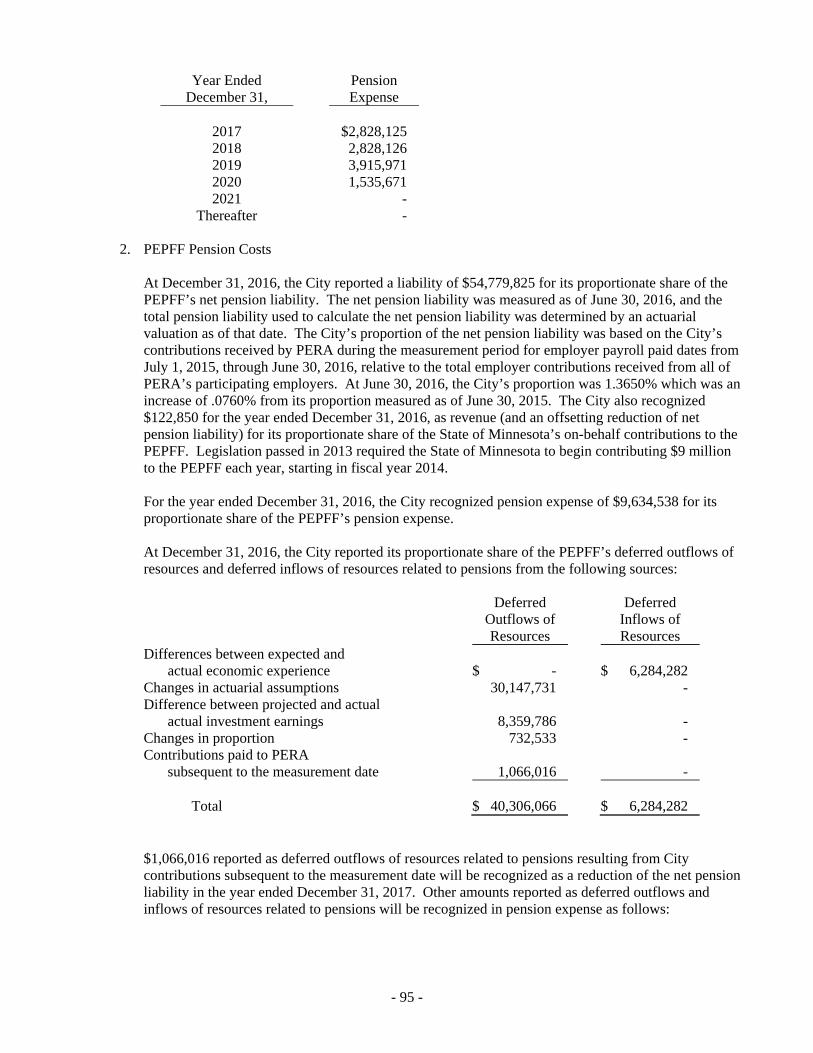
- 95 -
Year Ended December 31,
Pension Expense
2017
$2,828,125
2018 2,828,126 2019 3,915,971 2020 1,535,671 2021 -
Thereafter - 2. PEPFF Pension Costs
At December 31, 2016, the City reported a liability of $54,779,825 for its proportionate share of the PEPFF’s net pension liability. The net pension liability was measured as of June 30, 2016, and the total pension liability used to calculate the net pension liability was determined by an actuarial valuation as of that date. The City’s proportion of the net pension liability was based on the City’s contributions received by PERA during the measurement period for employer payroll paid dates from July 1, 2015, through June 30, 2016, relative to the total employer contributions received from all of PERA’s participating employers. At June 30, 2016, the City’s proportion was 1.3650% which was an increase of .0760% from its proportion measured as of June 30, 2015. The City also recognized $122,850 for the year ended December 31, 2016, as revenue (and an offsetting reduction of net pension liability) for its proportionate share of the State of Minnesota’s on-behalf contributions to the PEPFF. Legislation passed in 2013 required the State of Minnesota to begin contributing $9 million to the PEPFF each year, starting in fiscal year 2014. For the year ended December 31, 2016, the City recognized pension expense of $9,634,538 for its proportionate share of the PEPFF’s pension expense. At December 31, 2016, the City reported its proportionate share of the PEPFF’s deferred outflows of resources and deferred inflows of resources related to pensions from the following sources:
Deferred
Outflows of Resources
Deferred Inflows of Resources
Differences between expected and actual economic experience
$ -
$ 6,284,282
Changes in actuarial assumptions 30,147,731 - Difference between projected and actual actual investment earnings
8,359,786
-
Changes in proportion 732,533 - Contributions paid to PERA subsequent to the measurement date
1,066,016
-
Total
$ 40,306,066
$ 6,284,282
$1,066,016 reported as deferred outflows of resources related to pensions resulting from City contributions subsequent to the measurement date will be recognized as a reduction of the net pension liability in the year ended December 31, 2017. Other amounts reported as deferred outflows and inflows of resources related to pensions will be recognized in pension expense as follows:

- 96 -
Year Ended December 31,
Pension Expense
2017
$7,078,509
2018 7,078,509 2019 7,078,508 2020 6,402,938 2021 5,317,304
Thereafter - ACTUARIAL ASSUMPTIONS The total pension liability in the June 30, 2016, actuarial valuation was determined using the following actuarial assumptions:
Inflation 2.50% per year Active Member Payroll Growth 3.25% per year Investment Rate of Return 7.50%
Salary increases were based on a service-related table. Mortality rates for active members, retirees, survivors and disabilitants were based on RP-2014 tables for the GERF and RP-2000 tables for the PEPFF for males or females, as appropriate, with slight adjustments. Cost of living benefit increases for retirees are assumed to be 1% per year for all future years. Actuarial assumptions used in the June 30, 2016 valuation were based on the results of actuarial experience studies. The most recent four-year experience study in the GERF was completed in 2015. The experience study for PEPFF was for the period July 1, 2004, through June 30, 2009. The most recent five-year experience study for the Police and Fire Plan was completed in 2016, but the results were not adopted at the time of valuation. The following changes in actuarial assumptions occurred in 2016: General Employees Fund
The assumed post-retirement benefit increase rate was changed from 1.0% per year through 2035 and 2.5% per year thereafter to 1.0% per year for all future years.
The assumed investment return was changed from 7.9% to 7.5%. The single discount rate was changed from 7.9% to 7.5%.
Other assumptions were changed pursuant to the experience study dated June 30, 2015. The assumed future salary increases, payroll growth, and inflation were decreased by 0.25% to 3.25% for payroll growth and 2.50% for inflation.
Police and Fire Fund
The assumed post-retirement benefit increase rate was changed from 1.0% per year through 2037 and 2.5% thereafter to 1.0% per year for all future years.
The assumed investment return was changed from 7.9% to 7.5%. The single discount rate changed from 7.9% to 5.6%.
The assumed future salary increases, payroll growth, and inflation were decreased by 0.25% to 3.25% for payroll growth and 2.50% for inflation.

- 97 -
The long-term expected rate of return on pension plan investments is 7.5%. The State Board of Investment, which manages the investments of PERA, prepares an analysis of the reasonableness on a regular basis of the long-term expected rate of return using a building-block method in which best-estimate ranges of expected future rates of return are developed for each major asset class. These ranges are combined to produce an expected long-term rate of return by weighting the expected future rates of return by the target asset allocation percentages. The target allocation and best estimates of geometric real rates of return for each major asset class are summarized in the following table:
Asset Class
Target
Allocation
Long-Term Expected Real Rate of Return
Domestic stocks 45% 5.50% International stocks 15 6.00 Bonds 18 1.45 Alternative assets 20 6.40 Cash 2 .50 Total 100%
DISCOUNT RATE The discount rate used to measure the total pension liability in 2016 was 7.5%, a reduction from the 7.9% used in 2015. The projection of cash flows used to determine the discount rate assumed that contributions from plan members and employees will be made at the rates set in Minnesota statutes. Based on these assumptions, the fiduciary net position of the GERF was projected to be available to make all projected future benefit payments of current plan members. Therefore, the long-term expected rate of return on pension plan investments was applied to all periods of projected benefit payments to determine the total pension liability. In the Police and Fire Fund, the fiduciary net position was projected to be available to make all projected future benefit payments of current plan members through June 30, 2056. Beginning in the fiscal year ended June 30, 2057 for the Police and Fire Fund, when projected benefit payments exceed the funds’ projected fiduciary net position, benefit payments were discounted at the municipal bond rate of 2.85% based on an index of 20-year general obligation bonds with an average AA credit rating at the measurement date. An equivalent single discount rate of 5.60% for the Police and Fire Fund was determined that produced approximately the same present value of projected benefits when applied to all years of projected benefits as the present value of projected benefits using 7.50% applied to all years of projected benefits through the point of asset depletion and 2.85% after.

- 98 -
PENSION LIABILITY SENSITIVITY The following presents the City’s proportionate share of the net pension liability for all plans it participates in, calculated using the discount rate disclosed in the preceding paragraph, as well as what the City’s proportionate share of the net pension liability would be if it were calculated using a discount rate 1 percentage point lower or 1 percentage point higher than the current discount rate:
1% Decrease in Discount Rate
(6.5%)
Discount Rate
(7.5%)
1% Increase in Discount Rate
(8.5%) City’s proportionate share of the GERF net pension liability $ 60,382,086 $ 42,513,723 $ 27,795,955
1% Decrease in Discount Rate
(4.6%)
Discount Rate
(5.6%)
1% Increase in Discount Rate
(6.6%) City’s proportionate share of the PEPFF net pension liability $ 76,684,485 $ 54,779,825 $ 36,882,054 PENSION PLAN FIDUCIARY NET POSITION Detailed information about each pension plan’s fiduciary net position is available in a separately-issued PERA financial report that includes financial statements and required supplementary information. That report may be obtained on the Internet at www.mnpera.org .
B. SINGLE EMPLOYER PLAN – BLOOMINGTON FIRE DEPARTMENT RELIEF ASSOCIATION
SUMMARY OF SIGNIFICANT ACCOUNTING POLICIES Pensions. For purposes of measuring the net pension liability (asset), deferred outflows of resources and deferred inflows of resources related to pensions, and pension expense, information about the fiduciary net position of the Bloomington Fire Department Relief Association (Relief) and additions to deductions from the Relief’s fiduciary net position have been determined on the same basis as they were reported by the Relief. For this purpose, benefit payments are recognized when due and payable in accordance with the benefit terms. Investments are reported at fair value. PLAN DESCRIPTION Volunteer firefighters of the Bloomington Fire Department are covered by a defined benefit plan administered by the Bloomington Firefighters Relief Association. The Plan is a single employer retirement plan and is established and administered in accordance with Minnesota Statute, Chapter 69. BENEFITS PROVIDED The Relief Association provides retirement benefits as well as disability benefits to members and benefits to survivors upon death of eligible members. Benefits are established in accordance with the State Statute. The defined retirement benefits are based on the most recent 3-year average salary rates of the highest paid non-officer police officer in the City of Bloomington. Benefit provisions can be amended by the Minnesota State Legislature.

- 99 -
Twenty Year Service Pension Each member who is at least 50 years of age; has retained membership in the Association for 10 years, and has served at least twenty (20) years of active service with the Bloomington Fire Department before retirement; shall be entitled to a full service monthly pension for the remainder of his or her life. Benefits are based on 33 1/3% of the average of the highest paid non-officer police officers pay over the last 3 years. Disability Benefits A member who becomes disabled will be eligible for a monthly disability benefit based on the most recent three year average salary rates of the highest paid non-officer police officer for the City of Bloomington. If the period of disability continues to the time when the member would qualify for a service pension, the member will be placed on the service pension rolls and disability benefits shall terminate. Death Benefits Upon the death of an Association member, the Association shall pay to the designated beneficiary or estate, the sum of $500. EMPLOYEES COVERED BY BENEFIT TERMS At December 31, 2016, the following employees were covered by the benefit terms:
Retirees and beneficiaries currently receiving benefits
194
Retired members entitled to benefits, but who have not received them
14
Current members: Fully vested (20 years or more) Nonvested (less than 20 years)
7 118
Total
333
CONTRIBUTIONS Minnesota Statutes Chapter 69.772 sets the minimum contribution requirement for the City and State aid on an annual basis. These statutes are established and amended by the state legislature. The Relief Association is comprised of volunteers; therefore, members have no contribution requirements. The City receives the State aid contribution and is required by state statutes to pass this through as payment to the Relief Association. The City’s contributions to the Relief for the year ended December 31, 2016, were $905,855. The City’s contributions was equal to the required contribution as set by state statute. State aid contributions for the year ended December 31, 2016, were $563,627.
NET PENSION LIABILITY The City’s net pension liability (asset) was measured as of December 31, 2016, and the total pension liability used to calculate the net pension liability (asset) was determined by an actuarial valuation as of January 1, 2017.

- 100 -
ACTUARIAL ASSUMPTIONS The total pension liability in the January 1, 2017 actuarial valuation was determined using the following actuarial assumptions, applied to all periods included in the measurement:
Measurement date December 31, 2016 Investment rate of return 6.00% Projected salary increases 4.00% Inflation Built into other rate assumptions Cost-of-living adjustments 4.00% Age of service retirement 50 with 20 years of service Post-retirement benefit increase None
The plan has not had a formal actuarial experience study performed. Mortality assumptions for pre-retirement, post-retirement and disability are as follows: Pre-retirement – RP 2000 non-annuitant mortality table with white collar adjustment, generationally projected using scale AA, and set back two years for males and females. Post-retirement – RP 2000 annuitant mortality table with white collar adjustment, generationally projected using scale AA for males and females. Post-disabled – RP 2000 non-annuitant mortality table with white collar adjustment, set forward eight years for males and females. The best estimate range for the long-term expected rate of return is determined by adding expected inflation to expectant long-term real returns and reflecting expected volatility and correlation. The capital market assumptions are per the actuary’s investment consulting practice as of January 1, 2017.
Asset Class
Long-Term Expected GeometricReal Rate of Return
Cash
0.44%
Broad U.S. equities 3.73 Large Cap U.S. equities 3.54 Core fixed income 1.54 Developed foreign equities 4.15
DISCOUNT RATES The discount rate used to measure the total pension liability was 6.00%. The liability discount rate was developed using the alternative method described in paragraph 43 of GASB 67, which states that “if the evaluations required by paragraph 41 can be made with sufficient reliability without a separate projection of cash flows into and out of the pension plan, alternative methods may be applied in making the evaluations.” The determination of the discount rate assumed that the plan’s current overfunded status, combined with Minnesota statutory funding requirements, provide sufficient reliability that projected plan assets will be adequate to pay future retiree benefits. Therefore, the plan’s long-term expected return on plan investments was applied to all periods of projected benefit payments to determine the total pension liability.

- 101 -
CHANGES IN THE NET PENSION LIABILITY
Increase (Decrease) Total Pension
Liability (a)
Plan Fiduciary Net Position
(b)
Net Pension Liability (Asset)
(a) – (b) Balance at December 31, 2015 $ 132,836,377 $ 147,828,626 $ (14,992,249) Charges for the year:
Service cost 2,955,252 - 2,955,252 Interest on total pension liability 7,998,295 - 7,998,295 Effect of economic/demographic gains or losses 831,346 - 831,346 Benefit payments (5,046,951) (5,046,951) - Employer contributions - 1,469,482 (1,469,482) Net investment income - 11,133,373 (11,133,373) Administrative expense - (109,128) 109,128 Net changes 67,737,942 7,446,776 (708,834) Balance at December 31, 2016
$ 139,574,319
$ 155,275,402
$ (15,701,083)
PENSION LIABILITY (ASSET) SENSITIVITY The following presents the net pension liability (asset) of the City, calculated using the discount rate of 6.00 percent, as well as what the net pension liability would be if it were calculated using a discount rate that is 1-percentage-point lower (5.00 percent) or 1-percentage-point higher (7.00 percent) than the current rate:
1% Decrease in Discount Rate
(5.00%)
Discount Rate
(6.00%)
1% Increase in Discount Rate
(7.00%)
Net pension liability (asset) $ 7,996,287 $ (15,701,083) $ (34,366,232) PENSION PLAN FIDUCIARY NET POSITION Detailed information about the pension plan’s fiduciary net position is available in the separately issued Relief Association financial report. That report may be obtained by writing to Bloomington Fire Department Relief Association, 1800 West Old Shakopee Road, Bloomington, Minnesota, 55431, or by calling (952) 563-8700. PENSION EXPENSE AND DEFERRED OUTFLOWS OF RESOURCES AND DEFERRED INFLOWS OF RESOURCES RLEATED TO PENSIONS For the year ended December 31, 2016, the City recognized pension expense of $1,598,145. The City also recognized $563,627 for the year ended December 31, 2016, as pension expense (and grant revenue) for the State of Minnesota’s on-behalf contribution to the plan. At December 31, 2016, the City reported deferred outflows of resources and deferred inflows of resources related to pensions from the following sources:

- 102 -
Deferred Outflows of Resources
Deferred Inflows of Resources
Differences between expected and actual economic experience
$ 638,010
$ 3,552,740
Difference between projected and actual actual investment earnings
4,134,540
-
Total
$ 4,772,550
$ 3,552,740
Amounts reported as deferred outflows of resources and deferred inflows of resources related to pensions will be recognized in pension expense as follows:
Year Ended December 31,
Pension Expense
2017
$ (140,172)
2018 46,816 2019 1,729,694 2020 (416,528)2021 -
Thereafter -
C. PENSION EXPENSE Pension expense recognized by the City for the fiscal year ended December 31, 2015 is as follows:
GERF $ 5,419,831 PEPFF 9,634,538 Fire Relief 2,161,772 Total
$ 17,216,141
12. POST-EMPLOYMENT BENEFITS
A. PLAN DESCRIPTION
In addition to providing the pension benefits described in Note 11, the City provides post-employment health care benefits (as defined in paragraph B) for retired employees and police and firefighters disabled in the line of duty, through a single-employer defined benefit plan. The term Plan refers to the City’s requirement by State Statute to provide retirees with access to health insurance. The Other Post Employment Benefit (OPEB) plan is administered by the City. The authority to provide these benefits is established in Minnesota Statutes Sections 471.61 Subd. 2a, and 299A.465. The benefits, benefit levels, employee contributions and employer contributions are governed by the City and can be amended by the City through its personnel manual and collective bargaining agreements with employee groups. The Plan is not accounted for as a trust fund, as an irrevocable trust has not been established to account for the plan. The Plan does not issue a separate report.

- 103 -
B. BENEFITS PROVIDED
RETIREES The City is required by State Statute to allow a retiree to continue participation in the City’s group health insurance plan if the individual terminates service with the City through service retirement or disability retirement. Eligibility for continuing group health and dental insurance for City retirees is defined as follows: Eligibility Requirements The following eligibility requirements are the minimum allowed under Minnesota Statutes 471.61 and 299A.465 for local government entities: At retirement, employees of the City of Bloomington receiving a retirement or disability benefit, from
a Minnesota public pension plan (other than a volunteer Firefighter plan) may continue to participate in the City’s group health insurance plan that the employee was a participant of immediately prior to retirement.
For peace officers or firefighters disabled in the line of duty, Minnesota Statute 299A.465 requires the
peace officer’s or firefighter’s employer to continue payment of the employer’s contribution toward health coverage for the peace or firefighter and their dependents, if the dependents were covered at the time of the disability, until age 65.
Retirees may continue spouse/dependent coverage at retirement or add such coverage at the spouse’s retirement or the beginning of an enrollment year. Covered spouses/dependents may continue coverage after the retiree’s death.
Length of coverage Retirees and spouses/dependents are eligible to continue coverage in the City’s group health
insurance plans until they obtain Medicare coverage (usually at age 65) or until dependents become ineligible under the contract, provided the above eligibility requirements are met and applicable premiums are paid. Retirees may drop spouse or dependent coverage and maintain coverage for themselves. Retirees that elect not to continue health coverage, at any time, are not eligible to re-enroll in the City’s group health insurance plan.
Upon obtaining Medicare coverage, retirees and spouses are eligible to continue coverage in a City-
sponsored Medicare Supplemental Plan (HealthPartners Freedom, Medica Prime Solution, or UCare Minnesota).
Surviving spouses may maintain coverage after a retiree’s death provided the applicable premiums
are paid. All health care coverage is provided through the City’s group health insurance plans. The retirees are required to pay 100% of the premium cost for the City-sponsored group health insurance plan in which they participate. The premium is a blended rate determined on the entire active and retiree population. Since the projected claims costs for retirees exceed the blended premium paid by retirees, the retirees are receiving an implicit rate subsidy (benefit). The coverage levels are the same as those afforded to active employees. Retirees and spouses are eligible to remain in the City-sponsored group health insurance plan until death or the obtainment of Medicare, provided the applicable premiums are paid timely and coverage does not cease at any time.

- 104 -
DISABLED PEACE OFFICERS AND FIREFIGHTERS In accordance with Minnesota Statute 299A.465, the City is responsible to continue payment of the City’s contribution toward health coverage for peace officers or firefighters disabled in the line of duty; or a surviving spouse and/or dependents of a peace officer or firefighters killed in the line of duty. A peace officer is defined in the City as a sworn police officer. The only firefighters eligible for health coverage under the City’s policy are the Fire Chief and Assistant Fire Chief. The City’s contribution continues until the peace officer or firefighter reaches age 65 or the spouse/dependents are no longer eligible under the contract. In 2016, the City paid $81,541 for health insurance premiums for disabled public safety retirees and recognized this amount as an expense. The State reimburses the City annually for a portion of the City’s costs; in 2016, the City recognized as revenue a $21,836 reimbursement from the State. ACTIVE DEATH BENEFITS The City will pay 100% of the group health insurance premium for an employee’s dependents for two years after the employee’s death and 0% thereafter.
C. PARTICIPANTS As of the most recent actuarial valuation dated January 2015, participants consisted of:
Retirees and beneficiaries currently purchasing health insurance through the City
43
Active employees with coverage 546Active employees without coverage 0 Total
589
Participating employers 1
D. FUNDING POLICY
The additional cost of using a blended rate for actives and retirees is currently funded on a pay-as-you-go basis. The City Council may change the funding policy at any time.
E. ANNUAL OPEB COSTS AND NET OPEB OBLIGATION
The City’s annual OPEB cost is calculated based on the Annual Required Contribution (ARC) of the employer, an amount actuarially determined in accordance with the parameters of GASB Statement No. 45. The ARC represents a level of funding that, if paid on an ongoing basis, is projected to cover normal cost each year and amortize any unfunded actuarial liabilities (or funding excess) over a period not to exceed 30 years. The net OPEB obligation as of December 31, 2016, was calculated as follows:

- 105 -
Annual required contribution (ARC) $ 1,189,037 Interest on net OPEB obligation 245,111 Adjustment to ARC (247,619)Annual OPEB cost 1,186,529 Contributions made during the year (1) (353,471)Increase (decrease) in net OPEB obligation 833,058 Net OPEB obligation – beginning of year 6,127,767 Net OPEB obligation – end of year $ 6,960,825
(1) Employer contributions (Pay-As-You-Go costs) in 2016 will be actuarially determined at the
end of the year and will equal the retiree costs less contributions paid by retirees. For the governmental activities, other post employment benefits are liquidated through the Insured Benefits Fund. The City’s annual OPEB cost, the percentage of annual OPEB cost contributed to the plan and the net OPEB obligation for 2016 and the preceding two years were as follows:
Fiscal Year
Ended
Annual OPEB
Cost
Employer
Contributions
Percentage of Annual OPEB
Cost Contributed
Net OPEB Obligation
12/31/14 $ 1,268,987 $ 464,187 36.6% $ 5,296,640 12/31/15 1,143,384 312,257 27.3 6,127,767 12/31/16 1,186,529 353,471 29.8 6,960,825
F. FUNDED STATUS AND FUNDING PROGRESS
The City currently has no assets that have been irrevocably deposited in a trust for future health benefits; therefore, the actuarial value of assets is zero. The funded status of the plan was as follows:
Actuarial Valuation
Date
Actuarial Value of Assets
(a)
Actuarial Accrued Liability (AAL)*
(b)
Unfunded
AAL (UAAL) (b)-(a)
Funded Ratio (a)/(b)
Covered Payroll
(c)
UAAL as a
Percentage of Covered Payroll
((b-a)/c) 01/01/14 $ - $ 11,976,962 $ 11,976,962 0.0% $ 38,776,000 30.9% 01/01/15 - 9,744,125 9,744,125 0.0 39,887,000 24.4 01/01/16 - 10,489,142 10,489,142 0.0 41,383,000 25.3 *Using the entry age normal actuarial pay cost method.

- 106 -
G. ACTUARIAL METHODS AND ASSUMPTIONS
Actuarial valuations of an ongoing plan involve estimates of the value of reported amounts and assumptions about the probability of occurrence of events far into the future. Examples include assumptions about future employment, mortality and the health care cost trend. Amounts determined regarding the funded status of the plan and the annual required contributions (ARC) of the employer are subject to continual revision as actual results are compared with past expectations and new estimates are made about the future. The schedule of funding progress, presented as required supplementary information following the notes to financial statements, presents multi-year trend information that shows whether the actuarial value of plan assets is increasing or decreasing over time relative to the actuarial accrued liabilities for benefits. Projections of benefits for financial reporting purposes are based on the substantive plan (the plan as understood by the employer and plan members) and include the types of benefits provided at the time of each valuation and the historical pattern of sharing of benefit costs between the employer and plan members to that point. The actuarial methods and assumptions used include techniques that are designed to reduce the effect of short-term volatility in actuarial accrued liabilities and the actuarial value of assets, consistent with the long-term perspective of the calculations. The remaining amortization period at December 31, 2016 is 21 years. In the January 1, 2015 actuarial valuation, the Entry-age Normal Level Percent of Pay cost method was used. The following assumptions were used: Discount rate – 4% (pay-as-you-go funding) Inflation rate – 3% Payroll growth rate – 3.75% Salary increase rates – the salary increase rates used in the PERA plan of which the employee is a
participant. Mortality rates – the mortality rates used in the PERA plan of which the employee is a participant. Retirement rates – the retirement rates used in the PERA plan of which the employee is a participant. Dependent status – the marital percentage assessed in 75% of males and70% of females. Current and
future retirees were assumed to have no dependent children. Healthcare Cost Trend Rate – a 2015 rate of 9.0%, reducing .50% each year over 10 years.
13. RECEIVABLES AND DEFERRED INFLOWS
Receivables not expected to be collected within one year are mortgages receivable of $9,129,320 and deferred special assessments receivable of $17,100,645. Ten percent of the listed receivables are estimated to be collected within one year. Governmental funds report deferred inflows of resources in connection with receivables for revenues that are not considered to be available to liquidate liabilities of the current period. At the end of the current fiscal year the various components of deferred inflows reported in the governmental funds were as follows:

- 107 -
Property Taxes
State Aid
Special Assessments
Mortgages
Land Held For Resale
Total
Major Funds: General Fund
$ 406,017
$ -
$ 39,125
$ -
$ -
$ 445,142
Community Development Block Grant Capital Projects
- -
- -
- 1,564,350
10,143,689 -
- 7,418,047
10,143,689 8,982,397
Improvement Construction - 958,002 - - 606,477 1,564,479 Improvement Bonds - - 17,623,152 - - 17,623,152 Total Major Funds 406,017 958,002 19,226,627 10,143,689 8,024,524 38,758,859 Nonmajor Funds - - - - - - Total Deferred Inflows
$ 406,017
$ 958,002
$ 19,226,627
$10,143,689
$ 8,024,524
$ 38,758,859
14. SUBSEQUENT EVENT
In May of 2017 the City sold two bond issues. The first bond issue was General Obligation Charter Bonds in the amount of $1,420,000 sold to finance City park improvements. The second bond issue was General Obligation Water Utility Bonds in the amount of $1,170,000 sold to finance improvements to the City’s water system.
15. INDIVIDUAL COMPONENT UNIT DISCLOSURES
Discretely Presented Component Units - Notes 1 through 14 to the basic financial statements apply to the City and generally to its component units. The City’s two component units are reported in a separate column, or discretely presented, in the financial statements to emphasize that they are legally separate from the City. The following notes provide disclosures that are specific to each of the component units. Further detail regarding component units is provided under the Component Unit tab within the “Other Supplementary Information” section of the financial statements.

Port Authority in and for the City of Bloomington (Port Authority)
- 108 -
Cash, Cash Equivalents, and Investments
A. DEPOSITS
In accordance with Minnesota Statutes, the Port Authority maintains deposits at national or state banks within the state, all of which are members of the Federal Reserve System, as authorized by its Commissioners. Custodial Credit Risk-Deposits – Custodial credit risk is the risk that in event of a bank failure, the Port Authority’s deposits may not be returned to it. Minnesota Statutes require that all Port Authority deposits be protected by insurance, surety bond, or collateral. The fair value of collateral pledged must equal 110% of the deposits not covered by insurance or bonds. Minnesota Statutes require that securities pledged as collateral be held in safekeeping by the City treasury or in a financial institution other than that furnishing the collateral. As of December 31, 2016, the bank balance of the Port’s deposits was covered by federal depository insurance or covered by collateral pledged and held in the Port Authorities name. At December 31, 2016, the carrying amount of the Port Authority’s deposits with financial institutions and the bank balances totaled $68,640.
B. INVESTMENTS
The Port Authority invests funds, as authorized by Minnesota Statutes and its investment policy as follows: See Note 2 of the City of Bloomington for a description of qualifying depositories, collateralization, qualifying investments, and investment categorization.
At December 31, 2016, the Port Authority had the following investments and maturities:
Investment Type
Fair Value
Less than One Year
One Year to Five Years
Five Years to Ten Years
Money Market $ 22,328,290 $ 22,328,290 $ - $ - Commercial Paper 9,967,600 9,967,600 - - Federal Farm Credit Bank 10,081,724 5,119,624 4,962,100 - Federal National Mortgage Association Note
4,959,500 - 4,959,500 -
Municipal Bonds 9,106,711 500,215 7,809,560 796,936 Total investments 56,443,825 $ 37,915,729 $ 17,731,160 $ 796,936 Total deposits 68,640 Total investments and deposits $ 56,512,465 The Port Authority categorizes its fair value measurements within the fair value hierarchy established by generally accepted accounting principles. The hierarchy is based on the valuation inputs used to measure the fair value of the asset. The hierarchy has three levels. Level 1 investments are valued using inputs that are based on quoted prices in active markets for identical assets. Level 2 investments are valued using inputs that are based on quoted prices for similar assets or inputs that are observable, either directly or indirectly. Level 3 investments are valued using inputs that are unobservable.

Port Authority in and for the City of Bloomington (Port Authority)
- 109 -
The Port Authority has the following recurring fair value measurements as of December 31, 2016: Fair Value Measurements Using Investments by fair value level 12/31/16 Level 1 Level 2 Level 3 Commercial Paper $ 9,967,600 $ - $ 9,967,600 $ - Federal Farm Credit Bank 10,081,724 - 10,081,724 - Federal Home Loan Mortgage Corporation
4,959,500
-
4,959,500
-
Municipal Bonds 9,106,711 - 9,106,711 - Subtotal 34,115,535 $ - $ 34,115,535 $ - Investments not categorized External investment pools: 4M Fund Money Market 22,328,290 Bank deposits 68,640 Total $ 56,512,465 Custodial Credit Risk-Investments – For investments, custodial credit risk is the risk that in the event of a failure of the counterparty, the Port Authority will not be able to recover the value of its investments that are in possession of an outside party. As of December 31, 2016, all investments of the Port Authority were insured, registered, and held by the Port Authority or its agent in the Port Authority’s name. Interest Rate Risk - The Port Authority’s investment policy does not have limits on investment maturities as a means of managing its exposure to fair value losses arising from increasing interest rates. Credit Risk - State law limits investments in commercial paper to the top rating issued by at least two of the nationally recognized statistical rating organizations; at December 31, 2016 the Port Authority held commercial paper. The Port Authority’s investments in money market funds, Federal Farm Credit Bank and the municipal investments are all rated AA or better by Standard & Poor’s and Moody’s Investors Service. Concentration of Credit Risk - The Port Authority places no limit on the amount the Port Authority may invest in any one issuer. More than 5% of the Port Authority’s investments are in the following governmental agencies: Commercial Paper (18%), Municipals (16%), Federal National Mortgage Association (9%) and Federal Farm Credit Bank (18%). Committed Contracts At December 31, 2016, the Port had commitments for construction contracts in the Capital Projects fund with a remaining balance of $698,217.

Port Authority in and for the City of Bloomington (Port Authority)
- 110 -
Long-term Debt The long-term debt obligations outstanding at year-end are summarized as follows:
Original Balance Type of Bonds Issue Maturities Rates 12/31/16 Governmental activities -
Taxable G.O. Tax Increment Bonds $ 7,150,000 2019-2035 2.00 – 3.60% $ 7,150,000 On October 13, 2015, the Port authority issued $7,150,000 of Taxable General Obligation Tax Increment Bonds; the effective interest is 3.32%. The proceeds of the bonds will be used to finance the construction of an approximately 662-space parking ramp to be located in the IndiGO Development. A private party will independently finance an apartment complex that is being built in conjunction with the construction of the parking ramp. Changes in long-term liabilities during 2016 are summarized as follows:
Balance Balance Due Within 01/01/16 Additions Retirements 12/31/16 One Year Governmental Activities: G.O. Tax Increment Bonds $ 7,150,000 $ - $ - $ 7,150,000 $ - Unamortized Bond Premiums 15,199 - (15,199) - - Due to Primary Government - Loan from City
3,058,198
43,808
(429,704)
2,672,302
693,549
Total $10,223,397 $ 43,808 $ (444,903) $ 9,822,302 $ 693,549 Long-term debt maturities (including interest of $2,609,048) are as follows:
Governmental Activities Business-type Activities Year Ending December 31
Principal
Interest
Principal
Interest
Total
2017 $ - $ 218,245 $ - $ - $ 218,2452018 - 218,245 - - 218,2452019 380,000 214,445 - - 594,4452020 385,000 206,795 - - 591,7952021 395,000 198,995 - - 593,9952022-2026 1,925,000 859,413 - - 2,784,4132027-2031 2,100,000 548,100 - - 2,648,1002032-2036 1,965,000 144,810 - - 2,109,810 Total $ 7,150,000 $ 2,609,048 $ - $ - $ 9,759,048 Due from City The Port Authority issued a loan to the City in 2012 for the Mall of America ramp lighting project. The amount due on that loan as of December 31, 2016 is $409,143. At December 31, 2016, other payments due to the Port Authority were $20,333.

Port Authority in and for the City of Bloomington (Port Authority)
- 111 -
Due to City At December 31, 2016, the Port Authority owed the City $10,477 for services, facilities provided and payments made by the City that are Port Authority related. In addition, the Port Authority owed the City $262,172 for a portion of City projects that the Port Authority is contributing to the cost of building. The Port Authority also has a loan due to the City of $2,672,302, the proceeds of which were used to catch up special assessments owed and $2,000,000 for future special assessments that will be levied for public improvements. The expected repayment to the City in 2017 is $693,549. Payments to City During 2016 the Port contributed $8,671,710 to the City for the Lindau Lane and Old Cedar Avenue Bridge projects. Loan Receivable In 2014 the Port Authority loaned a developer $2 million at an interest rate of four percent. Semi-annual principal payments began in 2016 with the last payment scheduled in 2021. The balance at December 31, 2016, including interest, was $1,928,573. Tax Abatements-Pay-As-You-Go Tax Increment The Port Authority provides tax abatements pursuant to Minnesota Statutes 469.174 to 469.1794 (Tax Increment Financing) through a pay-as-you-go note program. Tax increment financing (TIF) can be used to encourage private development, redevelopment, renovation and renewal, growth in low-to-moderate-income housing, and economic development within the City. TIF captures the increase in tax capacity and property taxes from development or redevelopment to provide funding for the related project. The Port Authority has one tax increment pay-as-you-go agreement relating to Bloomington Central Station District 1-I. Under the terms of the agreement, the developer was assessed $7,351,758 ($11,483,513 with interest). As the developer makes assessment payments to the City, the Port Authority reimburses the developer via the counted value formula. The agreement is not a general obligation of the Port Authority and is payable solely from available tax increment derived from the redevelopment property during the prior six months, less a 10% administrative fee. The Port Authority shall have no obligation to pay any unpaid balance that may remain after decertification of the district on December 31, 2031. Accordingly, the obligation is not reflected in the financial statements of the Port Authority. Current year abatement (TIF payments) totaled $365,000. At December 31, 2016, the total amount outstanding on the contract, including interest, was $6,865,969.

Port Authority in and for the City of Bloomington (Port Authority)
- 112 -
Governmental Classifications At December 31, 2016, a summary of the governmental fund balance classifications is as follows:
General
Fund
Debt
Service
Capital Projects
Total Governmental
Funds Nonspendable – Prepaid items
$ -
$ -
$ -
$ -
Restricted for: Debt service
-
112,549
-
112,549
Tax increment purposes - - 53,521,072 53,521,072Committed – Capital purposes
-
-
152,097
152,097
Unassigned 36,750 - - 36,750 Total fund balances $ 36,750 $ 112,549 $ 53,673,169 $53,822,468

Housing and Redevelopment Authority of the City of Bloomington (HRA)
- 113 -
Cash, Cash Equivalents, and Investments See Note 2 for a description of qualifying depositories, collateralization, qualifying investments, and investment categorization. Minnesota Statutes require that all HRA deposits be protected by insurance, surety bond, or collateral. The fair value of collateral pledged must equal 110% of the deposits not covered by insurance or bonds. Minnesota Statutes require that securities pledged as collateral be held in safekeeping by the City treasury or in a financial institution other than that furnishing the collateral.
Authorized collateral includes the legal investments described as follows, as well as certain first mortgage notes, and certain other state or local government obligations.
Cash balances at December 31, 2016 were:
Credit Risk Category Bank
Balances Carrying Amount
Insured or collateralized by securities held by the HRA or its agent in the HRA’s name
$ 644,413
$ 101,148
Investment balances at December 31, 2016 were:
Investment
Maturities
Fair Value
Percentage of Total
4M Money market 01/01/17 $ 5,670,662 100% Total investments
5,670,662
100.0%
Total deposits 101,148 Net cash, cash equivalents, and investments $ 5,771,810

Housing and Redevelopment Authority of the City of Bloomington (HRA)
- 114 -
Capital Assets and Land Held for Resale Changes in general capital assets during 2016 are summarized as follows:
Balance 01/01/16
Additions
Retirements
Balance 12/31/16
Governmental activities: Capital assets not being depreciated - Land $ 130,300 $ - $ - $ 130,300Capital assets being depreciated - Machinery and equipment 30,764 - - 30,764Less accumulated depreciation for - Machinery and equipment (29,508) (1,256) - (30,764) Total capital assets being depreciated, net 1,256 (1,256) 0 Governmental activities capital assets, net
$ 131,556
$ (1,256)
$ -
$ 130,300
Business-type activities: Capital assets not being depreciated - Land $1,470,000 $ - $ - $ 1,470,000Capital assets being depreciated - Buildings and structures 3,285,617 - - 3,285,617Less accumulated depreciation for - Buildings and structures (1,985,438) (98,170) - (2,083,608) Total capital assets being depreciated, net 1,300,179 (98,170) - 1,202,009 Business-type activities capital assets, net
$2,770,179
$ (98,170)
$ -
$ 2,672,009
Land held for resale activity for the year ended December 31, 2016, was as follows:
Balance 1/1/16
Additions
Retirements
Balance 12/31/16
Land Held for Resale (Inventory) $ 732,958 $ 4,228,873 _$ (672,682) $ 4,289,149

Housing and Redevelopment Authority of the City of Bloomington (HRA)
- 115 -
Long-Term Debt and Obligations Due to Primary Government The long-term debt obligations outstanding at year-end are summarized as follows:
Original Balance Issue Maturities Rates 12/31/16 Governmental activities -
Due to primary government: 2011B Crossover Refunding Bonds $ 3,095,000 2017-2032 3.00-4.35 $ 2,725,000 2016A GO Tax Increment Bonds 2,045,000 2017-2022 .80-1.60 2,045,000 Total $ 5,140,000 $ 4,770,000 Business-type activities:
Family Housing Fund $ 175,000 2023 0.0% $ 175,000 Hennepin County-HOME Funds 419,450 2023 0.0 419,450 Hennepin County-HOME Funds 730,270 2024 0.0 730,270 Hennepin County-HOME Funds 250,000 2030 0.0 250,000 Total $ 1,574,720 $ 1,574,720
The long-term debt outstanding related to business-type activities bears no interest rate. The HRA has not imputed interest on these obligations. Changes in long-term debt during 2016 are summarized as follows:
Balance Balance Due Within 01/01/16 Additions Retirements 12/31/16 One Year Governmental Activities: Due to Primary Government- Bonds Payable
$2,850,000
$ 2,045,000
$ (125,000)
$ 4,770,000
$ 135,000
Business-type Activities - Enterprise Fund Loan Agreements
1,574,720
-
-
1,574,720
-
Total $ 4,424,720 $ 2,045,000 $ (125,000) $ 6,344,720 $ 135,000

Housing and Redevelopment Authority of the City of Bloomington (HRA)
- 116 -
Debt Service Payments The following is a schedule of the total future debt service and tax increment payment requirements for the HRA: Years ending Governmental Activities Business-type Activities December 31 Principal Interest Principal Interest Total 2017 $ 135,000 $ 116,415 $ - $ - $ 251,4152018 530,000 119,629 - - 649,6292019 545,000 111,859 - - 656,8592020 540,000 103,119 - - 643,1192021 560,000 93,465 - - 653,4652022-2026 1,245,000 341,468 1,324,720 - 2,911,1882027-2031 1,045,000 152,498 250,000 - 1,447,4982032 170,000 3,698 - - 173,698 Total $ 4,770,000 $ 1,042,151 $ 1,574,720 $ - $ 7,386,871 Fund Balance Classifications At December 31, 2016 a summary of the governmental fund balance classifications is as follows:
TIFGeneral Housing Section 8 Housing Special CapitalFund Develop Redevelop Vouchers Rehab Revenue Projects Totals
Nonspendable: Long term receivables -$ 401,896$ -$ -$ -$ -$ -$ 401,896$ Prepaid items - - - 359,159 - - - 359,159 Restricted for: Tax increment purposes - - - - - 1,465,648 - 1,465,648 HUD rehab loans - - - - 71,445 - - 71,445 Committed to: Development activities - 5,413,073 - - - - - 5,413,073 Rehabilitation loans - - - - 1,410,013 - - 1,410,013 Assigned - - - - - - 43,140 43,140 Unassigned 526,151 - - (244,817) - (3,831,475) - (3,550,141) Total fund balances 526,151$ 5,814,969$ -$ 114,342$ 1,481,458$ (2,365,827)$ 43,140$ 5,614,233$ Due to the City At December 31, 2016, the HRA owed the City $146,831 for services and facilities provided to the HRA and $135,000 for the current portion and $4,711,692 for the long-term portion of the debt obligation. Due to HRA At December 31, 2016, the City owed a total of $111,335 to the HRA for HRA rehabilitation loan program activities.

Housing and Redevelopment Authority of the City of Bloomington (HRA)
- 117 -
Conduit Debt Obligations From time to time, the HRA has issued Housing Revenue Bonds to provide financial assistance to private sector entities for the acquisition and construction of housing facilities deemed to be in the public interest. The bonds are secured by the property financed and are payable solely from payments received on the underlying mortgage loans. Upon repayment of the bonds, ownership of the acquired facilities transfers to the private-sector entity served by the bond issuance. The HRA, the State, or any other political subdivision thereof is not obligated in any manner for repayment of the bonds. Accordingly, the bonds are not reported as liabilities in the accompanying financial statements. As of December 31, 2016, there is one series of Housing Revenue Bonds outstanding, with an aggregate principal amount payable of approximately $1.8 million. The following table shows the balance of the conduit debt obligations as of December 31, 2016:
Original Balance
Beginning Balance 1/01/16
Additions
Less Payments/ Refinance
Ending Balance 12/31/16
Masonic Homes $ 4,000,000 $ 2,000,000 $ - $ (200,000) $ 1,800,000
Mortgages Receivable The Neighborhood Home Improvement Loan (Neighborhood) program is funded primarily by the HRA tax levy, loan repayments and occasionally from Strategic Initiative funds granted to the HRA by the City of Bloomington. The Neighborhood loans are to be repaid at such time as the related properties are transferred or sold. A lien is placed against the property by the HRA to ensure principal and interest is repaid. Proceeds for the Neighborhood loan principle and interest repayments will be recognized as revenue by the HRA when received. The Neighborhood loan balances outstanding, including interest, total $5,081,654 as of December 31, 2016. The Neighborhood loans have been recognized on the balance sheet as mortgage receivable and deferred inflow. The HRA entered into an agreement with Hennepin County to match funds for a rehabilitation program specifically focusing on foreclosed single family homes in 2009. Each entity provided $200,000 in funds for a program total of $400,000 with a maximum $20,000 per property. The HRA reapplied in 2010 and entered into another agreement with Hennepin County for an additional $200,000 to continue this successful program. Half of the amount provided to the homeowner from Hennepin County will become a grant if the homeowner remains in the home for a minimum of five years. The other half of the amount provided to the homeowner from the HRA is a five percent interest rate loan with the accrual of interest ceasing after ten years. Therefore, the proceeds from repayments for the amount loaned from the HRA is recognized as revenue when received. The foreclosure home (FHIP) loan balances outstanding, including interest, total $400,798 as of December 31, 2016.The outstanding balances are recognized on the balance sheet as mortgage receivable and deferred inflow.

Housing and Redevelopment Authority of the City of Bloomington (HRA)
- 118 -
In 2012, the HRA entered into another agreement with Hennepin County to match funds for the Community Enhancement Program II (CEPII ). This program also provides funding for rehabilitation loans. The first round of funding in early 2012 provided $250,000 each from the HRA and the County for loans. In late 2012, another agreement was entered into with $200,000 being pledged from each entity. The third round of funding was committed in 2013 providing an additional $233,934 from the HRA and the County. The HRA and County alternated the loans which were committed in terms of who is the mortgage holder. The CEPII loan balances outstanding, including interest, total $851,671 as of December 31, 2016. The HRA loans are recognized as mortgage receivable and deferred inflow on the balance sheet. In 2016, a new Curb Appeal Loan Program (CALP) was initiated by the HRA. This program provides up to a $10,000 loan for income elgible homeowners to use towards exterior home improvements. These loans are 0% deferred loans that are required to be repaid when the properties are transferred or sold. The CALP loan balances outstanding, including interest, total $134,583 as of December 31, 2016. These loans are recognized as mortgage receivable and deferred inflow on the balance sheet. In 2005, the HRA entered into four mortgage note agreements for the Essex Knoll property. The funds were loaned to low-income families to allow them the ability to purchase a home at an affordable price. Each mortgage note receivable was for $80,000, for a total of $320,000. The interest rate on each loan is 0% and the term is 30 years. The mortgage note has been recognized on the balance sheet as mortgage receivable and deferred inflow. The HRA has a $406,000 mortgage note receivable dated December 17, 1990, from the sale of land to a developer, Bloomington Family Townhomes LP. The funds were loaned to the developer for the purpose of constructing townhouse projects. The note accrues interest at 3% simple interest per year until the adjustment date, as defined in the note. The accumulated interest and principal was amended in 2008 to be due in the year 2025, or upon sale of the property. In 2016 the mortgage note and interest totaling $723,147 was recognized on the balance sheet as a mortgage note receivable and deferred inflow. Proceeds will be recognized as revenue by the HRA when received. If the townhomes are no longer used as affordable units, the note will bear an interest rate of 9% on the adjusted balance from the adjustment date to the year 2025, or upon sale of the property.
In 2002, the HRA entered into two loan agreements with Bloomington Southview Limited Partnership (BSLP). The funds were used to facilitate the development of affordable housing, site demolition, and abatement of environmental hazards. Under the terms of the loan agreements, the HRA provided BSLP with $165,000 and $150,000 loans, recognized on the balance sheet as notes receivable. There are no interim payments due; the compounded interest on the $165,000 loan is calculated at 3% and is recognized as revenue by the HRA as it accrues. The $150,000 loan has no interim payments due, the interest rate is 0%, and the term is 30 years. The HRA has not imputed interest on this loan. The HRA entered into two loan agreements with Bloomington Leased Housing Associates III Limited Partnership in 2007. The funds were used solely to assist with the payment of the purchase price of real property located at 10140 Lyndale Avenue also known as Blooming Glen and to rehabilitate a fifty-unit residential rental facility for low-income housing located on that property. The amounts of the loans are $200,000 accruing interest at 3% simple interest per year payable at maturity and $290,000 with a 0% interest rate. The principal and accumulated interest is due at maturity, August 18, 2037, or upon sale of the property for each loan. The mortgage notes and interest has been recognized on the balance sheet as mortgage receivable and deferred inflow. In 2008, the HRA entered into a loan agreement with Crossings at Valley View Limited Partnership (Crossings). Crossings received a $600,000 loan from the HRA to assist with the cost of acquiring property located in the northeast quadrant of Portland Avenue and 88th Street in Bloomington. This land was used to construct fifty low income housing units. The interest rate on the $600,000 loan is 0% and the term is 30 years.

Housing and Redevelopment Authority of the City of Bloomington (HRA)
- 119 -
The following table shows the balance of the mortgage loans receivable as of December 31, 2016:
Balance 01/01/16
Additions
Interest
Payments Received
Balance 12/31/16
Neighborhood Loans $ 4,201,734 $ 909,792 $ 55,865 $ (85,737) $ 5,081,654Foreclosure Loans 409,799 - 16,524 (25,525) 400,798CEP II Loans 436,308 108,181 32,306 (25,124) 851,671CALP Loans - 134,583 - - 134,583Essex Knoll 320,000 - - - 320,000Bloomington Family Townhomes
710,967
-
12,180
-
723,147
Bloomington Southview LP 150,000 - - - 150,000Bloomington Southview LP 244,559 - 7,337 - 251,896Blooming Glen 249,742 - 6,016 - 255,758Blooming Glen 290,000 - - - 290,000Crossings at Valley View 600,000 - - - 600,000VEPP 1 - - - 1 Total $ 7,913,110 $1,152,556 $ 130,228 $ (136,386) $ 9,059,508
Equity Participation/Contingent Repayment Agreements The HRA has ten equity participation agreements with various developers of development sites in Bloomington. The developers are L.W. Fraser Independent Living Project II, Henry Court Inc., AHEPA/Penelope, NHHI/ASI Bloomington Inc. (Garfield Commons and the Meadows), NHHI/Catalpa, non-profit entities of the Presbyterian Homes of Bloomington Inc. (Newton Manor, Ridgeview Terrace, and Summer House), and Cornerstone Advocacy Services. The agreements contain equity-share provisions giving the HRA portions of certain proceeds upon subsequent sales of the development sites. Such proceeds, if any, will be recognized as revenue by the HRA when received. In 2008, the City increased its equity participation agreement with AHEPA/Penelope by contributing an additional $50,000 to assist with construction of additional units of low income senior housing. On April 11, 2001, the HRA entered into a contingent repayment agreement with Lyndale Avenue Townhomes, Limited Partnership for the purpose of constructing townhomes for low-income tenants. The townhomes are operated by a management company on behalf of the HRA.

Housing and Redevelopment Authority of the City of Bloomington (HRA)
- 120 -
Value in Excess of Purchase Price (VEPP) Agreements The HRA owns one VEPP agreement with face values totaling $5,000. The agreements defer payment for portions of property values that were underwritten by the HRA under various homeownership programs. Each agreement is secured by a promissory note and a second mortgage against the individual property. The notes are repaid when a property is sold, leased, or upon maturity of the note (31 years), whichever comes first. There are no interim installment payments required by the note. Proceeds will be recognized as revenue by the HRA when received. Tax Abatements-Pay-As-You-Go Tax Increment The HRA provides tax abatements pursuant to Minnesota Statutes 469.174 to 469.1794 (Tax Increment Financing) through a pay-as-you-go note program. Tax increment financing (TIF) can be used to encourage private development, redevelopment, renovation and renewal, growth in low-to-moderate-income housing, and economic development within the City. TIF captures the increase in tax capacity and property taxes from development or redevelopment to provide funding for the related project. The HRA has one tax increment pay-as-you-go agreement. The agreement is not a general obligation of the HRA and is payable solely from available tax increment. Accordingly, this agreement is not reflected in the financial statements of the HRA. Oxboro O-4 TIF District issued a pay-as-you-go note in 2008 in the principal sum of $231,000 with an interest rate of 6% per annum. Principal and interest shall be paid on each February 1 and August 1, commencing February 1, 2009 and paid through August 1, 2035. Payments are payable solely from available tax increment derived from the redeveloped property and paid to the HRA. The pay-as-you-go note provides for payment to the developer equal to 100% of tax increment received in the prior six months less the administrative fees charged by the County. The HRA shall have no obligation to pay any unpaid balance of principal or accrued interest that may remain after the final payment on August 1, 2035. The current year abatement (TIF note payments) totaled $22,025. At December 31, 2016, the principal amount outstanding on the note was $231,000.
Committed Contracts
The HRA purchased 8000 Knox Avenue South in February 2016 with cash. City-issued bonds payable by the HRA financed the purchase of 1901 American Boulevard West in December 2016. The HRA signed a pre-development agreement with Knox & American I, LLC (the “developer”) in 2016. The developer also purchased two parcels of land adjacent to the parcels the HRA obtained. The anticipated development includes an approved housing TIF district and redevelopment TIF district which are yet to be certified. This site will include a mixed-use project that will include both market rate and affordable multi-family housing along with a hotel.

- 121 -
REQUIRED SUPPLEMENTARY
INFORMATION

- 122 -

CITY OF BLOOMINGTON, MINNESOTAREQUIRED SUPPLEMENTARY INFORMATION
Schedule of Revenues, Expenditures, and Changes in Fund Balances - Budget and ActualGeneral Fund
Year Ended December 31, 2016
Budget VarianceWith
Original Final Actual Final BudgetREVENUES Property taxes 42,131,723$ 42,131,723$ 41,913,743$ (217,980)$ Fiscal disparities 3,000,000 3,000,000 3,154,786 154,786 Special assessments - - 24,142 24,142 Lodging and admissions tax 8,510,583 8,510,583 9,807,314 1,296,731 Business licenses 4,808,550 4,808,550 4,743,748 (64,802) Fines and forfeitures 1,158,219 1,158,219 831,429 (326,790) Intergovernmental 2,313,816 2,468,461 2,607,348 138,887 Program income 2,165,458 2,228,966 2,084,458 (144,508) Interest 78,797 78,797 185,793 106,996 Net change in fair value of investments - - (105,202) (105,202) Other 834,346 840,696 982,120 141,424 Total revenues 65,001,492 65,225,995 66,229,679 1,003,684
EXPENDITURES General Government 569,503 571,003 566,504 4,499 City Manager 622,222 592,222 579,809 12,413 Legal 1,391,135 1,376,027 1,350,034 25,993 Human Resources 657,548 655,372 588,383 66,989 Finance 1,072,845 1,051,923 987,868 64,055 Public Safety 28,751,660 29,181,857 28,877,479 304,378 Community Development 6,960,471 6,950,839 6,707,431 243,408 Community Services 13,880,368 13,992,614 13,796,390 196,224 Public Works 11,202,517 10,955,239 10,832,428 122,811 Technical Services 2,933,303 2,950,104 2,935,770 14,334 Contingency/estmated unspent (236,450) (236,450) 20,000 (256,450) Total expenditures 67,805,122 68,040,750 67,242,096 798,654
Excess (deficiency) of revenues over (under) expenditures (2,803,630) (2,814,755) (1,012,417) 1,802,338
OTHER FINANCING SOURCES (USES) Transfers from other funds 3,153,630 3,153,630 3,615,169 461,539 Transfers to other funds (350,000) (1,750,000) (1,752,804) (2,804) Total other financing sources 2,803,630 1,403,630 1,862,365 458,735
Net change in fund balance - (1,411,125) 849,948 2,261,073
Fund balance - January 1 27,959,764 27,959,764 27,959,764 -
Fund balance - December 31 27,959,764$ 26,548,639$ 28,809,712$ 2,261,073$
EXHIBIT A-1
- 123 -

CITY OF BLOOMINGTON, MINNESOTAREQUIRED SUPPLEMENTARY INFORMATION
Schedule of Revenues, Expenditures, and Changes in Fund Balances - Budget and ActualCommunity Development Block Grant
Year Ended December 31, 2016
Budget VarianceWith
Original Final Actual Final BudgetREVENUES Intergovernmental 826,825$ 826,825$ 581,836$ (244,989)$ Program income 400,000 400,000 568,021 168,021 Total revenues 1,226,825 1,226,825 1,149,857 (76,968)
EXPENDITURES Current - Development services 1,201,825 1,201,825 1,117,426 84,399 Total expenditures 1,201,825 1,201,825 1,117,426 84,399
Excess (deficiency) of revenues over (under) expenditures 25,000 25,000 32,431 7,431
OTHER FINANCING SOURCES (USES) Transfers to other funds (25,000) (25,000) (32,431) (7,431)
Net change in fund balance - - - -
Fund balance - January 1 - - - -
Fund balance - December 31 -$ -$ -$ -$
EXHIBIT A-2
- 124 -

CITY OF BLOOMINGTON, MINNESOTAREQUIRED SUPPLEMENTARY INFORMATION
Schedule of Funding Progress - Retiree Health PlanYear Ended December 31, 2016
Unfunded UAAL as aActuarial Actuarial percentage
Actuarial Actuarial Accrued Accrued Funded Covered of CoveredValuation Value of Assets Liability (AAL)* Liability (UAAL) Ratio Payroll Payroll
Date (a) (b) (b-a) (a/b) (c) ((b-a)/c)
January 1, 2012 -$ 13,849,388$ 13,849,388$ 0.0% 36,760,000$ 37.7%
January 1, 2013 - 11,193,424 11,193,424 0.0% 37,374,000 29.9%
January 1, 2014 - 11,976,962 11,976,962 0.0% 38,776,000 30.9%
January 1, 2015 - 9,744,125 9,744,125 0.0% 39,887,000 24.4%
January 1, 2016 - 10,489,142 10,489,142 0.0% 41,383,000 25.3%
Using the entry age normal actuarial pay cost method.
EXHIBIT A-3
- 125 -

CITY OF BLOOMINGTON, MINNESOTAREQUIRED SUPPLEMENTARY INFORMATION
Schedule of Proportionate Share of Net Pension Liability - General Employees Retirement Fund
Year Ended December 31, 2016
Proportionate ShareProportionate of the Net Pension
Share (Amount) Liability as a Plan FiduciaryProportion of the Net Percentage of its Net Position as
(Percentage) of Pension Covered Covered-Employee a PercentageMeasurement Fiscal Year the Net Pension Liability Payroll Payroll of the Total
Date Ending Liability (a) (b) (a/b) Pension Liability
June 30, 2015 December 31, 2015 0.5389% $27,928,595 $31,663,355 88.2% 78.2%
June 30, 2016 December 31, 2016 0.5236% $42,513,723 $32,489,268 130.9% 78.2%
The schedule is provided prospectively beginning with the City's fiscal year ended December 31, 2015 and is intendedto show a ten year trend. Additional years will be reported as they become available.
EXHIBIT A-4
- 126 -

CITY OF BLOOMINGTON, MINNESOTAREQUIRED SUPPLEMENTARY INFORMATION
Schedule of Pension Contributions - General Employees Retirement Fund
Year Ended December 31, 2016
Contributions in Contributions as a Statutorily Relation to the Contribution Percentage of Required Statutorily Required Deficiency Covered Covered-Employee
Fiscal Year Contribution Contribution (Excess) Payroll PayrollEnding (a) (b) (a-b) (c) (b/c)
December 31, 2015 $2,414,889 $2,414,889 $0 $32,198,520 7.5%
December 31, 2016 $2,499,700 $2,499,700 $0 $33,329,333 7.5%
The schedule is provided prospectively beginning with the City's fiscal year ended December 31, 2015 and is intendedto show a ten year trend. Additional years will be reported as they become available.
EXHIBIT A-5
- 127 -

CITY OF BLOOMINGTON, MINNESOTAREQUIRED SUPPLEMENTARY INFORMATION
Schedule of Proportionate Share of Net Pension Liability - Public Employees Police and Fire Fund
Year Ended December 31, 2016
Proportionate ShareProportionate of the Net Pension
Share (Amount) Liability as a Plan FiduciaryProportion of the Net Percentage of its Net Position as
(Percentage) of Pension Covered Covered-Employee a PercentageMeasurement Fiscal Year the Net Pension Liability Payroll Payroll of the Total
Date Ending Liability (a) (b) (a/b) Pension Liability
June 30, 2015 December 31, 2015 1.2890% $14,646,056 $11,806,022 124.1% 86.6%
June 30, 2016 December 31, 2016 1.3650% $54,779,825 $13,147,924 416.6% 86.6%
The schedule is provided prospectively beginning with the City's fiscal year ended December 31, 2015 and is intendedto show a ten year trend. Additional years will be reported as they become available.
EXHIBIT A-6
- 128 -

CITY OF BLOOMINGTON, MINNESOTAREQUIRED SUPPLEMENTARY INFORMATION
Schedule of Pension Contributions - Public Employees Police and Fire Fund
Year Ended December 31, 2016
Contributions in Contributions as a Statutorily Relation to the Contribution Percentage of Required Statutorily Required Deficiency Covered- Covered-Employee
Fiscal Year Contribution Contribution (Excess) Payroll PayrollEnding (a) (b) (a-b) (c) (b/c)
December 31, 2015 $1,995,234 $1,995,234 $ - $12,316,259 16.2%
December 31, 2016 $2,164,062 $2,164,062 $ - $13,147,924 16.5%
The schedule is provided prospectively beginning with the City's fiscal year ended December 31, 2015 and is intendedto show a ten year trend. Additional years will be reported as they become available.
EXHIBIT A-7
- 129 -

CITY OF BLOOMINGTON, MINNESOTAREQUIRED SUPPLEMENTARY INFORMATION
Schedule of Changes in the Net Pension Liability (Asset) and Related Ratios - Public Employees Police and Fire Fund
Year Ended December 31, 2016
Fiscal Year Ending Dec. 31, 2016 Dec. 31, 2015 Dec. 31, 2014Measurement Date Dec. 31, 2016 Dec. 31, 2015 Dec. 31, 2014
Total pension liability:Service cost $2,955,252 $3,141,630 $3,047,649Interest cost 7,998,295 8,072,050 7,443,533Change of benefit terms - effect of economic/demographic gains or losses 831,346 - - Difference between expected and actual experience (5,046,951) (7,292,468) (1,567,433)Changes in assumptions - - - Benefit payments, including refunds of employee contributions - (4,883,583) (4,566,912)
Net change in total pension liability 6,737,942 (962,371) 4,356,837Total pension liability - beginning 132,836,377 133,798,748 129,441,911Total pension liability - ending (a) $139,574,319 $132,836,377 $133,798,748
Plan fiduciary net position:Contributions - employer $905,855 $1,175,095 $2,548,091Contributions - State of Minnesota 563,627 540,186 622,164Contributions - employee - - - Net investment income 11,133,373 (1,023,994) 9,982,524Benefit payments, including refunds of employee contributions (5,046,951) (4,883,583) (4,566,912)Administrative expense (109,128) (93,226) (83,410)Other - - -
Net change in plan fiduciary net position 7,446,776 (4,285,522) 8,502,457 Plan fiduciary net position - beginning 147,828,626 152,114,148 143,611,691Plan fiduciary net position - ending (b) $155,275,402 $147,828,626 $152,114,148
Net pension liability / (asset) - ending (a) - (b) ($15,701,083) ($14,992,249) ($18,315,400)
Plan fiduciary net position as a percentage of the total pension liability 111.25% 111.29% 113.69%
Covered-employee payroll* $11,003,580 $10,773,375 $10,110,384
Net pension liability (asset) as a percentage of covered employee payroll -142.69% -139.16% -181.15%
GASB 68 was implemented in 2015. Information prior to 2014 is not available.
* The Fire Relief Association is comprised of volunteers; therefore, there are no actual payroll expenditures.Covered payroll is based on the assumption that each active plan member earns the most recent salary rate of thehighest paid non-office police officer in the City of Bloomington.
EXHIBIT A-8
- 130 -

CITY OF BLOOMINGTON, MINNESOTAREQUIRED SUPPLEMENTARY INFORMATION
Schedule of Pension Contributions - Bloomington Fire Department Relief Association
Year Ended December 31, 2016
Contributions in Contributions as a Statutorily Relation to the Contribution Percentage of Required Statutorily Required Deficiency Covered Covered-Employee
Fiscal Year Contribution Contribution (Excess) Payroll Payroll*Ending (a) (b) (a-b) (c) (b/c)
December 31, 2015 $1,715,281 $1,715,281 $ - $10,773,375 15.9%
December 31, 2016 $1,469,482 $1,469,482 $ - $11,003,580 13.4%
The schedule is provided prospectively beginning with the City's fiscal year ended December 31, 2015 and is intendedto show a ten year trend. Additional years will be reported as they become available.
* The Fire Relief Association is comprised of volunteers; therefore, there are no actual payroll expenditures.Covered payroll is based on the assumption that each active plan member earns the most recent salary rate of thehighest paid non-office police officer in the City of Bloomington.
EXHIBIT A-9
- 131 -

- 132 -
CITY OF BLOOMINGTON, MINNESOTA
NOTE TO REQUIRED SUPPLEMENTARY INFORMATION FOR THE YEAR ENDED DECEMBER 31, 2016
BUDGETARY INFORMATION
Budgetary comparisons for the City’s General Fund and the annually budgeted Community Development Block Grant are required supplementary information. Budgetary information is derived from the annual operating budget and is presented using generally accepted accounting principles and the modified accrual basis of accounting. The legal level of budgetary control for the General Fund is at the department level (such as General Government, City Manager’s Office, Legal, and Human Resources) and at the fund level for the Community Development Block Grant Fund. Neither the General Fund nor the Community Development Block Grant Fund expenditures exceeded the legal level of budgetary control for fiscal year ended December 31, 2016. PENSION INFORMATION PERA – General Employees Retirement Fund 2016 Changes in Actuarial Assumptions: The assumed post-retirement benefit increase rate was changed from 1.0% per year through 2035
and 2.5% per year thereafter to 1.0% per year for all future years. The assumed investment return was changed from 7.9% to 7.5%. The single discount rate was
changed from 7.9% to 7.5%. Other assumptions were changed pursuant to the experience study dated June 30, 2015. The
assumed future salary increases, payroll growth, and inflation were decreased by 0.25% to 3.25% for payroll growth and 2.50% for inflation.
PERA – Public Employees Police and Fire Fund 2016 Changes in Actuarial Assumptions: The assumed post-retirement benefit increase rate was changed from 1.0% per year through 2037
and 2.5% thereafter to 1.0% per year for all future years. The assumed investment return was changed from 7.9% to 7.5%. The single discount rate
changed from 7.9% to 5.6%. The assumed future salary increases, payroll growth, and inflation were decreased by 0.25% to
3.25% for payroll growth and 2.50% for inflation.
Single Employer – Fire Relief Association There are no factors that affect trends in the amounts reported, such as change of benefit terms or assumptions. With only one year reported in the RSI, there is no additional information to include in the notes. Details can be obtained from the financial reports of the Fire Relief Association.

- 133 -
SUPPLEMENTARY INFORMATION

- 134 -

- 135 -
CITY OF BLOOMINGTON, MINNESOTA NONMAJOR GOVERNMENTAL FUNDS SPECIAL REVENUE FUNDS Special revenue funds are established to account for taxes and other revenues set aside for a particular purpose. Public Health Special Revenue Fund - This fund was established to account for grant funds received for the operation of public health programs such as the Sage Clinic, which operates cancer screening programs for low income and underinsured women. Public Safety Special Revenue Fund - This fund is used to account for the seized cash and/or forfeited property, enhanced 911 services, public safety and fire grant funds, the balance of police pension reimbursement proceeds, and designated fire pension obligation funds. Communications Fund - This fund was established to account for funds received from the franchise fee of the local cable television service. Park Grants Special Revenue Fund - This fund was established to account for grant funds received from the State’s Natural Resources Fund to be used for operational and maintenance costs associated with the Hyland-Bush-Anderson Lakes Regional Park Reserve. Creative Placemaking Fund – This fund was established to account for the use of funds designated for the purpose of building a vibrant, distinctive, and sustainable community through the use of arts. Initially focused on the South Loop District, creative placemaking efforts will expand to other areas in the future. Community Landscape Fund - This fund was established to account for fees collected and designated for landscape planting on public land in lieu of planting on constrained, private development sites. South Loop Revolving Development Services Fund - This fund was established to account for City funds for the Met Center Environmental Impact Statement (EIS) and Alternative Urban Areawide Review (AUAR) for Airport South development. Cemetery Trust Fund - This fund was established to provide for the perpetual care, maintenance, and improvement of the City cemetery. A portion of the monies received from the sale of lots shall be used for acquisition of additional cemetery lands with the balance placed in a perpetual care account. DEBT SERVICE FUNDS Debt service funds account for the accumulation of resources for and payment of general long-term debt principal and interest. Tax Increment Bonds Fund – This fund is used to account for the accumulation of resources for payment of tax increment general obligation bonds and interest thereon. General Obligation Bonds Fund – This fund is used to account for the accumulation of resources for payment of general obligation bonds and interest thereon. CAPITAL PROJECTS FUNDS Developer Escrow Fund - This fund is used to account for various deposits (mainly contractors' deposits for park development and to guarantee payment of special assessments for water, sewer, streets, and other improvements) required by the City.

CITY OF BLOOMINGTON, MINNESOTACombining Balance Sheet
Nonmajor Governmental FundsDecember 31, 2016
Special RevenuePublic Health Public Safety Parks Creative Community
Special Revenue Special Revenue Communications Grants Placemaking LandscapeASSETS Cash, cash equivalents and investments 56,507$ 2,358,996$ 579,900$ 257,398$ 245,828$ 1,703$ Accrued interest receivable 2 6,689 1,675 748 671 - Taxes receivable - 1,820 - - - - Accounts receivable 22,754 - 388,630 - - - Due from other governments 148,002 133,448 - - - -
Total assets 227,265$ 2,500,953$ 970,205$ 258,146$ 246,499$ 1,703$
LIABILITIES Accounts payable 35,849$ 18,502$ 208,962$ -$ 2,062$ -$ Due to other funds - 58,000 - - - - Unearned revenue 39,932 40,239 - 238,569 - - Deposits payable - - - - - - Total liabilities 75,781 116,741 208,962 238,569 2,062 -
DEFERRED INFLOWS OF RESOURCES Total deferred inflows of resources - - - - - -
FUND BALANCES Restricted 151,484 1,131,721 101,377 19,577 - - Committed - 1,252,491 659,866 - - 1,703 Assigned - - - - 244,437 - Total fund balances 151,484 2,384,212 761,243 19,577 244,437 1,703
Total liabilities, deferred inflows of resources, and fund balances 227,265$ 2,500,953$ 970,205$ 258,146$ 246,499$ 1,703$
- 136 -

TotalCapital Projects Nonmajor
South Loop Cemetery G.O. Tax General Developer GovernmentalRevolving Dev Trust Total Increment Obligation Bonds Total Escrow Funds
49,710$ 618,812$ 4,168,854$ 14,323$ 2,662,404$ 2,676,727$ 1,076,741$ 7,922,322$ 133 1,651 11,569 70 6,071 6,141 2,865 20,575
- - 1,820 - 2,574 2,574 - 4,394 37,698 - 449,082 - - - - 449,082
- - 281,450 - - - - 281,450
87,541$ 620,463$ 4,912,775$ 14,393$ 2,671,049$ 2,685,442$ 1,079,606$ 8,677,823$
46,154$ -$ 311,529$ 5,204$ 4,472$ 9,676$ 8,451$ 329,656$ - - 58,000 - - - - 58,000 - - 318,740 - - - - 318,740 - - - - - - 461,921 461,921
46,154 - 688,269 5,204 4,472 9,676 470,372 1,168,317
- - - - - - - -
- 620,463 2,024,622 9,189 2,666,577 2,675,766 - 4,700,388 41,387 - 1,955,447 - - - - 1,955,447
- - 244,437 - - - 609,234 853,671 41,387 620,463 4,224,506 9,189 2,666,577 2,675,766 609,234 7,509,506
87,541$ 620,463$ 4,912,775$ 14,393$ 2,671,049$ 2,685,442$ 1,079,606$ 8,677,823$
EXHIBIT B-1
- 137 -

CITY OF BLOOMINGTON, MINNESOTACombining Statement of Revenues, Expenditures, and Changes in Fund Balances
Nonmajor Governmental FundsYear Ended December 31, 2016
Special RevenuePublic Health Public Safety Parks Creative Community
Special Revenue Special Revenue Communications Grants Placemaking LandscapeREVENUES Property taxes -$ 461,237$ -$ -$ -$ -$ Fiscal disparities - 32,919 - - - - Fines and forfeitures - 226,089 - - - - Intergovernmental 834,347 2,348,038 - 64,693 - - Program income 88,316 - 1,205 - - - Interest 321 18,404 5,402 2,519 1,891 - Net change in fair value of investments (1,070) (9,467) (3,355) (933) (2,731) - Other - 29,983 82,640 40 - 601 Franchise fees - - 1,470,757 - - - Total revenues 921,914 3,107,203 1,556,649 66,319 (840) 601
EXPENDITURES Current: General services - - - - - - Development services - - - - 115,223 - Public safety - 3,184,106 - - - - Community services 886,593 - 1,400,821 47,408 - - Debt service: Interest - - - - - - Principal retirement - - - - - - Capital outlay: General services - - - - - - Development services - - - - 39,500 - Public safety - 74,530 - - - - Community services - - 234,167 - - - Total expenditures 886,593 3,258,636 1,634,988 47,408 154,723 -
Excess (deficiency) of revenues over (under) expenditures 35,321 (151,433) (78,339) 18,911 (155,563) 601
OTHER FINANCING SOURCES (USES) Transfers from other funds - 905,855 128,028 - 400,000 - Transfers to other funds - (148,500) - (13,784) - - Issuance of debt - - - - - - Premium on bonds issued - - - - - - Total other financing sources (uses) - 757,355 128,028 (13,784) 400,000 -
Net change in fund balance 35,321 605,922 49,689 5,127 244,437 601
Fund balance - January 1 116,163 1,778,290 711,554 14,450 - 1,102
Fund balance - December 31 151,484$ 2,384,212$ 761,243$ 19,577$ 244,437$ 1,703$
- 138 -

TotalDebt Service Capital Projects Nonmajor
South Loop Cemetery G.O. Tax General Developer GovernmentalRevolving Dev Trust Total Increment Obligation Bonds Total Escrow Funds
-$ -$ 461,237$ -$ 542,648$ 542,648$ -$ 1,003,885$ - - 32,919 - 40,280 40,280 - 73,199 - - 226,089 - - - - 226,089 - 3,247,078 - - - - 3,247,078
39,881 126,670 256,072 - - - - 256,072 961 5,742 35,240 167 9,425 9,592 9,920 54,752
1,819 500 (15,237) (210) (13,586) (13,796) (4,897) (33,930) - - 113,264 229,233 - 229,233 - 342,497 - - 1,470,757 - - - - 1,470,757
42,661 132,912 5,827,419 229,190 578,767 807,957 5,023 6,640,399
- 143,820 143,820 343 27,251 27,594 - 171,414 260,703 - 375,926 - - - - 375,926
- - 3,184,106 - - - - 3,184,106 - - 2,334,822 - - - - 2,334,822
- - - 104,090 113,000 217,090 - 217,090 - - - 125,000 910,000 1,035,000 - 1,035,000
- 278,450 278,450 - - - - 278,450 - - 39,500 - - - - 39,500 - - 74,530 - - - - 74,530 - - 234,167 - - - - 234,167
260,703 422,270 6,665,321 229,433 1,050,251 1,279,684 - 7,945,005
(218,042) (289,358) (837,902) (243) (471,484) (471,727) 5,023 (1,304,606)
- - 1,433,883 - - - - 1,433,883 - - (162,284) - - - - (162,284) - - - - 1,610,000 1,610,000 - 1,610,000 - - - - 126,512 126,512 - 126,512
- - 1,271,599 - 1,736,512 1,736,512 - 3,008,111
(218,042) (289,358) 433,697 (243) 1,265,028 1,264,785 5,023 1,703,505
259,429 909,821 3,790,809 9,432 1,401,549 1,410,981 604,211 5,806,001
41,387$ 620,463$ 4,224,506$ 9,189$ 2,666,577$ 2,675,766$ 609,234$ 7,509,506$
EXHIBIT B-2
- 139 -

CITY OF BLOOMINGTON, MINNESOTASchedule of Revenues, Expenditures, and Changes in Fund Balances - Budget and Actual
Public Health Special Revenue FundYear Ended December 31, 2016
Budget VarianceWith
Original Final Actual Final BudgetREVENUES Intergovernmental 1,087,875$ 974,705$ 834,347$ (140,358)$ Program income 34,460 35,466 88,316 52,850 Interest - - 321 321 Net change in fair value of investments - - (1,070) (1,070) Total revenues 1,122,335 1,010,171 921,914 (88,257)
EXPENDITURES Current - Community services 1,129,301 1,017,237 886,593 130,644 Total expenditures 1,129,301 1,017,237 886,593 130,644
Excess (deficiency) of revenues over (under) expenditures (6,966) (7,066) 35,321 42,387
Fund balance - January 1 116,163 116,163 116,163 -
Fund balance - December 31 109,197$ 109,097$ 151,484$ 42,387$
EXHIBIT C-1
- 140 -

CITY OF BLOOMINGTON, MINNESOTASchedule of Revenues, Expenditures, and Changes in Fund Balances - Budget and Actual
Public Safety Special Revenue FundYear Ended December 31, 2016
Budget VarianceWith
Original Final Actual Final BudgetREVENUES Property taxes 500,000$ 500,000$ 461,237$ (38,763)$ Fiscal disparities - - 32,919 32,919 Fines and forfeitures 165,000 165,000 226,089 61,089 Intergovernmental 2,230,665 2,358,120 2,348,038 (10,082) Interest 9,510 9,510 18,404 8,894 Net change in fair value of investments - - (9,467) (9,467) Other 50,000 28,535 29,983 1,448 Total revenues 2,955,175 3,061,165 3,107,203 46,038
EXPENDITURES Current - Public safety 2,853,966 3,258,644 3,184,106 74,538 Capital outlay 20,000 94,530 74,530 20,000 Total expenditures 2,873,966 3,353,174 3,258,636 94,538
Excess (deficiency) of revenues over (under) expenditures 81,209 (292,009) (151,433) 140,576
OTHER FINANCING USES Transfers from other funds 955,000 955,000 860,855 (94,145) Transfers to other funds (103,500) (103,500) (103,500) -
Total other financing sources (uses) 851,500 851,500 757,355 (94,145)
Net change in fund balance 932,709 559,491 605,922 46,431
Fund balance - January 1 1,778,290 1,778,290 1,778,290 -
Fund balance - December 31 2,710,999$ 2,337,781$ 2,384,212$ 46,431$
EXHIBIT C-2
- 141 -

CITY OF BLOOMINGTON, MINNESOTASchedule of Revenues, Expenditures, and Changes in Fund Balances - Budget and Actual
CommunicationsYear Ended December 31, 2016
Budget VarianceWith
Original Final Actual Final BudgetREVENUES Program income 2,500$ 2,500$ 1,205$ (1,295)$ Interest - - 5,402 5,402 Net change in fair value of investments - - (3,355) (3,355) Other 110,400 110,400 82,640 (27,760) Franchise fees 1,446,000 1,446,000 1,470,757 24,757 Total revenues 1,558,900 1,558,900 1,556,649 (2,251)
EXPENDITURES Current - Community services 1,443,601 1,424,031 1,400,821 23,210 Capital outlay 452,499 234,168 234,167 1 Total expenditures 1,896,100 1,658,199 1,634,988 23,211
Excess (deficiency) of revenues over (under) expenditures (337,200) (99,299) (78,339) 20,960
OTHER FINANCING SOURCES (USES) Transfers from other funds 128,235 128,235 128,028 (207)
Total other financing sources (uses) 128,235 128,235 128,028 (207)
Net change in fund balance (208,965) 28,936 49,689 20,753
Fund balance - January 1 711,554 711,554 711,554 -
Fund balance - December 31 502,589$ 740,490$ 761,243$ 20,753$
EXHIBIT C-3
- 142 -

CITY OF BLOOMINGTON, MINNESOTASchedule of Revenues, Expenditures, and Changes in Fund Balances - Budget and Actual
Park GrantsYear Ended December 31, 2016
Budget VarianceWith
Original Final Actual Final BudgetREVENUES Intergovernmental 65,000$ 65,000$ 64,733$ (267)$ Interest - - 2,519 2,519 Net change in fair value of investments - - (933) (933) Contributions - - - - Total revenues 65,000 65,000 66,319 1,319
EXPENDITURES Current - Community services 100,000 100,000 47,408 52,592 Total expenditures 100,000 100,000 47,408 52,592
Excess (deficiency) of revenues over (under) expenditures (35,000) (35,000) 18,911 53,911
OTHER FINANCING SOURCES (USES) Transfers to other funds - - (13,784) 13,784
Total other financing sources (uses) - - (13,784) (13,784)
Net change in fund balance (35,000) (35,000) 5,127 40,127
Fund balance - January 1 14,450 14,450 14,450 -
Fund balance - December 31 (20,550)$ (20,550)$ 19,577$ 40,127$
EXHIBIT C-4
- 143 -

CITY OF BLOOMINGTON, MINNESOTASchedule of Revenues, Expenditures, and Changes in Fund Balances - Budget and Actual
South Loop Revolving Development ServicesYear Ended December 31, 2016
Budget VarianceWith
Original Final Actual Final BudgetREVENUES Program income 400,000$ 400,000$ 39,881$ (360,119)$ Interest 1,900 1,900 961 (939) Net change in fair value of investments - - 1,819 1,819 Total revenues 401,900 401,900 42,661 (359,239)
EXPENDITURES Current - Development services 180,000 180,000 260,703 (80,703) Total expenditures 180,000 180,000 260,703 (80,703)
Excess (deficiency) of revenues over expenditures 221,900 221,900 (218,042) (439,942)
Fund balance - January 1 259,429 259,429 259,429 -
Fund balance - December 31 481,329$ 481,329$ 41,387$ (439,942)$
EXHIBIT C-5
- 144 -

CITY OF BLOOMINGTON, MINNESOTASchedule of Revenues, Expenditures, and Changes in Fund Balances - Budget and Actual
Creative PlacemakingYear Ended December 31, 2016
Budget VarianceWith
Original Final Actual Final BudgetREVENUES Interest -$ -$ 1,891$ 1,891$ Net change in fair value of investments - - (2,731) (2,731) Total revenues - - (840) (840)
EXPENDITURES Current - Development services 400,000$ 170,500$ 154,723$ 15,777$ Total expenditures 400,000 170,500 154,723 15,777
Excess of revenues over expenditures (400,000) (170,500) (155,563) 14,937
OTHER FINANCING SOURCES Transfers from other funds 400,000 400,000 400,000 - Total other financing sources (uses) 400,000 400,000 400,000 -
Net change in fund balance - 229,500 244,437 14,937
Fund balance - January 1 - - - -
Fund balance - December 31 -$ 229,500$ 244,437$ 14,937$
EXHIBIT C-6
- 145 -

CITY OF BLOOMINGTON, MINNESOTASchedule of Revenues, Expenditures, and Changes in Fund Balances - Budget and Actual
Cemetery TrustYear Ended December 31, 2016
Budget VarianceWith
Original Final Actual Final BudgetREVENUES Program income 137,165$ 137,165$ 126,670$ (10,495)$ Interest 6,295 6,295 5,742 (553) Net change in fair value of investments - - 500 500 Total revenues 143,460 143,460 132,912 (10,548)
EXPENDITURES Current - General services 154,582 154,582 143,820 (10,762) Capital outlay 300,000 400,000 278,450 121,550 Total expenditures 454,582 554,582 422,270 110,788
Excess of revenues over expenditures (311,122) (411,122) (289,358) 121,764
Fund balance - January 1 909,821 909,821 909,821 -
Fund balance - December 31 598,699$ 498,699$ 620,463$ 121,764$
EXHIBIT C-7
- 146 -

- 147 -
CITY OF BLOOMINGTON, MINNESOTA NONMAJOR ENTERPRISE FUNDS ENTERPRISE FUNDS Enterprise funds are used to account for operations that are financed and operated in a manner similar to private business enterprises where the intent is that the costs are to be recovered primarily through user charges. Solid Waste Management Fund - This fund accounts for the operations of the City's recycling program. Contractual Police Fund - This fund accounts for the operations of police contractual services acquired by various establishments. Motor Vehicle Fund - This fund accounts for the operations of the City’s motor vehicle registration and licensing program.

CITY OF BLOOMINGTON, MINNESOTACombining Statement of Fund Net Position
Nonmajor Enterprise FundsDecember 31, 2016
Solid Waste Contractual MotorManagement Police Vehicle Total
ASSETSCurrent assets: Cash and cash equivalents 1,876,248$ 3,627$ 466,283$ 2,346,158$ Accrued interest receivable 5,068 - 1,073 6,141 Taxes receivable 38,213 - - 38,213 Accounts receivable 1,366,965 143,027 - 1,509,992 Due from other governments 78,116 49,731 - 127,847 Total current assets 3,364,610 196,385 467,356 4,028,351 Noncurrent assets: Machinery and equipment 24,229 - - 24,229 Accumulated depreciation (24,229) - - (24,229) Total noncurrent assets - - - - Total assets 3,364,610 196,385 467,356 4,028,351
LIABILITIESCurrent liabilities: Accounts payable 1,145,304 71,185 146,613 1,363,102 Due to other funds - 120,000 - 120,000 Unearned revenue 4,319 - - 4,319 Deposits payable - 5,200 - 5,200 Total current liabilities 1,149,623 196,385 146,613 1,492,621 Total liabilities 1,149,623 196,385 146,613 1,492,621
NET POSITION Unrestricted 2,214,987 - 320,743 2,535,730 Total net position 2,214,987$ -$ 320,743$ 2,535,730$
EXHIBIT D-1
- 148 -

CITY OF BLOOMINGTON, MINNESOTACombining Statement of Revenues, Expenses, and Changes in Fund Net Position
Nonmajor Enterprise FundsYear Ended December 31, 2016
Business-type Activities - Enterprise Funds
Solid Waste Contractual MotorManagement Police Vehicle Total
Operating revenues - Charges for services 2,474,508$ 2,031,178$ 714,525$ 5,220,211$ Other 22,101 - - 22,101 Total operating revenues 2,496,609 2,031,178 714,525 5,242,312
Operating expenses: Salaries and benefits 221,145 1,737,052 552,599 2,510,796 Materials, supplies and service 3,007,385 64,587 130,335 3,202,307 Depreciation 1,211 - - 1,211 Total operating expenses 3,229,741 1,801,639 682,934 5,714,314
Operating income (loss) (733,132) 229,539 31,591 (472,002)
Nonoperating revenues: Taxes 31,812 - - 31,812 Intergovernmental 236,504 49,731 - 286,235 Interest income 10,488 - 3,894 14,382 Net change in fair value of investments (16,367) - (456) (16,823) Total nonoperating revenues 262,437 49,731 3,438 315,606
Income (loss) before transfers (470,695) 279,270 35,029 (156,396)
Transfers from other funds 1,850,004 - - 1,850,004 Transfers to other funds - (279,270) (110,004) (389,274)
Change in net position 1,379,309 - (74,975) 1,304,334
Total net position - January 1 835,678 - 395,718 1,231,396
Total net position - December 31 2,214,987$ -$ 320,743$ 2,535,730$
EXHIBIT D-2
- 149 -

CITY OF BLOOMINGTON, MINNESOTACombining Statement of Cash Flows
Nonmajor Enterprise FundsYear Ended December 31, 2016
Solid Waste Contractual MotorManagement Police Vehicle Total
CASH FLOWS FROM OPERATING ACTIVITIES Cash receipts from customers 1,362,958$ 2,522,238$ 715,006$ 4,600,202$ Other cash receipts - - - - Cash payments to other funds (192,674) (315,666) (120,264) (628,604) Payments to employees (215,972) (1,707,936) (551,060) (2,474,968) Payments to suppliers (1,783,133) (217,638) (32,687) (2,033,458) Net cash provided by (used in) operating activities (828,821) 280,998 10,995 (536,828)
CASH FLOWS FROM NONCAPITAL FINANCING ACTIVITIES Grants 238,797 - - 238,797 Transfers from other funds 1,850,004 - - 1,850,004 Transfers to other funds - (279,270) (110,004) (389,274) Taxes 31,812 - - 31,812 Net cash provided by noncapital financing activities 2,120,613 (279,270) (110,004) 1,731,339
CASH FLOWS FROM INVESTING ACTIVITIES Interest income (5,877) - 3,439 (2,438) Net cash provided by investing activities (5,877) - 3,439 (2,438)
Net increase (decrease) in cash and cash equivalents 1,285,915 1,728 (95,570) 1,192,073
Cash and cash equivalents - January 1 590,333 1,899 561,853 1,154,085
Cash and cash equivalents - December 31 1,876,248$ 3,627$ 466,283$ 2,346,158$
Reconciliation of operating income (loss) to net cash provided by (used in) operating activities Operating income (loss) (733,132)$ 229,539$ 31,591$ (472,002)$
Adjustments to reconcile operating income (loss) to net cash provided by (used in) operating activities - Depreciation 1,211 - - 1,211 Changes in assets and liabilities: Customer receivables (1,133,652) 491,060 481 (642,111) Accounts payable - other (4,531) (11,447) (618) (16,596) Accounts payable - supplier 1,035,993 (116,970) (23,136) 895,887 Interfund payables - (300,000) - (300,000) Salaries and benefits payable 5,290 (11,184) 2,677 (3,217) Net cash used in operating activities (828,821)$ 280,998$ 10,995$ (536,828)$
EXHIBIT D-3
- 150 -

- 151 -
CITY OF BLOOMINGTON, MINNESOTA INTERNAL SERVICE FUNDS Internal service funds are used to account for the financing of goods or services provided by one department to other departments of the City on a cost-reimbursement basis. Information Systems Fund - This fund accounts for the acquisition and maintenance of computer software and hardware. Equipment Division Fund - This fund accounts for the acquisition and maintenance of motorized equipment. User charges are billed to the various City departments. Support Services Fund - This fund accounts for printing, mailroom, and phone system activities. User charges are billed to various City departments. Public Safety Radio Fund - This fund accounts for the purchase and maintenance of public safety radios. User charges are billed to various City departments. Self-Insurance Fund - This fund accounts for payments of insurance premiums and claims and allocation of such costs to user departments. Benefit Accrual Fund - This fund accounts for payment of unused vacation, personal leave and compensatory time, and allocation of such costs to respective departments. Insured Benefits Fund – This fund accounts for the administration of employee benefits for insurance programs. Facilities and Parks Maintenance Fund - This fund accounts for costs related to replacement and maintenance of the main City buildings and park structures. PERA Pension – This fund accounts for payment of pension related benefits and allocation of such costs to respective departments.

CITY OF BLOOMINGTON, MINNESOTACombining Statement of Fund Net Position
Internal Service FundsDecember 31, 2016
Information Equipment Support Public SafetySystems Division Services Radio
ASSETSCurrent assets: Cash and cash equivalents 1,973,472$ 6,698,708$ 158,645$ 1,146,966$ Accrued interest receivable 5,267 17,477 445 3,073 Accounts receivable - 686 - 517 Prepaid items 665,769 - - - Due from other governments - - - - Inventory - 167,932 - - Total current assets 2,644,508 6,884,803 159,090 1,150,556 Noncurrent assets: Land - - - - Buildings and structures - - - 305,383 Machinery and equipment 1,765,850 28,564,621 81,358 1,388,727 Improvements 26,827 - - Construction in progress - 118,845 - 43,080 Accumulated depreciation (895,506) (20,122,391) (56,861) (1,108,325) Total noncurrent assets 870,344 8,587,902 24,497 628,865 Total assets 3,514,852 15,472,705 183,587 1,779,421
DEFERRED OUTFLOWS OF RESOURCES Deferred outflows - related to pensions - - - - Total deferred inflows of resources - - - -
LIABILITIESCurrent liabilities: Accounts payable 282,777 191,627 15,280 542,614 Estimated claims payable - - - - Benefits payable - - - - Due to other funds - - - - Unearned revenue - - - - Current bonds payable - - - - Accrued interest payable - - - - Deposits payable - - - - Total current liabilities 282,777 191,627 15,280 542,614 Noncurrent liabilities: Benefits payable - - - - Bonds payable - - - - Estimated claims payable - - - - Net pension liability - - - - Total noncurrent liabilities - - - - Total liabilities 282,777 191,627 15,280 542,614
DEFERRED INFLOWS OF RESOURCES Deferred inflows - related to pensions - - - - Total deferred inflows of resources - - - -
NET POSITION Net investment in capital assets 870,344 8,587,902 24,497 628,865 Unrestricted 2,361,731 6,693,176 143,810 607,942 Total net position 3,232,075$ 15,281,078$ 168,307$ 1,236,807$
- 152 -

Self- Benefit Insured Facilities & Parks PERA Insurance Accrual Benefits Maintenance Pension Total
3,980,722$ 12,317,636$ 2,440,901$ 9,417,900$ -$ 38,134,950$ 9,912 33,548 6,088 24,196 - 100,006
- - 625 - - 1,828 208,288 - - - - 874,057
- - - 8,349 - 8,349 - - - - - 167,932
4,198,922 12,351,184 2,447,614 9,450,445 - 39,287,122
- - - 11,432,262 - 11,432,262 - - - 39,846,156 - 40,151,539 - - - 4,617,953 - 36,418,509 - - - 1,913,617 - 1,940,444 - - - 51,000 - 212,925 - - - (18,961,793) - (41,144,876) - - - 38,899,195 - 49,010,803
4,198,922 12,351,184 2,447,614 48,349,640 - 88,297,925
- - - - 57,968,418 57,968,418 - - - - 57,968,418 57,968,418
37,613 - 2,674 485,428 - 1,558,013 897,200 - - - - 897,200
- 717,705 - - - 717,705 - - - 359,530 - 359,530 - - - 75,000 - 75,000 - - - 595,000 - 595,000 - - - 28,634 - 28,634 - - 21,088 - - 21,088
934,813 717,705 23,762 1,543,592 - 4,252,170
- 13,636,385 - - - 13,636,385 - - - 2,490,000 - 2,490,000
1,085,837 - - - - 1,085,837 - - - - 97,293,548 97,293,548
1,085,837 13,636,385 - 2,490,000 97,293,548 114,505,770 2,020,650 14,354,090 23,762 4,033,592 97,293,548 118,757,940
- - - - 11,569,900 11,569,900 - - - - 11,569,900 11,569,900
- - - 35,814,195 - 45,925,803 2,178,272 (2,002,906) 2,423,852 8,501,853 (50,895,030) (29,987,300) 2,178,272$ (2,002,906)$ 2,423,852$ 44,316,048$ (50,895,030)$ 15,938,503$
EXHIBIT E-1
- 153 -
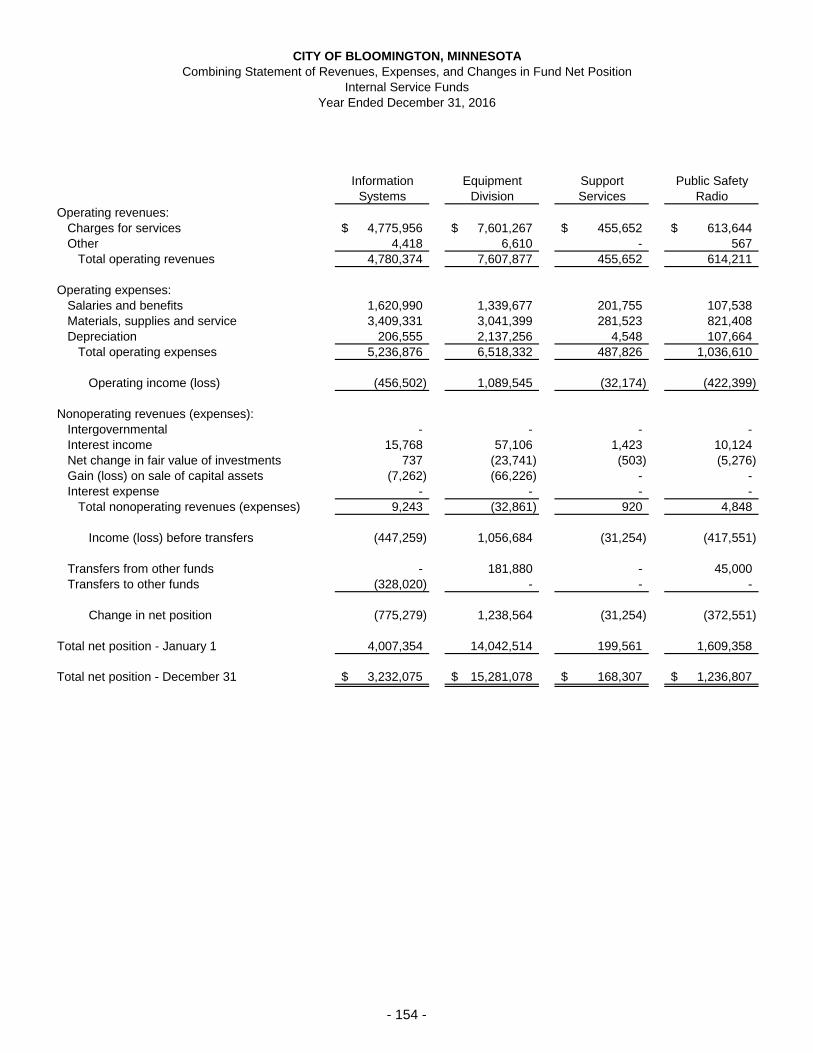
CITY OF BLOOMINGTON, MINNESOTACombining Statement of Revenues, Expenses, and Changes in Fund Net Position
Internal Service FundsYear Ended December 31, 2016
Information Equipment Support Public SafetySystems Division Services Radio
Operating revenues: Charges for services 4,775,956$ 7,601,267$ 455,652$ 613,644$ Other 4,418 6,610 - 567 Total operating revenues 4,780,374 7,607,877 455,652 614,211
Operating expenses: Salaries and benefits 1,620,990 1,339,677 201,755 107,538 Materials, supplies and service 3,409,331 3,041,399 281,523 821,408 Depreciation 206,555 2,137,256 4,548 107,664 Total operating expenses 5,236,876 6,518,332 487,826 1,036,610
Operating income (loss) (456,502) 1,089,545 (32,174) (422,399)
Nonoperating revenues (expenses): Intergovernmental - - - - Interest income 15,768 57,106 1,423 10,124 Net change in fair value of investments 737 (23,741) (503) (5,276) Gain (loss) on sale of capital assets (7,262) (66,226) - - Interest expense - - - - Total nonoperating revenues (expenses) 9,243 (32,861) 920 4,848
Income (loss) before transfers (447,259) 1,056,684 (31,254) (417,551)
Transfers from other funds - 181,880 - 45,000 Transfers to other funds (328,020) - - -
Change in net position (775,279) 1,238,564 (31,254) (372,551)
Total net position - January 1 4,007,354 14,042,514 199,561 1,609,358
Total net position - December 31 3,232,075$ 15,281,078$ 168,307$ 1,236,807$
- 154 -

Self- Benefit Insured Facilities & Parks PERAInsurance Accrual Benefits Maintenance Pension Total
2,345,707$ 1,295,244$ 9,646,428$ 11,954,028$ 4,663,762$ 43,351,688$ - - 25,000 7,975 - 44,570
2,345,707 1,295,244 9,671,428 11,962,003 4,663,762 43,396,258
- 1,878,366 9,775,661 3,619,227 15,054,369 33,597,583 1,878,451 - - 5,315,304 - 14,747,416
- - - 1,535,056 - 3,991,079 1,878,451 1,878,366 9,775,661 10,469,587 15,054,369 52,336,078
467,256 (583,122) (104,233) 1,492,416 (10,390,607) (8,939,820)
- - - 7,799 288,397 296,196 35,335 111,219 20,652 80,284 - 331,911
(15,342) (36,713) (6,019) (42,477) - (129,334) - - - - (73,488) - - - (69,442) - (69,442)
19,993 74,506 14,633 (23,836) 288,397 644,240
487,249 (508,616) (89,600) 1,468,580 (10,102,210) (8,583,977)
- - 30,996 - - 257,876 - - (200,004) - - (528,024)
487,249 (508,616) (258,608) 1,468,580 (10,102,210) (8,854,125)
1,691,023 (1,494,290) 2,682,460 42,847,468 (40,792,820) 24,792,628
2,178,272$ (2,002,906)$ 2,423,852$ 44,316,048$ (50,895,030)$ 15,938,503$
EXHIBIT E-2
- 155 -

CITY OF BLOOMINGTON, MINNESOTACombining Statement of Cash Flows
Internal Service FundsYear Ended December 31, 2016
Information Equipment SupportSystems Division Services
CASH FLOWS FROM OPERATING ACTIVITIES Cash from interfund services provided 4,551,695$ 7,611,144$ 455,741$ Cash payments to other funds (287,912) (1,276,346) (208,756) Payments to employees (1,589,848) (1,331,912) (200,228) Payments to suppliers (3,101,886) (1,879,586) (65,910) Net cash provided by (used in) operating activities (427,951) 3,123,300 (19,153)
CASH FLOWS FROM NONCAPITAL FINANCING ACTIVITIES Grants - - - Transfers from other funds - 181,880 - Transfers to other funds (328,020) - - Net cash provided by (used in) noncapital financing activities (328,020) 181,880 -
CASH FLOWS FROM CAPITAL AND RELATED FINANCING ACTIVITIES Bond payments - - - Interest and other payments - - - Proceeds from sale of capital assets - 199,075 - Purchase of capital assets (156,816) (2,719,825) (15,594) Net cash provided by (used in) capital and related financing activities (156,816) (2,520,750) (15,594)
CASH FLOWS FROM INVESTING ACTIVITIES Investment income 16,505 33,365 921 Net cash provided by investing activities 16,505 33,365 921
Net increase (decrease) in cash and cash equivalents (896,282) 817,795 (33,826)
Cash and cash equivalents - January 1 2,869,754 5,880,913 192,471
Cash and cash equivalents - December 31 1,973,472$ 6,698,708$ 158,645$
Reconciliation of operating income (loss) to net cash provided by (used in) operating activities: Operating income (loss) (456,502)$ 1,089,545$ (32,174)$
Adjustment to reconcile operating income (loss) to net cash provided by (used in) operating activities - Depreciation 206,555 2,137,256 4,548 Changes in assets and liabilities: Accounts receivable (232,223) 1,915 15 Other operating receivables 3,545 1,352 75 Inventory - 10,429 - Accounts payable - other 52 (1,893) - Accounts payable - supplier 18,810 (123,070) 6,856 Interfund payables - - - Net pension liabilty - - - Salaries and benefits payable 31,812 7,766 1,527 Deferred outflows of resources - - - Deferred inflows of resources - - - Net cash provided by (used in) operating activities (427,951)$ 3,123,300$ (19,153)$
- 156 -

Public Safety Self- Benefit Insured Facilities & Parks PERA Radio Insurance Accrual Benefits Maintenance Pension Total
613,493$ 2,359,382$ 1,301,361$ 9,672,485$ 11,960,055$ 4,663,762$ 43,189,118$ (13,824) (599,426) - - (2,449,634) - (4,835,898)
(107,036) - (1,426,615) (9,644,157) (3,594,081) (4,952,159) (22,846,036) (283,630) (1,284,620) - (171,290) (2,758,181) - (9,545,103) 209,003 475,336 (125,254) (142,962) 3,158,159 (288,397) 5,962,081
- - - - - 288,397 288,397 45,000 - - 30,996 - - 257,876
- - - (200,004) - - (528,024) 45,000 - - (169,008) - 288,397 18,249
- - - - (575,000) - (575,000) - - - - (69,442) - (69,442) - - - - - - 199,075
(43,080) - - - (634,086) - (3,569,401)
(43,080) - - - (1,278,528) - (4,014,768)
4,848 19,993 74,505 14,634 37,807 - 202,578 4,848 19,993 74,505 14,634 37,807 - 202,578
215,771 495,329 (50,749) (297,336) 1,917,438 - 2,168,140
931,195 3,485,393 12,368,385 2,738,237 7,500,462 - 35,966,810
1,146,966$ 3,980,722$ 12,317,636$ 2,440,901$ 9,417,900$ -$ 38,134,950$
(422,399)$ 467,256$ (583,122)$ (104,233)$ 1,492,416$ (10,390,607)$ (8,939,820)$
107,664 - - - 1,535,056 - 3,991,079
(517) 13,655 - (309) - - (217,464) (201) 20 6,117 1,366 (1,949) - 10,325
- - - - - - 10,429 - (106,322) - - (15,420) - (123,583)
523,818 100,727 453,741 (39,786) 158,863 - 1,099,959 - - - - (35,953) - (35,953) - - - - - 56,500,728 56,500,728
638 - (1,990) - 25,146 - 64,899 - - - - - (57,968,418) (57,968,418) - - - - - 11,569,900 11,569,900
209,003$ 475,336$ (125,254)$ (142,962)$ 3,158,159$ (288,397)$ 5,962,081$
EXHIBIT E-3EXHIBIT E-3
- 157 -

- 158 -
CITY OF BLOOMINGTON, MINNESOTA FIDUCIARY FUNDS - AGENCY Agency funds are used to account for resources held by the City as agent for the benefit of parties outside of the government. Convention Bureau Fund – This agency fund accounts for the collection of lodging taxes for the Bloomington Visitors and Convention Bureau. State Pass-Through Loans Fund – This agency fund accounts for loans between the Minnesota Department of Employment and Economic Development (DEED) and local Bloomington businesses. City Fiduciary Fund – This agency fund accounts for the collection and disbursement of funds received for other parties and governmental units including the police property room, Metro Mobility, AARP, Farmers Market, Creekside agreements, and youth summer programs.

City of BloomingtonCombining Statement of Fiduciary Net Position
Agency FundsDecember 31, 2016
StateConvention Pass-Through City
Bureau Loans Fiduciary TotalASSETS Cash and cash equivalents 367,383$ 9,019$ 449,118$ 825,520$ Accounts receivable 344,175 - - 344,175 Total assets 711,558 9,019 449,118 1,169,695
LIABILITIESCurrent liabilities - Accounts payable 711,558 9,019 449,118 1,169,695
NET POSITION -$ -$ -$ -$
EXHIBIT F-1
- 159 -

City of BloomingtonCombining Statement of Changes in Fiduciary Assets and Liabilities
Agency FundsYear Ended December 31, 2016
Balance Balance1/1/2016 Additions Deductions 12/31/2016
CONVENTION BUREAUASSETS
Cash and cash equivalents 325,047$ 5,501,095$ 5,458,759$ 367,383$ Accounts receivable 291,024 344,175 291,024 344,175
Total assets 616,071$ 5,845,270$ 5,749,783$ 711,558$
LIABILITIESDue to Convention Bureau 616,071$ 5,845,270$ 5,749,783$ 711,558$
STATE PASS-THROUGH LOANSASSETS
Cash and cash equivalents 6,012$ 36,073$ 33,066$ 9,019$ Accounts receivable - 36,073 36,073 -
Total assets 6,012$ 72,146$ 69,139$ 9,019$
LIABILITIESDue to Loan Recipients 6,012$ 72,146$ 69,139$ 9,019$
CITY FIDUCIARYASSETS
Cash and cash equivalents 496,840$ 770,969$ 818,691$ 449,118$
LIABILITIESDue to Other Parties 496,840$ 770,969$ 818,691$ 449,118$
TOTAL - ALL AGENCY FUNDSASSETS
Cash and cash equivalents 827,899$ 6,308,137$ 6,310,516$ 825,520$ Accounts receivable 291,024 380,248 327,097 344,175
Total assets 1,118,923$ 6,688,385$ 6,637,613$ 1,169,695$
LIABILITIESDue to Convention Bureau 616,071$ 5,845,270$ 5,749,783$ 711,558$ Due to Loan Recipients 6,012 72,146 69,139 9,019Due to Other Parties 496,840 770,969 818,691 449,118
Total liabilities 1,118,923$ 6,688,385$ 6,637,613$ 1,169,695$
EXHIBIT F-2
- 160 -

- 161 -
OTHER
SUPPLEMENTARY INFORMATION –
COMPONENT
UNITS

PORT AUTHORITY OF THECITY OF BLOOMINGTON, MINNESOTA
Schedule of Assets, Liabilities, and Fund BalancesDecember 31, 2016
Governmental Fund Types TotalsDebt Capital
General Service Projects 2016 2015ASSETS
Cash, cash equivalents, and investments 46,327$ 112,495$ 56,353,643$ 56,512,465$ 65,465,598$ Accounts receivable - - 18,600 18,600 - Taxes receivable - - 2,483 2,483 5,627 Accrued interest receivable - 254 131,858 132,112 131,328 Due from primary government - - 429,476 429,476 867,431 Loans receivable - - 1,928,573 1,928,573 2,121,600 Land held for resale - - 17,150,000 17,150,000 -
Total assets 46,327 112,749 76,014,633 76,173,709 68,591,584
LIABILITIESAccounts payable 3,020 200 2,253,068 2,256,288 1,805,747 Due to primary government 6,557 - 2,938,396 2,944,953 4,141,793
Total liabilities 9,577 200 5,191,464 5,201,241 5,947,540
DEFERRED INFLOWS OF RESOURCESDeferred inflow - land held for resale - - 17,150,000 17,150,000 -
Total deferred inflows of resources - - 17,150,000 17,150,000 -
FUND BALANCESRestricted - 112,549 53,521,072 53,633,621 62,456,176 Committed - - 152,097 152,097 151,319 Unassigned 36,750 - - 36,750 36,549
Total fund balances 36,750 112,549 53,673,169 53,822,468 62,644,044
Total liabilities, deferred inflows of resources and fund balances 46,327$ 112,749$ 76,014,633$ 76,173,709$ 68,591,584$
EXHIBIT G-1
- 162 -

PORT AUTHORITY OF THECITY OF BLOOMINGTON, MINNESOTA
Schedule of Revenues, Expenditures, and Changes in Fund BalancesYear Ended December 31, 2016
Governmental Fund Types TotalsDebt Capital
General Service Projects 2016 2015REVENUES
Property tax increment -$ -$ 27,297,579$ 27,297,579$ 22,093,532$ Interest - 436 506,840 507,276 346,590 Net change in fair value of investments 84 104 (46,183) (45,995) (37,415) City contribution 290,000 - - 290,000 260,000 Other 529 - 481 1,010 -
Total revenues 290,613 540 27,758,717 28,049,870 22,662,707
EXPENDITURESCurrent:
General services 290,412 200 273,124 563,736 649,115 Development services - - 36,029,311 36,029,311 13,781,229
Debt service:Interest - 166,109 112,290 278,399 120,609
Total expenditures 290,412 166,309 36,414,725 36,871,446 14,550,953
Excess (deficiency) ofrevenues over (under) expenditures 201 (165,769) (8,656,008) (8,821,576) 8,111,754
OTHER FINANCING SOURCES (USES)Transfers in - - 2,729,758 2,729,758 3,214,651 Transfers out - - (2,729,758) (2,729,758) (3,214,651) Issuance of debt - - - - 7,150,000 Premium on bonds issued - - - - 15,331
Total other financing sources (uses) - - - - 7,165,331
Net change in fund balance 201 (165,769) (8,656,008) (8,821,576) 15,277,085
Fund balance - January 1 36,549 278,318 62,329,177 62,644,044 47,366,959
Fund balance - December 31 36,750$ 112,549$ 53,673,169$ 53,822,468$ 62,644,044$
EXHIBIT G-2
- 163 -

HOUSING AND REDEVELOPMENT AUTHORITYIN AND FOR THE CITY OF BLOOMINGTON
Schedule of Net PositionDecember 31, 2016
Governmental Business-typeActivities Activities Total
ASSETS Cash and cash equivalents 5,262,338$ 509,472$ 5,771,810$ Accounts receivable 9,091,924 - 9,091,924 Prepaid items 359,159 - 359,159 Due from primary government 111,335 - 111,335 Due from other government 6,256 - 6,256 Inventory - land held for resale 4,289,149 - 4,289,149 Land 130,300 1,470,000 1,600,300 Buildings and structures, net of accumulated depreciation - 1,202,009 1,202,009
Total assets 19,250,461 3,181,481 22,431,942
LIABILITIESAccounts payable 53,127 81,856 134,983 Unearned revenue 371,533 - 371,533 Due to primary government 254,674 27,157 281,831 Noncurrent liabilities: Due to primary government - Bonds payable due in more than one year 4,711,692 - 4,711,692 Due in more than one year - 1,574,720 1,574,720
Total liabilities 5,391,026 1,683,733 7,074,759
NET POSITION Net investment in capital assets 130,300 1,097,289 1,227,589 Restricted for: Tax increment purposes 1,388,956 - 1,388,956 HUD rehab loans 71,445 - 71,445 Unrestricted 12,268,734 400,459 12,669,193
Total net position 13,859,435$ 1,497,748$ 15,357,183$
EXHIBIT H-1
- 164 -

HOUSING AND REDEVELOPMENT AUTHORITY
Operating CapitalCharges for Grants and Grants and Governmental Business-type
Functions/Programs Expenses Services Contributions Contributions Activities Activities Total
Governmental activities:General services 4,761,227$ 24,356$ 4,452,380$ -$ (284,491)$ -$ (284,491)$ Development services 3,325,597 1,938,580 1,017,499 - (369,518) - (369,518) Interest on long-term debt
and amounts due to primarygovernment - bonds payable 102,429 - - - (102,429) - (102,429)
Total governmental activities 8,189,253 1,962,936 5,469,879 - (756,438) - (756,438)
Business-type activities:Property management 341,246 196,696 - - - (144,550) (144,550) Assisted rental 313,492 291,226 - - - (22,266) (22,266)
Total business-type activities 654,738 487,922 - - - (166,816) (166,816)
Total 8,843,991$ 2,450,858$ 5,469,879$ -$ (756,438) (166,816) (923,254)
General revenues: Property taxes 3,080,068 - 3,080,068 Interest and investment earnings 7,689 - 7,689 Transfers (60,000) 60,000 - Total general revenues and transfers 3,027,757 60,000 3,087,757
Change in net position 2,271,319 (106,816) 2,164,503
Net position - January 1 11,588,116 1,604,564 13,192,680
Net position - December 31 13,859,435$ 1,497,748$ 15,357,183$
IN AND FOR THE CITY OF BLOOMINGTONSchedule of Activities
For the Year Ended December 31, 2016
Program RevenuesNet (Expense) Revenue and
Changes in Net Position
EXHIBIT H-2
- 165 -

HOUSING AND REDEVELOPMENT AUTHORITYIN AND FOR THE CITY OF BLOOMINGTON
Schedule of Assets, Liabilities, and Fund BalancesGovernmental FundsDecember 31, 2016
General Housing Section 8Fund Development Vouchers
ASSETS Cash and cash equivalents 547,485$ 1,435,368$ 176,374$ Taxes receivable 23,432 - - Accounts receivable 1,208 6,225 1,281 Mortgage receivable - 1,445,044 - Prepaid items - - 359,159 Due from other funds - 4,000,000 - Due from primary government - - - Due from other govts - - 6,256 Inventory - land for resale - 1,414,500 - Total assets 572,125$ 8,301,137$ 543,070$
LIABILITIES Accounts payable 731$ 13,180$ 8,385$ Due to other funds - - - Due to primary government 30,410 15,340 48,810 Unearned revenue 371,533 Total liabilities 31,141 28,520 428,728
DEFERRED INFLOWS OF RESOURCES Deferred inflow-taxes 14,833 - - Deferred inflow-mortgages - 1,043,148 - Deferred inflow-land held for resale - 1,414,500 - Total deferred inflows of resources 14,833 2,457,648 -
FUND BALANCES (DEFICITS) Nonspendable - 401,896 359,159 Restricted - - - Committed - 5,413,073 - Assigned - - - Unassigned 526,151 - (244,817) Total fund balances 526,151 5,814,969 114,342
Total liabilities, deferred inflows of resources and fund balances (deficits) 572,125$ 8,301,137$ 543,070$
- 166 -

TIF TotalHousing Special Capital Governmental
Rehabilitation Revenue Projects Funds
1,399,709$ 1,654,805$ 48,597$ 5,262,338$ - 270 - 23,702 - - - 8,714
6,468,706 - 1,145,758 9,059,508 - - - 359,159 - - - 4,000,000
111,335 - - 111,335 - - - 6,256 - 2,272,802 601,847 4,289,149
7,979,750$ 3,927,877$ 1,796,202$ 23,120,161$
4,472$ 20,902$ 5,457$ 53,127$ - 4,000,000 - 4,000,000
25,114 - - 119,674 - 371,533
29,586 4,020,902 5,457 4,544,334
- - - 14,833 6,468,706 - 1,145,758 8,657,612
- 2,272,802 601,847 4,289,149 6,468,706 2,272,802 1,747,605 12,961,594
- - - 761,055 71,445 1,465,648 - 1,537,093
1,410,013 - - 6,823,086 - - 43,140 43,140 - (3,831,475) - (3,550,141)
- 1,481,458 (2,365,827) 43,140 5,614,233
7,979,750$ 3,927,877$ 1,796,202$ 23,120,161$
EXHIBIT H-3
- 167 -

HOUSING AND REDEVELOPMENT AUTHORITYIN AND FOR THE CITY OF BLOOMINGTON
Reconciliation of the Governmental FundsSchedule of Assets, Liabilities, and Fund Balances
To the Schedule of Net PositionDecember 31, 2016
FUND BALANCE - TOTAL GOVERNMENTAL FUNDS 5,614,233$
Amounts reported for governmental activities in the Scheduleof Net Position are different because:
Capital assets used in governmental activities are not financialresources and, therefore, are not reported in the funds.
Cost of capital assets 161,064$ Less accumulated depreciation (30,764) 130,300
Some receivables that are not currently available are reportedas deferred inflow in the fund financial schedules but arerecognized as revenue when earned in the government-wideschedules. 12,961,594
Long-term liabilities, including bonds payable, are not due and payablein the current period and, therefore, are not reported in the funds. (4,770,000)
Governmental funds report the effect of premiums and discounts when debt is first issued, whereas these amounts are deferredand amortized in the government-wide schedules. (32,074)
Accrued interest is not due and payable in the current period and, therefore, not reported in the fund schedules. (44,618)
NET POSITION OF GOVERNMENTAL ACTIVITIES 13,859,435$
EXHIBIT H-4
- 168 -

- 169 -

HOUSING AND REDEVELOPMENT AUTHORITYIN AND FOR THE CITY OF BLOOMINGTON
Schedule of Revenues, Expenditures, and Changes in Fund BalancesGovernmental Funds
Year Ended December 31, 2016
General Housing Section 8Fund Development Vouchers
REVENUES Taxes: Regular 271,946$ 1,037,542$ -$ Tax increment - 32,456 - Intergovernmental - - 4,452,380 Sale of real property - - - Program - 7,337 - Interest 7,689 - - Other 1,650 6,225 22,706 Total revenues 281,285 1,083,560 4,475,086
EXPENDITURES Current: General services 270,288 - 4,489,683 Development services - 308,155 - Debt service: Administrative charges - - - Interest - - - Principal retirement - - - Capital outlay - Development services - 1,999,688 - Total expenditures 270,288 2,307,843 4,489,683
Excess (deficiency) of revenues over expenditures 10,997 (1,224,283) (14,597)
OTHER FINANCING SOURCES (USES) Transfers to other funds - (342,000) - Transfers from other funds - - 80,000 Proceeds of obligations due to primary government - - - Total other financing sources (uses) - (342,000) 80,000
Net change in fund balance 10,997 (1,566,283) 65,403
Fund balance (deficit) - January 1 515,154 7,381,252 48,939
Fund balance (deficit) - December 31 526,151$ 5,814,969$ 114,342$
- 170 -

TIF TotalHousing Special Capital Governmental
Rehabilitation Revenue Projects Funds
591,799$ -$ -$ 1,901,287$ - 1,146,949 - 1,179,405
1,011,177 6,322 - 5,469,879 - - 80,043 80,043
785,956 - - 793,293 - - - 7,689 - - - 30,581
2,388,932 1,153,271 80,043 9,462,177
- - - 4,759,971 2,301,734 69,351 53,574 2,732,814
- 142 - 142 - 104,090 - 104,090 - 125,000 - 125,000
- 2,005,102 224,084 4,228,874 2,301,734 2,303,685 277,658 11,950,891
87,198 (1,150,414) (197,615) (2,488,714)
- - - (342,000) - - 202,000 282,000 - 2,045,000 - 2,045,000
- 2,045,000 202,000 1,985,000
87,198 894,586 4,385 (503,714)
1,394,260 (3,260,413) 38,755 6,117,947
1,481,458$ (2,365,827)$ 43,140$ 5,614,233$
EXHIBIT H-5
- 171 -

HOUSING AND REDEVELOPMENT AUTHORITYIN AND FOR THE CITY OF BLOOMINGTON
Reconciliation of the Schedule of Revenues,Eexpenditures, and Changes in Fund Balances ofGovernmental Funds to the Schedule of Activities
For The Year Ended December 31, 2016
NET CHANGE IN FUND BALANCES - TOTAL GOVERNMENTAL FUNDS (503,714)$
Amounts reported for governmental activities in the Schedule of Activities aredifferent because:
Governmental funds report capital outlay as expenditures. However, in theSchedule of Net Position, the cost of these assets is capitalized and depreciated over their estimated useful lives as depreciation expense:
Depreciation expense (1,256) (1,256)
Revenues in the Schedule of Activities related to delinquent property taxes thatdo not provide current financial resources are not reported as revenues in the funds. (624)
Revenues in the Schedule of Activities related to mortgages receivable that do notprovide current financial resources are not reported as revenues in the funds. 1,139,061
Revenues in the Schedule of Activities related to Inventory - land held for resale that do not provide current financial resources are not reported as revenues in the funds. 3,556,191
Repayment of principal on long-term debt (e.g., bonds, leases) is an expenditure in the governmental funds but does not affect the Schedule of Activities. 125,000
Proceeds of obligations due to primary government are treated as other financing sources in the governmental funds but reported as a increase in bonds payablein the Schedule of Net Position. (2,045,000)
Governmental funds report the effect of discounts and premiums when debt is first issued, whereas these amounts are deferred and amortized in the Schedule of Activities. 2,127
Change in accrued interest on general long-term debt is reported in the Schedule ofActivities but does not require the use of current financial resources and, therefore,is not reported as an expenditure in governmental funds. (466)
CHANGE IN NET POSITION OF GOVERNMENTAL ACTIVITIES 2,271,319$
EXHIBIT H-6
- 172 -

HOUSING AND REDEVELOPMENT AUTHORITYIN AND FOR THE CITY OF BLOOMINGTON
Schedule of Fund Net PositionProprietary Funds
December 31, 2016
Assisted PropertyRental Management Total
ASSETSCurrent assets: Cash and cash equivalents 436,553$ 72,919$ 509,472$ Total current assets 436,553 72,919 509,472
Noncurrent assets: Land 700,000 770,000 1,470,000 Buildings and structures 1,698,090 1,587,527 3,285,617 Accumulated depreciation (1,072,420) (1,011,188) (2,083,608) Total noncurrent assets 1,325,670 1,346,339 2,672,009
Total assets 1,762,223 1,419,258 3,181,481
LIABILITIESCurrent liabilities: Accounts payable 4,055 10,496 14,551 Due to primary government 17,285 9,872 27,157 Deposits payable 7,539 59,766 67,305 Total current liabilities 28,879 80,134 109,013
Noncurrent liabilities - Long-term debt - 1,574,720 1,574,720
Total liabilities 28,879 1,654,854 1,683,733
NET POSITION Net investment in capital assets 1,325,670 (228,381) 1,097,289 Unrestricted 407,674 (7,215) 400,459
Total net position 1,733,344$ (235,596)$ 1,497,748$
EXHIBIT H-7
- 173 -

HOUSING AND REDEVELOPMENT AUTHORITYIN AND FOR THE CITY OF BLOOMINGTON
Schedule of Revenues, Expenses, and Changes in Fund Net PositionProprietary Funds
Year Ended December 31, 2016
Assisted PropertyRental Management Total
OPERATING REVENUES Program income 284,218$ 193,921$ 478,139$ Other 7,008 2,775 9,783 Total operating revenues 291,226 196,696 487,922
OPERATING EXPENSES Salaries and benefits 130,858 81,509 212,367 Professional services 1,088 6,816 7,904 City support services 3,660 209 3,869 Purchased services 44,997 36,036 81,033 Home rehabilitation 82,952 168,443 251,395 Depreciation 49,937 48,233 98,170 Total operating expenses 313,492 341,246 654,738
Operating income (loss) (22,266) (144,550) (166,816)
Transfers from other funds - 60,000 60,000
Change in net position (22,266) (84,550) (106,816)
Total net position - January 1 1,755,610 (151,046) 1,604,564
Total net position - December 31 1,733,344$ (235,596)$ 1,497,748$
EXHIBIT H-8
- 174 -

HOUSING AND REDEVELOPMENT AUTHORITYIN AND FOR THE CITY OF BLOOMINGTON
Schedule of Cash FlowsProprietary Funds
Year Ended December 31, 2016
Assisted PropertyRental Management Total
CASH FLOWS FROM OPERATING ACTIVITIES Cash receipts from customers 291,226$ 196,696$ 487,922$ Payments to other funds 4,830 2,582 7,412 Payments to employees (130,858) (81,509) (212,367) Payments to suppliers (127,015) (217,959) (344,974) Net cash provided by (used in) operating activities 38,183 (100,190) (62,007)
CASH FLOWS FROM NONCAPITAL FINANCING ACTIVITIES Transfers from other funds - 60,000 60,000 Net cash provided by noncapital financing activities - 60,000 60,000
Net increase in cash and cash equivalents 38,183 (40,190) (2,007)
Cash and cash equivalents - January 1 398,370 113,109 511,479
Cash and cash equivalents - December 31 436,553$ 72,919$ 509,472$
Reconciliation of operating loss to net cash provided by (used in) operating activities: Operating income (loss) (22,266)$ (144,550)$ (166,816)$ Adjustments to reconcile operating loss to net cash provided by (used in) operating activities: Depreciation 49,937 48,233 98,170 Changes in assets and liabilities: Accounts payable 1,998 8,880 10,878 Deposits payable 24 (15,544) (15,520) Due to primary government 8,490 2,791 11,281 Net cash provided by (used in) operating activities 38,183$ (100,190)$ (62,007)$
EXHIBIT H-9
- 175 -

HOUSING AND REDEVELOPMENT AUTHORITYIN AND FOR THE CITY OF BLOOMINGTON
Schedule of Revenues, Expenditures, and Changes in Fund Balances - Budget and ActualGeneral Fund
Year Ended December 31, 2016
Budget VarianceWith
Original Final Actual Final BudgetREVENUES Taxes - Regular 278,714$ 278,714$ 271,946$ (6,768)$ Interest - - 7,689 7,689 Other - - 1,650 1,650 Total revenues 278,714 278,714 281,285 2,571
EXPENDITURES Current - General services 278,714 293,714 270,288 23,426 Total expenditures 278,714 293,714 270,288 23,426
Excess (deficiency) of revenues over expenditures - (15,000) 10,997 25,997
Fund balance - January 1 515,154 515,154 515,154 -
Fund balance - December 31 515,154$ 500,154$ 526,151$ 25,997$
EXHIBIT H-10
- 176 -

HOUSING AND REDEVELOPMENT AUTHORITYIN AND FOR THE CITY OF BLOOMINGTON
Schedule of Revenues, Expenditures, and Changes in Fund Balances - Budget and ActualHousing Development Fund
Year Ended December 31, 2016
Budget VarianceWith
Original Final Actual Final BudgetREVENUES Taxes: Regular 1,051,920$ 1,051,920$ 1,037,542$ (14,378)$ Tax increment 32,456 32,456 32,456 - Sale of real property 150,000 - - - Program 7,123 7,123 7,337 214 Other 6,320 6,320 6,225 (95) Total revenues 1,247,819 1,097,819 1,083,560 (14,259)
EXPENDITURES Current - Development services 190,618 350,618 308,155 42,463 Capital outlay - Development services 1,057,201 2,187,201 1,999,688 187,513 Total expenditures 1,247,819 2,537,819 2,307,843 229,976
Excess (deficiency) of revenues over expenditures - (1,440,000) (1,224,283) 215,717
OTHER FINANCING USES Transfers to other funds - (140,000) (342,000) 202,000
Net change in fund balance - (1,580,000) (1,566,283) 13,717
Fund balance - January 1 7,381,252 7,381,252 7,381,252 -
Fund balance - December 31 7,381,252$ 5,801,252$ 5,814,969$ 13,717$
EXHIBIT H-11
- 177 -

HOUSING AND REDEVELOPMENT AUTHORITY IN AND FOR THE CITY OF BLOOMINGTON
Schedule of Revenues, Expenditures, and Changes in Fund Balances - Budget and ActualSection 8 Vouchers Fund
Year Ended December 31, 2016
Budget VarianceWith
Original Final Actual Final BudgetREVENUES Intergovernmental 4,317,548$ 4,457,548$ 4,452,380$ (5,168)$ Other 16,000 16,000 22,706 6,706 Total revenues 4,333,548 4,473,548 4,475,086 1,538
EXPENDITURES Current - General services 4,333,548 4,508,548 4,489,683 18,865
Excess of revenues over expenditures - (35,000) (14,597) 20,403
OTHER FINANCING SOURCES Transfers from other funds - 80,000 80,000 -
Net change in fund balance - 45,000 65,403 20,403
Fund balance - January 1 48,939 48,939 48,939 -
Fund balance - December 31 48,939$ 93,939$ 114,342$ 20,403$
EXHIBIT H-12
- 178 -

HOUSING AND REDEVELOPMENT AUTHORITYIN AND FOR THE CITY OF BLOOMINGTON
Schedule of Revenues, Expenditures, and Changes in Fund Balances - Budget and ActualHousing Rehabilitation Fund
Year Ended December 31, 2016
Budget VarianceWith
Original Final Actual Final BudgetREVENUES Taxes - Regular 600,000$ 600,000$ 591,799$ (8,201)$ Intergovernmental 1,129,989 1,074,989 1,011,177 (63,812) Program 109,000 769,000 785,956 16,956 Total revenues 1,838,989 2,443,989 2,388,932 (55,057)
EXPENDITURES Current - Development services 1,838,989 2,378,989 2,301,734 77,255
Excess (deficiency) of revenues over (under) expenditures - 65,000 87,198 22,198
Fund balance - January 1 1,394,260 1,394,260 1,394,260 -
Fund balance - December 31 1,394,260$ 1,459,260$ 1,481,458$ 22,198$
EXHIBIT H-13
- 179 -

HOUSING AND REDEVELOPMENT AUTHORITYIN AND FOR THE CITY OF BLOOMINGTON
Combining Schedule of Assets, Liabilities, and Fund BalancesTIF Special Revenue Fund
December 31, 2016
France & Penn & Oxboro O-4 Old Shakopee American
ASSETS Cash and cash equivalents 11,034$ 43,903$ 131,747$ Taxes receivable 254 - - Inventory - land for resale - 267,700 - Total assets 11,288$ 311,603$ 131,747$
LIABILITIES AND FUND BALANCESCurrent liabilities - Accounts payable 11,288$ 5,680$ 1,445$ Due to other funds - 1,000,000 3,000,000 Total liabilities 11,288 1,005,680 3,001,445
DEFERRED INFLOWS OF RESOURCES Deferred inflow-land held for resale - 267,700 - Total deferred inflows of resources - 267,700 -
FUND BALANCES Restricted - - - Unassigned - (961,777) (2,869,698) Total fund balances - (961,777) (2,869,698) Total liabilities, deferred inflows ofresources and fund balances 11,288$ 311,603$ 131,747$
- 180 -

Lyndale Green Oxboro H-1 Knox & AmericanGO Tax Increment GO Tax Increment GO Tax Increment
Bonds 2004A Bonds 2003A Bonds 2016A Total
1,098,929$ 368,656$ 536$ 1,654,805$ 16 - - 270
- - 2,005,102 2,272,802 1,098,945$ 368,656$ 2,005,638$ 3,927,877$
1,535$ 954$ -$ 20,902$ - - - 4,000,000
1,535 954 - 4,020,902
- - 2,005,102 2,272,802 - - 2,005,102 2,272,802
1,097,410 367,702 536 1,465,648 - - - (3,831,475)
1,097,410 367,702 536 (2,365,827)
1,098,945$ 368,656$ 2,005,638$ 3,927,877$
EXHIBIT H-14
- 181 -

HOUSING AND REDEVELOPMENT AUTHORITYIN AND FOR THE CITY OF BLOOMINGTON
Combining Schedule of Revenues, Expenditures, and Changes in Fund BalancesTIF Special Revenue Fund
Year Ended December 31, 2016
France & Penn &Oxboro O-4 Old Shakopee American
REVENUES Taxes - Tax increment 22,576$ 2,528$ 640,316$ Intergovernmental - - 6,322 Total revenues 22,576 2,528 646,638
EXPENDITURES Current - Development services 22,576 3,367 1,555 Debt service: Administrative charges - - - Interest - - - Principal retirement - - - Capital outlay: Development services - - - Total expenditures 22,576 3,367 1,555
Excess (deficiency) of revenues over expenditures - (839) 645,083
OTHER FINANCING SOURCES (USES)
Proceeds from obligations due to primary government - - - Total other financing sources (uses) sources (uses) - - -
Net change in fund balance - (839) 645,083
Fund balance - January 1 - (960,938) (3,514,781)
Fund balance - December 31 -$ (961,777)$ (2,869,698)$
- 182 -

TIF Special RevenueLyndale Green Oxboro H-1 Knox & American
GO Tax Increment GO Tax Increment GO Tax IncrementBonds 2004A Bonds 2003A Bonds 2016A Total
388,700$ 92,829$ -$ 1,146,949$ - - - 6,322
388,700 92,829 - 1,153,271
1,536 955 39,362 69,351
71 71 - 142 76,890 27,200 - 104,090 95,000 30,000 - 125,000
- - 2,005,102 2,005,102 173,497 58,226 2,044,464 2,303,685
215,203 34,603 (2,044,464) (1,150,414)
- - 2,045,000 2,045,000
- - 2,045,000 2,045,000
215,203 34,603 536 894,586
882,207 333,099 - (3,260,413)
1,097,410$ 367,702$ 536$ (2,365,827)$
EXHIBIT H-15
- 183 -

- 184 -

- 185 -
CITY OF BLOOMINGTON, MINNESOTA
Comprehensive Annual Financial Report For the Year Ended December 31, 2016
SECTION III
STATISTICAL INFORMATION

- 186 -

- 187 -
CITY OF BLOOMINGTON, MINNESOTA STATISTICAL SECTION This part of the City of Bloomington’s Comprehensive Annual Financial Report presents detailed information as a context for understanding what the information in the financial statements, note disclosures, and required supplementary information says about the City’s overall financial health. CONTENTS PAGE Financial Trends 188
These tables contain trend information to help the reader understand how the City’s financial performance and well-being have changed over time.
Revenue Capacity 196
These tables contain information to help the reader assess the factors affecting the City’s ability to generate its property tax.
Debt Capacity 201
These tables present information to help the reader assess the affordability of the City’s current levels of outstanding debt and the City’s ability to issue additional debt in the future.
Demographic and Economic Information 208
These tables offer demographic and economic indicators to help the reader understand the environment within which the City’s financial activities take place and to help make comparisons over time and with other governments.
Operating Information 210
These tables contain information about the City’s operations and resources to help the reader understand how the City’s financial information relates to the services the City provides and the activities it performs.
Sources: Unless otherwise noted, the information in these tables is derived from the Comprehensive Annual Financial Reports for the relevant year.

CITY OF BLOOMINGTON, MINNESOTANET POSITION BY COMPONENTLast Ten Fiscal Years(Accrual Basis of Accounting)
2007 2008 2009 2010Governmental activities:
Net investment in capital assets $234,297,444 $232,922,311 $235,909,200 $237,427,493Restricted 26,841,630 27,895,072 32,235,051 32,602,549Unrestricted 106,939,521 124,055,525 123,811,008 127,671,490
Total governmental activities net position $368,078,595 $384,872,908 $391,955,259 $397,701,532
Business-type activities:Net investment in capital assets $78,786,554 $81,918,711 $82,916,273 $83,743,321Restricted 183,500 183,500 183,500 183,500Unrestricted 16,299,438 14,147,711 14,605,681 13,691,701
Total business-type activities net position $95,269,492 $96,249,922 $97,705,454 $97,618,522
Primary government:Net investment in capital assets $313,083,798 $314,841,022 $318,825,473 $321,170,814Restricted 27,025,130 28,078,572 32,418,551 32,786,049Unrestricted 123,238,959 138,203,236 138,416,689 141,363,191
Total primary government net position $463,347,887 $481,122,830 $489,660,713 $495,320,054
- 188 -

Table 1
Fiscal Year2011 2012 2013 2014 2015 2016
$239,452,569 $247,436,963 $269,230,824 $283,643,717 $300,117,784 $310,750,92978,893,688 82,269,101 91,045,904 67,294,971 68,599,352 73,405,14384,444,842 80,282,505 73,886,361 87,228,094 69,232,697 67,390,335
$402,791,099 $409,988,569 $434,163,089 $438,166,782 $437,949,833 $451,546,407
$84,427,251 $84,300,863 $84,457,359 $86,185,438 $85,388,894 $85,359,140183,500 183,500 - - - -
13,264,850 14,968,340 14,056,641 11,782,412 12,401,673 12,352,137$97,875,601 $99,452,703 $98,514,000 $97,967,850 $97,790,567 $97,711,277
$323,879,820 $331,737,826 $353,688,183 $369,829,155 $385,506,678 $396,110,06979,077,188 82,452,601 91,045,904 67,294,971 68,599,352 73,405,14397,709,692 95,250,845 87,943,002 99,010,506 81,634,370 79,742,472
$500,666,700 $509,441,272 $532,677,089 $536,134,632 $535,740,400 $549,257,684
- 189 -

CITY OF BLOOMINGTON, MINNESOTACHANGES IN NET POSITIONLast Ten Fiscal Years(Accrual Basis of Accounting)
2007 2008 2009 2010ExpensesGovernmental activities:
General services $6,551,564 $7,552,801 $7,749,164 $6,755,313Development services 12,936,734 11,446,884 10,440,313 10,201,540Public works 15,879,366 18,618,172 16,483,155 16,918,065Public safety 22,163,979 22,690,239 23,123,311 26,208,360Community services 11,085,832 11,204,261 11,501,567 12,593,495Interest on long-term debt 2,169,550 1,928,534 2,254,770 2,312,818
Total governmental activities expenses 70,787,025 73,440,891 71,552,280 74,989,591
Business-type activities:Water/wastewater 20,241,555 20,445,586 21,095,746 21,186,738Storm water 2,741,346 3,022,346 2,940,357 3,207,573Recreational facilities 5,035,848 5,244,075 5,180,193 5,193,546Other activities 1,868,510 2,515,841 2,190,527 2,097,085
Total business-type activities expenses 29,887,259 31,227,848 31,406,823 31,684,942
Total primary government expenses $100,674,284 $104,668,739 $102,959,103 $106,674,533
Program revenuesGovernmental activities:
Charges for services:General services $2,821,039 $2,721,079 $2,716,248 $3,034,137Development services 3,763,403 2,743,925 2,833,463 2,844,876Public works 709,361 250,770 1,275,586 795,439Public safety 889,046 835,721 759,798 916,777Community services 1,947,222 2,067,333 2,165,263 2,298,546
Operating grants and contributions 5,275,523 5,323,062 5,532,596 7,765,315Capital grants and contributions 16,640,764 20,075,161 16,448,770 11,273,508
Total governmental activities program revs 32,046,358 34,017,051 31,731,724 28,928,598
Business-type activities:Charges for services:
Water/wastewater 18,958,895 19,870,545 21,262,140 19,974,684Storm water 3,903,039 4,152,024 4,463,832 4,491,970Recreational facilities 3,412,322 3,747,232 3,694,046 3,695,146Other activities 1,663,392 1,905,193 1,991,306 1,949,741
Operating grants and contributions 286,829 783,997 39,369 16,768Capital grants and contributions - - - -
Total business-type activities program revs 28,224,477 30,458,991 31,450,693 30,128,309
Total primary government program revs $60,270,835 $64,476,042 $63,182,417 $59,056,907
Net (expense) revenue:Governmental activities (38,740,667) (39,423,840) (39,820,556) (46,060,993)Business-type activities (1,662,782) (768,857) 43,870 (1,556,633)
Total primary gov't net (expense) revenue ($40,403,449) ($40,192,697) ($39,776,686) ($47,617,626)
General revenues and other changes in net positionGovernmental activities:
Taxes:Property taxes $39,924,520 $40,957,857 $41,263,207 $41,994,611Business taxes 6,529,409 6,818,771 5,808,668 6,200,706
Unrestricted grants and contributions 1,267,909 1,203,893 1,179,388 1,167,739Gain on sale of capital assets - 30,545 7,491 99,283Investment earnings 6,377,834 6,936,739 2,649,119 2,562,594Transfers 16,602 (24,000) (265,927) (217,667)
Total governmental activities 54,116,274 55,923,805 50,641,946 51,807,266
Business-type activities:Taxes 751,318 768,967 872,387 1,001,875Gain on sale of capital assets - - 809 7,481Investment earnings 944,397 775,794 272,539 242,678Transfers (16,602) 24,000 265,927 217,667
Total business-type activities 1,679,113 1,568,761 1,411,662 1,469,701
Total primary government $55,795,387 $57,492,566 $52,053,608 $53,276,967
Change in net position:Governmental activities $15,375,607 $16,499,965 $10,821,390 $5,746,273Business-type activities 16,331 799,904 1,455,532 (86,932)
Total primary government $15,391,938 $17,299,869 $12,276,922 $5,659,341
- 190 -

Table 2
Fiscal Year2011 2012 2013 2014 2015 2016
$7,255,182 $7,185,895 $7,527,901 $7,702,188 $7,574,572 $9,615,4719,993,980 9,686,546 12,006,241 23,261,857 11,120,055 18,533,117
16,787,405 14,229,217 15,162,908 15,620,844 15,922,887 19,389,39326,751,391 26,245,526 28,124,185 29,695,195 30,927,415 35,429,02512,532,613 14,787,079 15,894,544 15,720,340 15,987,952 18,455,4512,140,825 2,236,062 3,145,420 1,767,122 1,587,935 1,537,926
75,461,396 74,370,325 81,861,199 93,767,546 83,120,816 102,960,383
21,876,605 21,927,951 22,804,577 23,004,075 23,091,127 24,967,5193,205,055 3,181,680 3,229,686 3,446,390 3,453,095 3,693,3025,290,940 5,372,380 5,459,451 5,781,663 5,620,253 6,269,4052,272,292 2,294,436 2,479,382 2,851,567 4,285,676 5,788,056
32,644,892 32,776,447 33,973,096 35,083,695 36,450,151 40,718,282
$108,106,288 $107,146,772 $115,834,295 $128,851,241 $119,570,967 $143,678,665
$3,002,960 $2,999,283 $3,117,163 $3,500,551 $3,906,587 $3,084,5793,482,579 3,601,313 3,692,808 5,166,271 5,788,420 4,551,060
926,935 433,640 352,955 385,274 85,841 216,346623,482 564,118 664,015 511,613 559,691 578,786
2,141,239 2,378,476 2,294,859 2,150,551 2,084,066 2,178,8297,250,512 5,407,043 6,277,517 6,524,865 7,103,296 7,838,532
13,390,833 14,166,562 32,781,014 16,172,833 17,377,334 27,077,93630,818,540 29,550,435 49,180,331 34,411,958 36,905,235 45,526,068
19,800,214 20,954,786 20,575,176 20,578,287 21,412,966 23,562,1784,373,221 4,519,242 4,736,151 4,873,273 5,269,105 5,528,9443,485,848 3,445,419 3,412,602 3,448,585 3,710,670 3,749,8562,119,848 2,349,498 2,137,718 2,264,970 3,617,012 5,242,313
78,763 267,591 592,432 854,174 519,824 335,884179 36 - - 245,654 584,363
29,858,073 31,536,572 31,454,079 32,019,289 34,775,231 39,003,538
$60,676,613 $61,087,007 $80,634,410 $66,431,247 $71,680,466 $84,529,606
(44,642,856) (44,819,890) (32,680,868) (59,355,588) (46,215,581) (57,434,315)(2,786,819) (1,239,875) (2,519,017) (3,064,406) (1,674,920) (1,714,744)
($47,429,675) ($46,059,765) ($35,199,885) ($62,419,994) ($47,890,501) ($59,149,059)
$40,962,947 $43,284,520 $44,775,678 $46,752,023 $48,881,455 $51,260,2646,874,548 7,010,018 8,906,394 14,222,910 14,412,263 16,936,3411,593,424 1,232,810 1,202,154 1,850,619 2,877,947 1,977,371
82,023 58,760 70,765 4,275 163,564 87,9422,002,925 1,551,127 513,017 1,508,213 1,061,308 901,701
(1,783,444) (1,535,643) (189,469) (978,759) (5,267) (132,730)49,732,423 51,601,592 55,278,539 63,359,281 67,391,270 71,030,889
1,092,948 1,253,288 1,366,798 1,451,140 1,414,133 1,427,9846,367 - - - - 21,000
161,139 28,046 24,047 88,357 78,237 53,7401,783,444 1,535,643 189,469 978,759 5,267 132,7303,043,898 2,816,977 1,580,314 2,518,256 1,497,637 1,635,454
$52,776,321 $54,418,569 $56,858,853 $65,877,537 $68,888,907 $72,666,343
$5,089,567 $6,781,702 $22,597,671 $4,003,693 $21,175,689 $13,596,574257,079 1,577,102 (938,703) (546,150) (177,283) (79,290)
$5,346,646 $8,358,804 $21,658,968 $3,457,543 $20,998,406 $13,517,284
- 191 -

CITY OF BLOOMINGTON, MINNESOTA
FUND BALANCES, GOVERNMENTAL FUNDS
Last Ten Fiscal Years
(Modified Accrual Basis of Accounting)
2007 2008 2009 2010General Fund:
Reserved $622,847 $316,429 $261,546 $328,007Unreserved 18,300,838 19,388,591 19,650,614 19,122,276Fund balance:
Nonspendable - - - - Restricted - - - - Assigned - - - - Committed - - - - Unassigned - - - - Total general fund $18,923,685 $19,705,020 $19,912,160 $19,450,283
All other governmental funds:Reserved $15,911,503 $11,866,315 $12,561,450 $13,047,049Unreserved, designated, reported in:
Special revenue funds 5,266,190 4,989,824 4,615,480 8,152,553Capital projects funds 59,561,910 72,251,099 71,551,551 65,668,487
Unreserved, undesignated, reported in -Special revenue funds (96,377) - - -
Fund balance:Nonspendable - - - - Restricted - - - - Committed - - - - Assigned - - - - Unassigned - - - - Total all other governmental funds $80,643,226 $89,107,238 $88,728,481 $86,868,089
Note: The City implemented GASB Statement No. 54 for the fiscal year ended December 31, 2011.Information for years prior to 2011 is presented in accordance with fund balance classifications in effect at the time.
- 192 -

Table 3
Fiscal Year2011 2012 2013 2014 2015 2016
$ - $ - $ - $ - $ - $ - - - - - - -
- - - 3,952 - 4,337 - - - - - - - - - - - -
1,007,844 712,554 571,066 1,250,496 1,259,003 1,179,42118,997,494 19,979,183 20,344,235 23,388,858 26,700,761 27,625,954
$20,005,338 $20,691,737 $20,915,301 $24,643,306 $27,959,764 $28,809,712
$ - $ - $ - $ - $ - $ -
- - - - - - - - - - - -
- - - - - -
- - - - 20,585 17,00058,933,054 63,348,535 73,455,034 49,590,387 51,864,823 56,454,79413,096,599 12,621,177 11,155,740 6,375,212 6,494,362 7,376,66621,312,731 17,996,032 16,211,514 19,649,729 21,353,926 25,620,010
- - - - - - $93,342,384 $93,965,744 $100,822,288 $75,615,328 $79,733,696 $89,468,470
- 193 -

CITY OF BLOOMINGTON, MINNESOTA
CHANGES IN FUND BALANCES, GOVERNMENTAL FUNDS
Last Ten Fiscal Years
2007 2008 2009 2010Revenues: Taxes $38,604,975 $40,277,913 $41,277,481 $42,020,340 Lodging and admissions taxes 6,529,409 6,818,771 5,808,668 6,200,709 Licenses, fees and permits 4,562,365 3,774,304 3,732,882 3,623,605 Fines and penalties 1,375,256 1,277,684 1,185,711 1,515,366 Charges for services 2,594,882 2,669,727 2,726,102 2,894,200 Special assessments 2,048,460 2,572,993 2,873,470 3,210,522 Intergovernmental 13,248,739 9,145,167 9,120,682 9,041,238 Investment earnings 4,980,416 5,651,222 2,100,221 2,054,891 Other revenues 8,780,360 10,544,436 9,691,594 8,132,865 Total revenues 82,724,862 82,732,217 78,516,811 78,693,736
Expenditures: Current: General services 5,513,732 5,624,310 6,024,864 5,368,743 Development services 9,569,608 8,481,077 7,996,300 15,408,814 Public works 11,175,235 11,491,947 11,756,830 11,909,318 Public safety 21,067,496 21,748,003 22,617,035 25,500,113 Community services 9,962,691 10,380,435 10,754,056 11,658,659 Debt service: Paying agent fees 191,853 60,689 76,932 88,308 Interest 1,708,961 2,196,443 1,936,789 1,961,215 Principal retirement 3,125,000 9,345,000 4,610,000 4,335,000 Capital outlay: General services - 22,522 - - Development services 162,767 4,251,155 3,182,677 2,797,431 Public works 10,542,665 9,944,230 9,787,120 8,553,896 Public safety 276,882 281,249 125,671 759,463 Community services 270,224 1,061,763 912,968 865,036District decertified - repayment of tax increments 1,054,532 - - - Total expenditures 74,621,646 84,888,823 79,781,242 89,205,996
Revenues over (under) expenditures 8,103,216 (2,156,606) (1,264,431) (10,512,260)
Other financing sources (uses): Bonds issued 11,505,000 9,570,000 7,835,000 8,445,000 Bond premiums 89,705 213 (59,155) 15,426 Bond discounts - - - (18,998) Proceeds capital assets - 2,194,455 - - Transfers in 4,540,495 6,059,851 7,860,345 14,113,607 Transfers out (5,011,494) (6,543,471) (10,804,337) (14,365,044) Total other financing sources (uses) 11,123,706 11,281,048 4,831,853 8,189,991
Net change in fund balance $19,226,922 $9,124,442 $3,567,422 ($2,322,269)
Debt service as a percentage of noncapital expenditures 8.1% 16.5% 9.9% 8.2%
Debt service as percentage of total expenditures 6.5% 13.6% 8.2% 7.1%
Fiscal Year
- 194 -

Table 4
2011 2012 2013 2014 2015 2016
$41,365,118 $43,092,371 $45,485,284 $46,756,493 $48,852,186 $51,277,1516,874,548 7,010,018 8,906,395 14,222,909 14,412,263 16,936,3524,474,072 4,648,260 4,679,509 5,864,807 6,241,921 4,743,7481,376,797 1,283,725 1,493,871 1,216,254 1,251,693 1,057,5182,744,425 2,961,413 2,771,138 3,021,925 3,116,814 2,908,5513,809,554 4,438,899 3,738,367 3,645,884 4,469,106 3,943,2129,804,326 10,125,744 14,575,098 14,745,267 17,553,679 14,435,8161,645,392 1,239,085 448,813 1,250,209 833,337 701,2358,961,650 8,077,401 21,432,708 8,612,823 9,870,031 16,056,456
81,055,882 82,876,916 103,531,183 99,336,571 106,601,030 112,060,039
5,332,137 5,741,888 6,301,804 6,804,893 6,741,110 7,431,2747,454,595 11,742,179 9,548,984 19,400,112 8,479,242 14,926,374
11,613,863 9,362,745 10,007,731 10,464,616 9,989,225 10,778,98626,191,631 25,733,989 27,490,143 28,984,753 29,692,500 32,045,68611,683,752 13,979,633 14,983,442 14,709,288 15,396,539 16,131,465
227,284 281,170 136,333 43,887 - - 2,203,535 2,074,532 2,342,029 1,973,965 1,697,056 1,680,1805,020,000 7,765,000 8,720,000 17,645,000 7,895,000 6,975,000
- - - 238,249 - 278,4501,800,019 2,735,526 17,709,054 12,057,284 14,577,484 10,555,736
11,780,955 11,225,868 8,076,371 11,681,648 9,044,239 12,314,905640,353 269,002 607,105 80,704 510,613 90,429
1,310,704 964,706 750,975 1,779,496 979,392 496,599 - - - - - -
85,258,828 91,876,238 106,673,971 125,863,895 105,002,400 113,705,084
(4,202,946) (8,999,322) (3,142,788) (26,527,324) 1,598,630 (1,645,045)
12,720,000 11,515,000 9,315,000 7,465,000 5,355,000 11,455,000202,010 882,240 476,462 177,674 400,749 637,349 - - - - - - - - - - - -
7,509,683 5,748,790 6,205,652 4,213,697 7,268,816 8,063,372(9,199,397) (7,836,949) (7,351,067) (6,808,000) (7,188,369) (7,925,954)11,232,296 10,309,081 8,646,047 5,048,371 5,836,196 12,229,767
$7,029,350 $1,309,759 $5,503,259 ($21,478,953) $7,434,826 $10,584,722
10.3% 12.8% 13.8% 19.4% 12.0% 9.6%
8.5% 10.7% 10.4% 15.6% 9.1% 7.6%
- 195 -

CITY OF BLOOMINGTON, MINNESOTA
TAX CAPACITY VALUE AND ESTIMATED MARKET VALUE OF TAXABLE PROPERTY
Last Ten Fiscal Years
Fiscal Less:Year Commercial/ Total Fiscal
Ended Residential Industrial All Tax DisparityDecember 31 Property (a) Property Other (b) Capacity (c) Contribution (d)
2007 $79,432,988 $64,100,590 $1,603,052 $145,136,630 $14,054,146
2008 81,208,773 74,938,304 1,626,746 157,773,823 15,034,222
2009 79,090,466 78,899,492 1,603,754 159,593,712 22,292,418
2010 74,813,460 73,876,662 1,541,063 150,231,185 23,270,711
2011 70,275,703 66,648,996 1,642,367 138,567,066 21,615,548
2012 63,662,004 66,632,744 1,616,795 131,911,543 19,235,462
2013 60,099,901 69,646,814 1,792,190 131,538,905 18,610,390
2014 59,132,614 70,232,985 2,004,039 131,369,638 15,255,532
2015 64,894,848 70,943,301 2,072,962 137,911,111 11,956,404
2016 70,536,480 81,279,393 2,113,468 153,929,341 12,505,688
Source: City of Bloomington Assessing Division
By State Statute, property taxes are calculated and collected based on the prior year's assessor market value.For example, the tax capacity and market value figures for payable 2016 above relate to the January 2, 2015 assessment.
(a) Includes single-family homes, condominiums, townhouses, cooperatives, apartments and residential vacant land. (b) Includes personal property accounts and utilities/machinery classification.(c) Includes properties in tax increment financing (TIF) districts, the majority of which are commercial/industrial.(d) Figure represents fiscal disparities contribution net of fiscal disparities distribution. (e) Figure represents total tax capacity less net fiscal disparities. Note that total direct tax rate in the next column is calculated based on total tax capacity less fiscal disparities contribution and less tax capacity in TIF districts.
- 196 -
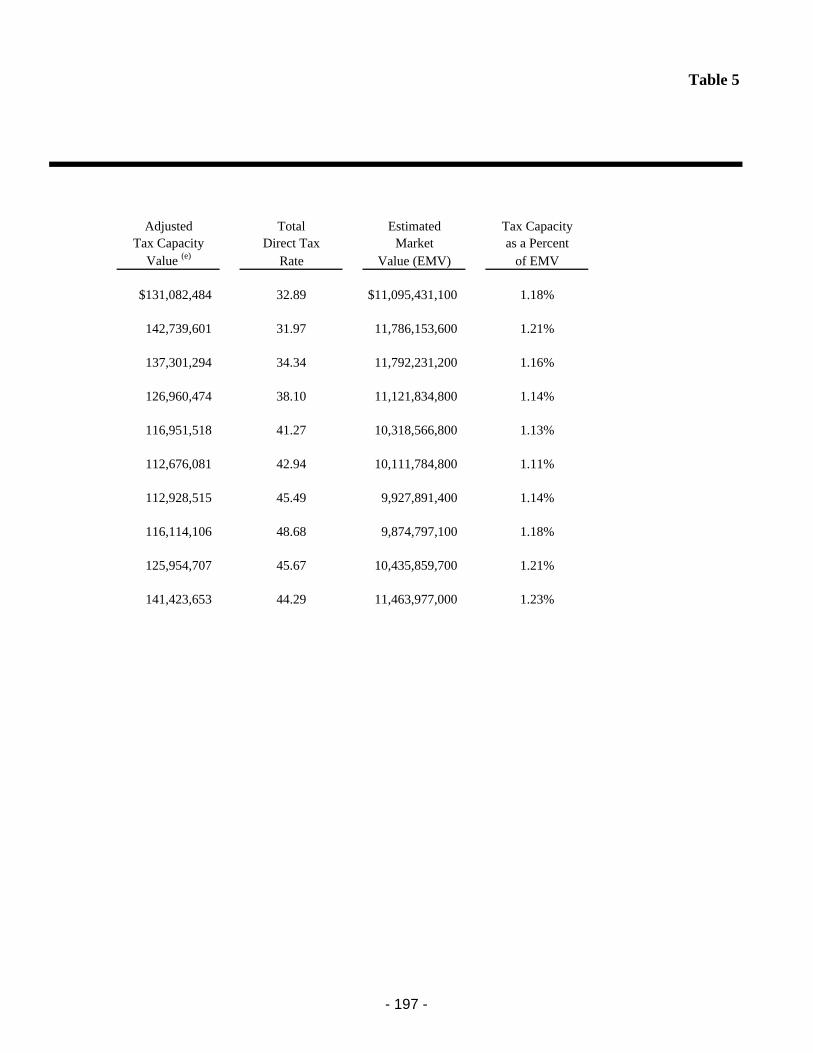
Table 5
Adjusted Total Estimated Tax CapacityTax Capacity Direct Tax Market as a Percent
Value (e) Rate Value (EMV) of EMV
$131,082,484 32.89 $11,095,431,100 1.18%
142,739,601 31.97 11,786,153,600 1.21%
137,301,294 34.34 11,792,231,200 1.16%
126,960,474 38.10 11,121,834,800 1.14%
116,951,518 41.27 10,318,566,800 1.13%
112,676,081 42.94 10,111,784,800 1.11%
112,928,515 45.49 9,927,891,400 1.14%
116,114,106 48.68 9,874,797,100 1.18%
125,954,707 45.67 10,435,859,700 1.21%
141,423,653 44.29 11,463,977,000 1.23%
- 197 -

CITY OF BLOOMINGTON, MINNESOTADIRECT AND OVERLAPPING PROPERTY TAX RATES Table 6
Last Ten Fiscal Years
Direct Rate - City of Bloomington Overlapping Rates*Fiscal School OtherYear Operating Debt Total District County Districts Total
2007 30.31 2.58 32.89 15.61 39.11 9.73 97.34
2008 29.65 2.32 31.97 17.26 38.58 9.82 97.63
2009 31.65 2.69 34.34 17.42 40.41 9.93 102.10
2010 35.41 2.69 38.10 19.31 42.64 11.10 111.15
2011 37.96 3.31 41.27 21.90 45.84 12.30 121.31
2012 39.48 3.46 42.94 22.46 48.23 12.75 126.38
2013 41.68 3.80 45.48 26.76 49.46 13.21 134.91
2014 44.42 4.26 48.68 28.18 49.96 13.92 140.74
2015 41.98 3.69 45.67 25.74 46.40 12.76 130.57
2016 40.95 3.34 44.29 24.25 45.36 12.38 126.28
Sources: Hennepin County and City of Bloomington Assessing Division
*Overlapping rates are those of local and county governments that apply to property owners within the City. Not all overlapping rates apply to all City property owners. Although County property tax rates apply to all City property owners, the Other Districts rates apply only to property owners whose property is located within certain geographic boundaries. For example, a small percentage of Bloomington taxpayers pay school district taxes to schools in neighboring communities. Also, the Other Districts rates include Watershed taxing districts, of which there are four different rates depending on location of parcels in Bloomington.
- 198 -

CITY OF BLOOMINGTON, MINNESOTAPRINCIPAL PROPERTY TAXPAYERS Table 7Current Year and Nine Years Ago
Percentage Percentage Taxable of Total City Taxable of Total CityCapacity Capacity Capacity Capacity
Taxpayer Value Rank Value Value Rank Value
Mall of America $18,300,554 (a) 1 11.89% $12,126,422 (a) 1 8.36%
Metropolitan Life Insurance 6,680,000 (b) 2 4.34% - (b) - -
Kraus-Anderson 2,197,066 3 1.43% 1,682,022 4 1.16%
Carlson Companies 1,592,426 4 1.03% - - -
Gramercy Property Trust 1,582,580 5 1.03% - - -
Liberty Property LP 1,471,260 6 0.96% 1,419,012 5 0.98%
Frauenshuh 1,111,259 7 0.72% - - -
Artis REIT 1,028,020 8 0.67% - - -
DRA Advisors 1,017,260 9 0.66% - - -
KBS Capital Advisors 1,012,000 10 0.66% - - -
Teachers Insurance and Annuity - - - 4,393,692 (b) 2 3.03%
United Properties - - - 2,602,022 3 1.79%
Duke Realty LP - - - 1,079,340 6 0.74%
Bloomington Central Station - - - 1,015,522 7 0.70%
Gateway Lake Properties - - - 937,444 8 0.65%
Bloomgate Holdings - - - 892,994 9 0.62%
Ryan Properties - - - 857,138 10 0.59%
Total $35,992,425 23.38% $27,005,608 18.61%
Total All Property $153,929,341 $145,136,630
Source: City of Bloomington Assessing Division
Note: Tax capacity values above relate to the prior year's assessment.
(a) Market value in the existing Mall of America TIF districts will become part of the local tax base starting in 2017 for Phase I and 2019 for Phase II.(b) Normandale Lake Office Park sold by Teachers Insurance to Equity Group in August 2012.
Payable 2016 Payable 2007
- 199 -

CITY OF BLOOMINGTON, MINNESOTAPROPERTY TAX LEVIES AND COLLECTIONS Table 8Last Ten Fiscal Years
Fiscal Taxes DelinquentYear Levied Collections in
Ended For The Percentage Subsequent Percentage
December 31, Fiscal Year Amount of Levy Years (a) Amount of Levy
2007 $38,800,770 $38,607,066 99.50% $66,373 $38,673,439 99.67%
2008 40,853,864 40,456,342 99.03% 207,117 40,663,459 99.53%
2009 41,936,879 41,636,622 99.28% 138,949 41,775,571 99.62%
2010 43,230,933 42,603,925 98.55% 52,061 42,655,986 98.67%
2011 43,002,753 42,520,657 98.88% (438,381) 42,082,276 97.86%
2012 44,441,371 44,134,422 99.31% (224,425) 43,909,997 98.80%
2013 46,641,219 46,450,282 99.59% (86,072) 46,364,210 99.41%
2014 48,049,784 47,836,890 99.56% (156,495) 47,680,395 99.23%
2015 49,971,775 49,888,157 99.83% (25,883) 49,862,274 99.78%
2016 52,845,452 52,561,489 99.46% (336,619) 52,224,870 98.83%
Source: City of Bloomington Finance Department
(a) Negative amounts in the "Collection in Subsequent Years" column reflect reductions of assessed property values.
Fiscal Year of the LevyCollected Within The
Total Collections to Date
- 200 -
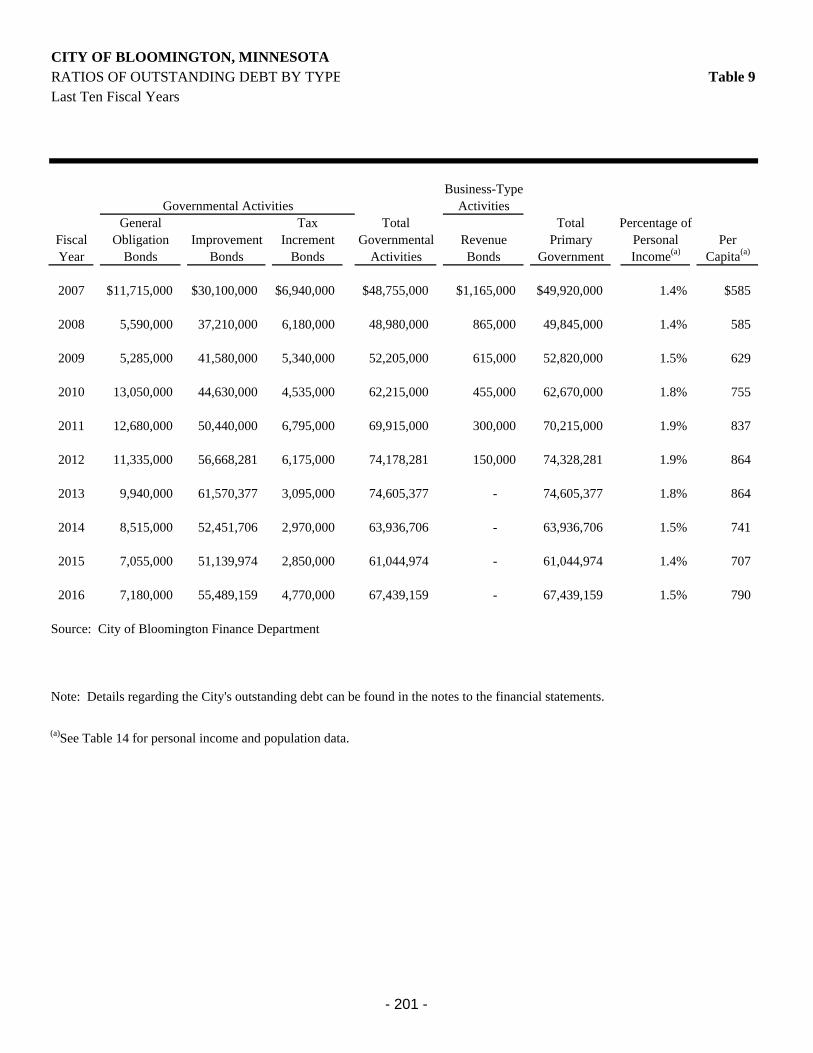
CITY OF BLOOMINGTON, MINNESOTARATIOS OF OUTSTANDING DEBT BY TYPE Table 9Last Ten Fiscal Years
Business-TypeGovernmental Activities Activities
General Tax Total Total Percentage ofFiscal Obligation Improvement Increment Governmental Revenue Primary Personal PerYear Bonds Bonds Bonds Activities Bonds Government Income(a) Capita(a)
2007 $11,715,000 $30,100,000 $6,940,000 $48,755,000 $1,165,000 $49,920,000 1.4% $585
2008 5,590,000 37,210,000 6,180,000 48,980,000 865,000 49,845,000 1.4% 585
2009 5,285,000 41,580,000 5,340,000 52,205,000 615,000 52,820,000 1.5% 629
2010 13,050,000 44,630,000 4,535,000 62,215,000 455,000 62,670,000 1.8% 755
2011 12,680,000 50,440,000 6,795,000 69,915,000 300,000 70,215,000 1.9% 837
2012 11,335,000 56,668,281 6,175,000 74,178,281 150,000 74,328,281 1.9% 864
2013 9,940,000 61,570,377 3,095,000 74,605,377 - 74,605,377 1.8% 864
2014 8,515,000 52,451,706 2,970,000 63,936,706 - 63,936,706 1.5% 741
2015 7,055,000 51,139,974 2,850,000 61,044,974 - 61,044,974 1.4% 707
2016 7,180,000 55,489,159 4,770,000 67,439,159 - 67,439,159 1.5% 790
Source: City of Bloomington Finance Department
Note: Details regarding the City's outstanding debt can be found in the notes to the financial statements.
(a)See Table 14 for personal income and population data.
- 201 -

CITY OF BLOOMINGTON, MINNESOTARATIOS OF GENERAL BONDED DEBT OUTSTANDING Table 10Last Ten Fiscal Years
General Obligation Debt NetGeneral Tax Less Percentage of Bonded
Fiscal Obligation Improvement Increment Debt Service Net Estimated Market Debt PerYear Bonds Bonds Bonds Total Fund Balance Bonded Debt Value of Property(a) Capita(b)
2007 $11,715,000 $30,100,000 $6,940,000 $48,755,000 $15,040,665 $33,714,335 0.30% 395
2008 5,590,000 37,210,000 6,180,000 48,980,000 10,943,810 38,036,190 0.32% 446
2009 5,285,000 41,580,000 5,340,000 52,205,000 11,586,697 40,618,303 0.34% 483
2010 13,050,000 44,630,000 4,535,000 62,215,000 12,016,405 50,198,595 0.45% 605
2011 12,680,000 50,440,000 6,795,000 69,915,000 17,950,997 51,964,003 0.50% 619
2012 11,335,000 56,668,281 6,175,000 74,178,281 23,572,558 50,605,723 0.50% 588
2013 9,940,000 61,570,377 3,095,000 74,605,377 27,682,370 46,923,007 0.47% 544
2014 8,515,000 52,451,706 2,970,000 63,936,706 17,590,028 46,346,678 0.47% 537
2015 7,055,000 51,139,974 2,850,000 61,044,974 18,208,674 42,836,300 0.41% 496
2016 7,180,000 55,489,159 4,770,000 67,439,159 23,725,327 43,713,832 0.38% 512
Source: City of Bloomington Finance Department
Note: Details regarding the City's outstanding debt can be found in the notes to the financial statements.(a)See Table 5 for estimated market value data.(b)See Table 14 for population data.
- 202 -

CITY OF BLOOMINGTON, MINNESOTADIRECT AND OVERLAPPING GOVERNMENTAL ACTIVITIES DEBT Table 11December 31, 2016
EstimatedEstimated Share of
Debt Percentage Overlapping
Governmental Unit Outstanding Applicable (a) Debt
Debt repaid with property taxes:School Districts:
ISD No. 271 $53,600,000 99.90% $53,546,400ISD No. 272 60,970,000 0.42% 256,074 ISD No. 273 172,010,000 1.44% 2,476,944
Other debt:Hennepin County 838,110,000 8.10% 67,886,910 Hennepin County Park District 62,125,000 11.26% 6,995,275 Hennepin Regional RR Authority 33,145,000 11.26% 3,732,127 Metropolitan Council 189,226,614 4.11% 7,777,214
Subtotal - overlapping debt 142,670,944
City direct debt (b) 67,439,159 100.00% 67,439,159
Total direct and overlapping debt $210,110,103
Source: Hennepin County
Note: Overlapping governments are those that coincide, at least in part, with the geographic boundaries of the City. Thisschedule estimates the portion of the outstanding debt of those overlapping governments that is borne by the residentsand businesses of the City. This process recognizes that, when considering the City's ability to issue and repay long-termdebt, the entire debt burden borne by the residents and businesses should be taken into account. However, this does notimply that every taxpayer is a resident, and therefore responsible for repaying the debt, of each overlapping government.
(a) The percentage of overlapping debt applicable is estimated using the taxable market values. Applicable percentageswere estimated by determining the portion of the county's and school district's taxable market value that is within theCity's boundaries.(b) Excludes revenue bonded indebtedness.
- 203 -

CITY OF BLOOMINGTON, MINNESOTALEGAL DEBT MARGIN INFORMATIONLast Ten Fiscal Years
2007 2008 2009 2010
Debt limit $235,806,328 $353,327,586 $353,157,039 $333,655,044
Total net debt applicable to limit (a) 4,931,655 5,009,500 4,638,800 6,457,546
Legal debt margin $230,874,673 $348,318,086 $348,518,239 $327,197,498
Total net debt applicable to the limit as a percentageof debt limit 2.09% 1.42% 1.31% 1.94%
Source: City of Bloomington Finance Department
Note: Under State finance law, Minnesota Statute 475.53, the City's outstanding general obligation debt should not exceed 3% of total assessed market value. The general obligation debt subject to the limitation is offset by amounts set aside for repaying general obligation bonds.
In 2008, the debt limit increased from 2% of total assessed market value to 3% of total assessed market value.
For example, in 2016 the debt limit was $343,919,310, the total net debt applicable to the limit was $3,884,062, and the City could issue up to an additional $340,035,248 of general obligation debt and still be in compliance with the above statute.
- 204 -

Table 12
2011 2012 2013 2014 2015 2016
$309,557,004 $303,353,544 $297,836,742 $296,243,913 $313,075,791 $343,919,310
10,924,513 9,493,644 8,047,547 6,557,605 5,039,777 3,884,062
$298,632,491 $293,859,900 $289,789,195 $289,686,308 $308,036,014 $340,035,248
3.53% 3.13% 2.70% 2.21% 1.61% 1.13%
Market value $11,463,977,000Debt limit (3% of market value) 343,919,310Debt applicable to limit:
General obligation bonds 7,180,000Less: Amount set aside for repayment
of general obligation debt (3,295,938)Total net debt applicable to limit 3,884,062
Legal debt margin $340,035,248
Legal Debt Margin Calculation for Fiscal Year 2016
- 205 -

CITY OF BLOOMINGTON, MINNESOTAPLEDGED-REVENUE COVERAGELast Ten Fiscal Years
Pledged Less NetFiscal Service Operating AvailableYear Charges Expenses Revenue Principal Interest Coverage
2007 $7,360,667 $6,094,601 $1,266,066 $365,000 $54,676 3.02
2008 7,899,256 6,521,853 1,377,403 300,000 41,496 4.03
2009 8,117,878 6,444,332 1,673,546 250,000 30,260 5.97
2010 1,432,860 1,085,440 347,420 160,000 21,998 1.91
2011 1,420,357 1,136,811 283,546 155,000 15,739 1.66
2012 1,344,365 1,135,713 208,652 150,000 3,188 1.36
2013 - - - - - 0.00
2014 - - - - - 0.00
2015 - - - - - 0.00
2016 - - - - - 0.00
Source: City of Bloomington Finance Department
(a) Storm water utility bonds were paid off in 2009. From 2010 to 2012, the remaining enterprise bonds had pledged revenues from the Ice Garden activity in the Recreational Facilities Fund.
(b) Both improvement bonds and tax increment bonds are general obligation bonds and have tax levy authority to cover all debt requirements.
Note: Details regarding the City's outstanding debt can be found in the notes to the financial statements.Operating expenses do not include depreciation.
Debt Service
Enterprise Revenue Bonds (a)
- 206 -

Table 13
Special TaxAssessment IncrementCollections Principal Interest Coverage Collections Principal Interest Coverage
$2,048,460 $1,920,000 $711,974 0.78 $1,147,754 $650,000 $387,888 1.11
2,518,754 2,460,000 1,043,280 0.72 1,414,486 760,000 354,440 1.27
2,836,610 3,465,000 1,356,869 0.59 1,282,134 840,000 311,380 1.11
3,176,372 3,185,000 1,453,531 0.68 1,189,685 805,000 266,984 1.11
3,693,237 3,815,000 1,539,217 0.69 1,004,967 835,000 222,090 0.95
4,420,188 6,335,000 1,562,573 0.56 827,103 620,000 181,475 1.03
3,718,701 4,810,000 1,805,825 0.56 455,351 165,000 139,573 1.50
3,440,152 16,660,000 1,576,016 0.19 723,577 125,000 111,440 3.06
4,278,664 6,890,000 1,329,972 0.52 885,766 120,000 107,765 3.89
3,752,488 5,940,000 1,320,498 0.52 1,179,405 125,000 104,090 5.15
Debt Service
Tax Increment Bonds (b)Improvement Bonds (b)
Debt Service
- 207 -

CITY OF BLOOMINGTON, MINNESOTADEMOGRAPHIC AND ECONOMIC STATISTICS Table 14Last Ten Fiscal Years
PerTotal Capita Public
Fiscal Personal Personal School Unemployment Rate (4)Year Population (1) Income (2) Income (2) Enrollment (3) Metropolitan Area Bloomington
2007 85,389 $3,503,852,226 $41,034 10,359 4.5% 4.1%
2008 85,238 $3,645,799,736 42,772 10,307 6.4 6.2
2009 84,034 $3,491,780,768 41,552 10,170 7.2 7.0
2010 83,038 $3,557,597,034 42,843 10,242 6.5 6.2
2011 83,896 $3,747,802,112 44,672 10,240 5.5 5.2
2012 86,033 $3,977,047,491 46,227 10,228 5.1 4.9
2013 86,319 $4,130,882,064 47,856 10,030 4.3 4.1
2014 86,314 $4,204,441,254 48,711 10,005 3.2 3.0
2015 86,435 $4,368,511,335 50,541 9,980 3.2 2.9
2016 85,319 $4,446,570,323 52,117 10,273 3.6 3.4
Sources: (1) U.S. Census estimates were used for 2010 through 2016 and Metropolitan Council estimates were used for prior years(2) Minnesota per capita income, as published by Bureau of Economic Analysis(3) Bloomington School Districts #271(4) Minnesota Department of Employment and Economic Development, based on December rates
- 208 -

CITY OF BLOOMINGTON, MINNESOTAPRINCIPAL EMPLOYERS Table 15Current Year and Nine Years Ago
Percentage Percentageof Total of Total
City CityEmployer Employees (1) Rank Employment (2) Employees (1) Rank Employment (2)
Mall of America Tenants 13,000 1 14% 13,000 1 14%HealthPartners 3,234 2 4% 2,275 3 3%Bloomington School District #271 1,940 3 2% 1,800 4 2%Seagate Technology 1,580 4 2% 2,300 2 3%Donaldson Company 1,002 5 1% 1,300 6 1%Toro Company 990 6 1% 980 7 1%NCS Pearson 959 7 1% 1,200 6 1%Barr Engineering 727 8 1% - - - General Dynamics 678 9 1% - - - Express Scripts 638 10 1% 1,379 5 2%Holiday Companies - - - 900 8 1%Thermo King/Ingersoll Rand Corp. - - - 600 9 1%Normandale Community College - - - 575 10 1%
Total 24,748 28% 26,309 29%
Total City Employment 89,959 90,986
Sources: (1) City of Bloomington Finance Department(2) Minnesota Department of Employment and Economic Development (average annual City employment)
20072016
- 209 -

CITY OF BLOOMINGTON, MINNESOTAFULL-TIME EQUIVALENT CITY GOVERNMENT EMPLOYEES BY FUNCTION/PROGRAMLast Ten Fiscal Years
Function/Program 2007 2008 2009 2010
Governmental activities:General services 81 80 80 80Development services 71 71 71 71Public works 118 121 117 116Public safety 153 153 153 153Community services 55 56 58 60
Total governmental activities 478 481 479 480
Business-type activities:Water/wastewater 54 54 54 54Storm water 11 11 12 11Recreational facilities 16 15 16 16Solid waste management 1 1 1 1Contractual police - - - - Motor vehicle 6 5 5 6
Total business-type activities 88 86 88 88
Total 566 567 567 568
Source: City of Bloomington Finance Department
- 210 -

Table 16
Full-Time Equivalent Employees as of December 312011 2012 2013 2014 2015 2016
80 80 80 80 80 8271 72 74 74 69 69
117 118 117 117 117 118152 152 155 155 160 165
61 62 60 60 60 59481 484 486 486 486 493
54 54 54 54 54 5412 11 12 12 12 1216 16 18 18 18 18
1 1 1 1 1 1 - - - - - -
5 5 5 5 6 688 87 90 90 91 91
569 571 576 576 577 584
- 211 -
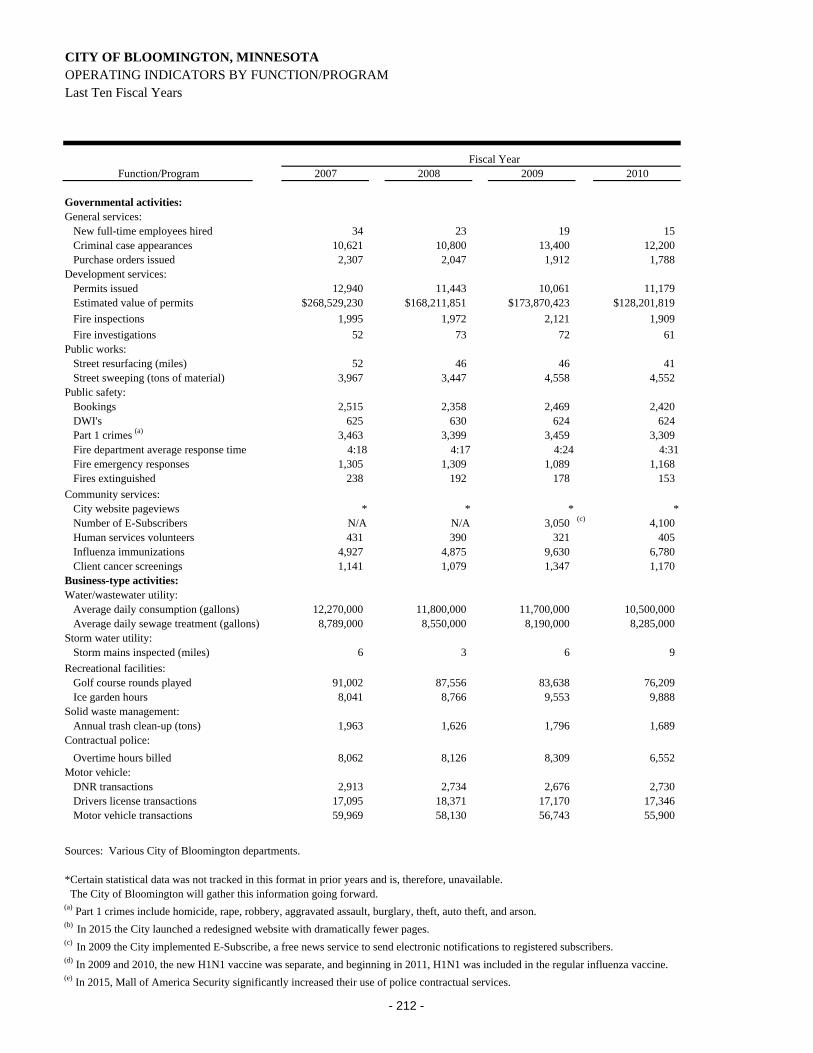
CITY OF BLOOMINGTON, MINNESOTAOPERATING INDICATORS BY FUNCTION/PROGRAMLast Ten Fiscal Years
Fiscal YearFunction/Program 2007 2008 2009 2010
Governmental activities:General services:
New full-time employees hired 34 23 19 15Criminal case appearances 10,621 10,800 13,400 12,200Purchase orders issued 2,307 2,047 1,912 1,788
Development services:Permits issued 12,940 11,443 10,061 11,179Estimated value of permits $268,529,230 $168,211,851 $173,870,423 $128,201,819
Fire inspections 1,995 1,972 2,121 1,909
Fire investigations 52 73 72 61Public works:
Street resurfacing (miles) 52 46 46 41Street sweeping (tons of material) 3,967 3,447 4,558 4,552
Public safety:Bookings 2,515 2,358 2,469 2,420DWI's 625 630 624 624Part 1 crimes (a) 3,463 3,399 3,459 3,309Fire department average response time 4:18 4:17 4:24 4:31Fire emergency responses 1,305 1,309 1,089 1,168Fires extinguished 238 192 178 153
Community services:City website pageviews * * * *Number of E-Subscribers N/A N/A 3,050 (c) 4,100Human services volunteers 431 390 321 405Influenza immunizations 4,927 4,875 9,630 6,780Client cancer screenings 1,141 1,079 1,347 1,170
Business-type activities:Water/wastewater utility:
Average daily consumption (gallons) 12,270,000 11,800,000 11,700,000 10,500,000Average daily sewage treatment (gallons) 8,789,000 8,550,000 8,190,000 8,285,000
Storm water utility:Storm mains inspected (miles) 6 3 6 9
Recreational facilities:Golf course rounds played 91,002 87,556 83,638 76,209Ice garden hours 8,041 8,766 9,553 9,888
Solid waste management:Annual trash clean-up (tons) 1,963 1,626 1,796 1,689
Contractual police:
Overtime hours billed 8,062 8,126 8,309 6,552Motor vehicle:
DNR transactions 2,913 2,734 2,676 2,730Drivers license transactions 17,095 18,371 17,170 17,346Motor vehicle transactions 59,969 58,130 56,743 55,900
Sources: Various City of Bloomington departments.
*Certain statistical data was not tracked in this format in prior years and is, therefore, unavailable. The City of Bloomington will gather this information going forward.(a) Part 1 crimes include homicide, rape, robbery, aggravated assault, burglary, theft, auto theft, and arson.(b) In 2015 the City launched a redesigned website with dramatically fewer pages.(c) In 2009 the City implemented E-Subscribe, a free news service to send electronic notifications to registered subscribers.(d) In 2009 and 2010, the new H1N1 vaccine was separate, and beginning in 2011, H1N1 was included in the regular influenza vaccine.(e) In 2015, Mall of America Security significantly increased their use of police contractual services.
- 212 -

Table 17
Fiscal Year2011 2012 2013 2014 2015 2016
33 43 44 44 51 4614,200 16,000 20,000 18,000 20,000 22,0001,696 1,875 1,457 1,382 1,026 995
11,254 11,362 16,119 14,413 12,313 11,856$263,305,005 $198,432,583 $201,614,610 $342,190,790 $485,208,914 $185,368,384
1,730 2,111 2,643 2,724 2,851 2,219
105 152 152 117 105 115
36 43 31 36 40 383,784 4,263 3,477 3,834 2,635 2,850
2,153 2,262 2,349 2,350 2,218 2,320593 512 451 425 362 363
3,358 3,443 3,524 3,423 3,118 3,0354:36 4:31 4:23 4:16 4:06 4:14
1,184 1,161 1,221 1,317 1,510 1,769142 177 159 149 184 166
1,776,135 1,814,332 1,948,674 1,911,818 1,468,653 (b) 1,629,3555,673 7,565 9,706 12,191 14,593 21,464
284 309 317 350 324 2794,101 (d) 3,506 4,488 3,851 3,216 2,7951,234 1,213 1,139 574 396 219
10,720,000 11,700,000 11,202,000 10,700,000 10,300,000 10,360,0008,570,000 8,130,000 8,078,000 8,175,000 7,920,000 8,100,000
9 8 8 9 11 12
66,180 62,852 51,658 61,355 62,392 57,5999,342 9,206 9,635 9,440 9,793 9,752
1,717 1,497 1,300 1,789 1,758 1,949
8,308 9,399 9,270 7,739 23,481 (e) 25,666 (e)
2,543 2,879 2,876 2,641 2,581 2,37018,209 21,610 20,439 20,727 20,092 21,15761,878 64,265 61,835 66,061 66,569 64,821
- 213 -

CITY OF BLOOMINGTON, MINNESOTACAPITAL ASSET STATISTICS BY FUNCTION/PROGRAMLast Ten Fiscal Years
Fiscal YearFunction/Program 2007 2008 2009 2010
Governmental activities:Public works:
Streets (miles) 343 342 342 341Streetlights 4,148 4,148 4,118 4,339Traffic signals 149 149 147 147Emergency outdoor warning sirens 22 22 22 22Emergency vehicle pre-emption systems 121 121 121 121
Public safety:Police stations 1 1 1 1Patrol units - marked and unmarked 37 37 37 37Police investigator vehicles 27 27 27 27
Fire stations 6 6 6 6Community services:
Community center 1 1 1 1Skate park 1 1 1 1
Playgrounds/playlots 46 54 54 54Baseball/softball diamonds 74 62 61 61Soccer/football fields 36 22 22 22Tennis courts 53 52 51 51Picnic shelters/gazebos 15 19 22 22
Business-type activities:
Water/wastewater utility:Water mains (miles) 489 490 489 489Fire hydrants 4,529 4,556 4,565 4,570Storage capacity (gallons) 44,000,000 44,000,000 44,000,000 44,000,000Sanitary sewers (miles) 380 382 383 383
Storm water utility:Storm sewers (miles) 250 250 253 253
Recreational facilities:Swimming beaches 1 1 1 1Swimming pools 1 1 1 1Golf courses 2 2 2 2Indoor ice rinks 3 3 3 3
Sources: Various City of Bloomington departments.
(a) In 2008, the City conducted a Park Master Plan Update, which provided a more accurate classification and accounting of park amenities. Also, park fields utilized for multiple activities are now only counted for one function.
Note: No capital asset indicators are available for the general services, development services, solid waste, contractual police, or motor vehicle functions.
- 214 -

Table 18
Fiscal Year2011 2012 2013 2014 2015 2016
341 342 342 342 342 3424,339 4,339 4,339 4,339 4,361 4,361
147 147 144 144 143 14322 22 22 22 22 22
121 121 121 121 122 122
1 1 1 1 1 137 37 37 37 37 3727 27 27 27 27 276 6 6 6 6 6
1 1 1 1 1 11 1 1 1 1 1
54 54 54 54 54 5461 61 61 62 62 6122 22 22 22 22 2250 50 49 49 50 5022 22 22 22 22 22
489 495 496 496 498 4984,599 4,589 4,617 4,617 4,665 4,676
44,000,000 44,000,000 44,000,000 44,000,000 44,000,000 44,000,000384 384 384 384 385 385
253 253 253 251 252 252
1 1 1 1 1 11 1 1 1 1 12 2 2 2 2 23 3 3 3 3 3
- 215 -
