yucca valley, california comprehensive annual financial...
TRANSCRIPT

Hi-Desert Water District
Yucca Valley, California
Comprehensive Annual Financial Report
For the Fiscal Years Ended June 30, 2012 and 2011

Our Mission Statement
"To provide a safe, reliable water supply and wastewater
reclamation system for the customers of the Hi-Desert Water District in an efficient and financially responsible manner"
Elected/ CurrentName Title Appointed Term
Sarann Graham President Elected 12/08 - 12/12
Roger Mayes Vice President Elected 12/10 - 12/14
Dan Munsey Director Elected 12/10 - 12/14
Robert Stadum Director Elected 12/08 - 12/12
Sheldon Hough Director Elected 12/10 - 12/14
Hi-Desert Water District
Board of Directors as of June 30, 2012
Hi-Desert Water District Ed Muzik, General Manager
55439 29 Palms Highway Yucca Valley, California 92284-2503
(760) 365-8333 – www.hdwd.com

Comprehensive Annual Financial Report
For the Fiscal Years Ended
June 30, 2012 and 2011
HI-DESERT WATER DISTRICT 55439 29 Palms Highway
Yucca Valley, California 92284-2503
Prepared by:
Frank J. Luckino, Chief Financial Officer

i
Hi-Desert Water District Annual Financial Report
For the Fiscal Years Ended June 30, 2012 and 2011
Table of Contents
Page No.
Table of Contents i
Introductory Section
Letter of Transmittal 1-4
Board of Directors 5
Organizational Chart 6
GFOA Certificate of Achievement for Excellence in Financial Reporting 7
Financial Section Independent Auditor’s Report 8-9
Management’s Discussion and Analysis 10-14
Basic Financial Statements: Statements of Net Assets 15 Statements of Revenues, Expenses and Changes in Net Assets 16
Statements of Cash Flows 17-18 Notes to the Basic Financial Statements 19-41
Required Supplemental Information: Schedule of Funding Progress – Other Post-Employment Benefits (OPEB) Plan 42
Supplemental Information Section Combining Schedule of Net Assets as of June 30, 2012 43 Combining Schedule of Net Assets as of June 30, 2011 44 Combining Schedule of Revenues, Expenses and Changes in Net Assets For the Year Ended June 30, 2012 45 Combining Schedule of Revenues, Expenses and Changes in Net Assets For the Year Ended June 30, 2011 46
Statistical Information Section Statistical Section – Table of Contents 47 Changes in Net Assets by Component – Last Ten Fiscal Years 48-49 Operating Revenues by Source – Last Ten Fiscal Years 50 Operating Expenses by Activity – Last Ten Fiscal Years 51 Revenue Base – Last Ten Fiscal Years 52 Revenue Rates – Last Ten Fiscal Years 53 Customers by Type – Last Ten Fiscal Years 54 Principal Customers – Current Fiscal Year and Nine Years Ago 55 Ratios of Outstanding Debt by Type – Last Ten Fiscal Years 56 Pledged-Revenue Coverage – Last Ten Fiscal Years 57 Demographic and Economic Statistics – Last Ten Fiscal Years 58 Operating and Capacity Indicators – Last Ten Fiscal Years 59
Report on Internal Controls and Compliance Independent Auditor’s Report on Internal Control over Financial Reporting And on Compliance and Other Matters Based on an Audit of Financial Statements Performed in Accordance with Government Auditing Standards 60

Introductory Section

1
December 7, 2012
Board of Directors Hi-Desert Water District
Introduction
It is our pleasure to submit the Annual Financial Report for the Hi-Desert Water District for the fiscal years ended June 30, 2012 and 2011, following guidelines set forth by the Governmental Accounting Standards Board. District staff prepared this financial report. The District is ultimately responsible for both the accuracy of the data and the completeness and the fairness of presentation, including all disclosures in this financial report. We believe that the data presented is accurate in all material respects. This report is designed in a manner that we believe necessary to enhance your understanding of the District’s financial position and activities.
This report is organized into four sections: (1) Introductory (2) Financial (3) Supplemental Information and (4) Statistical. The Introductory section offers general information about the District’s organization and current District activities and reports on a summary of significant financial results. The Financial section includes the Independent Auditors’ Report, Management’s Discussion and Analysis of the District’s basic financial statements, and the District’s audited basic financial statements with accompanying notes. The Supplemental Information section includes schedules for purposes of additional analysis. The Statistical section presents un-audited ten-year historical financial, demographic and statistical information pertinent to the District’s operations.
Generally Accepted Accounting Principles (GAAP) requires that management provide a narrative introduction, overview and analysis to accompany the financial statements in the form of the Management’s Discussion and Analysis (MD&A) section. This letter of transmittal is designed to complement the MD&A and should be read in conjunction with it. The District’s MD&A can be found immediately after the Independent Auditors’ Report.
District Structure and Leadership
The Hi-Desert Water District is an independent special district, which operates under the authority of Division 12 of the California Water Code. The District was formed in 1962 and is governed by a five-member Board of Directors, elected at-large from within the District’s service area. The General Manager administers the day-to-day operations of the District in accordance with policies and procedures established by the Board of Directors. The District employs approximately thirty-five (34) regular employees organized in six departments. The District’s Board of Directors meets on the first and third Wednesdays of each month. Meetings are publicly noticed and citizens are encouraged to attend.
The District provides water service to approximately 9,976 customers within its fifty-seven (57) square-mile service area, located in the eastern desert area of San Bernardino County. The District encompasses the Town of Yucca Valley in its entirety and some of the unincorporated areas of San Bernardino County, California.

2
District Services
Residential customers represent approximately 95% of the District’s customer base and consume approximately 88% of the water produced annually by the District. The District currently has a total of 13 groundwater wells with a maximum production capacity of 5,500 gallons per minute. In 2012 and 2011, the District purchased from Mojave Water Agency1,183 and 4,668 acre-feet of imported water from the State Water Project, respectively.
Economic Condition and Outlook
The District offices are located in the Town of Yucca Valley in San Bernardino County. San Bernardino and Riverside counties (Inland Empire) have witnessed a decrease in economic activity due to the down turn in property values and increased restrictions on credit.
California’s water supply continues to be a concern due to projected population increases. This concern has increased awareness for conservation and water efficient irrigation methods. For years our District has been an example in the area of conservation efforts with one of the lowest per service consumption rates in the state at 103 gallons per capita a day, with the statewide average at 192 gallons per capita a day. Almost 77% of the District customers have retrofitted their properties with low-flow toilets. The water district is continuing to improve its conservation program through public education and conservation incentives.
Major Initiatives
The activities of the Board and staff of the District are driven by its Mission Statement: “To provide a safe, reliable water supply and wastewater reclamation system for the customers of the Hi-Desert Water District in an efficient and financially responsible manner”. The strategic goals adopted by the Board of Directors are:
1. Wastewater System for Groundwater Protection.
2. Water Resource Management.
3. Emergency and Disaster Preparedness.
4. Public Information and Communication.
5. Infrastructure Development/Maintenance.
6. Financial Management.
7. Information Systems.
8. Human Resource Management.
9. Administrative Management.
All programs and operations of the District are developed and performed to provide the highest level of services to its customers. This is summarized in its motto, “Hi-Desert Water District—Serving You Today, Planning for Tomorrow.”
Accomplishments
To assist the board of directors in meeting their strategic mission for our District, staff achieved the following initiatives in 2012:
1. Submitted a grant request from the Clean-up and Abatement Account (CAA) and was awarded a $1.5M grant for the Wastewater Treatment Project;
2. Replaced 32,000 lineal feet of failing and undersized steel watermains with new poly vinyl chloride (PVC) pipe. The project included replacement of service laterals, fire hydrants, valves, and other appurtenances;
3. Awarded the Well 20W construction project which will add 800 gallons per minute (gpm) of production capacity to the system;

3
Accomplishments, continued
4. Developed the RFQ (Request for Qualifications) and RFP (Request for Proposals) for the collection system design of the Wastewater Treatment Project. Subsequent to fiscal year end, Hi-Desert Water District awarded this design task to Atkins North America;
5. Continued public education for the Wastewater Treatment Project; 6. During 2011/12, the District received State Water Project (SWP) deliveries from Mojave Water
Agency (MWA) totaling 2,538 acre feet (AF) bringing the total of available stored SWP reserves to approximately 16,600 AF or 6 years of additional storage based upon current water demands. The available storage is in addition to existing supplies of both native and return water;
7. Completed the first year of the District’s Reservoir Rehabilitation and Safety, Sanitary, and Security Upgrade project which included the completion of Reservoirs 30, 18, Hospital, and Golden Bee;
8. Addressed the rising cost of CALPERS pension by passing 25% of the employee cost to the employees with the goal of 100% in four years. And created a two tier pension plan with new employees going to a 2% at 60 plan;
9. Completed an electrical efficiency upgrade of well 6w reducing the District’s energy consumption and carbon footprint.
Internal Control Structure
District management is responsible for the establishment and maintenance of the internal control structure that ensures the assets of the District are protected from loss, theft or misuse. The internal control structure also ensures adequate accounting data is compiled to allow for the preparation of financial statements in conformity with generally accepted accounting principles. The District’s internal control structure is designed to provide reasonable assurance that these objectives are met. The concept of reasonable assurance recognizes that (1) the cost of a control should not exceed the benefits likely to be derived, and (2) the valuation of costs and benefits requires estimates and judgments by management.
Budgetary Control
The District Board of Directors annually adopts an operating and capital budget prior to the new fiscal year. The budget authorizes and provides the basis for reporting and control of financial operations and accountability for the District’s enterprise operations and capital projects. The budget and reporting treatment applied to the District is consistent with the accrual basis of accounting and the financial statement basis.
Investment Policy
The Board of Directors has adopted an investment policy that conforms to state law, District ordinance and resolutions, prudent money management, and the “prudent person” standards. The objective of the Investment Policy is safety, liquidity and yield. District funds are invested in the State Treasurer’s Local Agency Investment Fund and institutional savings and checking accounts.
Water Rates and District Revenues
District policy direction ensures that all revenues from user charges and surcharges generated from District customers must support all District operations including capital project funding. Accordingly, water rates are reviewed on an annual basis. Water rates are user charges imposed on customers for services and are the primary component of the District’s revenue. Water rates are composed of a commodity (usage) charge and a fixed meter (readiness-to-serve) charge.

4
Water Conservation Programs
The District has implemented conservation management practices since the early 1990’s. In 1991, the District became a signatory to the California Department of Water Resources Urban Water Management Plan that agreed to develop and implement comprehensive conservation practices or “Best Management Practices.” District staff participates in a number of community events and distributes materials to encourage water conservation. In addition to a tiered rate structure, which encourages conservation, the District offers the following conservation programs:
Residential Water Audits
Water Awareness Program
Audit and Financial Reporting
State Law and Bond covenants require the District to obtain an annual audit of its financial statements by an independent certified public accountant. The accounting firm of Charles Z. Fedak & Company, CPAs has conducted the audit of the District’s financial statements. Their unqualified Independent Auditor’s Report appears in the Financial Section.
Risk Management
The District is a member of the Association of California Water Agencies Joint Power Insurance Authority (Authority). The purpose of the Authority is to arrange and administer programs of insurance for the pooling of self-insured losses and to purchase excess insurance coverage.
Technological Advance in Customer Service
The District made significant changes to its customer service division, which has improved customer convenience. Customers now have the option to pay their bills at the District office, with a major credit card over the phone or on the District’s website, by automatic checking or savings account debit by enrollment in the auto-pay program, or at one of two drop boxes at either District office.
Other References
More information is contained in the Management’s Discussion and Analysis and the Notes to the Basic Financial Statements found in the Financial Section of the report.
Awards and Acknowledgements
The Government Finance Officers Association of the United States and Canada (GFOA) awarded a Certificate of Achievement for Excellence in Financial Reporting to the District for its Comprehensive Annual Financial Report for the fiscal year ended June 30, 2011. This was the fith year that the District has achieved this prestigious award. In order to be awarded a Certificate of Achievement, a governmental entity must publish an easily readable and efficiently organized Comprehensive Annual Financial Report. This report must satisfy both generally accepted accounting principles and applicable legal requirements.
Preparation of this report was accomplished by the combined efforts of District staff. We appreciate the dedicated efforts and professionalism that our staff members bring to the District. We would also like to thank the members of the Board of Directors for their continued support in the planning and implementation of the Hi-Desert Water District’s fiscal policies.
Respectfully submitted,

5
Board of Directors A five member Board of Directors are elected by the
Yucca Valley area to set policy and govern the District. Currently the Board of Directors are:
Sarann Graham
(President)
Roger Mayes
(Vice-President)
Dan Munsey
(Director)
Robert Stadum
(Director)
Sheldon Hough
(Director)

6

7

Financial Section


8
Independent Auditor’s Report
Board of Directors Hi-Desert Water District Yucca Valley, California
We have audited the accompanying financial statements of the Hi-Desert Water District (District) as of and for the fiscal years ended June 30, 2012 and 2011, which collectively comprise the District’s basic financial statements as listed in the table of contents. These basic financial statements are the responsibility of the District’s management. Our responsibility is to express an opinion on these basic financial statements based on our audits.
We conducted our audits in accordance with auditing standards generally accepted in the United States of America and the standards applicable to financial audits contained in Government Auditing Standards, issued by the Comptroller General of the United States; and the State Controller’s Minimum Audit Requirements for California Special Districts. Those standards require that we plan and perform the audits to obtain reasonable assurance about whether the basic financial statements are free of material misstatements. An audit includes examining, on a test basis, evidence supporting the amounts and disclosures in the basic financial statements. An audit also includes assessing the accounting principles used and significant estimates made by management, as well as evaluating the overall basic financial statement presentation. We believe that our audits provide a reasonable basis for our opinion.
In our opinion, the basic financial statements referred to above present fairly, in all material respects, the respective financial position of the Hi-Desert Water District as of June 30, 2012 and 2011, and the respective changes in net assets and cash flows for the years then ended in conformity with accounting principles generally accepted in the United States of America.
In accordance with Government Auditing Standards, we have also issued a report dated December 7, 2012, on our consideration of the District’s internal control over financial reporting and our tests of its compliance with certain provisions of laws, regulations, contracts, grant agreements and other matters. The purpose of that report is to describe the scope of our testing of internal control over financial reporting and compliance and the results of that testing, and not to provide an opinion on the internal control over financial reporting or on compliance. That report is an integral part of an audit performed in accordance with Government Auditing Standards and should be read in conjunction with this report in considering the results of our audits. This report can be found on page 60.
Accounting principles generally accepted in the United States of America require that the management’s discussion and analysis on pages 10 through 14 and the required supplementary information page 42 be presented to supplement the basic financial statements. Such information, although not a part of the basic financial statements, is required by the Governmental Accounting Standards Board, who considers it to be an essential part of financial reporting for placing the basic financial statements in an appropriate operational, economic, or historical context. We have applied certain limited procedures to the required supplementary information in accordance with auditing standards generally accepted in the United States of America, which consisted of inquires of management about the methods of preparing the information and comparing the information for consistency with management’s responses to our inquires, the basic financial statements, and other knowledge we obtained during our audit of the basic financial statements. We do not express an opinion or provide any assurance on the information because the limited procedures do not provide us with sufficient evidence to express an opinion or provide any assurance.
9
Independent Auditor’s Report, continued Our audits were conducted for the purpose of forming opinions on the financial statements that collectively comprise the District’s basic financial statements as a whole. The introductory section on pages 1 through 4, the supplementary information of combining schedules on pages 43 through 46, and the statistical section on pages 47 through 59 are presented for purposes of additional analysis and are not required parts of the basic financial statements. The supplementary information of combining schedules are the responsibility of management and were derived from and relate directly to the underlying accounting and other records used to prepare the basic financial statements. The information has been subjected to the auditing procedures applied in the audit of the basic financial statements and certain additional procedures, including comparing and reconciling such information directly to the underlying accounting and other records used to prepare the basic financial statements or to the basic financial statements themselves, and other additional procedures in accordance with auditing standards generally accepted in the United States of America. In our opinion, the information is fairly stated in all material respects in relation to the basic financial statements taken as a whole. The introductory and statistical sections have not been subjected to the auditing procedures applied in the audit of the basic financial statements and, accordingly, we do not express an opinion or provide any assurance on them. Charles Z. Fedak & Company, CPA’s – An Accountancy Corporation Cypress, California December 7, 2012
Hi-Desert Water District Management’s Discussion and Analysis
For the Fiscal Years Ended June 30, 2012 and 2011
10
The following Management’s Discussion and Analysis (MD&A) of activities and financial performance of the Hi-Desert Water District (District) provides an introduction to the financial statements of the District for the fiscal years ended June 30, 2012 and 2011. We encourage readers to consider the information presented here in conjunction with the transmittal letter in the Introductory Section and with the basic financial statements and related notes, which follow this section.
Financial Highlights
The District’s net assets increased 2.38% or $723,202 to $31,114,305 in fiscal year 2012 and the District’s net assets decreased 0.28% or $84,233 to $30,391,103 in fiscal year 2011 as a result of each year’s operations.
In 2012, the District’s operating revenues exceeded its operating expenses before depreciation and amortization expense by 6.55% or $501,167 as the results of the year’s operations. The District’s operating expenses exceeded its operating revenues before depreciation and amortization expense by 7.56% or $551,063 as the result of the year’s operations.
The District’s net income from non-operating revenues and debt service expenses produced a positive return of $928,371 and $1,684,183 in fiscal years 2012 and 2011, respectively. The District has pledged certain non-operating property tax and surcharge revenue items to pay for the District’s debt service expense and/or to be used for the District’s capital improvement program.
Capital contributions in 2012 amounted to $687,323 which is comprised of grant revenues of $49,804 and $515,923 for water operations and wastewater operations, respectively, and $121,596 from developers for meter purchases and installation fees. In 2011, capital contributions amounted to $218,433 which is comprised of grant revenues of $143,538 and $29,410 for water operations and wastewater operations, respectively, and $45,485 from developers for meter purchases and installation fees.
Required Financial Statements
This annual report consists of a series of financial statements. The Statement of Net Assets, Statement of Revenues, Expenses and Changes in Net Assets and Statement of Cash Flows provide information about the activities and performance of the District using accounting methods similar to those used by private sector companies.
The Statement of Net Assets includes all of the District’s investments in resources (assets) and the obligations to creditors (liabilities). It also provides the basis for computing a rate of return, evaluating the capital structure of the District and assessing the liquidity and financial flexibility of the District. All of the current year’s revenue and expenses are accounted for in the Statement of Revenues, Expenses and Changes in Net Assets. This statement measures the success of the District’s operations over the past year and can be used to determine if the District has successfully recovered all of its costs through its rates and other charges. This statement can also be used to evaluate profitability and credit worthiness. The final required financial statement is the Statement of Cash Flows, which provides information about the District’s cash receipts and cash payments during the reporting period. The Statement of Cash Flows reports cash receipts, cash payments and net changes in cash resulting from operations, investing, non-capital financing, and capital and related financing activities and provides answers to such questions as where did cash come from, what was cash used for, and what was the change in cash balance during the reporting period.
Hi-Desert Water District Management’s Discussion and Analysis
For the Fiscal Years Ended June 30, 2012 and 2011
11
Financial Analysis of the District
One of the most important questions asked about the District’s finances is, “Is the District better off or worse off as a result of this year’s activities?” The Statement of Net Assets and the Statement of Revenues, Expenses and Changes in Net Assets report information about the District in a way that helps answer this question.
These statements include all assets and liabilities using the accrual basis of accounting, which is similar to the accounting used by most private sector companies. All of the current year’s revenues and expenses are taken into account regardless of when the cash is received or paid.
These two statements report the District’s net assets and changes in them. You can think of the District’s net assets – the difference between assets and liabilities – as one way to measure the District’s financial health, or financial position. Over time, increases or decreases in the District’s net assets are one indicator of whether its financial health is improving or deteriorating. However, one will need to consider other non-financial factors such as changes in economic conditions, population growth, zoning and new or changed government legislation, such as changes in Federal and State water quality standards.
Notes to the Basic Financial Statements
The notes provide additional information that is essential to a full understanding of the data provided in the basic financial statements. The notes to the basic financial statements can be found on pages 19 through 42.
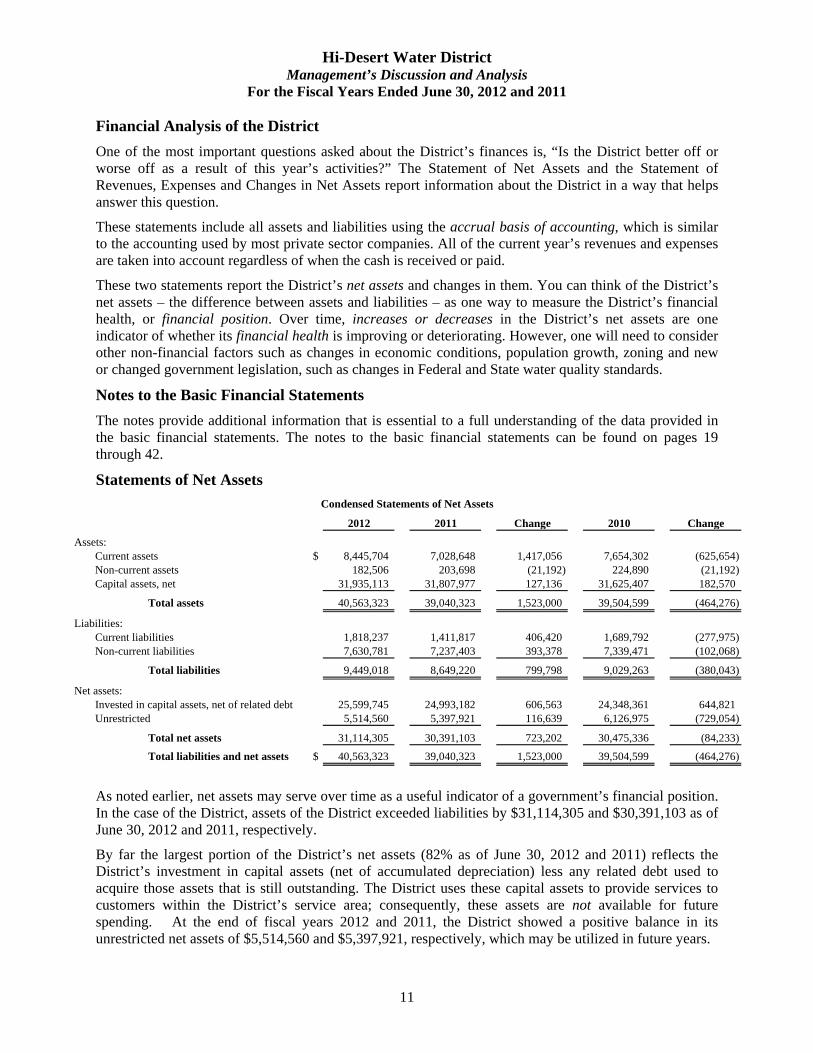
Statements of Net Assets
2012 2011 Change 2010 Change
Assets:Current assets $ 8,445,704 7,028,648 1,417,056 7,654,302 (625,654) Non-current assets 182,506 203,698 (21,192) 224,890 (21,192) Capital assets, net 31,935,113 31,807,977 127,136 31,625,407 182,570
Total assets 40,563,323 39,040,323 1,523,000 39,504,599 (464,276)
Liabilities:Current liabilities 1,818,237 1,411,817 406,420 1,689,792 (277,975) Non-current liabilities 7,630,781 7,237,403 393,378 7,339,471 (102,068)
Total liabilities 9,449,018 8,649,220 799,798 9,029,263 (380,043)
Net assets:Invested in capital assets, net of related debt 25,599,745 24,993,182 606,563 24,348,361 644,821 Unrestricted 5,514,560 5,397,921 116,639 6,126,975 (729,054)
Total net assets 31,114,305 30,391,103 723,202 30,475,336 (84,233)
Total liabilities and net assets $ 40,563,323 39,040,323 1,523,000 39,504,599 (464,276)
Condensed Statements of Net Assets
As noted earlier, net assets may serve over time as a useful indicator of a government’s financial position. In the case of the District, assets of the District exceeded liabilities by $31,114,305 and $30,391,103 as of June 30, 2012 and 2011, respectively.
By far the largest portion of the District’s net assets (82% as of June 30, 2012 and 2011) reflects the District’s investment in capital assets (net of accumulated depreciation) less any related debt used to acquire those assets that is still outstanding. The District uses these capital assets to provide services to customers within the District’s service area; consequently, these assets are not available for future spending. At the end of fiscal years 2012 and 2011, the District showed a positive balance in its unrestricted net assets of $5,514,560 and $5,397,921, respectively, which may be utilized in future years.
Hi-Desert Water District Management’s Discussion and Analysis
For the Fiscal Years Ended June 30, 2012 and 2011
12
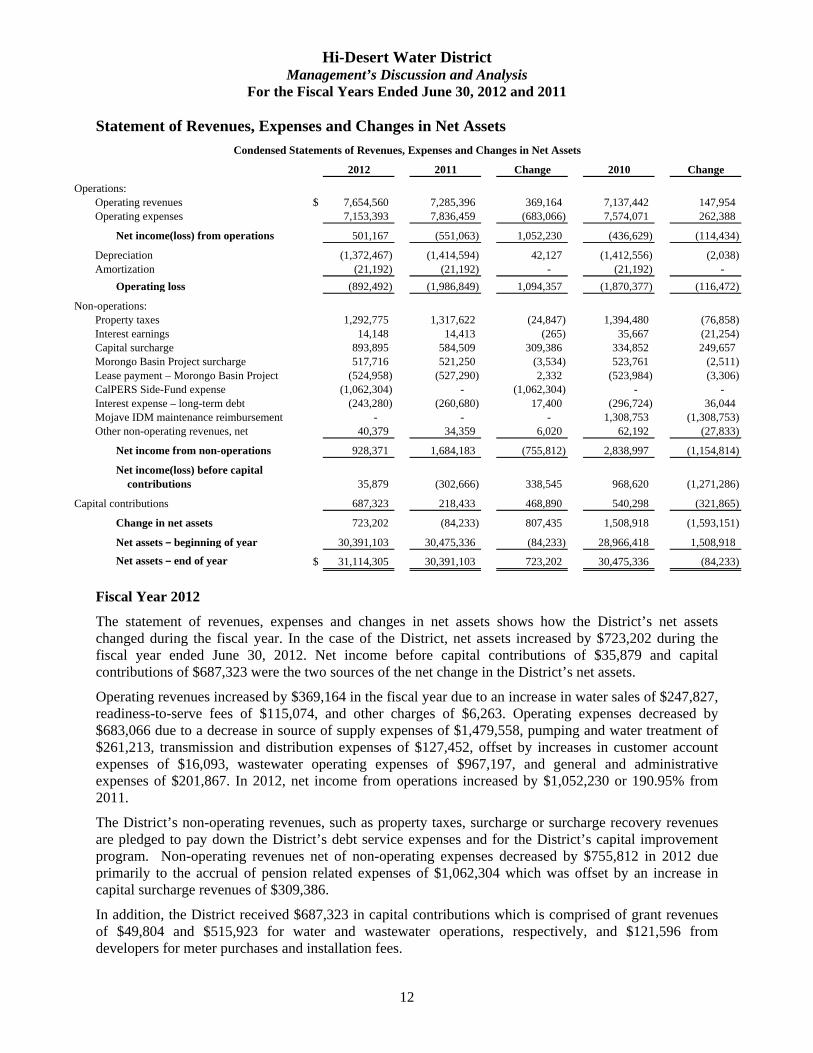
Statement of Revenues, Expenses and Changes in Net Assets
2012 2011 Change 2010 Change
Operations:Operating revenues $ 7,654,560 7,285,396 369,164 7,137,442 147,954 Operating expenses 7,153,393 7,836,459 (683,066) 7,574,071 262,388
Net income(loss) from operations 501,167 (551,063) 1,052,230 (436,629) (114,434)
Depreciation (1,372,467) (1,414,594) 42,127 (1,412,556) (2,038) Amortization (21,192) (21,192) - (21,192) -
Operating loss (892,492) (1,986,849) 1,094,357 (1,870,377) (116,472)
Non-operations:Property taxes 1,292,775 1,317,622 (24,847) 1,394,480 (76,858) Interest earnings 14,148 14,413 (265) 35,667 (21,254) Capital surcharge 893,895 584,509 309,386 334,852 249,657 Morongo Basin Project surcharge 517,716 521,250 (3,534) 523,761 (2,511) Lease payment – Morongo Basin Project (524,958) (527,290) 2,332 (523,984) (3,306) CalPERS Side-Fund expense (1,062,304) - (1,062,304) - - Interest expense – long-term debt (243,280) (260,680) 17,400 (296,724) 36,044 Mojave IDM maintenance reimbursement - - - 1,308,753 (1,308,753) Other non-operating revenues, net 40,379 34,359 6,020 62,192 (27,833)
Net income from non-operations 928,371 1,684,183 (755,812) 2,838,997 (1,154,814)
Net income(loss) before capital contributions 35,879 (302,666) 338,545 968,620 (1,271,286)
Capital contributions 687,323 218,433 468,890 540,298 (321,865)
Change in net assets 723,202 (84,233) 807,435 1,508,918 (1,593,151)
Net assets – beginning of year 30,391,103 30,475,336 (84,233) 28,966,418 1,508,918
Net assets – end of year $ 31,114,305 30,391,103 723,202 30,475,336 (84,233)
Condensed Statements of Revenues, Expenses and Changes in Net Assets
Fiscal Year 2012
The statement of revenues, expenses and changes in net assets shows how the District’s net assets changed during the fiscal year. In the case of the District, net assets increased by $723,202 during the fiscal year ended June 30, 2012. Net income before capital contributions of $35,879 and capital contributions of $687,323 were the two sources of the net change in the District’s net assets.
Operating revenues increased by $369,164 in the fiscal year due to an increase in water sales of $247,827, readiness-to-serve fees of $115,074, and other charges of $6,263. Operating expenses decreased by $683,066 due to a decrease in source of supply expenses of $1,479,558, pumping and water treatment of $261,213, transmission and distribution expenses of $127,452, offset by increases in customer account expenses of $16,093, wastewater operating expenses of $967,197, and general and administrative expenses of $201,867. In 2012, net income from operations increased by $1,052,230 or 190.95% from 2011.
The District’s non-operating revenues, such as property taxes, surcharge or surcharge recovery revenues are pledged to pay down the District’s debt service expenses and for the District’s capital improvement program. Non-operating revenues net of non-operating expenses decreased by $755,812 in 2012 due primarily to the accrual of pension related expenses of $1,062,304 which was offset by an increase in capital surcharge revenues of $309,386.
In addition, the District received $687,323 in capital contributions which is comprised of grant revenues of $49,804 and $515,923 for water and wastewater operations, respectively, and $121,596 from developers for meter purchases and installation fees.

Hi-Desert Water District Management’s Discussion and Analysis
For the Fiscal Years Ended June 30, 2012 and 2011
13
Statement of Revenues, Expenses and Changes in Net Assets, continued
Fiscal Year 2011
The statement of revenues, expenses and changes in net assets shows how the District’s net assets changed during the fiscal year. In the case of the District, net assets decreased by $84,233 during the fiscal year ended June 30, 2011. Net loss before capital contributions of $302,666 and capital contributions of $218,433 were the two sources of the net change in the District’s net assets.
Operating revenues increased by $147,954 in the fiscal year due to an increase in water sales of $22,264, readiness-to-serve fees of $86,391, and other charges of $39,299. Operating expenses increased by $262,388 due to increases in source of supply expenses of $1,026,715 and customer account expenses of $504,639 offset by decreases in pumping and water treatment expenses of $22,641, transmission and distribution expenses of $169,126, wastewater operations expenses of $606,131 and general and administrative expenses of $471,068. In 2011, net loss from operations increased by $114,434 or 26.2% from 2010.
The District’s non-operating revenues, such as property taxes, surcharge or surcharge recovery revenues are pledged to pay down the District’s debt service expenses and for the District’s capital improvement program. Non-operating revenues net of non-operating expenses decreased $1,154,814 in 2011 due primarily to a decrease in Mojave Water Agency pipeline maintenance fee refund of $1,308,753 and a decrease in property taxes of $76,858 which was offset by an increase in capital surcharge of $249,657.
In addition, the District received $218,433 in capital contributions which is comprised of grant revenues of $143,538 and $29,410 for water and wastewater operations, respectively, and $45,485 from developers for meter purchases and installation fees.
Capital Asset Administration
Changes in capital assets in 2012 were as follows:
Balance Balance2011 Additions Transfers 2012
Capital assets:Non-depreciable assets $ 4,003,271 793,990 (800,325) 3,996,936 Depreciable assets 51,506,985 1,505,938 - 53,012,923 Accumulated depreciation (23,702,279) (1,372,467) - (25,074,746)
Total capital assets $ 31,807,977 927,461 (800,325) 31,935,113
Changes in capital assets in 2011 were as follows:
Balance Balance2010 Additions Transfers 2011
Capital assets:Non-depreciable assets $ 4,271,319 1,597,164 (1,865,212) 4,003,271 Depreciable assets 49,641,773 1,865,212 - 51,506,985 Accumulated depreciation (22,287,685) (1,414,594) - (23,702,279)
Total capital assets $ 31,625,407 2,047,782 (1,865,212) 31,807,977
At the end of fiscal year 2012 and 2011, the District’s investment in capital assets amounted to $31,935,113 and $31,807,977 (net of accumulated depreciation), respectively. This investment in capital assets includes land, easements, transmission and distribution systems, wells, tanks, reservoirs, pumps, buildings and structures, equipment, vehicles and construction-in-process, etc. Major depreciable capital asset additions during fiscal year 2012 include additions to the transmission and distribution system mains, reservoirs and tanks, wells, and buildings and structures.

Hi-Desert Water District Management’s Discussion and Analysis
For the Fiscal Years Ended June 30, 2012 and 2011
14
Capital Asset Administration, continued
Major depreciable capital asset additions during fiscal year 2011 includes additions to the transmission and distribution system mains, reservoirs and tanks, wells, buildings and structures, and vehicles. See further detailed information in Note 5. Debt Administration
Changes in long-term debt amounts for 2012 were as follows:
Balance Principal Balance2011 Additions Payments 2012
Long-term debt:Loans payable $ 2,954,195 - (184,427) 2,769,768 Bonds payable 2,920,000 - (225,000) 2,695,000 Notes payable 940,600 - (70,000) 870,600
Total long-term debt $ 6,814,795 - (479,427) 6,335,368
Changes in long-term debt amounts for 2011 were as follows:
Balance Principal Balance2010 Additions Payments 2011
Long-term debt:Loans payable $ 3,131,446 - (177,251) 2,954,195 Bonds payable 3,135,000 - (215,000) 2,920,000 Notes payable 1,010,600 - (70,000) 940,600
Total long-term debt $ 7,277,046 - (462,251) 6,814,795
Principal payments in 2012 decreased total long-term debt by $479,427 from the 2011 levels. Principal payments in 2011 decreased total long-term debt by $462,251 from the 2010 levels. See further detailed information in Note 8.
Conditions Affecting Current Financial Position
Management is unaware of any conditions that would have a significant impact on the District’s financial position, net assets, or operating results in future periods.
Requests for Information
This financial report is designed to provide the District’s funding sources, customers, stakeholders and other interested parties with an overview of the District’s financial operations and financial condition. Should the reader have questions regarding the information included in this report or wish to request additional financial information, please contact the District’s Chief Financial Officer at 55439 29 Palms Highway, Yucca Valley, California 92284-2503.

Basic Financial Statements

Hi-Desert Water District Statements of Net Assets June 30, 2012 and 2011
15
2012 2011
Current assets:Cash and cash equivalents (note 2) $ 6,326,508 5,015,574 Accrued interest receivable 3,837 3,924 Accounts receivable – water sales and services, net (note 3) 765,249 701,508 Accounts receivable – other 125,928 58,780 Property taxes receivable 99,385 201,727 Materials and supplies inventory 354,124 292,946 Prepaid lease payment 719,341 719,303 Prepaid expenses and other deposits 51,332 34,886
Total current assets 8,445,704 7,028,648
Non-current assets:Deferred charges, net (note 4) 182,506 203,698 Capital assets – not being depreciated (note 5) 3,996,936 4,003,271 Depreciable capital assets, net (note 5) 27,938,177 27,804,706
Total non-current assets 32,117,619 32,011,675
Total assets $ 40,563,323 39,040,323
Current liabilities:Accounts payable and accrued expenses $ 427,075 432,743 Deposits and deferred revenue 326,170 341,029 Accrued interest on long-term debt 99,016 104,090 Long-term liabilities – due within one year:
Compensated absences (note 6) 55,751 54,590 Pension related debt (note 7) 57,820 - Loans payable (note 8) 192,405 184,365 Bonds payable (note 9) 235,000 225,000 Notes payable (note 10) 425,000 70,000
Total current liabilities 1,818,237 1,411,817
Non-current liabilities:Long-term liabilities – due in more than one year:
Compensated absences (note 6) 167,251 163,772 Other post employment benefits payable (note 13) 976,083 738,201 Pension related debt (note 7) 1,004,484 - Loans payable (note 8) 2,577,363 2,769,830 Bonds payable (note 9) 2,460,000 2,695,000 Notes payable (note 10) 445,600 870,600
Total non-current liabilities 7,630,781 7,237,403
Total liabilities 9,449,018 8,649,220
Net assets: (note 14)Invested in capital assets, net of related debt 25,599,745 24,993,182 Unrestricted 5,514,560 5,397,921
Total net assets 31,114,305 30,391,103
Total liabilities and net assets $ 40,563,323 39,040,323
See accompanying notes to the basic financial statements
Assets
Liabilities and Net Assets
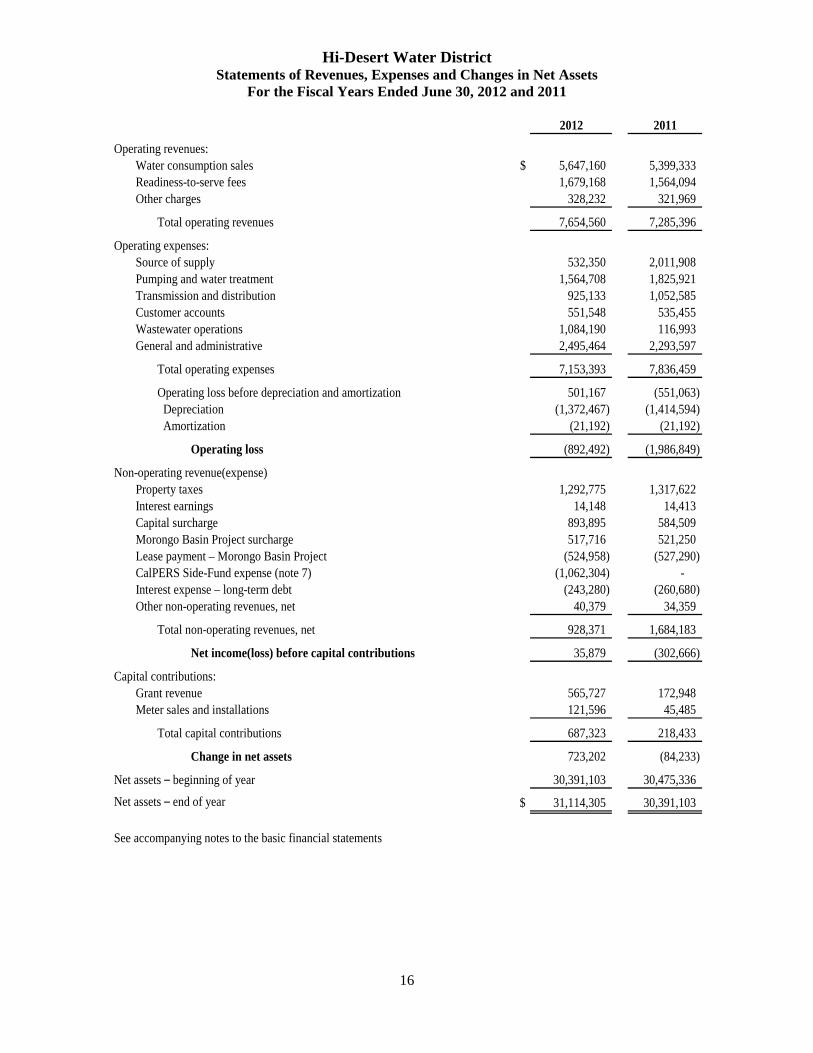
Hi-Desert Water District Statements of Revenues, Expenses and Changes in Net Assets
For the Fiscal Years Ended June 30, 2012 and 2011
16
2012 2011
Operating revenues:Water consumption sales $ 5,647,160 5,399,333 Readiness-to-serve fees 1,679,168 1,564,094 Other charges 328,232 321,969
Total operating revenues 7,654,560 7,285,396
Operating expenses:Source of supply 532,350 2,011,908 Pumping and water treatment 1,564,708 1,825,921 Transmission and distribution 925,133 1,052,585 Customer accounts 551,548 535,455 Wastewater operations 1,084,190 116,993 General and administrative 2,495,464 2,293,597
Total operating expenses 7,153,393 7,836,459
Operating loss before depreciation and amortization 501,167 (551,063) Depreciation (1,372,467) (1,414,594) Amortization (21,192) (21,192)
Operating loss (892,492) (1,986,849)
Non-operating revenue(expense)Property taxes 1,292,775 1,317,622 Interest earnings 14,148 14,413 Capital surcharge 893,895 584,509 Morongo Basin Project surcharge 517,716 521,250 Lease payment – Morongo Basin Project (524,958) (527,290) CalPERS Side-Fund expense (note 7) (1,062,304) - Interest expense – long-term debt (243,280) (260,680) Other non-operating revenues, net 40,379 34,359
Total non-operating revenues, net 928,371 1,684,183
Net income(loss) before capital contributions 35,879 (302,666)
Capital contributions:Grant revenue 565,727 172,948 Meter sales and installations 121,596 45,485
Total capital contributions 687,323 218,433
Change in net assets 723,202 (84,233)
Net assets – beginning of year 30,391,103 30,475,336
Net assets – end of year $ 31,114,305 30,391,103
See accompanying notes to the basic financial statements

Hi-Desert Water District Statements of Cash Flows
For the Fiscal Years Ended June 30, 2012 and 2011
17
2012 2011
Cash flows from operating activities:Cash receipts from customers for water sales and services $ 7,590,819 7,304,177 Cash paid to employees for salaries and wages (2,328,656) (2,388,710) Cash paid to vendors and suppliers for materials and services (4,747,514) (5,298,503)
Net cash used by operating activities 514,649 (383,036)
Cash flows from non-capital financing activities:Proceeds from property taxes 1,395,117 1,259,343 Proceeds from non-operating revenues, net 40,379 34,359
Net cash provided by non-capital financing activities 1,435,496 1,293,702
Cash flows from capital and related financing activities:Acquisition and construction of capital assets (1,499,603) (1,597,164) Proceeds from capital grants 565,727 172,948 Proceeds from meter sales and installations 121,596 45,485 Principal paid on long-term debt (479,427) (462,251) Interest paid on long-term debt (248,354) (267,648) Proceeds from Dept. of Water Resources Reach II surcharge 893,895 584,509 Proceeds from Morongo Basin Project surcharge 517,716 521,250 Lease payment – Morongo Basin Project (524,996) (526,441)
Net cash used in capital and related financing activities (653,446) (1,529,312)
Cash flows from investing activities:Interest earnings 14,235 18,102
Net cash provided by investing activities 14,235 18,102
Net decrease in cash and cash equivalents 1,310,934 (600,544)
Cash and cash equivalents – beginning of year 5,015,574 5,616,118
Cash and cash equivalents – end of year $ 6,326,508 5,015,574
Reconciliation of cash and cash equivalents to statement of financial position:
Cash and cash equivalents $ 6,326,508 5,015,574
Total cash and cash equivalents $ 6,326,508 5,015,574
Continued on next page
See accompanying notes to the basic financial statements
Hi-Desert Water District Statements of Cash Flows, continued
For the Fiscal Years Ended June 30, 2012 and 2011
18
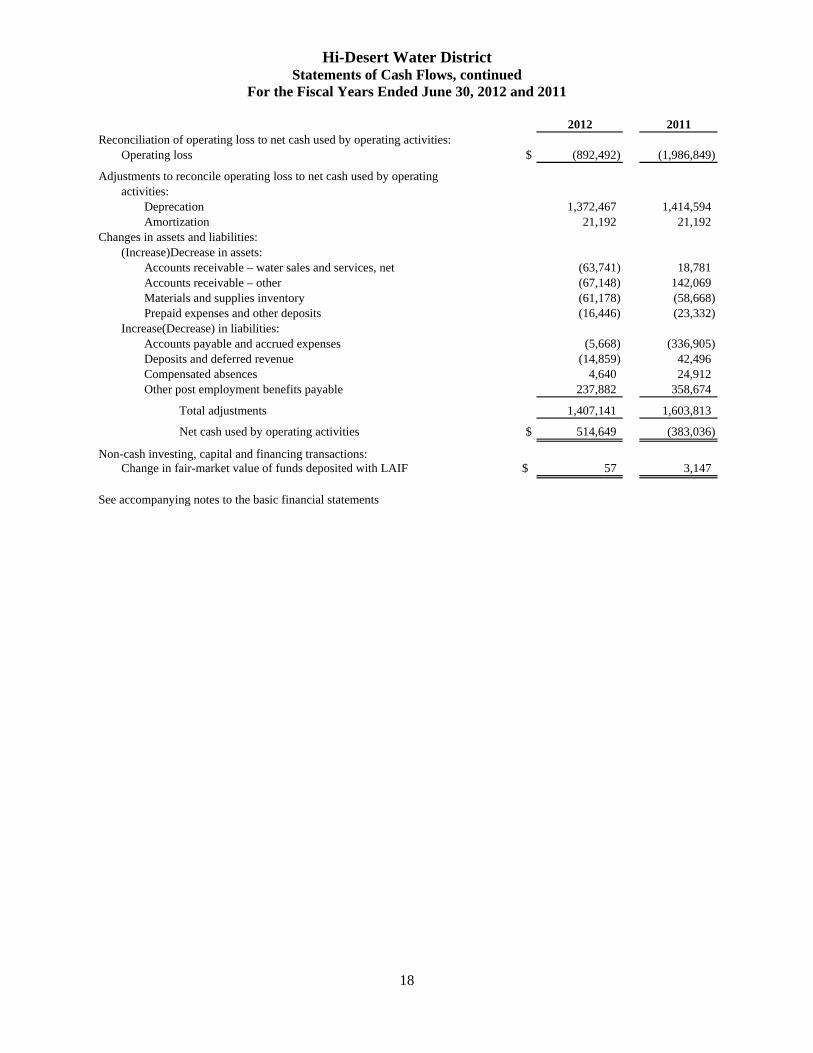
2012 2011Reconciliation of operating loss to net cash used by operating activities:
Operating loss $ (892,492) (1,986,849)
Adjustments to reconcile operating loss to net cash used by operatingactivities:
Deprecation 1,372,467 1,414,594 Amortization 21,192 21,192
Changes in assets and liabilities:(Increase)Decrease in assets:
Accounts receivable – water sales and services, net (63,741) 18,781 Accounts receivable – other (67,148) 142,069 Materials and supplies inventory (61,178) (58,668) Prepaid expenses and other deposits (16,446) (23,332)
Increase(Decrease) in liabilities:Accounts payable and accrued expenses (5,668) (336,905) Deposits and deferred revenue (14,859) 42,496 Compensated absences 4,640 24,912 Other post employment benefits payable 237,882 358,674
Total adjustments 1,407,141 1,603,813
Net cash used by operating activities $ 514,649 (383,036)
Non-cash investing, capital and financing transactions: Change in fair-market value of funds deposited with LAIF $ 57 3,147
See accompanying notes to the basic financial statements

Hi-Desert Water District Notes to the Basic Financial Statements
For the Fiscal Years Ended June 30, 2012 and 2011
19
(1) Reporting Entity and Summary of Significant Accounting Policies
A. Organization and Operations of the Reporting Entity
The Hi-Desert Water District (District) was formed on December 14, 1962 and provides potable water and water services to a population of over 25,000 within a 57-square mile area between the cities of Joshua Tree and Morongo Valley within the County of San Bernardino. The District is governed by a five-member Board of Directors who serve overlapping four-year terms.
The criteria used in determining the scope of the financial reporting entity is based on the provisions of Governmental Accounting Statements No. 14, The Financial Reporting Entity, and No. 39, Determining Whether Certain Organizations Are Component Units (an amendment of No. 14). The District is the primary governmental unit based on the foundation of a separately elected governing board that is elected by the citizens in a general popular election. Component units are legally separate organizations for which the elected officials of the primary government are financially accountable. The District is financially accountable if it appoints a voting majority of the organization’s governing body and: 1) It is able to impose its will on that organization, or 2) There is a potential for the organization to provide specific financial benefits to, or impose specific financial burdens on, the primary government.
The Hi-Desert Improvement Corporation (HDIC) was incorporated on February 13, 1981. The HDIC is a California nonprofit public benefit corporation formed to assist the Hi-Desert Water District (District) by acquiring, constructing, operating and maintaining facilities, equipment, or other property needed by the District and leasing or selling such property to the District and as such has no employees or other operations. Although the HDIC is legally separate, it is included as a blended component unit of the District, as it is in substance part of the District’s operations.
The Warren Valley Basin (Basin) provides a groundwater supply for the community of Yucca Valley in the County of San Bernardino. Concerned about the significant increase in groundwater overdraft in the Basin, the District filed a complaint for adjudication of the groundwater in 1976. In 1977, the Superior Court for the County of San Bernardino issued its judgment for adjudication. In the adjudication, the Court recognized the need to issue groundwater rights in excess of the Basin's safe yield so that the local economy could support the cost of a solution to the overdraft problem. To administer the provisions of the adjudication judgment, the Court appointed the District as the Warren Valley Basin Watermaster (WVBW) for the Basin and ordered that the WVBW to formulate a plan and program for management of the Basin’s resources. Although the WVBW is legally separate, it is included as a blended component unit of the District, as it is in substance part of the District’s operations as it is governed by the same Board of Directors. No separate financial statements are prepared for the HDIC and/or WVBW.
B. Basis of Accounting and Measurement Focus
The District reports its activities as an enterprise fund, which is used to account for operations that are financed and operated in a manner similar to a private business enterprise, where the intent of the District is that the costs of providing water to its service area on a continuing basis be financed or recovered primarily through user charges (water sales), capital grants and similar funding. Revenues and expenses are recognized on the full accrual basis of accounting. Revenues are recognized in the accounting period in which they are earned and expenses are recognized in the period incurred, regardless of when the related cash flows take place.
Operating revenues and expenses, such as water sales, water purchases and wastewater related charges, result from exchange transactions associated with the principal activity of the District. Exchange transactions are those in which each party receives and gives up essentially equal values. Non-operating revenues, such as grant funding and investment income, result from non-exchange transactions, in which, the District gives (receives) value without directly receiving (giving) value in exchange.
Hi-Desert Water District Notes to the Basic Financial Statements, continued For the Fiscal Years Ended June 30, 2012 and 2011
20
(1) Reporting Entity and Summary of Significant Accounting Policies, continued
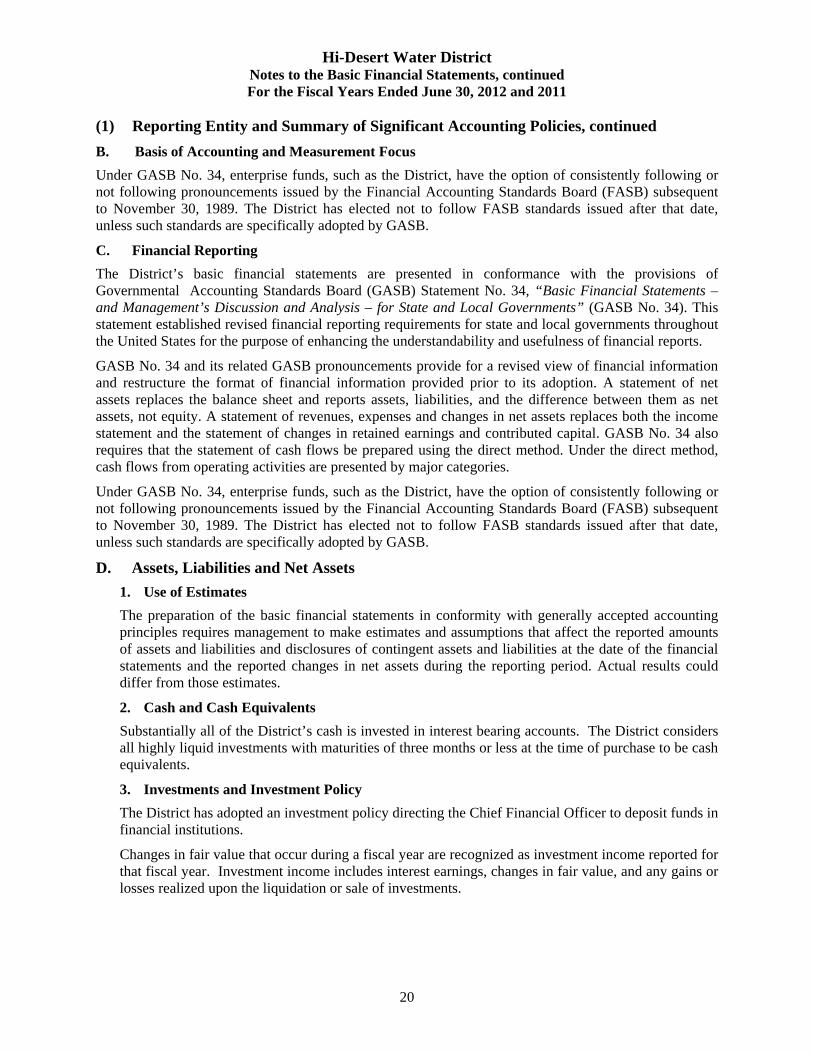
B. Basis of Accounting and Measurement Focus
Under GASB No. 34, enterprise funds, such as the District, have the option of consistently following or not following pronouncements issued by the Financial Accounting Standards Board (FASB) subsequent to November 30, 1989. The District has elected not to follow FASB standards issued after that date, unless such standards are specifically adopted by GASB.
C. Financial Reporting
The District’s basic financial statements are presented in conformance with the provisions of Governmental Accounting Standards Board (GASB) Statement No. 34, “Basic Financial Statements – and Management’s Discussion and Analysis – for State and Local Governments” (GASB No. 34). This statement established revised financial reporting requirements for state and local governments throughout the United States for the purpose of enhancing the understandability and usefulness of financial reports.
GASB No. 34 and its related GASB pronouncements provide for a revised view of financial information and restructure the format of financial information provided prior to its adoption. A statement of net assets replaces the balance sheet and reports assets, liabilities, and the difference between them as net assets, not equity. A statement of revenues, expenses and changes in net assets replaces both the income statement and the statement of changes in retained earnings and contributed capital. GASB No. 34 also requires that the statement of cash flows be prepared using the direct method. Under the direct method, cash flows from operating activities are presented by major categories.
Under GASB No. 34, enterprise funds, such as the District, have the option of consistently following or not following pronouncements issued by the Financial Accounting Standards Board (FASB) subsequent to November 30, 1989. The District has elected not to follow FASB standards issued after that date, unless such standards are specifically adopted by GASB.
D. Assets, Liabilities and Net Assets
1. Use of Estimates
The preparation of the basic financial statements in conformity with generally accepted accounting principles requires management to make estimates and assumptions that affect the reported amounts of assets and liabilities and disclosures of contingent assets and liabilities at the date of the financial statements and the reported changes in net assets during the reporting period. Actual results could differ from those estimates.
2. Cash and Cash Equivalents
Substantially all of the District’s cash is invested in interest bearing accounts. The District considers all highly liquid investments with maturities of three months or less at the time of purchase to be cash equivalents.
3. Investments and Investment Policy
The District has adopted an investment policy directing the Chief Financial Officer to deposit funds in financial institutions.
Changes in fair value that occur during a fiscal year are recognized as investment income reported for that fiscal year. Investment income includes interest earnings, changes in fair value, and any gains or losses realized upon the liquidation or sale of investments.

Hi-Desert Water District Notes to the Basic Financial Statements, continued For the Fiscal Years Ended June 30, 2012 and 2011
21
(1) Reporting Entity and Summary of Significant Accounting Policies, continued
D. Assets, Liabilities and Net Assets, continued
4. Accounts Receivable and Allowance for Uncollectible Accounts
The District extends credit to customers in the normal course of operations. When management deems customer accounts uncollectible, the District uses the allowance method for the reservation and write-off of those accounts.
5. Property Taxes and Assessments
The County of San Bernardino Assessor’s Office assesses all real and personal property within the County each year. The County of San Bernardino Tax Collector’s Offices bills and collects the District’s share of property taxes and assessments. The County of San Bernardino Treasurer’s Office remits current and delinquent property tax collections to the District throughout the year. Property tax in California is levied in accordance with Article 13A of the State Constitution at one percent (1%) of countywide assessed valuations.
Property taxes receivable at year-end are related to property taxes collected by the County of San Bernardino, which have not been credited to the District's cash balance as of June 30. The property tax calendar is as follows:
Lien date March 1 Levy date July 1 Due dates November 1 and March 1 Collection dates December 10 and April 10
6. Materials and Supplies Inventory
Materials and supplies inventory consists primarily of water meters, pipe and pipefittings for construction and repair to the District’s water transmission and distribution system. Inventory is valued at cost using the first-in first-out method. Inventory items are charged to expense at the time that individual items are withdrawn from inventory or consumed.
7. Prepaid Expenses
Certain payments to vendors reflects costs or deposits applicable to future accounting periods and are recorded as prepaid items in the basic financial statements.
8. Deferred Charges
The deferred charges are from bond issuance costs that will be amortized using the straight-line method over the remaining life of the respective debt service.
9. Compensated Absences
The District’s policy is to permit employees to accumulate earned vacation and sick leave. No employee is allowed to accrue vacation leave in excess of two (2) full years of their particular vacation schedule. Sick leave that is not used shall accumulate during subsequent years without limitation. Sick leave cannot be converted to vacation time, but in order to reward employees who do not utilize all of their sick leave, the District will compensate employees up to fifty percent (50%) of the unused sick leave. Payment of unused sick leave shall not reduce the accrual balance to less than eighty (80) hours and the plan is voluntary.

Hi-Desert Water District Notes to the Basic Financial Statements, continued For the Fiscal Years Ended June 30, 2012 and 2011
22
(1) Reporting Entity and Summary of Significant Accounting Policies, continued
D. Assets, Liabilities and Net Assets, continued
10. Water Sales
Water sales are billed on a monthly cyclical basis.
11. Capital Contributions
Capital contributions represent cash and capital asset additions contributed to the District by property owners, granting agencies or real estate developers desiring services that require capital expenditures or capacity commitment.
12. Capital Assets
Capital assets acquired and/or constructed are capitalized at historical cost. District policy has set the capitalization threshold for reporting capital assets at $5,000. Donated assets are recorded at estimated fair market value at the date of donation. Upon retirement or other disposition of capital assets, the cost and related accumulated depreciation are removed from the respective balances and any gains or losses are recognized. Depreciation is recorded on a straight-line basis over the estimated useful lives of the assets as follows:
Transmission and distribution mains – 15 to 40 years Reservoirs and tanks – 10 to 45 years Wells – 10 to 30 years Meter service installations – 7 to 10 years Recharge site #3 – 40 years Recharge ponds – 3 to 40 years Nitrate removal plant – 40 years Reach II pipeline – 40 years Pumps – 12 to 20 years Boosters – 20 to 25 years Hydrants – 25 to 40 years Blending facility – 40 years Buildings and structures – 5 to 30 years Office furniture and equipment – 5 to 10 years Tools and equipment – 5 years Vehicles – 4 years
13. Capital Grants
When a grant agreement is approved and eligible expenditures are incurred, the amount is recorded as a capital or operating grant receivable on the statement of net assets and as capital grant contribution or operating grant revenue, as appropriate, on the statement of revenues, expenses and changes in net assets.
14. Budgetary Policies
The District adopts an annual non-appropriated budget for planning, control, and evaluation purposes. Budgetary control and evaluation are affected by comparisons of actual revenues and expenses with planned revenues and expenses for the period. Encumbrance accounting is not used to account for commitments related to unperformed contracts for construction and services.
Hi-Desert Water District Notes to the Basic Financial Statements, continued For the Fiscal Years Ended June 30, 2012 and 2011
23
(1) Reporting Entity and Summary of Significant Accounting Policies, continued
D. Assets, Liabilities and Net Assets, continued
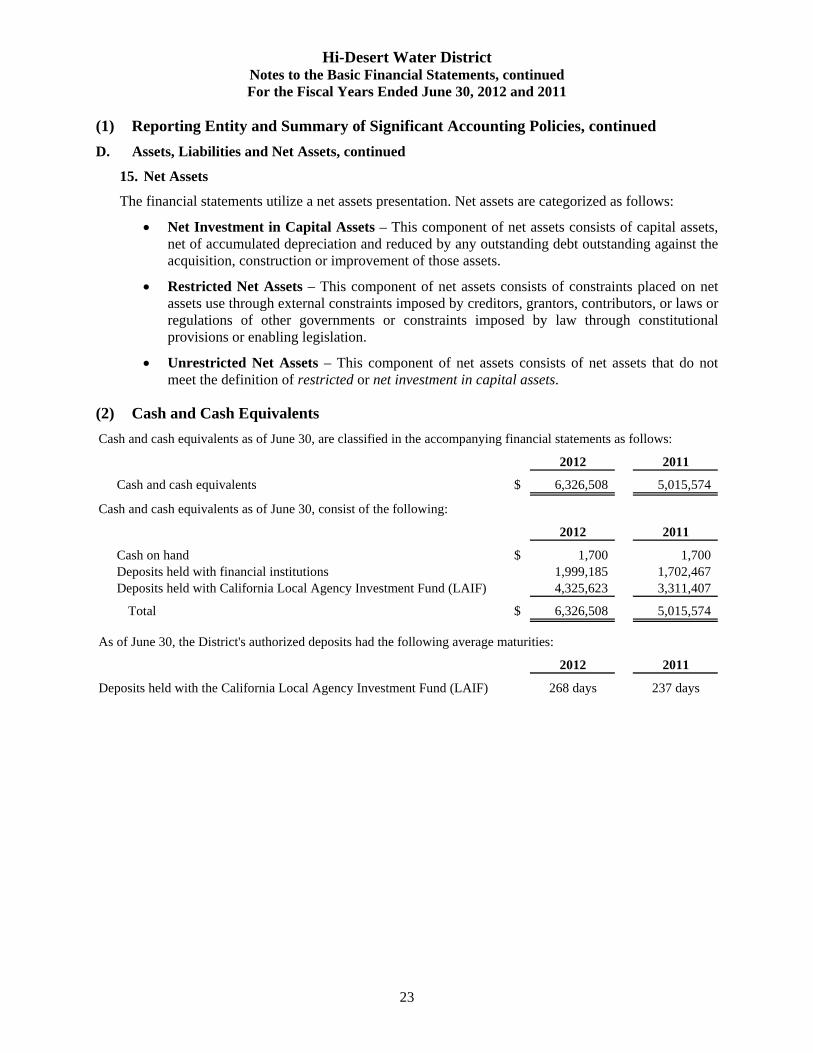
15. Net Assets
The financial statements utilize a net assets presentation. Net assets are categorized as follows:
Net Investment in Capital Assets – This component of net assets consists of capital assets, net of accumulated depreciation and reduced by any outstanding debt outstanding against the acquisition, construction or improvement of those assets.
Restricted Net Assets – This component of net assets consists of constraints placed on net assets use through external constraints imposed by creditors, grantors, contributors, or laws or regulations of other governments or constraints imposed by law through constitutional provisions or enabling legislation.
Unrestricted Net Assets – This component of net assets consists of net assets that do not meet the definition of restricted or net investment in capital assets.
(2) Cash and Cash Equivalents
Cash and cash equivalents as of June 30, are classified in the accompanying financial statements as follows:
2012 2011
Cash and cash equivalents $ 6,326,508 5,015,574
Cash and cash equivalents as of June 30, consist of the following:
2012 2011
Cash on hand $ 1,700 1,700 Deposits held with financial institutions 1,999,185 1,702,467 Deposits held with California Local Agency Investment Fund (LAIF) 4,325,623 3,311,407
Total $ 6,326,508 5,015,574
As of June 30, the District's authorized deposits had the following average maturities:
2012 2011
Deposits held with the California Local Agency Investment Fund (LAIF) 268 days 237 days

Hi-Desert Water District Notes to the Basic Financial Statements, continued For the Fiscal Years Ended June 30, 2012 and 2011
24
(2) Cash and Cash Equivalents, continued
Investments Authorized by the California Government Code and the District’s Investment Policy
The table below identifies the investment types that are authorized by the District in accordance with the California Government Code (or the District’s investment policy, where more restrictive). The table also identifies certain provisions of the California Government Code (or the District’s investment policy, where more restrictive) that address interest rate risk, credit risk, and concentration of credit risk.
Maximum Maximum
Maximum Percentage InvestmentMaturity Of Portfolio in One Issuer
U.S. Treasury obligations 5 years None NoneFederal agency and bank obligations 5 years None NoneCertificates-of-deposit (negotiable or placed) 5 years 30% 10%Commercial paper (prime) 270 days 10% 10%Money market mutual funds N/A 20% NoneState and local bonds, notes and warrants N/A None NoneCalifornia Local Agency Investment Fund (LAIF) N/A None None
AuthorizedInvestment Type
Custodial Credit Risk
Custodial credit risk for deposits is the risk that, in the event of the failure of a depository financial institution, a government will not be able to recover its deposits or will not be able to recover collateral securities that are in the possession of an outside party. The California Government Code and the District’s investment policy does not contain legal or policy requirements that would limit the exposure to custodial credit risk for deposits, other than the following provision for deposits: The California Government Code requires that a financial institution secure deposits made by state or local governmental units by pledging securities in an undivided collateral pool held by a depository regulated under state law (unless so waived by the governmental unit). The market value of the pledged securities in the collateral pool must equal at least 110% of the total amount deposited by the public agencies. Of the District’s bank balances, up to $250,000 is federally insured and the remaining balance is collateralized in accordance with the Code; however, the collateralized securities are not held in the District’s name.
The custodial credit risk for investments is the risk that, in the event of the failure of the counterparty (e.g., broker-dealer) to a transaction, a government will not be able to recover the value of its investment or collateral securities that are in the possession of another party. The Code and the District’s investment policy contains legal and policy requirements that would limit the exposure to custodial credit risk for investments. With respect to investments, custodial credit risk generally applies only to direct investments in marketable securities. Custodial credit risk does not apply to a local government’s indirect investment in securities through the use of mutual funds or government investment pools (such as LAIF).
Interest Rate Risk
Interest rate risk is the risk that changes in market interest rates will adversely affect the fair value of an investment. The longer the maturity an investment has the greater its fair value has sensitivity to changes in market interest rates. The District’s investment policy follows the Code as it relates to limits on investment maturities as a means of managing exposure to fair value losses arising from increasing interest rates.

Hi-Desert Water District Notes to the Basic Financial Statements, continued For the Fiscal Years Ended June 30, 2012 and 2011
25
(2) Cash and Cash Equivalents and Investments, continued
Credit Risk
Credit risk is the risk that an issuer of an investment will not fulfill its obligation to the holder of the investment. This is measured by the assignment of a rating by a nationally recognized statistical rating organization; however, LAIF is not rated.
Concentration of Credit Risk
The District’s investment policy contains various limitations on the amounts that can be invested in any one governmental agency or non-governmental issuer as stipulated by the California Government Code. The District’s deposit portfolio with governmental agencies, LAIF, is 68% and 66% as of June 30, 2012 and 2011, respectively, of the District’s total depository and investment portfolio. There were no investments in any one non-governmental issuer that represent 5% or more of the District’s total investments.
(3) Accounts Receivable – Water Sales and Services, Net
The balance at June 30, consists of the following: 2012 2011
Accounts receivable – water sales and services $ 945,989 793,763 Allowance for uncollectible accounts (180,740) (92,255)
Accounts receivable – water sales, net $ 765,249 701,508
(4) Deferred Charges
Deferred charges are related to the 1998 defeasance costs of the District’s 1991 Certificates of Participation and are being amortized over a twenty-three year period (remaining debt service years on the 1998 Revenue Refunding Bonds) beginning in 1998, as follows:
The balance at June 30, consists of the following: 2012 2011
Deferred charges $ 487,194 487,194 Accumulated amortization (304,688) (283,496)
Deferred charges, net $ 182,506 203,698
Hi-Desert Water District Notes to the Basic Financial Statements, continued For the Fiscal Years Ended June 30, 2012 and 2011
26
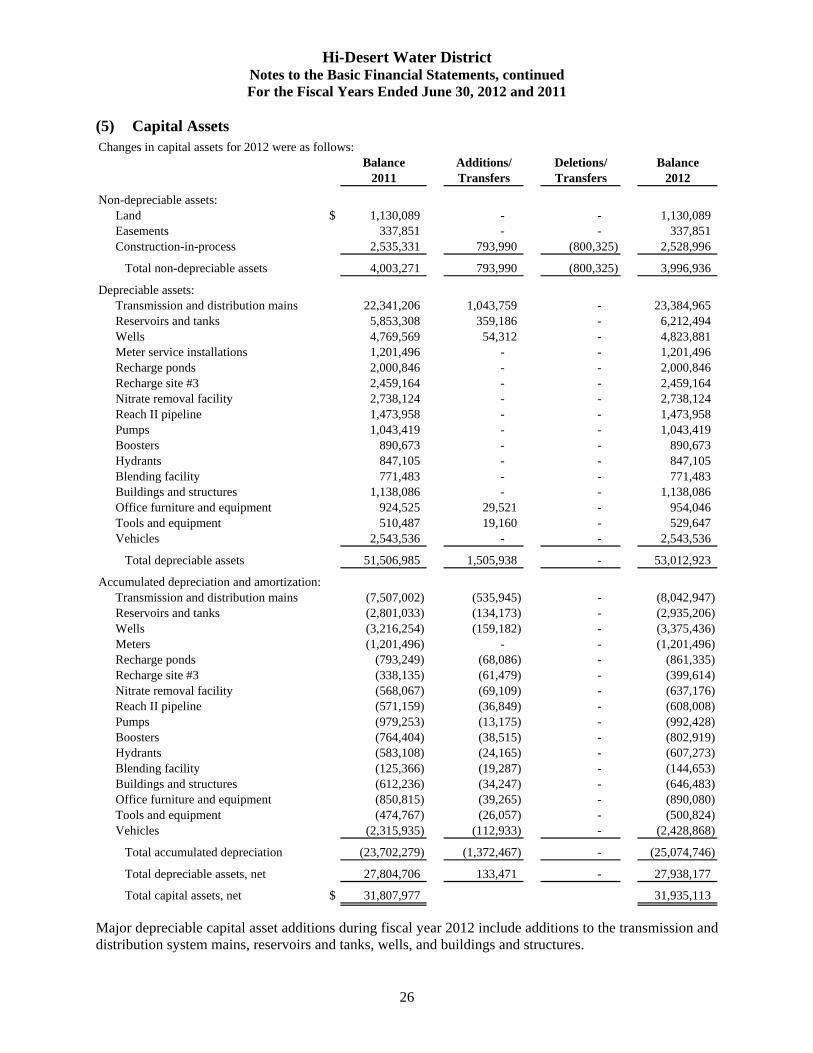
(5) Capital Assets Changes in capital assets for 2012 were as follows:
Balance Additions/ Deletions/ Balance2011 Transfers Transfers 2012
Non-depreciable assets:Land $ 1,130,089 - - 1,130,089 Easements 337,851 - - 337,851 Construction-in-process 2,535,331 793,990 (800,325) 2,528,996
Total non-depreciable assets 4,003,271 793,990 (800,325) 3,996,936
Depreciable assets:Transmission and distribution mains 22,341,206 1,043,759 - 23,384,965 Reservoirs and tanks 5,853,308 359,186 - 6,212,494 Wells 4,769,569 54,312 - 4,823,881 Meter service installations 1,201,496 - - 1,201,496 Recharge ponds 2,000,846 - - 2,000,846 Recharge site #3 2,459,164 - - 2,459,164 Nitrate removal facility 2,738,124 - - 2,738,124 Reach II pipeline 1,473,958 - - 1,473,958 Pumps 1,043,419 - - 1,043,419 Boosters 890,673 - - 890,673 Hydrants 847,105 - - 847,105 Blending facility 771,483 - - 771,483 Buildings and structures 1,138,086 - - 1,138,086 Office furniture and equipment 924,525 29,521 - 954,046 Tools and equipment 510,487 19,160 - 529,647 Vehicles 2,543,536 - - 2,543,536
Total depreciable assets 51,506,985 1,505,938 - 53,012,923
Accumulated depreciation and amortization:Transmission and distribution mains (7,507,002) (535,945) - (8,042,947) Reservoirs and tanks (2,801,033) (134,173) - (2,935,206) Wells (3,216,254) (159,182) - (3,375,436) Meters (1,201,496) - - (1,201,496) Recharge ponds (793,249) (68,086) - (861,335) Recharge site #3 (338,135) (61,479) - (399,614) Nitrate removal facility (568,067) (69,109) - (637,176) Reach II pipeline (571,159) (36,849) - (608,008) Pumps (979,253) (13,175) - (992,428) Boosters (764,404) (38,515) - (802,919) Hydrants (583,108) (24,165) - (607,273) Blending facility (125,366) (19,287) - (144,653) Buildings and structures (612,236) (34,247) - (646,483) Office furniture and equipment (850,815) (39,265) - (890,080) Tools and equipment (474,767) (26,057) - (500,824) Vehicles (2,315,935) (112,933) - (2,428,868)
Total accumulated depreciation (23,702,279) (1,372,467) - (25,074,746)
Total depreciable assets, net 27,804,706 133,471 - 27,938,177
Total capital assets, net $ 31,807,977 31,935,113
Major depreciable capital asset additions during fiscal year 2012 include additions to the transmission and distribution system mains, reservoirs and tanks, wells, and buildings and structures.

Hi-Desert Water District Notes to the Basic Financial Statements, continued For the Fiscal Years Ended June 30, 2012 and 2011
27
(5) Capital Assets, continued Changes in capital assets for 2011 were as follows:
Balance Additions/ Deletions/ Balance2010 Transfers Transfers 2011
Non-depreciable assets:Land $ 1,130,089 - - 1,130,089 Easements 337,851 - - 337,851 Construction-in-process 2,803,379 1,597,164 (1,865,212) 2,535,331
Total non-depreciable assets 4,271,319 1,597,164 (1,865,212) 4,003,271
Depreciable assets:Transmission and distribution mains 21,237,597 1,103,609 - 22,341,206 Reservoirs and tanks 5,160,430 692,878 - 5,853,308 Wells 4,716,001 53,568 - 4,769,569 Meter service installations 1,201,496 - - 1,201,496 Recharge ponds 2,000,846 - - 2,000,846 Recharge site #3 2,459,164 - - 2,459,164 Nitrate removal facility 2,738,124 - - 2,738,124 Reach II pipeline 1,473,958 - - 1,473,958 Pumps 1,043,419 - - 1,043,419 Boosters 890,673 - - 890,673 Hydrants 847,105 - - 847,105 Blending facility 771,483 - - 771,483 Buildings and structures 1,128,929 9,157 - 1,138,086 Office furniture and equipment 924,525 - - 924,525 Tools and equipment 510,487 - - 510,487 Vehicles 2,537,536 6,000 - 2,543,536
Total depreciable assets 49,641,773 1,865,212 - 51,506,985
Accumulated depreciation and amortization:Transmission and distribution mains (6,997,899) (509,103) - (7,507,002) Reservoirs and tanks (2,676,838) (124,195) - (2,801,033) Wells (3,062,467) (153,787) - (3,216,254) Meters (1,198,540) (2,956) - (1,201,496) Recharge ponds (725,162) (68,087) - (793,249) Recharge site #3 (276,656) (61,479) - (338,135) Nitrate removal facility (498,957) (69,110) - (568,067) Reach II pipeline (534,310) (36,849) - (571,159) Pumps (949,056) (30,197) - (979,253) Boosters (723,051) (41,353) - (764,404) Hydrants (558,923) (24,185) - (583,108) Blending facility (106,079) (19,287) - (125,366) Buildings and structures (574,456) (37,780) - (612,236) Office furniture and equipment (806,436) (44,379) - (850,815) Tools and equipment (447,067) (27,700) - (474,767) Vehicles (2,151,788) (164,147) - (2,315,935)
Total accumulated depreciation (22,287,685) (1,414,594) - (23,702,279)
Total depreciable assets, net 27,354,088 450,618 - 27,804,706
Total capital assets, net $ 31,625,407 31,807,977
Major depreciable capital asset additions during fiscal year 2011 include additions to the transmission and distribution system mains, reservoirs and tanks, wells, buildings and structures, and vehicles.
Hi-Desert Water District Notes to the Basic Financial Statements, continued For the Fiscal Years Ended June 30, 2012 and 2011
28
(5) Capital Assets, continued
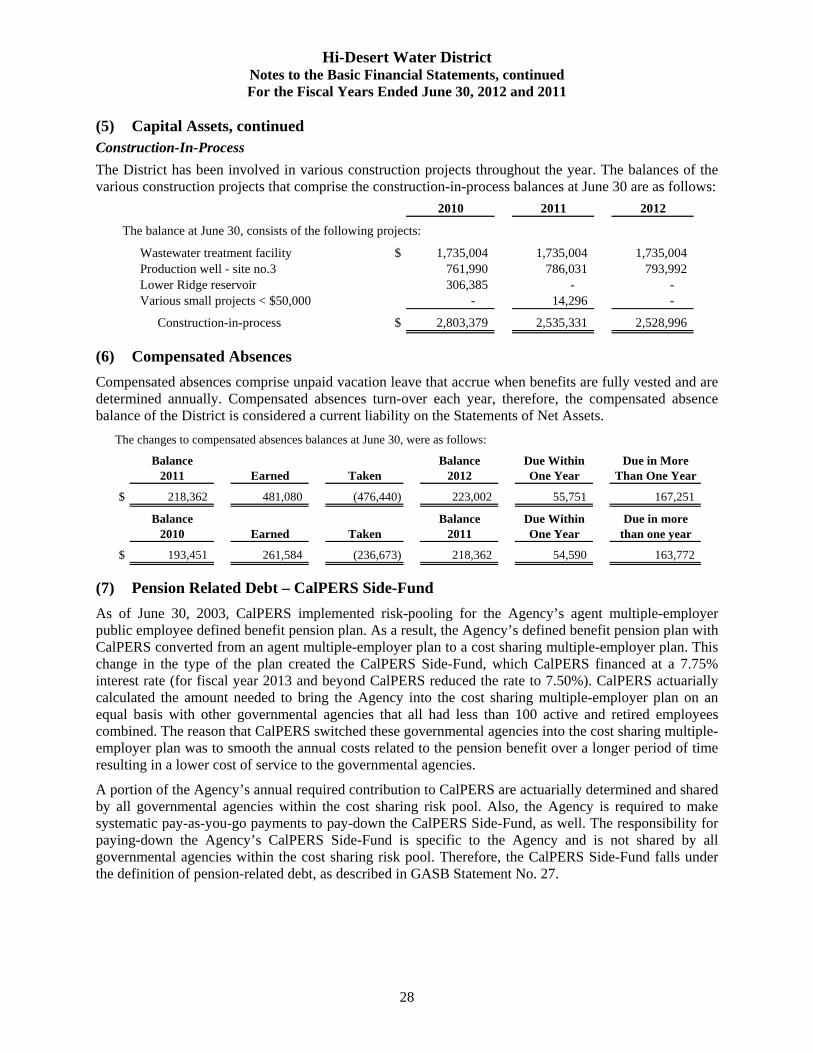
Construction-In-Process
The District has been involved in various construction projects throughout the year. The balances of the various construction projects that comprise the construction-in-process balances at June 30 are as follows:
2010 2011 2012
The balance at June 30, consists of the following projects:
Wastewater treatment facility $ 1,735,004 1,735,004 1,735,004 Production well - site no.3 761,990 786,031 793,992 Lower Ridge reservoir 306,385 - - Various small projects < $50,000 - 14,296 -
Construction-in-process $ 2,803,379 2,535,331 2,528,996
(6) Compensated Absences
Compensated absences comprise unpaid vacation leave that accrue when benefits are fully vested and are determined annually. Compensated absences turn-over each year, therefore, the compensated absence balance of the District is considered a current liability on the Statements of Net Assets.
The changes to compensated absences balances at June 30, were as follows:
Balance Balance Due Within Due in More2011 Earned Taken 2012 One Year Than One Year
$ 218,362 481,080 (476,440) 223,002 55,751 167,251
Balance Balance Due Within Due in more2010 Earned Taken 2011 One Year than one year
$ 193,451 261,584 (236,673) 218,362 54,590 163,772
(7) Pension Related Debt – CalPERS Side-Fund
As of June 30, 2003, CalPERS implemented risk-pooling for the Agency’s agent multiple-employer public employee defined benefit pension plan. As a result, the Agency’s defined benefit pension plan with CalPERS converted from an agent multiple-employer plan to a cost sharing multiple-employer plan. This change in the type of the plan created the CalPERS Side-Fund, which CalPERS financed at a 7.75% interest rate (for fiscal year 2013 and beyond CalPERS reduced the rate to 7.50%). CalPERS actuarially calculated the amount needed to bring the Agency into the cost sharing multiple-employer plan on an equal basis with other governmental agencies that all had less than 100 active and retired employees combined. The reason that CalPERS switched these governmental agencies into the cost sharing multiple-employer plan was to smooth the annual costs related to the pension benefit over a longer period of time resulting in a lower cost of service to the governmental agencies.
A portion of the Agency’s annual required contribution to CalPERS are actuarially determined and shared by all governmental agencies within the cost sharing risk pool. Also, the Agency is required to make systematic pay-as-you-go payments to pay-down the CalPERS Side-Fund, as well. The responsibility for paying-down the Agency’s CalPERS Side-Fund is specific to the Agency and is not shared by all governmental agencies within the cost sharing risk pool. Therefore, the CalPERS Side-Fund falls under the definition of pension-related debt, as described in GASB Statement No. 27.

Hi-Desert Water District Notes to the Basic Financial Statements, continued For the Fiscal Years Ended June 30, 2012 and 2011
29
(7) Pension Related Debt – CalPERS Side-Fund, continued
The following long-term debt has been recorded on the Agency’s financial statements as the Agency is making systematic pay-as-you-go payments to CalPERS each payroll period. The annual repayment schedule is as follows:
Year Principal Interest Total
2013 $ 57,820 74,790 132,610 2014 66,162 70,311 136,473 2015 75,369 65,198 140,567 2016 85,394 59,390 144,784 2017 96,302 52,826 149,128
2018-2022 681,256 134,232 815,488
Total 1,062,303 456,747 1,519,050
Less: current portion (57,820)
Long-term portion $ 1,004,483
(8) Loans Payable
Changes in loans payable for the year ended June 30, 2012 are as follows:
Balance Balance2011 Additions Payments 2012
1986 California Dept. of Water Resources loan $ 2,954,195 - (184,427) 2,769,768
Total 2,954,195 - (184,427) 2,769,768
Less: current portion due (184,365) (192,405)
Long-term portion due $ 2,769,830 2,577,363
Changes in loans payable for the year ended June 30, 2011 are as follows:
Balance Balance2010 Additions Payments 2011
1986 California Dept. of Water Resources loan $ 3,131,446 - (177,251) 2,954,195
Total 3,131,446 - (177,251) 2,954,195
Less: current portion due (177,190) (184,365)
Long-term portion due $ 2,954,256 2,769,830
Hi-Desert Water District Notes to the Basic Financial Statements, continued For the Fiscal Years Ended June 30, 2012 and 2011
30
(8) Loans Payable, continued
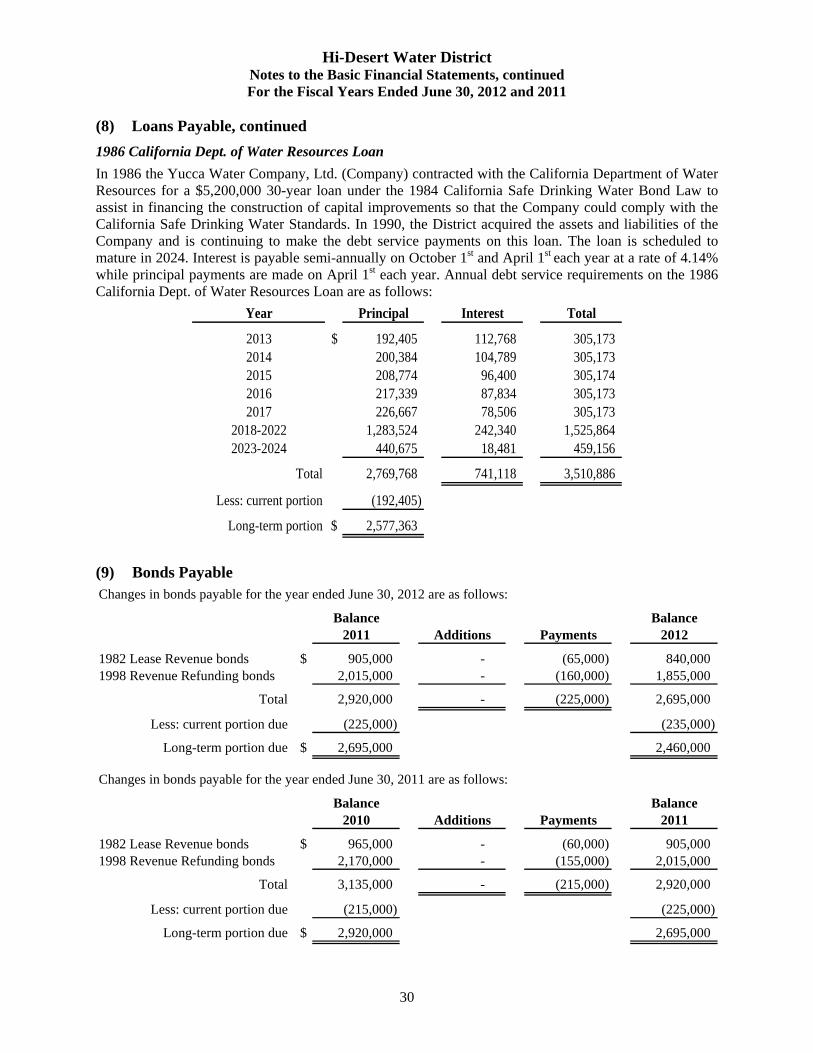
1986 California Dept. of Water Resources Loan
In 1986 the Yucca Water Company, Ltd. (Company) contracted with the California Department of Water Resources for a $5,200,000 30-year loan under the 1984 California Safe Drinking Water Bond Law to assist in financing the construction of capital improvements so that the Company could comply with the California Safe Drinking Water Standards. In 1990, the District acquired the assets and liabilities of the Company and is continuing to make the debt service payments on this loan. The loan is scheduled to mature in 2024. Interest is payable semi-annually on October 1st and April 1st each year at a rate of 4.14% while principal payments are made on April 1st each year. Annual debt service requirements on the 1986 California Dept. of Water Resources Loan are as follows:
Year Principal Interest Total
2013 $ 192,405 112,768 305,173 2014 200,384 104,789 305,173 2015 208,774 96,400 305,174 2016 217,339 87,834 305,173 2017 226,667 78,506 305,173
2018-2022 1,283,524 242,340 1,525,864 2023-2024 440,675 18,481 459,156
Total 2,769,768 741,118 3,510,886
Less: current portion (192,405)
Long-term portion $ 2,577,363
(9) Bonds Payable
Changes in bonds payable for the year ended June 30, 2012 are as follows:
Balance Balance2011 Additions Payments 2012
1982 Lease Revenue bonds $ 905,000 - (65,000) 840,000 1998 Revenue Refunding bonds 2,015,000 - (160,000) 1,855,000
Total 2,920,000 - (225,000) 2,695,000
Less: current portion due (225,000) (235,000)
Long-term portion due $ 2,695,000 2,460,000
Changes in bonds payable for the year ended June 30, 2011 are as follows:
Balance Balance2010 Additions Payments 2011
1982 Lease Revenue bonds $ 965,000 - (60,000) 905,000 1998 Revenue Refunding bonds 2,170,000 - (155,000) 2,015,000
Total 3,135,000 - (215,000) 2,920,000
Less: current portion due (215,000) (225,000)
Long-term portion due $ 2,920,000 2,695,000

Hi-Desert Water District Notes to the Basic Financial Statements, continued For the Fiscal Years Ended June 30, 2012 and 2011
31
(9) Bonds Payable, continued
1982 Lease Revenue Bonds
In 1982, the Hi-Desert Improvement Corporation (HDIC) issued $1,867,700 in 40-year Lease Revenue Bonds to provide funds for water capital improvements for the District. The bonds and interest are payable from, and are secured by a charge and lien on, the revenues derived by the HDIC from and by the assignment of a lease and sub-lease between the District and the HDIC.
The bonds are scheduled to mature in 2022. Interest is payable semi-annually on September 1st and March 1st each year at a rate of 5.00% while principal payments are made on March 1st each year. Annual debt service requirements on the 1982 Lease Revenue Bonds are as follows:
Year Principal Interest Total
2013 $ 65,000 42,000 107,000 2014 70,000 38,750 108,750 2015 75,000 35,250 110,250 2016 75,000 31,500 106,500 2017 80,000 27,750 107,750
2018-2022 475,000 73,750 548,750
Total 840,000 249,000 1,089,000
Less: current portion (65,000)
Long-term portion $ 775,000
1998 Revenue Refunding Bonds
In 1991, the California Special Districts Association Finance Corporation (CSDAFC) issued $3,870,000 in 30-year Certificates of Participation (COPs) at 6.8% to provide for a Facilities Lease, dated January 1, 1991, between the CSDAFC and the District. The facilities consist primarily of eight water storage tanks and the District’s office building and shop on Old Woman Springs Road.
The Joshua Basin – Hi-Desert Financing Authority (Authority) was established in 1998 as a joint exercise of powers authority organized under the laws of the State of California and comprised of the Joshua Basin Water District and the Hi-Desert Water District. The Authority was formed to assist in the financing of various capital improvements and the facilities named above.
In 1998, the Authority issued $3,590,000 in Revenue Refunding Bonds to initiate an advance refunding (defeasance) of the 1991 COPs. The net proceeds from the sale were used to purchase U.S Treasury securities that were deposited in irrevocable escrow trust accounts with a bank acting as an independent fiscal agent to provide for all future debt service on the bonds being refunded. As a result, those bonds are considered defeased and the related liabilities have been excluded from Hi-Desert Water District’s basic financial statements. At June 30, 2011 and 2010, outstanding Certificates of Participation of $3,590,000, respectively, are considered to be defeased.
The Authority will lease certain facilities from the District pursuant to a Facilities Lease, dated January 1, 1998, by and between the Authority and the District, and will lease back to the District the facilities pursuant to a Lease Agreement, dated January 1, 1998, by and between the Authority and the District. The District is legally required to make lease payments in each year in consideration for the use and occupancy of the facilities from operating sources in an amount sufficient to pay the annual principal and interest requirements on the bonds.

Hi-Desert Water District Notes to the Basic Financial Statements, continued For the Fiscal Years Ended June 30, 2012 and 2011
32
(9) Bonds Payable, continued
The bonds are scheduled to mature in 2021. Interest is payable semi-annually on August 1st and February 1st each year at a rate of 3.80% to 5.00% while principal payments are made on February 1st each year.
Annual debt service requirements on the 1998 Revenue Bonds are as follows:
Year Principal Interest Total
2013 $ 170,000 91,413 261,413 2014 180,000 83,338 263,338 2015 185,000 74,788 259,788 2016 195,000 66,000 261,000 2017 205,000 56,250 261,250
2018-2021 920,000 118,750 1,038,750
Total 1,855,000 490,539 2,345,539
Less: current portion (170,000)
Long-term portion $ 1,685,000
(10) Notes Payable
Changes in notes payable for the year ended June 30, 2012 are as follows:
Balance Balance2011 Additions Payments 2012
1978 Farmer's Home Loan Administration note $ 590,600 - (70,000) 520,600 Town of Yucca Valley note 350,000 - - 350,000
Total 940,600 - (70,000) 870,600
Less: current portion due (70,000) (425,000)
Long-term portion due $ 870,600 445,600
Changes in notes payable for the year ended June 30, 2011 are as follows:
Balance Balance2010 Additions Payments 2011
1978 Farmer's Home Loan Administration note $ 660,600 - (70,000) 590,600 Town of Yucca Valley note 350,000 - - 350,000
Total 1,010,600 - (70,000) 940,600
Less: current portion due (70,000) (75,000)
Long-term portion due $ 940,600 865,600
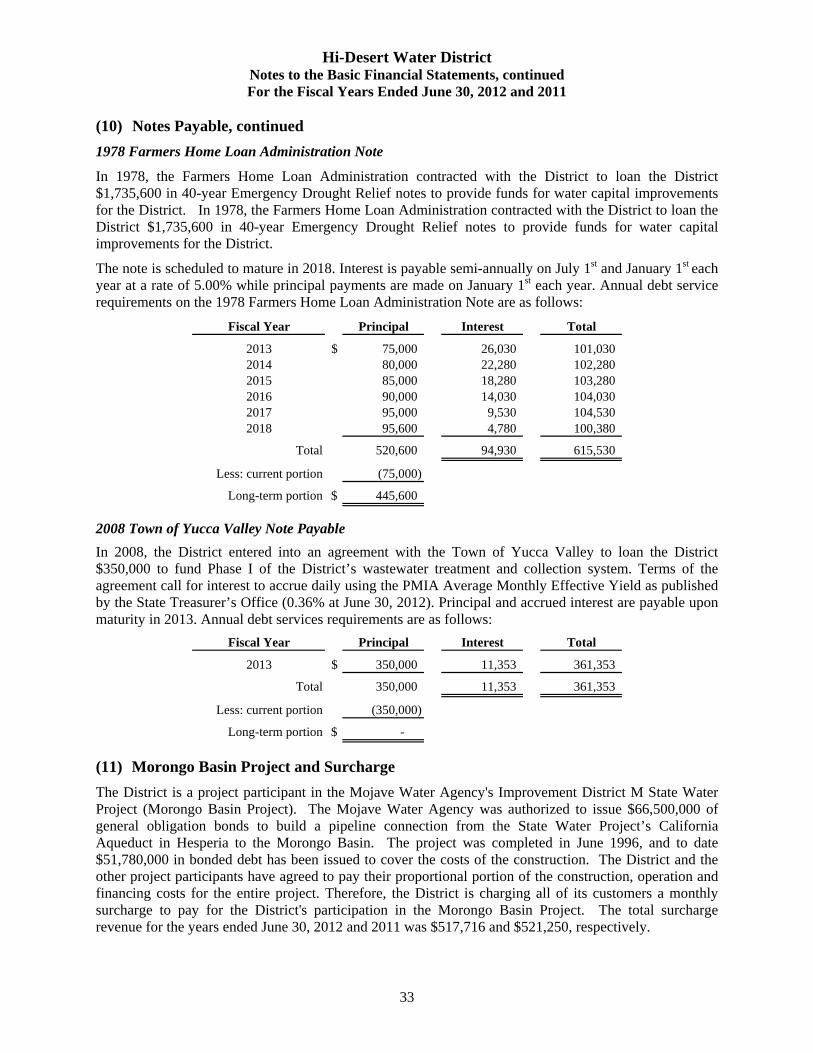
Hi-Desert Water District Notes to the Basic Financial Statements, continued For the Fiscal Years Ended June 30, 2012 and 2011
33
(10) Notes Payable, continued
1978 Farmers Home Loan Administration Note
In 1978, the Farmers Home Loan Administration contracted with the District to loan the District $1,735,600 in 40-year Emergency Drought Relief notes to provide funds for water capital improvements for the District. In 1978, the Farmers Home Loan Administration contracted with the District to loan the District $1,735,600 in 40-year Emergency Drought Relief notes to provide funds for water capital improvements for the District.
The note is scheduled to mature in 2018. Interest is payable semi-annually on July 1st and January 1st each year at a rate of 5.00% while principal payments are made on January 1st each year. Annual debt service requirements on the 1978 Farmers Home Loan Administration Note are as follows:
Fiscal Year Principal Interest Total
2013 $ 75,000 26,030 101,030 2014 80,000 22,280 102,280 2015 85,000 18,280 103,280 2016 90,000 14,030 104,030 2017 95,000 9,530 104,530 2018 95,600 4,780 100,380
Total 520,600 94,930 615,530
Less: current portion (75,000)
Long-term portion $ 445,600
2008 Town of Yucca Valley Note Payable
In 2008, the District entered into an agreement with the Town of Yucca Valley to loan the District $350,000 to fund Phase I of the District’s wastewater treatment and collection system. Terms of the agreement call for interest to accrue daily using the PMIA Average Monthly Effective Yield as published by the State Treasurer’s Office (0.36% at June 30, 2012). Principal and accrued interest are payable upon maturity in 2013. Annual debt services requirements are as follows:
Fiscal Year Principal Interest Total
2013 $ 350,000 11,353 361,353
Total 350,000 11,353 361,353
Less: current portion (350,000)
Long-term portion $ -
(11) Morongo Basin Project and Surcharge
The District is a project participant in the Mojave Water Agency's Improvement District M State Water Project (Morongo Basin Project). The Mojave Water Agency was authorized to issue $66,500,000 of general obligation bonds to build a pipeline connection from the State Water Project’s California Aqueduct in Hesperia to the Morongo Basin. The project was completed in June 1996, and to date $51,780,000 in bonded debt has been issued to cover the costs of the construction. The District and the other project participants have agreed to pay their proportional portion of the construction, operation and financing costs for the entire project. Therefore, the District is charging all of its customers a monthly surcharge to pay for the District's participation in the Morongo Basin Project. The total surcharge revenue for the years ended June 30, 2012 and 2011 was $517,716 and $521,250, respectively.

Hi-Desert Water District Notes to the Basic Financial Statements, continued For the Fiscal Years Ended June 30, 2012 and 2011
34
(11) Morongo Basin Project and Surcharge, continued
The agreement is being treated as a 25-year operating lease since title to the pipeline connection assets will not be transferred to the District. As part of the agreement, the District is required to pre-pay its portion of the lease (debt service on the project) on June 1, for the next fiscal year. The District’s commitment under the agreement is 17.70% of the annual bonded debt service requirements (principal and interest). The District’s remaining operating lease payments are as follows:
Due June 1st Amount
2013 $ 473,991 2014 473,991 2015 473,991 2016 473,991 2017 473,991
2018-2022 2,369,955
Total $ 4,739,910
At June 30, 2012 and 2011, the District has recorded a prepaid asset on the statement of net assets in the amount of $719,341 and $719,303, respectively, related to the Morongo Basin Project and Surcharge.
(12) Deferred Compensation Savings Plan
For the benefit of its employees, the District participates in a 457 Deferred Compensation Program (Program). The purpose of this Program is to provide deferred compensation for public employees that elect to participate in the Program. Generally, eligible employees may defer receipt of a portion of their salary until termination, retirement, death or unforeseeable emergency. Until the funds are paid or otherwise made available to the employee, the employee is not obligated to report the deferred salary for income tax purposes.
Federal law requires deferred compensation assets to be held in trust for the exclusive benefit of the participants. Accordingly, the District is in compliance with this legislation. Therefore, these assets are not the legal property of the District, and are not subject to claims of the District’s general creditors. Market value of all plan assets held in trust by CalPERS at June 30, 2012 and 201 was $86,073 and $41,613, respectively. The market value of all plan assets held in trust by Lincoln Financial Services at June 30, 2012 and 2011 was $676,516 and $677,773, respectively.
The District has implemented GASB Statement No. 32, Accounting and Financial Reporting for Internal Revenue Code Section 457 Deferred Compensation Plans. Since the District has little administrative involvement and does not perform the investing function for this plan, the assets and related liabilities are not shown on the statement of net assets.
(13) Defined Benefit Pension Plan
Plan Description
The District contributes to the California Public Employees Retirement System (CalPERS), a cost-sharing multi-employer defined benefit pension plan. CalPERS provides retirement and disability benefits, annual cost-of-living adjustments, and death benefits to plan members and beneficiaries. CalPERS act as a common investment and administrative agent for participating public agencies within the State of California. Benefit provisions and all other requirements are established by state statute and the Agency. Copies of CalPERS annual financial report may be obtained form their executive Office: 400 P Street, Sacramento, CA, 95814.

Hi-Desert Water District Notes to the Basic Financial Statements, continued For the Fiscal Years Ended June 30, 2012 and 2011
35
(13) Defined Benefit Pension Plan, continued
Funding Policy
The contribution rate for plan members in the CalPERS 2.5% at 55 Risk Pool Retirement Plan is 8% of their annual covered salary. The Agency makes these contributions required of Agency employees on their behalf and for their account. Also, the Agency is required to contribute the actuarially determined remaining amounts necessary to fund the benefits for its members. The required employer contribution rates are equal to the annual pension costs (APC) percentage of payroll for fiscal years 2012, 2011 and 2010 as noted below. The contribution requirements of the plan members are established by State statute, and the employer contribution rate is established and may be amended by CalPERS. For fiscal years 2012, 2011 and 2010, the Agencies annual contribution for CalPERS and were equal to the Agencies required and actual contribution for each fiscal year as follows:
Three Year Funding Information:
Annual Percentage Net APCFiscal Pension of APC Pension Percentage Year Cost (APC) Contributed Obligation of Payroll
2010 $ 596,566 100% - 15.797%2011 510,355 100% - 20.650%2012 527,741 100% - 18.825%
(14) Other Post-Employment Benefits Payable
The District provides other post-employment benefits (OPEB) to qualified employees who retire from the District and meet the District’s vesting requirements. During the fiscal year ended June 30, 2010, the District implemented GASB Statement No. 45, which changed the accounting and financial reporting used by local government employers for post employment benefits. Previously, the costs of such benefits were generally recognized as expenses of local government employers on a pay-as-you-go basis. The new reporting requirements for these benefit programs as they pertain to the District are set forth below.
Plan Description – Eligibility
A retired employee and dependent spouse, or spouse of a deceased employee or retiree must satisfy the following requirements in order to be eligible for post employment medical and dental benefits:
Full time employees hired before November 15, 2000 with 10 years of continuous service with a minimum of 50 years of age.
Full time employees hired on or after November 15, 2000 with 20 years of continuous service with a minimum of 55 years of age.
Full time employees hired on or after May 17, 2006 is a minimum of 55 years of age with a minimum of 20 years of continuous service will receive benefits until the earlier of age 65 or until eligible for Medicare.
Full time employees hired on or after July 1, 2009 are not eligible for post employment benefits.
If the spouse of a deceased employee or retiree remarries and becomes eligible for health benefits under his/her new spouse’s health plan, all District benefits shall be terminated.

Hi-Desert Water District Notes to the Basic Financial Statements, continued For the Fiscal Years Ended June 30, 2012 and 2011
36
(14) Other Post-Employment Benefits Payable, continued
Plan Description – Eligibility, continued
Membership in the OPEB plan consisted of the following members as of June 30:
2012 2011 2010
Active plan members 34 35 35 Retirees and beneficiaries receiving benefits 18 20 19 Separated plan members entitled to but not
yet receiving benefits - - -
Total plan membership 52 55 54
Plan Description – Benefits
The District offers post employment medical and dental benefits to retired employees who satisfy the eligibility rules. Spouses and surviving spouses are also eligible to receive benefits. Retirees may enroll in any plan available through the District’s medical and dental programs. The contribution requirements of Plan members and the District are established and may be amended by the Board of Directors.
Funding Policy
The District is required to contribute the Annual Required Contribution (ARC) of the Employer, an amount actuarially determined in accordance with the parameters of GASB Statement No. 45. The ARC represents a level of funding that, if paid on an ongoing basis, is projected to cover the normal cost each year and amortize any unfunded actuarial liabilities (or funding excess) over a period not to exceed thirty years. The current ARC rate is 21.1% of the annual covered payroll.
Annual Cost
For the fiscal years ended June 30, 2012 and 2011, the District’s ARC cost is $515,600 and $502,248, respectively. The District’s net OPEB payable obligation amounted to $976,083 and $738,201for the fiscal years ended June 30, 2012 and 2011, respectively. The District contributed $273,899 and $133,367 in adjusted contributions for current retiree OPEB premiums for the fiscal years ended June 30, 2012 and 2011, respectively.
The balance at June 30, consists of the following:
2012 2011 2010 Annual OPEB expense:
Annual required contribution (ARC) $ 515,600 502,248 501,746 Interest on net OPEB obligation 14,662 15,052 - Adjustment to annual required contribution (18,481) (25,259) -
Total annual OPEB expense 511,781 492,041 501,746
Change in net OPEB payable obligation:Age adjusted contributions made (273,899) (133,367) (122,219)
Total change in net OPEB payable obligation 237,882 358,674 (122,219)
OPEB payable – beginning of year 738,201 379,527 -
OPEB payable – end of year $ 976,083 738,201 379,527

Hi-Desert Water District Notes to the Basic Financial Statements, continued For the Fiscal Years Ended June 30, 2012 and 2011
37
(14) Other Post-Employment Benefits Payable, continued
Annual Cost, continued
The District’s annual OPEB cost, the percentage of the annual OPEB cost contributed to the Plan, and the net OPEB obligation for fiscal year 2012 and the two preceding years were as follows:
Fiscal Annual Age Percentage Net OPEBYear OPEB Adjusted of Annual OPEB Obligation
Ended Cost Contribution Cost Contributed Payable
2012 $ 575,600 273,899 47.58% $ 976,083 2011 502,248 133,367 26.55% 738,201 2010 501,746 122,219 24.36% 379,527
Three-Year History of Net OPEB Obligation
Funded Status and Funding Progress of the Plan
The most recent valuation (dated June 30, 2010) includes an Actuarial Accrued Liability and Unfunded Actuarial Accrued Liability of $3,296,127. The covered payroll (annual payroll of active employees covered by the plan) for the year ended June 30, 2012 was $2,444,369. The ratio of the unfunded actuarial accrued liability to annual covered payroll is 134.85%.
Actuarial Methods and Assumptions
Actuarial valuations involve estimates of the value of reported amounts and assumptions about the probability of events far into the future. Actuarially determined amounts are subject to continual revision as actual results are compared to past expectations and new estimates are made about the future. Calculations are based on the types of benefits provided under the terms of the substantive plan at the time of each valuation and the pattern of sharing of costs between the employer and plan members to that point. Consistent with the long-term perspective of actuarial calculations, actuarial methods and assumptions used include techniques that are designed to reduce short-term volatility in actuarial accrued liabilities for benefits.
The following is a summary of the actuarial assumptions and methods:
Valuation date June 30, 2012Actuarial cost method Entry age normal cost methodAmortization method Level percent of payroll amortizationRemaining amortization period 28 Years as of the valuation dateAsset valuation method 10 Year smoothed marketActuarial assumptions: Projected salary increase 0.10% Inflation - discount rate 3.00% Individual salary growth District annual COLA
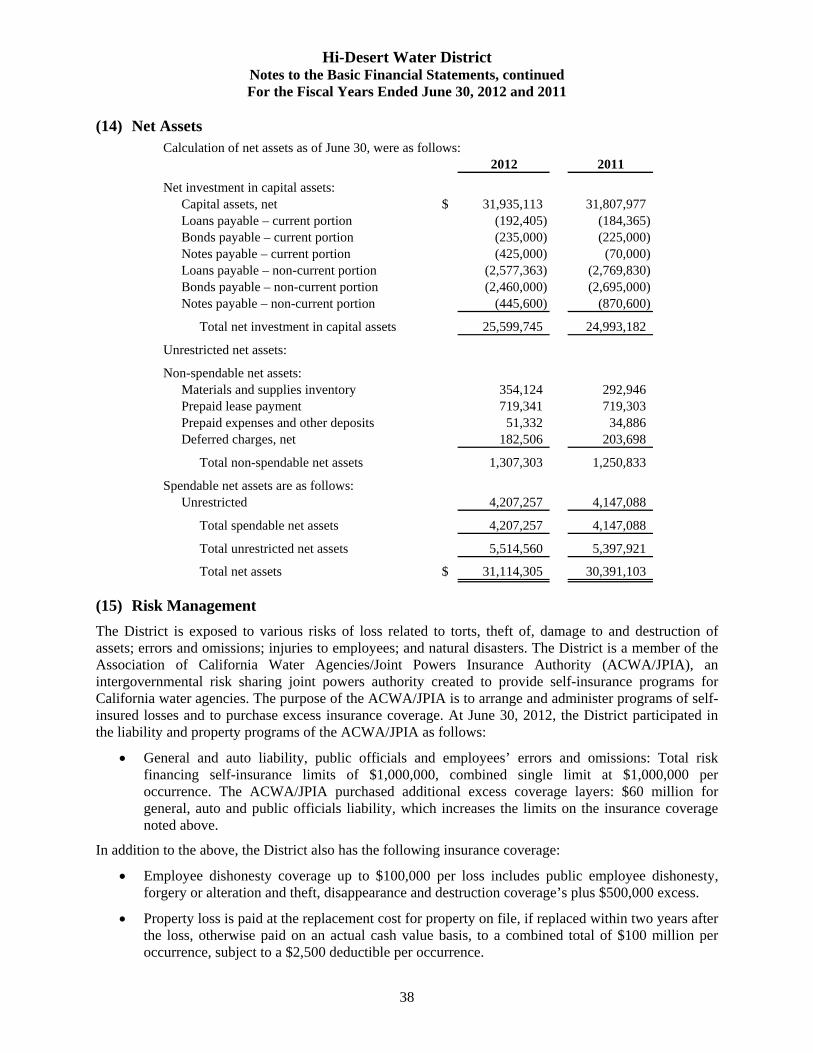
Hi-Desert Water District Notes to the Basic Financial Statements, continued For the Fiscal Years Ended June 30, 2012 and 2011
38
(14) Net Assets Calculation of net assets as of June 30, were as follows:
2012 2011
Net investment in capital assets:Capital assets, net $ 31,935,113 31,807,977 Loans payable – current portion (192,405) (184,365) Bonds payable – current portion (235,000) (225,000) Notes payable – current portion (425,000) (70,000) Loans payable – non-current portion (2,577,363) (2,769,830) Bonds payable – non-current portion (2,460,000) (2,695,000) Notes payable – non-current portion (445,600) (870,600)
Total net investment in capital assets 25,599,745 24,993,182
Unrestricted net assets:
Non-spendable net assets:Materials and supplies inventory 354,124 292,946 Prepaid lease payment 719,341 719,303 Prepaid expenses and other deposits 51,332 34,886 Deferred charges, net 182,506 203,698
Total non-spendable net assets 1,307,303 1,250,833
Spendable net assets are as follows:Unrestricted 4,207,257 4,147,088
Total spendable net assets 4,207,257 4,147,088
Total unrestricted net assets 5,514,560 5,397,921
Total net assets $ 31,114,305 30,391,103
(15) Risk Management
The District is exposed to various risks of loss related to torts, theft of, damage to and destruction of assets; errors and omissions; injuries to employees; and natural disasters. The District is a member of the Association of California Water Agencies/Joint Powers Insurance Authority (ACWA/JPIA), an intergovernmental risk sharing joint powers authority created to provide self-insurance programs for California water agencies. The purpose of the ACWA/JPIA is to arrange and administer programs of self-insured losses and to purchase excess insurance coverage. At June 30, 2012, the District participated in the liability and property programs of the ACWA/JPIA as follows:
General and auto liability, public officials and employees’ errors and omissions: Total risk financing self-insurance limits of $1,000,000, combined single limit at $1,000,000 per occurrence. The ACWA/JPIA purchased additional excess coverage layers: $60 million for general, auto and public officials liability, which increases the limits on the insurance coverage noted above.
In addition to the above, the District also has the following insurance coverage:
Employee dishonesty coverage up to $100,000 per loss includes public employee dishonesty, forgery or alteration and theft, disappearance and destruction coverage’s plus $500,000 excess.
Property loss is paid at the replacement cost for property on file, if replaced within two years after the loss, otherwise paid on an actual cash value basis, to a combined total of $100 million per occurrence, subject to a $2,500 deductible per occurrence.

Hi-Desert Water District Notes to the Basic Financial Statements, continued For the Fiscal Years Ended June 30, 2012 and 2011
39
(15) Risk Management, continued
Boiler and machinery coverage for the replacement cost up to $100 million per occurrence, subject to various deductibles depending on the type of equipment.
Workers’ compensation insurance up to California statutory limits for all work related injuries/illnesses covered by California law purchased through the Special District Risk Management Authority (SDRMA).
Settled claims have not exceeded any of the coverage amounts in any of the last three fiscal years and there were no reductions in the District’s insurance coverage during the years ending June 30, 2012, 2011 and 2010. Liabilities are recorded when it is probable that a loss has been incurred and the amount of the loss can be reasonably estimated net of the respective insurance coverage. Liabilities include an amount for claims that have been incurred but not reported (IBNR). There were no IBNR claims payable as of June 30, 2012, 2011 and 2010.
(16) Governmental Accounting Standards Board Statements Issued, Not Yet Effective
The Governmental Accounting Standards Board (GASB) has issued several pronouncements prior to June 30, 2012, that has effective dates that may impact future financial presentations.
Governmental Accounting Standards Board Statement No. 60
In November 2010, the GASB issued Statement No. 60, Accounting and Financial Reporting for Service Concession Arrangements. This standard address how to account for and report service concession arrangements, a type of public-private or public-public partnership that state and local governments are increasingly entering into. This statement is effective for financial statements for periods beginning after December 15, 2011. The impact of the implementation of this Statement to the District’s financial statements has not been assessed at this time.
Governmental Accounting Standards Board Statement No. 61
In November 2010, the GASB issued Statement No. 61, The Financial Reporting Entity, Omnibus. This standard is designed to improve financial reporting for governmental entities by amending the requirements of GASB Statement No. 14, The Financial Reporting Entity, and GASB Statement No. 34, Basic Financial Statement and Management’s Discussion and Analysis for State and local Governments. This statement is effective for financial statements for periods beginning after June 15, 2012. The impact of the implementation of this Statement to the District’s financial statements has not been assessed at this time.
Governmental Accounting Standards Board Statement No. 62
In December 2010, The GASB issued Statement No. 62 – Codification of Accounting and Financial Reporting Guidance Contained in Pre-November 30, 1989 FASB and AICPA Pronouncements. The objective of this Statement is to incorporate into the GASB’s authoritative literature certain accounting and financial reporting guidance that is included in the following pronouncements issued on or before November 30, 1989, which does not conflict with or contradict GASB pronouncements:
1. Financial Accounting Standards Board (FASB) Statements and Interpretations
2. Accounting Principles Board Opinions
3. Accounting Research Bulletins of the American Institute of Certified Public Accountants’ (AICPA) Committee on Accounting Procedure.

Hi-Desert Water District Notes to the Basic Financial Statements, continued For the Fiscal Years Ended June 30, 2012 and 2011
40
(16) Governmental Accounting Standards Board Statements Issued, Not Yet Effective
Governmental Accounting Standards Board Statement No. 62, continued
Hereinafter, these pronouncements collectively are referred to as the “FASB and AICPA pronouncements.” This Statement also supersedes Statement No. 20, Accounting and Financial Reporting for Proprietary Funds and Other Governmental Entities That Use Proprietary Fund Accounting, thereby eliminating the election provided in paragraph 7 of that Statement for enterprise funds and business-type activities to apply post-November 30, 1989 FASB Statements and Interpretations that do not conflict with or contradict GASB pronouncements. However, those entities can continue to apply, as other accounting literature, post-November 30, 1989 FASB pronouncements that do not conflict with or contradict GASB pronouncements, including this Statement. The requirements of this Statement are effective for financial statements for periods beginning after December 15, 2011. The provisions of this Statement generally are required to be applied retroactively for all periods presented.
Governmental Accounting Standards Board Statement No. 63
In June 2011, the GASB issued Statement No. 63, Financial Reporting of Deferred Outflows of Resources, Deferred Inflows of Resources, and Net Position. This standard is designed to improve financial reporting by standardizing the presentation of deferred outflows of resources and deferred inflows of resources into the definitions of the required components of the residual measure and by renaming that measure as net position, rather than net assets. This statement is effective for financial statements for periods beginning after December 15, 2011. The impact of the implementation of this Statement to the District’s financial statements has not been assessed at this time.
Governmental Accounting Standards Board Statement No. 64
In June 2011, the GASB issued Statement No. 64, Derivative Instruments: Application of Hedge Accounting Termination Provisions – an amendment of GASB Statement No. 53. This standard is designed to improve financial reporting by clarifying the circumstances in which hedge accounting should continue when a swap counterparty, or swap counterparty’s credit support provider, is replaced. This statement is effective for financial statements for periods beginning after December 15, 2011. The impact of the implementation of this Statement to the District’s financial statements has not been assessed at this time.
Governmental Accounting Standards Board Statement No. 65
In March 2012, the GASB issued Statement No. 65 – Items Previously Reported as Assets and Liabilities. This Statement establishes accounting and financial reporting standards that reclassify, as deferred outflows of resources or deferred inflows of resources, certain items that were previously reported as assets and liabilities and recognizes, as outflows of resources or inflows of resources, certain items that were previously reported as assets and liabilities. The provisions of this Statement are effective for financial statements for periods beginning after December 15, 2012. The impact of the implementation of this Statement to the District’s financial statements has not been assessed at this time.
Governmental Accounting Standards Board Statement No. 66
In March 2012, the GASB issued Statement No. 66 – Technical Corrections—2012—an amendment of GASB Statements No. 10 and No. 62. The objective of this Statement is to improve accounting and financial reporting for a governmental financial reporting entity by resolving conflicting guidance that resulted from the issuance of two pronouncements, Statements No. 54, Fund Balance Reporting and Governmental Fund Type Definitions, and No. 62, Codification of Accounting and Financial Reporting Guidance Contained in Pre-November 30, 1989 FASB and AICPA Pronouncements. The provisions of this Statement are effective for financial statements for periods beginning after December 15, 2012. The impact of the implementation of this Statement to the District’s financial statements has not been assessed at this time.

Hi-Desert Water District Notes to the Basic Financial Statements, continued For the Fiscal Years Ended June 30, 2012 and 2011
41
(16) Governmental Accounting Standards Board Statements Issued, Not Yet Effective
Governmental Accounting Standards Board Statement No. 68
In June 2012, the GASB issued Statement No. 68 – Accounting and Financial Reporting for Pensions—an amendment of GASB Statement No. 27. The primary objective of this Statement is to improve accounting and financial reporting by state and local governments for pensions. It also improves information provided by state and local governmental employers about financial support for pensions that is provided by other entities. This Statement results from a comprehensive review of the effectiveness of existing standards of accounting and financial reporting for pensions with regard to providing decision-useful information, supporting assessments of accountability and inter-period equity, and creating additional transparency.
This Statement replaces the requirements of Statement No. 27, Accounting for Pensions by State and Local Governmental Employers, as well as the requirements of Statement No. 50, Pension Disclosures, as they relate to pensions that are provided through pension plans administered as trusts or equivalent arrangements (hereafter jointly referred to as trusts) that meet certain criteria. The requirements of Statements 27 and 50 remain applicable for pensions that are not covered by the scope of this Statement. The provisions of Statement 68 are effective for fiscal years beginning after June 15, 2014. The impact of the implementation of this Statement to the District’s financial statements has not been assessed at this time.
(17) Commitments and Contingencies
Grant Awards
Grant funds received by the District are subject to audit by the grantor agencies. Such audit could lead to requests for reimbursements to the grantor agencies for expenditures disallowed under terms of the grant. Management of the District believes that such disallowances, if any, would not be significant.
Litigation
In the ordinary course of operations, the District is subject to claims and litigation from outside parties. After consultation with legal counsel, the District believes the ultimate outcome of such matters, if any, will not materially affect its financial condition.
(18) Subsequent Event
Events occurring after June 30, 2012 have been evaluated for possible adjustment to the financial statements or disclosure as of December 7, 2012, which is the date the financial statements were available to be issued.
2008 Town of Yucca Valley Note Payable
On October 10, 2012, the District paid off the 2008 loan with the Town of Yucca Valley in the amount of $350,000 plus accrued interest in the amount of $17,084.

Required Supplementary Information

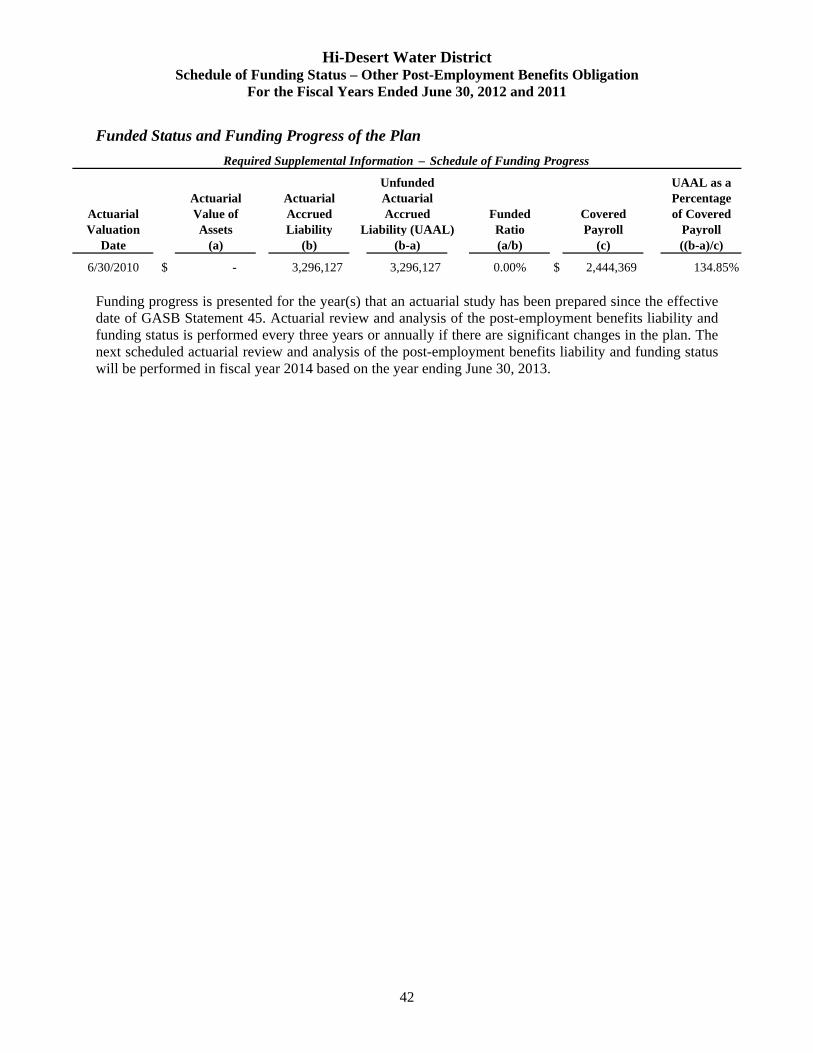
Hi-Desert Water District Schedule of Funding Status – Other Post-Employment Benefits Obligation
For the Fiscal Years Ended June 30, 2012 and 2011
42
Funded Status and Funding Progress of the Plan
Unfunded UAAL as aActuarial Actuarial Actuarial Percentage
Actuarial Value of Accrued Accrued Funded Covered of CoveredValuation Assets Liability Liability (UAAL) Ratio Payroll Payroll
Date (a) (b) (b-a) (a/b) (c) ((b-a)/c)
6/30/2010 $ - 3,296,127 3,296,127 0.00% $ 2,444,369 134.85%
Required Supplemental Information – Schedule of Funding Progress
Funding progress is presented for the year(s) that an actuarial study has been prepared since the effective date of GASB Statement 45. Actuarial review and analysis of the post-employment benefits liability and funding status is performed every three years or annually if there are significant changes in the plan. The next scheduled actuarial review and analysis of the post-employment benefits liability and funding status will be performed in fiscal year 2014 based on the year ending June 30, 2013.
Supplemental Information Section


Hi-Desert Water District Combining Schedule of Net Assets
June 30, 2012
43
Water Fund Sewer Fund Total
Current assets:Cash and cash equivalents $ 6,308,753 17,755 6,326,508 Accrued interest receivable 3,837 - 3,837 Accounts receivable – water sales and services, net 765,249 - 765,249 Accounts receivable – property taxes 55,683 70,245 125,928 Accounts receivable – other 99,385 - 99,385 Internal balances 2,720,708 (2,720,708) - Materials and supplies inventory 354,124 - 354,124 Prepaid lease payment 719,341 - 719,341 Prepaid expense and other deposits 51,332 - 51,332
Total current assets 11,078,412 (2,632,708) 8,445,704
Non-current assets:Deferred charges, net 182,506 - 182,506 Capital assets – not being depreciated 1,938,645 2,058,291 3,996,936 Depreciable capital assets, net 27,938,177 - 27,938,177
Total non-current assets 30,059,328 2,058,291 32,117,619
Total assets $ 41,137,740 (574,417) 40,563,323
Current liabilities:Accounts payable and accrued expenses $ 315,596 111,479 427,075 Deposits and deferred revenue 326,170 - 326,170 Accrued interest on long-term debt 81,953 17,063 99,016 Long-term liabilities – due within one year:
Compensated absences 55,751 - 55,751 Pension related debt 57,820 - 57,820 Loans payable 192,405 - 192,405 Bonds payable 235,000 - 235,000 Notes payable 75,000 350,000 425,000
Total current liabilities 1,339,695 478,542 1,818,237
Non-current liabilitiesLong-term liabilities – due in more than one year:
Compensated absences 167,251 - 167,251 Other post employment benefits 976,083 - 976,083 Pension related debt 1,004,484 - 1,004,484 Loans payable 2,577,363 - 2,577,363 Bonds payable 2,460,000 - 2,460,000 Notes payable 445,600 - 445,600
Total non-current liabilities 7,630,781 - 7,630,781
Total liabilities 8,970,476 478,542 9,449,018
Net assets:Invested in capital assets, net of related debt 23,891,454 1,708,291 25,599,745 Unrestricted 8,275,810 (2,761,250) 5,514,560
Total net assets 32,167,264 (1,052,959) 31,114,305
Total liabilities and net assets $ 41,137,740 (574,417) 40,563,323
See accompanying notes to the basic financial statements
Assets
Liabilities and Net Assets
Enterprise Funds

Hi-Desert Water District Combining Schedule of Net Assets
June 30, 2011
44
Water Fund Sewer Fund Total
Current assets:Cash and cash equivalents $ 4,907,072 108,502 5,015,574 Accrued interest receivable 3,924 - 3,924 Accounts receivable – water sales and services, net 701,508 - 701,508 Accounts receivable – property taxes 58,780 - 58,780 Accounts receivable – other 201,727 - 201,727 Internal balances 2,249,016 (2,249,016) - Materials and supplies inventory 292,946 - 292,946 Prepaid lease payment 719,303 - 719,303 Prepaid expense and other deposits 34,886 - 34,886
Total current assets 9,169,162 (2,140,514) 7,028,648
Non-current assets:Deferred charges, net 203,698 - 203,698 Capital assets – not being depreciated 1,944,980 2,058,291 4,003,271 Depreciable capital assets, net 27,804,706 - 27,804,706
Total non-current assets 29,953,384 2,058,291 32,011,675
Total assets $ 39,122,546 (82,223) 39,040,323
Current liabilities:Accounts payable and accrued expenses $ 397,337 35,406 432,743 Deposits and deferred revenue 341,029 - 341,029 Accrued interest on long-term debt 87,027 17,063 104,090 Long-term liabilities – due within one year:
Compensated absences 54,590 - 54,590 Loans payable 184,365 - 184,365 Bonds payable 225,000 - 225,000 Notes payable 70,000 - 70,000
Total current liabilities 1,359,348 52,469 1,411,817
Non-current liabilitiesLong-term liabilities – due in more than one year:
Compensated absences 163,772 - 163,772 Other post employment benefits 738,201 - 738,201 Loans payable 2,769,830 - 2,769,830 Bonds payable 2,695,000 - 2,695,000 Notes payable 520,600 350,000 870,600
Total non-current liabilities 6,887,403 350,000 7,237,403
Total liabilities 8,246,751 402,469 8,649,220
Net assets:Invested in capital assets, net of related debt 23,284,891 1,708,291 24,993,182 Unrestricted 7,590,904 (2,192,983) 5,397,921
Total net assets 30,875,795 (484,692) 30,391,103
Total liabilities and net assets $ 39,122,546 (82,223) 39,040,323
See accompanying notes to the basic financial statements
Assets
Liabilities and Net Assets
Enterprise Funds

Hi-Desert Water District Combining Schedule of Revenues, Expenses and Changes in Net Assets
For the Fiscal Year Ended June 30, 2012
45
Water Fund Sewer Fund Total
Operating revenues:Water consumption sales $ 5,647,160 - 5,647,160 Readiness-to-serve fees 1,679,168 - 1,679,168 Other charges 328,232 - 328,232
Total operating revenues 7,654,560 - 7,654,560
Operating expenses:Source of supply 532,350 - 532,350 Pumping and water treatment 1,564,708 - 1,564,708 Transmission and distribution 925,133 - 925,133 Customer accounts 551,548 - 551,548 Wastewater operations - 1,084,190 1,084,190 General and administrative 2,495,464 - 2,495,464
Total operating expenses 6,069,203 1,084,190 7,153,393
Operating income(loss) before depreciation and amortization 1,585,357 (1,084,190) 501,167 Depreciation (1,372,467) - (1,372,467) Amortization (21,192) - (21,192)
Operating loss 191,698 (1,084,190) (892,492)
Non-operating revenue(expense)Property taxes 1,292,775 - 1,292,775 Interest earnings 14,148 - 14,148 Capital surcharge 893,895 - 893,895 Morongo Basin Project surcharge 517,716 - 517,716 Lease payment – Morongo Basin Project (524,958) - (524,958) CalPERS Side-Fund expense (1,062,304) - (1,062,304) Interest expense – long-term debt (243,280) - (243,280) Other non-operating revenues, net 40,379 - 40,379
Total non-operating revenues, net 928,371 - 928,371
Income(loss) before capital contributions 1,120,069 (1,084,190) 35,879
Capital contributions:Grant revenue 49,804 515,923 565,727 Meter sales and installations 121,596 - 121,596
Total capital contributions 171,400 515,923 687,323
Change in net assets 1,291,469 (568,267) 723,202
Net assets – beginning of year 30,875,795 (484,692) 30,391,103
Net assets – end of year $ 32,167,264 (1,052,959) 31,114,305
See accompanying notes to the basic financial statements
Enterprise Funds
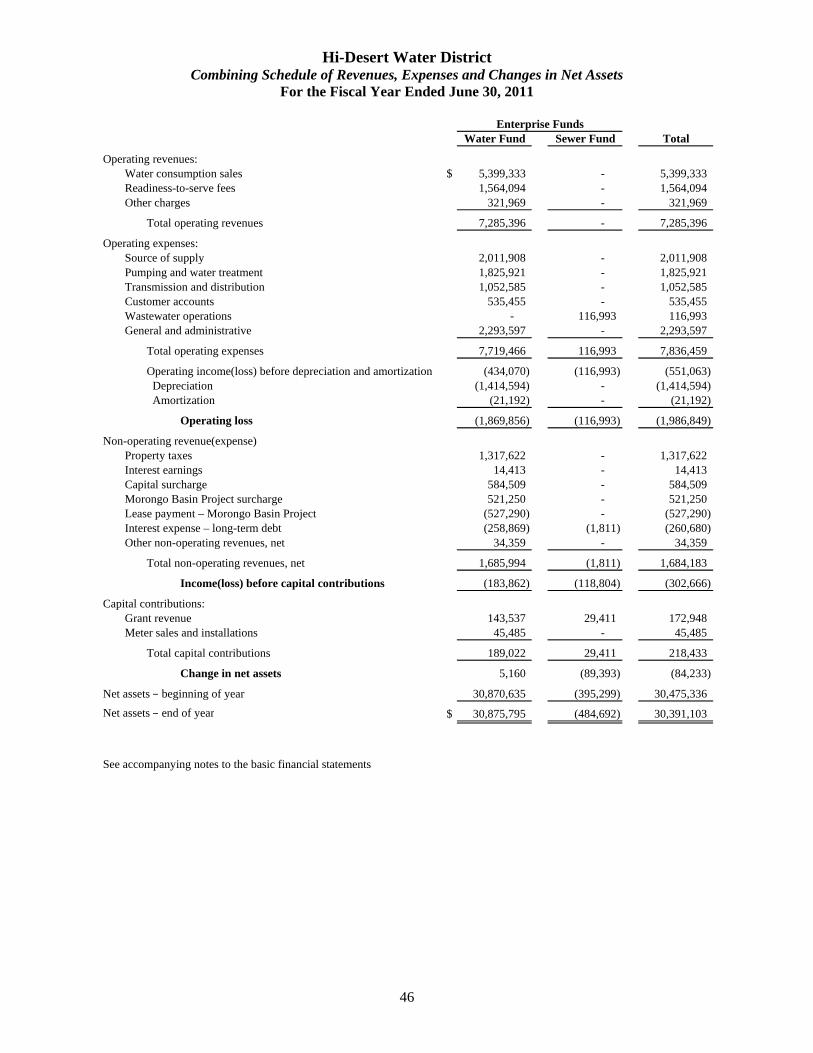
Hi-Desert Water District Combining Schedule of Revenues, Expenses and Changes in Net Assets
For the Fiscal Year Ended June 30, 2011
46
Water Fund Sewer Fund Total
Operating revenues:Water consumption sales $ 5,399,333 - 5,399,333 Readiness-to-serve fees 1,564,094 - 1,564,094 Other charges 321,969 - 321,969
Total operating revenues 7,285,396 - 7,285,396
Operating expenses:Source of supply 2,011,908 - 2,011,908 Pumping and water treatment 1,825,921 - 1,825,921 Transmission and distribution 1,052,585 - 1,052,585 Customer accounts 535,455 - 535,455 Wastewater operations - 116,993 116,993 General and administrative 2,293,597 - 2,293,597
Total operating expenses 7,719,466 116,993 7,836,459
Operating income(loss) before depreciation and amortization (434,070) (116,993) (551,063) Depreciation (1,414,594) - (1,414,594) Amortization (21,192) - (21,192)
Operating loss (1,869,856) (116,993) (1,986,849)
Non-operating revenue(expense)Property taxes 1,317,622 - 1,317,622 Interest earnings 14,413 - 14,413 Capital surcharge 584,509 - 584,509 Morongo Basin Project surcharge 521,250 - 521,250 Lease payment – Morongo Basin Project (527,290) - (527,290) Interest expense – long-term debt (258,869) (1,811) (260,680) Other non-operating revenues, net 34,359 - 34,359
Total non-operating revenues, net 1,685,994 (1,811) 1,684,183
Income(loss) before capital contributions (183,862) (118,804) (302,666)
Capital contributions:Grant revenue 143,537 29,411 172,948 Meter sales and installations 45,485 - 45,485
Total capital contributions 189,022 29,411 218,433
Change in net assets 5,160 (89,393) (84,233)
Net assets – beginning of year 30,870,635 (395,299) 30,475,336
Net assets – end of year $ 30,875,795 (484,692) 30,391,103
See accompanying notes to the basic financial statements
Enterprise Funds
Statistical Information Section


Hi-Desert Water District Statistical Section
47
This part of the District’s comprehensive annual financial report presents detailed information as a context for understanding what the information in the financial statements, note disclosures, and required supplementary information says about the District’s overall financial health.
Table of Contents
Page No. Financial Trends 48-51 These schedules contain information to help the reader understand how the District’s financial performance and well-being have changed over time. Revenue Capacity 52-55 These schedules contain information to help the reader assess the District’s most significant own-source revenue, water sales. Debt Capacity 56-57 These schedules present information to help the reader assess the affordability of the District’s current levels of outstanding debt and the District’s ability to issue additional debt in the future. Demographic Information 58 This schedule offers demographic indicators to help the reader understand the environment within which the District’s financial activities take place. Operating Information 59 This schedule contains service and infrastructure data to help the reader understand how the information in the District’s financial report relates to the service the District provides.

Hi-Desert Water District Changes in Net Assets and Net Assets by Component Last Ten Fiscal Years
48
2003 2004 2005 2006 2007
Changes in net assets:Operating revenues (see Schedule 2) $ 5,699,619 6,110,334 6,093,782 6,425,232 7,217,095 Operating expenses (see Schedule 3) (4,527,353) (4,968,356) (5,817,566) (6,246,266) (7,439,423) Depreciation and amortization (1,169,417) (1,215,006) (1,242,872) (1,327,810) (1,359,177)
Operating income(loss) 2,849 (73,028) (966,656) (1,148,844) (1,581,505)
Non-operating revenues(expenses):Property taxes 905,288 923,936 245,592 400,014 1,423,132 Rental income - cellular antennas 38,616 46,533 47,817 49,584 48,149 Investment income 145,913 101,439 140,043 245,540 301,267 Tax revenue recovery surcharge - - 98,473 608,050 621,257 Contract water delivery charge - - - 547,605 - Dept. of Water Resources Reach II surcharge - - 339,119 325,411 331,595 Morongo Basin Project 1,806,664 1,923,990 1,501,624 619,261 548,322 Lease payment - Morongo Basin Project (1,367,880) (1,365,480) (892,393) (665,933) (474,449) Interest expense (622,952) (607,800) (499,214) (470,576) (445,216) Other revenue/(expense), net (1) 132,074 84,238 134,113 160,120 561,897
Total non-operating revenues(expenses), net 1,037,723 1,106,856 1,115,174 1,819,076 2,915,954
Net income (loss) before capital contributions 1,040,572 1,033,828 148,518 670,232 1,334,449
Capital contributions - 71,760 1,062,925 1,971,144 1,019,619
Changes in net assets $ 1,040,572 1,105,588 1,211,443 2,641,376 2,354,068
Net assets by component:Invested in capital assets, net of related debt $ 12,181,660 13,202,861 15,771,673 19,148,873 19,646,826 Restricted - - - - - Unrestricted 9,063,867 9,148,254 7,790,885 7,055,061 8,911,176
Total net assets $ 21,245,527 22,351,115 23,562,558 26,203,934 28,558,002
Note: (1) Includes CalPERS Side-Fund expense in FY 2012.
Source: Hi-Desert Water District Accounting Department
Fiscal Year
($500,000)
$0
$500,000
$1,000,000
$1,500,000
$2,000,000
$2,500,000
$3,000,000
Cha
nge
in N
et A
sset
s
Fiscal Year

Schedule 1
49
2008 2009 2010 2011 2012
6,949,058 7,118,299 7,137,442 7,285,396 7,654,560 (8,045,653) (8,199,546) (7,574,071) (7,836,459) (7,153,393) (1,379,933) (1,405,368) (1,433,748) (1,435,786) (1,393,659)
(2,476,528) (2,486,615) (1,870,377) (1,986,849) (892,492)
1,571,117 1,568,181 1,394,480 1,317,622 1,292,775 4,025 - - - -
306,604 144,520 35,667 14,413 14,148 260,317 - - - -
- - - - - 332,566 336,994 334,852 584,509 893,895 531,664 527,101 523,761 521,250 517,716
(494,987) (287,098) (523,984) (527,290) (524,958) (370,525) (348,944) (296,724) (260,680) (243,280)
98,736 697 1,370,945 34,359 (1,021,925)
2,239,517 1,941,451 2,838,997 1,684,183 928,371
(237,011) (545,164) 968,620 (302,666) 35,879
189,483 1,001,108 540,298 218,433 687,323
(47,528) 455,944 1,508,918 (84,233) 723,202
20,791,852 22,214,518 24,348,361 24,993,182 25,599,745 - - - - -
7,718,622 6,751,900 6,126,975 5,397,921 5,514,560
28,510,474 28,966,418 30,475,336 30,391,103 31,114,305
Fiscal Year
$0
$5,000,000
$10,000,000
$15,000,000
$20,000,000
$25,000,000
$30,000,000
$35,000,000
Net
Ass
ets
Fiscal Year

Hi-Desert Water District Operating Revenue by Source Last Ten Fiscal Years Schedule 2
50
Fiscal Water Connection Readiness-to-serve Service Other Total OperatingYear Consumption Sales Fees Fees Assessments Charges Revenue
2003 $ 3,937,352 745,347 228,668 646,129 142,123 5,699,619 2004 4,391,789 762,257 270,190 510,358 175,740 6,110,334 2005 4,794,647 - 1,107,823 - 191,312 6,093,782 2006 (1) 5,146,001 - 1,070,837 - 208,394 6,425,232 2007 (1) 5,919,654 - 1,063,068 - 234,373 7,217,095 2008 5,445,196 - 1,242,602 - 261,260 6,949,058 2009 5,430,238 - 1,417,866 - 270,195 7,118,299 2010 5,377,069 - 1,477,703 - 282,670 7,137,442 2011 5,399,333 - 1,564,094 - 321,969 7,285,396 2012 5,647,160 - 1,679,168 - 328,232 7,654,560
Notes: (1) Operating revenues were recategorized in 2005
Source: Hi-Desert Water District Accounting Department
$0
$1,000,000
$2,000,000
$3,000,000
$4,000,000
$5,000,000
$6,000,000
$7,000,000
$8,000,000
$9,000,000
Rev
enu
e
Fiscal Year

Hi-Desert Water District Operating Expenses by Activity Last Ten Fiscal Years Schedule 3
51
Fiscal Source of Pumping and Transmission and Customer General and Wastwater Total OperatingYear Supply Water Treatment Distribution Accounts Administrative Operations Expenses
2003 $ 880,850 1,295,596 687,590 126,018 1,537,299 - 4,527,353 2004 909,864 1,561,586 753,612 182,237 1,561,057 - 4,968,356 2005 1,155,796 1,968,702 816,436 172,503 1,704,129 - 5,817,566 2006 587,457 1,754,028 1,061,388 255,359 2,040,429 - 5,698,661 2007 1,724,994 1,688,838 1,263,450 321,997 2,440,144 - 7,439,423 2008 1,379,445 1,776,631 1,399,020 400,415 2,266,195 823,947 8,045,653 2009 807,326 1,864,326 1,429,091 165,875 2,761,521 1,171,407 8,199,546 2010 985,193 1,848,562 1,221,711 30,816 2,764,665 723,124 7,574,071 2011 2,011,908 1,825,921 1,052,585 535,455 2,293,597 116,993 7,836,459 2012 532,350 1,564,708 925,133 551,548 2,495,464 1,084,190 7,153,393
#
Source: Hi-Desert Water District Accounting Department
$0
$1,000,000
$2,000,000
$3,000,000
$4,000,000
$5,000,000
$6,000,000
$7,000,000
$8,000,000
$9,000,000
Exp
ense
s
Fiscal Year

Hi-Desert Water District Revenue Base Last Ten Fiscal Years Schedule 4
52
Fiscal Water Sales Water ProducedYear (HCF) (HCF)
2003 1,214,607 1,381,082 2004 1,235,009 1,358,331 2005 1,234,487 1,357,679 2006 1,258,803 1,386,737 2007 1,442,794 1,511,401 2008 1,283,452 1,421,493 2009 1,215,482 1,449,610 2010 1,131,666 1,383,037 2011 1,076,856 1,359,862 2012 1,070,166 1,308,588
Note: See Schedule 2 "Operating Revenue by Source" for information regarding water revenues.
Source: Hi-Desert Water District Accounting Department
0
200,000
400,000
600,000
800,000
1,000,000
1,200,000
1,400,000
1,600,000
Cu
bic
Fee
t (i
n H
un
dre
ds)
Fiscal Year

Hi-Desert Water District Revenue Rates(1) Last Ten Fiscal Years Schedule 5
53
HCF Consumed 2003 2004 2005 2006 2007 2008 2009 2010 2011 2012
0-4 $ 2.00 2.32 2.64 2.80 2.80 2.97 2.97 3.18 3.40 3.595-10 3.15 3.63 4.11 4.35 4.35 4.61 4.61 4.97 5.30 5.6911-28 4.30 4.68 5.06 5.25 5.25 5.57 5.57 6.01 6.41 6.8929-40 5.85 6.23 6.61 6.80 6.80 7.21 7.21 8.04 8.56 9.0841-53 5.85 6.23 6.61 6.80 6.80 7.21 7.21 8.04 8.56 9.0854-65 6.90 7.18 7.46 7.60 7.60 8.06 8.06 8.04 8.56 9.0866-78 6.90 7.18 7.46 7.60 7.60 8.06 8.06 8.04 8.56 9.08
79-over 6.90 7.18 7.46 7.60 7.60 8.06 8.06 8.04 8.56 9.08
Meter Size 2003 2004 2005 2006 2007 2008 2009 2010 2011 2012
5/8" & 3/4" $ 7.00 7.00 7.00 7.00 7.00 10.00 10.00 10.40 11.10 11.801" 14.00 14.00 14.00 14.00 14.00 20.00 20.00 21.10 22.50 23.80
1 1/2" 21.00 21.00 21.00 21.00 21.00 30.00 30.00 38.90 41.50 43.802" 35.00 35.00 35.00 35.00 35.00 50.00 50.00 60.20 64.20 67.803" 77.00 77.00 77.00 77.00 77.00 110.00 110.00 117.10 124.90 131.904" 119.00 119.00 119.00 119.00 119.00 170.00 170.00 118.10 193.10 203.906" 231.00 231.00 231.00 231.00 231.00 330.00 330.00 368.80 382.70 404.10
Meter Size 2003 2004 2005 2006 2007 2008 2009 2010 2011 2012
5/8" & 3/4" $ 11.00 11.00 6.00 4.50 4.00 4.00 4.00 4.00 4.00 4.001" 30.00 30.00 12.00 9.00 8.00 8.00 8.00 8.00 8.00 8.00
1 1/2" 45.00 45.00 18.00 13.50 12.00 12.00 12.00 12.00 12.00 12.002" 75.00 75.00 30.00 22.50 20.00 20.00 20.00 20.00 20.00 20.003" 165.00 165.00 66.00 49.50 44.00 44.00 44.00 44.00 44.00 44.004" 245.00 245.00 98.00 98.00 68.00 68.00 68.00 68.00 68.00 68.006" 495.00 495.00 198.00 198.00 132.00 132.00 132.00 132.00 132.00 132.00
Meter Size 2003 2004 2005 2006 2007 2008 2009 2010 2011 2012
5/8" & 3/4" $ 2.50 2.50 2.50 2.50 2.50 2.50 2.50 2.50 5.00 7.501" 5.00 5.00 5.00 5.00 5.00 5.00 5.00 5.00 10.00 15.00
1 1/2" 7.50 7.50 7.50 7.50 7.50 7.50 7.50 7.50 15.00 22.502" 12.50 12.50 12.50 12.50 12.50 12.50 12.50 12.50 25.00 37.503" 27.50 27.50 27.50 27.50 27.50 27.50 27.50 27.50 55.00 82.504" 42.50 42.50 42.50 42.50 42.50 42.50 42.50 42.50 85.00 127.506" 82.50 82.50 82.50 82.50 82.50 82.50 82.50 82.50 165.00 247.50
Notes:(1) Rates as of June 30, of each fiscal year.
Source: Hi-Desert Water District Board of Directors approved rate ordinances and resolutions
Water Consumption per Hundred Cubic Feet (HCF)
Pipeline Surcharge Fees per Month
Recharge Surcharge Fees per Month
Connection Fees per Month

Hi-Desert Water District Customers by Type Last Ten Fiscal Years Schedule 6
54
Fiscal PublicYear Residential Commercial Entities Irrigation Multi-Family Parks Total
2003 8,069 382 61 56 278 12 8,858 2004 8,133 383 61 56 282 12 8,927 2005 8,557 387 61 56 279 12 9,352 2006 8,926 399 61 59 276 12 9,733 2007 8,989 398 61 63 273 12 9,796 2008 8,957 403 61 69 268 12 9,770 2009 8,888 399 61 69 270 12 9,699 2010 9,112 387 61 69 259 12 9,902 2011 9,190 408 61 69 261 12 9,998 2012 9,155 404 63 71 271 12 9,976
Note: Number of customers as of June 30, of fiscal year.
Source: Hi-Desert Water District Accounting Department
Customer Type
7,000
7,500
8,000
8,500
9,000
9,500
10,000
10,500
Num
ber
of
Cu
stom
ers
Fiscal Year

Hi-Desert Water District Principal Customers Current Fiscal Year and Nine Years Ago Schedule 7
55
Water Percentage Water PercentageCustomer Consumed of Total Consumed of Total
Schools (12) 23,812 2.23% 25,709 2.12%Mobile Home Parks (4) 23,268 2.17% 28,936 2.38%Parks (6) 21,098 1.97% 20,830 1.71%Medical (4) 11,266 1.05% 13,574 1.12%Grocery (4) 11,555 1.08% 6,498 0.53%Hotels (3) 7,390 0.69% 5,914 0.49%Restraunts (5) 8,086 0.76% 9,766 0.80%Churches (4) 1,429 0.13% 1,673 0.14%
Total 107,904 10.08% 112,900 9.30%
Total Water Consumed (HCF) 1,070,166 100.00% 1,214,607 100.00%
Source: Hi-Desert Water District Accounting Department
2012 2003

Hi-Desert Water District Ratios of Outstanding Debt by Type Last Ten Fiscal Years Schedule 8
56
Fiscal Loans Bonds Notes Per As a Share ofYear Payable Payable Payable Debt Capita Personal Income
2003 $ 6,556,083 4,395,000 2,292,733 13,243,816 734.30 3.02%2004 6,248,361 4,235,000 1,742,273 12,225,634 649.06 2.69%2005 5,928,816 4,070,000 1,358,835 11,357,651 575.77 2.38%2006 5,598,503 3,895,000 1,075,600 10,569,103 514.09 2.09%2007 5,256,376 3,715,000 1,020,600 9,991,976 506.54 2.10%2008 4,902,577 3,535,000 1,210,515 9,648,092 459.94 1.70%2009 4,535,480 3,340,000 1,151,115 9,026,595 425.00 1.48%2010 3,131,446 3,135,000 1,010,600 7,277,046 357.03 1.33%2011 2,954,195 2,920,000 940,600 6,814,795 329.22 1.62%2012 2,769,768 2,695,000 870,600 6,335,368 302.90 1.01%
#
Source: Hi-Desert Water District Accounting Department
Total
$0
$2,000,000
$4,000,000
$6,000,000
$8,000,000
$10,000,000
$12,000,000
$14,000,000
Dol
lars
Fiscal Year

Hi-Desert Water District Pledged-Revenue Coverage Last Ten Fiscal Years Schedule 9
57
Net Operating Net Available Coverage
Fiscal Year Revenues Expenses(1) Revenues Principal(2) Interest Total Ratio
2003 7,360,294 (4,527,353) 2,832,941 513,382 622,952 1,136,334 2.492004 7,824,990 (4,968,356) 2,856,634 1,018,182 607,800 1,625,982 1.762005 7,708,170 (5,817,566) 1,890,604 867,983 499,214 1,367,197 1.382006 8,714,884 (5,698,661) 3,016,223 788,548 470,576 1,259,124 2.402007 10,578,265 (7,439,423) 3,138,842 577,127 445,216 1,022,343 3.072008 9,559,100 (8,045,653) 1,513,447 693,284 370,525 1,063,809 1.422009 9,408,694 (8,199,546) 1,209,148 622,097 348,944 971,041 1.252010 10,273,163 (7,574,071) 2,699,092 1,749,549 296,724 2,046,273 1.322011 9,230,259 (7,836,459) 1,393,800 462,251 260,680 722,931 1.932012 8,826,211 (7,153,393) 1,672,818 479,427 243,280 722,707 2.31
Notes: (1) Operating expenses exclude depreciation expense.(2) Includes only normal principal payments (does not include payments as a result of refinancing of debt)
Source: Hi-Desert Water District Accounting Department
Debt Service
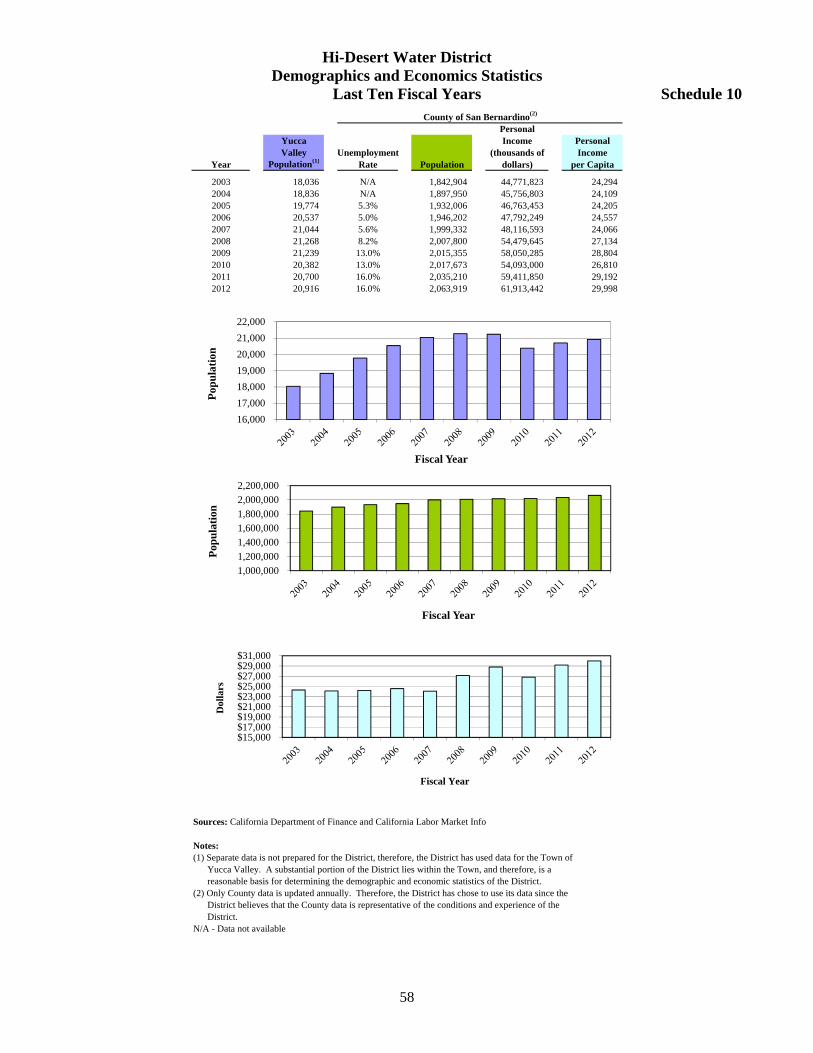
Hi-Desert Water District Demographics and Economics Statistics Last Ten Fiscal Years Schedule 10
58
PersonalYucca Income PersonalValley Unemployment (thousands of Income
Year Population(1) Rate Population dollars) per Capita
2003 18,036 N/A 1,842,904 44,771,823 24,294 2004 18,836 N/A 1,897,950 45,756,803 24,109 2005 19,774 5.3% 1,932,006 46,763,453 24,205 2006 20,537 5.0% 1,946,202 47,792,249 24,557 2007 21,044 5.6% 1,999,332 48,116,593 24,066 2008 21,268 8.2% 2,007,800 54,479,645 27,134 2009 21,239 13.0% 2,015,355 58,050,285 28,804 2010 20,382 13.0% 2,017,673 54,093,000 26,810 2011 20,700 16.0% 2,035,210 59,411,850 29,192 2012 20,916 16.0% 2,063,919 61,913,442 29,998
Sources: California Department of Finance and California Labor Market Info
Notes:(1) Separate data is not prepared for the District, therefore, the District has used data for the Town of
Yucca Valley. A substantial portion of the District lies within the Town, and therefore, is a reasonable basis for determining the demographic and economic statistics of the District.
(2) Only County data is updated annually. Therefore, the District has chose to use its data since the District believes that the County data is representative of the conditions and experience of the District.
N/A - Data not available
County of San Bernardino(2)
16,000
17,000
18,000
19,000
20,000
21,000
22,000
Pop
ula
tion
Fiscal Year
$15,000$17,000$19,000$21,000$23,000$25,000$27,000$29,000$31,000
Dol
lars
Fiscal Year
1,000,000 1,200,000 1,400,000 1,600,000 1,800,000 2,000,000 2,200,000
Pop
ulat
ion
Fiscal Year

Hi-Desert Water District Operating and Capacity Indicators Last Ten Fiscal Years Schedule 11
59
Fiscal Accounting Customer ConstructionYear Operations Staff and Billing Service CRP & Maintenance Total
2003 16 6 9 0 6 0 372004 12 5 4 4 9 6 402005 12 5 3 5 9 6 402006 11 5 3 5 8 6 382007 11 5 3 6 8 9 422008 15 10 3 4 7 8 472009 12 10 4 4 6 8 442010 10 7 4 3 6 8 382011 10 7 4 3 5 6 352012 10 6 4 3 5 6 34
Fiscal District Area Miles of Storage Groundwater WellYear (Square Miles) Pipleline Storage Tanks Capacity (MG) Wells Capacity (MGD) Fire Hydrants
2003 51 274 16 12.66 15 9.2 1,8582004 51 274 16 12.66 15 9.2 1,8582005 51 274 16 12.66 15 10.0 1,8582006 57 316 16 12.90 14 10.0 1,8582007 57 316 16 12.90 13 9.2 1,8582008 57 316 16 12.90 13 9.2 1,8582009 57 316 16 12.90 13 9.2 1,8582010 57 316 16 12.90 13 9.2 1,8012011 57 316 16 13.14 13 9.2 1,8012012 57 296 16 12.66 11 9.2 1,801
MG - Millions of GallonsMGD - Millions of Gallons per Day
Sources: Hi-Desert Water District Operations and Accounting Departments
Note: The Fire Hydrant total is inclusive of Hydrants and Jones heads.
Other Operating and Capacity Indicators
Full-time Equivalent District Employees by Department
0
5
10
15
20
25
30
35
40
45
50
Em
plo
yees
Fiscal Year


Report on Internal Controls and Compliance


60
Independent Auditor’s Report on Internal Controls Over Financial Reporting And on Compliance and Other Matters Based on an Audit of Financial Statements
Performed in Accordance with Government Auditing Standards
Board of Directors Hi-Desert Water District Yucca Valley, California
We have audited the basic financial statements of the Hi-Desert Water District (District) as of and for the years ended June 30, 2012 and 2011, and have issued our report thereon dated December 7, 2012. We conducted our audits in accordance with auditing standards generally accepted in the United States of America and the standards applicable to financial audits contained in Government Auditing Standards, issued by the Comptroller General of the United States.
Internal Control Over Financial Reporting
In planning and performing our audits, we considered the District’s internal control over financial reporting as a basis for designing our auditing procedures for the purpose of expressing our opinions on the financial statements, but not for the purpose of expressing an opinion on the effectiveness of the District’s internal control over financial reporting. Accordingly, we do not express an opinion on the effectiveness of the District’s internal control over financial reporting.
A deficiency in internal control over financial reporting exists when the design or operation of a control does not allow management or employees, in the normal course of performing their assigned functions, to prevent, or detect and correct misstatements on a timely basis. A material weakness is a deficiency, or a combination of deficiencies, in internal control such that there is a reasonable possibility that a material misstatement of the entity’s financial statements will not be prevented, or detected and corrected on a timely basis.
Our consideration of internal control over financial reporting was for the limited purpose described in the first paragraph of this section and was not designed to identify all deficiencies in internal control over financial reporting that might be deficiencies, significant deficiencies, or material weaknesses. We did not identify any deficiencies in internal control over financial reporting that we consider to be material weaknesses, as defined above.
Compliance and Other Matters
As part of obtaining reasonable assurance about whether the District’s financial statements are free of material misstatement, we performed tests of its compliance with certain provisions of laws, regulations, contracts and grants, noncompliance with which could have a direct and material effect on the determination of financial statement amounts. However, providing an opinion on compliance with those provisions was not an objective of our audit and, accordingly, we do not express such an opinion. The results of our tests disclosed no instances of noncompliance that are required to be reported under Government Auditing Standards.
This report is intended solely for the information and use of the Board of Directors and management and is not intended to be and should not be used by anyone other than these specified parties.
Charles Z. Fedak & Company, CPA’s – An Accountancy Corporation Cypress, California December 7, 2012