fy2010 comprehensive annual financial report (cafr)
TRANSCRIPT
SAN JOAQUIN REGIONAL TRANSIT DISTRICTCOUNTY OF SAN JOAQUIN, CALIFORNIA
COMPREHENSIVE ANNUAL FINANCIAL REPORTFOR THE YEAR ENDED JUNE 30, 2010
Prepared byFINANCE DEPARTMENT
SAN JOAQUIN REGIONAL TRANSIT DISTRICTCOMPREHENSIVE ANNUAL FINANCIAL REPORT
JUNE 30, 2010 AND 2009
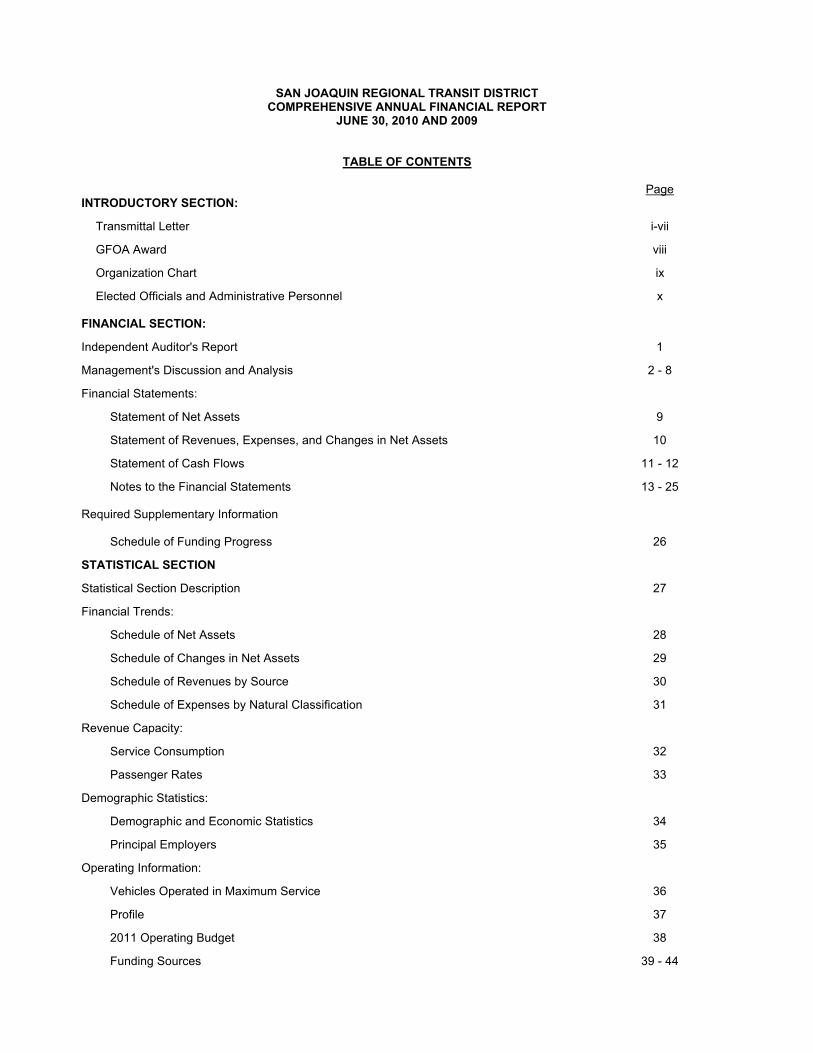
TABLE OF CONTENTS
PageINTRODUCTORY SECTION:
Transmittal Letter i-vii
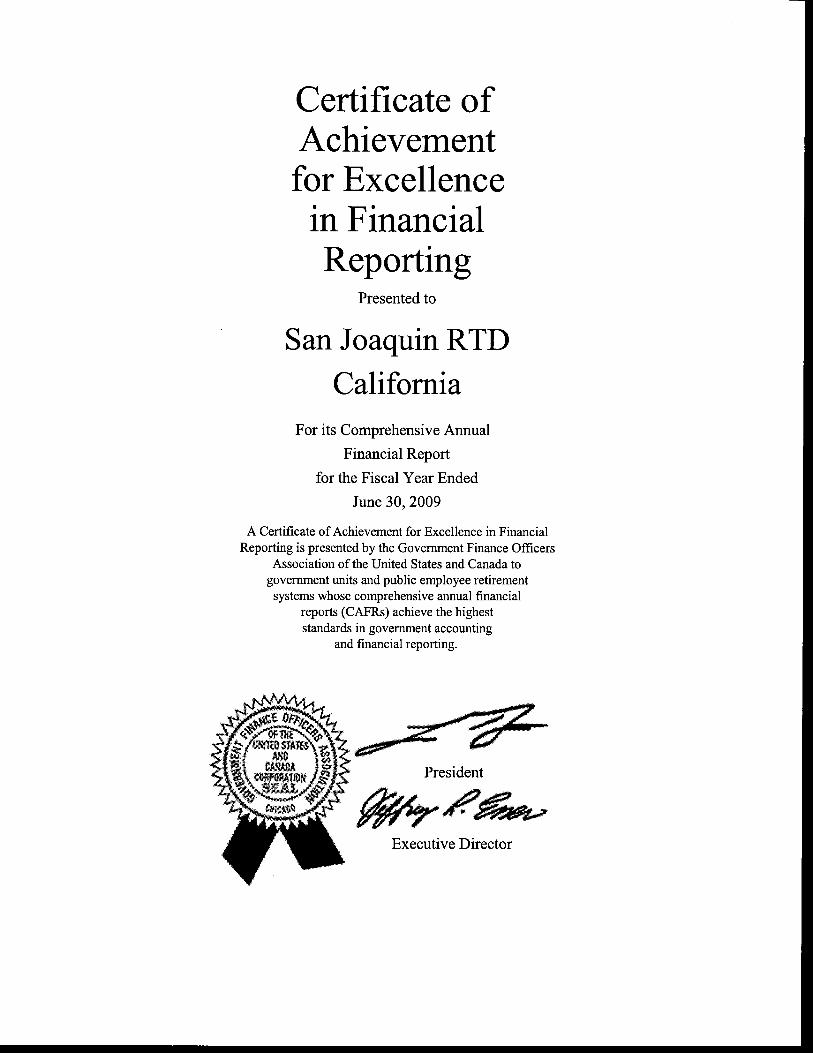
GFOA Award viii
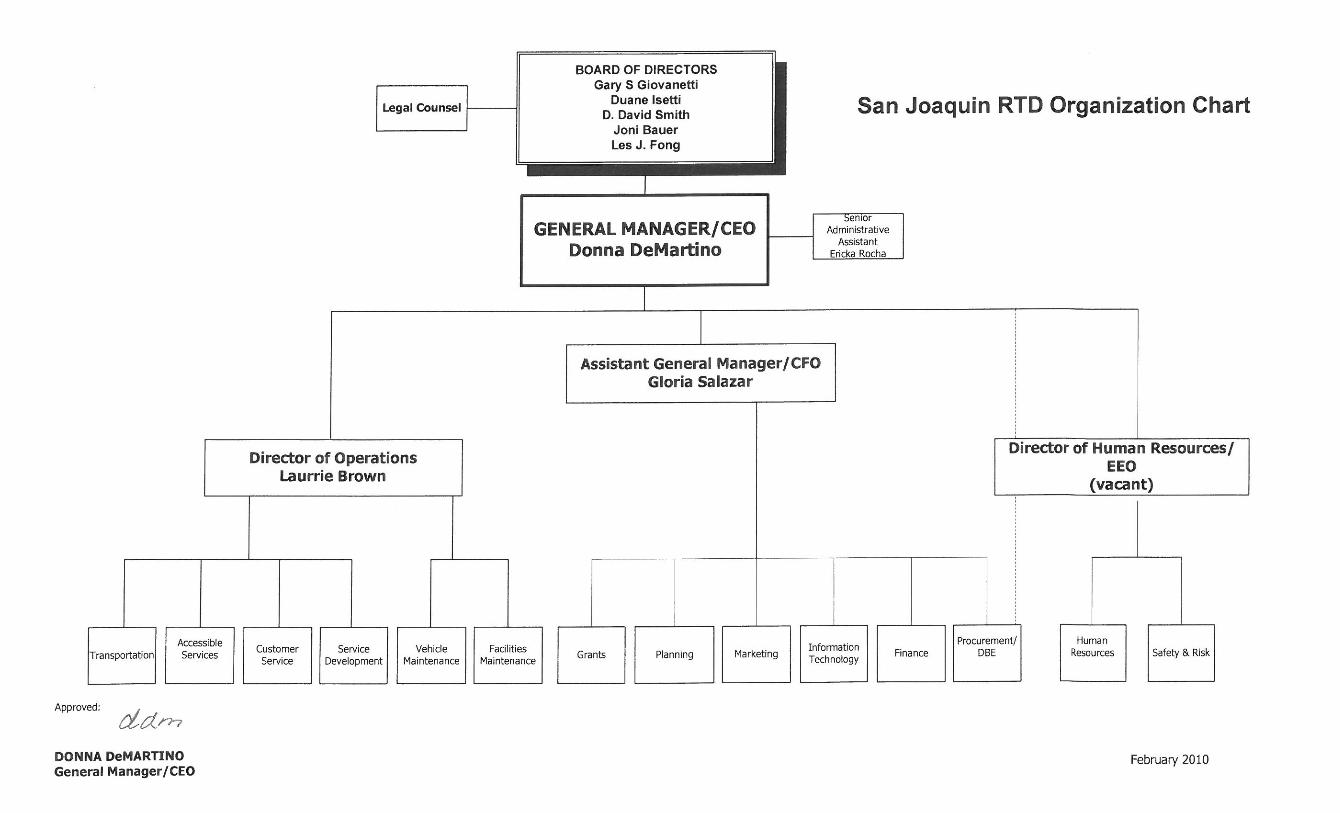
Organization Chart ix
Elected Officials and Administrative Personnel x
FINANCIAL SECTION:
Independent Auditor's Report 1
Management's Discussion and Analysis 2 - 8
Financial Statements:
Statement of Net Assets 9
Statement of Revenues, Expenses, and Changes in Net Assets 10
Statement of Cash Flows 11 - 12
Notes to the Financial Statements 13 - 25
Required Supplementary Information
Schedule of Funding Progress 26
STATISTICAL SECTION
Statistical Section Description 27
Financial Trends:
Schedule of Net Assets 28
Schedule of Changes in Net Assets 29
Schedule of Revenues by Source 30
Schedule of Expenses by Natural Classification 31
Revenue Capacity:
Service Consumption 32
Passenger Rates 33
Demographic Statistics:
Demographic and Economic Statistics 34
Principal Employers 35
Operating Information:
Vehicles Operated in Maximum Service 36
Profile 37
2011 Operating Budget 38
Funding Sources 39 - 44
Introductory Section
SAN
P.O. Box 201 010 I Stockton, California 195201
20 9 .948 .556 6 I 209.948.8516 [fa x ] I www .s8njoaquinRTD .c om
November 22, 2010
Board of DirectorsSan Joaquin RTDP.O. Box 201010Stockton, CA 95201
It is with pleasure that we submit to you the San Joaquin Regional TransitDistrict (RTD) Comprehensive Annual Financial Report (CAFR) for the yearended June 30, 2010. RTD is required to undergo an annual audit inconformity with the provision of the Single Audit Act and U.s. Office ofManagement and Budget Circular A-133 as it pertains to audits of stateand local governments. State law requires that RTD publish a completedaudited financial statement within six months of the close of the fiscal yearin conformity with generally accepted accounting principles (GMP) andaudited in accordance with generally accepted auditing standards by a firmof certified public accountants licensed to practice in the State ofCalifornia.
This report consists of management's representations concerning thefinances of RTD. Responsibility for both the accuracy of the data, as wellas the completeness and fairness of the presentation, including alldisclosures, rests with RTD management. To the best of our knowledgeand belief, the enclosed data is accurate in all material respects and isreported in a manner that presents the financial position and results ofRTD operations. Disclosures are included to enable the reader to gain anunderstanding of RTD's activities.
Mann Urrutia Nelson CPAs & Associates LLP, a firm of licensed certifiedpublic accountants, has audited RTD's financial statements for the fiscalyear ending June 30, 2010. The goal of the independent audit is toprovide reasonable assurance that the financial statements are free ofmaterial misstatement. The independent audit includes examining
. evidence supporting the amounts and disclosures in the financialstatements, on a test basis; assessing the accounting principles used andsignificant estimates made by management; and evaluating the overall
ii
financial statement. The independent auditor’s findings are contained in a separate report. The independent audit of the financial statements was a part of a broader, federally mandated “Single Audit” designed to meet the needs of federal grantor agencies. The standards governing the Single Audit engagements require the independent auditor to report on the fair presentation of the financial statements, the audited RTD’s internal controls, and compliance with legal requirements. The audit puts an emphasis on internal controls and legal requirements involving the administration of federal awards. These reports are available in RTD’s Annual Financial Report (provided separately). GAAP require that management provide a narrative introduction, statement overview, and analysis to accompany the basic financial statements in the form of Management’s Discussion and Analysis (MD&A) letter. This letter of transmittal is designed to complement MD&A. RTD’s MD&A immediately follows the report of the independent auditors. PROFILE OF RTD RTD was organized in 1964 as the Stockton Metropolitan Transit District. The District was renamed in 1994 to the San Joaquin Regional Transit District (RTD) to better describe its expanded service area. RTD provides local, intercity, and interregional public transportation throughout San Joaquin County, California. RTD also provides Interregional Commuter Services to the Bay Area and Sacramento County. RTD is governed by a five-member board consisting of two members appointed by the Stockton City Council, two members appointed by the San Joaquin County Board of Supervisors and one member jointly appointed by the Stockton City Council and County Board of Supervisors. RTD is fiscally independent of the City and County insofar as neither makes budget appropriations to RTD. FACTORS AFFECTING FINANCIAL CONDITION RTD Management is responsible for establishing and maintaining a system of internal financial controls that provide reasonable assurance that assets are protected from loss, theft, or misuse. RTD management is responsible for assuring that adequate accounting controls are in place to provide reasonable assurance as to the accuracy of information and data used to
iii
prepare this report. The concept of reasonable assurance in internal controls recognizes that the cost of implementing a control should not outweigh the benefits likely to be received, and that the valuation of costs and benefits requires estimates and judgment exercised by management. As the regional transit provider for San Joaquin County, RTD’s role in providing local and regional transit services is continuously changing to meet its ever-changing environment. RTD closely monitors changes in the economy because of the potential impact to transportation revenues. RTD will continue to research ways to improve funding options to preserve a sustainable level of service. With the reduced revenue brought about by the economic decline, it was necessary to implement measures to reduce expenses in order to deliver a sustainable level of bus service. RTD will identify services that disproportionately serve the City of Stockton and San Joaquin County, and remove those services that have the highest operating costs and least return in ridership. RTD will prioritize service adjustments to maintain Americans with Disabilities Act (ADA) service levels and meet all ADA service requirements. RTD’s Short Range Transit Plan (SRTP) is current and available on RTD’s website: www.sanjoaquinrtd.com. The operating and capital plan for the fiscal year 2010 through fiscal year 2013 is included within this plan. Operating and capital funding needs continue to rise as a result of increased public demand for service. RTD continues its commitment to provide the best service possible to the residents of San Joaquin County at the lowest cost. In response to declining operating revenues due to economic decline and to preserve a sustainable level of service, RTD has implemented a restructured service design, developed a multi-faceted approach to funding that looks beyond existing resources in order to maintain a stable source of revenues through partnerships with local agencies and educational institutions in Stockton, lobbied for increased Federal, State, and local resources, and increased marketing efforts. Local Economy RTD’s operating and capital planning decisions are based on the strategic initiatives contained within its annual Strategic Plan. The mission and vision statements of RTD guide the initiatives.
iv
RTD’s major additions during Fiscal Year 2010 were acquisitions related to the Regional Transportation Center project; procurement of hybrid buses; installation of bus benches; construction of Phase II of Bus Rapid Transit, and the completion of the Mall Transfer Station project. RTD began preliminary engineering and design of the Regional Transportation Center (RTC) in Fiscal Year 2010. The RTC will centralize operations to increase efficiency in operations and maintenance of the fleet. RTD is in the process of constructing a second corridor of its Bus Rapid Transit (BRT) system to extend the Metro Express BRT to the Stockton Airport. RTD introduced Metro Express, San Joaquin County’s first BRT system, in Fiscal Year 2007. The first extension of Metro Express, which will operate along the Airport Corridor, will open in Fiscal Year 2011 and is funded in part by a $2.8 million Very Small Starts award. In Fiscal Year 2010, RTD was awarded a $5.227 million Federal Bus and Bus Livability Grant that will provide capital funding for the third extension of RTD’s Metro Express BRT service, along the Hammer Corridor. Together, these three BRT lines will span Stockton’s most highly traveled arterials to form a backbone of service for a more efficient, reliable, and convenient bus transit system in Stockton. In Fiscal Year 2010, RTD implemented the new Metro Hopper Service to replace most of our expensive Dial-A-Ride (DAR) services. In its first six months of operations, RTD provided 57% more passenger trips with DAR and Metro Hopper combined, while significantly reducing operating costs. Our former DAR passengers now enjoy the convenience of fixed route service with flexibility to deviate where necessary. RTD also received support for the Metro Hopper from various agencies such as the Commission on Aging, Human Services Agency, University of the Pacific, Valley Mountain Regional Center, various assisted living facilities, and consumer advocates. RTD takes pride in being recognized as a leader in transportation coordination efforts. As a result of our efforts, RTD received over $800,000 for operations from federal programs JARC (Job Access Reverse Commute) and New Freedom. As a part of its coordination efforts, RTD entered into a cooperative partnership with UCP (United Cerebral Palsy) to provide enhanced service on RTD’s behalf for passengers with special needs.
v
RTD will implement the Google Transit Trip Planner into its website in Fiscal Year 2011. The trip planner will use RTD’s published schedule data to provide all necessary information including walking and transfer directions, and will offer alternatives based upon available routes. It also can access the data of other regional transit agencies to provide region-wide public transit trip planning. Other ongoing capital projects are: procurement and rehabilitation of rolling stock, improvements to major transit hubs and passenger amenities, installation and enhancement of bus shelters and benches, improvements to system security, and implementation of a centralized database system. RTD is soliciting proposals for contractors(s) to operate and maintain vehicles for all intercity fixed routes, commuter services, and rural services. RTD is statutorily required to competitively bid out these services every five years. The selected bidder will start service in Fiscal Year 2011. RTD will continue to pursue public and private support towards increased transit use, and funding support to achieve our primary mission to provide safe, reliable, and efficient transportation system for the region. San Joaquin County is experiencing minimal employment opportunities due to current economic situation. With the county’s current population, which is approximately 675,000 RTD provides an alternative mode of transportation for commuters to Alameda and Sacramento County, decreasing traffic congestion and improving mobility efficiency throughout the County. This has a tremendous impact on the regional economy and quality of life for San Joaquin County residents. RTD must maintain a comprehensive transit system to remain competitive with other urban areas observing similar levels of economic development. Balanced Funding Concepts RTD is continually reviewing its strategic goals, which will delineate the operating and capital requirements for the next 5-10 years. It is increasingly important to ensure the availability of financial resources to maintain existing levels of service and to fund planned capital and operating expenditures including rolling stock replacement and additional facilities. RTD currently uses three major levels of funding resources:
• Locally controlled Federal and State funding allocations (funding given to local governments and agencies to spend on their priority and/or operations)
vi
• Federal discretionary funding awards (identified by the Federal Transit Administration for specific projects)
• Locally collected money (e.g. County sales taxes, Measure K, fares) Risk Management RTD is exposed to various risks related to torts; theft of, damage to, and destruction of assets; errors and omissions; injuries to employees; and natural disasters. RTD is partially self-insured, and purchases additional commercial insurance for claims in excess of self-insured amounts. Settled claims have not exceeded the commercial coverage in the last fiscal year. Additionally, RTD implements various control techniques to minimize accident-related losses. These techniques include employee accident prevention training, defensive driver training, verification of transit training, post-accident training, ergonomics training, monthly safety themes and messages, safety awards, yearly review of accident related claims to target populations, and passenger safety education. In Fiscal Year 2011, RTD plans to conduct a safety fair to increase the level of safety awareness for employees and family on the job and at home. Budget Controls RTD adopts an annual operating budget that serves as the foundation for financial planning and control. The budget is a financial plan governing the fiscal year operating and capital investments. For capital projects exceeding one fiscal year, RTD management adopts a project length budget. The budget matches revenues with the operating and capital project expenses based on adopted policies and strategic plans set by RTD’s Board of Directors. The budget process follows three basic steps that provide continuity in decision making: 1) assess current conditions and needs and develop goals, objectives, policies, and plans, 2) prioritize projects and develop a work program, 3) implement identified plans and policies and evaluate their effectiveness and shortcomings. RTD maintains budgetary controls to monitor compliance with RTD’s authorization and adopted rules. The annual budget is categorized by fund type (operating or capital), and by department (e.g., transportation). Department managers may make transfers of line items within their department. Budget transfers between departments require the approval of the General Manager/CEO. Amendments to RTD’s budget, occurring after Board adoption of the budget for a given fiscal year, requires Board approval.
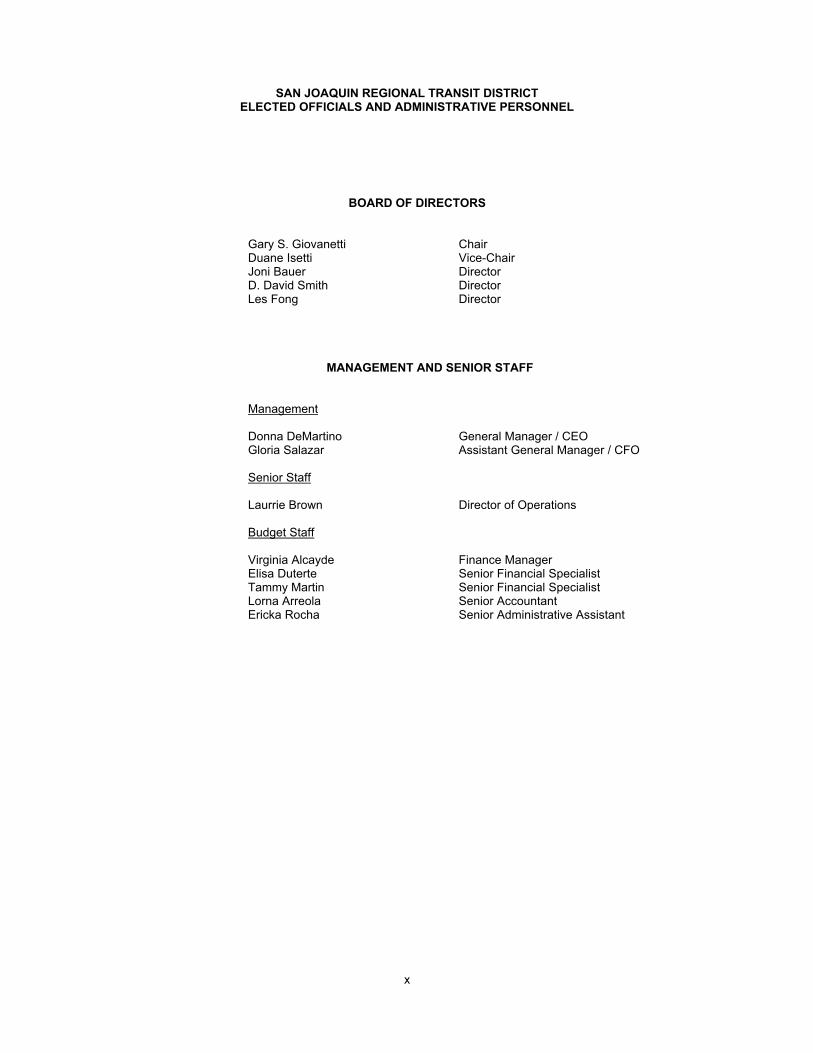
SAN JOAQUIN REGIONAL TRANSIT DISTRICTELECTED OFFICIALS AND ADMINISTRATIVE PERSONNEL
BOARD OF DIRECTORS
Gary S. Giovanetti ChairDuane Isetti Vice-ChairJoni Bauer DirectorD. David Smith DirectorLes Fong Director
MANAGEMENT AND SENIOR STAFF
Management
Donna DeMartino General Manager / CEOGloria Salazar Assistant General Manager / CFO
Senior Staff
Laurrie Brown Director of Operations
Budget Staff
Virginia Alcayde Finance ManagerElisa Duterte Senior Financial SpecialistTammy Martin Senior Financial SpecialistLorna Arreola Senior AccountantEricka Rocha Senior Administrative Assistant
x
Financial Section
ROSEVILLE OFFICE
290 I Douglas Boulevard . Suite 290
Roseville . CA 95661
TEL 9 I6 114 -4208
FAX 916 114-4230
To the Board of DirectorsSan Joaquin Region al Transit Disbi ctStockton, California
MAN NU RRUTIANELSO N
C PAs
AS SO C IAT E SL LP .
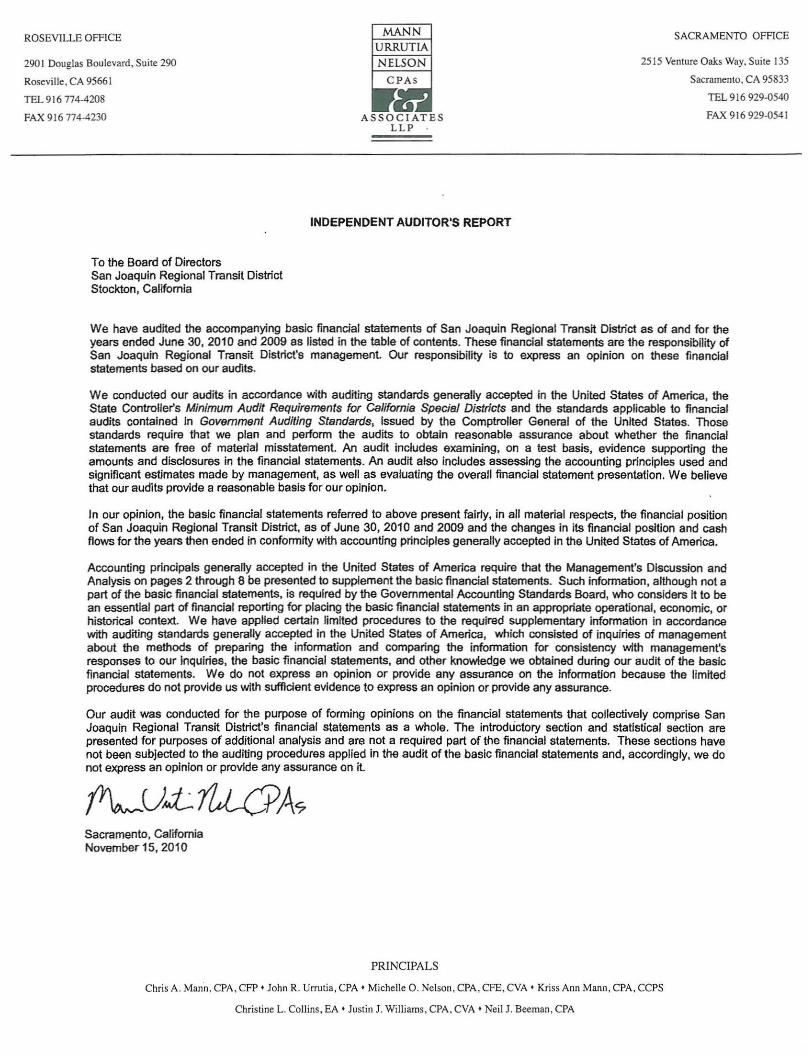
INDEPEN DENT AUD ITOR'S REPORT
SACRAMENTO OFFICE
25 15 Venture Oaks Way. Sui te 135
Sacramento , CA 95833
TEL 916 929-0540
FAX 9 I6 929 -054 I
We have audited the accompanying bas ic financial statements of San Joaquin Regional Transit District as of and for theyears endad June 30, 2010 and 2009 as listed in the tabla of contents. These financial statements are the responsibility ofSan Joaqu in Regional Transit District'e management. Our responsibility is to express an opinion on these financialstatements based on our audits .
We conductad ou r audits in accordance with auditing standards generally accepted in the United States of America, theState Controller's Minimum Audit Requirements for California Speciel Districts end the standards applicable to financialaudits conta ined In Govamment Auditing Standards, Issued by the Comptroller General of the United States . Thosestandards require that we plan and perform the audits to obtain reasonable assuranca about whether the financ ialstatements are free of material misstatement. An audit includes examining, on a test basis, evidence supporting theamounts and disclosures in the finencial statements. An audit also Includes assessing tha accounting principles used andsignificant estimates made by management, as well as evaluating the overall financial statement presentatlon. We believethat our audits provide a reasonable basis for our opinion.
In our opin ion, the basic financial statements referred to above present fairly, in all materia i respects, the financial positionof San Jo aquin Regional Transit District, as of June 30, 2010 and 2009 and the changes in its finan cial position and cashflows for the years then ended in confonnity with accounting principles generally accepted in the United States of America.
Accounting principals generally accepted in the United States of America require that the Management's Discussion andAnalysis on pages 2 through 8 be presented to supplement the bas ic financial statements. Such infonnation, although not apart of the basic financial statements, is requ ired by the Governmental Accounting Standards Board, who cons iders It to bean essentia l part of financial reporting for placing the bas ic financial statements in en appropriate opera tional, economic, orhistorical context. We have applied certa in limited procedures to the requ ired supp lementary infonnatlon in accordancewith auditing standards generally accepted in the United States of America, which consisted of inquiries of managementabout the methods of preparing the infonnation and comparing the irrfonnation for cons istency with management'sresponses to our inqu iries , the basic financial statements, end other knowledge we obtained dUring our audit of the bas icfinancial statements. We do not express en opinion or provide any assurance on the Infonnetion because the limitedprocedures do not provide us with sufficient evidence to express en opin ion or provide any assurance.
Our audit was conducted for the purpose of forming opinions on the financial statements that collectively comprise SanJoaqu in Regional Transit District's financial statements as a whole. The introductory section and stall stica l sect ion areprese nted for purposes of additional analysis and are not a requ ired part of the financial statements. These sections havenot been subjected to the auditing procedures applied in the audit of the basic financia l statements and, accordingly, we donot express an opin ion or provide any assurance on it
Sacra mento, CaliforniaNovember 15, 2010
PRINCIPALS
Chris A . Mann . CPA, CFp . Joh n R. Urrutia, CPA ' Michelle O . Nelson. CPA. CFE , eVA ' Kriss An n Mann . CPA. CCPS
Christine L. Co llins , EA t Justin J. Will iams. CPA. e VA ' Neil J. Beeman . CPA
SAN JOAQUIN RTDMANAGEMENT'S DISCUSSION AND ANALYSIS
FOR THE YEARS ENDEDJUNE 30, 2010 AND 2009
Introduction
The following discussion and analysis of the financial performance and activity of the San Joaquin Regional Transit District(RTD) provides an introduction and understanding of the basic financial statements of RTD for the year ended June 30,2010 with selected comparative information for the year ended June 30, 2009. This discussion has been prepared bymanagement and should be read in conjunction with the financial statements and the notes thereto, which follow thissection.
Transit operations in Stockton were made public in 1963 through State of California Assembly Bill Number 323, whichcreated the Stockton Metropolitan Transit District. On January 4, 1994, the Board of Directors, with the support of the SanJoaquin Council of Governments and the San Joaquin County Board of Supervisors, unanimously approved a resolutionexpanding RTD’s boundaries to include all of San Joaquin County, with the new District to be known as the San JoaquinRegional Transit District, and later became San Joaquin RTD.
RTD is governed by a five-member board-of directors, two of which are appointed by the Stockton City Council, twoappointed by the San Joaquin County Board of Supervisors, and one appointed by a committee made up of representativesof both bodies.
The Financial Statements
RTD’s basic financial statements include (1) the Statement of Net Assets, (2) the Statement of Revenues, Expenses andChanges in Net Assets, and (3) the Statement of Cash Flows. The financial statements are prepared in accordance withaccounting principles generally accepted in the United States of America.
The Statement of Net Assets reports assets, liabilities and the difference as net assets. The entire equity section iscombined to report total net assets and is displayed in three components- invested in capital assets, net of related debt;restricted net assets; and unrestricted net assets.
The net asset component invested in capital assets, net of related debt consists of capital assets, including restricted capitalassets, net of accumulated depreciation and is reduced by the outstanding balances of any borrowings attributable to theacquisition, construction or improvements of those assets.
Restricted net assets consist of assets where constraints on their use are externally imposed by creditors (such as throughdebt covenants, if any), grantors, contributors, or laws and regulations of other governments.
Unrestricted net assets consist of net assets that do not meet the definition of restricted or invested in capital assets, net ofrelated debt. This net asset component includes net assets that have been designated by management as operating andcapital reserves for purposes which in the case of RTD may include and reserve for assets allocated to fund capitalprojects, reserves for self-insurance, other liabilities, and operations, provided such use is approved by the RTD Board.
Revenues and expenses are categorized as either operating or nonoperating based upon the definitions provided by GASBStatements No. 33 and No. 34. Significant recurring resources of RTD’s revenues, such as capital contributions, arereported as nonoperating revenues.
The Statement of Cash Flows is presented using the direct method and includes a reconciliation of operating cash flows tooperating income.
2
SAN JOAQUIN RTDMANAGEMENT'S DISCUSSION AND ANALYSIS (continued)
FOR THE YEARS ENDEDJUNE 30, 2010 AND 2009
Financial Highlights
Statement of Revenues, Expenses and Change in Net Assets
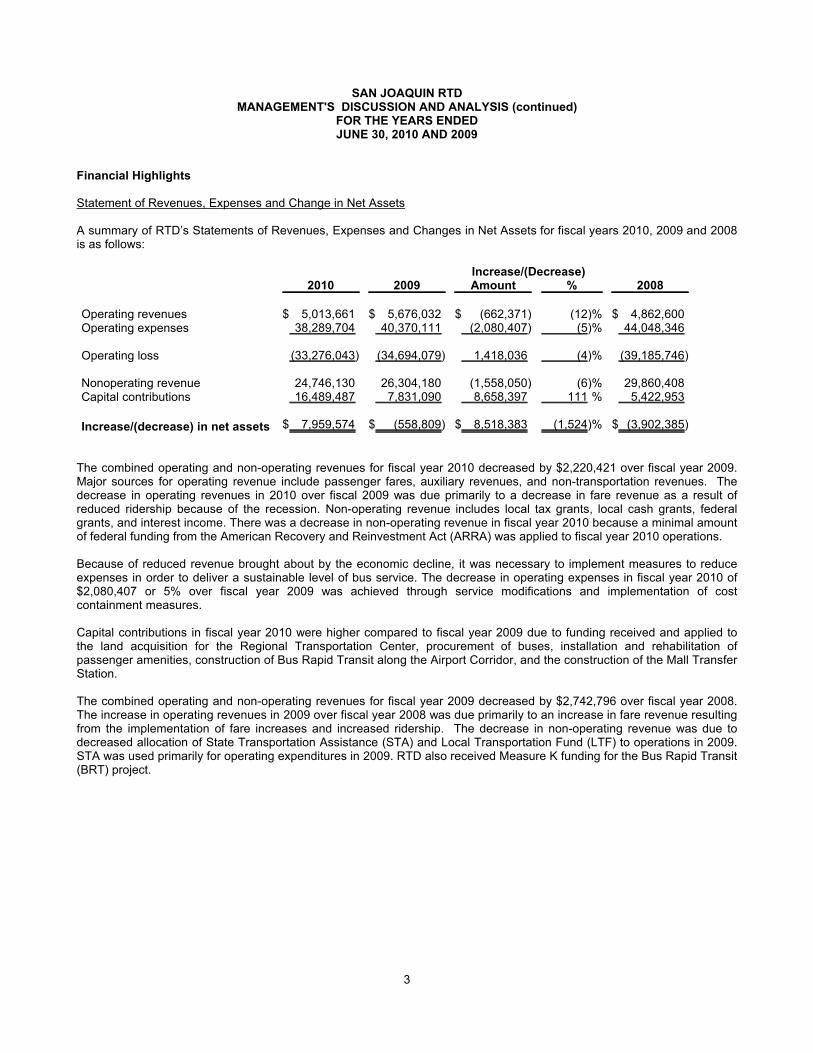
A summary of RTD’s Statements of Revenues, Expenses and Changes in Net Assets for fiscal years 2010, 2009 and 2008is as follows:
Increase/(Decrease)2010 2009 Amount % 2008
Operating revenues $ 5,013,661 $ 5,676,032 $ (662,371) %(12) $ 4,862,600Operating expenses 38,289,704 40,370,111 (2,080,407) %(5) 44,048,346
Operating loss (33,276,043) (34,694,079) 1,418,036 %(4) (39,185,746)
Nonoperating revenue 24,746,130 26,304,180 (1,558,050) %(6) 29,860,408Capital contributions 16,489,487 7,831,090 8,658,397 %111 5,422,953
Increase/(decrease) in net assets $ 7,959,574 $ (558,809) $ 8,518,383 %(1,524) $ (3,902,385)
The combined operating and non-operating revenues for fiscal year 2010 decreased by $2,220,421 over fiscal year 2009.Major sources for operating revenue include passenger fares, auxiliary revenues, and non-transportation revenues. Thedecrease in operating revenues in 2010 over fiscal 2009 was due primarily to a decrease in fare revenue as a result ofreduced ridership because of the recession. Non-operating revenue includes local tax grants, local cash grants, federalgrants, and interest income. There was a decrease in non-operating revenue in fiscal year 2010 because a minimal amountof federal funding from the American Recovery and Reinvestment Act (ARRA) was applied to fiscal year 2010 operations.
Because of reduced revenue brought about by the economic decline, it was necessary to implement measures to reduceexpenses in order to deliver a sustainable level of bus service. The decrease in operating expenses in fiscal year 2010 of$2,080,407 or 5% over fiscal year 2009 was achieved through service modifications and implementation of costcontainment measures.
Capital contributions in fiscal year 2010 were higher compared to fiscal year 2009 due to funding received and applied tothe land acquisition for the Regional Transportation Center, procurement of buses, installation and rehabilitation ofpassenger amenities, construction of Bus Rapid Transit along the Airport Corridor, and the construction of the Mall TransferStation.
The combined operating and non-operating revenues for fiscal year 2009 decreased by $2,742,796 over fiscal year 2008.The increase in operating revenues in 2009 over fiscal year 2008 was due primarily to an increase in fare revenue resultingfrom the implementation of fare increases and increased ridership. The decrease in non-operating revenue was due todecreased allocation of State Transportation Assistance (STA) and Local Transportation Fund (LTF) to operations in 2009.STA was used primarily for operating expenditures in 2009. RTD also received Measure K funding for the Bus Rapid Transit(BRT) project.
3

SAN JOAQUIN RTDMANAGEMENT'S DISCUSSION AND ANALYSIS (continued)
FOR THE YEARS ENDEDJUNE 30, 2010 AND 2009
Below is a schedule showing major sources of operating and non-operating revenue.
Increase / (Decrease)2010 2009 Amount % 2008
Operating Revenues by Major Source
Passenger $ 4,895,856 $ 5,536,021 $ (640,165) %(12) $ 4,762,139Special transit fares 1,117 1,673 (556) %(33) 2,413Auxiliary 64,932 90,899 (25,967) %(29) 96,182Non-transportation 51,756 47,439 4,317 %9 1,866
Nonoperating Revenues by Major Source
Local tax grants 818,930 930,439 (111,509) %(12) 983,839Local cash grants 18,692,493 18,966,163 (273,670) %(1) 23,438,595Federal cash grants 5,220,718 6,385,311 (1,164,593) %(18) 5,334,570Interest and investment 13,989 22,267 (8,278) %(37) 103,404
Total Revenue $ 29,759,791 $ 31,980,212 $(2,220,421) %(7) $ 34,723,008
Passenger fares decreased by $640,165 or 12% in fiscal year 2010 over fiscal year 2009 because of the decrease inridership brought about by the economic decline and service modifications which took effect in October 2009 and January2010. Job losses and change in the boundaries for transportation eligibility of students were primarily the contributing factorof the reduced ridership which subsequently reduced fare revenue.
Auxiliary revenues decreased by $25,967 or 29% due to a decrease in advertising revenue.
Non-transportation operating revenues increased by $4,317 or 9% because a portion of the Downtown Transit Centerearned rental revenue from a local merchant for a full year in fiscal year 2010, but only for a partial year in fiscal year 2009.
Local tax grants decreased by $111,509 or 12% in fiscal year 2010 over fiscal year 2009 because property taxapportionment from the County was lower as a result of declined property values. Local cash grants decreased by $273,670or 1% in spite of the reinstatement of State Transit Assistance in fiscal year 2010 because of lower operating fundsapportionment received from the Local Transportation Fund (LTF) which was calculated based on retail sales tax collectedfrom San Joaquin County.
Federal cash grants decreased in fiscal year 2010 by $1,164,593 or 18% over fiscal year 2009 because of lower AmericanRecovery and Reinvestment Act (ARRA) funding applied to fiscal year 2010.
Interest and investment revenues decreased by $8,278 or 37% in fiscal year 2010 over fiscal year 2009 due to the delay inreceipt of state funding which resulted in lower cash balances, and subsequently resulted in lower interest income.
4
SAN JOAQUIN RTDMANAGEMENT'S DISCUSSION AND ANALYSIS (continued)
FOR THE YEARS ENDEDJUNE 30, 2010 AND 2009
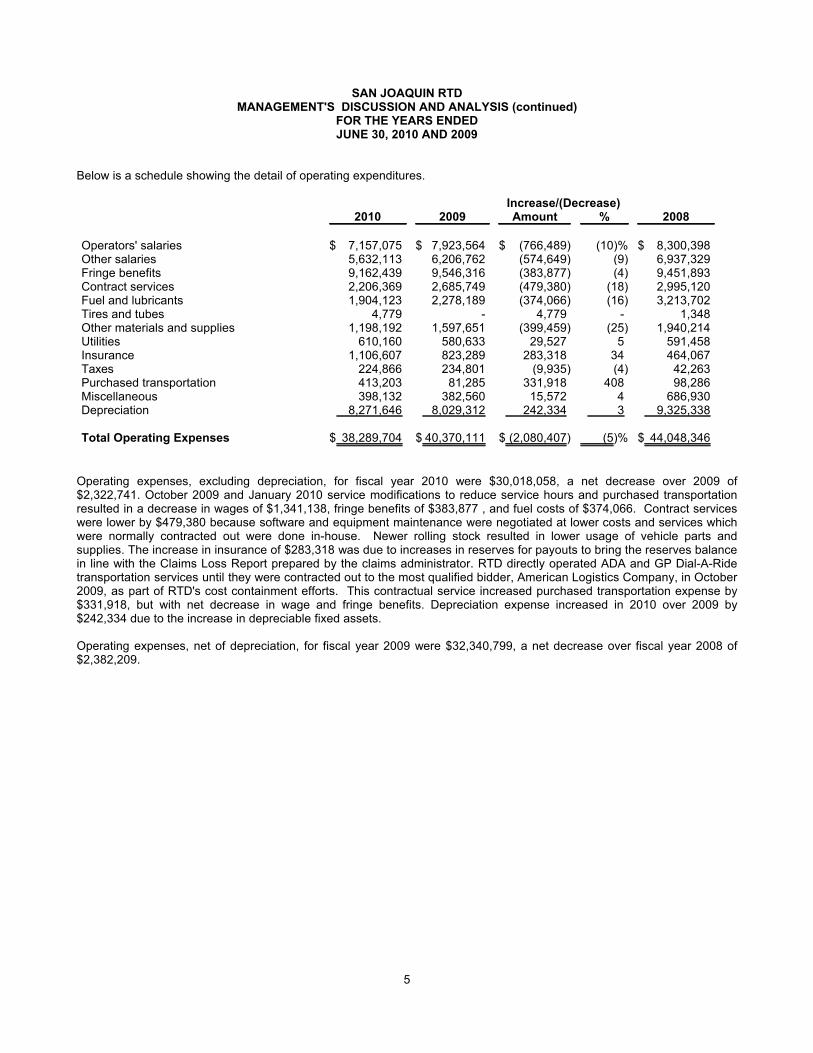
Below is a schedule showing the detail of operating expenditures.
Increase/(Decrease)2010 2009 Amount % 2008
Operators' salaries $ 7,157,075 $ 7,923,564 $ (766,489) %(10) $ 8,300,398Other salaries 5,632,113 6,206,762 (574,649) (9) 6,937,329Fringe benefits 9,162,439 9,546,316 (383,877) (4) 9,451,893Contract services 2,206,369 2,685,749 (479,380) (18) 2,995,120Fuel and lubricants 1,904,123 2,278,189 (374,066) (16) 3,213,702Tires and tubes 4,779 - 4,779 - 1,348Other materials and supplies 1,198,192 1,597,651 (399,459) (25) 1,940,214Utilities 610,160 580,633 29,527 5 591,458Insurance 1,106,607 823,289 283,318 34 464,067Taxes 224,866 234,801 (9,935) (4) 42,263Purchased transportation 413,203 81,285 331,918 408 98,286Miscellaneous 398,132 382,560 15,572 4 686,930Depreciation 8,271,646 8,029,312 242,334 3 9,325,338
Total Operating Expenses $ 38,289,704 $ 40,370,111 $ (2,080,407) %(5) $ 44,048,346
Operating expenses, excluding depreciation, for fiscal year 2010 were $30,018,058, a net decrease over 2009 of$2,322,741. October 2009 and January 2010 service modifications to reduce service hours and purchased transportationresulted in a decrease in wages of $1,341,138, fringe benefits of $383,877 , and fuel costs of $374,066. Contract serviceswere lower by $479,380 because software and equipment maintenance were negotiated at lower costs and services whichwere normally contracted out were done in-house. Newer rolling stock resulted in lower usage of vehicle parts andsupplies. The increase in insurance of $283,318 was due to increases in reserves for payouts to bring the reserves balancein line with the Claims Loss Report prepared by the claims administrator. RTD directly operated ADA and GP Dial-A-Ridetransportation services until they were contracted out to the most qualified bidder, American Logistics Company, in October2009, as part of RTD's cost containment efforts. This contractual service increased purchased transportation expense by$331,918, but with net decrease in wage and fringe benefits. Depreciation expense increased in 2010 over 2009 by$242,334 due to the increase in depreciable fixed assets.
Operating expenses, net of depreciation, for fiscal year 2009 were $32,340,799, a net decrease over fiscal year 2008 of$2,382,209.
5
SAN JOAQUIN RTDMANAGEMENT'S DISCUSSION AND ANALYSIS (continued)
FOR THE YEARS ENDEDJUNE 30, 2010 AND 2009
Statement of Net Assets
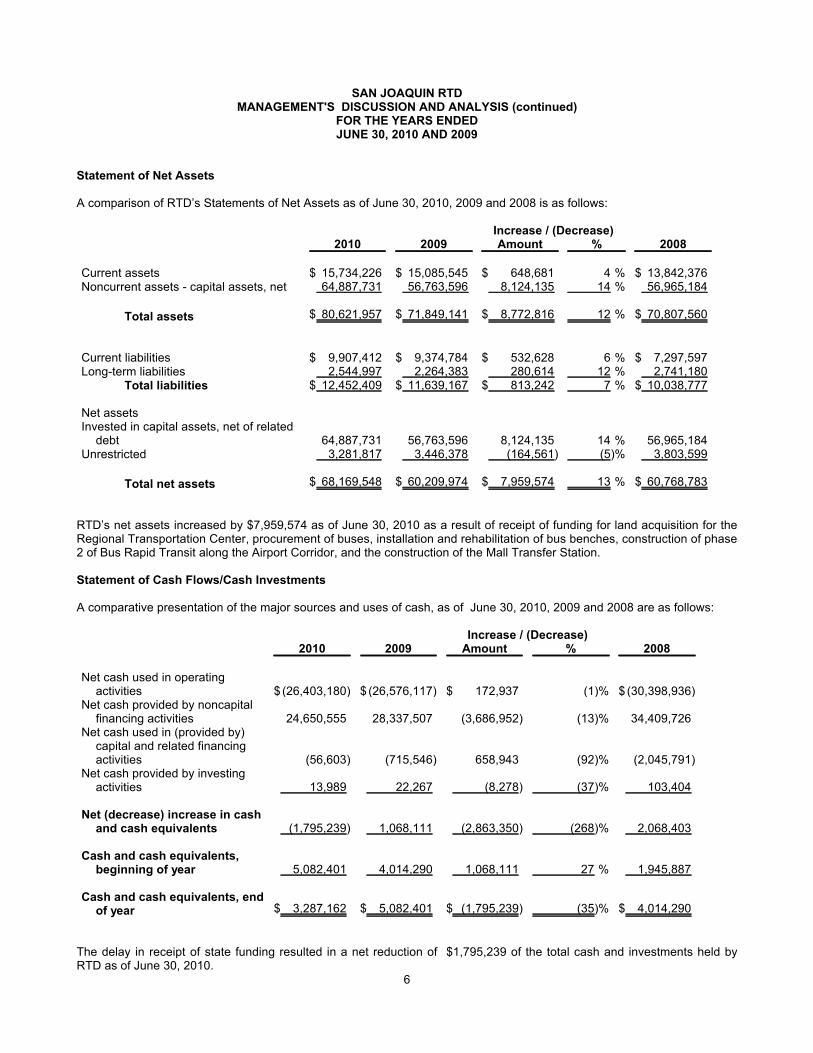
A comparison of RTD’s Statements of Net Assets as of June 30, 2010, 2009 and 2008 is as follows:
Increase / (Decrease)2010 2009 Amount % 2008
Current assets $ 15,734,226 $ 15,085,545 $ 648,681 %4 $ 13,842,376Noncurrent assets - capital assets, net 64,887,731 56,763,596 8,124,135 %14 56,965,184
Total assets $ 80,621,957 $ 71,849,141 $ 8,772,816 %12 $ 70,807,560
Current liabilities $ 9,907,412 $ 9,374,784 $ 532,628 %6 $ 7,297,597Long-term liabilities 2,544,997 2,264,383 280,614 %12 2,741,180
Total liabilities $ 12,452,409 $ 11,639,167 $ 813,242 %7 $ 10,038,777
Net assetsInvested in capital assets, net of related
debt 64,887,731 56,763,596 8,124,135 %14 56,965,184Unrestricted 3,281,817 3,446,378 (164,561) %(5) 3,803,599
Total net assets $ 68,169,548 $ 60,209,974 $ 7,959,574 %13 $ 60,768,783
RTD’s net assets increased by $7,959,574 as of June 30, 2010 as a result of receipt of funding for land acquisition for theRegional Transportation Center, procurement of buses, installation and rehabilitation of bus benches, construction of phase2 of Bus Rapid Transit along the Airport Corridor, and the construction of the Mall Transfer Station.
Statement of Cash Flows/Cash Investments
A comparative presentation of the major sources and uses of cash, as of June 30, 2010, 2009 and 2008 are as follows:
Increase / (Decrease)2010 2009 Amount % 2008
Net cash used in operatingactivities $ (26,403,180) $ (26,576,117) $ 172,937 %(1) $ (30,398,936)
Net cash provided by noncapitalfinancing activities 24,650,555 28,337,507 (3,686,952) %(13) 34,409,726
Net cash used in (provided by)capital and related financingactivities (56,603) (715,546) 658,943 %(92) (2,045,791)
Net cash provided by investingactivities 13,989 22,267 (8,278) %(37) 103,404
Net (decrease) increase in cashand cash equivalents (1,795,239) 1,068,111 (2,863,350) %(268) 2,068,403
Cash and cash equivalents,beginning of year 5,082,401 4,014,290 1,068,111 %27 1,945,887
Cash and cash equivalents, endof year $ 3,287,162 $ 5,082,401 $ (1,795,239) %(35) $ 4,014,290
The delay in receipt of state funding resulted in a net reduction of $1,795,239 of the total cash and investments held byRTD as of June 30, 2010.
6
SAN JOAQUIN RTDMANAGEMENT'S DISCUSSION AND ANALYSIS (continued)
FOR THE YEARS ENDEDJUNE 30, 2010 AND 2009
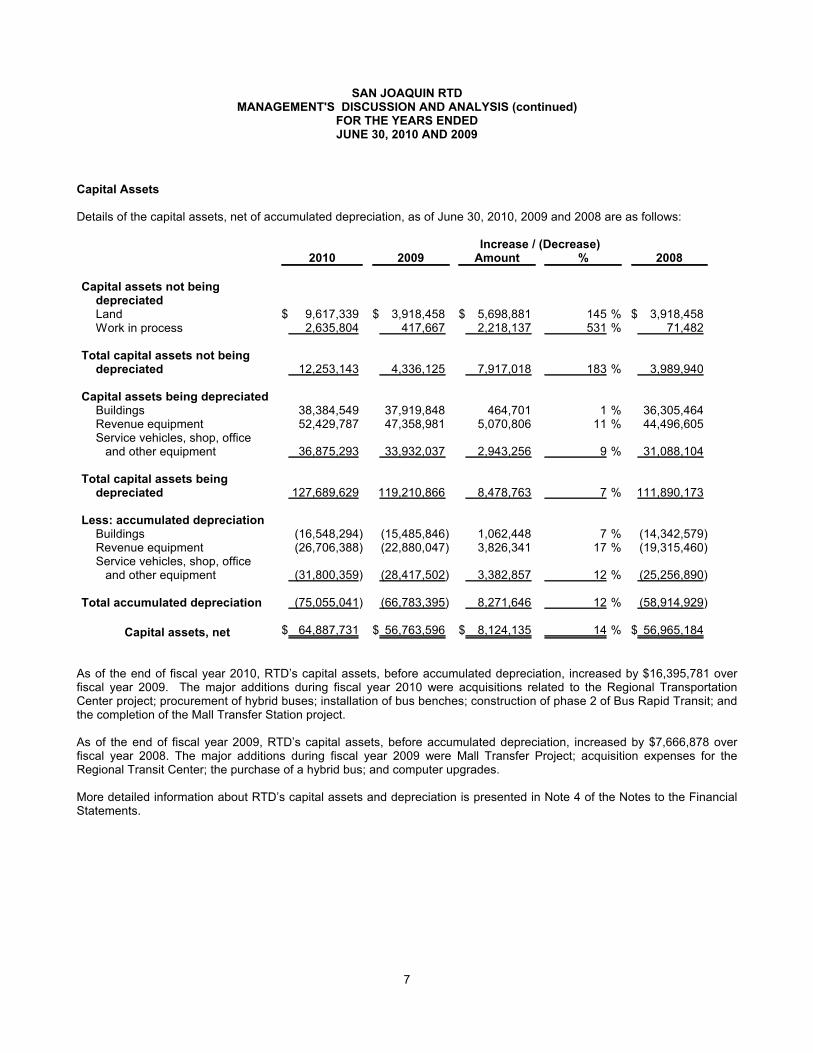
Capital Assets
Details of the capital assets, net of accumulated depreciation, as of June 30, 2010, 2009 and 2008 are as follows:
Increase / (Decrease)2010 2009 Amount % 2008
Capital assets not beingdepreciatedLand $ 9,617,339 $ 3,918,458 $ 5,698,881 %145 $ 3,918,458Work in process 2,635,804 417,667 2,218,137 %531 71,482
Total capital assets not beingdepreciated 12,253,143 4,336,125 7,917,018 %183 3,989,940
Capital assets being depreciatedBuildings 38,384,549 37,919,848 464,701 %1 36,305,464Revenue equipment 52,429,787 47,358,981 5,070,806 %11 44,496,605Service vehicles, shop, office
and other equipment 36,875,293 33,932,037 2,943,256 %9 31,088,104
Total capital assets beingdepreciated 127,689,629 119,210,866 8,478,763 %7 111,890,173
Less: accumulated depreciationBuildings (16,548,294) (15,485,846) 1,062,448 %7 (14,342,579)Revenue equipment (26,706,388) (22,880,047) 3,826,341 %17 (19,315,460)Service vehicles, shop, office
and other equipment (31,800,359) (28,417,502) 3,382,857 %12 (25,256,890)
Total accumulated depreciation (75,055,041) (66,783,395) 8,271,646 %12 (58,914,929)
Capital assets, net $ 64,887,731 $ 56,763,596 $ 8,124,135 %14 $ 56,965,184
As of the end of fiscal year 2010, RTD’s capital assets, before accumulated depreciation, increased by $16,395,781 overfiscal year 2009. The major additions during fiscal year 2010 were acquisitions related to the Regional TransportationCenter project; procurement of hybrid buses; installation of bus benches; construction of phase 2 of Bus Rapid Transit; andthe completion of the Mall Transfer Station project.
As of the end of fiscal year 2009, RTD’s capital assets, before accumulated depreciation, increased by $7,666,878 overfiscal year 2008. The major additions during fiscal year 2009 were Mall Transfer Project; acquisition expenses for theRegional Transit Center; the purchase of a hybrid bus; and computer upgrades.
More detailed information about RTD’s capital assets and depreciation is presented in Note 4 of the Notes to the FinancialStatements.
7
SAN JOAQUIN RTDMANAGEMENT'S DISCUSSION AND ANALYSIS (continued)
FOR THE YEARS ENDEDJUNE 30, 2010 AND 2009
Economic Condition, Outlook, and Activity
RTD’s operating and capital planning decisions are based on its strategic initiatives contained within its annual StrategicPlan. The initiatives are guided by the mission and vision statements of RTD.
Operating and capital funding needs continue to rise as a result of increased public demand for service. RTD continues itscommitment to provide the best service possible to the residents of San Joaquin County at the lowest cost. In response todeclining operating revenues due to economic decline and to preserve a sustainable level of service, RTD has implementeda restructured service design, developed a multi-faceted approach to funding that looks beyond existing resources in orderto maintain a stable source of revenues through partnerships with local agencies and education institutions in Stockton,lobbied for increased Federal, State, and Local resources, and increased marketing efforts.
RTD put into motion preliminary engineering and design of the Regional Transportation Center (RTC) in fiscal year 2010.The RTC will centralize operations to increase efficiency in operations and maintenance of the fleet. RTD is in the processof constructing a second corridor of its Bus Rapid Transit (BRT) system to extend the Metro Express BRT to the StocktonAirport.
RTD introduced Metro Express, San Joaquin County’s first BRT system, in Fiscal Year 2007. The first extension of MetroExpress, which will operate along the Airport Corridor, will open in Fiscal Year 2011 and is funded in part by a $2.8 millionVery Small Starts award. In Fiscal Year 2010, RTD was awarded a $5.227 million Federal Bus and Bus Livability Grant thatwill provide capital funding for the third extension of RTD’s Metro Express BRT service, along the Hammer Corridor.Together, these three BRT lines will span Stockton’s most highly traveled arterials to form a backbone of service for a moreefficient, reliable, and convenient bus transit system in Stockton.
RTD will implement the Google Transit Trip Planner into its website in Fiscal Year 2011. The trip planner will use RTD’spublished schedule data to provide all necessary information, including walking and transfer directions, and will offeralternatives based upon available routes. It also can access the data of other regional transit agencies to provide region-wide public transit trip planning.
Other ongoing capital projects are: procurement and rehabilitation of rolling stock, improvements to major transit hubs andpassenger amenities, installation and enhancement of bus shelters and benches, improvements to system security, andimplementation of a centralized database system.
RTD is soliciting proposals for contractor(s) to operate and maintain vehicles for all intercity fixed routes, commuterservices, and rural services. RTD is statutorily required to competitively bid out these services every five years. Theselected bidder will start service in Fiscal Year 2011.
RTD will continue to pursue public and private support towards increased transit use, and funding support to achieve ourprimary mission to provide safe, reliable, and efficient transportation system for the region.
Contacting RTD’s Financial Management
RTD’s financial report is designed to provide RTD’s Board of Directors, management, and the public with an overview ofRTD’s finances. For additional information about this report, please contact Gloria Salazar, Assistant GeneralManager/CFO, San Joaquin RTD, PO Box 201010, Stockton, California 95201.
8
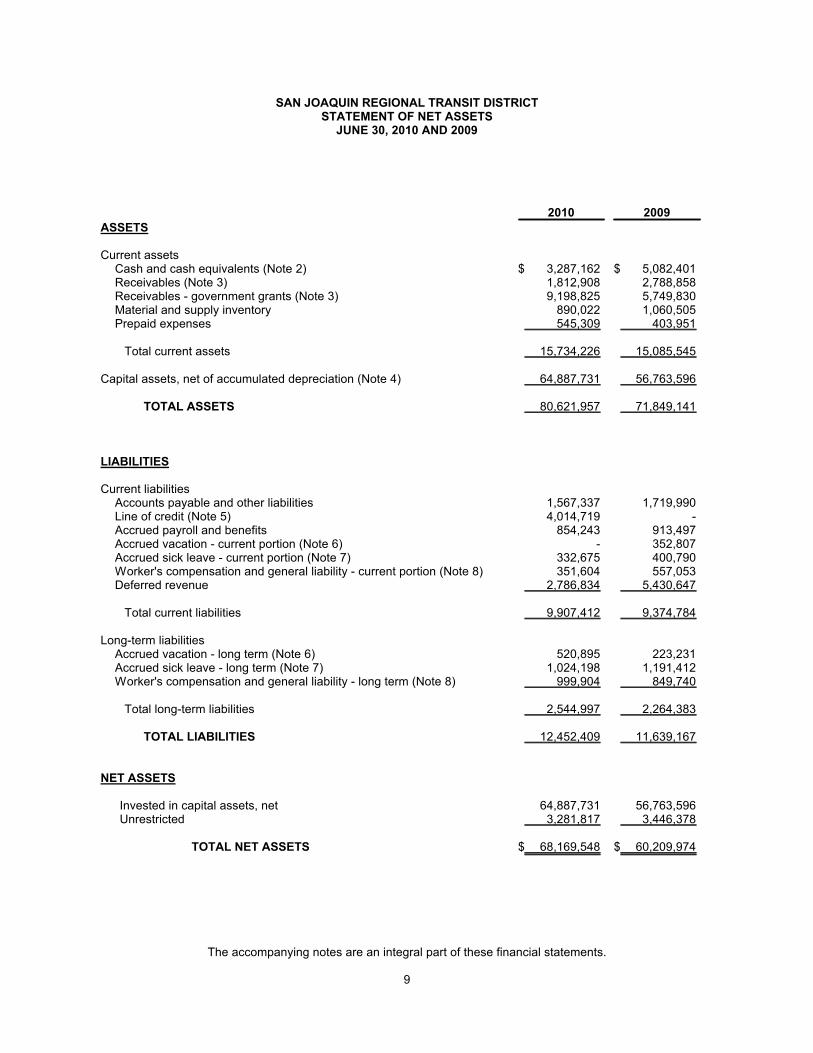
SAN JOAQUIN REGIONAL TRANSIT DISTRICTSTATEMENT OF NET ASSETS
JUNE 30, 2010 AND 2009
2010 2009
ASSETS
Current assetsCash and cash equivalents (Note 2) $ 3,287,162 $ 5,082,401Receivables (Note 3) 1,812,908 2,788,858Receivables - government grants (Note 3) 9,198,825 5,749,830Material and supply inventory 890,022 1,060,505Prepaid expenses 545,309 403,951
Total current assets 15,734,226 15,085,545
Capital assets, net of accumulated depreciation (Note 4) 64,887,731 56,763,596
TOTAL ASSETS 80,621,957 71,849,141
LIABILITIES
Current liabilitiesAccounts payable and other liabilities 1,567,337 1,719,990Line of credit (Note 5) 4,014,719 -Accrued payroll and benefits 854,243 913,497Accrued vacation - current portion (Note 6) - 352,807Accrued sick leave - current portion (Note 7) 332,675 400,790Worker's compensation and general liability - current portion (Note 8) 351,604 557,053Deferred revenue 2,786,834 5,430,647
Total current liabilities 9,907,412 9,374,784
Long-term liabilitiesAccrued vacation - long term (Note 6) 520,895 223,231Accrued sick leave - long term (Note 7) 1,024,198 1,191,412Worker's compensation and general liability - long term (Note 8) 999,904 849,740
Total long-term liabilities 2,544,997 2,264,383
TOTAL LIABILITIES 12,452,409 11,639,167
NET ASSETS
Invested in capital assets, net 64,887,731 56,763,596Unrestricted 3,281,817 3,446,378
TOTAL NET ASSETS $ 68,169,548 $ 60,209,974
The accompanying notes are an integral part of these financial statements.
9
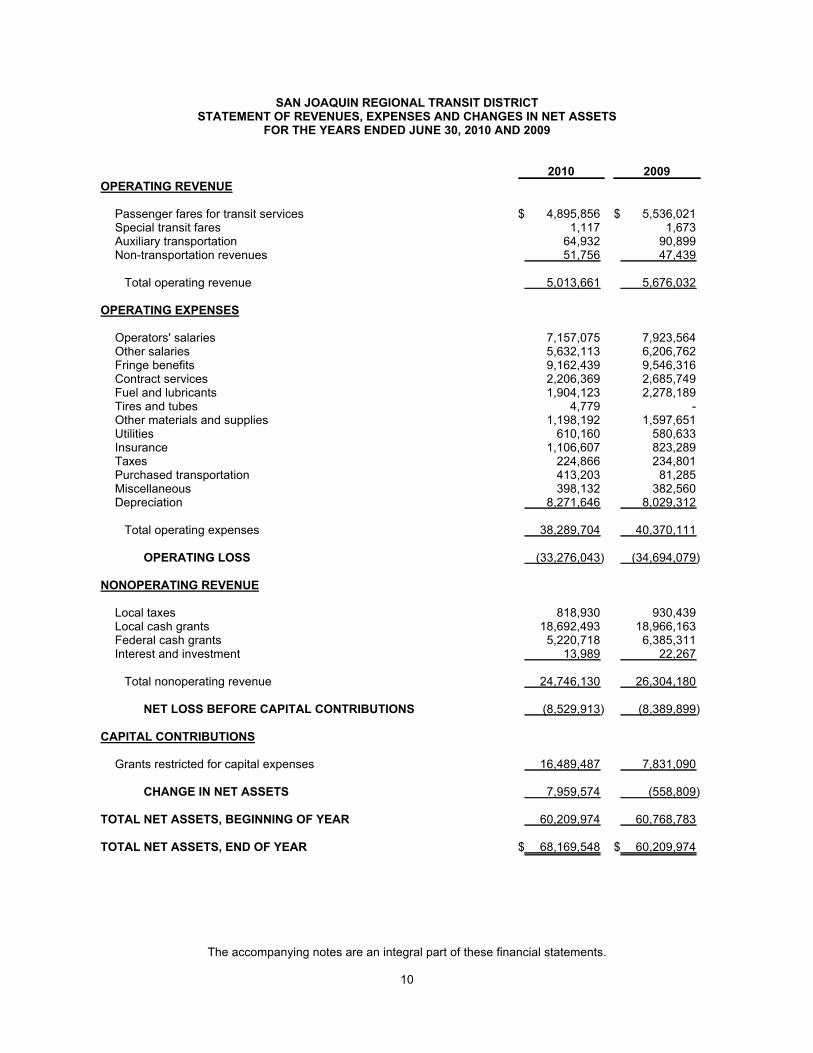
SAN JOAQUIN REGIONAL TRANSIT DISTRICTSTATEMENT OF REVENUES, EXPENSES AND CHANGES IN NET ASSETS
FOR THE YEARS ENDED JUNE 30, 2010 AND 2009
2010 2009
OPERATING REVENUE
Passenger fares for transit services $ 4,895,856 $ 5,536,021Special transit fares 1,117 1,673Auxiliary transportation 64,932 90,899Non-transportation revenues 51,756 47,439
Total operating revenue 5,013,661 5,676,032
OPERATING EXPENSES
Operators' salaries 7,157,075 7,923,564Other salaries 5,632,113 6,206,762Fringe benefits 9,162,439 9,546,316Contract services 2,206,369 2,685,749Fuel and lubricants 1,904,123 2,278,189Tires and tubes 4,779 -Other materials and supplies 1,198,192 1,597,651Utilities 610,160 580,633Insurance 1,106,607 823,289Taxes 224,866 234,801Purchased transportation 413,203 81,285Miscellaneous 398,132 382,560Depreciation 8,271,646 8,029,312
Total operating expenses 38,289,704 40,370,111
OPERATING LOSS (33,276,043) (34,694,079)
NONOPERATING REVENUE
Local taxes 818,930 930,439Local cash grants 18,692,493 18,966,163Federal cash grants 5,220,718 6,385,311Interest and investment 13,989 22,267
Total nonoperating revenue 24,746,130 26,304,180
NET LOSS BEFORE CAPITAL CONTRIBUTIONS (8,529,913) (8,389,899)
CAPITAL CONTRIBUTIONS
Grants restricted for capital expenses 16,489,487 7,831,090
CHANGE IN NET ASSETS 7,959,574 (558,809)
TOTAL NET ASSETS, BEGINNING OF YEAR 60,209,974 60,768,783
TOTAL NET ASSETS, END OF YEAR $ 68,169,548 $ 60,209,974
The accompanying notes are an integral part of these financial statements.
10
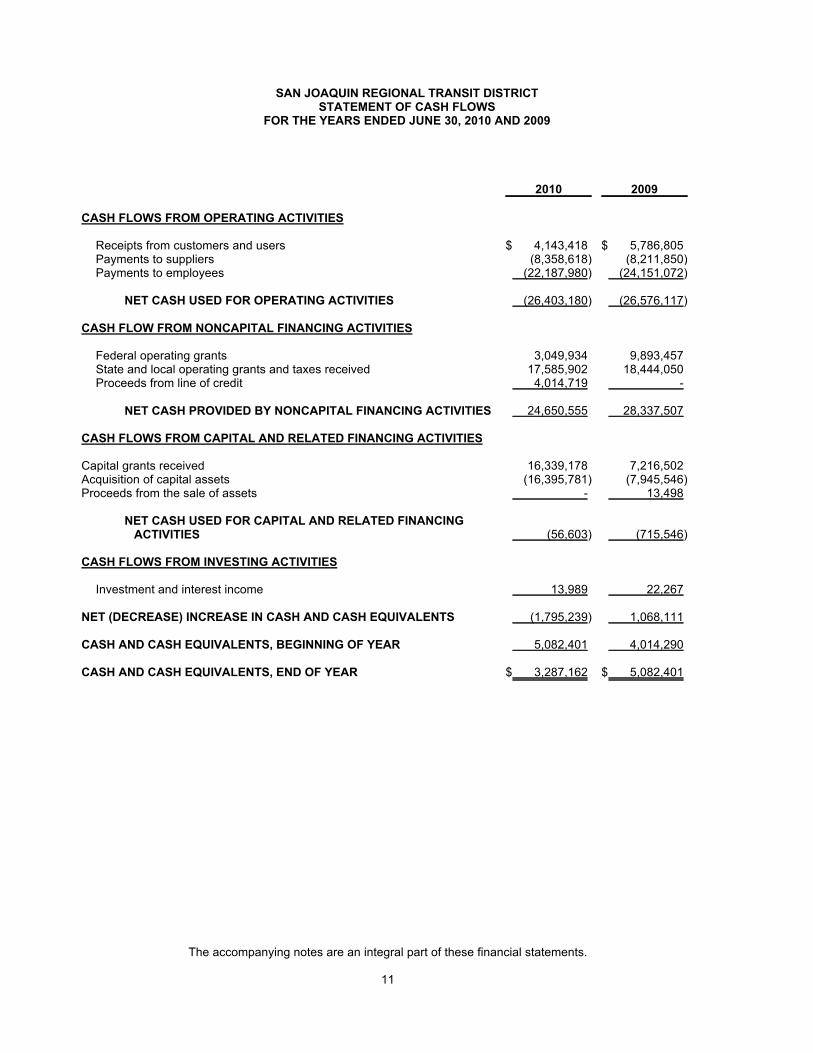
SAN JOAQUIN REGIONAL TRANSIT DISTRICTSTATEMENT OF CASH FLOWS
FOR THE YEARS ENDED JUNE 30, 2010 AND 2009
2010 2009
CASH FLOWS FROM OPERATING ACTIVITIES
Receipts from customers and users $ 4,143,418 $ 5,786,805Payments to suppliers (8,358,618) (8,211,850)Payments to employees (22,187,980) (24,151,072)
NET CASH USED FOR OPERATING ACTIVITIES (26,403,180) (26,576,117)
CASH FLOW FROM NONCAPITAL FINANCING ACTIVITIES
Federal operating grants 3,049,934 9,893,457State and local operating grants and taxes received 17,585,902 18,444,050Proceeds from line of credit 4,014,719 -
NET CASH PROVIDED BY NONCAPITAL FINANCING ACTIVITIES 24,650,555 28,337,507
CASH FLOWS FROM CAPITAL AND RELATED FINANCING ACTIVITIES
Capital grants received 16,339,178 7,216,502Acquisition of capital assets (16,395,781) (7,945,546)Proceeds from the sale of assets - 13,498
NET CASH USED FOR CAPITAL AND RELATED FINANCINGACTIVITIES (56,603) (715,546)
CASH FLOWS FROM INVESTING ACTIVITIES
Investment and interest income 13,989 22,267
NET (DECREASE) INCREASE IN CASH AND CASH EQUIVALENTS (1,795,239) 1,068,111
CASH AND CASH EQUIVALENTS, BEGINNING OF YEAR 5,082,401 4,014,290
CASH AND CASH EQUIVALENTS, END OF YEAR $ 3,287,162 $ 5,082,401
The accompanying notes are an integral part of these financial statements.
11
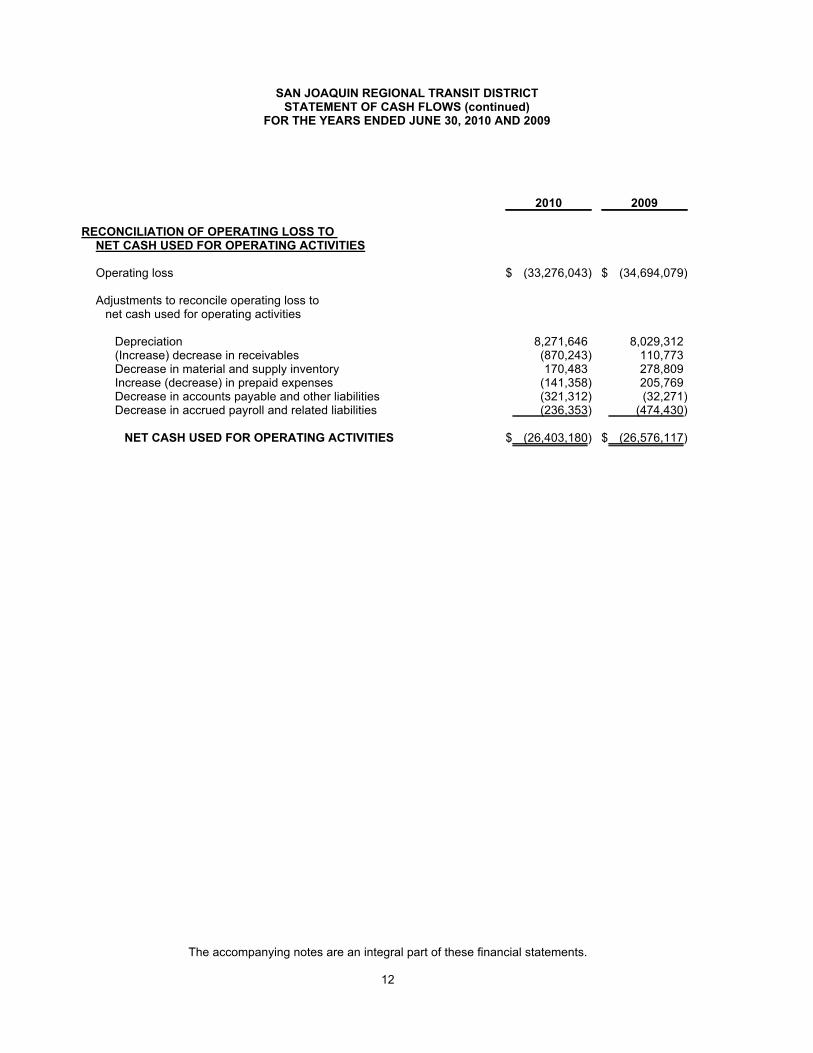
SAN JOAQUIN REGIONAL TRANSIT DISTRICTSTATEMENT OF CASH FLOWS (continued)
FOR THE YEARS ENDED JUNE 30, 2010 AND 2009
2010 2009
RECONCILIATION OF OPERATING LOSS TO NET CASH USED FOR OPERATING ACTIVITIES
Operating loss $ (33,276,043) $ (34,694,079)
Adjustments to reconcile operating loss to net cash used for operating activities
Depreciation 8,271,646 8,029,312(Increase) decrease in receivables (870,243) 110,773Decrease in material and supply inventory 170,483 278,809Increase (decrease) in prepaid expenses (141,358) 205,769Decrease in accounts payable and other liabilities (321,312) (32,271)Decrease in accrued payroll and related liabilities (236,353) (474,430)
NET CASH USED FOR OPERATING ACTIVITIES $ (26,403,180) $ (26,576,117)
The accompanying notes are an integral part of these financial statements.
12
SAN JOAQUIN REGIONAL TRANSIT DISTRICTNOTES TO FINANCIAL STATEMENTS
JUNE 30, 2010 AND 2009
NOTE 1: SUMMARY OF SIGNIFICANT ACCOUNTING POLICIES
A. Reporting Entity
San Joaquin RTD (RTD) was organized in 1964 as the Stockton Metropolitan Transit District. In 1994, it was renamed theSan Joaquin Regional Transit District to better describe its expanded service area. RTD provides local, inter-city and inter-regional public transportation to the residents of San Joaquin County, California. Commuter service to the San FranciscoBay Area is also provided by RTD. The RTD is governed by a five member board consisting of two members appointed bythe Stockton City Council, two members appointed by the San Joaquin County Board of Supervisors, and one jointlyappointed member by the City Council and Board of Supervisors. The RTD is fiscally independent of the City and Countyinsofar as neither makes budget apportionments to RTD.
B. Measurement Focus, Basis of Accounting and Presentation
The financial statements of San Joaquin Regional Transit District have been prepared in conformity with general acceptedaccounting principles (GAAP). The Governmental Accounting Standards Board (GASB) is the acknowledged standardsetting body for establishing accounting and financial reporting standards followed by governmental entities in the UnitedStates.
The RTD follows Statements and Interpretations of the Financial Accounting Standards Board and its predecessors thatwere issued on or before November 30, 1989, in accounting for its business-type activities, which do not conflict withGovernment Accounting Standards Board Pronouncements.
Measurement Focus
The statement of net assets and the statement of revenues, expenses and changes in net assets, are presented using theeconomic resources measurement focus. The accounting objectives of this measurement focus are the determination ofoperating income, changes in net assets (or cost recovery), financial position, and cash flows. All assets and all liabilities(whether current or noncurrent) associated with the operation of these funds are reported. Proprietary fund equity isclassified as net assets.
Basis of Accounting
In the statement of net assets and statement of revenues, expenses and changes in net assets, business-like activities arepresented using the accrual basis of accounting. Under the accrual basis of accounting, revenues are recognized whenearned and expenses are recorded when the liability is incurred or the economic asset used. Revenues, expenses, gains,losses, assets and liabilities resulting from exchange and exchange-like transactions are recognized when the exchangetakes place. Enterprise funds distinguish operating revenues and expenses from nonoperating items. Operating revenuesand expenses generally result from providing services in connection with RTD's principal ongoing operational activities.Charges to customers represent RTD’s principal operating revenues and include passenger fares, special transit fares, andauxiliary transportation. Operating expenses include the cost of operating maintenance and support of transit services andrelated capital assets, administrative expenses and depreciation on capital assets. All revenues and expenses not meetingthis definition are reported as nonoperating revenues and/or expenses.
Grant revenues are recognized in the fiscal year in which all eligibility requirements are met. Under the terms of grantagreements, RTD may fund certain programs with a combination of cost-reimbursement grants, categorical block grants,and general revenues. Thus, both restricted and unrestricted net assets are available to finance program expenditures.RTD's policy is to first apply restricted grant resources to such programs, followed by general revenues if necessary.
Certain indirect costs are included in program expenses reported for individual functions and activities.
Non-exchange transactions, in which the RTD gives or receives value without directly receiving or giving equal value inexchange, include property taxes, grants, entitlements, and donations. On the accrual basis, revenues from property taxesare recognized in the fiscal year for which the taxes are levied. Revenues from grants, entitlements, and donations arerecognized in the fiscal year in which all eligibility requirements have been satisfied.
13
SAN JOAQUIN REGIONAL TRANSIT DISTRICTNOTES TO FINANCIAL STATEMENTS
JUNE 30, 2010 AND 2009
NOTE 1: SUMMARY OF SIGNIFICANT ACCOUNTING POLICIES (continued)
C. Pooled Cash and Investments
Cash from various governmental agencies is pooled for investment purposes by the San Joaquin County Treasurer. Interestreceived on the investment is prorated to individual agencies based on their average cash balances.
The County is authorized to deposit cash and invest excess funds by the California Government Code section 53648 et.seq. The funds maintained by the County are either secured by Federal depository insurance or collateralized. Thesepooled funds are carried at cost, which approximates market value.
D. Cash and Cash Equivalents
For purposes of the statement of cash flows, RTD considers pooled cash and investments, and deposits in financialinstitutions (including deposited cash) having an original maturity of three months or less to be cash and cash equivalents.
E. Investments
RTD reports investments at their fair value in accordance with GASB Statement No. 31. Fair value is determined by quotedmarket prices provided by RTD’s financial institutions. The change in fair value is included in interest and investmentincome in the statement of revenues, expenses, and changes in net assets.
F. Receivables and Payables
Property Tax
The County of San Joaquin assesses properties, bills for, collects, and distributes property taxes for the RTD per thefollowing schedule:
Secured Unsecured
Valuations dates March 1 March 1Lien/levy dates July 1 July 1Due dates 50% on November 1 July 1
50% on February 1Delinquent as of December 10, April 10 August 31
The term "unsecured" refers to taxes on personal property other than real estate, land and buildings. These taxes aresecured by liens on the property being taxed. Property tax revenues are recognized by the RTD in the fiscal year they areassessed provided they become available as defined above.
G. Materials and Supply Inventory
Inventory is stated at cost. Inventory held by RTD consists of spare bus parts that are consumed by RTD and are not forresale purposes.
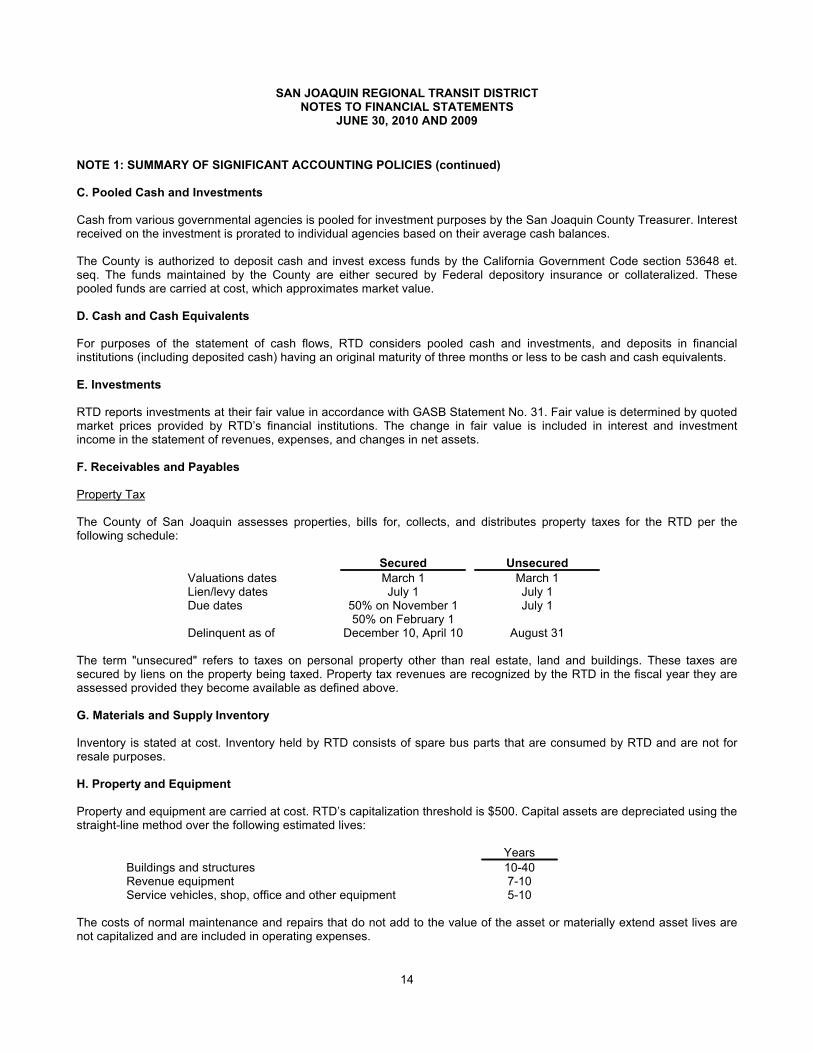
H. Property and Equipment
Property and equipment are carried at cost. RTD’s capitalization threshold is $500. Capital assets are depreciated using thestraight-line method over the following estimated lives:
Years
Buildings and structures 10-40Revenue equipment 7-10Service vehicles, shop, office and other equipment 5-10
The costs of normal maintenance and repairs that do not add to the value of the asset or materially extend asset lives arenot capitalized and are included in operating expenses.
14
SAN JOAQUIN REGIONAL TRANSIT DISTRICTNOTES TO FINANCIAL STATEMENTS
JUNE 30, 2010 AND 2009
NOTE 1: SUMMARY OF SIGNIFICANT ACCOUNTING POLICIES (continued)
I. Self-insured Liability
RTD is partially self-insured under various risk management programs. RTD is liable for claims relating to public liability andproperty damage up to $500,000. Claims in excess of $500,000 up to $4,500 000 are insured with commercial carriers. Forworker’s compensation, RTD is liable for claims up to $1,000,000. Claims in excess of $1,000,000 up to $10,000,000 areinsured with commercial carriers. Refer to Note 8 for further descriptions.
J. Accrued Vacation and Sick Leave
Full time employees accumulate vacation based on length of service. Unused accrued vacation is paid out to employees atthe date of termination. The accrued vacation liability is recorded on the statement of net assets and is segregated betweencurrent and long-term. Changes to the liability are recorded as an increase or decrease to operating expenses on thestatement of revenues, expenses, and changes in net assets.
For represented employees, a maximum limit of 239 sick days may be accrued. Upon retirement or termination, anemployee will be paid 100% of the value of unused sick leave based upon the wage rate of the employee at the date ofretirement or termination. Employees, at their option, may elect to use these funds to pay the cost of the health insuranceconversion program, receive the funds in cash, or place the funds into a deferred compensation plan. See Note 7 for furtherinformation.
K. Classification of Revenue and Expenses
Operating revenues: Operating revenues include activities that have the characteristics of exchange transactions such aspassenger revenues and advertising revenues.
Operating expenses: Payments to suppliers and to employees and on behalf of employees and all payments that do notresult from transactions defined as capital and related financing, noncapital financing, or investing activities.
Non-operating revenues: Non-operating revenues include activities that have the characteristics of non-exchangetransactions and other revenue sources that are defined as non-operating revenues by GASB Statement No. 9, ReportingCash Flows of Proprietary and Nonexpendable Trust Funds and Governmental Entities that use Proprietary FundAccounting, and GASB Statement No. 34, Basic Financial Statements - and Management's Discussion and Analysis - forState and Local Governments. Examples of non-operating revenues would be sales tax revenues, federal grants andinvestment income.
Non-operating expenses: Payments that result from transactions defined as capital and related financing, non-capitalfinancing, or investing activities.
L. Deferred Revenue
Deferred revenue arises when resources are received by RTD before they have earned them.
M. Contributed Capital
In accordance with GASB Statement No. 33, Accounting and Financial Reporting for Nonexchange Transactions, capitalgrants are required to be included in the determination of net income which resulted in an increase in net revenue of$16,489,487 and $7,831,090 for the years ending June 30, 2010 and 2009, respectively.
N. Net Assets
Net assets represent the residual interest in RTD’s assets after liabilities are deducted. Net assets are presented in threebroad components: invested in capital assets, net of related debt; restricted; and unrestricted. Net assets invested in capitalassets, net of related debt include capital assets net of accumulated depreciation and outstanding principal balances ofdebt attributable to the acquisition, construction or improvement of those assets. Net assets are restricted when constraintsare imposed by the third parties or by law through constitutional provisions or enabling legislation. All other net assets areunrestricted.
15
SAN JOAQUIN REGIONAL TRANSIT DISTRICTNOTES TO FINANCIAL STATEMENTS
JUNE 30, 2010 AND 2009
NOTE 1: SUMMARY OF SIGNIFICANT ACCOUNTING POLICIES (continued)
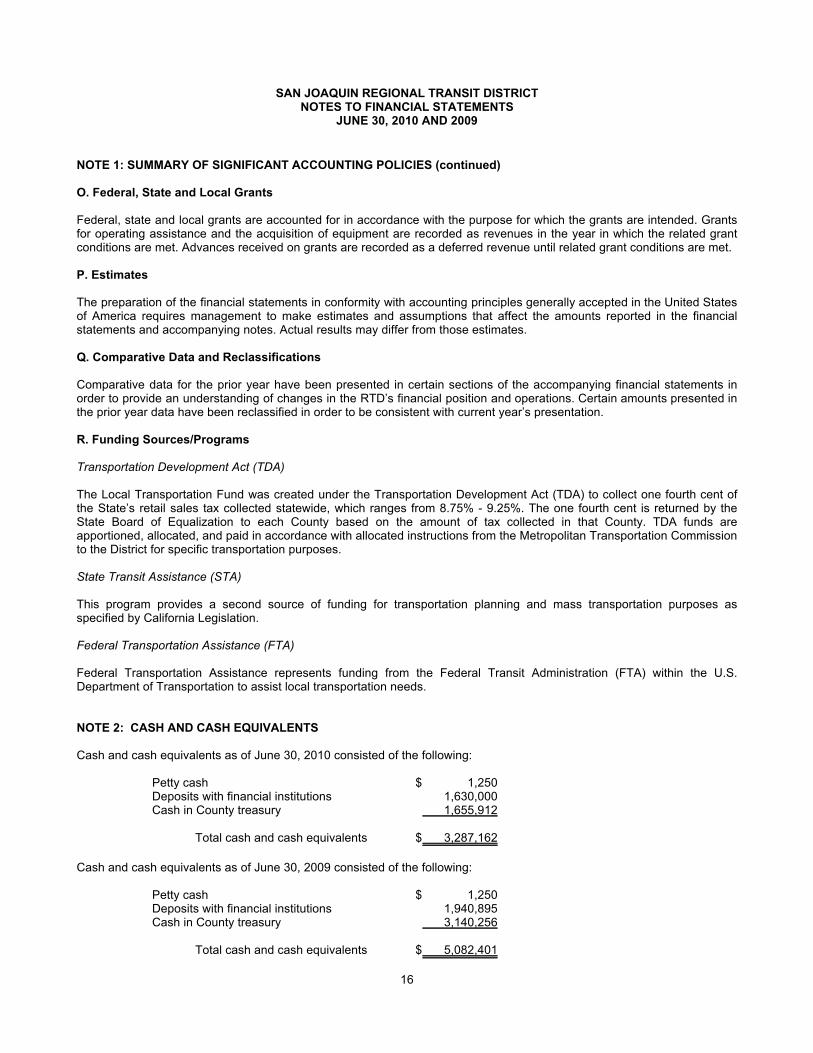
O. Federal, State and Local Grants
Federal, state and local grants are accounted for in accordance with the purpose for which the grants are intended. Grantsfor operating assistance and the acquisition of equipment are recorded as revenues in the year in which the related grantconditions are met. Advances received on grants are recorded as a deferred revenue until related grant conditions are met.
P. Estimates
The preparation of the financial statements in conformity with accounting principles generally accepted in the United Statesof America requires management to make estimates and assumptions that affect the amounts reported in the financialstatements and accompanying notes. Actual results may differ from those estimates.
Q. Comparative Data and Reclassifications
Comparative data for the prior year have been presented in certain sections of the accompanying financial statements inorder to provide an understanding of changes in the RTD’s financial position and operations. Certain amounts presented inthe prior year data have been reclassified in order to be consistent with current year’s presentation.
R. Funding Sources/Programs
Transportation Development Act (TDA)
The Local Transportation Fund was created under the Transportation Development Act (TDA) to collect one fourth cent ofthe State’s retail sales tax collected statewide, which ranges from 8.75% - 9.25%. The one fourth cent is returned by theState Board of Equalization to each County based on the amount of tax collected in that County. TDA funds areapportioned, allocated, and paid in accordance with allocated instructions from the Metropolitan Transportation Commissionto the District for specific transportation purposes.
State Transit Assistance (STA)
This program provides a second source of funding for transportation planning and mass transportation purposes asspecified by California Legislation.
Federal Transportation Assistance (FTA)
Federal Transportation Assistance represents funding from the Federal Transit Administration (FTA) within the U.S.Department of Transportation to assist local transportation needs.
NOTE 2: CASH AND CASH EQUIVALENTS
Cash and cash equivalents as of June 30, 2010 consisted of the following:
Petty cash $ 1,250Deposits with financial institutions 1,630,000Cash in County treasury 1,655,912
Total cash and cash equivalents $ 3,287,162
Cash and cash equivalents as of June 30, 2009 consisted of the following:
Petty cash $ 1,250Deposits with financial institutions 1,940,895Cash in County treasury 3,140,256
Total cash and cash equivalents $ 5,082,401
16
SAN JOAQUIN REGIONAL TRANSIT DISTRICTNOTES TO FINANCIAL STATEMENTS
JUNE 30, 2010 AND 2009
NOTE 2: CASH AND CASH EQUIVALENTS (continued)
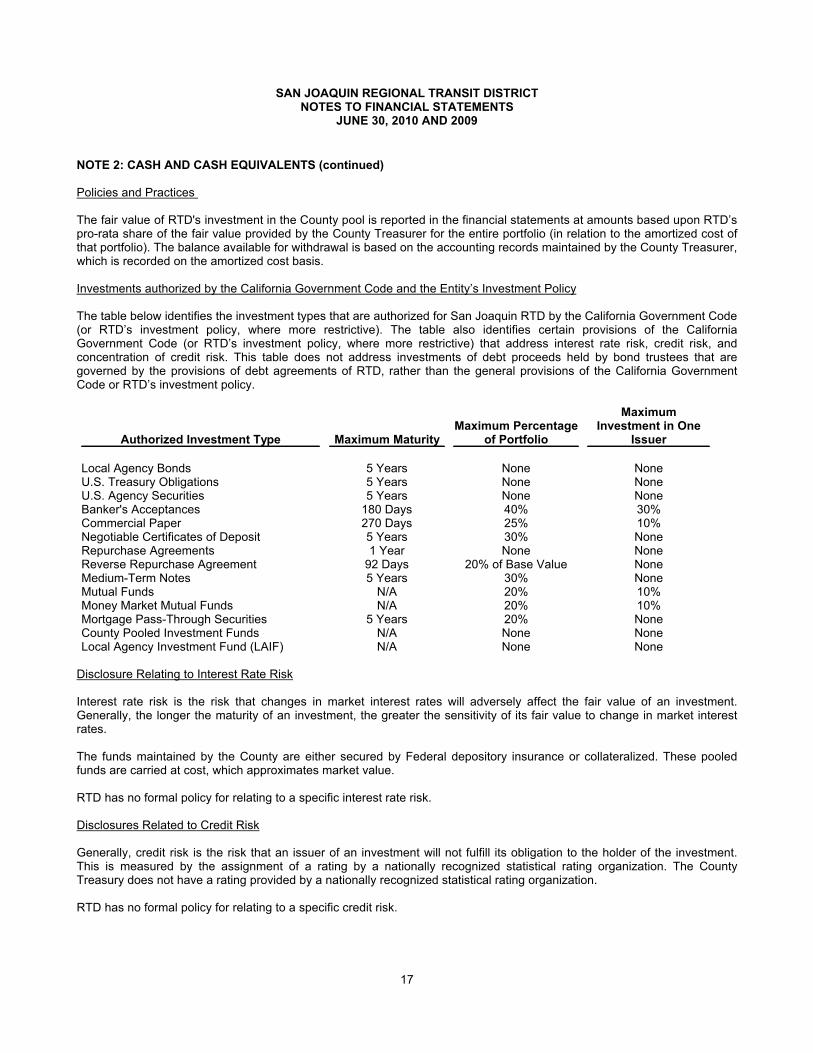
Policies and Practices
The fair value of RTD's investment in the County pool is reported in the financial statements at amounts based upon RTD’spro-rata share of the fair value provided by the County Treasurer for the entire portfolio (in relation to the amortized cost ofthat portfolio). The balance available for withdrawal is based on the accounting records maintained by the County Treasurer,which is recorded on the amortized cost basis.
Investments authorized by the California Government Code and the Entity’s Investment Policy
The table below identifies the investment types that are authorized for San Joaquin RTD by the California Government Code(or RTD’s investment policy, where more restrictive). The table also identifies certain provisions of the CaliforniaGovernment Code (or RTD’s investment policy, where more restrictive) that address interest rate risk, credit risk, andconcentration of credit risk. This table does not address investments of debt proceeds held by bond trustees that aregoverned by the provisions of debt agreements of RTD, rather than the general provisions of the California GovernmentCode or RTD’s investment policy.
Authorized Investment Type Maximum MaturityMaximum Percentage
of Portfolio
MaximumInvestment in One
Issuer
Local Agency Bonds 5 Years None NoneU.S. Treasury Obligations 5 Years None NoneU.S. Agency Securities 5 Years None NoneBanker's Acceptances 180 Days 40% 30%Commercial Paper 270 Days 25% 10%Negotiable Certificates of Deposit 5 Years 30% NoneRepurchase Agreements 1 Year None NoneReverse Repurchase Agreement 92 Days 20% of Base Value NoneMedium-Term Notes 5 Years 30% NoneMutual Funds N/A 20% 10%Money Market Mutual Funds N/A 20% 10%Mortgage Pass-Through Securities 5 Years 20% NoneCounty Pooled Investment Funds N/A None NoneLocal Agency Investment Fund (LAIF) N/A None None
Disclosure Relating to Interest Rate Risk
Interest rate risk is the risk that changes in market interest rates will adversely affect the fair value of an investment.Generally, the longer the maturity of an investment, the greater the sensitivity of its fair value to change in market interestrates.
The funds maintained by the County are either secured by Federal depository insurance or collateralized. These pooledfunds are carried at cost, which approximates market value.
RTD has no formal policy for relating to a specific interest rate risk.
Disclosures Related to Credit Risk
Generally, credit risk is the risk that an issuer of an investment will not fulfill its obligation to the holder of the investment.This is measured by the assignment of a rating by a nationally recognized statistical rating organization. The CountyTreasury does not have a rating provided by a nationally recognized statistical rating organization.
RTD has no formal policy for relating to a specific credit risk.
17
SAN JOAQUIN REGIONAL TRANSIT DISTRICTNOTES TO FINANCIAL STATEMENTS
JUNE 30, 2010 AND 2009
NOTE 2: CASH AND CASH EQUIVALENTS (continued)
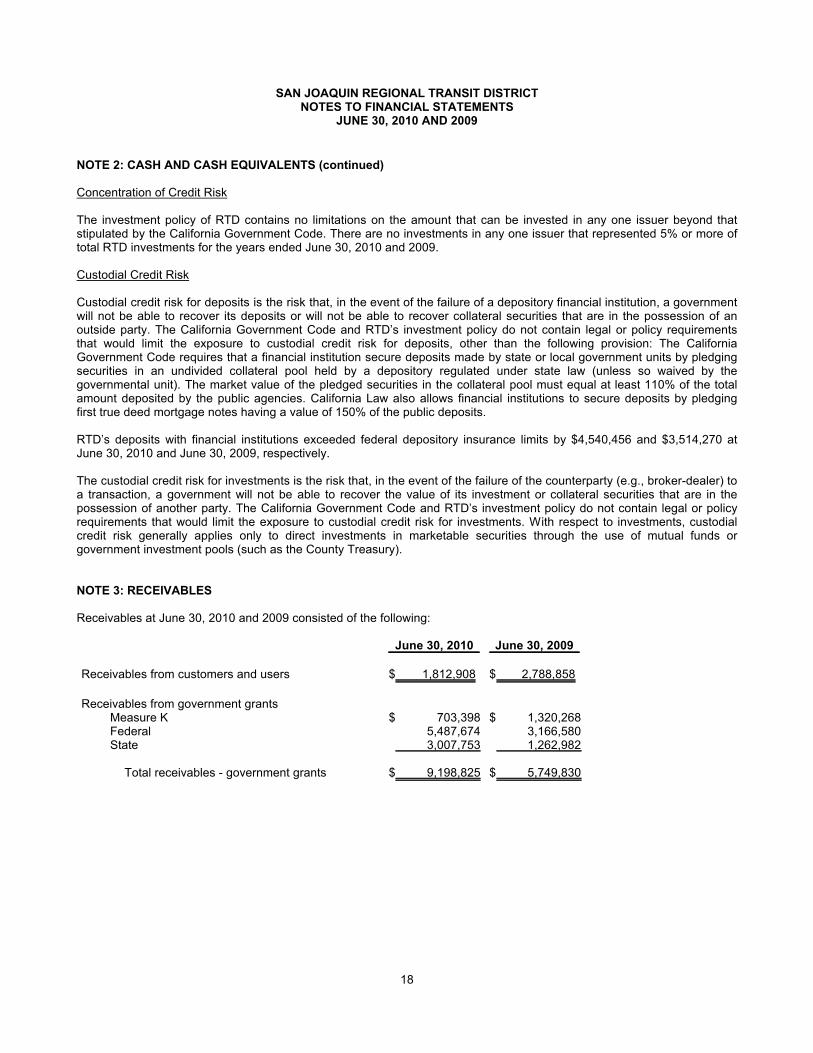
Concentration of Credit Risk
The investment policy of RTD contains no limitations on the amount that can be invested in any one issuer beyond thatstipulated by the California Government Code. There are no investments in any one issuer that represented 5% or more oftotal RTD investments for the years ended June 30, 2010 and 2009.
Custodial Credit Risk
Custodial credit risk for deposits is the risk that, in the event of the failure of a depository financial institution, a governmentwill not be able to recover its deposits or will not be able to recover collateral securities that are in the possession of anoutside party. The California Government Code and RTD’s investment policy do not contain legal or policy requirementsthat would limit the exposure to custodial credit risk for deposits, other than the following provision: The CaliforniaGovernment Code requires that a financial institution secure deposits made by state or local government units by pledgingsecurities in an undivided collateral pool held by a depository regulated under state law (unless so waived by thegovernmental unit). The market value of the pledged securities in the collateral pool must equal at least 110% of the totalamount deposited by the public agencies. California Law also allows financial institutions to secure deposits by pledgingfirst true deed mortgage notes having a value of 150% of the public deposits.
RTD’s deposits with financial institutions exceeded federal depository insurance limits by $4,540,456 and $3,514,270 atJune 30, 2010 and June 30, 2009, respectively.
The custodial credit risk for investments is the risk that, in the event of the failure of the counterparty (e.g., broker-dealer) toa transaction, a government will not be able to recover the value of its investment or collateral securities that are in thepossession of another party. The California Government Code and RTD’s investment policy do not contain legal or policyrequirements that would limit the exposure to custodial credit risk for investments. With respect to investments, custodialcredit risk generally applies only to direct investments in marketable securities through the use of mutual funds orgovernment investment pools (such as the County Treasury).
NOTE 3: RECEIVABLES
Receivables at June 30, 2010 and 2009 consisted of the following:
June 30, 2010 June 30, 2009
Receivables from customers and users $ 1,812,908 $ 2,788,858
Receivables from government grantsMeasure K $ 703,398 $ 1,320,268Federal 5,487,674 3,166,580State 3,007,753 1,262,982
Total receivables - government grants $ 9,198,825 $ 5,749,830
18
SAN JOAQUIN REGIONAL TRANSIT DISTRICTNOTES TO FINANCIAL STATEMENTS
JUNE 30, 2010 AND 2009
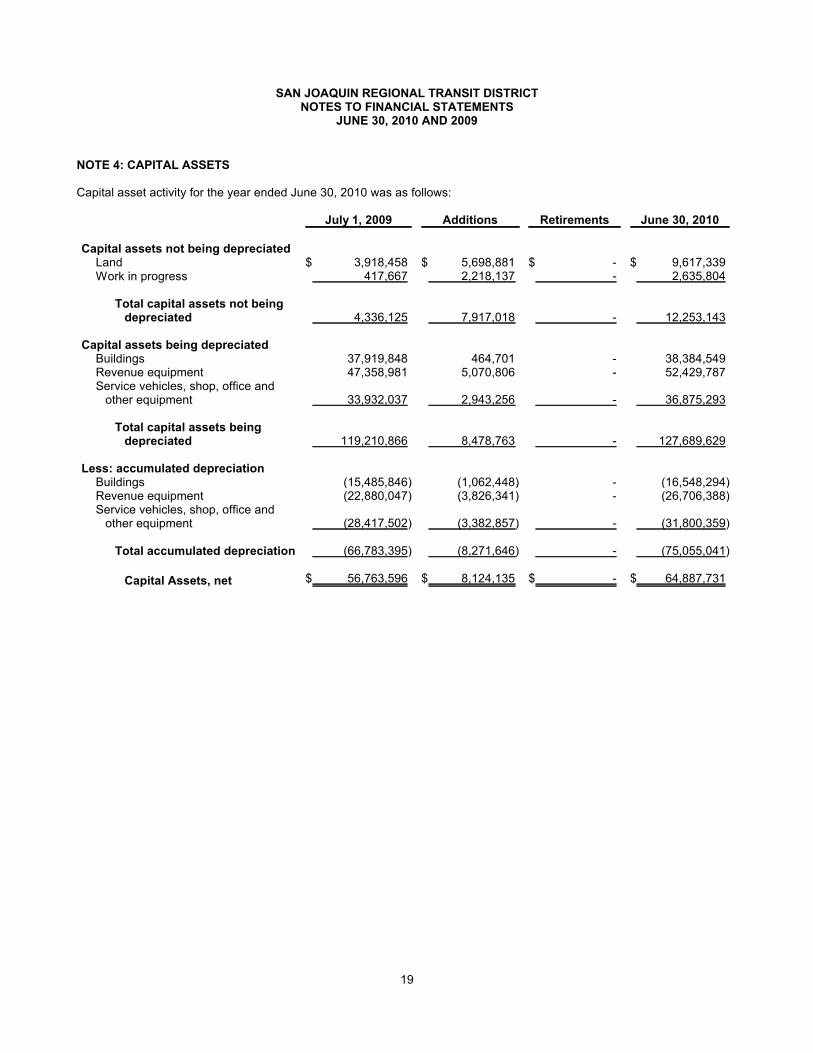
NOTE 4: CAPITAL ASSETS
Capital asset activity for the year ended June 30, 2010 was as follows:
July 1, 2009 Additions Retirements June 30, 2010
Capital assets not being depreciatedLand $ 3,918,458 $ 5,698,881 $ - $ 9,617,339Work in progress 417,667 2,218,137 - 2,635,804
Total capital assets not beingdepreciated 4,336,125 7,917,018 - 12,253,143
Capital assets being depreciatedBuildings 37,919,848 464,701 - 38,384,549Revenue equipment 47,358,981 5,070,806 - 52,429,787Service vehicles, shop, office and
other equipment 33,932,037 2,943,256 - 36,875,293
Total capital assets beingdepreciated 119,210,866 8,478,763 - 127,689,629
Less: accumulated depreciationBuildings (15,485,846) (1,062,448) - (16,548,294)Revenue equipment (22,880,047) (3,826,341) - (26,706,388)Service vehicles, shop, office and
other equipment (28,417,502) (3,382,857) - (31,800,359)
Total accumulated depreciation (66,783,395) (8,271,646) - (75,055,041)
Capital Assets, net $ 56,763,596 $ 8,124,135 $ - $ 64,887,731
19
SAN JOAQUIN REGIONAL TRANSIT DISTRICTNOTES TO FINANCIAL STATEMENTS
JUNE 30, 2010 AND 2009
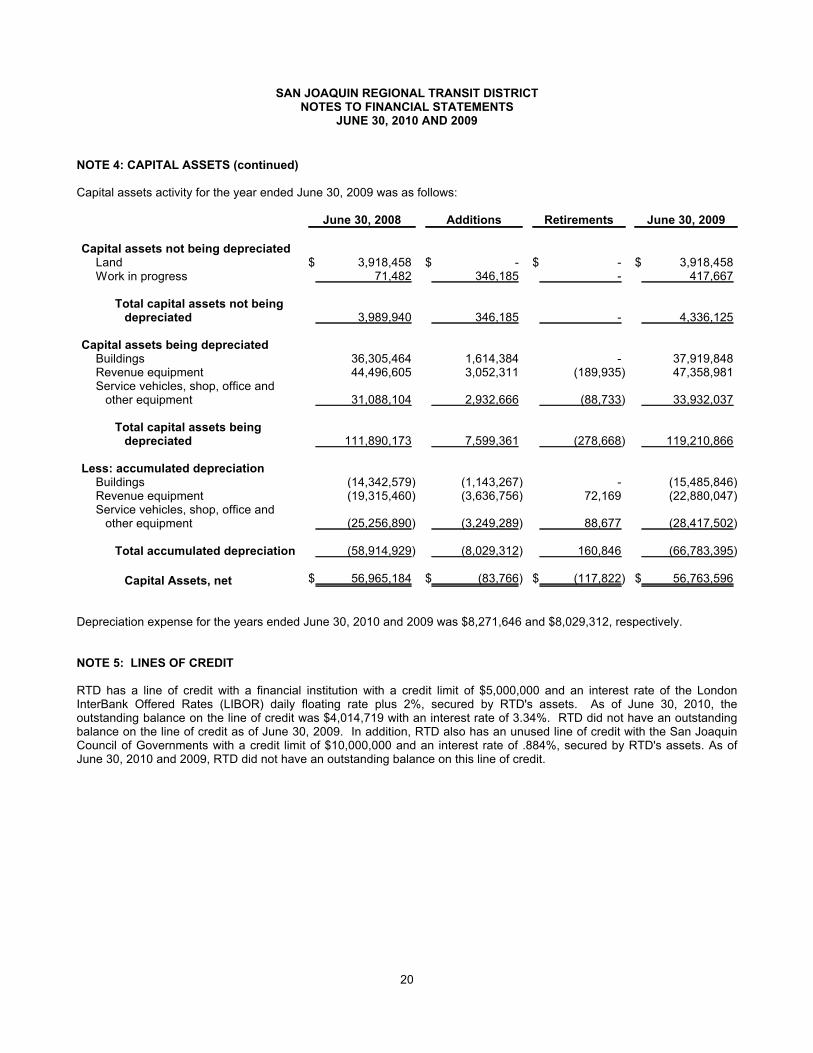
NOTE 4: CAPITAL ASSETS (continued)
Capital assets activity for the year ended June 30, 2009 was as follows:
June 30, 2008 Additions Retirements June 30, 2009
Capital assets not being depreciatedLand $ 3,918,458 $ - $ - $ 3,918,458Work in progress 71,482 346,185 - 417,667
Total capital assets not beingdepreciated 3,989,940 346,185 - 4,336,125
Capital assets being depreciatedBuildings 36,305,464 1,614,384 - 37,919,848Revenue equipment 44,496,605 3,052,311 (189,935) 47,358,981Service vehicles, shop, office and
other equipment 31,088,104 2,932,666 (88,733) 33,932,037
Total capital assets beingdepreciated 111,890,173 7,599,361 (278,668) 119,210,866
Less: accumulated depreciationBuildings (14,342,579) (1,143,267) - (15,485,846)Revenue equipment (19,315,460) (3,636,756) 72,169 (22,880,047)Service vehicles, shop, office and
other equipment (25,256,890) (3,249,289) 88,677 (28,417,502)
Total accumulated depreciation (58,914,929) (8,029,312) 160,846 (66,783,395)
Capital Assets, net $ 56,965,184 $ (83,766) $ (117,822) $ 56,763,596
Depreciation expense for the years ended June 30, 2010 and 2009 was $8,271,646 and $8,029,312, respectively.
NOTE 5: LINES OF CREDIT
RTD has a line of credit with a financial institution with a credit limit of $5,000,000 and an interest rate of the LondonInterBank Offered Rates (LIBOR) daily floating rate plus 2%, secured by RTD's assets. As of June 30, 2010, theoutstanding balance on the line of credit was $4,014,719 with an interest rate of 3.34%. RTD did not have an outstandingbalance on the line of credit as of June 30, 2009. In addition, RTD also has an unused line of credit with the San JoaquinCouncil of Governments with a credit limit of $10,000,000 and an interest rate of .884%, secured by RTD's assets. As ofJune 30, 2010 and 2009, RTD did not have an outstanding balance on this line of credit.
20
SAN JOAQUIN REGIONAL TRANSIT DISTRICTNOTES TO FINANCIAL STATEMENTS
JUNE 30, 2010 AND 2009
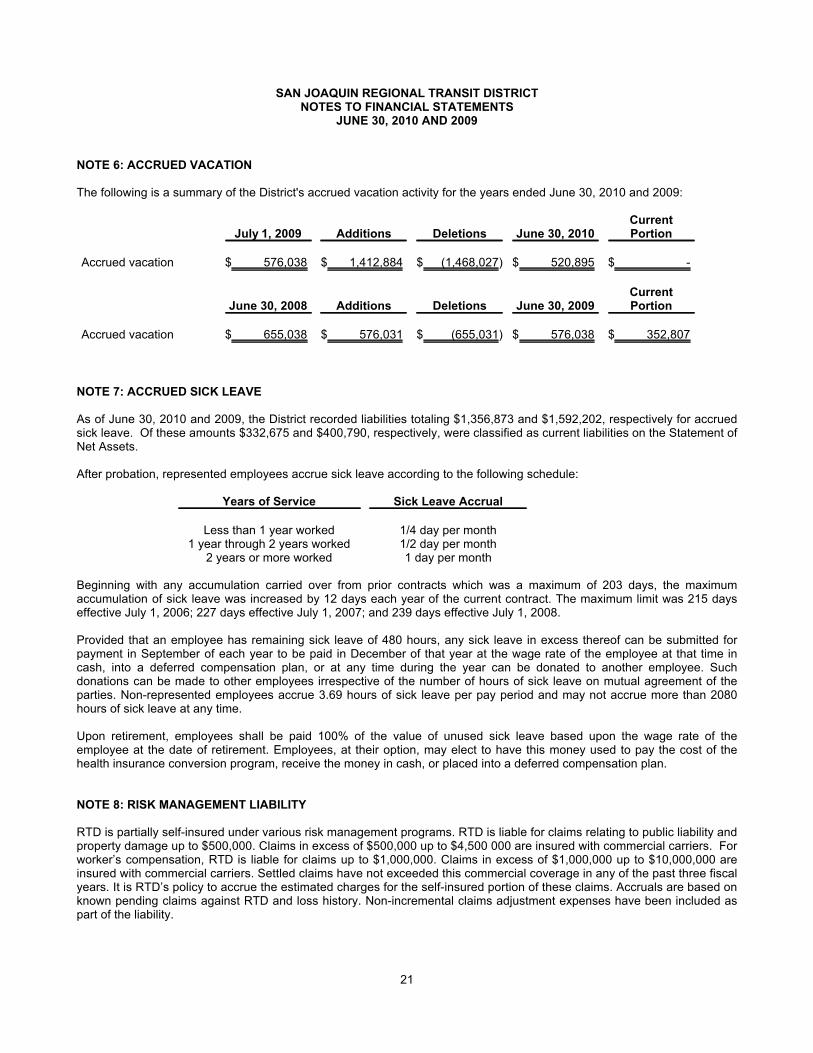
NOTE 6: ACCRUED VACATION
The following is a summary of the District's accrued vacation activity for the years ended June 30, 2010 and 2009:
July 1, 2009 Additions Deletions June 30, 2010CurrentPortion
Accrued vacation $ 576,038 $ 1,412,884 $ (1,468,027) $ 520,895 $ -
June 30, 2008 Additions Deletions June 30, 2009CurrentPortion
Accrued vacation $ 655,038 $ 576,031 $ (655,031) $ 576,038 $ 352,807
NOTE 7: ACCRUED SICK LEAVE
As of June 30, 2010 and 2009, the District recorded liabilities totaling $1,356,873 and $1,592,202, respectively for accruedsick leave. Of these amounts $332,675 and $400,790, respectively, were classified as current liabilities on the Statement ofNet Assets.
After probation, represented employees accrue sick leave according to the following schedule:
Years of Service Sick Leave Accrual
Less than 1 year worked 1/4 day per month1 year through 2 years worked 1/2 day per month
2 years or more worked 1 day per month
Beginning with any accumulation carried over from prior contracts which was a maximum of 203 days, the maximumaccumulation of sick leave was increased by 12 days each year of the current contract. The maximum limit was 215 dayseffective July 1, 2006; 227 days effective July 1, 2007; and 239 days effective July 1, 2008.
Provided that an employee has remaining sick leave of 480 hours, any sick leave in excess thereof can be submitted forpayment in September of each year to be paid in December of that year at the wage rate of the employee at that time incash, into a deferred compensation plan, or at any time during the year can be donated to another employee. Suchdonations can be made to other employees irrespective of the number of hours of sick leave on mutual agreement of theparties. Non-represented employees accrue 3.69 hours of sick leave per pay period and may not accrue more than 2080hours of sick leave at any time.
Upon retirement, employees shall be paid 100% of the value of unused sick leave based upon the wage rate of theemployee at the date of retirement. Employees, at their option, may elect to have this money used to pay the cost of thehealth insurance conversion program, receive the money in cash, or placed into a deferred compensation plan.
NOTE 8: RISK MANAGEMENT LIABILITY
RTD is partially self-insured under various risk management programs. RTD is liable for claims relating to public liability andproperty damage up to $500,000. Claims in excess of $500,000 up to $4,500 000 are insured with commercial carriers. Forworker’s compensation, RTD is liable for claims up to $1,000,000. Claims in excess of $1,000,000 up to $10,000,000 areinsured with commercial carriers. Settled claims have not exceeded this commercial coverage in any of the past three fiscalyears. It is RTD’s policy to accrue the estimated charges for the self-insured portion of these claims. Accruals are based onknown pending claims against RTD and loss history. Non-incremental claims adjustment expenses have been included aspart of the liability.
21
SAN JOAQUIN REGIONAL TRANSIT DISTRICTNOTES TO FINANCIAL STATEMENTS
JUNE 30, 2010 AND 2009
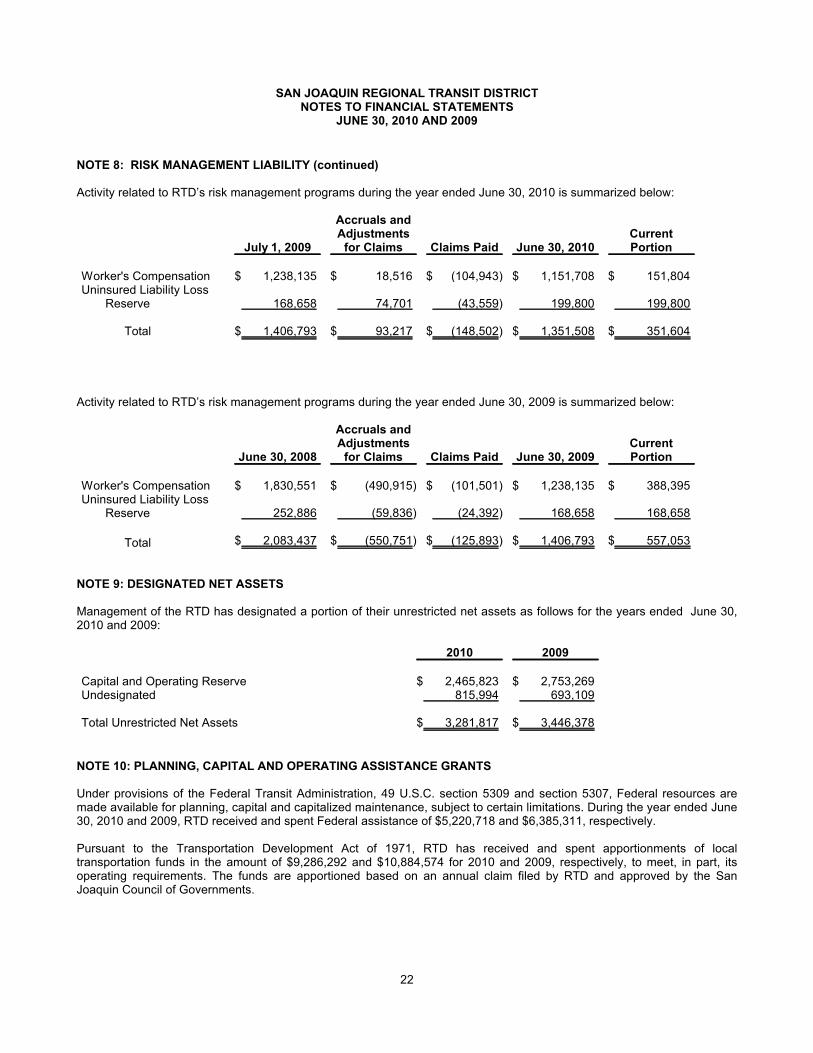
NOTE 8: RISK MANAGEMENT LIABILITY (continued)
Activity related to RTD’s risk management programs during the year ended June 30, 2010 is summarized below:
July 1, 2009
Accruals andAdjustments
for Claims Claims Paid June 30, 2010CurrentPortion
Worker's Compensation $ 1,238,135 $ 18,516 $ (104,943) $ 1,151,708 $ 151,804Uninsured Liability Loss
Reserve 168,658 74,701 (43,559) 199,800 199,800
Total $ 1,406,793 $ 93,217 $ (148,502) $ 1,351,508 $ 351,604
Activity related to RTD’s risk management programs during the year ended June 30, 2009 is summarized below:
June 30, 2008
Accruals andAdjustments
for Claims Claims Paid June 30, 2009CurrentPortion
Worker's Compensation $ 1,830,551 $ (490,915) $ (101,501) $ 1,238,135 $ 388,395Uninsured Liability Loss
Reserve 252,886 (59,836) (24,392) 168,658 168,658
Total $ 2,083,437 $ (550,751) $ (125,893) $ 1,406,793 $ 557,053
NOTE 9: DESIGNATED NET ASSETS
Management of the RTD has designated a portion of their unrestricted net assets as follows for the years ended June 30,2010 and 2009:
2010 2009
Capital and Operating Reserve $ 2,465,823 $ 2,753,269Undesignated 815,994 693,109
Total Unrestricted Net Assets $ 3,281,817 $ 3,446,378
NOTE 10: PLANNING, CAPITAL AND OPERATING ASSISTANCE GRANTS
Under provisions of the Federal Transit Administration, 49 U.S.C. section 5309 and section 5307, Federal resources aremade available for planning, capital and capitalized maintenance, subject to certain limitations. During the year ended June30, 2010 and 2009, RTD received and spent Federal assistance of $5,220,718 and $6,385,311, respectively.
Pursuant to the Transportation Development Act of 1971, RTD has received and spent apportionments of localtransportation funds in the amount of $9,286,292 and $10,884,574 for 2010 and 2009, respectively, to meet, in part, itsoperating requirements. The funds are apportioned based on an annual claim filed by RTD and approved by the SanJoaquin Council of Governments.
22
SAN JOAQUIN REGIONAL TRANSIT DISTRICTNOTES TO FINANCIAL STATEMENTS
JUNE 30, 2010 AND 2009
NOTE 11: DEFINED BENEFIT PENSION PLAN
Plan Description
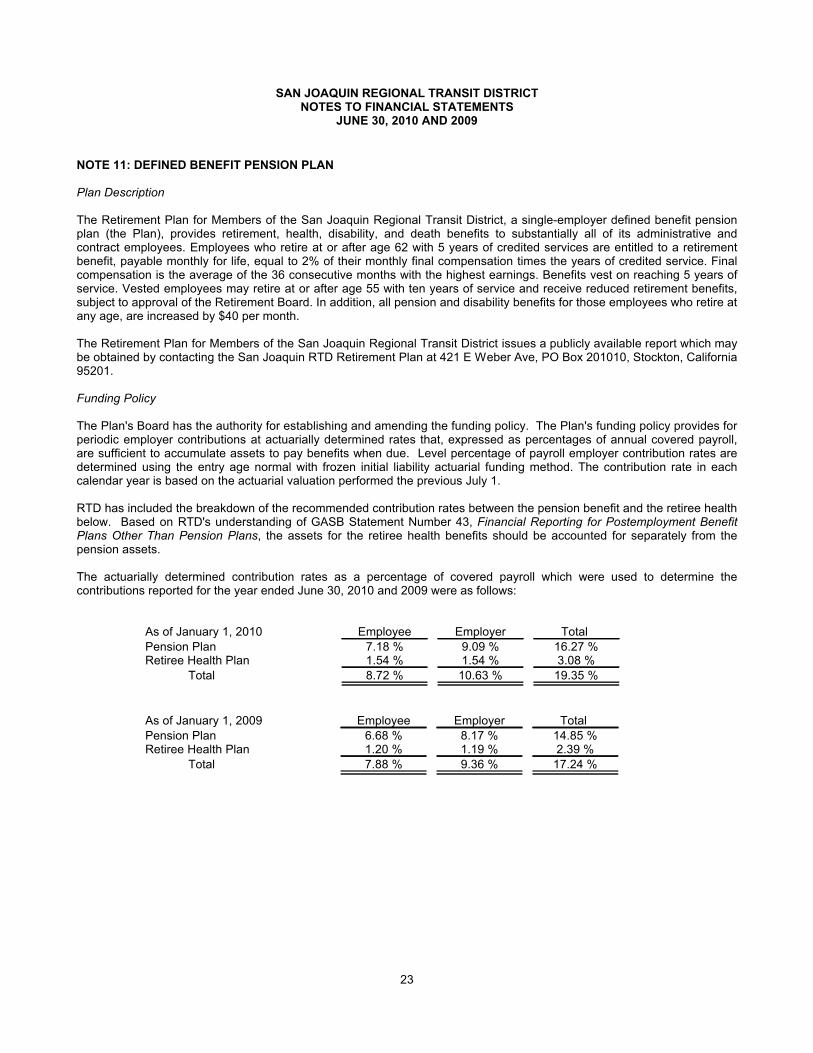
The Retirement Plan for Members of the San Joaquin Regional Transit District, a single-employer defined benefit pensionplan (the Plan), provides retirement, health, disability, and death benefits to substantially all of its administrative andcontract employees. Employees who retire at or after age 62 with 5 years of credited services are entitled to a retirementbenefit, payable monthly for life, equal to 2% of their monthly final compensation times the years of credited service. Finalcompensation is the average of the 36 consecutive months with the highest earnings. Benefits vest on reaching 5 years ofservice. Vested employees may retire at or after age 55 with ten years of service and receive reduced retirement benefits,subject to approval of the Retirement Board. In addition, all pension and disability benefits for those employees who retire atany age, are increased by $40 per month.
The Retirement Plan for Members of the San Joaquin Regional Transit District issues a publicly available report which maybe obtained by contacting the San Joaquin RTD Retirement Plan at 421 E Weber Ave, PO Box 201010, Stockton, California95201.
Funding Policy
The Plan's Board has the authority for establishing and amending the funding policy. The Plan's funding policy provides forperiodic employer contributions at actuarially determined rates that, expressed as percentages of annual covered payroll,are sufficient to accumulate assets to pay benefits when due. Level percentage of payroll employer contribution rates aredetermined using the entry age normal with frozen initial liability actuarial funding method. The contribution rate in eachcalendar year is based on the actuarial valuation performed the previous July 1.
RTD has included the breakdown of the recommended contribution rates between the pension benefit and the retiree healthbelow. Based on RTD's understanding of GASB Statement Number 43, Financial Reporting for Postemployment BenefitPlans Other Than Pension Plans, the assets for the retiree health benefits should be accounted for separately from thepension assets.
The actuarially determined contribution rates as a percentage of covered payroll which were used to determine thecontributions reported for the year ended June 30, 2010 and 2009 were as follows:
As of January 1, 2010 Employee Employer Total
Pension Plan 7.18 % 9.09 % 16.27 %Retiree Health Plan 1.54 % 1.54 % 3.08 %
Total 8.72 % 10.63 % 19.35 %
As of January 1, 2009 Employee Employer Total
Pension Plan 6.68 % 8.17 % 14.85 %Retiree Health Plan 1.20 % 1.19 % 2.39 %
Total 7.88 % 9.36 % 17.24 %
23
SAN JOAQUIN REGIONAL TRANSIT DISTRICTNOTES TO FINANCIAL STATEMENTS
JUNE 30, 2010 AND 2009
NOTE 11: DEFINED BENEFIT PENSION PLAN (continued)
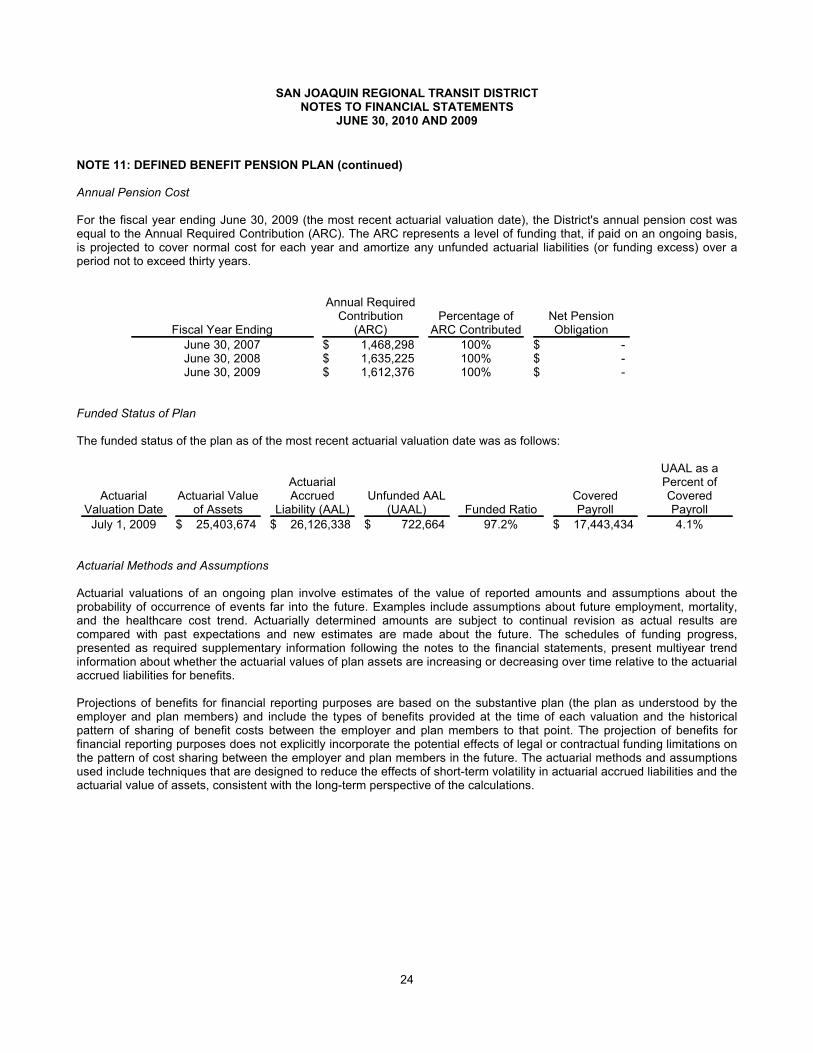
Annual Pension Cost
For the fiscal year ending June 30, 2009 (the most recent actuarial valuation date), the District's annual pension cost wasequal to the Annual Required Contribution (ARC). The ARC represents a level of funding that, if paid on an ongoing basis,is projected to cover normal cost for each year and amortize any unfunded actuarial liabilities (or funding excess) over aperiod not to exceed thirty years.
Fiscal Year Ending
Annual RequiredContribution
(ARC)Percentage of
ARC ContributedNet PensionObligation
June 30, 2007 $ 1,468,298 100% $ -June 30, 2008 $ 1,635,225 100% $ -June 30, 2009 $ 1,612,376 100% $ -
Funded Status of Plan
The funded status of the plan as of the most recent actuarial valuation date was as follows:
ActuarialValuation Date
Actuarial Valueof Assets
ActuarialAccrued
Liability (AAL)Unfunded AAL
(UAAL) Funded RatioCoveredPayroll
UAAL as aPercent ofCoveredPayroll
July 1, 2009 $ 25,403,674 $ 26,126,338 $ 722,664 97.2% $ 17,443,434 4.1%
Actuarial Methods and Assumptions
Actuarial valuations of an ongoing plan involve estimates of the value of reported amounts and assumptions about theprobability of occurrence of events far into the future. Examples include assumptions about future employment, mortality,and the healthcare cost trend. Actuarially determined amounts are subject to continual revision as actual results arecompared with past expectations and new estimates are made about the future. The schedules of funding progress,presented as required supplementary information following the notes to the financial statements, present multiyear trendinformation about whether the actuarial values of plan assets are increasing or decreasing over time relative to the actuarialaccrued liabilities for benefits.
Projections of benefits for financial reporting purposes are based on the substantive plan (the plan as understood by theemployer and plan members) and include the types of benefits provided at the time of each valuation and the historicalpattern of sharing of benefit costs between the employer and plan members to that point. The projection of benefits forfinancial reporting purposes does not explicitly incorporate the potential effects of legal or contractual funding limitations onthe pattern of cost sharing between the employer and plan members in the future. The actuarial methods and assumptionsused include techniques that are designed to reduce the effects of short-term volatility in actuarial accrued liabilities and theactuarial value of assets, consistent with the long-term perspective of the calculations.
24
SAN JOAQUIN REGIONAL TRANSIT DISTRICTNOTES TO FINANCIAL STATEMENTS
JUNE 30, 2010 AND 2009
NOTE 11: DEFINED BENEFIT PENSION PLAN (continued)
The information presented in the Schedule of Funding Progress and the Schedule of Employer Contributions wasdetermined as part of the actuarial valuations at the dates indicated. Additional information as of the latest actuarialvaluation follows:
Valuation date July 1, 2009
Actuarial cost method Frozen Entry Age Normal
Amortization method Level dollar
Remaining amortization period 13.5 years closed
Asset valuation method Five year smoothed market
Actuarial assumptions:
Investment rate of return 7.75 %
Projected salary increase(includes inflation at 3.50 %)
4.00 %
Health Insurance Benefits(includes inflation at 3.50 %)
5.50 %
NOTE 12: COMMITMENTS AND CONTINGENCIES
RTD is involved in various claims and litigations arising in the ordinary course of its operations. RTD management, afterconsultation with RTD’s General Counsel, believes that they have sufficient insurance coverage so that resolution of suchmatters will not have a material effect on RTD’s financial position or results of operations.
NOTE 13: SUBSEQUENT EVENT
Contract for County Services
At its July 8, 2010, RTD's Board of Directors approved a resolution awarding MV Transportation (MV), Inc. a five-yearcontract, effective September 5, 2010, for the operations and maintenance of the services RTD provides through its Countyyard operations: Intercity, Hopper, and San Joaquin Commuter. Under this contract, MV will be providing the services onbehalf of RTD. RTD had been providing these services since November 2002.
25

REQUIRED SUPPLEMENTARY INFORMATION
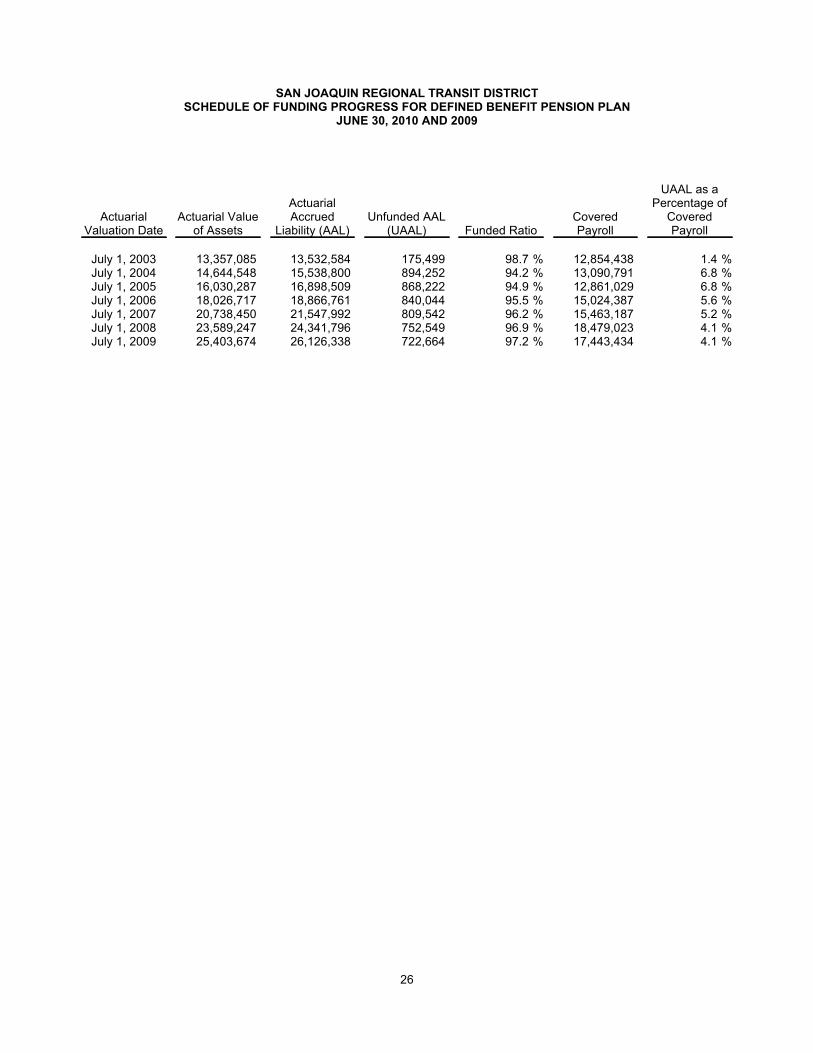
SAN JOAQUIN REGIONAL TRANSIT DISTRICTSCHEDULE OF FUNDING PROGRESS FOR DEFINED BENEFIT PENSION PLAN
JUNE 30, 2010 AND 2009
ActuarialValuation Date
Actuarial Valueof Assets
ActuarialAccrued
Liability (AAL)Unfunded AAL
(UAAL) Funded RatioCoveredPayroll
UAAL as aPercentage of
CoveredPayroll
July 1, 2003 13,357,085 13,532,584 175,499 %98.7 12,854,438 %1.4July 1, 2004 14,644,548 15,538,800 894,252 %94.2 13,090,791 %6.8July 1, 2005 16,030,287 16,898,509 868,222 %94.9 12,861,029 %6.8July 1, 2006 18,026,717 18,866,761 840,044 %95.5 15,024,387 %5.6July 1, 2007 20,738,450 21,547,992 809,542 %96.2 15,463,187 %5.2July 1, 2008 23,589,247 24,341,796 752,549 %96.9 18,479,023 %4.1July 1, 2009 25,403,674 26,126,338 722,664 %97.2 17,443,434 %4.1
26
Statistical Section
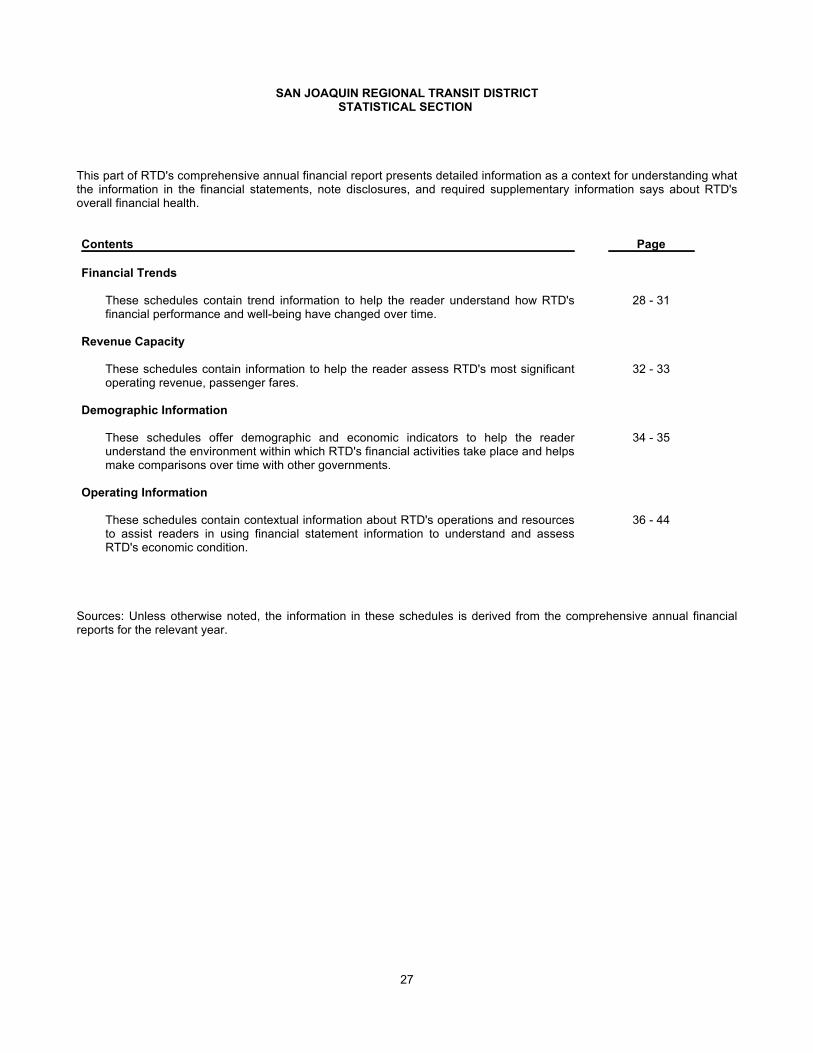
SAN JOAQUIN REGIONAL TRANSIT DISTRICTSTATISTICAL SECTION
This part of RTD's comprehensive annual financial report presents detailed information as a context for understanding whatthe information in the financial statements, note disclosures, and required supplementary information says about RTD'soverall financial health.
Contents Page
Financial Trends
These schedules contain trend information to help the reader understand how RTD'sfinancial performance and well-being have changed over time.
28 - 31
Revenue Capacity
These schedules contain information to help the reader assess RTD's most significantoperating revenue, passenger fares.
32 - 33
Demographic Information
These schedules offer demographic and economic indicators to help the readerunderstand the environment within which RTD's financial activities take place and helpsmake comparisons over time with other governments.
34 - 35
Operating Information
These schedules contain contextual information about RTD's operations and resourcesto assist readers in using financial statement information to understand and assessRTD's economic condition.
36 - 44
Sources: Unless otherwise noted, the information in these schedules is derived from the comprehensive annual financialreports for the relevant year.
27
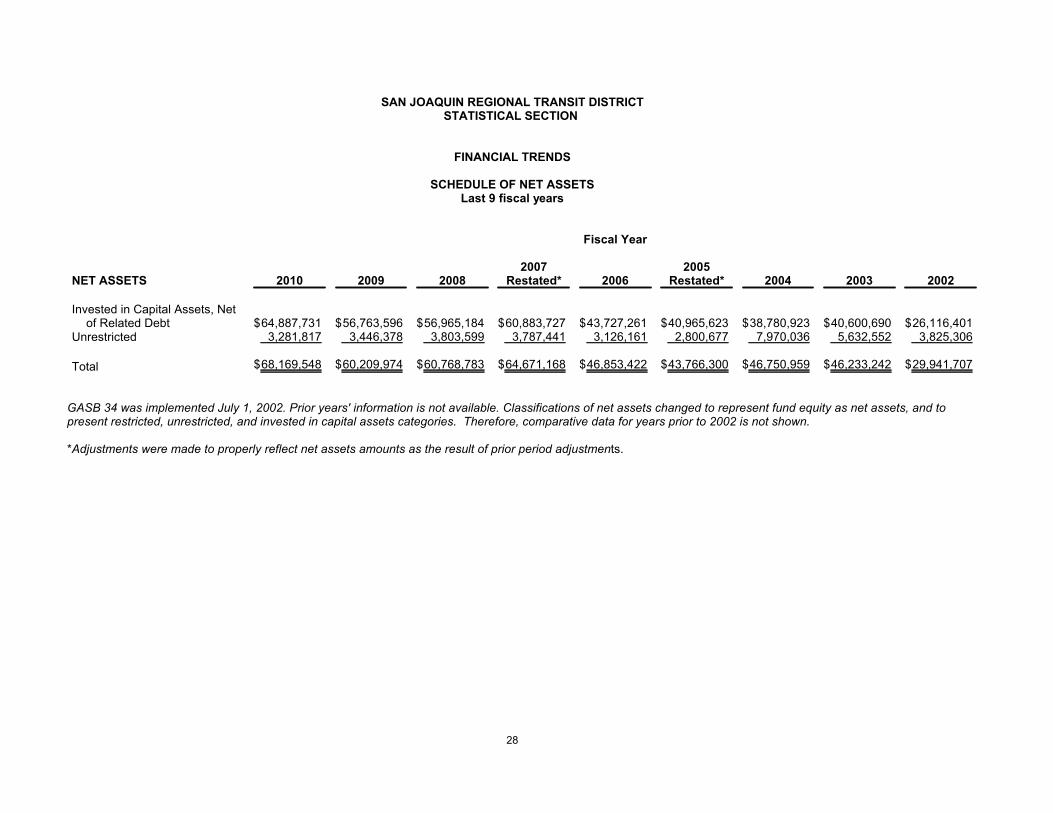
SAN JOAQUIN REGIONAL TRANSIT DISTRICTSTATISTICAL SECTION
FINANCIAL TRENDS
SCHEDULE OF NET ASSETSLast 9 fiscal years
Fiscal Year
NET ASSETS 2010 2009 20082007
Restated* 20062005
Restated* 2004 2003 2002
Invested in Capital Assets, Netof Related Debt $64,887,731 $56,763,596 $56,965,184 $60,883,727 $43,727,261 $40,965,623 $38,780,923 $40,600,690 $26,116,401
Unrestricted 3,281,817 3,446,378 3,803,599 3,787,441 3,126,161 2,800,677 7,970,036 5,632,552 3,825,306
Total $68,169,548 $60,209,974 $60,768,783 $64,671,168 $46,853,422 $43,766,300 $46,750,959 $46,233,242 $29,941,707
GASB 34 was implemented July 1, 2002. Prior years' information is not available. Classifications of net assets changed to represent fund equity as net assets, and topresent restricted, unrestricted, and invested in capital assets categories. Therefore, comparative data for years prior to 2002 is not shown.
*Adjustments were made to properly reflect net assets amounts as the result of prior period adjustments.
28
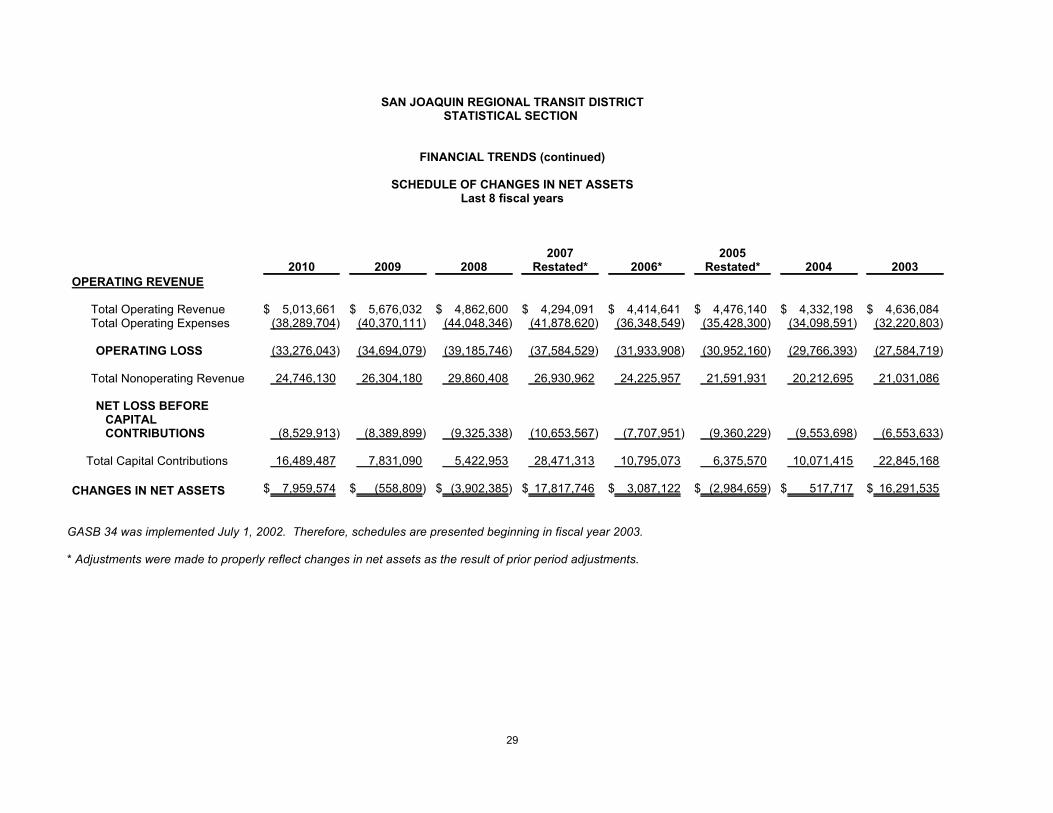
SAN JOAQUIN REGIONAL TRANSIT DISTRICTSTATISTICAL SECTION
FINANCIAL TRENDS (continued)
SCHEDULE OF CHANGES IN NET ASSETSLast 8 fiscal years
2010 2009 20082007
Restated* 2006*2005
Restated* 2004 2003
OPERATING REVENUE
Total Operating Revenue $ 5,013,661 $ 5,676,032 $ 4,862,600 $ 4,294,091 $ 4,414,641 $ 4,476,140 $ 4,332,198 $ 4,636,084Total Operating Expenses (38,289,704) (40,370,111) (44,048,346) (41,878,620) (36,348,549) (35,428,300) (34,098,591) (32,220,803)
OPERATING LOSS (33,276,043) (34,694,079) (39,185,746) (37,584,529) (31,933,908) (30,952,160) (29,766,393) (27,584,719)
Total Nonoperating Revenue 24,746,130 26,304,180 29,860,408 26,930,962 24,225,957 21,591,931 20,212,695 21,031,086
NET LOSS BEFORECAPITALCONTRIBUTIONS (8,529,913) (8,389,899) (9,325,338) (10,653,567) (7,707,951) (9,360,229) (9,553,698) (6,553,633)
Total Capital Contributions 16,489,487 7,831,090 5,422,953 28,471,313 10,795,073 6,375,570 10,071,415 22,845,168
CHANGES IN NET ASSETS $ 7,959,574 $ (558,809) $ (3,902,385) $ 17,817,746 $ 3,087,122 $ (2,984,659) $ 517,717 $ 16,291,535
GASB 34 was implemented July 1, 2002. Therefore, schedules are presented beginning in fiscal year 2003.
* Adjustments were made to properly reflect changes in net assets as the result of prior period adjustments.
29
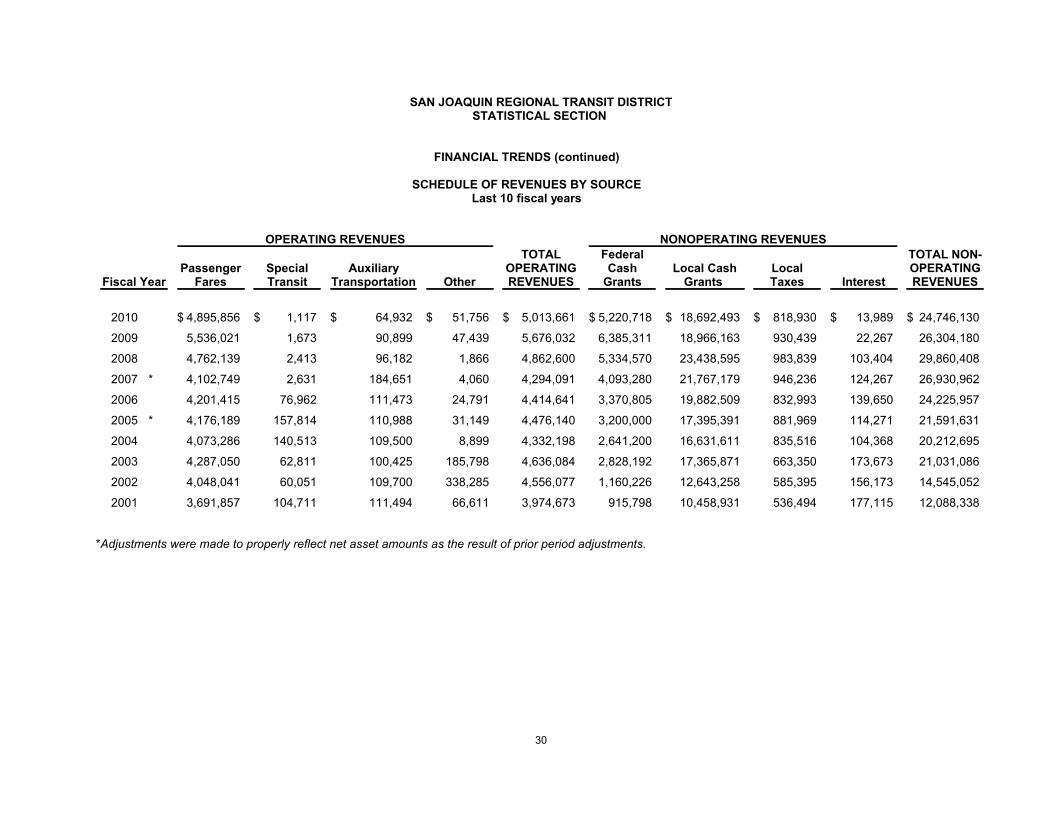
SAN JOAQUIN REGIONAL TRANSIT DISTRICTSTATISTICAL SECTION
FINANCIAL TRENDS (continued)
SCHEDULE OF REVENUES BY SOURCELast 10 fiscal years
OPERATING REVENUES NONOPERATING REVENUES
Fiscal YearPassenger
FaresSpecialTransit
AuxiliaryTransportation Other
TOTALOPERATINGREVENUES
FederalCash
GrantsLocal Cash
Grants LocalTaxes Interest
TOTAL NON-OPERATINGREVENUES
2010 $ 4,895,856 $ 1,117 $ 64,932 $ 51,756 $ 5,013,661 $ 5,220,718 $ 18,692,493 $ 818,930 $ 13,989 $ 24,746,130
2009 5,536,021 1,673 90,899 47,439 5,676,032 6,385,311 18,966,163 930,439 22,267 26,304,180
2008 4,762,139 2,413 96,182 1,866 4,862,600 5,334,570 23,438,595 983,839 103,404 29,860,408
2007 * 4,102,749 2,631 184,651 4,060 4,294,091 4,093,280 21,767,179 946,236 124,267 26,930,962
2006 4,201,415 76,962 111,473 24,791 4,414,641 3,370,805 19,882,509 832,993 139,650 24,225,957
2005 * 4,176,189 157,814 110,988 31,149 4,476,140 3,200,000 17,395,391 881,969 114,271 21,591,631
2004 4,073,286 140,513 109,500 8,899 4,332,198 2,641,200 16,631,611 835,516 104,368 20,212,695
2003 4,287,050 62,811 100,425 185,798 4,636,084 2,828,192 17,365,871 663,350 173,673 21,031,086
2002 4,048,041 60,051 109,700 338,285 4,556,077 1,160,226 12,643,258 585,395 156,173 14,545,052
2001 3,691,857 104,711 111,494 66,611 3,974,673 915,798 10,458,931 536,494 177,115 12,088,338
*Adjustments were made to properly reflect net asset amounts as the result of prior period adjustments.
30
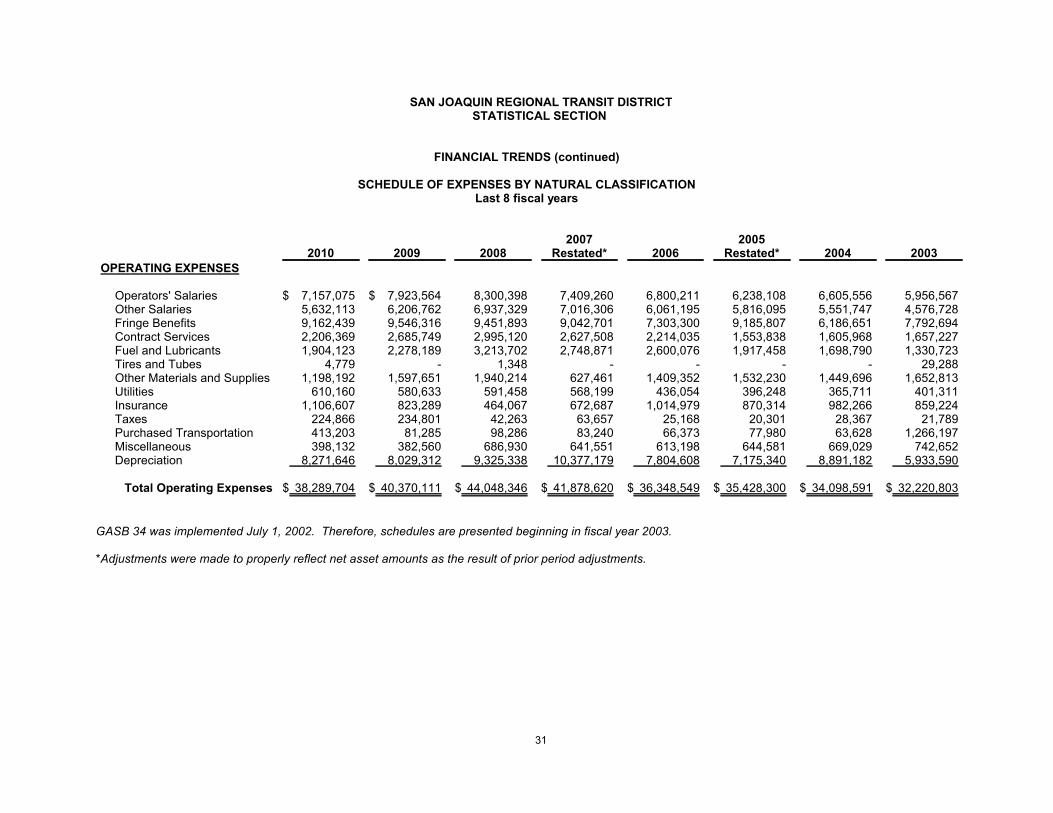
SAN JOAQUIN REGIONAL TRANSIT DISTRICTSTATISTICAL SECTION
FINANCIAL TRENDS (continued)
SCHEDULE OF EXPENSES BY NATURAL CLASSIFICATIONLast 8 fiscal years
2010 2009 20082007
Restated* 20062005
Restated* 2004 2003
OPERATING EXPENSES
Operators' Salaries $ 7,157,075 $ 7,923,564 8,300,398 7,409,260 6,800,211 6,238,108 6,605,556 5,956,567Other Salaries 5,632,113 6,206,762 6,937,329 7,016,306 6,061,195 5,816,095 5,551,747 4,576,728Fringe Benefits 9,162,439 9,546,316 9,451,893 9,042,701 7,303,300 9,185,807 6,186,651 7,792,694Contract Services 2,206,369 2,685,749 2,995,120 2,627,508 2,214,035 1,553,838 1,605,968 1,657,227Fuel and Lubricants 1,904,123 2,278,189 3,213,702 2,748,871 2,600,076 1,917,458 1,698,790 1,330,723Tires and Tubes 4,779 - 1,348 - - - - 29,288Other Materials and Supplies 1,198,192 1,597,651 1,940,214 627,461 1,409,352 1,532,230 1,449,696 1,652,813Utilities 610,160 580,633 591,458 568,199 436,054 396,248 365,711 401,311Insurance 1,106,607 823,289 464,067 672,687 1,014,979 870,314 982,266 859,224Taxes 224,866 234,801 42,263 63,657 25,168 20,301 28,367 21,789Purchased Transportation 413,203 81,285 98,286 83,240 66,373 77,980 63,628 1,266,197Miscellaneous 398,132 382,560 686,930 641,551 613,198 644,581 669,029 742,652Depreciation 8,271,646 8,029,312 9,325,338 10,377,179 7,804,608 7,175,340 8,891,182 5,933,590
Total Operating Expenses $ 38,289,704 $ 40,370,111 $ 44,048,346 $ 41,878,620 $ 36,348,549 $ 35,428,300 $ 34,098,591 $ 32,220,803
GASB 34 was implemented July 1, 2002. Therefore, schedules are presented beginning in fiscal year 2003.
*Adjustments were made to properly reflect net asset amounts as the result of prior period adjustments.
31
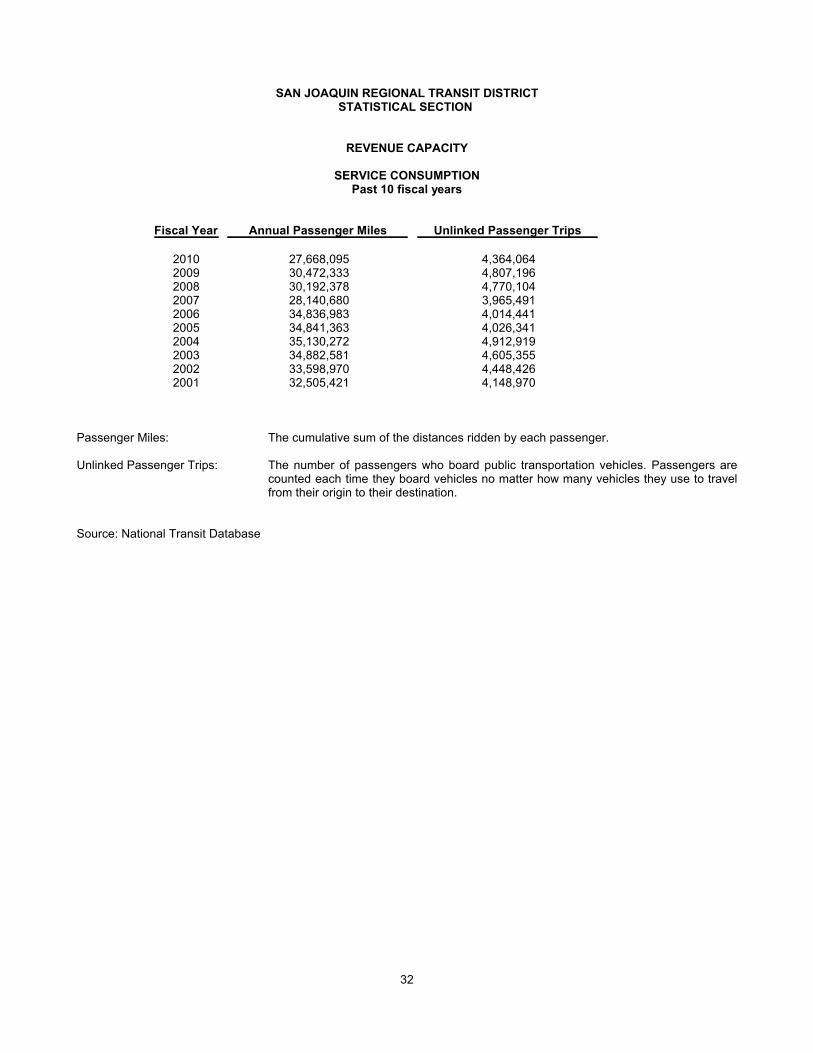
SAN JOAQUIN REGIONAL TRANSIT DISTRICTSTATISTICAL SECTION
REVENUE CAPACITY
SERVICE CONSUMPTIONPast 10 fiscal years
Fiscal Year Annual Passenger Miles Unlinked Passenger Trips
2010 27,668,095 4,364,0642009 30,472,333 4,807,1962008 30,192,378 4,770,1042007 28,140,680 3,965,4912006 34,836,983 4,014,4412005 34,841,363 4,026,3412004 35,130,272 4,912,9192003 34,882,581 4,605,3552002 33,598,970 4,448,4262001 32,505,421 4,148,970
Passenger Miles: The cumulative sum of the distances ridden by each passenger.
Unlinked Passenger Trips: The number of passengers who board public transportation vehicles. Passengers arecounted each time they board vehicles no matter how many vehicles they use to travelfrom their origin to their destination.
Source: National Transit Database
32
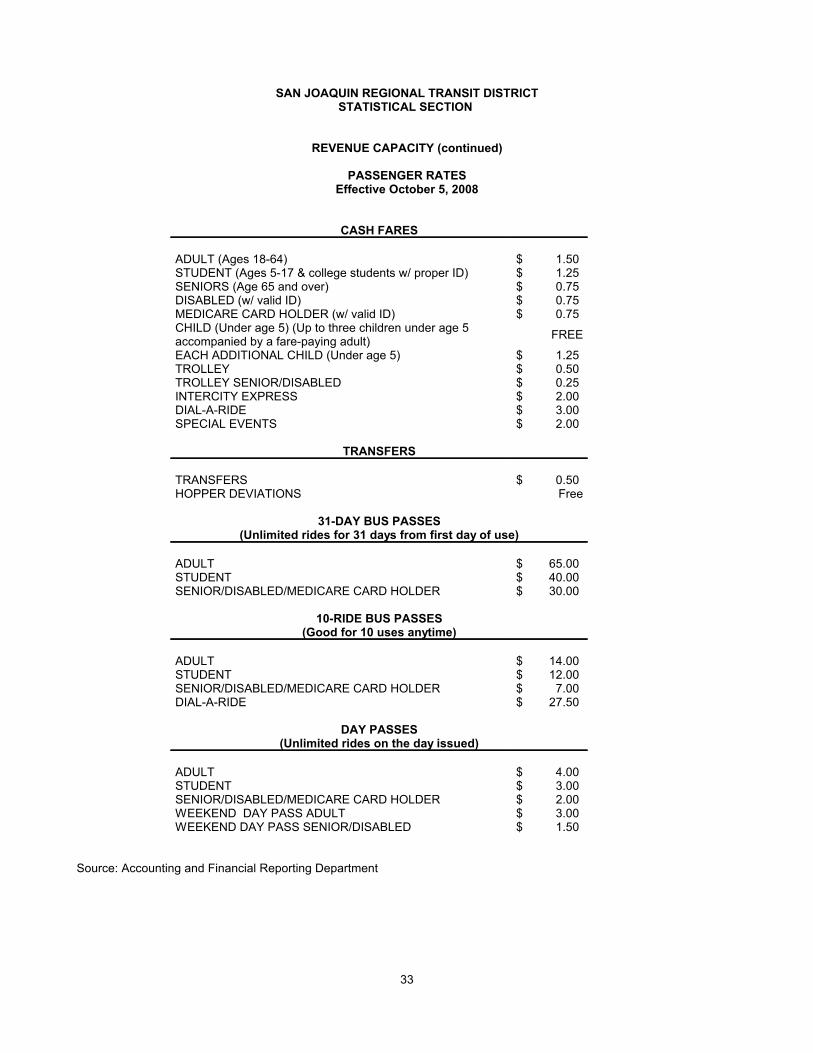
SAN JOAQUIN REGIONAL TRANSIT DISTRICTSTATISTICAL SECTION
REVENUE CAPACITY (continued)
PASSENGER RATESEffective October 5, 2008
CASH FARES
ADULT (Ages 18-64) $ 1.50STUDENT (Ages 5-17 & college students w/ proper ID) $ 1.25SENIORS (Age 65 and over) $ 0.75DISABLED (w/ valid ID) $ 0.75MEDICARE CARD HOLDER (w/ valid ID) $ 0.75CHILD (Under age 5) (Up to three children under age 5accompanied by a fare-paying adult)
FREE
EACH ADDITIONAL CHILD (Under age 5) $ 1.25TROLLEY $ 0.50TROLLEY SENIOR/DISABLED $ 0.25INTERCITY EXPRESS $ 2.00DIAL-A-RIDE $ 3.00SPECIAL EVENTS $ 2.00
TRANSFERS
TRANSFERS $ 0.50HOPPER DEVIATIONS Free
31-DAY BUS PASSES(Unlimited rides for 31 days from first day of use)
ADULT $ 65.00STUDENT $ 40.00SENIOR/DISABLED/MEDICARE CARD HOLDER $ 30.00
10-RIDE BUS PASSES(Good for 10 uses anytime)
ADULT $ 14.00STUDENT $ 12.00SENIOR/DISABLED/MEDICARE CARD HOLDER $ 7.00DIAL-A-RIDE $ 27.50
DAY PASSES(Unlimited rides on the day issued)
ADULT $ 4.00STUDENT $ 3.00SENIOR/DISABLED/MEDICARE CARD HOLDER $ 2.00WEEKEND DAY PASS ADULT $ 3.00WEEKEND DAY PASS SENIOR/DISABLED $ 1.50
Source: Accounting and Financial Reporting Department
33
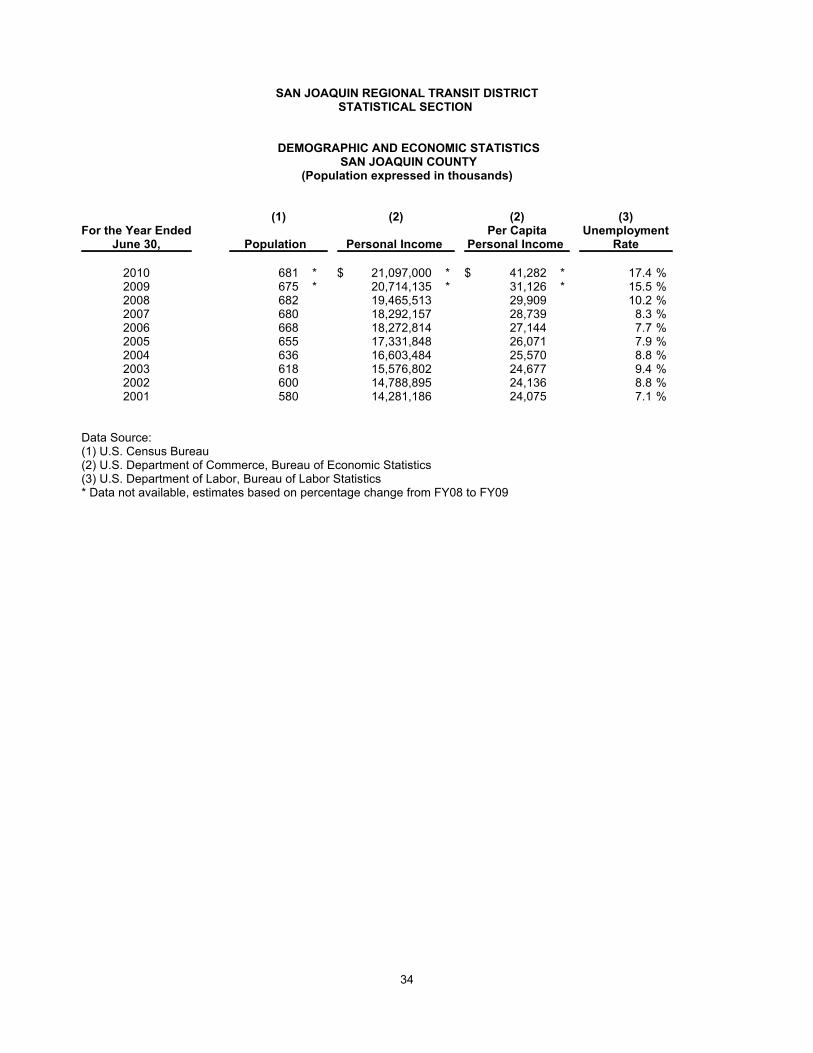
SAN JOAQUIN REGIONAL TRANSIT DISTRICTSTATISTICAL SECTION
DEMOGRAPHIC AND ECONOMIC STATISTICS SAN JOAQUIN COUNTY
(Population expressed in thousands)
(1) (2) (2) (3)For the Year Ended
June 30, Population Personal Income Per Capita
Personal Income Unemployment
Rate
2010 681 * $ 21,097,000 * $ 41,282 * 17.4 %2009 675 * 20,714,135 * 31,126 * 15.5 %2008 682 19,465,513 29,909 10.2 %2007 680 18,292,157 28,739 8.3 %2006 668 18,272,814 27,144 7.7 %2005 655 17,331,848 26,071 7.9 %2004 636 16,603,484 25,570 8.8 %2003 618 15,576,802 24,677 9.4 %2002 600 14,788,895 24,136 8.8 %2001 580 14,281,186 24,075 7.1 %
Data Source:(1) U.S. Census Bureau(2) U.S. Department of Commerce, Bureau of Economic Statistics(3) U.S. Department of Labor, Bureau of Labor Statistics* Data not available, estimates based on percentage change from FY08 to FY09
34
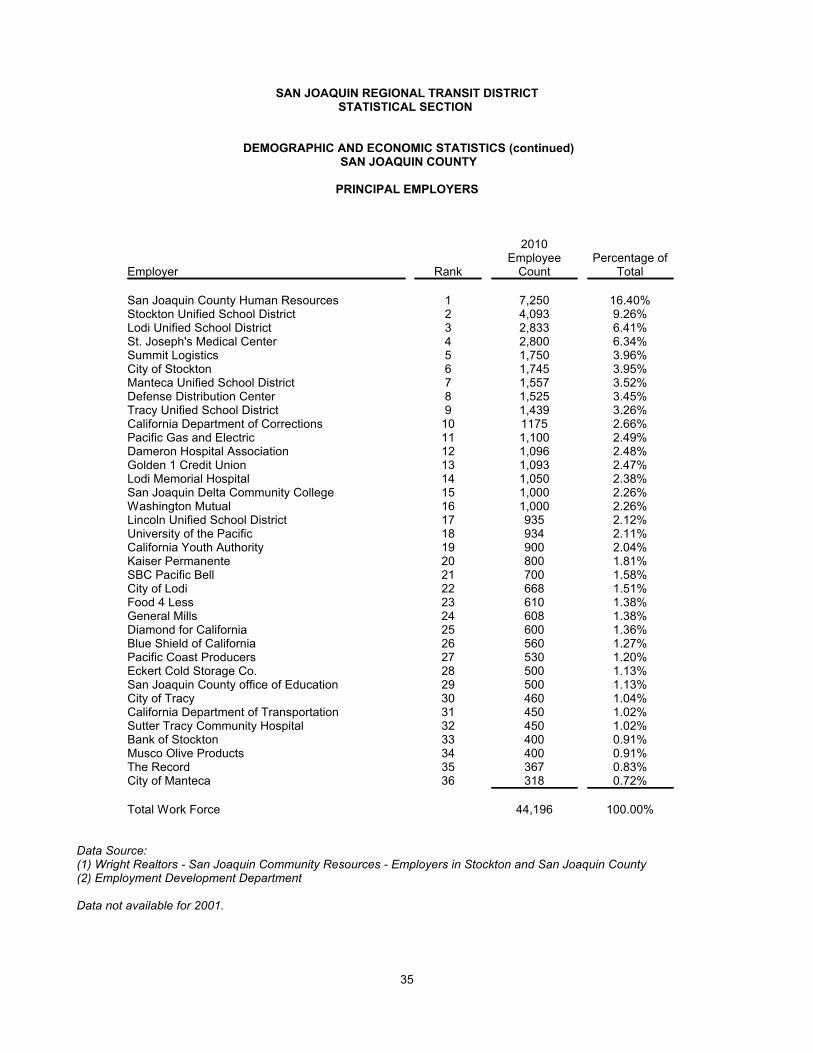
SAN JOAQUIN REGIONAL TRANSIT DISTRICTSTATISTICAL SECTION
DEMOGRAPHIC AND ECONOMIC STATISTICS (continued) SAN JOAQUIN COUNTY
PRINCIPAL EMPLOYERS
Employer Rank
2010Employee
CountPercentage of
Total
San Joaquin County Human Resources 1 7,250 16.40%Stockton Unified School District 2 4,093 9.26%Lodi Unified School District 3 2,833 6.41%St. Joseph's Medical Center 4 2,800 6.34%Summit Logistics 5 1,750 3.96%City of Stockton 6 1,745 3.95%Manteca Unified School District 7 1,557 3.52%Defense Distribution Center 8 1,525 3.45%Tracy Unified School District 9 1,439 3.26%California Department of Corrections 10 1175 2.66%Pacific Gas and Electric 11 1,100 2.49%Dameron Hospital Association 12 1,096 2.48%Golden 1 Credit Union 13 1,093 2.47%Lodi Memorial Hospital 14 1,050 2.38%San Joaquin Delta Community College 15 1,000 2.26%Washington Mutual 16 1,000 2.26%Lincoln Unified School District 17 935 2.12%University of the Pacific 18 934 2.11%California Youth Authority 19 900 2.04%Kaiser Permanente 20 800 1.81%SBC Pacific Bell 21 700 1.58%City of Lodi 22 668 1.51%Food 4 Less 23 610 1.38%General Mills 24 608 1.38%Diamond for California 25 600 1.36%Blue Shield of California 26 560 1.27%Pacific Coast Producers 27 530 1.20%Eckert Cold Storage Co. 28 500 1.13%San Joaquin County office of Education 29 500 1.13%City of Tracy 30 460 1.04%California Department of Transportation 31 450 1.02%Sutter Tracy Community Hospital 32 450 1.02%Bank of Stockton 33 400 0.91%Musco Olive Products 34 400 0.91%The Record 35 367 0.83%City of Manteca 36 318 0.72%
Total Work Force 44,196 100.00%
Data Source: (1) Wright Realtors - San Joaquin Community Resources - Employers in Stockton and San Joaquin County(2) Employment Development Department
Data not available for 2001.
35
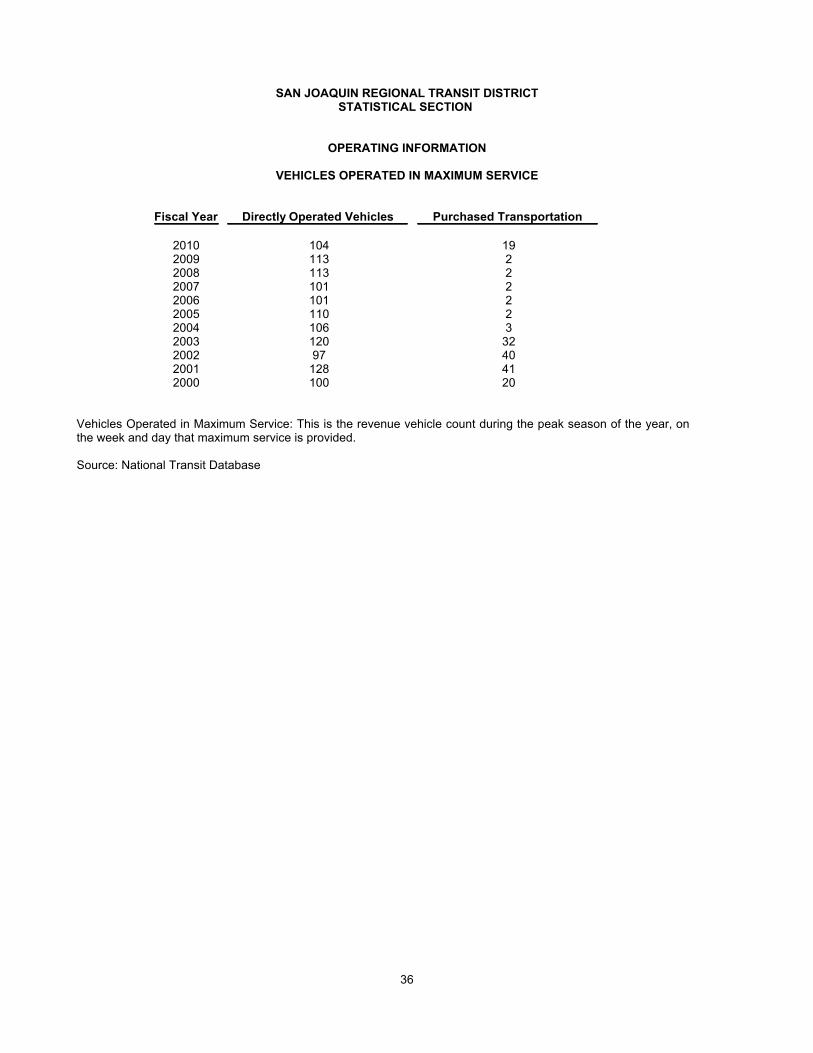
SAN JOAQUIN REGIONAL TRANSIT DISTRICTSTATISTICAL SECTION
OPERATING INFORMATION
VEHICLES OPERATED IN MAXIMUM SERVICE
Fiscal Year Directly Operated Vehicles Purchased Transportation
2010 104 192009 113 22008 113 22007 101 22006 101 22005 110 22004 106 32003 120 322002 97 402001 128 412000 100 20
Vehicles Operated in Maximum Service: This is the revenue vehicle count during the peak season of the year, onthe week and day that maximum service is provided.
Source: National Transit Database
36
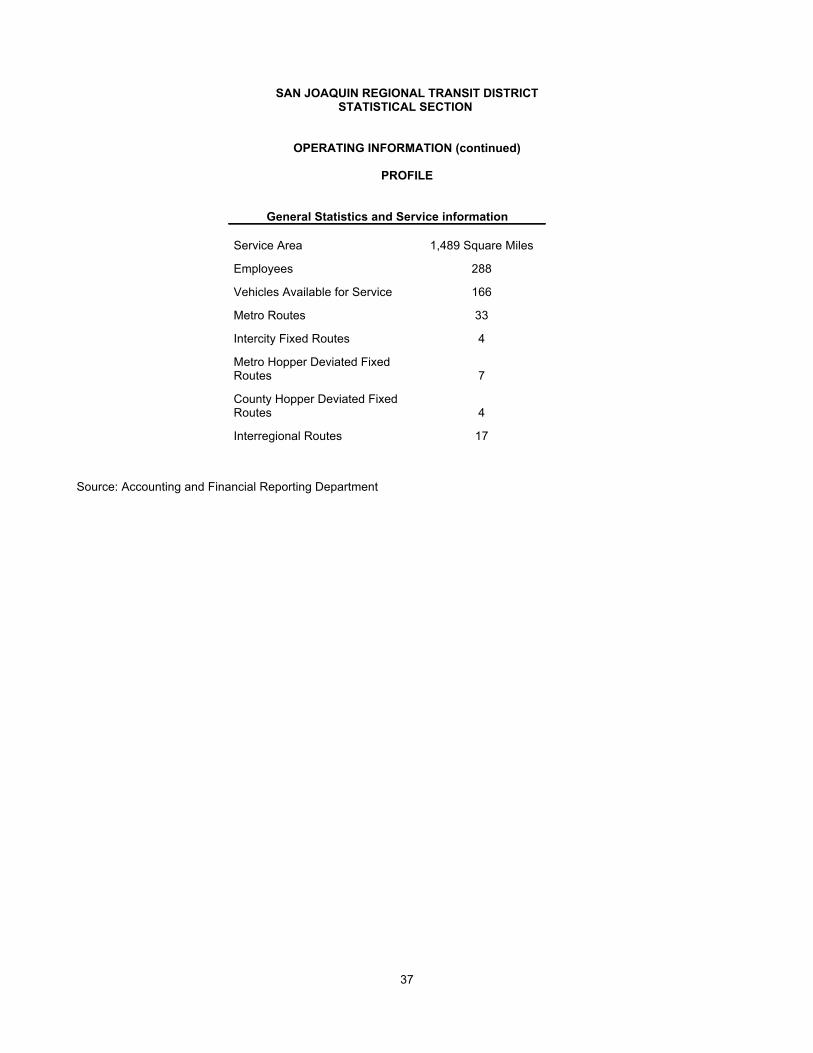
SAN JOAQUIN REGIONAL TRANSIT DISTRICTSTATISTICAL SECTION
OPERATING INFORMATION (continued)
PROFILE
General Statistics and Service information
Service Area 1,489 Square Miles
Employees 288
Vehicles Available for Service 166
Metro Routes 33
Intercity Fixed Routes 4
Metro Hopper Deviated FixedRoutes 7
County Hopper Deviated FixedRoutes 4
Interregional Routes 17
Source: Accounting and Financial Reporting Department
37
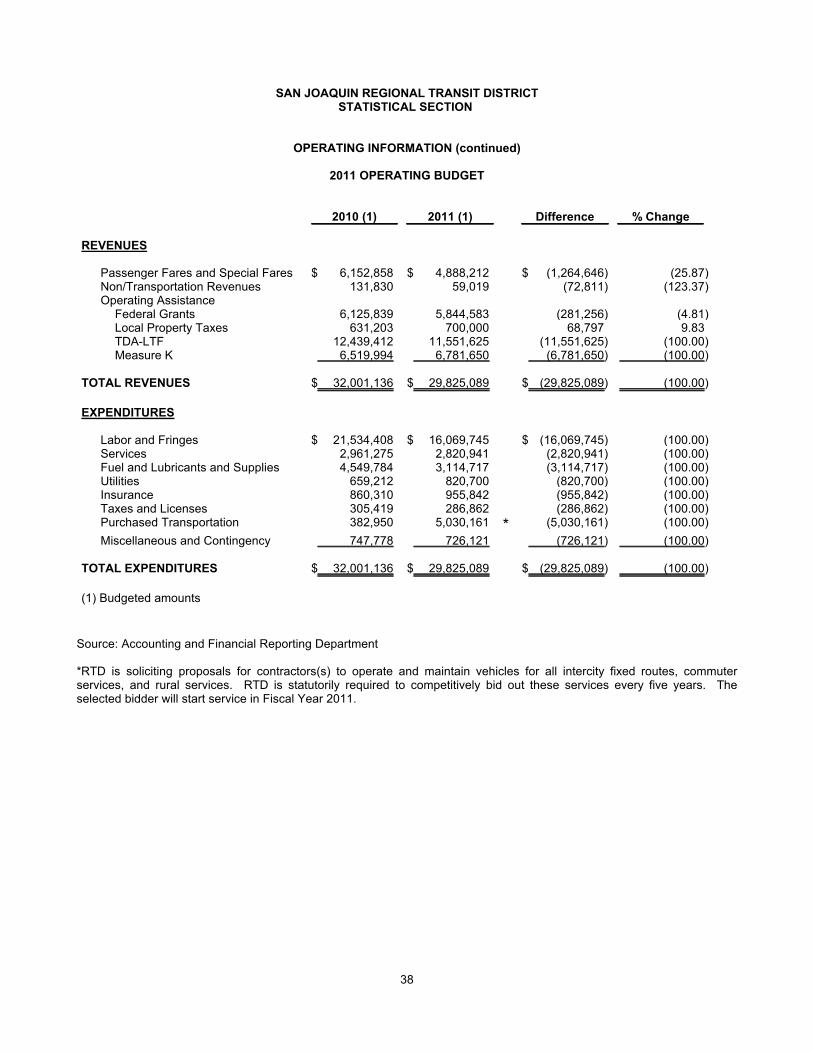
SAN JOAQUIN REGIONAL TRANSIT DISTRICTSTATISTICAL SECTION
OPERATING INFORMATION (continued)
2011 OPERATING BUDGET
2010 (1) 2011 (1) Difference % Change
REVENUES
Passenger Fares and Special Fares $ 6,152,858 $ 4,888,212 $ (1,264,646) (25.87)Non/Transportation Revenues 131,830 59,019 (72,811) (123.37)Operating Assistance
Federal Grants 6,125,839 5,844,583 (281,256) (4.81)Local Property Taxes 631,203 700,000 68,797 9.83TDA-LTF 12,439,412 11,551,625 (11,551,625) (100.00)Measure K 6,519,994 6,781,650 (6,781,650) (100.00)
TOTAL REVENUES $ 32,001,136 $ 29,825,089 $ (29,825,089) (100.00)
EXPENDITURES
Labor and Fringes $ 21,534,408 $ 16,069,745 $ (16,069,745) (100.00)Services 2,961,275 2,820,941 (2,820,941) (100.00)Fuel and Lubricants and Supplies 4,549,784 3,114,717 (3,114,717) (100.00)Utilities 659,212 820,700 (820,700) (100.00)Insurance 860,310 955,842 (955,842) (100.00)Taxes and Licenses 305,419 286,862 (286,862) (100.00)Purchased Transportation 382,950 5,030,161 * (5,030,161) (100.00)
Miscellaneous and Contingency 747,778 726,121 (726,121) (100.00)
TOTAL EXPENDITURES $ 32,001,136 $ 29,825,089 $ (29,825,089) (100.00)
(1) Budgeted amounts
Source: Accounting and Financial Reporting Department
*RTD is soliciting proposals for contractors(s) to operate and maintain vehicles for all intercity fixed routes, commuterservices, and rural services. RTD is statutorily required to competitively bid out these services every five years. Theselected bidder will start service in Fiscal Year 2011.
38
SAN JOAQUIN REGIONAL TRANSIT DISTRICTSTATISTICAL SECTION
OPERATING INFORMATION (continued)
FUNDING SOURCES
The following section provides a description of each of the major funding resources used by RTD and their available uses.
Fare Revenue
RTD collects fares from passengers to ride the bus. The current fare schedule is available on page 33.
FTA Section 5307
The FTA defines the Section 5307 program as the following:
The program (49 U.S.C. 5307) makes Federal resources available to urbanized areas and to Governors for transitcapital and operating assistance in urbanized areas and for transportation related planning. An urbanized area isan incorporated area with a population of 50,000 or more that is designated as such by the U.S. Department ofCommerce, Bureau of the Census.
Eligible purposes include planning, engineering design and evaluation of transit projects and other technicaltransportation-related studies. Also include capital investment in bus and bus-related activities such asreplacement of buses, overhaul of buses, rebuilding of buses, crime prevention and security equipment andconstruction of maintenance and passenger facilities and capital investments in new and existing fixed guidewaysystems including rolling stock, overhaul and rebuilding of vehicles, track, signals, communications, and computerhardware and software. All preventive maintenance and some Americans with Disabilities Act complimentaryparatransit service costs considered capital costs.
For urbanized areas with 20,000 populations and over, funds are apportioned and flow directly to a designatedrecipient selected locally to apply for and receive federal funds. For urbanized areas, fewer than 200,000 inpopulations have been designated as transportation management areas and receive apportionments directly.
For urbanized areas with populations of 200,000 or more, operating assistance is not an eligible expense. In theseareas, at least one percent of the funding apportioned to each area must be use for transit enhancement activitiessuch as historic preservation, landscaping, public art, pedestrian access, bicycle access, and enhanced access forpersons with disabilities.
The FTA distributes Section 5307 funds annually based on formula using population, density and operating statistics. RTDuses Section 5307 funding apportionments for both capital and preventive maintenance of the fleet. Transit related capitalprojects are eligible and may include multi-jurisdictional cooperation. The availability of funds for capital use is subject tolocal prioritization and project selection at the regional level through the San Joaquin Council of Governments. RTD uses aminimum of 1% of apportioned 5307 funds for security projects.
39
SAN JOAQUIN REGIONAL TRANSIT DISTRICTSTATISTICAL SECTION
OPERATING INFORMATION (continued)
FUNDING SOURCES (continued)
FTA Section 5307 ARRA
The FTA defines the Section 5307 program as the following:
This program (49 U.S.C. 5307) makes Federal resources available to urbanized areas and to Governors for transitcapital and operating assistance in urbanized areas and for transportation related planning. An urbanized area isan incorporated area with a population of 50,000 or more that is designated as such by the U.S. Department ofCommerce, Bureau of the Census.
Eligible purposes include planning, engineering design and evaluation of transit projects and other technicaltransportation-related studies; capital investments in bus and bus-related activities such as replacement of buses,overhaul of buses, rebuilding of buses, crime prevention and security equipment and construction of maintenanceand passenger facilities; and capital investments in new and existing fixed guideway systems including rollingstock, overhaul and rebuilding of vehicles, track, signals, communications, and computer hardware and software.All preventive maintenance and some Americans with Disabilities Act complementary paratransit service costs areconsidered capital costs, and 10 percent of the allocation may be used for operating.
For urbanized areas with 200,000 population and over, funds are apportioned and flow directly to a designatedrecipient selected locally to apply for and receive Federal funds. For urbanized areas under 200,000 in population,the funds are apportioned to the Governor of each state for distribution. A few areas under 200,000 in populationhave been designated as transportation management areas and receive apportionments directly.
For urbanized areas with populations of 200,000 or more, operating assistance is not an eligible expense. In theseareas, at least one percent of the funding apportioned to each area must be used for transit enhancement activitiessuch as historic preservation, landscaping, public art, pedestrian access, bicycle access, and enhanced access forpersons with disabilities.
The FTA distributes Section 5307 funds annually based on a formula using population, density, and operating statistics.RTD uses Section 5307 funding apportionments for both capital and preventive maintenance of the fleet. Transit relatedcapital projects are eligible and may include multi-jurisdictional cooperation. The availability of funds for capital use issubject to local prioritization and project selection at the regional level through the San Joaquin Council of Governments.RTD uses a minimum of 1% of apportioned 5307 funds for security projects.
FTA Section 5308
The FTA defines the Section 5308 program as the following:
Section 3010 of the Safe, Accountable, Flexible, Efficient Transportation Equity Act: A Legacy for Users(SAFETEA-LU), Pub. L. No. 109-59, 119 Stat. 1144, 1572 (2005), amended section 5308 of title 49 United statescode, commonly referred to as Clean Fuels Grant Program, from a formula-based to a discretionary grant program.
The program has a two-fold purpose. First, the program was developed to assist the non-attainment andmaintenance areas in achieving or maintaining the National Ambient Air Quality Standards for ozone and carbonmonoxide (CO). Second, the program supports emerging clean fuel and advanced propulsion technologies fortransit buses and markets for those technologies.
The FTA distributes Section 5308 funds annually based on a competitive grant application. RTD anticipates pursuingSection 5308 funding for capital fleet replacement.
40
SAN JOAQUIN REGIONAL TRANSIT DISTRICTSTATISTICAL SECTION
OPERATING INFORMATION (continued)
FUNDING SOURCES (continued)
FTA Section 5309
Section 5309 is discretionary capital funding that provides capital assistance for transit projects. The FTA distributesSection 5309 funds annually based on a competitive application. Projects selected are eligible for 80 percent federalparticipation and 20 percent local match.
The FTA defines the Section 5309 program as the following:
The Transit Capital Investment Program (49 U.S.C. 5309) provides capital assistance for three primary activities:
Replace buses and Facilities.
Modernization existing rail systems.
Fixed guideway systems (New Starts).
Eligible recipients for capital investment funds are public bodies and agencies (transit authorities and other stateand local public bodies and agencies thereof) including states, municipalities, other political subdivisions of states;public agencies and instrumentalities of one or more states; and certain public corporations, boards, andcommissions established under state law. Funds allocated on a discretionary basis.
The Bus and bus facilities program provides capital assistance for new and replacement buses and relatedequipment and facilities.
Eligible capital projects include the purchasing of buses for fleet and service expansion. Bus maintenance andadministrative facilities, transfer facilities, bus malls, transportation centers, intermodal terminals, park-and-ridestations, acquisition of replacement vehicles, bus rebuilds, bus preventive maintenance, passenger amenities suchas passenger shelters and bus stop signs, accessory and miscellaneous equipment such as mobile radio units,supervisory vehicles, fare boxes, computers and shop and garage equipment are also included.
Private companies engaged in public transportation and private non-profit organizations are eligible sub recipientsof FTA grants. Private operators may now receive FTA funds as a pass through without competition if they areincluded in a program of projects submitted by the designated public authority acting as the direct recipient of agrant.
A subsection of the Section 5309 funding is dedicated to the Small Starts, and Very Small Starts discretionary fund. Thisresource is applied for through the grant application process. Federal funding is awarded for capital projects that provideminimal service expansion for large scale transit operations. RTD has applied Very Small Starts funding toward theexpansion of its Bus Rapid Transit system.
41
SAN JOAQUIN REGIONAL TRANSIT DISTRICTSTATISTICAL SECTION
OPERATING INFORMATION (continued)
FUNDING SOURCES (continued)
FTA Section 5311
The FTA defines the Section 5311 program as the following:
This program (49 U.S.C. 5311) provides formula funding to states for the purposes of supporting publictransportation in areas of less than 50,000 populations. Eighty percent of the statutory formula based on thenonurbanized population of the states. Twenty percent of the formula based on the land area. No state mayreceive more than 5 percent of the amount apportioned for land area. In addition, FTA increase amountsapportioned based on nonurbanized population according to the growing States factors of 49 U.S.C. 5340 to theamounts apportioned to the states under the Section 5311 program.
Funds may be used for capital, operating, and administrative assistance to state agencies, local public bodies,Indian tribes, and nonprofit organizations, and operators of public transportation services. The state must use 15percent of its annual apportionment to support intercity bus service, unless the Governor certifies, afterconsultation with affected intercity bus providers that these needs of the state are adequately met. Projects tomeet the requirements of the Americans with Disabilities Act, the Clean Air Act, or bicycle access projects, may befunded at 90 percent Federal match. The maximum FTA share for operating assistance is 50 percent of the netoperating costs.
Section 5311 grants provide funding for public transportation services in rural areas. RTD receives Section 5311 funding tosupport Hopper and Intercity operations in the rural portion of San Joaquin County. Section 5311 funding is apportioned bythe State based on population of the rural area of the County.
FTA Section 5311 ARRA
The FTA defines the Section 5311 program as the following:
This program (49 U.S.C. 5311) provides formula funding to states for the purpose of supporting publictransportation in areas of less than 50,000 populations. Eighty percent of the statutory formula is based on thenonurbanized population of the States. Twenty percent of the formula is based on land area. No State mayreceive more than 5 percent of the amount apportioned for land area. In addition, FTA adds amounts apportionedbased on nonurbanized population according to the growing States formula factors of 49 U.S.C. 5340 to theamounts apportioned to the States under the Section 5311 program.
Funds may be used for capital, up to 10 percent of the allocation can be used for operating, and administrativeassistance to state agencies, local public bodies, Indian tribes, and nonprofit organizations, and operators of publictransportation services. Projects may be funded at 100 percent Federal match.
Section 5311 grants provide funding for public transportation services in rural areas. RTD receives Section 5311 funding tosupport Hopper and Intercity operations in the rural portion of San Joaquin County. Section 5311 funding is apportioned bythe State based on population of the rural area of the County.
FTA Section 5316
The FTA defines the Section 5316 Job Access and Reverse Commute program (JARC) as the following:
The goal of the Job Access and Reverse Commute program is to improve access to transportation services toemployment and employment related activities for welfare recipients and eligible low-income individuals and totransport residents of urbanized areas and nonurbanized areas to suburban employment opportunities. Towardthis goal, the Federal Transit Administration provides financial assistance for transportation services planned,designed, and carried out to meet the transportation needs of eligible low-income individuals, and of reversecommuters regardless of income. The program requires coordination of Federally-assisted programs and servicesin order to make the most efficient use of Federal resources.
The FTA distributes Section 5316 funds annually based on a competitive grant application. RTD uses Section 5316 fundingfor operating assistance and mobility management activities to support the goals of the program.
42
SAN JOAQUIN REGIONAL TRANSIT DISTRICTSTATISTICAL SECTION
OPERATING INFORMATION (continued)
FUNDING SOURCES (continued)
FTA Section 5317
The FTA defines the Section 5317 New Freedom program as the following:
The New Freedom formula grant program aims to provide additional tools to overcome existing barriers facingAmericans with disabilities seeking integration into the work force and full participation in society. Lack ofadequate transportation is a primary barrier to work for individuals with disabilities. The 2000 Census showed thatonly 60 percent of people between the ages of 16 and 64 with disabilities are employed. The New Freedomformula grant program seeks to reduce barriers to transportation services and expand the transportation mobilityoptions available to people with disabilities beyond the requirements of the Americans with Disabilities Act (ADA)of 1990.
The FTA distributes Section 5317 funds annually based on a competitive grant application. RTD uses Section 5317 fundingfor operating assistance and mobility management activities to support the goals of the program.
Transportation Development Act (TDA)
The TDA is a dedicated funding source available to public transit, and it is the primary source of RTD operating revenues.The TDA provides two sources of funding for public transportation, the Local Transportation Fund (LTF) and the StateTransit Assistance (STA) funding. The LTF and STA receive revenues through gasoline and sales taxes within the County,however these funds are available to the State in times of fiscal crisis, and are not as reliable in a declining economy.
The LTF is funded from one quarter of one cent of the six cents in state sales tax collected per dollar of retail receipts. Theallocated portion for LTF is returned to each county based on the amount of tax dollars collected in that County. The Statedistributes the LTF to available jurisdictions (incorporated cities and the County) based on population. RTD currentlyreceives the full apportionment of LTF from the City of Stockton and Lathrop for SMA operations. RTD also receives 75% ofCounty LTF for operations of the Hopper, Intercity, and Dial-A-Ride services.
The STA is funded from the statewide sales tax on motor vehicle fuels. The State allocates these funds based on acomplex population and operations formula for each County. The formula allocates 50% of the funds according topopulation and the remaining to transit operator revenues. RTD uses these funds to balance the annual budget, as STArevenues are eligible for all operating categories.
Local Property Tax
RTD receives property tax revenues for properties within the County in accordance with the Revenue and Taxation Code,Section 97. RTD anticipates that property tax revenues will significantly decline due to declining property values associatedwith declining economy within San Joaquin County. RTD anticipates that the federal oversight of the mortgage industry willresult in a minimal regulated growth over the next four years.
Measure K
Measure K is a local San Joaquin County transportation sales tax initiative, passed by voters in November 1990, estimatedto generate approximately $400 million (1990 dollars) for transportation based projects through FY10. Measure Kapportioned approximately $54 million to improvements in countywide transit service. Measure K is used for a variety ofprojects, including SMA frequency improvements, BRT operations, Interregional Commuter Services operations, Intercityoperations, General Public Dial-A-Ride operations, leasing Park-and-Ride lots, and construction of facilities including theDowntown Transit Center, passenger shelters, and bicycle facilities. Measure K revenues are projected to grow at anannual rate of 4.5% through FY10.
RTD currently maintains cooperative agreements with SJCOG for Measure K funds for the previously identified services.These cooperative agreements will expire in FY11. RTD anticipates maintaining and expanding these agreements as aresult of the voter initiated reauthorization of Measure K through 2040.
43
SAN JOAQUIN REGIONAL TRANSIT DISTRICTSTATISTICAL SECTION
OPERATING INFORMATION (continued)
FUNDING SOURCES (continued)
Congestion Mitigation and Air Quality (CMAQ)
The State apportions Federal CMAQ funding for projects that will contribute to meeting the attainment of national ambientair quality standards for ozone and/or carbon monoxide in Clean Air Act non-attainment areas. The San Joaquin Council ofGovernments (SJCOG) is responsible to select and prioritize projects for funding, in consultation with the State for thisprogram. RTD uses CMAQ funds for capital and operating projects that support the program goals including the purchaseof vehicles that have fewer emissions. RTD anticipates using additional CMAQ funds for bus replacement as they becomeavailable.
State Transportation Improvement Program (STIP)-Transportation Enhancement (TE)
The State Transportation Improvement Program (STIP) is a multi-year capital improvement program of transportationprojects on and off the State Highway System, funded with revenues from the State Highway Account and other fundingsources. STIP programming generally occurs every two years. The programming cycle begins with the release of aproposed fund estimate in July of odd-numbered years, followed by California Transportation Commission (CTC) adoptionof the fund estimate in August (odd years). The fund estimate serves to identify the amount of new funds available for theprogramming of transportation projects. After adopting the fund estimate, Caltrans and the regional planning agenciesprepare transportation improvement plans for submittal by December 15 (odd years). Caltrans prepare the InterregionalImprovement Plan (IIP) and regional agencies prepare Regional Improvement Plans (RIP)). Public hearings are held inJanuary (even years) in both northern and southern California. The STIP adopted by the CTC by April (even years).Transportation Enhancement (TE) projects are subset of the STIP and are programmed as regional project enhancementsfor roadway segments including improved pedestrian facilities and aesthetic improvements.
Proposition 1B
In November 2006, California voters approved the Highway Safety, Traffic Reduction, Air Quality, and Port Security BondAct of 2006 to authorize $19.925 billion of state general obligation bonds for specified purposes. RTD receives funding forcapital projects under two of these categories: The Public Transportation Modernization, Improvement, and ServiceEnhancement Account (PTMISEA) and the Transit System Safety, Security, and Disaster Response Account (TSSSDRA).
Bus and Shelter Advertising
RTD currently contracts out all of the sales of advertising space on RTD’s fleet and facilities. RTD staff will also pursue in-kind partnerships for advertising with applicable partners.
Other
RTD is pursuing optional funding sources that would assist with operating or capital improvements. RTD will continue topursue Public/Private Partnership (PPP) and sponsorships for specific operations assistance. Examples of this includemaintaining agreements with school districts, secondary education districts, and local governments to develop agreementsfor service and purchase of discounted monthly passes for retail sale to the public. RTD anticipates expanding PPPopportunities to fully fund specific public transportation support services in downtown Stockton.
RTD receives rental funds from the commercial portion of the DTC. Currently occupied by a café, RTD’s commercial spacetakes advantage of mixed-use development design by providing a retail location. Revenues associated with the rentalspace are use for support administrative operations.
Source: Grants Department
44