2017 comprehensive annual financial report (cafr
TRANSCRIPT
City of Franklin, Wisconsin Management's Discussion and Analysis
(Unaudited)
As management of the City of Franklin (City), the following offers readers of the City's financial statements an overview and analysis of the financial activities of the City for the fiscal year ended December 31, 2017. Readers are encouraged to consider this information in conjunction with additional information contained in the letter of transmittal, which can be found on pages 1-5 of this report.
Financial Highlights
• The assets of the City exceeded its liabilities as of December 31 , 2017, by $248,574,088 (net position). Of this amount, $15,637,898 (unrestricted net position) may be used to meet the government's ongoing obligations to citizens and creditors.
• The City's total net position increased by a net amount of $1 ,977,323 (excluding the prior period adjustment for the OPES Net Position). Net investment in capital assets increased by $3,512,441 , while unrestricted net position decreased by $2,754,566 and restricted net position decreased by $1, 122,820. The increase in investment in capital assets was related to capital asset additions offset by debt payments, net of unspent bond proceeds and accumulated depreciation. The largest net asset addition was a jurisdictional transfer to the City of W St. Martin's Road from Milwaukee County. The unrestricted decrease was the result of the GASB 75 related to OPEB Net Obligations.
• The City's governmental funds reported, as of December 31, 2017, combined ending fund balances of $23,438,415, an increase of $401,952 from the prior year. The primary reasons were the collection of Advances from the Sewer Fund used partially to make a $605,000 extraordinary payment to the Public Works Pension plan and the proceeds of a $1 .63 million note issuance.
• The Nonspendable fund balances are $247,198, a decrease of $2,049,034 due to the collection of the Sewer Fund Advance.
• The restricted fund balances in total are $10,322,090, an increase of $591,794, which resulted from the new Tourism Commission fund collection of hotel taxes totaling $211,793 and net collections in the Development and Utility Development funds.
• The assigned fund balances in total of $6,897, 179 has an increase of $1, 151,028 related to the sale of $1 .63 million in new notes.
• The unassigned fund balance as of December 31, 2017 for the General Fund was $6,190,398. This represents approximately 23.8 percent of total anticipated 2018 General Fund expenditures. The unassigned fund balance increased by $708, 164 was the result the collection of the $2.2 Sewer advance net of the $1 .1 million deficit in 2017.
• The City's Governmental activities debt decreased a net $1.4 million from scheduled repayments. See table 11 for complete debt activity details. A new $1.63 million note was issued in December, 2017 for the 2018 Capital Improvement program to preserve levy increases under the State Levy Limits.
• The City's Business type activities generated a $2.15 million loss, most of which is depreciation on contributed assets and the Ryan Creek Sanitary Interceptor sewer.
Overview of the Financial Statements
This discussion and analysis are intended to serve as an introduction to the City's basic financial statements. These basic financial statements are comprised of three components 1) government-wide financial statements, 2) fund financial statements, and 3) notes to the financial statements. This report
Page 12

also contains other supplementary information in addition to the basic financial statements themselves.
Government-wide financial statements
The government-wide financial statements are designed to provide readers with a broad overview of the City's finances, in a manner similar to a private-sector business. The statement of net position presents information on all of the City's assets, deferred outflows, liabilities and deferred inflows, with the difference between the categories reported as net position. Over time, increases or decreases in net position may serve as a useful indicator of whether the financial position of the City is improving or deteriorating. Table 1 provides a ten year history of Net Position.
The statement of activities presents information showing how the government's net position changed during the most recent fiscal year. All changes in net position are reported as soon as the underlying event giving rise to the change occurs, regardless of the timing of related cash flows. Thus, revenue and expenditures are reported in this statement for some items that will result in cash flows in future fiscal periods (e.g., uncollected taxes and earned but unused vacation and sick leave). Table 2 provides a ten year history of the statement of activities.
The government-wide financial statements distinguish functions of the City that are principally supported by taxes and intergovernmental revenue (governmental activities) from other functions that are intended to recover all or a significant portion of their costs through user fees and charges (business-like activities). The governmental activities of the City include general government, public safety, public works, health & human services, culture & recreation and conservation & development. The business-type activities include the Franklin Water Utility and the Sanitary Sewer fund.
The government-wide financial statements include not only the City itself (known as the primary government) but also a legally separate Community Development Authority for which the City is financially accountable. Financial information for this blended component unit is reported as part of the financial information presented for the primary government itself.
The government-wide financial statements can be found on Exhibits A and B of this report.
Fund financial statements
A fund is a grouping of related accounts that is used to maintain control over resources that have been segregated for specific activities or objectives. The City, like other state and local governments, uses fund accounting to ensure and demonstrate compliance with finance-related legal requirements. All of the funds of the City can be divided into three categories: governmental funds, proprietary funds and fiduciary funds.
Governmental funds
Governmental funds are used to account for essentially the same functions reported as governmental activities in the government-wide financial statements. However, unlike government-wide financial statements, governmental fund financial statements focus on near term inflows and outflows of spendable resources, as well as on balances of spendable resources available at the end of the fiscal year. Such information may be useful in evaluating a government's near-term financing requirements.
Because the focus of governmental funds is narrower than that of the government-wide financial statements, it is useful to compare the information presented for governmental funds with similar information presented for governmental activities in the government-wide financial statements. By doing so, readers may better understand the long-term impact of the government's near-term financing decisions. Both the governmental fund balance sheet and the governmental fund statement
Page 13

of revenue, expenditures and changes in fund balances provide a reconciliation to facilitate this comparison between governmental funds and governmental activities.
The City maintains 17 individual governmental funds. Information is presented separately in the governmental fund balance sheet and in the governmental fund statement of revenue, expenditures, and changes in fund balances for the General, Debt Service and TIF Districts Funds, that are all considered to be major funds. Data from the remaining 14 governmental funds are combined into a single, aggregated presentation. Individual fund data for each of these nonmajor governmental funds is provided in the form of combining statements later in this report.
The basic governmental fund financial statements can be found on Exhibits C, D, E and F of this report. These statements include a budgetary comparison of the General Fund.
The City adopts an annual appropriated budget for its General Fund, Debt Service Fund, TIF District, Library Operating Fund, Library Auxiliary Fund, Solid Waste Fund, Donations, Grant, Civic Celebrations, St Martin's Fair, Capital Outlay Fund, Equipment Replacement Fund, Street Improvement Fund, Capital Improvement Fund, Development Fund, Utility Development Fund, Sanitary Sewer Fund and the Franklin Water Utility. A budgetary comparison statement has been provided for all governmental funds demonstrating compliance with their budgets.
Proprietary funds
Proprietary funds are used to report the functions presented as business-type activities in the government-wide financial statements. Proprietary funds provide the same type of information as the government-wide financial statements, only in more detail. The proprietary fund financial statements provide separate information for the Franklin Water Utility, the Sanitary Sewer Fund and the Internal Service Fund.
The proprietary fund financial statements can be found on Exhibits G, H & I of this report.
Fiduciary funds
Fiduciary funds are used to account for resources held for the benefit of parties outside the government. Fiduciary funds are not reflected in the government-wide financial statement because the resources of those funds are not available to support the City's programs. The fiduciary funds maintained by the City are the Property Tax Agency Fund, that records the tax roll and tax collections for the City and other taxing jurisdictions, a post-employment benefits trust to hold funds until needed to pay designated health benefits for eligible current and future retirees and other agency funds.
The basic fiduciary fund financial statements can be found on Exhibit J & K of this report.
Notes to the financial statements
The notes provide additional information that is essential to a full understanding of the data provided in the government-wide and fund financial statements. The notes to the financial statements are found on pages 40 - 88 of this report.
Other information
In addition to the basic financial statements, notes and accompanying notes, this report also presents certain required supplementary information concerning the City of Franklin's progress in funding its retiree health obligations to eligible full time employees and its participation in the Wisconsin
Page 14

Retirement System and City of Franklin Defined Benefit Pension Plans. Required supplementary information can be found on pages 89 - 94 of this report.
The combining and individual fund financial statements and schedules section presents combining statements in connection with non-major governmental funds, a detailed budgetary comparison schedule for the General Fund, Special Revenue, Capital Projects and TIF Funds to demonstrate compliance with the budget complementing the statement included in the basic governmental fund financial statements, and other information related to the individual funds are presented immediately following the required supplementary information. Schedules 1 to 12.2 can be found on pages 95 -118 of this report.
Government-wide Financial Analysis
As noted earlier, net position may serve over time as a useful indicator of a government's financial position. In the case of the City, assets exceeded liabilities by $248,574,088 and $248,939,033 at the end of 2017 and 2016, respectively.
CITY OF FRANKLIN NET POSITION December 31, 2017 and 2016
Governmental Business-type
Activities Activities Total 2017 2016 2017 2016 2017 2016
Current and
other assets $ 54,462,094 $ 53,076,382 $ 7,417,875 $ 6,730,520 $ 61,879,969 $ 59,806,902
Long term Note Rec 18,799,969 20,014,692 18,799,969 20,014,692
Capital assets 121,923,878 118,399,446 107,713,836 110,484,366 229,637,714 228,883,812
Total assets 176,385,972 171,475,828 133,931,680 137,229,578 310,317,652 308, 705,406
Deferred Outflows 7,287,434 8,455,769 833,543 356,959 8,120,977 8,812,728
Current liabilities 3,612,319 2,403,969 1,639,382 1,415,431 5,251,701 3,819,400
Long-term liabilities 15,369,145 14,689,207 22,098,478 22,899,975 37,467,623 37,589,182
Total liabilities 18,981,464 17,093,176 23,737,860 24,315,406 42,719,324 41,408,582
Deferred Inflows 27,074,967 27,060,233 70,250 110,286 27,145,217 27,170,519
Net position:
Net Investment in
capital assets 115,417,617 110,638, 152 86,584,568 88,115,672 201,846,895 198,334,454
Restricted 10,896,013 10,617,660 20,193,282 21,594,455 31,089,295 32,212,115
Unrestricted 11,303,345 14,522,376 4,179,263 3,450,718 15,637,898 18,392,464
Total net position $ 137,616,975 $ 135,778,188 $ 110,957,113 $ 113, 160,845 $ 248,574,088 $ 248,939,033
The net position section includes an adjustment for capital assets owned by the business-type activities, but financed by the debt of the governmental activities. Amounts will not cross-foot as a result. See Note 3-G.
The largest portion of the City's net position (approximately 88 and 87 percent, in 2017 and 2016, respectively) reflects its investment in capital assets (e.g., land, buildings, machinery, and equipment); less any related debt used to acquire those assets that is still outstanding. The City uses these capital assets to provide services to citizens; consequently, net position is not available for future spending.
Page 15
Although the City's investment in its capital assets is reported net of related debt, it should be noted that the resources needed to repay this debt must be provided from other sources, since capital assets themselves cannot be used to liquidate these liabilities.
Investment in capital assets accounted for $201 ,846,895 and $198,753,824 in 2017 and 2016, respectively of the year end net position. The inclusion n 2016, of the Ryan Creek Sanitary Interceptor Sewer ($22.5 million) is the major cause for the increase in net capital assets that year.
Major 2017 projects were the acceptance of W St. Martin's Road ($2.8 million jurisdictional transfer from Milwaukee County) , the completion of the S 27th Street reconstruction by the State and City enhanced elements, the replacement of a bridge on W St. Martin's Road, and the replacement of an ambulance.
Major 2016 projects were acceptance of S North Cape Road ($3 million jurisdictional transfer from Milwaukee County) , completion of Kayla's Playground (an all-inclusive, all-accessible playground), work on three trails ($369,000), a Public Safety dispatch console ($242,000) , a replacement roof ($76,000) on fire station #1 , and utility costs associated with the S 27'h Street reconstruction project.
The City early adopted GASS 75 related to OPES obligations. That added over $2 million in long term obligations.
Deferred Outflows decreased in 2017 related to changes in the WRS pension and Defined Benefit plan.
Deferred Outflows increased in 2016 from changes in WRS pension plan results.
The City contributed water infrastructure on S 27th Street via TIO #3 and utility assets in Kayla's playground to the Business-type activities totaling $659,283 in 2016. Developers also contributed two water main extensions.
An additional portion of the City's net position (12% and 13% in 2017 and 2016, respectively) represent resources that are subject to external restrictions on how they may be used. There were $31,089,295 and $32,212, 115 respectively in those net positions that were restricted to specific purposes.
The 2017 $1.1 million reduction in restricted net position relates to the collection of the intergovernmental cooperation agreement.
The 2016 increase in restricted net position reported is due principally to the intergovernmental cooperation agreement and TIF balances upon the retirement of internal advances and new TIF resources without current project costs.
The remaining balance in unrestricted net position of $15,637,898 and $18,392,464 in 2017 and 2016, respectively, may be used to meet the City's ongoing obligations to citizens and creditors. At the end of the current and prior fiscal years the City reported positive balances in the unrestricted net position for both the governmental and for its business-type activities. A $2,342,268 reduction in unrestricted net position relates to the prior period adjustment for the OPEB obligations recognized in the GASB 75 adoption.
Page 16

Government-wide activities
The details of changes in net position follow:
Revenue Program revenue:
Charges for services Operating grants & contributions Capital grants & contributions
General revenue: Property taxes Other taxes Intergovernmental Investment earnings
Other
Total revenue
Expenses: General government Public safety Public works Health & human services Culture & recreation Conservation & development Interest on long-term debt Water Sewer
Total expenses
Increase in net position before transfers
Transfers
Change in net position
Net position - beginning
Restatement - pension
City of Franklin Changes in Net Position For the Years Ending December 31, 2017 and 2016
Governmental Activities
2017 2016
Business-type Activities
2017 2016
$ 5,760,983 $ 1,829,490
3,143,577
5,772,042 $ 9,370,939 $ 9,383, 123 $ 1,882,406
3,677,886 341,915
22,925,176
1,020,027
1,404,222
406,902
127,280
36,617,657
3,310,893
18,839,063
7,478,288
889,434
2,202,090
586,622
165,254
33,471,644
3,146,013
989,602
4,135,615
135,778, 188
23,669,025
863,735
1,350,257
315,376
161,381
37,692,108
3,215,423
18,398,830
8,124,372
794,502
1,872,691
547,060
313,301
33,266,179
4,425,929
305, 112
4,731,041
131,047,147
(2,296,828) -----
133,481,360 131,047, 147
529,004
85,943
9,985,886
5,429,943 5,724,633
11, 154,576
(1, 168,690)
(989,602)
(2, 158,292)
113, 160,845
(45,440)
113,115,405
437,909
58,832
10,221,779
5,549,508 5,729,314
11,278,822
(1,057,043)
(305,112)
(1,362, 155)
92,071,540
22,451,460
114,523,000
Total 2017 2016
15,131,922 $ 15,155,165
1,829,490 1,882,406
3, 143,577 4,019,801
22,925, 176
1,020,027
1,404,222
935,906
213,223
46,603,543
3,310,893
18,839,063
7,478,288
889,434
2,202,090
586,622
165,254
5,429,943 5,724,633
44,626,220
1,977,323
1,977,323
248,939,033
(2,342,268)
246,596,765
23,669,025
863,735
1,350,257
753,285
220,213
47,913,887
3,215,423
18,398,830
8, 124,372
794,502
1,872,691
547,060
313,301
5,549,508 5,729,314
44,545,001
3,368,886
3,368,886
223, 118,687
22,451,460
245,570,147 Net position - beginning (restated)
Net position - ending $ 137,616,975 $ 135,778,188 $ 110,957,113 $ 113,160,845 $ 248,574,088 $ 248,939,033
The 2017 Governmental Activities increase of $4, 135,615 was principally generated by the $2.8 million jurisdictional transfer of W St. Martin's Road by Milwaukee County. The Adoption of GASB 75 for OPEB obligations reduced the City Net Position by $2.3 million.
The 2016 Governmental Activities increased the City's net position by $4,731,041 or 135% of the total growth in net position. Biggest element of this increase, $3 million was the donation of S North Cape Road by Milwaukee County and TIF resources with no related project costs. The 2016 Business-type Activities decrease in net position of $1,362, 155 reflects depreciation charges on contributed assets which is not being recovered via operations.
Page 17
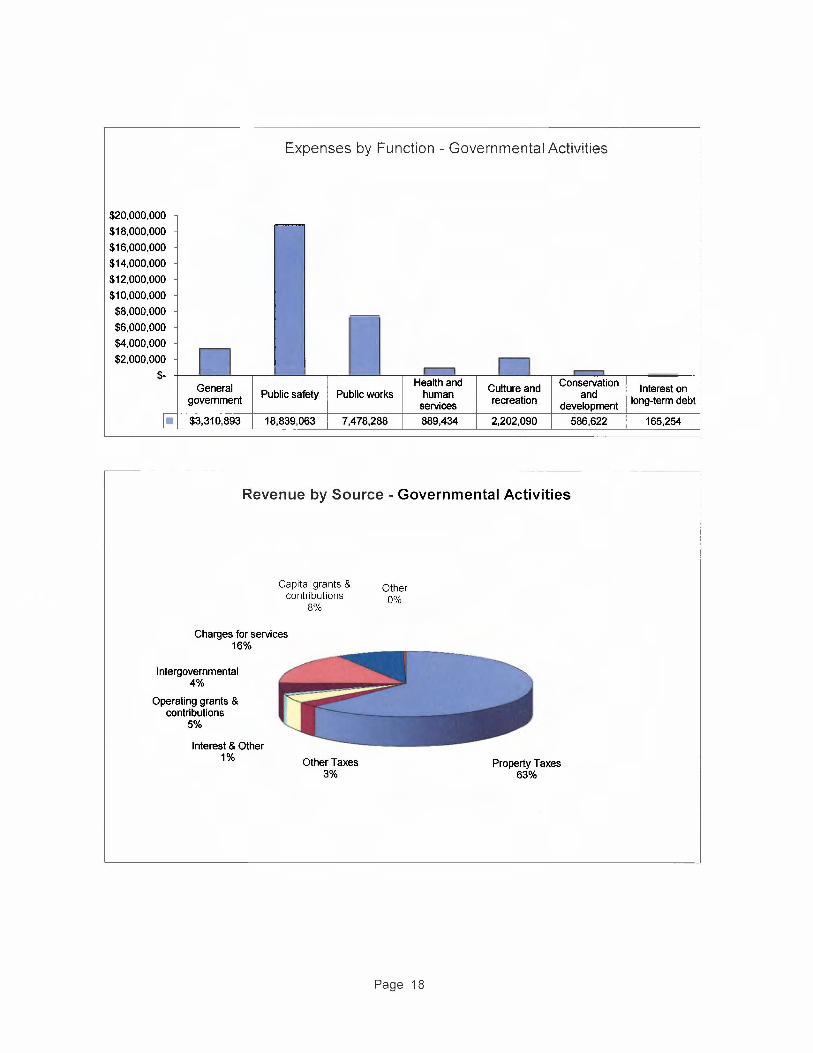
Expenses by Function - Governmental Activities
$20,000,000
$18,000,000 ,.-----
$16,000,000
$14,000,000
$12,000,000
$10,000,000
$8,000,000 ,,.,,,,...... $6,000,000
$4,000,000 n I $2,000,000 11 $- I lr--11 .-General
Health and Culture and Conservation
government Public safety Public works human
recreation and
services development
I• $3,310,893 18,839,063 7,478,288 889,434 2,202,090 586,622
Revenue by Source - Governmental Activities
Capital grants & contributions
8%
Charges for services 16%
Intergovernmental 4%
Operating grants & contributions
5%
Interest & Other 1% Other Taxes
3%
Other 0%
Page 18
Property Taxes 63%
Interest on long-term debt
165,254

Business-type activities
In 2017, business-type activities decreased the City's net position by $2,158,292 (or 61% of the total net change). Depreciation on contributed assets and the Ryan Creek Interceptor Sewer are the major reasons for the reduction in net position. The City has not set rates to recover the contributed assets. Rates will eventually need to provide for the replacement of those contributed assets, but until such time, the City's policy has been to hold rates down. The Sewer Fund purchased a replacement camera truck for $240,985.
In 2016, business-type activities decreased the City's net position by $1,362, 155 or 40.4%. Depreciation of contributed assets totaled $2,795,955, with the Ryan Creek Interceptor Sewer amounting to $1,425,000 of that total. The Ryan Creek Interceptor Sewer will be donated to Milwaukee Metropolitan Sewer District (MMSD) when the Clean Water Fund Loan is retired in 2031 by intergovernmental agreement. The City must maintain the asset until that time, no significant maintenance costs are expected, however some maintenance costs will likely occur.
The following graph compares the 2017 charges for services to the operating expenses for water and sewer activities.
Operating Revenue and Expense - Business-type Activities
$8,000,000
$7,000,000
$6,000,000
$5,000,000
$4,000,000
$3,000,000
$2,000,000
$1,000,000
$ -
Water revenue
revenue Sewer expense
Water and Sewer expenses can exceed revenue due to the current policy of including only depreciation from City spending on capital assets in the rate formula. The large amount of new infrastructure that has been contributed is the reason for this policy. Over 88% of the Business-type assets have been contributed by developers or new growth resources. When maintenance and replacement costs increase, this policy may need to be reevaluated. The City replaced $284,000 of contributed water mains in 2015 and none in 2016 or 2017. A $1 million replacement project is planned for 2018.
Page 19
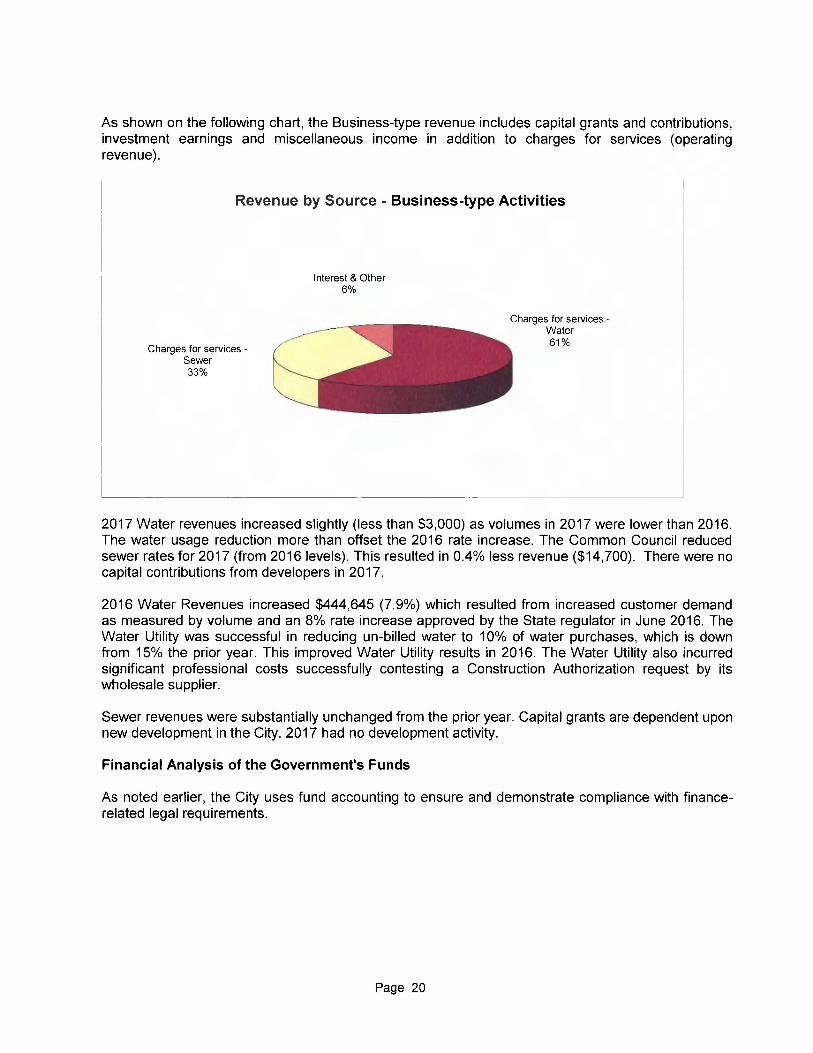
As shown on the following chart, the Business-type revenue includes capital grants and contributions, investment earnings and miscellaneous income in addition to charges for services (operating revenue).
Revenue by Source - Business-type Activities
Charges for services -Sewer 33%
Interest & Other 6%
Charges for services -Water 61%
2017 Water revenues increased slightly (less than $3,000) as volumes in 2017 were lower than 2016. The water usage reduction more than offset the 2016 rate increase. The Common Council reduced sewer rates for 2017 (from 2016 levels). This resulted in 0.4% less revenue ($14,700). There were no capital contributions from developers in 2017.
2016 Water Revenues increased $444,645 (7.9%) which resulted from increased customer demand as measured by volume and an 8% rate increase approved by the State regulator in June 2016. The Water Utility was successful in reducing un-billed water to 10% of water purchases, which is down from 15% the prior year. This improved Water Utility results in 2016. The Water Utility also incurred significant professional costs successfully contesting a Construction Authorization request by its wholesale supplier.
Sewer revenues were substantially unchanged from the prior year. Capital grants are dependent upon new development in the City. 2017 had no development activity.
Financial Analysis of the Government's Funds
As noted earlier, the City uses fund accounting to ensure and demonstrate compliance with financerelated legal requirements.
Page 20
Governmental Funds
The focus of the City's governmental funds is to provide information on near-term inflows, outflows, and balances of spendable resources. Such information is useful in assessing the City's financing requirements. In particular, unassigned fund balance may serve as a useful measure of a government's net resources available for spending at the end of the fiscal year.
As of the end of the current fiscal year, the City's governmental funds reported combined ending fund balances of $23,438,415, an increase of $401 ,952 from the prior year. At year end the unassigned fund balance was $5,971 ,948. Of this total $6, 190,398 was for General Fund activities. This amount was offset by deficits in the TIF Districts and Nonmajor Governmental Funds. Newly created TIF District #5 has an advance from the General Fund for organizational expenses.
The City has assigned fund balances for activities of the Capital Projects of $6,746,614. In addition , $150,565 of General Fund Balance has been assigned for purchase commitments into 2018.
Outside party restrictions have resulted in restricted fund balances: 1) to pay debt service -$735,022, 2) for utility improvements - $1 ,413,378, 3) for development purposes - $4, 166,500, 4) for TIF Districts of $2,405,999, 5) for library services $580,430
6) for Solid Waste services $393,677 and 7) for donations, health, grant funds, tourism and recreational activities - totaling $627,084.
The City also has nonspendable fund balances to indicate that it is not available for new spending because it has already been committed for prepaid expenses and inventories ($16,498) and for advances to other funds ($230, 700). The General Fund provided a 10 year advance to the Water Utility to finance an extraordinary contribution to the Public Works Retirement plan (in excess of the Actuarially Determined Contribution). This was financed out of the collection of the Sewer Fund advance.
The General Fund is the chief operating fund of the City. As of December 31, 2017, the total fund balance of the General Fund was $6,587,511 of which $6, 190,398 was unassigned. This unassigned fund balance represents approximately 25% of 2017 General Fund budgeted expenditures.
The total General fund balance decreased by $1 , 103, 173 during fiscal year 2017. With the repayment of the $2.2 million advance to the Sewer Fund in January 2017 a $900,000 extraordinary contribution· to the Public Works retirement plan was made. $605,700 of that was charged to the General Fund, and $155, 700 was advanced to the Water Utility to finance its contribution.
The Debt Service Fund has a total fund balance of $735,022, restricted for the payment of debt service. The fund balance increase of $83, 724 related to a $51,071 premium on a December 2017 new issue.
The TIF Districts Fund has total fund balance of $2,222,001; a restricted fund of $2,405,999 and a deficit fund balance of $183,998 related to start-up costs in Ballpark Commons (TID5).
The Nonmajor Governmental Funds have a total fund balance of $13,893,881 . The fund balance increase of $1 ,731,241 came principally from the proceeds of a December, 2017 new debt issue. The new issue was sold to finance the 2018 Capital Improvement Fund projects and to protect levy limit provisions.
Page 21

The City's Proprietary Funds provide the same type of information found in the government-wide financial statements, but in more detail.
Unrestricted net position of the Water Utility at the end of the year amounted to $2,710,007, an increase of $550,064 from the prior year coming out of operating results.
Unrestricted net position of the Sanitary Sewer Fund at the end of the year amounted to $1,469,256, an increase of $178,481 from the prior year. The increase is the result of spending dow the Restricted Replacement fund for the purchase of the camera truck.
The enterprise funds financial statements can be found on Exhibits G, H and I of this report.
General Fund Budgetary Highlights
Revenue trailed budget by $537,939. Building permit revenues were below budget by $305,037 related to delays in the start up of the Ballpark Commons development. Ambulance fees also trailed expectations by $86,974.
Actual expenditures were less than budgeted expenditures by $840,413. The City established a $625,000 contingency reserve in the Adopted Budget. $266,000 of that contingency was not spent. Public Safety underspent the final budget by 1.8% or $303,894.
A $1, 161,924 deficit before transfers out, compares favorably to the amended budgeted deficit of $1,464,398.
Capital assets
The City's investment in capital assets for its governmental and business type activities as of December 31, 2017, amounts to $229,637,714, net of accumulated depreciation. This investment in capital assets includes land, buildings, improvements other than buildings and machinery and equipment.
Page 22

City of Franklin's Investment in Capital Assets
Governmental Business-type Activities Activities Total
2017 2016 2017 2016 2017 2016
Land $ 25,072 ,951 $ 24,623,751 $ 888,479 $ 888,479 $ 25,961 ,430 $ 25,512 ,230 Buildings and Improvements 26,860,342 26,770,132 6,682,442 6,677,157 33,542,784 33,447,289
Improvements other than buildings 104,393,846 98,419,149 134,189,113 134, 145,872 238,582,959 232,565,021
Machinery and and equipment 18,562,309 17,924,405 5,749,838 5,385,346 24,312,147 23,309,751
Construction
in process 442,805 1,019,925 442,805 1,019,925
Total capital assets 175,332 ,253 168,757,362 147,509,872 147,096,854 322,842, 125 315,854,216
Less Accumulated
depreciation (53,408,375) (50,357 ,916) (39,796,036) (36,612,488) (93,204,411) (86,970,404)
Capital assets net of
depreciation $ 121 ,923,878 $ 118,399,446 $ 107,713,836 $ 110,484,366 $ 229,637,714 $ 228,883,812
The total increase in the City's net investment in capital assets net of depreciation for the current fiscal year was $753,902 or 0.3%. The increase is principally the result of the jurisdictional transfer of W St. Martin 's Road from Milwaukee County.
For further details on capital asset activity refer to Note 1 (D)6 and Note 3(E) of the Notes to Financial Statements and Schedules 12 - 12.2.
Long-term debt
State statutes limit the amount of general obligation debt a governmental entity may issue up to 5 percent of its total equalized valuation. At December 31 , 2017, the City had general obligation note and bond issues outstanding totaling $29,984,693. The current legal debt limitation for the City is $194,446,310. The City's current outstanding general obligation debt is 15.4% of the statutory debt limit. This is the lowest level in the last ten years.
By City policy, outstanding general obligation debt is limited to 2% of total equalized value or $77,778,524. Outstanding debt represents 39% of this internal limit, leaving an internal debt limit margin of $47,793,831 .
The City's present rating from Moody's for its general obligation debt is "Aa2". This rating was reduced from "Aa1 '', when a bond issue took place in December, 2017.
In April 2016, the City refunded the 2007 bonds with a notional value of $5,895,000 with new bonds valued at $5,770,000. See the debt footnote for further details.
In December, 2017, the City issued $1 ,630,000 of notes. The notes will finance the 2018 Capital Improvement programs.
Page 23

City of Franklin's Outstanding Debt (All purposes)
Governmental Business-type Activities Activities Total
2017 2016 2017 2016 2017 2016 General obligation Premium (Discount) $ 217,622 $ 260,403 $ (10,425) $ (11,534) $ 207,197 $ 248,869 Bonds 4,560,000 5,770,000 21,139,693 22,380,228 25,699,693 28,150,228 Notes 4,285,000 4,475,000 4,285,000 4,475,000
Total $ 9,062,622 $ 10,505,403 $ 21, 129,268 $ 22,368,694 $ 30,191,890 $ 32,874,097
Additional information of the City's long-term debt can be found in Note 3(H), Schedule 5 and Tables 11 - 13 in the statistical section of the report.
Other Changes of Significance
Post Employment Health Care Benefits
The City of Franklin provides retiree health care benefits to certain retiree groups from the date of retirement until age 65. Prior to 2008 the City's portion of health care cost was recognized as an expenditure in the period premiums were paid. Funding for those costs was provided out of the current operating budget of the City. This was referred to as financing on a pay as you go basis.
The Government Accounting Standards Board (GASS) issued Statement #45 effective for the City of Franklin on January 1, 2008 that said that the expense of these benefits has to be recognized over the working lives of the employees. The Common Council concluded that the City of Franklin should not only recognize the expense on its financial statements but should fund those amounts out of its general revenue starting in 2008 with the establishment of a section 115 trust. The actuarial computed annual required contribution under GASS #45 was $342,872 for 2016.
In 2017, the City adopted GASS 75, which treats OPES liabilities similarly to pension obligations. This resulted in a prior period adjustment of $2,342,268. The OPES liability as of December 31, 2017 was $7,607,514 and the plan fiduciary net position was $5,573,763 for a net OPES liability of $2,033,751.
More detailed information can be found in Note 4(C).
Economic Factors, Tax Rates and Next Year's Budgets
• The unemployment rate as of December 31, 2017 for the City was 3.2% and Milwaukee County which includes the City, was 3.1 %. This compares with an unemployment rate of 3.2% for the State of Wisconsin.
• The local assessed tax rate decreased to $5.61 from $5.69 for operations for 2017. In the prior two years the tax rate of $5.61 and $5.69 was relatively unchanged. The 2017 rate reduction was the result of a revaluation in the City and a frozen tax levy. The tax levy was unchanged the past four years, excluding the TIF Districts.
Page 24

Requests for Information
This financial report is designed to provide a general overview of the City's finances for those with an interest in the government's finances. Questions concerning any of the information provided in this report or requests for additional financial information should be addressed to the Director of Finance & Treasurer, City of Franklin 9229 West Loomis Road, Franklin, WI 53132.
General information or more detailed financial and budget information relating to the City of Franklin can be found at the City's website, www.franklinwi.gov - Finance Department tab.
Page 25