cochilco mining in chile future y challenges rusia bielorrusia
DESCRIPTION
Cochilcos Sergio Hernandez presentation, dealing with the mining in Chile, investment situation and structural challenges in the sector. Enters in the reasons for attractive investments, copper production and forecast,TRANSCRIPT

Logo Gobierno:
160x162px.
Ministerio,
Subsecretaría,
Organismo,
etc.:160x145px
Sergio HernándezExecutive Vicepresident
Chilean Copper Commission
Mining in Chile: Future and
Challenges

Index
I. Mining in Chile and investments
II. Structural challenges
III. Final Comments
Imagen Referencial
I. Mining in Chile and investments

0
10.000
20.000
30.000
40.000
50.000
60.000
70.000
80.000
90.000
198
6
198
8
199
0
199
2
199
4
199
6
199
8
200
0
200
2
200
4
200
6
200
8
201
0
201
2
201
4
MUS$
Exportaciones nomineras
Otras exportacionesmineras
Exportaciones de cobre
Non-mining exports
Other miningexports
2014:
Mining 57%
Copper mining 50%
Source: Central Bank of Chile, COCHILCO
Tax revenue(2014)
•9% of total
•US$ 4.9 billion
Foreign Direct Investment(2009 – 2013)
•45%
•US$ 45.3 billion
GDP (2008 – 2014)
•13% nominal
Why Chile is attractive for mining investment?Economic Development
2. Mining in Chile and investments Chilean Copper Commission - COCHILCO
Copper exports
90,000
80,000
70,000
60,000
50,000
40,000
30,000
20,000
10,000

1,0
7,0
Macroeconomía
Estabilidad política
Infraestructura paranegocios
Infraestructura generalMarco regulatorio
Mercado laboral
Potencial geológico
Países ingresos bajos y medios Países ingresos altos Chile
Source: COCHILCO, 2014
2. Mining in Chile and investments Chilean Copper Commission - COCHILCO
Why Chile is attractive for mining investment?Competitive in comparison with other mining countries
Macroeconomics
Geological potential
Labour market
Regulatory framework General infrastructure
Business infrastructure
Political stability
Low and middle income countries High-income countries

Source: USGS Mineral Commodity Summaries (2014)
27.9%
10.3%
5.7%
4.4%
4.4%
4.1%
12.8%
5.6%
Chile
Peru
USA
Russia
China
Mexico
Other countries14%
Indonesia
Australia
Why Chile is attractive for mining investment?Geological potential
2. Mining in Chile and investments Chilean Copper Commission - COCHILCO

Mining in Chile
World copper mining participation
Source: COCHILCO, WBMS and Wood Mackenzie
0
2.000
4.000
6.000
8.000
10.000
12.000
14.000
16.000
18.000
20.000
1950
1952
1954
1956
1958
1960
1962
1964
1966
1968
1970
1972
1974
1976
1978
1980
1982
1984
1986
1988
1990
1992
1994
1996
1998
2000
2002
2004
2006
2008
2010
2012
kt Cu
World total Chile
2014:Chile 31%
1950:Chile 14%
18%
Up to34%
Up to32-37%
2. Mining in Chile and investments Chilean Copper Commission - COCHILCO

Source: COCHILCO Y WBMS
Country 2013 2014
Chile 5,776 5,745
China 1,707 1,632
Peru 1,376 1,380
USA 1,240 1,346
D.R. Congo 817 999
Australia 996 963
Zambia 839 759
Russia 720 720
Canada 632 696
Mexico 480 513
Others 3,705 3,677
World 18,288 18,428
Chile 31%
China 9%
Peru 8%USA
7%
D.R. Congo
5%
Australia 5%
Zambia 4%
Russia 4%
Canada 4%
Mexico 3%
Otros 20%
2014
2. Mining in Chile and investments Chilean Copper Commission - COCHILCO
World copper mine productionThousands of tons

The portfolio consists of investment projects in the mining of copper,
gold, industrial minerals and iron.
Consider initiatives with investments of over US $ 90 million.
Initiatives that companies have announced publicly.
At least they have started their pre-feasibility studies.
Its investment decision is expected no later than 2019.
9
Mining projects portfolio
General concepts - conditions for inclusion in the portfolio
2. Mining in Chile and investments Chilean Copper Commission - COCHILCO

Investment
Risk
Engineeringprofile
Prefeasibility Feasibility Construction
Investment decision
Start up
Project Portfolio
Mining projects portfolio
General concepts – Project stages
2. Mining in Chile and investments Chilean Copper Commission - COCHILCO

Levels of
certaintyType of project
Stage of
advancementEnvironmental licenses Start up
BASE Anyone Construction Approved 2015 - 2019
PROBABLE
Anyone Suspended construction Approved or legal claim 2015 - 2019
Anyone Feasibility Approved 2015 - 2019
Replacement or Expansion Feasibility In process 2015 - 2019
POSSIBLE
Replacement or Expansion Suspended Feasibility In process 2015 - 2019
Replacement or Expansion Feasibility Not submitted 2015 - 2019
New Feasibility In process or not submitted 2015 - 2019
Anyone Feasibility Approved 2020 - 2024
Replacement or Expansion Feasibility In process or not submitted 2020 - 2024
POTENTIAL
Anyone Suspended Feasibility Anyone 2020 - 2024
New Feasibility In process or not submitted 2020 - 2024
Anyone Prefeasibility Anyone Anyone
2. Mining in Chile and investments Chilean Copper Commission - COCHILCO
Mining projects portfolio
General concepts – Levels of certainty

- Pampa Hermosa (MUS$ 1,033)
- Cerro Negro Norte (MUS$ 1,200)
- Escondida Nueva Pila de Lix. De Óxidos (MUS$ 721)
- Planta Nitrato Potasio – Coya Sur (MUS$ 250)
- Sierra Gorda (MUS$ 4,240)
- Bellavista (MUS$ 143)
- Actualización Quebrada Blanca (2016 – MUS$ 165)
- Arbiodo (2017 – MUS$ 503)
- Los Bronces / Fase 7 (2017 – MUS$ 112)
- Spence Growth Option (2019 – MUS$ 3,300**)
SALEN(*)
ENTRAN
Source: COCHILCO, 2015.(*) in operation in 2014(**) Including desalination plant
Current status of investment portfolio
2. Mining in Chile and investments Chilean Copper Commission - COCHILCO
OUT
IN

- Jerónimo (Gold, MUS$ 423)
- Lomas Bayas III Sulfuros (Priv. mining - Cu, MUS$ 1,600)
- Tovaku (Mid. Min. – Cu, MUS$ 600)
- Lobo Marte (Gold, MUS$ 800)
- Inca de Oro (Mid. Min. – Cu, MUS$ 600)
- Volcán (Gold, MUS$ 800)
- Cerro Casale (Gold, MUS$ 6,000)
- El Morro (Gold, MUS$ 3,900)
- Collahuasi Expansión Fase III (Priv. mining – Cu, MUS$ 6,500)
- Ampliación Los Pelambres IV (Priv. mining – Cu, MUS$ 7,000)
REESTRUCTURADOS
Source: COCHILCO, 2015.(*) Projects out from the portfolio to be under review process without starting or investment decision clarified by companies
Projects under review*
2. Mining in Chile and investments Chilean Copper Commission - COCHILCO
UNDER REVIEW

Source: COCHILCO
The portfolio of mining projects 2015 - 2024 considered 42initiatives, broken down as follows, according to sector.
2. Mining in Chile and investments Chilean Copper Commission - COCHILCO
Mining projects portfolio
Investment by the mining sector

Source: COCHILCO(*) CODELCO investment includes metallurgical plants, other development projects, information projects and five structural projects
2. Mining in Chile and investments Chilean Copper Commission - COCHILCO
*
Mining projects portfolio
Investment by type of company

Each project has considered attributes that give it a graduality associated
with greater or lesser certainty meet its deadlines of materialization.
Source: COCHILCO
2. Mining in Chile and investments Chilean Copper Commission - COCHILCO
Mining projects portfolio
Levels of certainty
2. Mining in Chile and investments Chilean Copper Commission - COCHILCO
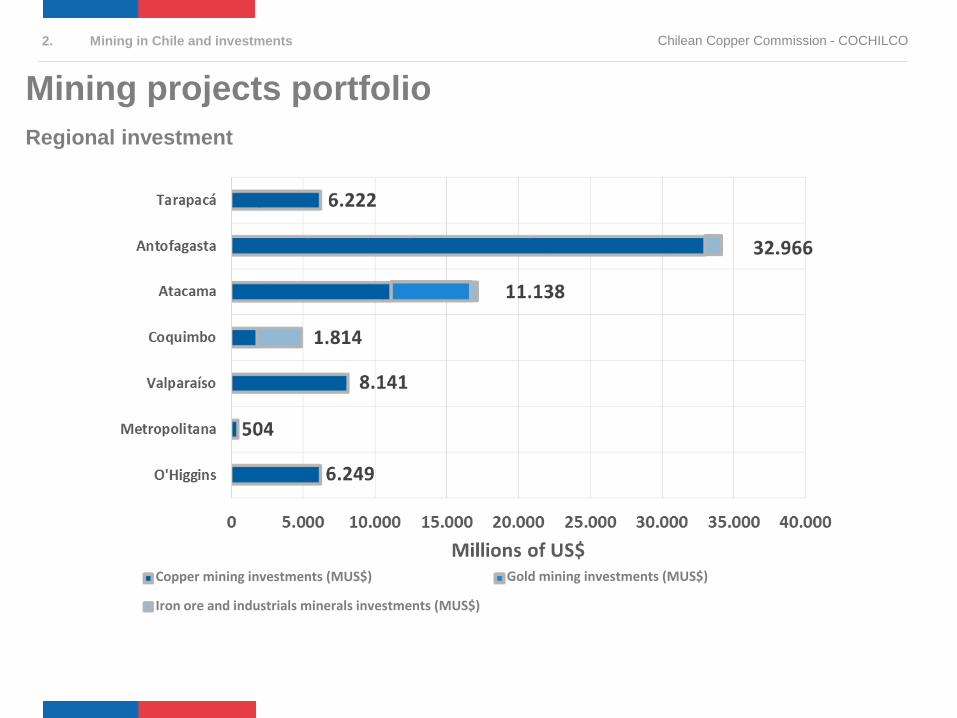
Mining projects portfolio
Regional investment
Copper mining investments (MUS$)
Iron ore and industrials minerals investments (MUS$)
Gold mining investments (MUS$)

In the last thirteen years (2002 - 2014) Copper mine production grew 25.5% at an average annual rate of 1.8%. The project portfolio has a potential production growth of 18.7%
copper mine at an average annual rate of 1.3%.
-4,6%
+11,0%
6,83 Mt
5,75 Mt
Copper production forecast
By levels of certainty, 2014 - 2026
2. Mining in Chile and investments Chilean Copper Commission - COCHILCOM
illio
nto
ns
of
cop
per

+1.8 Mt of copper in concentrates. (+70.5%)
-0.92 Mt of copper in SxEw cathodes (-50,1%)
2.55 Mt of copper in concentrate exported in 2014, 65.3% of concentrate production in the country. In 2026 would potentially be exported 4.4 million tons of concentrates, 73.6 % of the
chilean concentrate production that year.
2. Mining in Chile and investments Chilean Copper Commission - COCHILCO
Copper production forecast
By products, 2014 - 2026

2. Mining in Chile and investments Chilean Copper Commission - COCHILCO
Copper concentrate production forecast
Increased mineral processing
51.2%
90.5%

Daily production of tailings around 1.54 Mt, due to mining copper sulphide, the project portfolio will increase to 2.95 Mt of tailings daily production to 2026, a growth of 91%.
563,5
1.077,9
0,0
200,0
400,0
600,0
800,0
1.000,0
1.200,0
1.400,0
1.600,0
1.800,0
2005 2010 2015 2020 2025 2030 2035
Mill
ion
ton
so
gta
ilin
gs
2. Mining in Chile and investments Chilean Copper Commission - COCHILCO
Copper concentrate production forecast
Tailings, 2014 vs 2026

Imagen Referencial
III. Structural challenges

3. Structural challenges
Critical supplies
OPEX
Source: COCHILCO, 2014
Energía Eléctrica Chancado y Molienda (Conc)
Energía Eléctrica Sistema de Impulsión (Imp. Des)
Combustible (Petróleo y lubricantes) (mca)
M&R (Infraestructura, LHD, Camiones, Jumbo, Martillo, Chancador, Correas) (ms)
Requerimiento Agua Fresca (Desalada) (Conc)
Acido Sulfúrico (Sx-Lix-Ew)
Mantención y Reparación (M&R) (mca)Servicios de M&R Chancado yMolienda (Mec-Elec) (Conc)
Servicios de M&R Espesamiento Concentrado (Mec-Elec) (Conc)Bolas y Barras de Molino (Conc)
Cal (Conc)Espumante (Conc)Colector Primario (Conc)
Reactivos Sx-EW
Otros tronadura(mca)
Depresante Cobre (Conc)Floculante Relaves (Conc)
Energía Eléctrica Pta. Desaladora (Des)Servicios de M&R Desaladora(Mec-Elec) (Des)
Reactivo CO2 (Des)
0
1
2
3
4
5
6
7
8
9
10
11
12
13
14
15
16
17
18
0% 10% 20% 30% 40% 50% 60% 70% 80% 90% 100%
RIE
SG
O D
E D
ESA
BA
ST
EC
IMIE
NT
O
PESO RELATIVO EN LOS COSTOS DE OPERACIÓN(Por Subproceso)
Electricity
Sulphuric acid
Grinding balls
Lime
Water
Chilean Copper Commission - COCHILCO

Camiones (CAEX) (Mina Rajo)
Geomembrana (Lix)
Pala de Cable (Mina Rajo)
Insumos Eléctricos (Cables, conduit y
luminarias) (Lix)
Molino de Bolas y Barras (Pta. Concent.)
Bombas (Pta. Desal.)
Correas transportadoras (Lix)
Polín (correa)
(Lix)
Edificio Molienda (Pta. Concent.)
Celda Flotacion
(Pta. Concent.)
Loop eléctrico(Mina Rajo)
Equipos de Bombeo (Bombas) (Lix)
Cañería Aceros (Lix)
Cañ
eria
s N
o M
etal
icas
(Pta
. Des
al.)
0
1
2
3
4
5
6
7
8
9
10
11
12
13
14
15
0% 5% 10% 15% 20% 25% 30%
RIE
SGO
DE
DES
AB
AST
ECIM
IEN
TO
PESO RELATIVO EN EL CAPEX
(Por Subproceso)
Critical supplies
CAPEX
Source: COCHILCO, 2014
Mining Trucks
3. Structural challenges Chilean Copper Commission - COCHILCO

Energy (Electricity+Fuels)
Expected consumption forecast, 2014 - 2025
46,3
39,5
21,922,9
0
10
20
30
40
50
TWh
Consumomáximo
Consumoesperado
Mínimoesperado(Proyectos Base)
Minimumconsumption(Base projects)
It is expected that electricity demand
increase by 80.3% in the period 2014-2025.
Source: COCHILCO, 2014
3. Structural challenges Chilean Copper Commission - COCHILCO
Maximum consumption
Expected consumption

Water
Expected consumption forecast, 2014 - 2025
14,8 14,7 14,616,1 16,7 17,5
18,520,4 21,0
22,023,6
24,6
0
5
10
15
20
25
30
m3
/s An increase of 66.2% in water consumption in
mining is expected in the period 2014-2025
Source: “Proyección de consumo de agua en la minería del cobre 2014-2025”, COCHILCO, 2014.
3. Structural challenges Chilean Copper Commission - COCHILCO

Water
Expected consumption forecast of fresh water and sea water, by level of certainty
Source: “Proyección de consumo de agua en la minería del cobre 2014-2025”, COCHILCO, 2014.
0
2
4
6
8
10
12
14
16
18
m3
/se
g
Fresh Water
BASE PROBABLE POSIBLE POTENCIAL
0
2
4
6
8
10
12
14
16
18
m3
/se
g
Sea water
POTENCIAL POSIBLE PROBABLE BASE
3. Structural challenges Chilean Copper Commission - COCHILCO
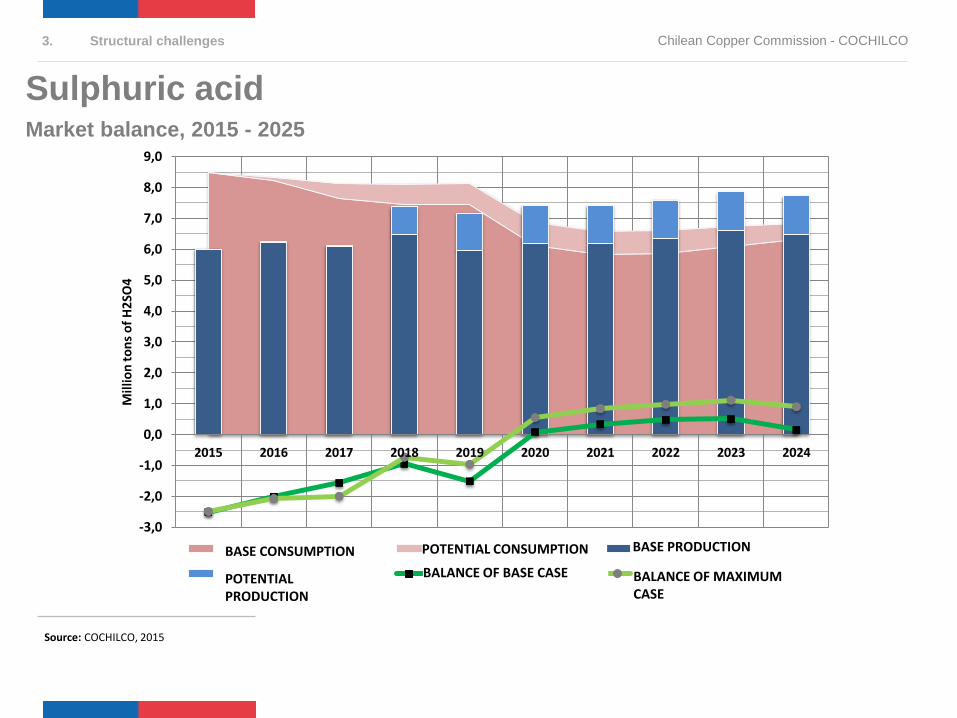
Sulphuric acidMarket balance, 2015 - 2025
Source: COCHILCO, 2015
-3,0
-2,0
-1,0
0,0
1,0
2,0
3,0
4,0
5,0
6,0
7,0
8,0
9,0
2015 2016 2017 2018 2019 2020 2021 2022 2023 2024
Mill
ion
ton
so
f H
2SO
4
CONSUMO BASE CONSUMO POTENCIAL PRODUCCIÓN BASE
PRODUCCIÓN POTENCIAL BALANCE CASO BASE BALANCE CASO MÁXIMO
3. Structural challenges Chilean Copper Commission - COCHILCO
BASE CONSUMPTION
POTENTIAL PRODUCTION
POTENTIAL CONSUMPTION
BALANCE OF BASE CASE
BASE PRODUCTION
BALANCE OF MAXIMUM CASE

• Starting in 2018, the entry into operation of new mining projects will push up the price of lime, as the domestic supply can not meet demand.
Source: “Análisis del mercado de insumos críticos en la minería del cobre”, Cochilco 2015
-
500.000
1.000.000
1.500.000
2.000.000
2014 2015 2016 2017 2018 2019 2020
(ton)
CaO otros usos (25% ) Esc. Base Esc. Probable Esc. Posible Esc. Potencial Oferta CaO Nacional
Lime
Consumption forecast, 2014 - 2020
3. Structural challenges Chilean Copper Commission - COCHILCO

• From 2019, the domestic supply fails to meet demand for a scenario in which all mininginvestments materialize, a situation that would push up the price of the grinding balls.
-
100
200
300
400
500
600
700
800
900
1.000
2014 2015 2016 2017 2018 2019 2020 2021 2022 2023 2024 2025
(kto
no
f gr
ind
ing
bal
ls)
Base Probable Posible Potencial Oferta Nacional
Grinding balls
Consumption forecast, 2014 - 2020
Source: Análisis del mercado de insumos críticos en la minería del cobre, Cochilco 2015
3. Structural challenges Chilean Copper Commission - COCHILCO

Mining trucks
Current imports and additional quantity required by 2025
• For the period 2015 -2025 expected a need for 700 mining trucks, which is mainlyexplained by the replacement needs of existing units in operation for compliance with theestimated useful life.
Import models most used in the Private Mining, period 2002-2014
54 7950
104 94 68115
174208
7219
15
4058
90 103
48
85
152
180
87
84
2002 2003 2004 2005 2006 2007 2008 2009 2010 2011 2012 2013 2014
Caterpillar
(773-775-777-785-789-793-795)
Komatsu
(730E-830E-930E-960E-HD465-HD605-HD785)
Liebherr
(T282)
Source: “Análisis del mercado de insumos críticos en la minería del cobre”, Cochilco 2015
3. Structural challenges Chilean Copper Commission - COCHILCO

What is Chile doing to stay competitive?
CNID
• Research and Development Commission(Comisión de Investigación y Desarrollo)
• Advises the President of Chile on the identification, formulation and implementation of policies and actions to strengthen innovation and competitiveness in Chile.
CMDCh
• Mining and Development Commission of Chile (Comisión Minería y Desarrollo de Chile)
• Mining and Development Commission of Chile Team with representatives of public-private sector summoned to build a strategic vision of the challenges (gaps) facing copper mining development
Agenda
• Mining: A platform for the future of Chile (Minería: Una plataforma de futuro para Chile)
• Mining: A platform for the future of Chile Strategic agenda and guidance to bring the Chilean mining to a virtuous mining (competitive and productive), inclusive (communities) and sustainable (socially and environmentally).
• One of the strategic commitments, beginning in 2015, corresponding to generate collaborative initiatives and fund R & D + i.
3. Structural challenges Chilean Copper Commission - COCHILCO

ENABLINGELEMENTS/RESOURCES
What is Chile doing to stay competitive?
Roadmap
TENDENCIES/DRIVERS
BUSINESS OPPORTUNITIES
TECHNOLOGIES
PROJECTSR&D+i
TAILIN
GS
SMA
RT
MIN
ING
SMELTER
&
REFIN
ING
ENER
GY
&
WA
TER
OTH
ERS
DRIVING CORES
TODAY SHORT TERM MID TERM + 2035
ENABLING CORES
SUPPLIERS DEVELOPMENT
HUMAN CAPITAL
VISION AND OBJECTIVES
US$M 10.000 in exports
290 world-classsuppliers
80% of industrie in first costquartiles
3. Structural challenges Chilean Copper Commission - COCHILCO

Imagen Referencial
III. Final Comments
Ministerio de Minería| COCHILCO

Logo Gobierno:
160x162px.
Ministerio,
Subsecretaría,
Organismo,
etc.:160x145px
Sergio HernándezExecutive Vicepresident
Chilean Copper Commission
Mining in Chile: Future and
Challenges