climate change vulnerability study - con ed
TRANSCRIPT
Climate Change Vulnerability Study December 2019
In partnership with:
With contributions from O'Neill Management Consulting, LLC, The Risk Research Group, Inc., and Jupiter Intelligence Inc.
TABLE OF CONTENTS
i Climate Change Vulnerability Study
Table of Contents Executive Summary ................................................................................................................................ 1
The Need for a Study ...................................................................................................................................................... 2 A New Understanding of Climate Science and Extreme Weather ................................................................. 3 Characterization of Con Edison’s Vulnerabilities to Climate Risks ................................................................ 4 Resilience Management Framework ......................................................................................................................... 6 Adaptation Measures to Address Vulnerabilities ................................................................................................. 7 Next Steps .......................................................................................................................................................................... 10
Introduction ........................................................................................................................................... 11 Study Background and Objectives ........................................................................................................................... 11 Guiding Principles ........................................................................................................................................................... 11 Study Methodology ....................................................................................................................................................... 13
Historical and Future Climate ............................................................................................................. 16 Con Edison in a Changing Climate .......................................................................................................................... 16 Con Edison’s Understanding and Assessment of Climate Change ............................................................. 17 Overview of Climate Science Findings Relevant to Con Edison ................................................................... 19 Signposts: Monitoring and Climate Science Updates ...................................................................................... 25
Existing Efforts and Practices to Manage Risks Under a Changing Climate ................................ 26 Physical Infrastructure ................................................................................................................................................... 26 Data Collection and Monitoring ............................................................................................................................... 27 Emergency Preparedness ............................................................................................................................................ 28
Vulnerabilities, a Resilience Management Framework, and Adaptation Options ...................... 29 Resilience Management Framework ....................................................................................................................... 29 All Commodities (Electricity, Gas, and Steam) ..................................................................................................... 32 Electric System ................................................................................................................................................................. 38 Gas System ........................................................................................................................................................................ 49 Steam ................................................................................................................................................................................... 52
Moving Towards Implementation ...................................................................................................... 56 Initial Climate Projection Design Pathway ............................................................................................................ 56 Flexible Adaptation Pathways Approach ............................................................................................................... 57 Selecting Cost-Effective Solutions............................................................................................................................ 62 Key Issues to Be Addressed for Effective Implementation ............................................................................. 64 Next Steps .......................................................................................................................................................................... 66
References .............................................................................................................................................. 67
Appendices ............................................................................................................................................. 71
EXECUTIVE SUMMARY
1 Climate Change Vulnerability Study
Executive Summary In its 2013 rate case filing after Superstorm Sandy, Con Edison proposed $1 billion in storm hardening investments to build additional resiliency into its energy systems. Con Edison worked with a Storm Hardening and Resiliency Collaborative to recommend optimal investments for the proposed storm hardening funds, including the recommendation that Con Edison conduct a Climate Change Vulnerability Study (Study). As described by the New York State Public Service Commission, the purpose of this Study is to aid in the ongoing review of the Company’s design standards and development of a risk mitigation plan.1 Over the course of the Study, Con Edison regularly convened a stakeholder group to provide feedback, consisting of many of the same participants from the Storm Hardening and Resiliency Collaborative. The findings from the Study equip Con Edison with a better understanding of future climate change risks and strengthen the company’s ability to more proactively address those risks.
This Study describes historical and projected climate changes across Con Edison’s service territory, drawing on the best available science, including downscaled climate models, recent literature, and expert elicitation. Con Edison recognizes the global scientific consensus that climate change is occurring at an accelerating rate. The exact timing and magnitude of future climate change is uncertain. To account for climate uncertainty, the Study considered a range of potential climate futures reflecting both unabated and reduced greenhouse gas concentrations through time and evaluated extreme event “stress test” scenarios.
This Study evaluates present-day infrastructure, design specifications, and procedures against expected climate changes to better understand Con Edison’s vulnerability to climate-driven risks. This analysis identified sea level rise, coastal storm surge, inland flooding from intense rainfall, hurricane-strength winds, and extreme heat as the most significant climate-driven risks to Con Edison’s systems. Con Edison has unique energy systems, and vulnerabilities vary across those systems. The utility’s electric, gas, and steam systems are all vulnerable to increased flooding and coastal storms; workers across all commodities are vulnerable to increasing temperatures; and the electric system is also vulnerable to heat events.
While Con Edison already uses a range of measures to build resilience to weather events, the vulnerabilities identified in this Study guide the company to pursue additional strategies to mitigate climate risks. The Study establishes an overarching framework that can work to strengthen Con Edison’s resilience over time. While many adaptation strategies focus on avoiding impacts altogether, a comprehensive resilience plan also requires a system that can reduce and recover from impacts, particularly following outages.
Over the course of 2020, Con Edison will develop and file a Climate Change Implementation Plan, which will specify a governance structure and a strategy for implementing adaptation options over the next 5, 10, and 20 years. While this Study assesses vulnerabilities within Con Edison’s present-day systems to a future climate, the implementation plan must also consider the evolving market for energy services, and potential changes to services and infrastructure driven by customers, government policy and external actions over time.
1 Cases 13-E-0030, 13-G-0031, 13-S-0032, Order Adopting Storm Hardening and Resiliency Collaborative Phase Three Report Subject to Modifications (January 25, 2016).
EXECUTIVE SUMMARY
2 Climate Change Vulnerability Study
The Need for a Study The New York State Public Service Commission approved an Order and funding for Con Edison to conduct a Climate Change Vulnerability Study, with a requirement for delivery by the end of 2019. The Con Edison Department of Strategic Planning undertook this Study with support from more than 100 subject matter experts throughout the company and in collaboration with ICF’s climate adaptation and resilience experts and Columbia University’s Lamont-Doherty Earth Observatory. The Study was designed to meet three primary goals:
1. Research and develop a shared understanding of new climate science and projected extreme weather for the service territory.
2. Assess the risks of potential impacts of climate change on operations, planning, and physical assets.
3. Review a portfolio of operational, planning, and design measures, considering costs and benefits, to improve resilience to climate change.
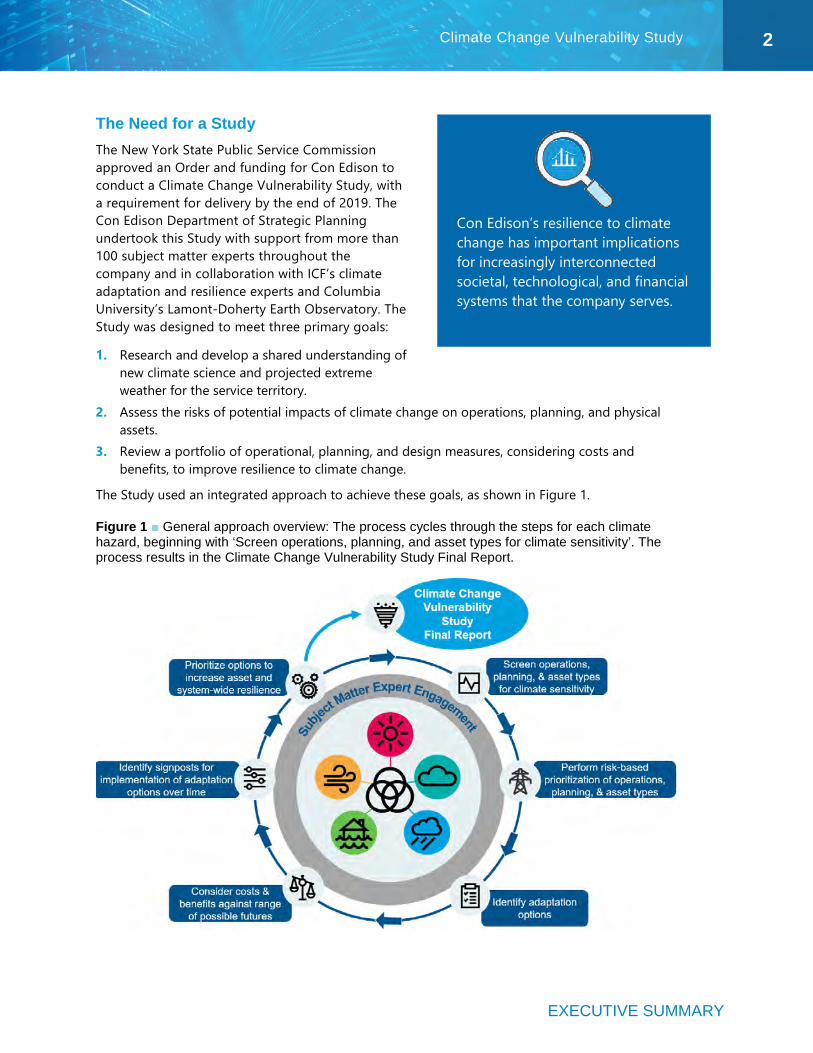
The Study used an integrated approach to achieve these goals, as shown in Figure 1.
Figure 1 ■ General approach overview: The process cycles through the steps for each climate hazard, beginning with ‘Screen operations, planning, and asset types for climate sensitivity’. The process results in the Climate Change Vulnerability Study Final Report.
Con Edison’s resilience to climate change has important implications for increasingly interconnected societal, technological, and financial systems that the company serves.
EXECUTIVE SUMMARY
3 Climate Change Vulnerability Study
A New Understanding of Climate Science and Extreme Weather Con Edison will face new challenges from a rapidly changing climate through the 21st century. To better understand these challenges, the Study characterized historical and projected changes to climate hazards within the service territory to estimate the magnitude and timing of potential climate vulnerabilities. Climate variables that present outsized impacts to Con Edison include temperature, humidity, precipitation, sea level rise, and extreme events, such as rare hurricanes and long-duration heat waves.
Temperature Average and maximum air temperatures are projected to increase throughout the century relative to historical conditions. Assuming unabated greenhouse gas concentrations, Con Edison could experience up to 23 days per year in which maximum temperatures exceed 95°F by 2050 relative to 4 days historically. Heat waves with 3 or more days when average temperatures exceed 86°F in Central Park are projected to occur up to 5 and 14 times per year by 2050 and 2080, respectively, relative to 1 heat wave every 5 years historically.
Humidity The frequency of very high heat index thresholds, which combines both temperature and humidity, is projected to increase dramatically through the century. The number of days per year where the heat index equals or exceeds 103°F could increase by 7 to 26 days by 2050, compared with only 2 days historically. In addition, Con Edison evaluates the relationship of system load to an index called temperature variable (TV), which is similar to a heat index, but considers the persistence of heat and humidity over several days. Looking forward, TV thresholds that historically occur only once per year (e.g., 86°F) are projected to become common occurrences within a generation, occurring between 4 and 19 times per year by 2050 and between 5 and 52 times per year by 2080 based on reduced and unabated greenhouse gas concentrations, respectively.
Precipitation Con Edison’s service territory experiences rainfall, downpours, snowfall, and ice. Climate change is projected to drive heavier precipitation across these event types. For example, the heaviest 5-day precipitation total could be 11.8 inches at Central Park by 2050, which represents a 17% increase over the historical reference period. Ultimately, projections point to a future defined by more frequent heavy precipitation, likely accompanied by smaller increases in the frequency of dry or light precipitation days.
Sea Level Rise Sea levels are very likely to rise between 0.62 and 1.94 feet by 2050. In turn, rising sea levels will have profound effects on coastal flooding, as sea level rise increases both the frequency and height of future floods. For example, the flood height associated with the 1% annual chance flood (i.e., the so-called 100-year flood) in New York City is projected to increase from 8.3 feet to as much as 13.3 feet by 2100 relative to mean sea level at the Battery tide gauge. By the end of the century, today’s annual chance flood could occur at every high tide.
EXECUTIVE SUMMARY
4 Climate Change Vulnerability Study
Extreme Events Extreme events are low-probability and high-impact phenomena, such as hurricanes and long-duration heat waves. While difficult to simulate in climate models, a growing body of evidence suggests that many extreme events will increase in frequency and intensity as a result of climate warming. This Study considers high impact “worst-case”2 extreme event scenarios, including a prolonged heat wave, a Category 4 hurricane, and an unprecedented nor’easter, to understand these changes and their impacts on Con Edison.
Characterization of Con Edison’s Vulnerabilities to Climate Risks
Heat and Temperature Variable The core electric vulnerabilities to increasing temperature and TV include increased asset deterioration, decreased system capacity, increased load, and decreased system reliability. Since the internal temperature of electric power equipment is determined by the ambient temperature as well as the power being delivered, higher ambient temperatures increase the internal operating temperature of equipment.
Higher internal operating temperatures increase the rate of aging of the insulation of electric equipment such as transformers, resulting in decreased total life of the assets. Higher internal temperatures, resulting from higher average and maximum ambient temperatures, also reduce the delivery capacity of electric equipment such as transformers. In addition, higher ambient temperatures increase the operating temperature of overhead transmission lines, causing increased sagging. One remedy is to decrease the operational rating of the assets to reflect the new operating environment. However, derating the system due to increasing temperatures would effectively decrease the capacity of the system, and Con Edison will need to make investments to replace that capacity if it is needed.
Similarly, higher TV can cause higher peak loads due to increases in demand for cooling. Increases in load may also require investments in system capacity to meet the higher demand. The combination of decreased capacity and increased load is best addressed through Con Edison’s existing 10- and 20-year load relief program. Addressing this combined risk is estimated to cost between $1.3 billion and $4.6 billion by 2050 (based on future projections using Representative Concentration Pathway (RCP) 4.5 10th and RCP 8.5 90th percentiles, respectively).
Increases in heat waves are expected to affect the electric network and non-network systems by decreasing reliability. Con Edison uses a Network Reliability Index (NRI) model to determine the reliability of the underground distribution networks. The Study’s forward-looking NRI analysis found that with an increase in the frequency and duration of heat waves by mid-century, between 11 and 28 of the 65 underground networks may not be able to maintain Con Edison’s standard of reliability by 2050, absent adaptation.
Outdoor worker safety may be a concern across all Con Edison commodities if heat index values rise as projected. When needed, Con Edison can implement safety protocols (e.g., shift modifications and hydration breaks) already practiced in mutual aid work that the company provided in hotter locations such as Florida and Puerto Rico. Similarly, to supply sufficient cooling in 2080, Con Edison’s heating, ventilation, and air conditioning (HVAC) capacity will have to increase by 11% due to projected increases in dry bulb temperature. These systems have a roughly 2 “Worst-case” scenarios are meant to explore Con Edison system vulnerabilities related to rare extreme weather events and formulate commensurate adaptation and resilience strategies. Scenarios represent one plausible permutation of extreme weather and the severity of actual events may exceed those considered.
EXECUTIVE SUMMARY
5 Climate Change Vulnerability Study
15-year life span and therefore can be upgraded during routine replacements with minimal cost increases.
Flooding from Precipitation, Sea Level Rise, and Coastal Storms All underground assets are vulnerable to flooding damage (i.e., water pooling, intrusion, or inundation) from precipitation events, sea level rise, and coastal storms. Following Superstorm Sandy in 2012, Con Edison protected all infrastructure in the floodplain against future 100-year storms and 1 foot of sea level rise (e.g., submersible infrastructure, flood walls, pumps, elevation). Sea level rise projections suggest that Con Edison’s 1 foot of sea level rise risk tolerance threshold may be exceeded as early as 2030 and as late as 2080.
Electric substations, overhead distribution, underground distribution, and the transmission system are sensitive to precipitation-based hazards, although the design of Con Edison’s assets already mitigates some of these risks. For example, flooding from increased intense precipitation can damage non-submersible electrical equipment, although Con Edison designs all underground cables and splices to operate while submerged in water. In addition, all underground distribution equipment installed in flood zones and all new installations are submersible.
To assess future asset vulnerability to sea level rise and storm surge, the Study team analyzed the exposure of Con Edison’s assets to 3 feet of sea level rise, while keeping the other elements of Con Edison’s existing risk tolerance constant (i.e., a 100-year storm with 2 feet of freeboard). Of the 324 substations (encompassing generating stations, area substations, transmission stations, unit substations, and Public Utility Regulating Stations), 75 would be vulnerable to flooding during a 100-year storm if sea level rose 3 feet. In addition, 32 gas regulators and five steam generation stations would be exposed. Hardening all of these assets would cost approximately $680 million.
Both the gas and steam distribution systems are vulnerable to water entry, which can reduce system pressure and limit distribution capacity. In the gas system, low-pressure segments3 are particularly vulnerable to this risk. In addition, the steam system is susceptible to “water hammer” events when a high volume of water collects around a manhole, causing steam in the pipes underneath to cool and condense. Interaction between steam and the built-up condensate may cause an explosion, both damaging the steam system and putting public safety at risk.
Across all commodities, increased winter precipitation can wash salt from city roads, causing an influx of salt-saturated runoff into manholes and percolation into the ground. Salt can cause equipment degradation, arcing, manhole fires or explosions, and failure of underground assets.
Extreme and Multi-Hazard Events The Study team reviewed the vulnerabilities of Con Edison’s electric, gas and steam systems to future extreme events based on specific, worst case extreme event narratives (Category 4 hurricane, a strong nor’easter, and a prolonged heat wave) designed to stress-test these systems.
Storm surge driven by an extreme hurricane event (i.e., a Category 4 hurricane) has the potential to flood both aboveground and belowground assets. In addition, wind stress and windblown debris can lead to tower and/or line failure of the overhead transmission system and damage overhead distribution infrastructure, which could cause widespread customer outages.
3 The Con Edison gas system contains piping operating at three pressures: low, medium, and high.
EXECUTIVE SUMMARY
6 Climate Change Vulnerability Study
An extreme nor’easter may cause significant damage to assets across all commodities. During nor’easters, accumulation of radial ice can cause tower or line failure of the overhead transmission system. Similarly, snow, ice, and wind can damage the overhead distribution system.
Con Edison’s systems are vulnerable to exceeding system capacity during extreme temperatures; gas systems may experience overloading during extreme cold, and electric systems during extreme heat.
On an operational level, the increasing frequency and intensity of extreme weather events may exceed Con Edison’s currently robust emergency preparedness efforts. Con Edison’s current “full-scale” response, which calls for all Con Edison resources and extensive mutual assistance, is initiated when the number of customers out of service reaches approximately 100,000. However, low-probability extreme events can increase customer outages and outage durations by orders of magnitude, outpacing current levels of emergency planning and preparedness.
Resilience Management Framework
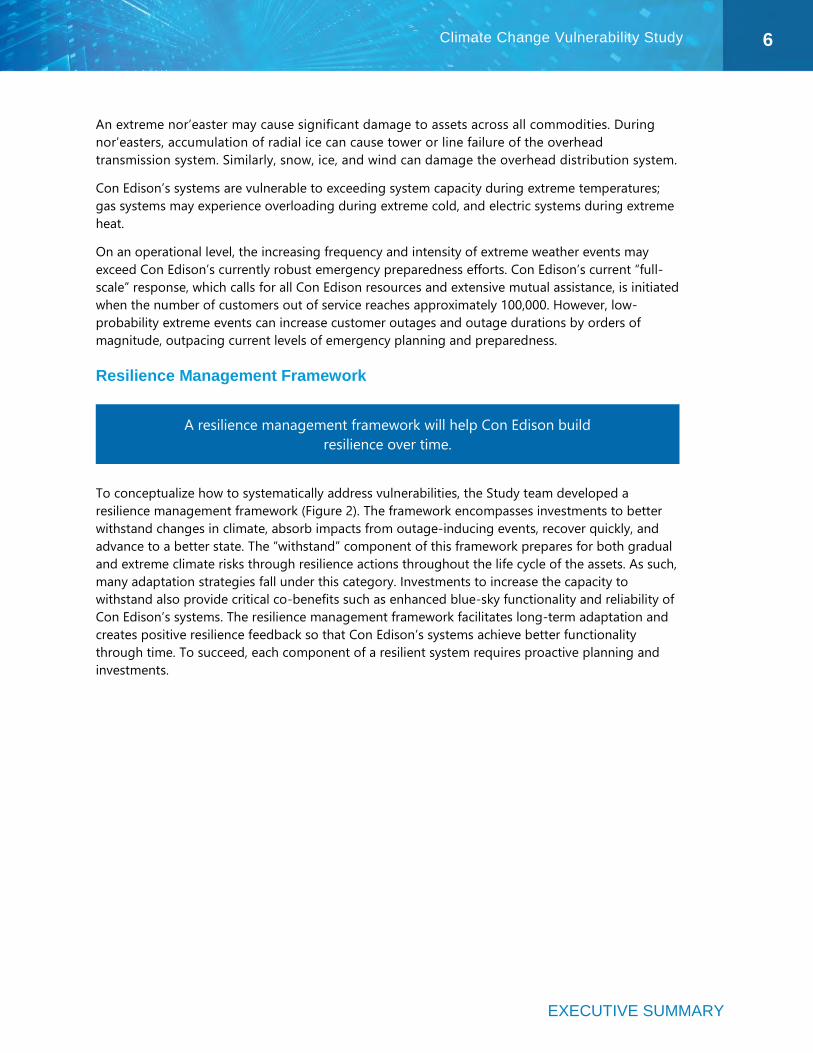
To conceptualize how to systematically address vulnerabilities, the Study team developed a resilience management framework (Figure 2). The framework encompasses investments to better withstand changes in climate, absorb impacts from outage-inducing events, recover quickly, and advance to a better state. The “withstand” component of this framework prepares for both gradual and extreme climate risks through resilience actions throughout the life cycle of the assets. As such, many adaptation strategies fall under this category. Investments to increase the capacity to withstand also provide critical co-benefits such as enhanced blue-sky functionality and reliability of Con Edison’s systems. The resilience management framework facilitates long-term adaptation and creates positive resilience feedback so that Con Edison’s systems achieve better functionality through time. To succeed, each component of a resilient system requires proactive planning and investments.
A resilience management framework will help Con Edison build resilience over time.
EXECUTIVE SUMMARY
7 Climate Change Vulnerability Study
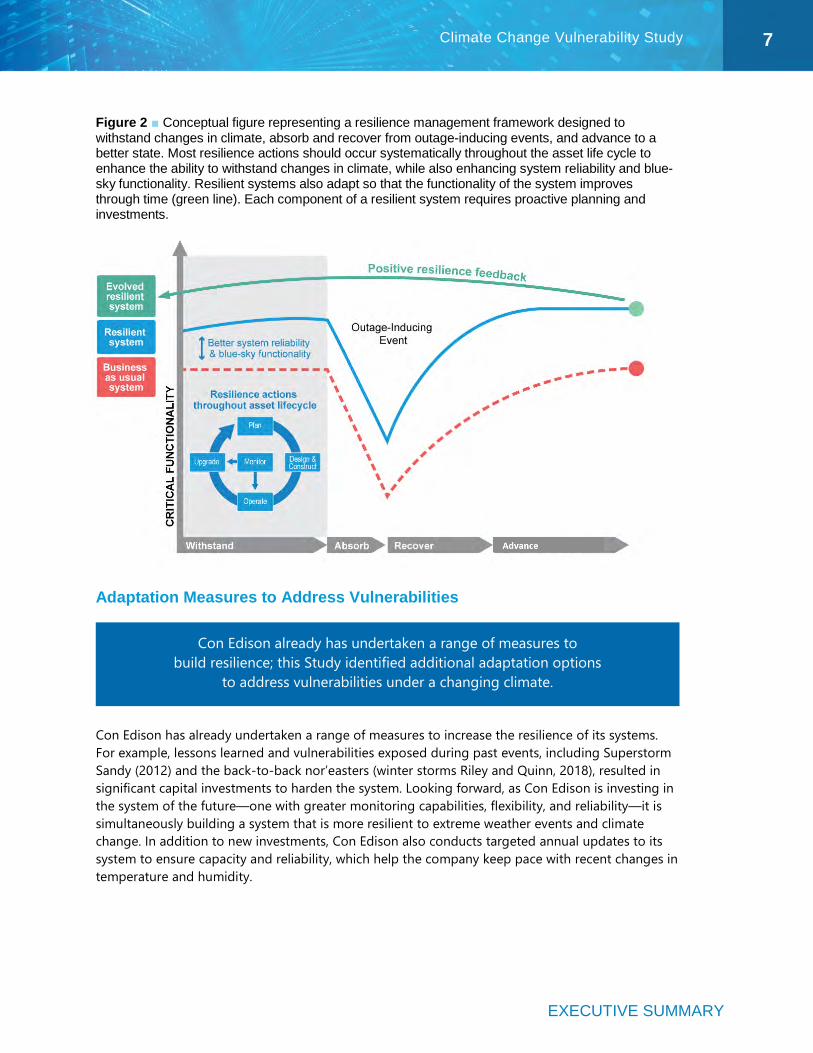
Figure 2 ■ Conceptual figure representing a resilience management framework designed to withstand changes in climate, absorb and recover from outage-inducing events, and advance to a better state. Most resilience actions should occur systematically throughout the asset life cycle to enhance the ability to withstand changes in climate, while also enhancing system reliability and blue-sky functionality. Resilient systems also adapt so that the functionality of the system improves through time (green line). Each component of a resilient system requires proactive planning and investments.
Adaptation Measures to Address Vulnerabilities
Con Edison has already undertaken a range of measures to increase the resilience of its systems. For example, lessons learned and vulnerabilities exposed during past events, including Superstorm Sandy (2012) and the back-to-back nor’easters (winter storms Riley and Quinn, 2018), resulted in significant capital investments to harden the system. Looking forward, as Con Edison is investing in the system of the future—one with greater monitoring capabilities, flexibility, and reliability—it is simultaneously building a system that is more resilient to extreme weather events and climate change. In addition to new investments, Con Edison also conducts targeted annual updates to its system to ensure capacity and reliability, which help the company keep pace with recent changes in temperature and humidity.
Con Edison already has undertaken a range of measures to build resilience; this Study identified additional adaptation options
to address vulnerabilities under a changing climate.
EXECUTIVE SUMMARY
8 Climate Change Vulnerability Study
Withstand Gradual Changes in Climate and Extreme Events Resilience actions should occur systematically throughout an asset’s life cycle to enhance the ability to withstand changes in climate while also enhancing system reliability and blue-sky functionality. This can be accomplished through planning, designing, and upgrading assets in a resilient manner, with ongoing monitoring throughout.
Plan Incorporating climate change projections into Con Edison’s routine planning processes will help identify capital needs and help the systems gradually adjust to changes in climate. Some of the types of planning processes and tools that may benefit from consideration of climate change include the following:
• Load and volume forecasting for all commodities • Load relief planning for the electric system, which should include reduced system capacity and
higher load due to warmer temperatures • Working with utilities in other environments to understand how they plan and design their
system for the climate Con Edison will experience in the future • Long-range planning for all commodities • Network reliability modeling and planning
Design The key to designing resilient infrastructure is to update design standards, specifications, and ratings to account for likely changes in climate over the life cycle of the infrastructure. While there is uncertainty as to the exact changes in climate an asset will experience, selecting an initial climate projection design pathway allows engineers to design infrastructure in line with Con Edison’s risk tolerance. The Study team suggests an initial climate projection design pathway that follows the 50th percentile merged RCP 4.5 and 8.5 projections for sea level rise and high-end 90th percentile merged RCP 4.5 and 8.5 projections for heat and precipitation.
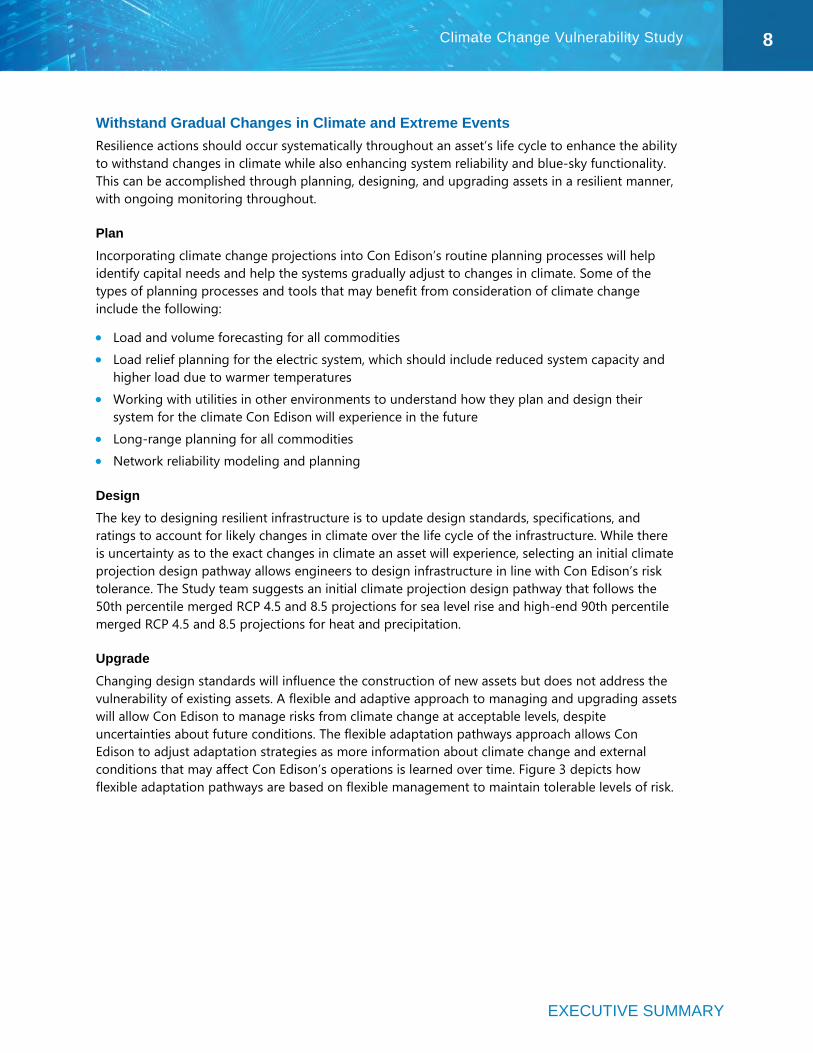
Upgrade Changing design standards will influence the construction of new assets but does not address the vulnerability of existing assets. A flexible and adaptive approach to managing and upgrading assets will allow Con Edison to manage risks from climate change at acceptable levels, despite uncertainties about future conditions. The flexible adaptation pathways approach allows Con Edison to adjust adaptation strategies as more information about climate change and external conditions that may affect Con Edison’s operations is learned over time. Figure 3 depicts how flexible adaptation pathways are based on flexible management to maintain tolerable levels of risk.
EXECUTIVE SUMMARY
9 Climate Change Vulnerability Study
Figure 3 ■ Flexible adaptation pathways in the context of tolerable risk and risk management challenges to non-flexible adaptation. Adapted from Rosenzweig & Solecki, 2014.
As conditions change over time, Con Edison will need to consistently track these changes to identify when decision making for additional or alternative adaptation strategies is required. This approach relies on monitoring indicators, or “signposts,” that provide information which is critical for adaptive management decisions. Broad categories of signposts that Con Edison should consider monitoring include climate variable observations and best available climate projections; climate impacts; and policy, societal, and economic conditions. Predetermined thresholds for these conditions signal the need for a change in action, which support decisions on when, where, and how Con Edison can take action to continue to manage its climate risks at an acceptable level. The body of this report provides many specific examples of proactive investments in resilience and their signposts; a few selected examples are provided in Table 1.
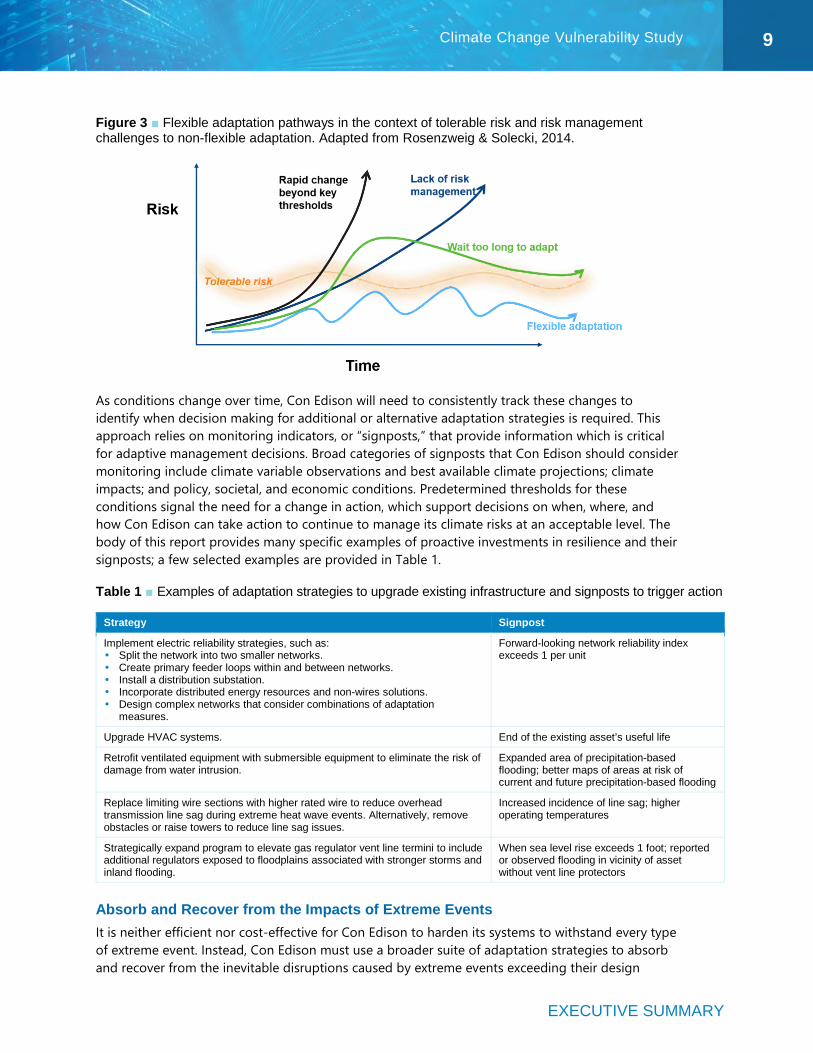
Table 1 ■ Examples of adaptation strategies to upgrade existing infrastructure and signposts to trigger action
Strategy Signpost
Implement electric reliability strategies, such as: Split the network into two smaller networks. Create primary feeder loops within and between networks. Install a distribution substation. Incorporate distributed energy resources and non-wires solutions. Design complex networks that consider combinations of adaptation
measures.
Forward-looking network reliability index exceeds 1 per unit
Upgrade HVAC systems. End of the existing asset’s useful life
Retrofit ventilated equipment with submersible equipment to eliminate the risk of damage from water intrusion.
Expanded area of precipitation-based flooding; better maps of areas at risk of current and future precipitation-based flooding
Replace limiting wire sections with higher rated wire to reduce overhead transmission line sag during extreme heat wave events. Alternatively, remove obstacles or raise towers to reduce line sag issues.
Increased incidence of line sag; higher operating temperatures
Strategically expand program to elevate gas regulator vent line termini to include additional regulators exposed to floodplains associated with stronger storms and inland flooding.
When sea level rise exceeds 1 foot; reported or observed flooding in vicinity of asset without vent line protectors
Absorb and Recover from the Impacts of Extreme Events It is neither efficient nor cost-effective for Con Edison to harden its systems to withstand every type of extreme event. Instead, Con Edison must use a broader suite of adaptation strategies to absorb and recover from the inevitable disruptions caused by extreme events exceeding their design
EXECUTIVE SUMMARY
10 Climate Change Vulnerability Study
standards. Con Edison currently incorporates “absorb” into its design and operations with, for example, a limited ability to control customer demand and shed load in extreme cases. A broader suite of strategies focuses on emergency preparedness, limiting customer impact and improving customer coping, including the following:
• Supporting the creation of resilience hubs (spaces that support residents and coordinate resources before, during, and after extreme weather events (Baja, 2018) and have continued access to energy services)
• Using smart meters to implement targeted load shedding to limit the impact to fewer customers during extreme events
• Strengthening staff skills for streamlined emergency response • Planning for resilient and efficient supply chains • Coordinating extreme event preparedness plans with external stakeholders • Incorporating low-probability events into long-term plans • Expanding extreme heat worker safety protocols • Examining and reporting on the levels of workers necessary to prepare for and recover from
extreme climate events • Investing in energy storage, on-site generation, and energy efficiency programs
Advance Advancing to a better adapted, more resilient state after an outage-inducing event (i.e., building back better/stronger) begins with effective pre-planning for post-event reconstruction. Even with proactive resilience investments, events can reveal system or asset vulnerabilities. Where assets need to be replaced during recovery, having a plan already in place for selection and procurement of assets designed to be more resilient in the future can help to ensure that Con Edison is adapting to a continuously changing risk environment. Outage-inducing events also provide important opportunities to measure the performance of adaptation investments, helping to inform additional actions that further resilience.
Next Steps
As a next step from this Study, Con Edison will develop a detailed Climate Change Implementation Plan to integrate the recommendations from this Climate Change Vulnerability Study. The implementation plan will be developed in close coordination with Con Edison SMEs and will utilize quarterly meetings with external stakeholders. The implementation plan will consider updates in climate science, finalize an initial climate design pathway, integrate that pathway into company specifications and processes based on input from subject matter experts, develop a timeline for action with associated costs and signposts, and recommend a governance structure. Some key items for consideration in the implementation plan include determining the appropriate amount of proactive investment, changes in the policy/regulatory and operating environment and the establishment of a reporting structure.
In 2020, Con Edison will develop an implementation plan that details priority actions needed in the next 5, 10, and 20 years.
Introduction
11 Climate Change Vulnerability Study
Introduction Study Background and Objectives Con Edison’s resilience to climate change has important implications for increasingly interconnected societal, technological, and financial systems that the company serves. Developing a shared understanding of Con Edison’s vulnerability to climate change is critical to ensuring the continued strength of the company over the coming century. The Con Edison Climate Change Vulnerability Study (Study) has three primary goals:
1. Develop a shared understanding of new climate science and projected climate and extreme weather for the territory.
2. Assess the risks of potential climate change impacts on Con Edison’s operations, planning, and physical assets.
3. Review a portfolio of operational, planning, and design measures, considering costs and benefits, to improve resilience to climate change.
The Study was conducted as an outcome of the 2013 rate case. In 2013, Con Edison worked with a Storm Hardening and Resiliency Collaborative in parallel with the rate case to provide parties with an opportunity to fully examine proposals for plans to protect against storms. In 2014, the New York State Public Service Commission approved an Order and funding for Con Edison to implement measures to plan for and protect its systems from the effects of climate change, including conducting a climate change vulnerability study. The Study was developed by the Con Edison Department of Strategic Planning, in collaboration with ICF’s climate adaptation and resilience experts and Columbia University’s Lamont-Doherty Earth Observatory. The members of this partnership are collectively referred to as the Study team. The Study team relied on inputs and expertise from Con Edison subject matter experts (SMEs), including engaging more than 100 SMEs through a series of in-person meetings, teleconferences, and workshops.
Guiding Principles The Study used six key principles to efficiently meet its objectives and benefit Con Edison. The Study employed a decision-first and risk-based approach, applying the best available climate science to produce flexible and adaptive solutions and mitigate risks associated with climate change and extreme weather events. The Study process was transparent and interactive to ensure that it can be replicated and institutionalized.
Introduction
12 Climate Change Vulnerability Study
Decision-first approach. The Study team used a decision-first approach, which focuses on understanding the broader vulnerabilities and constraints of the system, the objectives and needs of stakeholders, and the adaptation options available, before considering the projected changes in future climate. The Study team first identified the needs of decision makers (i.e., Con Edison leadership and SMEs) and worked from there to determine information requirements based on decision goals, instead of starting by amassing as much data as possible. This approach places a higher priority on understanding the decision-making context and providing enough information to inform those decisions, which helps to prioritize near- and long-term risks and develop effective solutions despite the existence of deep uncertainties related to future climate change.
Risk-based approach. The Study team employed a risk-based approach that considers both the likelihood and the consequence of potential changes in the climate. This involves identifying a comprehensive set of plausible future climate outcomes and assessing their probability and associated impact on Con Edison’s service territory. Doing so allows Con Edison to assess its vulnerability to—and to prepare for—high-probability and low-impact, as well as low-probability and high-impact, outcomes.
Best available climate science. The Study team prioritized continuous dialogues among climate scientists, climate adaptation specialists, and Con Edison SMEs to identify which climate scenarios, time periods, hazards, variables, and thresholds are important for Con Edison’s operations, infrastructure, and planning. The Study team assessed multiple lines of evidence to capture historical climate conditions in the territory and employed a comprehensive set of Global Climate Models to identify the extent to which current climate conditions may change throughout the 21st century. Ultimately, the Study team synthesized climate information into metrics relating plausible effects of climatic changes on operations, infrastructure, and planning.
Transparent and replicable. A transparent and replicable approach allows Con Edison to institutionalize its adaptation strategy and increase its adaptive capacity over time. This will help SMEs establish their adaptation efforts into emerging policies and procedures, as well as train the next generation of SMEs in resilience building. Transparency also engenders trust with internal and external stakeholders.
Flexible solutions and adaptive implementation. A flexible and adaptive approach will allow Con Edison to manage risks from a changing climate at acceptable levels, despite uncertainties about future conditions. Adaptive implementation pathways, or flexible adaptation pathways, are a recognized approach to adaptation planning and project implementation that ensures adaptability over time in the face of uncertainty: changes in energy demand, technologies, population, and other driving factors, and refinements in the scientific understanding of future climate. Under the adaptive approach, resilience measures can be sequenced over time, allowing Con Edison to protect against near-term changes while leaving options open to protect against the wide range of plausible changes emerging later in the century.
Resilience management framework. The Study introduces a resilience management framework that allows Con Edison to mitigate risks associated with climate changes and extreme weather events most relevant to Con Edison’s service territory (Figure 4). Resilient systems are composed of more than hardening measures alone, and instead consider measures that increase resilience throughout the life cycle of outage-inducing climate events. These measures include the system’s capacity to “withstand,” “absorb,” and “recover” from climate risks and “advance” resilience. In this way, the resilient management framework is particularly important for addressing complex extreme
Introduction
13 Climate Change Vulnerability Study
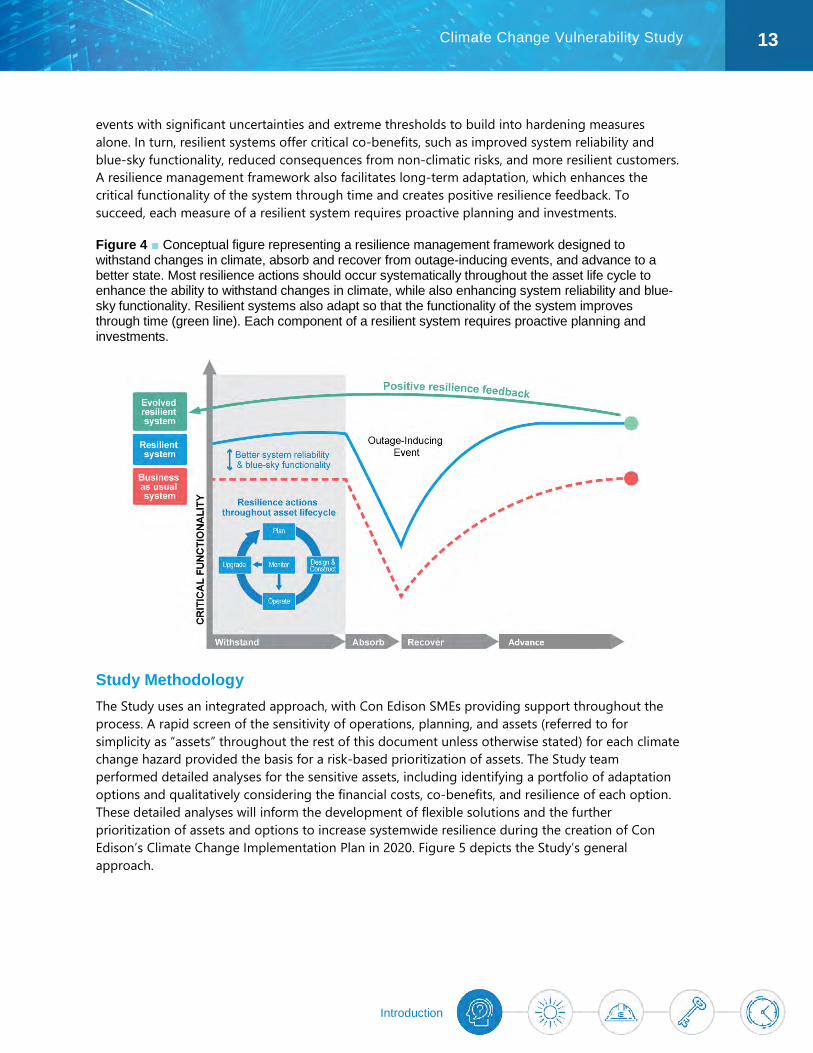
events with significant uncertainties and extreme thresholds to build into hardening measures alone. In turn, resilient systems offer critical co-benefits, such as improved system reliability and blue-sky functionality, reduced consequences from non-climatic risks, and more resilient customers. A resilience management framework also facilitates long-term adaptation, which enhances the critical functionality of the system through time and creates positive resilience feedback. To succeed, each measure of a resilient system requires proactive planning and investments.
Figure 4 ■ Conceptual figure representing a resilience management framework designed to withstand changes in climate, absorb and recover from outage-inducing events, and advance to a better state. Most resilience actions should occur systematically throughout the asset life cycle to enhance the ability to withstand changes in climate, while also enhancing system reliability and blue-sky functionality. Resilient systems also adapt so that the functionality of the system improves through time (green line). Each component of a resilient system requires proactive planning and investments.
Study Methodology The Study uses an integrated approach, with Con Edison SMEs providing support throughout the process. A rapid screen of the sensitivity of operations, planning, and assets (referred to for simplicity as “assets” throughout the rest of this document unless otherwise stated) for each climate change hazard provided the basis for a risk-based prioritization of assets. The Study team performed detailed analyses for the sensitive assets, including identifying a portfolio of adaptation options and qualitatively considering the financial costs, co-benefits, and resilience of each option. These detailed analyses will inform the development of flexible solutions and the further prioritization of assets and options to increase systemwide resilience during the creation of Con Edison’s Climate Change Implementation Plan in 2020. Figure 5 depicts the Study’s general approach.
Introduction
14 Climate Change Vulnerability Study
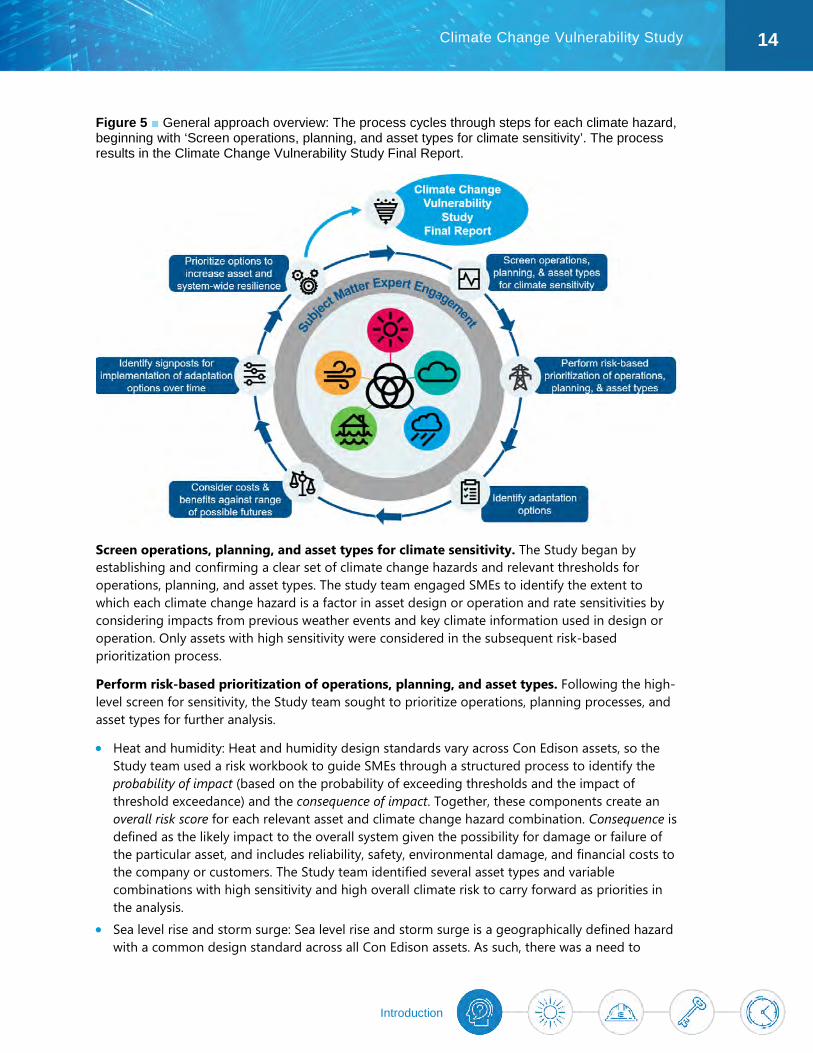
Figure 5 ■ General approach overview: The process cycles through steps for each climate hazard, beginning with ‘Screen operations, planning, and asset types for climate sensitivity’. The process results in the Climate Change Vulnerability Study Final Report.
Screen operations, planning, and asset types for climate sensitivity. The Study began by establishing and confirming a clear set of climate change hazards and relevant thresholds for operations, planning, and asset types. The study team engaged SMEs to identify the extent to which each climate change hazard is a factor in asset design or operation and rate sensitivities by considering impacts from previous weather events and key climate information used in design or operation. Only assets with high sensitivity were considered in the subsequent risk-based prioritization process.
Perform risk-based prioritization of operations, planning, and asset types. Following the high-level screen for sensitivity, the Study team sought to prioritize operations, planning processes, and asset types for further analysis.
• Heat and humidity: Heat and humidity design standards vary across Con Edison assets, so the Study team used a risk workbook to guide SMEs through a structured process to identify the probability of impact (based on the probability of exceeding thresholds and the impact of threshold exceedance) and the consequence of impact. Together, these components create an overall risk score for each relevant asset and climate change hazard combination. Consequence is defined as the likely impact to the overall system given the possibility for damage or failure of the particular asset, and includes reliability, safety, environmental damage, and financial costs to the company or customers. The Study team identified several asset types and variable combinations with high sensitivity and high overall climate risk to carry forward as priorities in the analysis.
• Sea level rise and storm surge: Sea level rise and storm surge is a geographically defined hazard with a common design standard across all Con Edison assets. As such, there was a need to
Introduction
15 Climate Change Vulnerability Study
identify potentially exposed assets rather than prioritize among them. The Study team used Geographic Information System (GIS) modeling to evaluate the specific type and number of assets that would be exposed under various future scenarios.
• Precipitation: Very few of Con Edison’s assets have design standards tied to precipitation. For the few that were identified, the Study team evaluated whether the assets would withstand future increases in the intensity of precipitation events. In addition, the Study team worked with Con Edison SMEs to identify and prioritize the operational impacts of precipitation on the various commodities.
• Extreme events: By definition, the extreme events analyzed in the study exceed all existing Con Edison design standards. As such, the Study team conducted a workshop with SMEs to prioritize extreme event risks based on the following: − The potential for impacts on operations, planning, and assets − How prior major weather events affected assets and operations − The preparations that Con Edison has in place for future extreme events − How longer or more intense events might overwhelm current preparedness efforts
Identify adaptation options. For the identified vulnerabilities, the Study team developed adaptation response options through SME engagement, review of relevant literature, and lessons learned from adaptation options implemented in regions with similar challenges. Adaptation options include strategies to withstand a changing climate, such as engineering design, operations, and planning strategies, as well as strategies to absorb and recover from extreme events. The Study team considered adaptation options that are often already in use to manage the hazard, but which may require revision or updating to deal with changing risk. The Study team also considered both short-term and long-term solutions and took steps to understand and assess the limitations of adaptation options.
Consider costs and benefits of adaptation options against a range of possible futures. The Study team worked with SMEs to develop order of magnitude costs of the various adaptation strategies, where feasible. Where possible, the Study team conducted a multi-criteria analysis of the adaptation options to compare criteria that may be difficult to quantify or monetize, or that may not be effectively highlighted in the financial analysis.
Identify signposts for implementation of adaptation options over time. Evaluation of adaptation measures in the context of a continuously changing risk environment poses a challenge to typical project planning, design, and execution. It is important to ensure that decision-making processes support flexible solutions that allow for effective risk management in the face of irreducible uncertainties in projections of future climate conditions. The Study uses an adaptive implementation pathway approach to achieve this goal. The Study team designed a framework for “signposts,” which represent information that will be tracked over time to help Con Edison understand how climate, policy, and process conditions change and, in turn, trigger additional action.
Prioritize options to increase asset and systemwide resilience. Once the prior steps were completed, the Study team circulated the findings to SMEs to allow them to strike, add, or refine strategies. This process resulted in the prioritized set of strategies included in this report.
Historical and Future Climate Projections
16 Climate Change Vulnerability Study
Historical and Future Climate Con Edison in a Changing Climate Earth’s climate is not static; it changes in response to both natural and human-caused drivers. The past decade was the warmest on record, and global atmospheric warming has increased at a faster rate since the 1970s (GCRP, 2017), which the global climate science community attributes to increasing human-caused greenhouse gas emissions (IPCC, 2013).
A growing body of research reveals that a range of climate hazards will likely increase in frequency and intensity as a result of atmospheric warming (GCRP, 2017; IPCC, 2013). For example, a warmer atmosphere increases the frequency, intensity, and duration of heat waves; holds more water vapor for heavy precipitation events; and accelerates ice loss from Earth’s large ice sheets, contributing to sea level rise and coastal storm surge. These climate changes highlight how changes in the global climate system affect local climatology and weather in Con Edison’s service territory. Local changes include both long-term mean changes, such as gradual increases in temperature and sea level, and changes in extreme events, such as heat waves, hurricanes, and storm surge. In most cases, long-term climate change amplifies and increases the likelihood of extreme events. In turn, climate changes and baseline climate hazards cause both direct (e.g., physical damage to infrastructure) and indirect (e.g., changing customer behavior) impacts across the electric, gas, and steam systems of Con Edison’s business.
Rapid climate change will bring new challenges to Con Edison through the 21st century. This Study develops climate projections to characterize these challenges. Still, conceptualizing climate change in tangible terms is notoriously difficult. Another way to describe potential climate change is through climate analogs, which match expected future climate change at a location to current climate conditions in another. Under this perspective, New York City’s temperature and precipitation by 2080 could more closely resemble current conditions in southern cities such as Memphis, TN, and Little Rock, AR, if greenhouse gas emissions continue unabated (Fitzpatrick & Dunn, 2019).4
4 Climate analogs are illustrative and vary depending on the choice of evaluation metrics, decade, and climate scenario. In this case, analogs are determined using metrics for seasonal minimum and maximum temperature and total precipitation.
Historical and Future Climate Projections
17 Climate Change Vulnerability Study
Con Edison’s Understanding and Assessment of Climate Change The Study team developed improved, downscaled climate projections and used best available science to understand and evaluate climate change trends and potential extreme weather events across Con Edison’s service territory over near- (2030), intermediate- (2050), and long-term (2080) time horizons.5 This approach builds on methods used by the New York City Panel on Climate Change (NPCC) and introduces a range of benefits (see Table 2). The Study team focused on climate variables that could present outsized impacts to operations, planning, and infrastructure across the electric, gas, and steam segments of Con Edison’s business. These include temperature, humidity, precipitation, sea level rise and coastal flooding, extreme events, and multiple—or compounding—events.
The primary tools for understanding future climate change are Global Climate Models (GCMs), which mathematically simulate important aspects of Earth’s climate, such as changes in temperature and precipitation, natural modes of climate variability (e.g., El Niño and La Niña events), and the influence of human greenhouse gas emissions (GCRP, 2017). Over short timescales (i.e., years to decades), individual GCM projections can differ from one another due to unpredictable natural climate variability, differences in how models characterize small-scale climate processes, and their response to greenhouse gas emissions/concentration assumptions. For these reasons, future climate analyses often consider a large ensemble of GCMs to better discern long-term trends, account for uncertainty, and consider a fuller range of potential future climate outcomes. To this end, the Study team used a broad model ensemble (i.e., 32 GCMs) for each climate variable of interest to address the spread across models and provide a comprehensive view of future climate.
While GCMs use a finer spatial resolution than ever before, they still provide coarse-resolution estimates of future climate, with model grid cells typically extending approximately 100 kilometers on one side. To achieve a more accurate representation of local climate in the New York Metropolitan Region, the Study team bias-corrected and downscaled GCM projections (i.e., statistically adjusted simulations to bring them closer to observed data) using weather station data over a 1976–2005 historical reference period from three weather station locations spanning Con Edison’s service territory, including Central Park, LaGuardia Airport, and White Plains Airport.6
GCM simulations are driven by a standard set of time-dependent greenhouse gas concentration trajectories called Representative Concentration Pathways (RCPs), developed by the Intergovernmental Panel on Climate Change (IPCC). RCPs consider different evolutions of fossil fuels, technologies, population growth, and other controlling factors on greenhouse gas emissions through the 21st century. To acknowledge uncertainty in future greenhouse gas concentrations, the Study team selected the commonly used RCPs 4.5 and 8.5 to drive each GCM, following precedent set by IPCC and NPCC. RCP 4.5 represents a moderately warmer future based on a peak in global greenhouse gas emissions around 2040. In contrast, RCP 8.5 represents a hotter future
5 Columbia University’s Lamont-Doherty Earth Observatory led the analysis of temperature, humidity, and precipitation projections and extreme event information. ICF provided insights into future climate conditions using localized constructed analog (LOCA) projections, analyzed sea level rise projections, and synthesized extreme event narratives. Jupiter Intelligence provided projections of extreme temperatures and the urban heat island effect. 6 Technical information regarding bias-correction and downscaling methods used in this Study are provided in the appendices for the relevant climate variables.
Historical and Future Climate Projections
18 Climate Change Vulnerability Study
corresponding to “business as usual” increases in greenhouse gas concentrations through the century.
The Study team used a model-based probabilistic framework to evaluate climate change hazards and account for model uncertainty under different RCP scenarios. Specifically, the Study team analyzed high-end estimates (e.g., the 90th percentile of projections across climate models), and mid-point (50th percentile) and low-end (10th percentile) projections for both RCPs. In doing so, the Study Team considered the range of potential climate outcomes across models and RCPs to form a comprehensive risk-based approach. Under this framework, the RCP 8.5 90th percentile approximates a stress test to characterize low probability, high-impact climate change, and its impact on Con Edison.
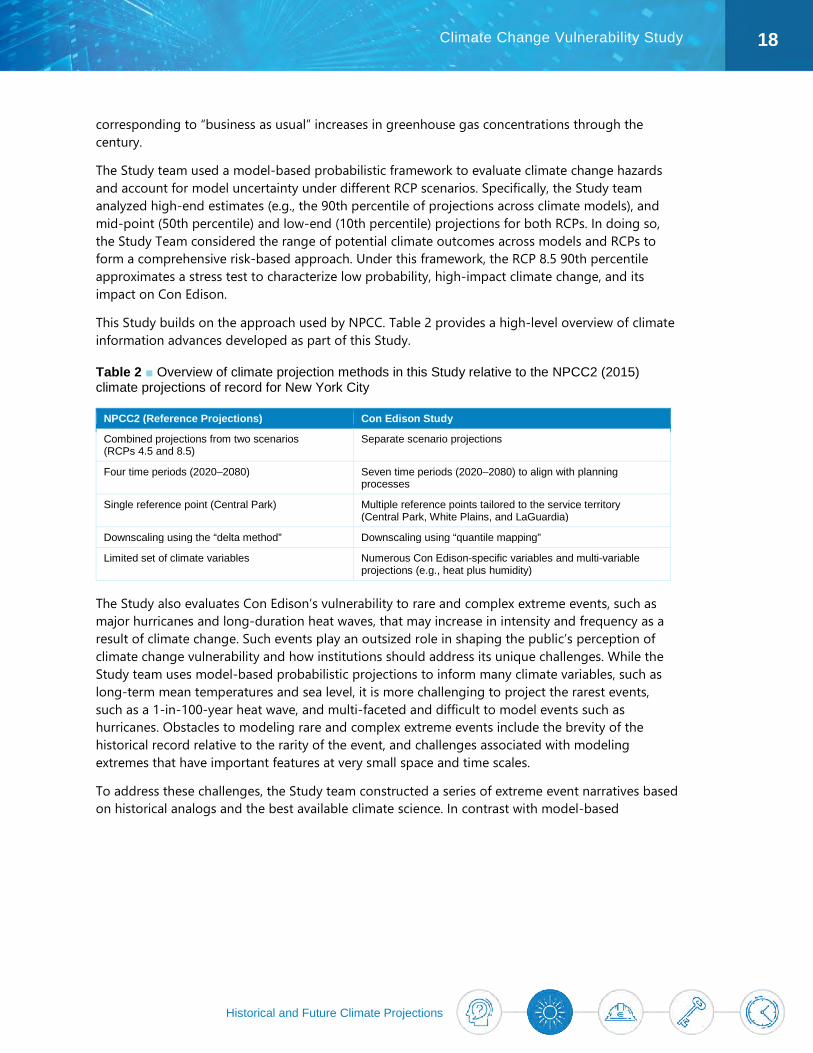
This Study builds on the approach used by NPCC. Table 2 provides a high-level overview of climate information advances developed as part of this Study.
Table 2 ■ Overview of climate projection methods in this Study relative to the NPCC2 (2015) climate projections of record for New York City
NPCC2 (Reference Projections) Con Edison Study
Combined projections from two scenarios (RCPs 4.5 and 8.5)
Separate scenario projections
Four time periods (2020–2080) Seven time periods (2020–2080) to align with planning processes
Single reference point (Central Park) Multiple reference points tailored to the service territory (Central Park, White Plains, and LaGuardia)
Downscaling using the “delta method” Downscaling using “quantile mapping”
Limited set of climate variables Numerous Con Edison-specific variables and multi-variable projections (e.g., heat plus humidity)
The Study also evaluates Con Edison’s vulnerability to rare and complex extreme events, such as major hurricanes and long-duration heat waves, that may increase in intensity and frequency as a result of climate change. Such events play an outsized role in shaping the public’s perception of climate change vulnerability and how institutions should address its unique challenges. While the Study team uses model-based probabilistic projections to inform many climate variables, such as long-term mean temperatures and sea level, it is more challenging to project the rarest events, such as a 1-in-100-year heat wave, and multi-faceted and difficult to model events such as hurricanes. Obstacles to modeling rare and complex extreme events include the brevity of the historical record relative to the rarity of the event, and challenges associated with modeling extremes that have important features at very small space and time scales.
To address these challenges, the Study team constructed a series of extreme event narratives based on historical analogs and the best available climate science. In contrast with model-based
Historical and Future Climate Projections
19 Climate Change Vulnerability Study
probabilistic projections, narratives represent plausible future worst-case scenarios7 meant to stress-test Con Edison’s system. The narratives merge a decision-first and risk-based approach, blending best available science with decision maker-defined high impacts to develop a better understanding of Con Edison’s vulnerability to rare, complex extreme events.
Overview of Climate Science Findings Relevant to Con Edison The Study team’s analysis characterized historical and future changes in temperature, humidity, precipitation, sea level rise, and extreme events within Con Edison’s service territory. This information supports a risk-based understanding of potential climate-related vulnerabilities within the company’s operations, planning, and physical assets. The sections below provide an overview of projected climate changes relevant to Con Edison. While projections were prepared for Central Park, LaGuardia, and White Plains as described above, this section commonly uses Central Park as a reference point due to its central location and because it currently serves as a reference point for many Con Edison operations. The report appendices contain detailed information on other locations and the full scope of climate projections and corresponding vulnerabilities developed for this Study.
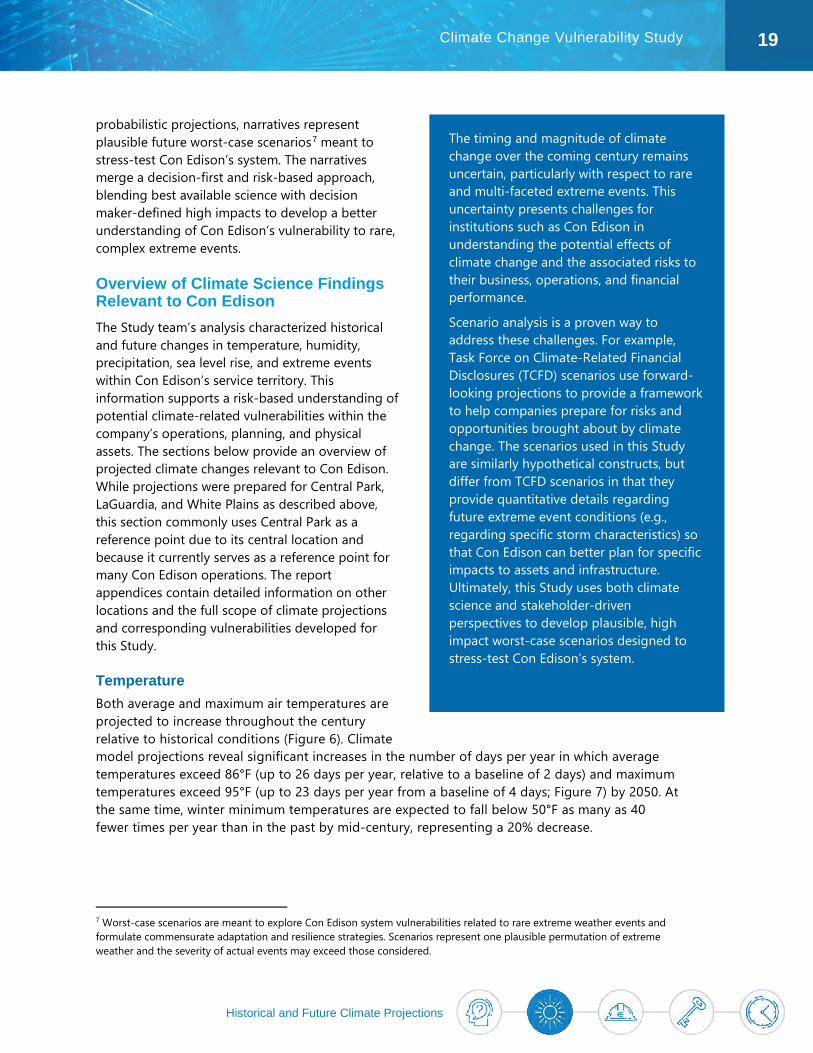
Temperature Both average and maximum air temperatures are projected to increase throughout the century relative to historical conditions (Figure 6). Climate model projections reveal significant increases in the number of days per year in which average temperatures exceed 86°F (up to 26 days per year, relative to a baseline of 2 days) and maximum temperatures exceed 95°F (up to 23 days per year from a baseline of 4 days; Figure 7) by 2050. At the same time, winter minimum temperatures are expected to fall below 50°F as many as 40 fewer times per year than in the past by mid-century, representing a 20% decrease.
7 Worst-case scenarios are meant to explore Con Edison system vulnerabilities related to rare extreme weather events and formulate commensurate adaptation and resilience strategies. Scenarios represent one plausible permutation of extreme weather and the severity of actual events may exceed those considered.
The timing and magnitude of climate change over the coming century remains uncertain, particularly with respect to rare and multi-faceted extreme events. This uncertainty presents challenges for institutions such as Con Edison in understanding the potential effects of climate change and the associated risks to their business, operations, and financial performance.
Scenario analysis is a proven way to address these challenges. For example, Task Force on Climate-Related Financial Disclosures (TCFD) scenarios use forward-looking projections to provide a framework to help companies prepare for risks and opportunities brought about by climate change. The scenarios used in this Study are similarly hypothetical constructs, but differ from TCFD scenarios in that they provide quantitative details regarding future extreme event conditions (e.g., regarding specific storm characteristics) so that Con Edison can better plan for specific impacts to assets and infrastructure. Ultimately, this Study uses both climate science and stakeholder-driven perspectives to develop plausible, high impact worst-case scenarios designed to stress-test Con Edison’s system.
Historical and Future Climate Projections
20 Climate Change Vulnerability Study
Figure 6 ■ Historic (black line) and projected (colored bands) average air temperature in Central Park during the summer under two greenhouse gas concentration scenarios (RCPs 4.5 and 8.5)
Figure 7 ■ The average number of days per year with maximum summer air temperatures exceeding 95°F in Central Park under two greenhouse gas concentration scenarios (RCPs 4.5 and 8.5). The dashed horizontal lines show the historical average number of days. Box plots correspond to the 10th, 25th, 50th, 75th, and 90th percentile projections.
Multi-day heat events, known as heat waves, create potential risks for Con Edison as they drive demand for air conditioning and stress electrical and infrastructure systems. The number of heat waves, defined here as 3 or more consecutive days when average temperatures exceed 86°F in Central Park, is projected to increase up to 5 and 14 events per year by 2050 and 2080, respectively, relative to 0.2 events per year historically. The magnitudes of temperature increases are projected to be greatest at LaGuardia and Central Park and smaller at White Plains.
Historical and Future Climate Projections
21 Climate Change Vulnerability Study
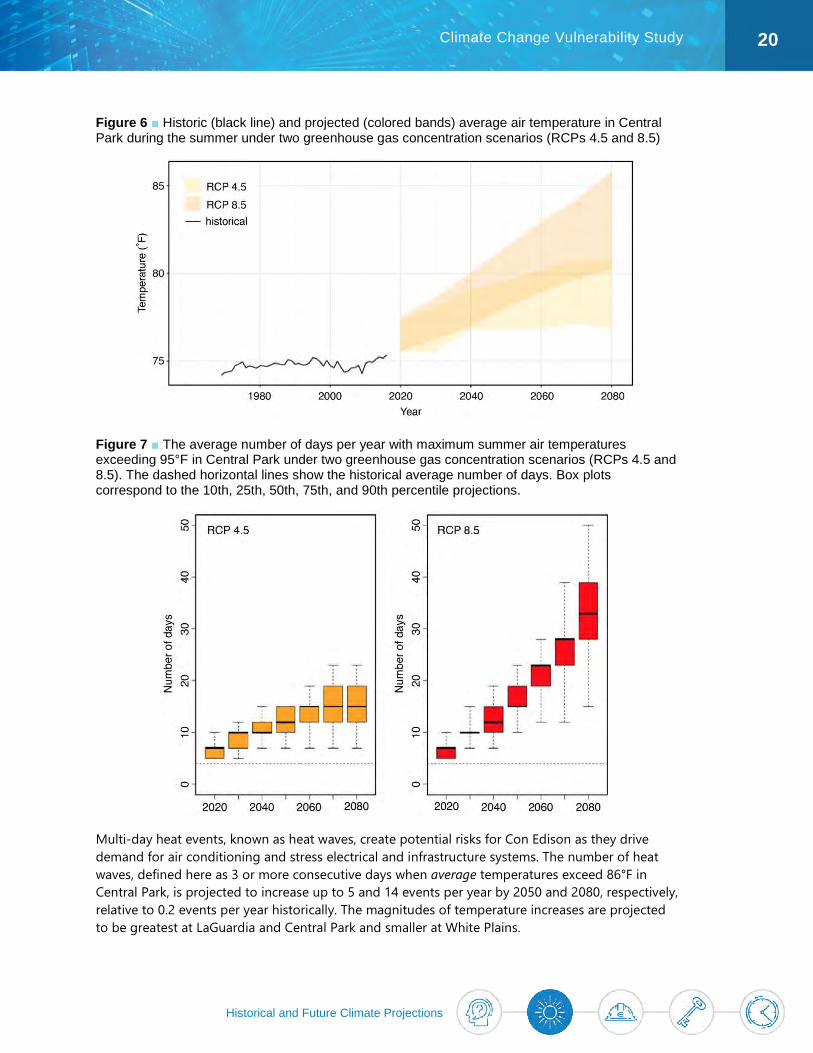
Humidity The New York Metropolitan Region is susceptible to significant combinations of heat and humidity, which cannot be captured by temperature alone. The combination of temperature and humidity drives electric demand within Con Edison’s service territory. To address this, the company currently evaluates the potential for high loads using an index referred to by Con Edison as temperature variable (TV),8 which incorporates considerations of both temperature and humidity. Looking forward, TV thresholds that have historically occurred only once per year (e.g., 86°F), are projected to become common occurrences within a generation, occurring between 4 and 19 times per year by 2050 and 5 and 52 times per year by 2080, under the RCP 4.5 10th percentile and RCP 8.5 90th percentile, respectively, at LaGuardia (Figure 8). Smaller increases are expected at White Plains.
Figure 8 ■ Distributions showing historical (black line) and 2050 projected (blue and red lines) summer (June–August) daily electric TV at LaGuardia Airport. The 2050 projections show both the RCP 8.5 90th percentile and the RCP 4.5 10th percentile distributions.
The heat index is a typical indicator of “how hot it feels,” which considers the combined effect of air temperature and relative humidity. The index assesses health risks associated with overheating, including for Con Edison employees working under hot conditions. Looking forward, the frequency of occurrence for very high heat index thresholds is projected to increase dramatically through the century. Projections reveal that the number of days per year when the heat index equals or exceeds 103°F at LaGuardia could increase to between 7 and 26 days by 2050 under the RCP 4.5 10th percentile and the RCP 8.5 90th percentile, respectively, compared to only 2 days historically.
8 Temperature variable is calculated using the weighted time integration of the highest daily recorded 3-hour temperature and humidity over a 3-day period. The reference TV for Con Edison is 86°F, which approximates a heat index of 105°F.
0
1
2
3
4
5
6
7
8
55 60 65 70 75 80 85 90 95 100 105
Aver
age
Num
ber o
f Day
s pe
r Yea
r
Temperature Variable (°F)
RCP 8.5 90thPercentile
RCP 4.5 10thPercentile
Historical and Future Climate Projections
22 Climate Change Vulnerability Study
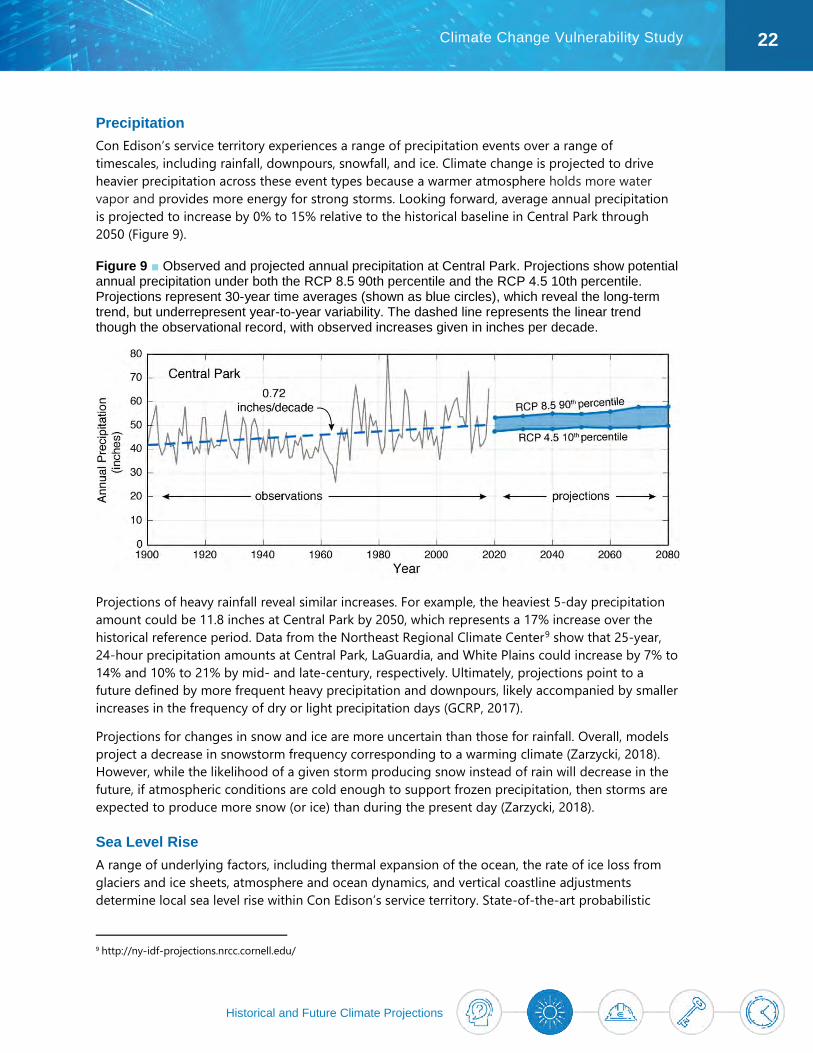
Precipitation Con Edison’s service territory experiences a range of precipitation events over a range of timescales, including rainfall, downpours, snowfall, and ice. Climate change is projected to drive heavier precipitation across these event types because a warmer atmosphere holds more water vapor and provides more energy for strong storms. Looking forward, average annual precipitation is projected to increase by 0% to 15% relative to the historical baseline in Central Park through 2050 (Figure 9).
Figure 9 ■ Observed and projected annual precipitation at Central Park. Projections show potential annual precipitation under both the RCP 8.5 90th percentile and the RCP 4.5 10th percentile. Projections represent 30-year time averages (shown as blue circles), which reveal the long-term trend, but underrepresent year-to-year variability. The dashed line represents the linear trend though the observational record, with observed increases given in inches per decade.
Projections of heavy rainfall reveal similar increases. For example, the heaviest 5-day precipitation amount could be 11.8 inches at Central Park by 2050, which represents a 17% increase over the historical reference period. Data from the Northeast Regional Climate Center9 show that 25-year, 24-hour precipitation amounts at Central Park, LaGuardia, and White Plains could increase by 7% to 14% and 10% to 21% by mid- and late-century, respectively. Ultimately, projections point to a future defined by more frequent heavy precipitation and downpours, likely accompanied by smaller increases in the frequency of dry or light precipitation days (GCRP, 2017).
Projections for changes in snow and ice are more uncertain than those for rainfall. Overall, models project a decrease in snowstorm frequency corresponding to a warming climate (Zarzycki, 2018). However, while the likelihood of a given storm producing snow instead of rain will decrease in the future, if atmospheric conditions are cold enough to support frozen precipitation, then storms are expected to produce more snow (or ice) than during the present day (Zarzycki, 2018).
Sea Level Rise A range of underlying factors, including thermal expansion of the ocean, the rate of ice loss from glaciers and ice sheets, atmosphere and ocean dynamics, and vertical coastline adjustments determine local sea level rise within Con Edison’s service territory. State-of-the-art probabilistic
9 http://ny-idf-projections.nrcc.cornell.edu/
Historical and Future Climate Projections
23 Climate Change Vulnerability Study
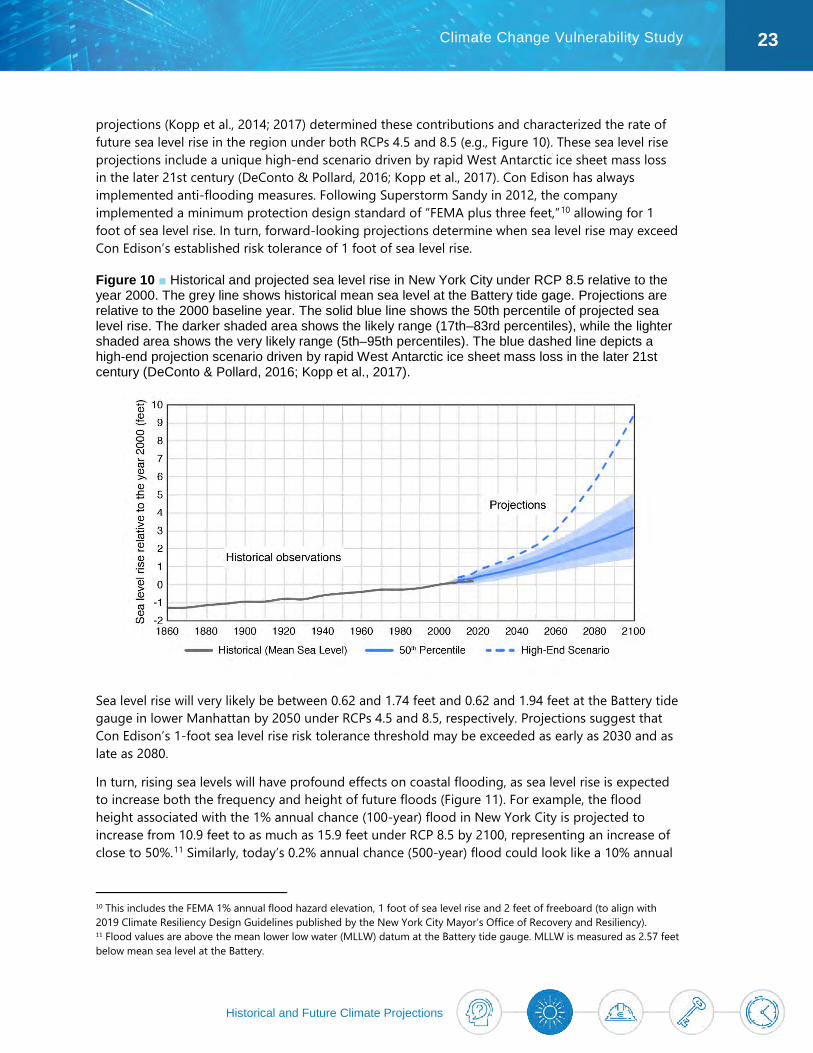
projections (Kopp et al., 2014; 2017) determined these contributions and characterized the rate of future sea level rise in the region under both RCPs 4.5 and 8.5 (e.g., Figure 10). These sea level rise projections include a unique high-end scenario driven by rapid West Antarctic ice sheet mass loss in the later 21st century (DeConto & Pollard, 2016; Kopp et al., 2017). Con Edison has always implemented anti-flooding measures. Following Superstorm Sandy in 2012, the company implemented a minimum protection design standard of “FEMA plus three feet,”10 allowing for 1 foot of sea level rise. In turn, forward-looking projections determine when sea level rise may exceed Con Edison’s established risk tolerance of 1 foot of sea level rise.
Figure 10 ■ Historical and projected sea level rise in New York City under RCP 8.5 relative to the year 2000. The grey line shows historical mean sea level at the Battery tide gage. Projections are relative to the 2000 baseline year. The solid blue line shows the 50th percentile of projected sea level rise. The darker shaded area shows the likely range (17th–83rd percentiles), while the lighter shaded area shows the very likely range (5th–95th percentiles). The blue dashed line depicts a high-end projection scenario driven by rapid West Antarctic ice sheet mass loss in the later 21st century (DeConto & Pollard, 2016; Kopp et al., 2017).
Sea level rise will very likely be between 0.62 and 1.74 feet and 0.62 and 1.94 feet at the Battery tide gauge in lower Manhattan by 2050 under RCPs 4.5 and 8.5, respectively. Projections suggest that Con Edison’s 1-foot sea level rise risk tolerance threshold may be exceeded as early as 2030 and as late as 2080.
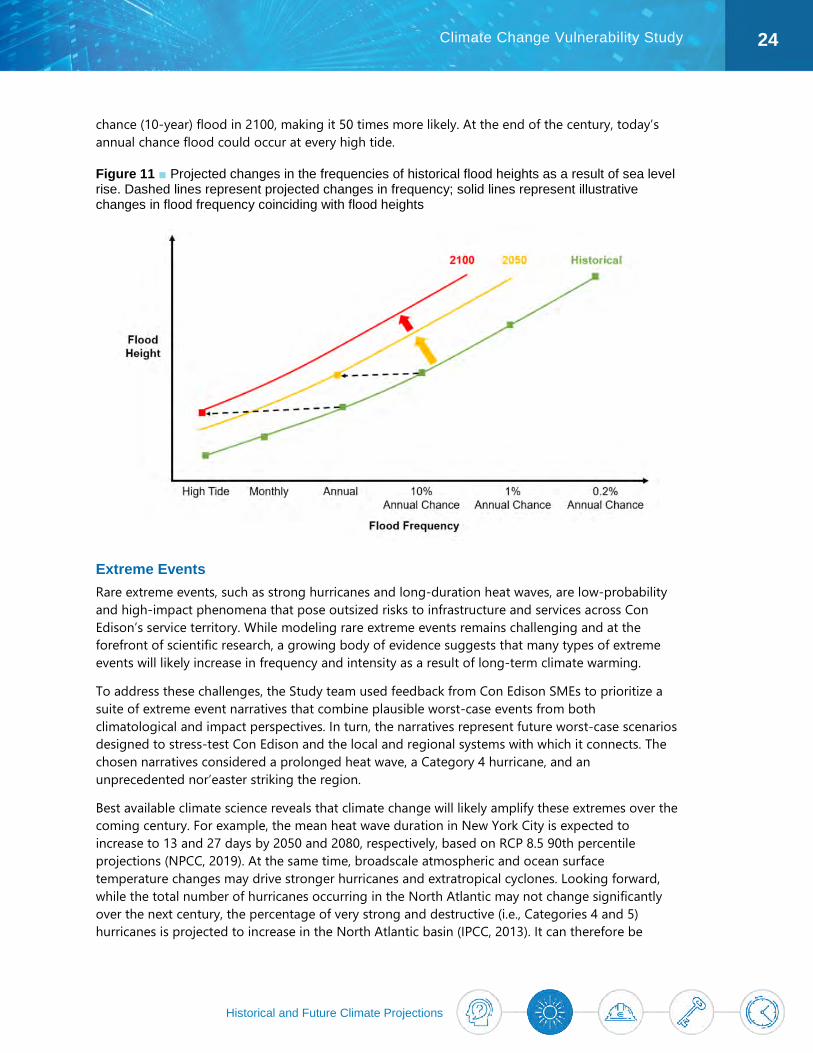
In turn, rising sea levels will have profound effects on coastal flooding, as sea level rise is expected to increase both the frequency and height of future floods (Figure 11). For example, the flood height associated with the 1% annual chance (100-year) flood in New York City is projected to increase from 10.9 feet to as much as 15.9 feet under RCP 8.5 by 2100, representing an increase of close to 50%.11 Similarly, today’s 0.2% annual chance (500-year) flood could look like a 10% annual
10 This includes the FEMA 1% annual flood hazard elevation, 1 foot of sea level rise and 2 feet of freeboard (to align with 2019 Climate Resiliency Design Guidelines published by the New York City Mayor’s Office of Recovery and Resiliency). 11 Flood values are above the mean lower low water (MLLW) datum at the Battery tide gauge. MLLW is measured as 2.57 feet below mean sea level at the Battery.
Historical and Future Climate Projections
24 Climate Change Vulnerability Study
chance (10-year) flood in 2100, making it 50 times more likely. At the end of the century, today’s annual chance flood could occur at every high tide.
Figure 11 ■ Projected changes in the frequencies of historical flood heights as a result of sea level rise. Dashed lines represent projected changes in frequency; solid lines represent illustrative changes in flood frequency coinciding with flood heights
Extreme Events Rare extreme events, such as strong hurricanes and long-duration heat waves, are low-probability and high-impact phenomena that pose outsized risks to infrastructure and services across Con Edison’s service territory. While modeling rare extreme events remains challenging and at the forefront of scientific research, a growing body of evidence suggests that many types of extreme events will likely increase in frequency and intensity as a result of long-term climate warming.
To address these challenges, the Study team used feedback from Con Edison SMEs to prioritize a suite of extreme event narratives that combine plausible worst-case events from both climatological and impact perspectives. In turn, the narratives represent future worst-case scenarios designed to stress-test Con Edison and the local and regional systems with which it connects. The chosen narratives considered a prolonged heat wave, a Category 4 hurricane, and an unprecedented nor’easter striking the region.
Best available climate science reveals that climate change will likely amplify these extremes over the coming century. For example, the mean heat wave duration in New York City is expected to increase to 13 and 27 days by 2050 and 2080, respectively, based on RCP 8.5 90th percentile projections (NPCC, 2019). At the same time, broadscale atmospheric and ocean surface temperature changes may drive stronger hurricanes and extratropical cyclones. Looking forward, while the total number of hurricanes occurring in the North Atlantic may not change significantly over the next century, the percentage of very strong and destructive (i.e., Categories 4 and 5) hurricanes is projected to increase in the North Atlantic basin (IPCC, 2013). It can therefore be
Historical and Future Climate Projections
25 Climate Change Vulnerability Study
argued that climate change could make it more likely for one of these storms to impact the New York Metropolitan Region, although the most dominant factor will remain unpredictable climate and weather variability (Horton & Liu, 2014). Finally, some recent studies project a 20% to 40% increase in nor’easter strengthening (i.e., producing the types of storms with destructive winds) immediately inland of the Atlantic coast by late-century, suggesting stronger storms may more frequently impact the New York Metropolitan Region with heavy precipitation, wind, and storm surge (Colle et al., 2013)
Signposts: Monitoring and Climate Science Updates Understanding Con Edison’s vulnerabilities to climate change and adapting to those changes over time require a robust monitoring strategy. Climate change evolves through time, meaning that the current spread of potential future climate outcomes produced by models will eventually converge on a smaller set of climate realizations. To keep up with this evolution, a range of signposts are required to sufficiently gauge relevant rates of change and best prepare Con Edison for the most likely climate future.
An awareness of past and present climate conditions in Con Edison’s service territory is critical for understanding the trajectory of climate change. Con Edison currently operates a number of stations that monitor climate variables and is finalizing plans to expand the number of monitoring locations. Increasing observations from monitoring stations will help measure both local climate variations and climate change through time, informing Con Edison’s climate resilience planning. Citywide observations of variables, such as hourly temperatures, precipitation, humidity, wind speed, and sea level, are paramount to building a broad and usable set of guiding measurements. With accurate and up-to-date data on these variables, Con Edison can better monitor both changing conditions and potential points of vulnerability.
Con Edison can supplement monitoring through a regularly updated understanding of the best available projections as models and expert knowledge evolve over time. Climate projections continually improve as the scientific community better understands the physical, chemical, and biological processes governing Earth’s climate and incorporates them into predictive models. Ultimately, Con Edison wants to draw on the best available data and projections that are driven by scientific consensus, but also are accessible and applicable to company needs. Signposts for updating climate science used to inform potential Con Edison vulnerabilities include major science advancements, such as the release of the new Coupled Model Intercomparison Project (CMIP) projections and their integration and validation in new IPCC, NPCC, and National Climate Assessment (NCA) reports. These assessments include updated probabilistic climate projections representing model advancements, the best available science regarding difficult-to-model extreme events, and literature reviews reflecting the current state of science as guided by leading experts. Such signposts could justify Con Edison updating their climate projections of record to reflect the best available science or projections that represent a significant departure from previous understanding. Historically, major scientific reports, such as the IPCC, have been released about every 6 to 7 years, which provide a potential constraint on how frequently Con Edison’s understanding of climate change within the service territory might be revisited.
Existing Efforts and Practices to Manage Risks under a Changing Climate
26 Climate Change Vulnerability Study
Existing Efforts and Practices to Manage Risks Under a Changing Climate Although this Study is Con Edison’s first comprehensive assessment of climate change vulnerabilities, Con Edison has already undertaken a range of measures to increase the resiliency of its system. Lessons learned and vulnerabilities exposed during past events, most recently Superstorm Sandy (2012) and the back-to-back nor’easters (winter storms Riley and Quinn, 2018), resulted in significant capital investments to harden the system.
In addition, as Con Edison invests in the system of the future—one with greater monitoring capabilities, flexibility, and reliability—it is simultaneously building a system that is more resilient to extreme weather events and climate change. For example, grid modernization will both increase efficiency and enhance monitoring capabilities by employing new technology and modes of data acquisition. Con Edison is planning to support numerous grid modernization initiatives that target energy storage technologies, communications systems, distributed energy resources infrastructure and management, complex data processing, and advanced grid-edge sensors (Con Edison, 2019). Con Edison additionally plans to modernize its Control Center to assume more proactive and centralized management of its complex distribution grid. Throughout these modernization initiatives, the company remains in close collaboration with the City of New York.
Con Edison also conducts targeted annual updates to its system to ensure capacity and reliability. These annual updates help the company keep pace in real time with changes in some key hazards. For example, when conducting electric load relief planning, Con Edison incorporates load forecasts that use an annually updated set of TV data. Although these forecasts are not grounded in future projections that consider climate change, they do account for the most recent climate trends and, as such, allow the company to stay in stride with the most current data.
Con Edison’s previous adaptation measures have made targeted improvements in (1) physical infrastructure, (2) data collection and monitoring, and (3) emergency preparedness. The following measures are illustrative of these targeted improvements, but are not meant to be exhaustive of the efforts that Con Edison has undertaken:
Physical Infrastructure • Adopting the Dutch approach of “defense in depth” after Superstorm Sandy to protect all critical
and vulnerable system components from coastal flooding risks, including the following:
Existing Efforts and Practices to Manage Risks under a Changing Climate
27 Climate Change Vulnerability Study
− Upgrading and increasing the number of flood barriers and other protective structures − Reinforcing tunnels − Replacing equipment with submersible equivalents in flood zones (e.g., targeted main
replacement program, gas system) − Installing pumps and elevating infrastructure behind flood walls
• Protecting or elevating critical electrical infrastructure to the Federal Emergency Management Agency (FEMA) 100-year flood elevation plus 3 feet to account for sea level rise and freeboard during coastal storms
• Undertaking a targeted main replacement program that addresses low-pressure gas mains in low-lying areas, as well as other potentially vulnerable gas mains
• Installing isolation devices to limit the impact of damaged infrastructure on customers by de-energizing more granular sections of the system, when necessary
• Engaging innovative technologies to reduce the impact of extreme weather on electric distribution systems and quicken the recovery, including the following: − Demand response technologies that more efficiently regulate load − Automated splicing systems that reduce feeder processing times
Data Collection and Monitoring • Developing programs that employ machine learning and remote monitoring to identify areas of
heightened vulnerability in Con Edison’s systems, including the following: − Leak-prone areas of the gas distribution system − Gas system drip pots that require draining
• Initiating a more diligent inspection system that effectively assesses the functionality of assets, as well as their exposure to potential hazards (e.g., nearby vegetation), including the following: − Underground network transformers and protectors − Underground structures − Flushing of flood zone vaults − Rapid assessments of overhead feeders − Overhead system pole-by-pole inspection for specification compliance
• Future deployment of advanced metering infrastructure (AMI) throughout the service territory has the potential to both improve information flow to customers and help absorb the impacts of extreme events. Specifically, AMI might be able to rapidly shed load on a targeted network to help ensure demand does not exceed supply, which reduces potential damages and likelihood of network-wide outages in the event of an extreme event.
Existing Efforts and Practices to Manage Risks under a Changing Climate
28 Climate Change Vulnerability Study
Emergency Preparedness • Improving contractor and material bases for post-storm repair crews and equipment, including
the following: − Expanding and diversifying spare material inventories − Ensuring that all spare materials are housed in safe locations
• Conducting post-event debriefings to understand the impact of weather conditions on system performance
• Engaging with major telecommunications providers and enhancing communications systems among customer networks
• Facilitating equipment-sharing programs across New York State to ensure access to supplies during emergency response
Con Edison recognizes that the drivers behind future planning operations are inherently uncertain and is committed to both closely monitoring key signposts and continuously updating company investment plans and priorities.
Vulnerabilities, a Resilience Management Framework, and Adaptation Options
29 Climate Change Vulnerability Study
Vulnerabilities, a Resilience Management Framework, and Adaptation Options Con Edison may face greater vulnerabilities due to future changes in temperature, humidity, precipitation, sea level rise, and extreme weather events. To understand this, the Study team evaluated key vulnerabilities of Con Edison’s present-day electric, gas, and steam systems under a changing climate. The physical assets, operations, and planning of each system are uniquely vulnerable. In turn, building a detailed understanding of key vulnerabilities is an important step toward identifying priority adaptation measures.
Resilience Management Framework Under a changing climate, Con Edison will likely experience the increasing frequency and intensity of both gradual climate changes and extreme events. In response, the Study team developed a resilience management framework (Figure 12) to outline how a comprehensive set of adaptation strategies would mitigate future climate risks. The framework encompasses investments to better withstand changes in climate, absorb impacts from outage-inducing events, recover quickly, and advance to a better state. The “withstand” component of this framework prepares for both gradual (chronic) and extreme climate risks through resilience actions throughout the life cycle of assets. As such, many of the adaptation strategies identified in the following sections fall under the category of systematically bolstering Con Edison’s ability to withstand future climate risks. Investments to increase the capacity to withstand also provide critical co-benefits, such as enhanced blue-sky functionality and the reliability of Con Edison’s system. The resilience management framework facilitates long-term adaptation and creates positive resilience feedback so that Con Edison’s system achieves better functionality through time. To succeed, each component of a resilient system requires proactive planning and investments.
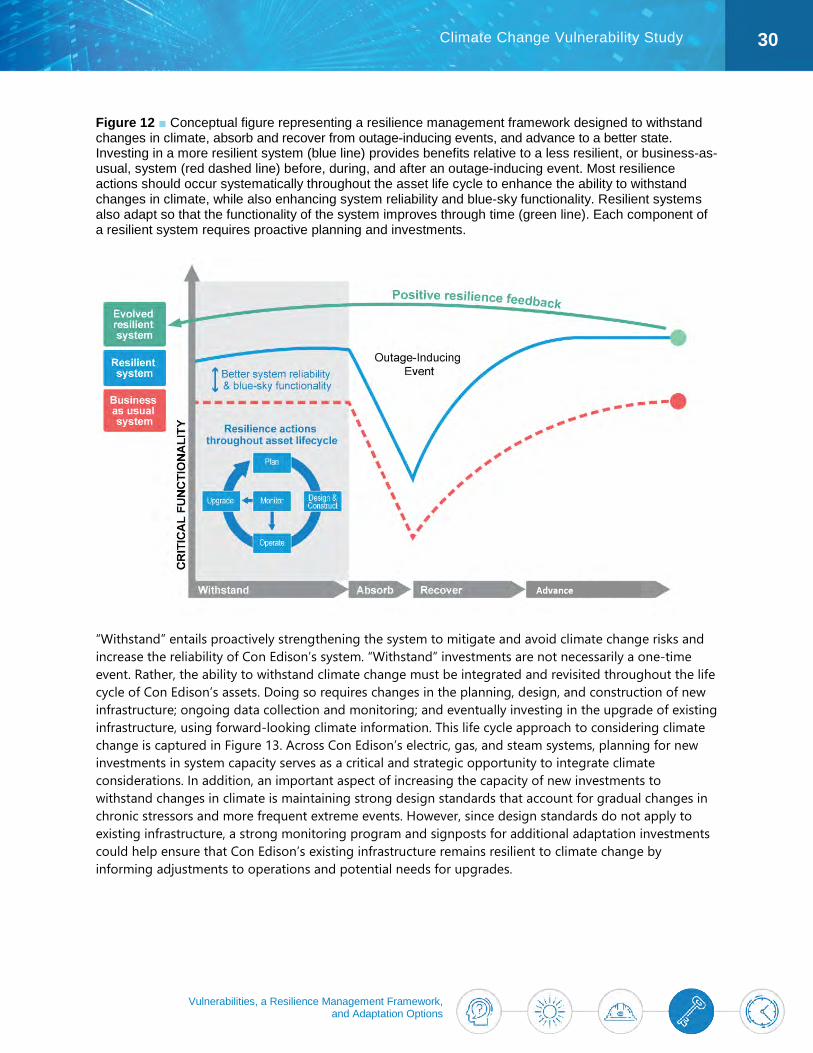
Vulnerabilities, a Resilience Management Framework, and Adaptation Options
30 Climate Change Vulnerability Study
Figure 12 ■ Conceptual figure representing a resilience management framework designed to withstand changes in climate, absorb and recover from outage-inducing events, and advance to a better state. Investing in a more resilient system (blue line) provides benefits relative to a less resilient, or business-as-usual, system (red dashed line) before, during, and after an outage-inducing event. Most resilience actions should occur systematically throughout the asset life cycle to enhance the ability to withstand changes in climate, while also enhancing system reliability and blue-sky functionality. Resilient systems also adapt so that the functionality of the system improves through time (green line). Each component of a resilient system requires proactive planning and investments.
“Withstand” entails proactively strengthening the system to mitigate and avoid climate change risks and increase the reliability of Con Edison’s system. “Withstand” investments are not necessarily a one-time event. Rather, the ability to withstand climate change must be integrated and revisited throughout the life cycle of Con Edison’s assets. Doing so requires changes in the planning, design, and construction of new infrastructure; ongoing data collection and monitoring; and eventually investing in the upgrade of existing infrastructure, using forward-looking climate information. This life cycle approach to considering climate change is captured in Figure 13. Across Con Edison’s electric, gas, and steam systems, planning for new investments in system capacity serves as a critical and strategic opportunity to integrate climate considerations. In addition, an important aspect of increasing the capacity of new investments to withstand changes in climate is maintaining strong design standards that account for gradual changes in chronic stressors and more frequent extreme events. However, since design standards do not apply to existing infrastructure, a strong monitoring program and signposts for additional adaptation investments could help ensure that Con Edison’s existing infrastructure remains resilient to climate change by informing adjustments to operations and potential needs for upgrades.
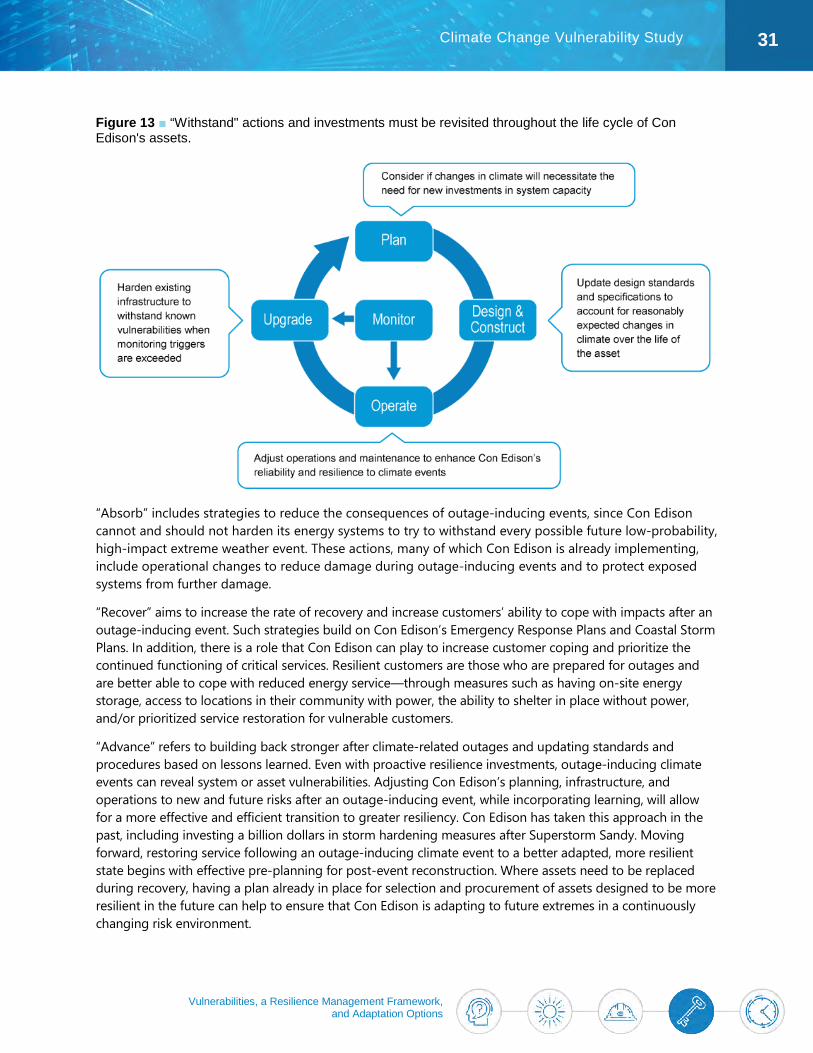
Vulnerabilities, a Resilience Management Framework, and Adaptation Options
31 Climate Change Vulnerability Study
Figure 13 ■ “Withstand" actions and investments must be revisited throughout the life cycle of Con Edison's assets.
“Absorb” includes strategies to reduce the consequences of outage-inducing events, since Con Edison cannot and should not harden its energy systems to try to withstand every possible future low-probability, high-impact extreme weather event. These actions, many of which Con Edison is already implementing, include operational changes to reduce damage during outage-inducing events and to protect exposed systems from further damage.
“Recover” aims to increase the rate of recovery and increase customers’ ability to cope with impacts after an outage-inducing event. Such strategies build on Con Edison’s Emergency Response Plans and Coastal Storm Plans. In addition, there is a role that Con Edison can play to increase customer coping and prioritize the continued functioning of critical services. Resilient customers are those who are prepared for outages and are better able to cope with reduced energy service—through measures such as having on-site energy storage, access to locations in their community with power, the ability to shelter in place without power, and/or prioritized service restoration for vulnerable customers.
“Advance” refers to building back stronger after climate-related outages and updating standards and procedures based on lessons learned. Even with proactive resilience investments, outage-inducing climate events can reveal system or asset vulnerabilities. Adjusting Con Edison’s planning, infrastructure, and operations to new and future risks after an outage-inducing event, while incorporating learning, will allow for a more effective and efficient transition to greater resiliency. Con Edison has taken this approach in the past, including investing a billion dollars in storm hardening measures after Superstorm Sandy. Moving forward, restoring service following an outage-inducing climate event to a better adapted, more resilient state begins with effective pre-planning for post-event reconstruction. Where assets need to be replaced during recovery, having a plan already in place for selection and procurement of assets designed to be more resilient in the future can help to ensure that Con Edison is adapting to future extremes in a continuously changing risk environment.
Vulnerabilities, a Resilience Management Framework, and Adaptation Options
32 Climate Change Vulnerability Study
Implementation of adaptation strategies throughout all of these phases will need to be adjusted over time to manage for acceptable levels of risk despite uncertainties about future conditions. The flexible adaptation pathways approach, described in further detail in the subsequent section, ensures the adaptability of adaptation strategies over time as more information about climate change and external conditions becomes available.
All Commodities (Electricity, Gas, and Steam)
Vulnerabilities The Study team identified priority hazards for each of Con Edison’s commodity systems (electric, gas, and steam) and found that several hazards were priorities across all three systems, although these hazards present unique vulnerabilities to the various assets within each system. The hazards common to all three systems are heat index, precipitation, sea level rise and storm surge, and extreme and multi-hazard events. These are discussed below. System-specific vulnerabilities are subsequently discussed in separate sections.
Heat Index Worker safety may be a point of vulnerability if heat index values rise as projected. The Occupational Safety and Health Administration has set a threshold of 103°F for high heat index risk for people working under hot conditions. During the base period (1998–2017), there were 2 days per year with maximum heat greater than or equal to 103°F (but below 115°F). Under a lower emissions climate scenario (RCP 4.5 10th percentile), the 103°F threshold may be met 5 to 7 days per year by 2050; under a higher emissions scenario (RCP 8.5 90th percentile), this may occur 14 to 20 days per year by 2050. This poses a potential health threat to all Con Edison workers whose duties require outdoor labor.
Projected increases in heat index may also affect cooling equipment across Con Edison’s systems, including the HVAC units for Con Edison buildings, air cooling towers for the electric system, and a water cooling tower for Con Edison’s East River Steam Generating Plant. In order to supply sufficient cooling to its systems in 2080, Con Edison’s HVAC systems will have to increase their capacity by 11% due to projected increases in dry bulb temperature. These systems have a roughly 15-year life span and therefore can be upgraded during routine replacements at an incremental cost of $1.3 million for 157 units. Similarly, Con Edison’s cooling towers will have to increase their capacity by 30% by 2050. Cooling towers have a 20- to 35-year life span, allowing them to be upgraded during routine replacements at an incremental cost of $1.1 million for 19 cooling towers at 13 sites.
Precipitation The Study team conducted an analysis of the physical and operational vulnerabilities of Con Edison’s steam system, gas system, and transmission and substation components of the electric system. Findings indicated that all underground assets are vulnerable to flooding damage (i.e., water pooling, intrusion, or inundation) from heavy precipitation occurring over a short period of time. Specific vulnerabilities and their relevant thresholds vary significantly by commodity and, as such, are outlined in their respective sections.
Vulnerabilities, a Resilience Management Framework, and Adaptation Options
33 Climate Change Vulnerability Study
Sea Level Rise and Storm Surge The Study team broke down evaluation of priority vulnerabilities related to sea level rise into two components.
The first component focuses on design standards for new infrastructure. The Study team assessed Con Edison’s coastal flood protection standards for robustness to projected sea level rise. Con Edison’s current design standard for coastal flood protections includes the FEMA 1% annual flood hazard elevation, 1 foot for sea level rise, and 2 feet of freeboard, which aligns with New York City’s Climate Resilience Design Guidelines for critical infrastructure and water elevations that Con Edison experienced during Superstorm Sandy. Under high-end sea level rise (e.g., due to either rapid ice loss from the West Antarctic Ice Sheet corresponding to Kopp et al., 2017, or RCP 8.5 95th percentile projections corresponding to Kopp et al., 2014), the existing 1 foot sea level rise risk tolerance threshold could be exceeded by 2030; however, under more likely scenarios, the current threshold could be exceeded between 2040 and 2080.12 The probability that sea level rise will exceed the 1-foot sea level rise risk tolerance by 2020 is under 10%; that increases to 65% to 70% by 2050, and to 100% by the 2080s.
The second evaluation component identified specific physical vulnerabilities of Con Edison’s existing assets to impacts related to sea level rise, which are described by commodity below.
Extreme and Multi-Hazard Events Assets across all systems are vulnerable to possible damage from extreme event flooding. Storm surge driven by an extreme hurricane event (i.e., a Category 4 hurricane) has the potential to flood both aboveground and belowground assets. Specific asset damage varies by commodity and is outlined in the commodity-specific sections. In addition, flooding from ice-melt and snowmelt may cause significant damage to assets across all commodities, especially if the melt contains corrosive road salts.
On an operational level, increasing frequency and intensity of extreme weather events may exceed Con Edison’s currently robust emergency preparedness efforts. Con Edison’s extreme weather response protocols are specified in the company’s hazard-specific Emergency Response Plans and Coastal Storm Plans for electric, steam, and gas systems. Con Edison’s current “full-scale” response, which calls for all Con Edison resources and extensive mutual assistance, is initiated when the number of customers out of service reaches approximately 100,000. However, low-probability extreme events can increase customer outages and outage durations by an order of magnitude, outpacing current levels of emergency planning and preparedness, as shown in Figure 14.
12 The sea level rise projections use a baseline year of 2000. For more details on these projections and how they relate to Con Edison’s design standards, see Appendix 4.
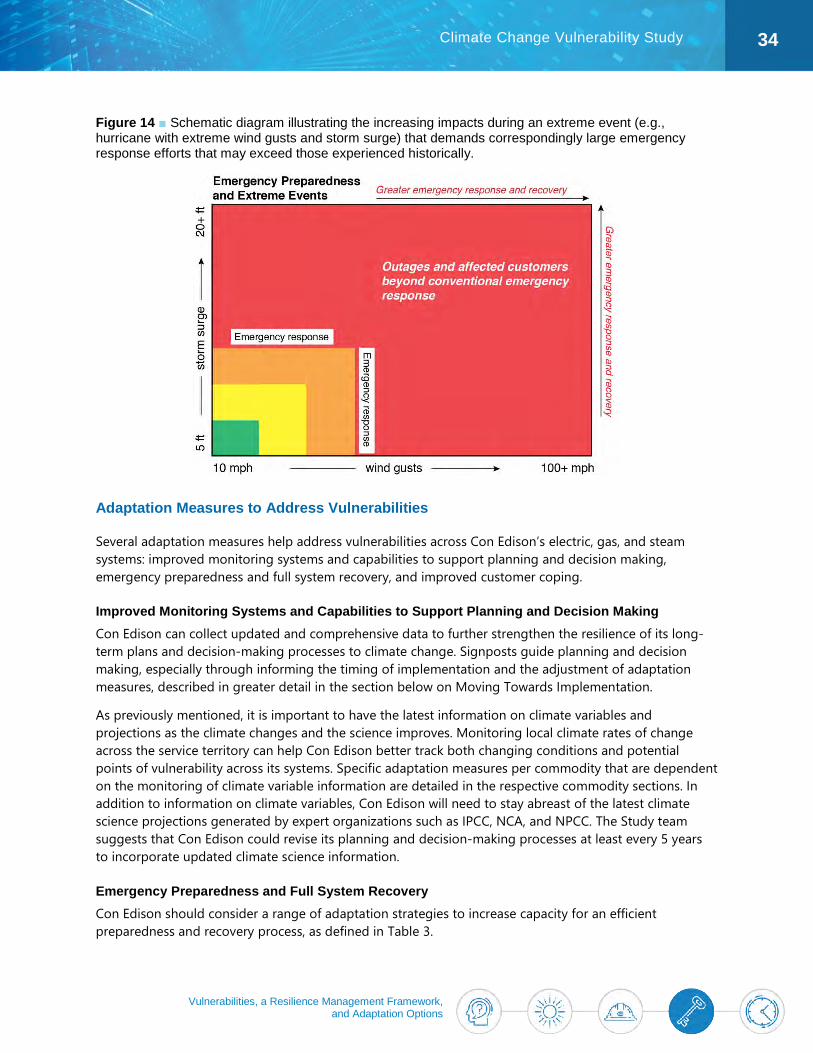
Vulnerabilities, a Resilience Management Framework, and Adaptation Options
34 Climate Change Vulnerability Study
Figure 14 ■ Schematic diagram illustrating the increasing impacts during an extreme event (e.g., hurricane with extreme wind gusts and storm surge) that demands correspondingly large emergency response efforts that may exceed those experienced historically.
Adaptation Measures to Address Vulnerabilities
Several adaptation measures help address vulnerabilities across Con Edison’s electric, gas, and steam systems: improved monitoring systems and capabilities to support planning and decision making, emergency preparedness and full system recovery, and improved customer coping.
Improved Monitoring Systems and Capabilities to Support Planning and Decision Making Con Edison can collect updated and comprehensive data to further strengthen the resilience of its long-term plans and decision-making processes to climate change. Signposts guide planning and decision making, especially through informing the timing of implementation and the adjustment of adaptation measures, described in greater detail in the section below on Moving Towards Implementation.
As previously mentioned, it is important to have the latest information on climate variables and projections as the climate changes and the science improves. Monitoring local climate rates of change across the service territory can help Con Edison better track both changing conditions and potential points of vulnerability across its systems. Specific adaptation measures per commodity that are dependent on the monitoring of climate variable information are detailed in the respective commodity sections. In addition to information on climate variables, Con Edison will need to stay abreast of the latest climate science projections generated by expert organizations such as IPCC, NCA, and NPCC. The Study team suggests that Con Edison could revise its planning and decision-making processes at least every 5 years to incorporate updated climate science information.
Emergency Preparedness and Full System Recovery Con Edison should consider a range of adaptation strategies to increase capacity for an efficient preparedness and recovery process, as defined in Table 3.
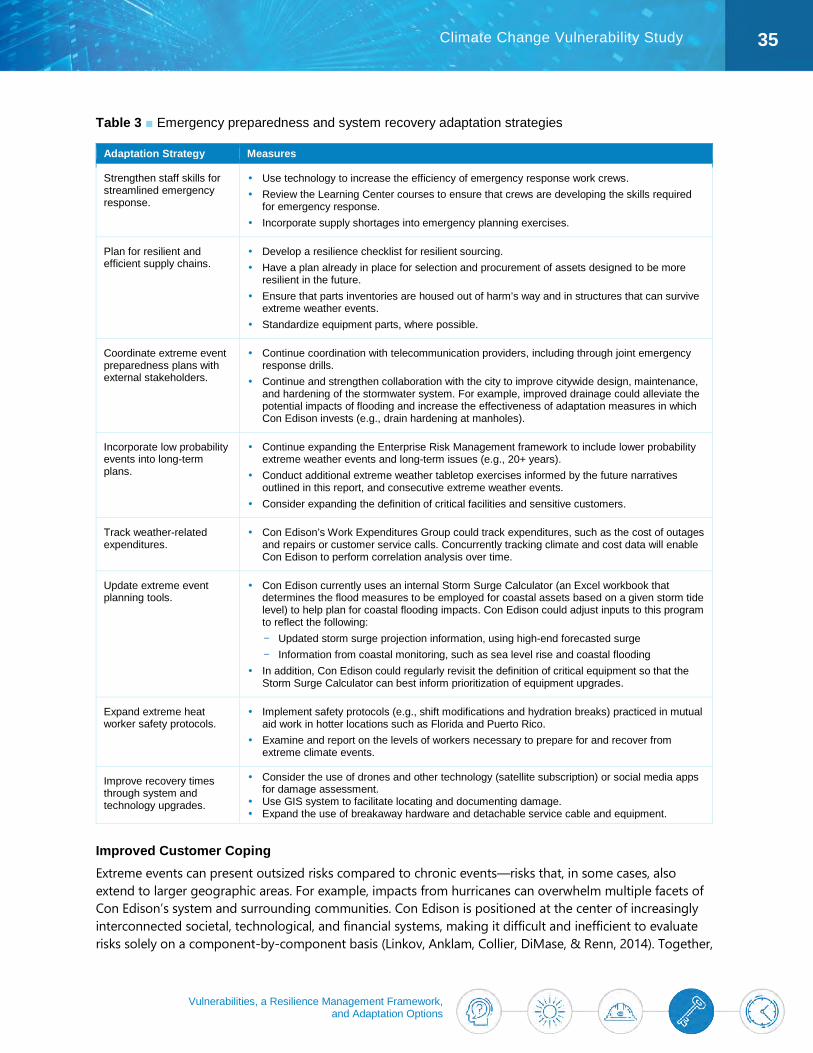
Vulnerabilities, a Resilience Management Framework, and Adaptation Options
35 Climate Change Vulnerability Study
Table 3 ■ Emergency preparedness and system recovery adaptation strategies
Adaptation Strategy Measures
Strengthen staff skills for streamlined emergency response.
Use technology to increase the efficiency of emergency response work crews. Review the Learning Center courses to ensure that crews are developing the skills required
for emergency response. Incorporate supply shortages into emergency planning exercises.
Plan for resilient and efficient supply chains.
Develop a resilience checklist for resilient sourcing. Have a plan already in place for selection and procurement of assets designed to be more
resilient in the future. Ensure that parts inventories are housed out of harm’s way and in structures that can survive
extreme weather events. Standardize equipment parts, where possible.
Coordinate extreme event preparedness plans with external stakeholders.
Continue coordination with telecommunication providers, including through joint emergency response drills.
Continue and strengthen collaboration with the city to improve citywide design, maintenance, and hardening of the stormwater system. For example, improved drainage could alleviate the potential impacts of flooding and increase the effectiveness of adaptation measures in which Con Edison invests (e.g., drain hardening at manholes).
Incorporate low probability events into long-term plans.
Continue expanding the Enterprise Risk Management framework to include lower probability extreme weather events and long-term issues (e.g., 20+ years).
Conduct additional extreme weather tabletop exercises informed by the future narratives outlined in this report, and consecutive extreme weather events.
Consider expanding the definition of critical facilities and sensitive customers.
Track weather-related expenditures.
Con Edison’s Work Expenditures Group could track expenditures, such as the cost of outages and repairs or customer service calls. Concurrently tracking climate and cost data will enable Con Edison to perform correlation analysis over time.
Update extreme event planning tools.
Con Edison currently uses an internal Storm Surge Calculator (an Excel workbook that determines the flood measures to be employed for coastal assets based on a given storm tide level) to help plan for coastal flooding impacts. Con Edison could adjust inputs to this program to reflect the following: − Updated storm surge projection information, using high-end forecasted surge − Information from coastal monitoring, such as sea level rise and coastal flooding
In addition, Con Edison could regularly revisit the definition of critical equipment so that the Storm Surge Calculator can best inform prioritization of equipment upgrades.
Expand extreme heat worker safety protocols.
Implement safety protocols (e.g., shift modifications and hydration breaks) practiced in mutual aid work in hotter locations such as Florida and Puerto Rico.
Examine and report on the levels of workers necessary to prepare for and recover from extreme climate events.
Improve recovery times through system and technology upgrades.
Consider the use of drones and other technology (satellite subscription) or social media apps for damage assessment.
Use GIS system to facilitate locating and documenting damage. Expand the use of breakaway hardware and detachable service cable and equipment.
Improved Customer Coping Extreme events can present outsized risks compared to chronic events—risks that, in some cases, also extend to larger geographic areas. For example, impacts from hurricanes can overwhelm multiple facets of Con Edison’s system and surrounding communities. Con Edison is positioned at the center of increasingly interconnected societal, technological, and financial systems, making it difficult and inefficient to evaluate risks solely on a component-by-component basis (Linkov, Anklam, Collier, DiMase, & Renn, 2014). Together,
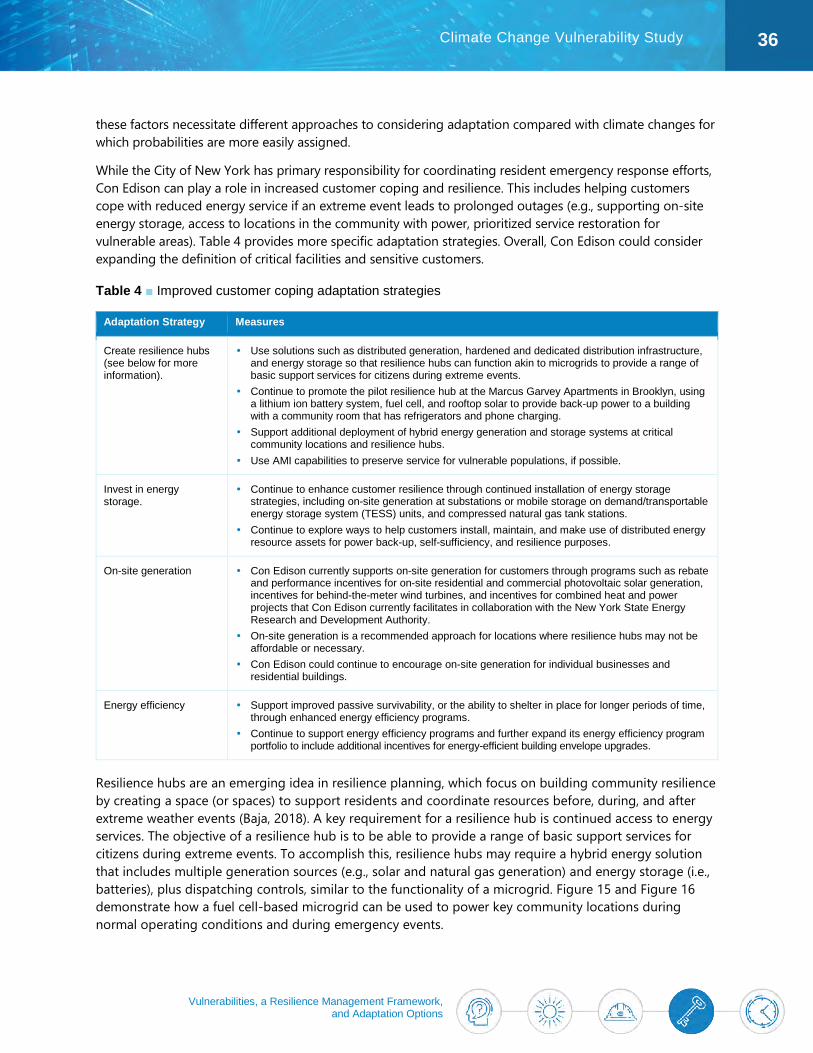
Vulnerabilities, a Resilience Management Framework, and Adaptation Options
36 Climate Change Vulnerability Study
these factors necessitate different approaches to considering adaptation compared with climate changes for which probabilities are more easily assigned.
While the City of New York has primary responsibility for coordinating resident emergency response efforts, Con Edison can play a role in increased customer coping and resilience. This includes helping customers cope with reduced energy service if an extreme event leads to prolonged outages (e.g., supporting on-site energy storage, access to locations in the community with power, prioritized service restoration for vulnerable areas). Table 4 provides more specific adaptation strategies. Overall, Con Edison could consider expanding the definition of critical facilities and sensitive customers.
Table 4 ■ Improved customer coping adaptation strategies
Adaptation Strategy Measures
Create resilience hubs (see below for more information).
Use solutions such as distributed generation, hardened and dedicated distribution infrastructure, and energy storage so that resilience hubs can function akin to microgrids to provide a range of basic support services for citizens during extreme events.
Continue to promote the pilot resilience hub at the Marcus Garvey Apartments in Brooklyn, using a lithium ion battery system, fuel cell, and rooftop solar to provide back-up power to a building with a community room that has refrigerators and phone charging.
Support additional deployment of hybrid energy generation and storage systems at critical community locations and resilience hubs.
Use AMI capabilities to preserve service for vulnerable populations, if possible.
Invest in energy storage.
Continue to enhance customer resilience through continued installation of energy storage strategies, including on-site generation at substations or mobile storage on demand/transportable energy storage system (TESS) units, and compressed natural gas tank stations.
Continue to explore ways to help customers install, maintain, and make use of distributed energy resource assets for power back-up, self-sufficiency, and resilience purposes.
On-site generation Con Edison currently supports on-site generation for customers through programs such as rebate and performance incentives for on-site residential and commercial photovoltaic solar generation, incentives for behind-the-meter wind turbines, and incentives for combined heat and power projects that Con Edison currently facilitates in collaboration with the New York State Energy Research and Development Authority.
On-site generation is a recommended approach for locations where resilience hubs may not be affordable or necessary.
Con Edison could continue to encourage on-site generation for individual businesses and residential buildings.
Energy efficiency Support improved passive survivability, or the ability to shelter in place for longer periods of time, through enhanced energy efficiency programs.
Continue to support energy efficiency programs and further expand its energy efficiency program portfolio to include additional incentives for energy-efficient building envelope upgrades.
Resilience hubs are an emerging idea in resilience planning, which focus on building community resilience by creating a space (or spaces) to support residents and coordinate resources before, during, and after extreme weather events (Baja, 2018). A key requirement for a resilience hub is continued access to energy services. The objective of a resilience hub is to be able to provide a range of basic support services for citizens during extreme events. To accomplish this, resilience hubs may require a hybrid energy solution that includes multiple generation sources (e.g., solar and natural gas generation) and energy storage (i.e., batteries), plus dispatching controls, similar to the functionality of a microgrid. Figure 15 and Figure 16 demonstrate how a fuel cell-based microgrid can be used to power key community locations during normal operating conditions and during emergency events.
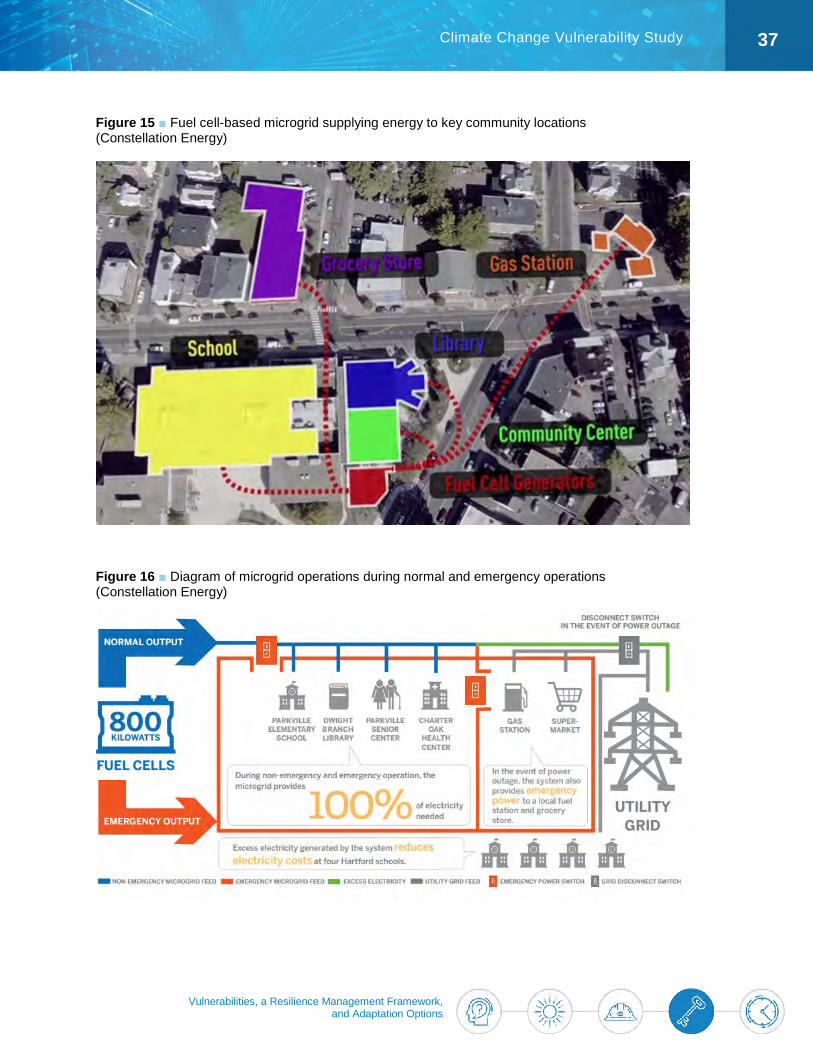
Vulnerabilities, a Resilience Management Framework, and Adaptation Options
37 Climate Change Vulnerability Study
Figure 15 ■ Fuel cell-based microgrid supplying energy to key community locations (Constellation Energy)
Figure 16 ■ Diagram of microgrid operations during normal and emergency operations (Constellation Energy)
Vulnerabilities, a Resilience Management Framework, and Adaptation Options
38 Climate Change Vulnerability Study
Electric System
Electric System Overview Con Edison’s electric service territory includes both New York City and Westchester County, covering an area of 660 square miles and serving 3.3 million customers. Figure 17 depicts a schematic of the Con Edison electric system.
Con Edison’s grid is a delivery system that connects energy sources to customers. While most electricity delivered is produced by large third-party generating stations, distributed energy resources also supply energy to the grid.
Energy produced by generating sources is delivered via the Con Edison transmission system, which includes 430 circuit-miles of overhead transmission lines and the largest underground transmission system in the United States, with 749 circuit-miles of underground cable. The system also includes 39 transmission substations. The high-voltage transmission lines bring power from generating facilities to transmission substations, which supply area substations, where the voltage is stepped down to distribution levels.
Con Edison has two different electric distribution systems—the non-network (primarily overhead) system and the network (primarily underground) system. The network system is segmented into independent geographical and electrical grids supplied by primary feeders at 13 kilovolts (kV) or 27 kV. The non-network system is designed using either overhead autoloops with redundant sources of supply, or 4-kV overhead grids arranged in a network configuration or as underground residential distribution systems designed in loop configurations.

Vulnerabilities, a Resilience Management Framework, and Adaptation Options
39 Climate Change Vulnerability Study
Figure 17 ■ Diagram of the Con Edison Electric System
Electric Vulnerabilities Assets in the electric segment of Con Edison’s business are most vulnerable to climate-induced changes in temperature/humidity and sea level rise. Both climate hazards have already shown their ability to bring about outages or damage assets and interrupt operations and carry the potential for future impacts. More information on specific vulnerabilities for these and other climate stressors is discussed below.
Heat and Temperature Variable (TV) The core electric vulnerabilities for increasing temperature and TV include increased asset deterioration, decreased asset capacity, decreased system reliability, and increased load. Figure 18 illustrates how temperature-related stressors, such as maximum and average air temperature, lead to impacts on the electric system.
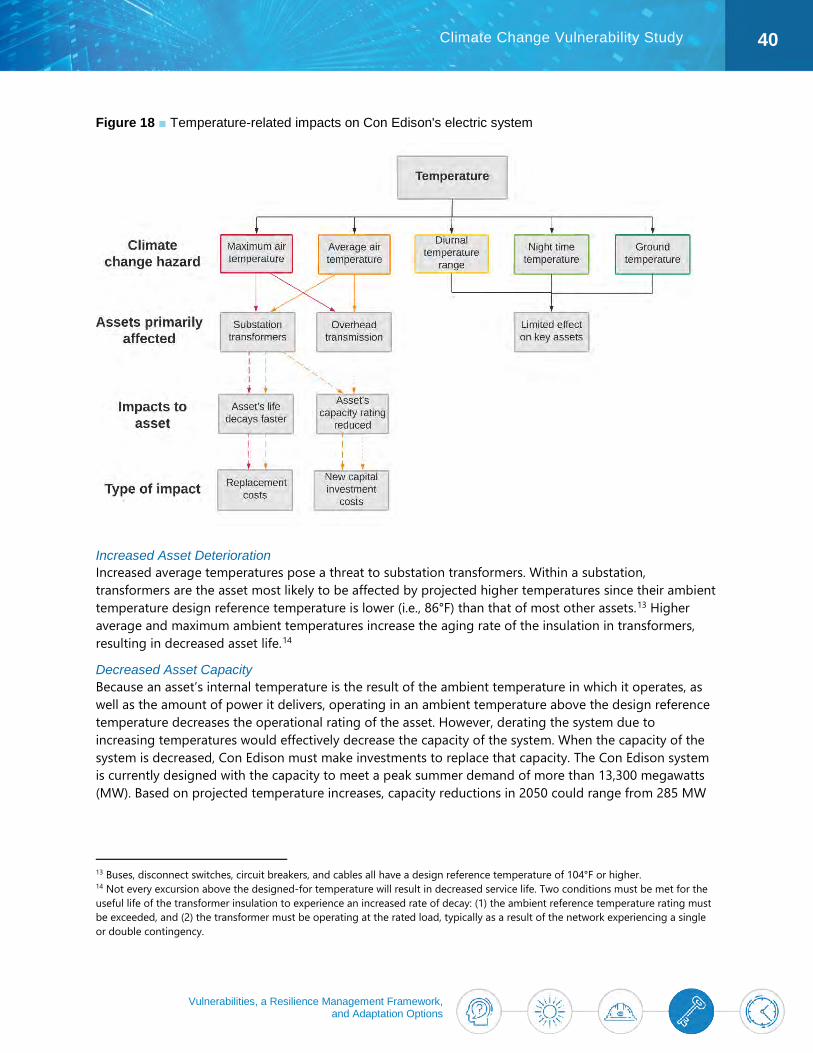
Vulnerabilities, a Resilience Management Framework, and Adaptation Options
40 Climate Change Vulnerability Study
Figure 18 ■ Temperature-related impacts on Con Edison's electric system
Increased Asset Deterioration Increased average temperatures pose a threat to substation transformers. Within a substation, transformers are the asset most likely to be affected by projected higher temperatures since their ambient temperature design reference temperature is lower (i.e., 86°F) than that of most other assets.13 Higher average and maximum ambient temperatures increase the aging rate of the insulation in transformers, resulting in decreased asset life.14
Decreased Asset Capacity Because an asset’s internal temperature is the result of the ambient temperature in which it operates, as well as the amount of power it delivers, operating in an ambient temperature above the design reference temperature decreases the operational rating of the asset. However, derating the system due to increasing temperatures would effectively decrease the capacity of the system. When the capacity of the system is decreased, Con Edison must make investments to replace that capacity. The Con Edison system is currently designed with the capacity to meet a peak summer demand of more than 13,300 megawatts (MW). Based on projected temperature increases, capacity reductions in 2050 could range from 285 MW
13 Buses, disconnect switches, circuit breakers, and cables all have a design reference temperature of 104°F or higher. 14 Not every excursion above the designed-for temperature will result in decreased service life. Two conditions must be met for the useful life of the transformer insulation to experience an increased rate of decay: (1) the ambient reference temperature rating must be exceeded, and (2) the transformer must be operating at the rated load, typically as a result of the network experiencing a single or double contingency.
Vulnerabilities, a Resilience Management Framework, and Adaptation Options
41 Climate Change Vulnerability Study
to 693 MW for overhead transmission, switching stations, area station and sub-transmission, and network transformers.15 This could potentially result in a capital cost of $237 million to $510 million by 2050.
The primary impact of increases in ambient temperatures on overhead transmission lines (assuming peak load) is increased line sag. Insufficient line clearance presents a safety risk should standard measures such as vegetation management not alleviate the risk. If standard measures cannot be applied, the lines would have to be derated and investments would be needed to replace the diminished capabilities of the line.
Decreased System Reliability Increases in TV-related events are expected to affect the electric network and non-network systems by decreasing reliability. Con Edison uses a Network Reliability Index (NRI) model to determine the reliability of the underground distribution networks.16 Con Edison has set an NRI value of 1 per unit (p.u.) as the threshold over which reliability is considered unacceptable. Currently, there are no networks that exceed this standard.
The Study team modeled how the NRI value of each network would change without continued investments in the system. The forward-looking NRI analysis found that with an increase in the frequency and duration of heat waves by mid-century, between 11 and 28 of the networks may not be able to maintain Con Edison’s 1 p.u. standard of reliability by 2050, absent adaptation. Under the higher emissions scenario (RCP 8.5 90th percentile), projected impacts are relatively severe, even by 2030, with up to 21 total networks projected to exceed the NRI threshold by that year, absent adaptation (Figure 19). These deficiencies can be reduced by continuing to make investments to better withstand climate events, which Con Edison has done in the past through measures such as infrastructure hardening and added redundancy, diversity, and flexibility in power delivery. Such measures carry the co-benefit of improving blue-sky functionality and reliability.
Currently, Con Edison replaces paper-insulated, lead-covered (PILC) cables as an effective first line of defense against NRI increases. Con Edison is committed to continued investment in this measure, which will help reduce this heat-related vulnerability in the near term. The Study team also quantified the value of other measures to maintain network reliability, including innovative distribution designs and the use of distributed resources, which can be part of microgrids.
15 The assumed decrease in capacity is 0.7% per °C (0.38% per °F) for substation power transformers, and 1.5% per °C (0.8% per °F) for overhead transmission conductors (Sathaye, 2013). 16 NRI is a Monte Carlo simulation used to predict the performance of a network during a heat wave. The program uses the historical failure rates of the various components/equipment that are in the network, and through probability analysis determines which networks are more likely to experience a shutdown.
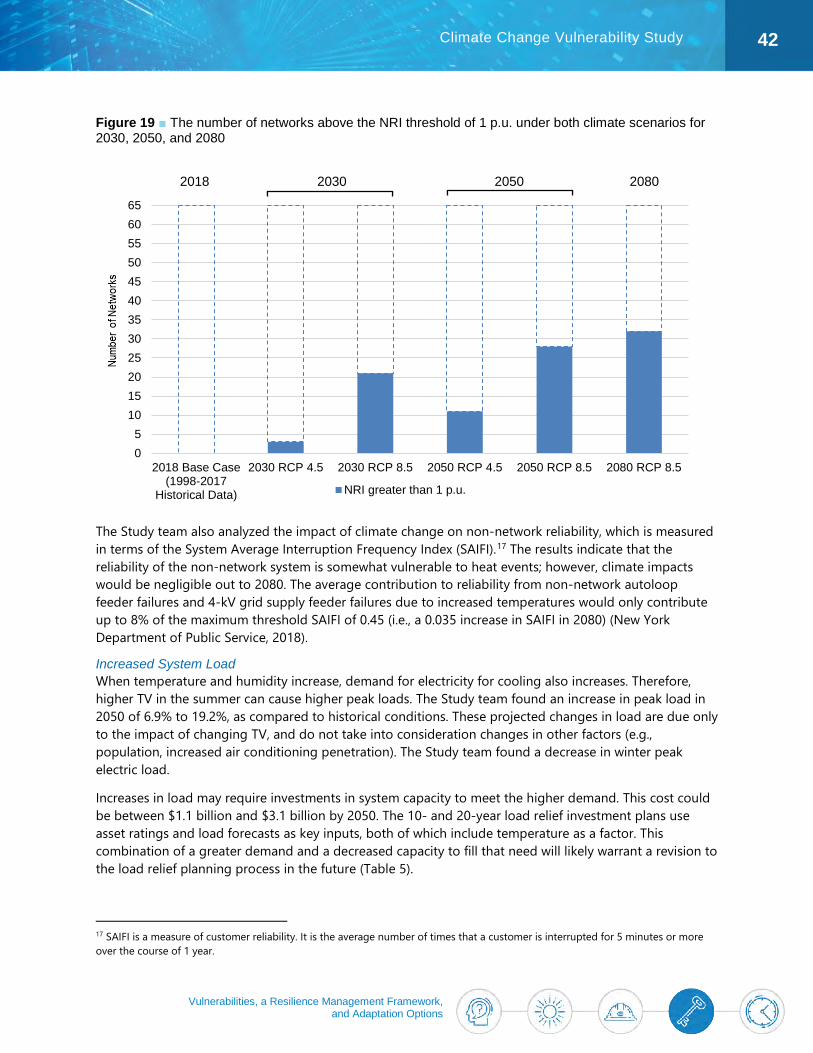
Vulnerabilities, a Resilience Management Framework, and Adaptation Options
42 Climate Change Vulnerability Study
Figure 19 ■ The number of networks above the NRI threshold of 1 p.u. under both climate scenarios for 2030, 2050, and 2080
The Study team also analyzed the impact of climate change on non-network reliability, which is measured in terms of the System Average Interruption Frequency Index (SAIFI).17 The results indicate that the reliability of the non-network system is somewhat vulnerable to heat events; however, climate impacts would be negligible out to 2080. The average contribution to reliability from non-network autoloop feeder failures and 4-kV grid supply feeder failures due to increased temperatures would only contribute up to 8% of the maximum threshold SAIFI of 0.45 (i.e., a 0.035 increase in SAIFI in 2080) (New York Department of Public Service, 2018).
Increased System Load When temperature and humidity increase, demand for electricity for cooling also increases. Therefore, higher TV in the summer can cause higher peak loads. The Study team found an increase in peak load in 2050 of 6.9% to 19.2%, as compared to historical conditions. These projected changes in load are due only to the impact of changing TV, and do not take into consideration changes in other factors (e.g., population, increased air conditioning penetration). The Study team found a decrease in winter peak electric load.
Increases in load may require investments in system capacity to meet the higher demand. This cost could be between $1.1 billion and $3.1 billion by 2050. The 10- and 20-year load relief investment plans use asset ratings and load forecasts as key inputs, both of which include temperature as a factor. This combination of a greater demand and a decreased capacity to fill that need will likely warrant a revision to the load relief planning process in the future (Table 5).
17 SAIFI is a measure of customer reliability. It is the average number of times that a customer is interrupted for 5 minutes or more over the course of 1 year.
05
101520253035404550556065
2018 Base Case(1998-2017
Historical Data)
2030 RCP 4.5 2030 RCP 8.5 2050 RCP 4.5 2050 RCP 8.5 2080 RCP 8.5
NRI greater than 1 p.u.
2030 20502018 2080
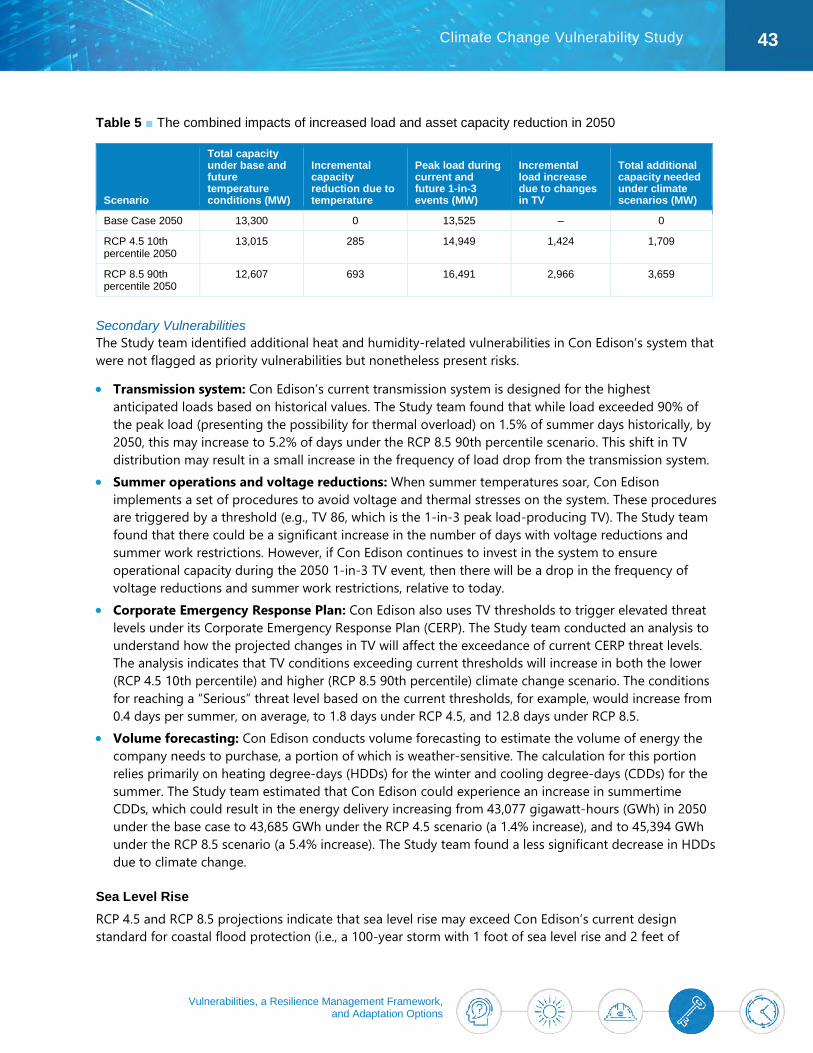
Vulnerabilities, a Resilience Management Framework, and Adaptation Options
43 Climate Change Vulnerability Study
Table 5 ■ The combined impacts of increased load and asset capacity reduction in 2050
Scenario
Total capacity under base and future temperature conditions (MW)
Incremental capacity reduction due to temperature
Peak load during current and future 1-in-3 events (MW)
Incremental load increase due to changes in TV
Total additional capacity needed under climate scenarios (MW)
Base Case 2050 13,300 0 13,525 – 0
RCP 4.5 10th percentile 2050
13,015 285 14,949 1,424 1,709
RCP 8.5 90th percentile 2050
12,607 693 16,491 2,966 3,659
Secondary Vulnerabilities The Study team identified additional heat and humidity-related vulnerabilities in Con Edison’s system that were not flagged as priority vulnerabilities but nonetheless present risks.
• Transmission system: Con Edison’s current transmission system is designed for the highest anticipated loads based on historical values. The Study team found that while load exceeded 90% of the peak load (presenting the possibility for thermal overload) on 1.5% of summer days historically, by 2050, this may increase to 5.2% of days under the RCP 8.5 90th percentile scenario. This shift in TV distribution may result in a small increase in the frequency of load drop from the transmission system.
• Summer operations and voltage reductions: When summer temperatures soar, Con Edison implements a set of procedures to avoid voltage and thermal stresses on the system. These procedures are triggered by a threshold (e.g., TV 86, which is the 1-in-3 peak load-producing TV). The Study team found that there could be a significant increase in the number of days with voltage reductions and summer work restrictions. However, if Con Edison continues to invest in the system to ensure operational capacity during the 2050 1-in-3 TV event, then there will be a drop in the frequency of voltage reductions and summer work restrictions, relative to today.
• Corporate Emergency Response Plan: Con Edison also uses TV thresholds to trigger elevated threat levels under its Corporate Emergency Response Plan (CERP). The Study team conducted an analysis to understand how the projected changes in TV will affect the exceedance of current CERP threat levels. The analysis indicates that TV conditions exceeding current thresholds will increase in both the lower (RCP 4.5 10th percentile) and higher (RCP 8.5 90th percentile) climate change scenario. The conditions for reaching a “Serious” threat level based on the current thresholds, for example, would increase from 0.4 days per summer, on average, to 1.8 days under RCP 4.5, and 12.8 days under RCP 8.5.
• Volume forecasting: Con Edison conducts volume forecasting to estimate the volume of energy the company needs to purchase, a portion of which is weather-sensitive. The calculation for this portion relies primarily on heating degree-days (HDDs) for the winter and cooling degree-days (CDDs) for the summer. The Study team estimated that Con Edison could experience an increase in summertime CDDs, which could result in the energy delivery increasing from 43,077 gigawatt-hours (GWh) in 2050 under the base case to 43,685 GWh under the RCP 4.5 scenario (a 1.4% increase), and to 45,394 GWh under the RCP 8.5 scenario (a 5.4% increase). The Study team found a less significant decrease in HDDs due to climate change.
Sea Level Rise RCP 4.5 and RCP 8.5 projections indicate that sea level rise may exceed Con Edison’s current design standard for coastal flood protection (i.e., a 100-year storm with 1 foot of sea level rise and 2 feet of
Vulnerabilities, a Resilience Management Framework, and Adaptation Options
44 Climate Change Vulnerability Study
freeboard) between 2030 and 2080. The Study team analyzed the exposure of Con Edison’s assets to 3 feet of sea level rise (i.e., the 2080 RCP 8.5 83rd percentile sea level rise projection), keeping the other elements of Con Edison’s existing risk tolerance constant (i.e., a 100-year storm with 2 feet of freeboard). By summing the freeboard and sea level rise values, this equates to FEMA’s 100-year floodplain elevation plus 5 additional feet.
Of the 324 electric substations (encompassing generating stations, area substations, transmission stations, unit substations, and Public Utility Regulating Stations [PURS]), 75 would be vulnerable to flooding during a 100-year storm if sea level rose 3 feet. Three of these potentially exposed substations would only require minimal modifications to protect them, 16 would require an extension of existing protections, eight would require a new protection approach (i.e., the existing protections cannot be extended), and 48 do not have existing protections because they are outside of the floodplain. Hardening all these substations is estimated to cost $636 million.
Precipitation The Study team found that substations, overhead distribution, underground distribution, and the transmission system are most at risk for precipitation-based hazards.
Substations may experience an overflow of water from transformer spill moats, which could release oil-contaminated water within the substation. However, the risk of such an event is low, as transformer spill moats are built at a level that is robust to all but a severe and highly improbably conjunction of events.18
The transmission and overhead distribution systems are both vulnerable to the accumulation of radial ice, which can build up on lines and towers during winter precipitation events. In extreme scenarios, accumulation of radial ice can result in unbalanced structural loading and subsequent transmission line failure, especially when accompanied by heavy winds (Nasim Rezaei, Chouinard, Legeron, & Langlois, 2015). Con Edison’s current system meets the National Electrical Safety Code standard for radial ice and is robust to ice accumulation. It is uncertain whether climate change will increase or decrease the intensity of future icing events.
The underground distribution system is vulnerable to flooding and salt runoff from snowfall and ice events. Flooding can damage non-submersible electrical equipment. This risk is mitigated through Con Edison’s designs: All underground cables and splices operate while submerged in water, and all underground distribution equipment installed in current flood zones (and all new installations) are submersible. Snowfall and ice require municipalities to spread salt on roads, which eventually seeps into the ground with runoff water. Road salt can degrade wire insulation and lead to insulation burning and arcing, potentially causing safety concerns and customer outages. It is currently unclear how salting frequency will change over time.
Extreme Events Hurricanes and nor’easters present physical risks associated with heavy winds, precipitation, and flooding, which can lead to widespread system outages and, at worst, physical destruction. During hurricanes, wind stress and windblown debris can lead to tower and/or line failure of the overhead transmission system
18 In accordance with New York State code and federal Spill Prevention, Control, and Countermeasure recommendations, Con Edison’s transformers are protected by moats designed to hold water from a 6-inch, 1-day storm event, in addition to the gallons of oil that may be released during a spill event and a further 50,000–60,000 gallons of fire suppression fluid. Based on this standard, Con Edison’s substation transformer moats are robust to 6 inches of rain during a catastrophic emergency, and significantly more than that at all other times.
Vulnerabilities, a Resilience Management Framework, and Adaptation Options
45 Climate Change Vulnerability Study
and damage overhead distribution infrastructure, which could cause widespread customer outages. Intense rain during hurricanes can also flood substations, which may cause an overflow of oil-contaminated water from transformer spill moats. A Category 4 hurricane could very likely lead to outages for more than 600,000 non-network customers and more than 1.6 million network customers.
During nor’easters, accumulation of radial ice can cause tower or line failure of the overhead transmission system. Similarly, snow, ice, and wind can damage the overhead distribution system. Indirectly, salt put down by the city to contend with snow and ice accumulation on roads could infiltrate the underground distribution system, causing arcing and failure of underground components.
Extreme heat waves present a range of effects that can contribute to failures, including a lower ampacity rating while increasing load demand, causing cables and splices to overheat, transformers to overheat, and transmission and distribution line sag. Distribution network component failures can cause Con Edison to exceed the network reliability design standard. Greater line sag can lead to flashovers and line trips.
Adaptation Options for the Electric System
Withstand In the short term, Con Edison can work to address the vulnerabilities of the electric system by integrating climate hazard considerations into planning, collecting data on priority hazards, and updating design strategies.
There are several opportunities to integrate climate change data into planning processes. For example, Con Edison could integrate climate change projections into long-term load forecasts, consult utilities in cities with higher temperatures to refine the load forecast equation for high TV numbers, and develop a load relief plan that integrates future changes in temperature and TV into asset capacity and load projections. During load relief planning, Con Edison could also consider whether extreme events may shift the preferred load relief option—frequent extreme heat could reduce the effectiveness of demand response programs. For the transmission system, Con Edison could integrate considerations of climate change into the long-range transmission plan. For the distribution system, Con Edison could integrate climate projections into NRI modeling and install high-reliability components,19 as needed.
Given the potential risks that temperature and heat waves pose to the electric system, the Study team suggests that Con Edison could collect data on these hazards to build greater awareness of their impacts to the system, as well as to monitor for signposts that would trigger additional action. Specifically, Con Edison could:
19 System components vary in their reliability. For example, PILC cable performs more poorly than solid dielectric cable.
Vulnerabilities, a Resilience Management Framework, and Adaptation Options
46 Climate Change Vulnerability Study
• Install equipment capable of collecting, tracking, and organizing temperature data at substations to allow for location-specific ratings and operations.
• Make ground temperature data more accessible and track increases over time. • Expand monitoring and targeting of high-risk vegetation areas. • Continue to track line sag and areas of vegetation change via light detection and ranging (LiDAR)
flyovers to identify new segments that may require adaptation.
These data could be used to routinely review asset ratings in light of observed temperatures. Con Edison could also incorporate heat wave projections into reliability planning for the network system.
Hurricanes are another priority hazard for the electric system and therefore warrant robust planning tools that capture potential changes in climate. Con Edison could complement their existing model used to predict work crews required to service weather-driven outages with an updated model that better resolves extreme weather events and extreme weather impacts on customers in the service territory.
Design standards are a way to help standardize resilience by ensuring that new assets are built to withstand the impacts of climate change hazards. The Study team suggests a variety of design standards:
• Temperature: Standardize ambient reference temperatures across all assets for development ratings. • Precipitation: Update precipitation design standards to reference National Oceanic and Atmospheric
Administration (NOAA) Atlas 14 for up-to-date precipitation data. Consider updating the design storm from the 25-year precipitation event to the 50-year event to account for future increases in heavy rain events.
• Sea Level Rise: Revise design guidelines to consider sea level rise projections and facility useful life. Continue to build to the higher of the FEMA + 3’ level and the Category 2 storm surge levels at new-build sites, as is current practice. Add sea level rise to the Category 2 maps to account for future changes and a greater flood height/frequency.
In addition to these systematic approaches, Con Edison can also help the electric system better withstand climate hazards through asset-specific physical adaptation measures, when needed. Table 6 illustrates these physical options.
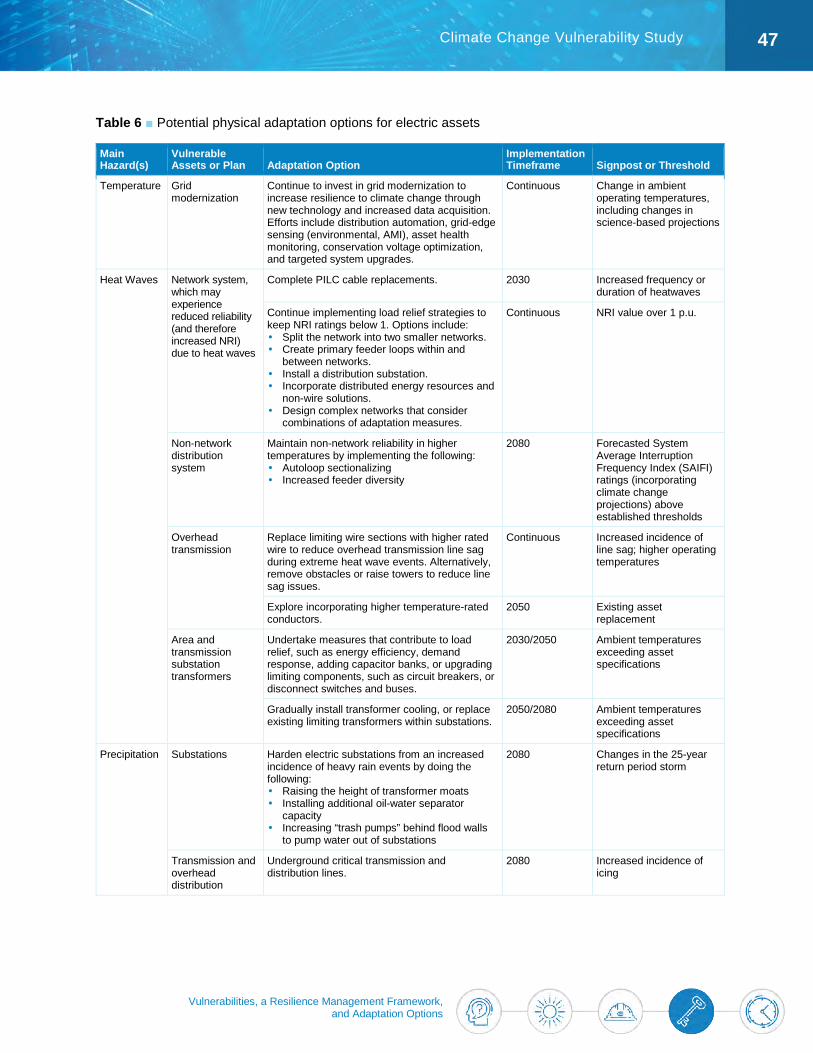
Vulnerabilities, a Resilience Management Framework, and Adaptation Options
47 Climate Change Vulnerability Study
Table 6 ■ Potential physical adaptation options for electric assets
Main Hazard(s)
Vulnerable Assets or Plan Adaptation Option
Implementation Timeframe Signpost or Threshold
Temperature Grid modernization
Continue to invest in grid modernization to increase resilience to climate change through new technology and increased data acquisition. Efforts include distribution automation, grid-edge sensing (environmental, AMI), asset health monitoring, conservation voltage optimization, and targeted system upgrades.
Continuous Change in ambient operating temperatures, including changes in science-based projections
Heat Waves Network system, which may experience reduced reliability (and therefore increased NRI) due to heat waves
Complete PILC cable replacements. 2030 Increased frequency or duration of heatwaves
Continue implementing load relief strategies to keep NRI ratings below 1. Options include: Split the network into two smaller networks. Create primary feeder loops within and
between networks. Install a distribution substation. Incorporate distributed energy resources and
non-wire solutions. Design complex networks that consider
combinations of adaptation measures.
Continuous NRI value over 1 p.u.
Non-network distribution system
Maintain non-network reliability in higher temperatures by implementing the following: Autoloop sectionalizing Increased feeder diversity
2080 Forecasted System Average Interruption Frequency Index (SAIFI) ratings (incorporating climate change projections) above established thresholds
Overhead transmission
Replace limiting wire sections with higher rated wire to reduce overhead transmission line sag during extreme heat wave events. Alternatively, remove obstacles or raise towers to reduce line sag issues.
Continuous Increased incidence of line sag; higher operating temperatures
Explore incorporating higher temperature-rated conductors.
2050 Existing asset replacement
Area and transmission substation transformers
Undertake measures that contribute to load relief, such as energy efficiency, demand response, adding capacitor banks, or upgrading limiting components, such as circuit breakers, or disconnect switches and buses.
2030/2050 Ambient temperatures exceeding asset specifications
Gradually install transformer cooling, or replace existing limiting transformers within substations.
2050/2080 Ambient temperatures exceeding asset specifications
Precipitation Substations Harden electric substations from an increased incidence of heavy rain events by doing the following: Raising the height of transformer moats Installing additional oil-water separator
capacity Increasing “trash pumps” behind flood walls
to pump water out of substations
2080
Changes in the 25-year return period storm
Transmission and overhead distribution
Underground critical transmission and distribution lines.
2080 Increased incidence of icing
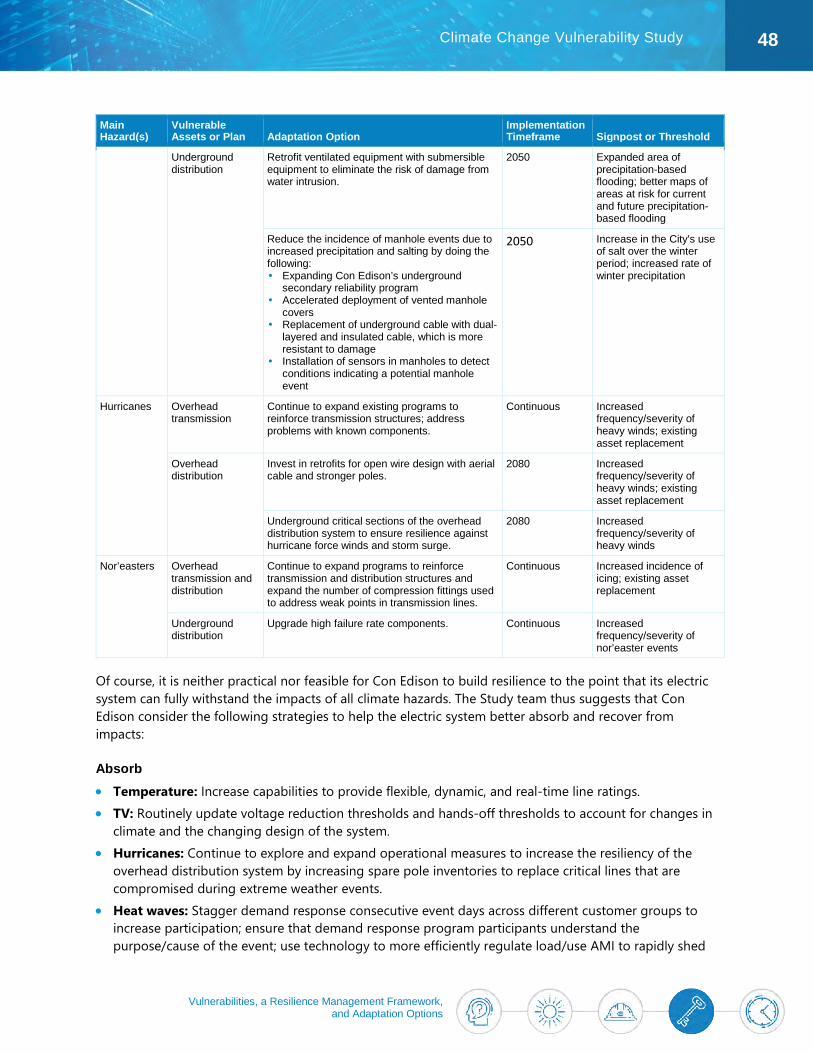
Vulnerabilities, a Resilience Management Framework, and Adaptation Options
48 Climate Change Vulnerability Study
Main Hazard(s)
Vulnerable Assets or Plan Adaptation Option
Implementation Timeframe Signpost or Threshold
Underground distribution
Retrofit ventilated equipment with submersible equipment to eliminate the risk of damage from water intrusion.
2050
Expanded area of precipitation-based flooding; better maps of areas at risk for current and future precipitation-based flooding
Reduce the incidence of manhole events due to increased precipitation and salting by doing the following: Expanding Con Edison’s underground
secondary reliability program Accelerated deployment of vented manhole
covers Replacement of underground cable with dual-
layered and insulated cable, which is more resistant to damage
Installation of sensors in manholes to detect conditions indicating a potential manhole event
2050 Increase in the City's use of salt over the winter period; increased rate of winter precipitation
Hurricanes Overhead transmission
Continue to expand existing programs to reinforce transmission structures; address problems with known components.
Continuous Increased frequency/severity of heavy winds; existing asset replacement
Overhead distribution
Invest in retrofits for open wire design with aerial cable and stronger poles.
2080 Increased frequency/severity of heavy winds; existing asset replacement
Underground critical sections of the overhead distribution system to ensure resilience against hurricane force winds and storm surge.
2080 Increased frequency/severity of heavy winds
Nor’easters Overhead transmission and distribution
Continue to expand programs to reinforce transmission and distribution structures and expand the number of compression fittings used to address weak points in transmission lines.
Continuous Increased incidence of icing; existing asset replacement
Underground distribution
Upgrade high failure rate components. Continuous Increased frequency/severity of nor’easter events
Of course, it is neither practical nor feasible for Con Edison to build resilience to the point that its electric system can fully withstand the impacts of all climate hazards. The Study team thus suggests that Con Edison consider the following strategies to help the electric system better absorb and recover from impacts:
Absorb • Temperature: Increase capabilities to provide flexible, dynamic, and real-time line ratings. • TV: Routinely update voltage reduction thresholds and hands-off thresholds to account for changes in
climate and the changing design of the system. • Hurricanes: Continue to explore and expand operational measures to increase the resiliency of the
overhead distribution system by increasing spare pole inventories to replace critical lines that are compromised during extreme weather events.
• Heat waves: Stagger demand response consecutive event days across different customer groups to increase participation; ensure that demand response program participants understand the purpose/cause of the event; use technology to more efficiently regulate load/use AMI to rapidly shed
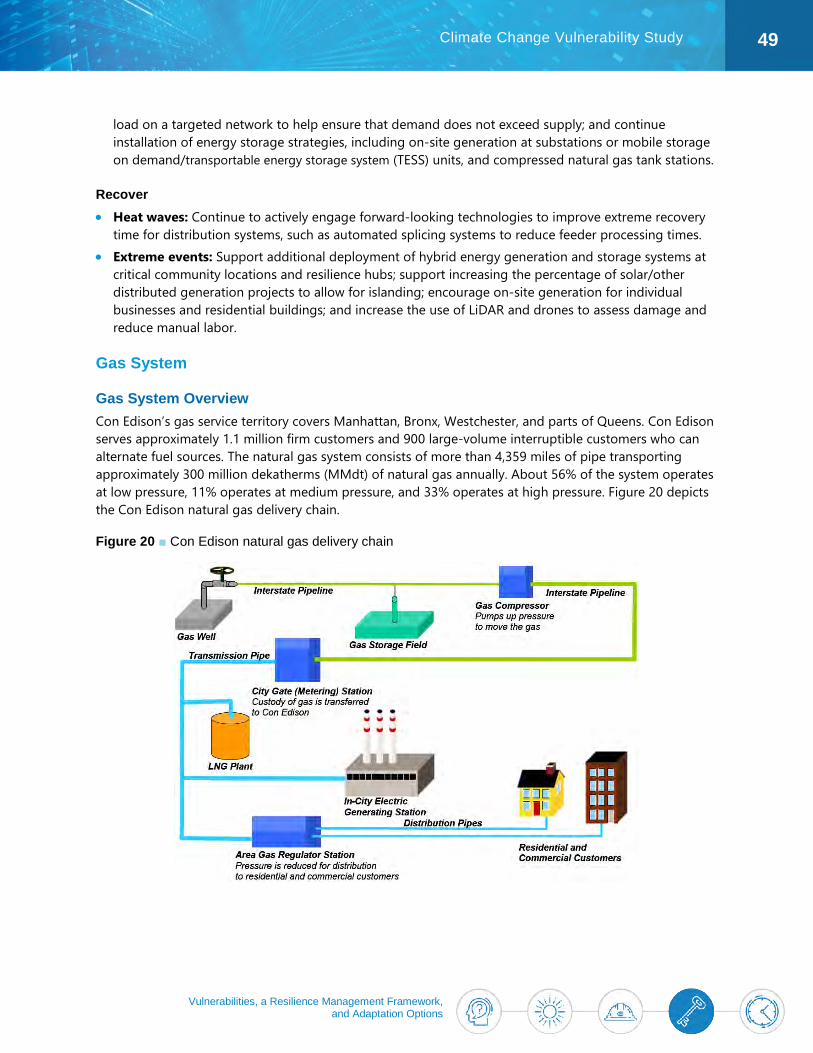
Vulnerabilities, a Resilience Management Framework, and Adaptation Options
49 Climate Change Vulnerability Study
load on a targeted network to help ensure that demand does not exceed supply; and continue installation of energy storage strategies, including on-site generation at substations or mobile storage on demand/transportable energy storage system (TESS) units, and compressed natural gas tank stations.
Recover • Heat waves: Continue to actively engage forward-looking technologies to improve extreme recovery
time for distribution systems, such as automated splicing systems to reduce feeder processing times. • Extreme events: Support additional deployment of hybrid energy generation and storage systems at
critical community locations and resilience hubs; support increasing the percentage of solar/other distributed generation projects to allow for islanding; encourage on-site generation for individual businesses and residential buildings; and increase the use of LiDAR and drones to assess damage and reduce manual labor.
Gas System
Gas System Overview Con Edison’s gas service territory covers Manhattan, Bronx, Westchester, and parts of Queens. Con Edison serves approximately 1.1 million firm customers and 900 large-volume interruptible customers who can alternate fuel sources. The natural gas system consists of more than 4,359 miles of pipe transporting approximately 300 million dekatherms (MMdt) of natural gas annually. About 56% of the system operates at low pressure, 11% operates at medium pressure, and 33% operates at high pressure. Figure 20 depicts the Con Edison natural gas delivery chain.
Figure 20 ■ Con Edison natural gas delivery chain
Vulnerabilities, a Resilience Management Framework, and Adaptation Options
50 Climate Change Vulnerability Study
Gas Vulnerabilities Most of Con Edison’s gas assets are underground, and gas load peaks in the winter rather than in the summer, which means that gas assets are less likely to be damaged by subaerial extreme events, such as heat waves, lightning, and strong winds. As discussed in Con Edison’s Post Sandy Enhancement Plan, Con Edison’s gas assets are most vulnerable to underground water intrusion caused by flooding, and thus projected increases in the frequency of heavy precipitation and downpours, sea level rise and storm surge, and hurricanes and nor’easters pose a significant risk (Con Edison, 2013).
Water intrusion can occur if underground water enters gas pipes or mains and may result in a drop in pressure and lead to scattered service interruptions; low-pressure segments of the system and cast iron pipes are particularly vulnerable to this risk. In addition, pipe sections near open-pit construction projects may also be more vulnerable, because open excavation work can create opportunities for water intrusion if flood protection measures are not consistently used. Con Edison has already developed operational protocols that require crews working on open excavation sites to secure them to minimize water intrusion risk.
Water intrusion into gas regulators through aboveground vents may also cause damage. This intrusion could lead to water sitting on top of the diaphragm that allows each regulator to function and exerting additional pressure on the diaphragm that could, in turn, over-pressurize the regulator. Over-pressurized gas flowing through a system designed for lower pressure gas increases the possibility of tearing leaks in distribution piping, and in the worst-case scenario, could blow out pilot lights.
For the gas distribution system to function at full capacity and to be able to provide customers with desired gas supply, Con Edison must keep gas moving through the system at the intended flow rate, or pressure level, of each system segment. Once water enters the gas system, it is difficult to pinpoint the location and remove the water, which can increase the durations of resulting service interruptions.
Con Edison is currently undertaking several measures to manage underground water intrusion:
• Using drip pots to collect water at low points in the system (approximately 8,000 are currently in place) • Developing a program to better prioritize gas infrastructure replacements. Remote sensors and
machine learning could identify leak-prone areas to prioritize for upgrades intended to mitigate increasing precipitation risks in the face of climate change
• Developing a drip pot remote monitoring program using sensors, which would increase the efficiency of periodic emptying of drip pots and reduce the effort needed to monitor drip pots during the period of planned pipe replacement
• Shifting toward constructing and repairing infrastructure with more leak-resistant equipment, when possible
A climate change-driven increase in the frequency and intensity of flood events, such as heavy rain events or snow events followed by rapid snow melt, or coastal storm surge, may elevate the risk of water infiltration into the low-pressure gas system. The precipitation threshold currently used as a benchmark for monitoring and emptying drip pots is ½ inch of rain in 24 hours. Under the RCP 8.5 scenario, this threshold is projected to be exceeded 37 days per year in Central Park by the latter part of the century, which is nearly 20% more than the 31 days observed over the baseline period.
Low-probability, high-impact extreme events may also include heavy rainfall and storm surge that could increase the risk of water entering the distribution system. An increase in the frequency and intensity of extreme events may make water infiltration into the gas distribution system more likely. Con Edison’s gas
Vulnerabilities, a Resilience Management Framework, and Adaptation Options
51 Climate Change Vulnerability Study
system has established criteria to ensure that new equipment, such as gas regulator line vents, is resilient against a 100-year storm and 1 foot of sea level rise. After Superstorm Sandy, Con Edison upgraded two regulator stations to meet this standard. The Study team determined that to protect regulator stations against 3 feet of sea level rise, Con Edison would need to update 32 regulator stations, at a cost of $13.8 million.
The gas transmission system is vulnerable to cold snaps associated with nor’easters, when temperatures can drop below 0°F for multiple days. Transmission system capacity is designed to meet demand projected for weather conditions at or above 0°F. Temperatures below that threshold may increase demand to a level that exceeds system capacity; in such an event, system pressure may decrease, resulting in customer service loss.
In a generally warmer climate, the gas sector could experience significant decreases in winter energy sales for heating. There could be up to a 33% decrease by 2050 and a 49% decrease by 2080. Similarly, under the RCP 8.5 scenario, winter gas peak load is projected to decrease by 144 MMdt in 2050, compared to the base case.
Adaptation Options for the Gas System In addition to Con Edison’s existing efforts, the Study team identified several additional adaptation options that the company could consider. Some measures proposed, such as remote information monitoring and analysis, address vulnerabilities in operations and planning processes. Most measures proposed address physical vulnerabilities (see Table 7), which fall within the “withstand” adaptation category.
In the short term, Con Edison could focus on expanding its monitoring capabilities, particularly through programs that use machine learning and remote monitoring to identify vulnerable areas of the distribution system, and remote drip pot monitoring sensors.
To account for changing temperatures, Con Edison could integrate climate change data on changes in the winter gas TV into gas volume and peak load forecasting so that the company is continuously planning for future changes in climate.
To address physical risks to existing infrastructure, Con Edison may need to invest in the system at strategic points in time, as described in Table 7.
Distribution system measures focus on minimizing the risk of flood water entering and depressurizing gas mains and pipes, and measures to more easily re-elevate pressure if water does enter the system.
Adaptation measures identified to address transmission system vulnerabilities primarily focus on diversifying the system and strengthening load management when capacity is constrained.
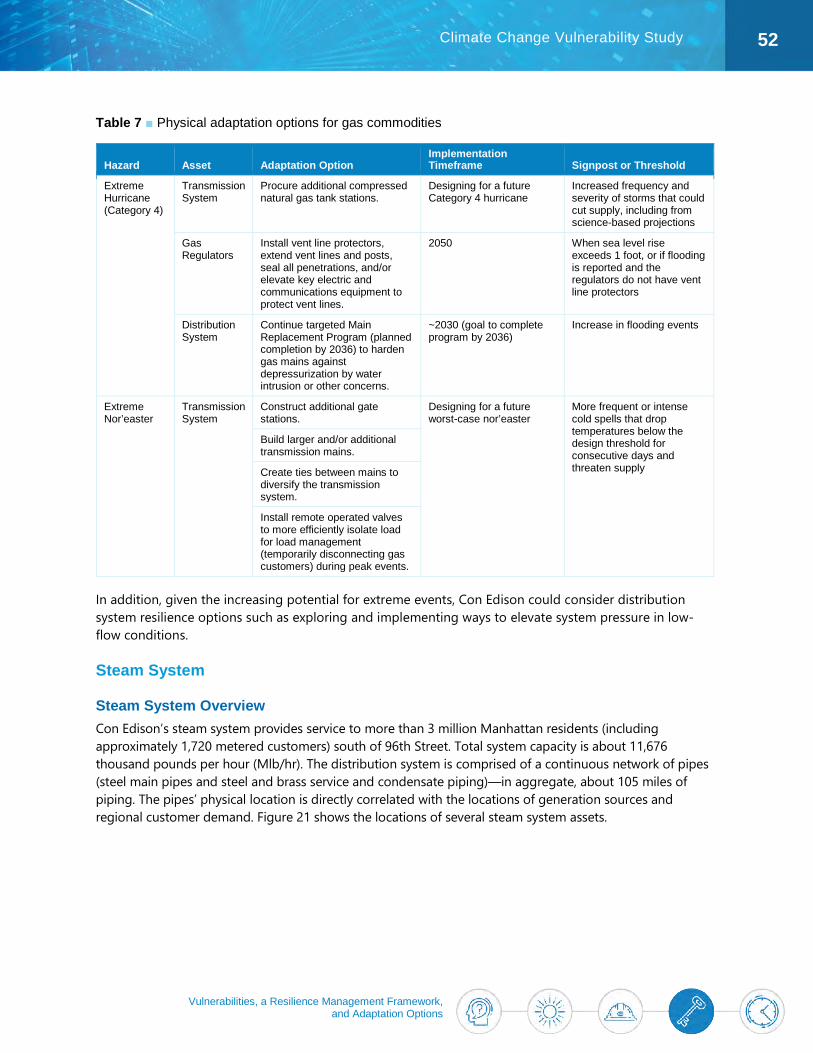
Vulnerabilities, a Resilience Management Framework, and Adaptation Options
52 Climate Change Vulnerability Study
Table 7 ■ Physical adaptation options for gas commodities
Hazard Asset Adaptation Option Implementation Timeframe Signpost or Threshold
Extreme Hurricane (Category 4)
Transmission System
Procure additional compressed natural gas tank stations.
Designing for a future Category 4 hurricane
Increased frequency and severity of storms that could cut supply, including from science-based projections
Gas Regulators
Install vent line protectors, extend vent lines and posts, seal all penetrations, and/or elevate key electric and communications equipment to protect vent lines.
2050 When sea level rise exceeds 1 foot, or if flooding is reported and the regulators do not have vent line protectors
Distribution System
Continue targeted Main Replacement Program (planned completion by 2036) to harden gas mains against depressurization by water intrusion or other concerns.
~2030 (goal to complete program by 2036)
Increase in flooding events
Extreme Nor’easter
Transmission System
Construct additional gate stations.
Designing for a future worst-case nor’easter
More frequent or intense cold spells that drop temperatures below the design threshold for consecutive days and threaten supply
Build larger and/or additional transmission mains.
Create ties between mains to diversify the transmission system.
Install remote operated valves to more efficiently isolate load for load management (temporarily disconnecting gas customers) during peak events.
In addition, given the increasing potential for extreme events, Con Edison could consider distribution system resilience options such as exploring and implementing ways to elevate system pressure in low-flow conditions.
Steam System
Steam System Overview Con Edison’s steam system provides service to more than 3 million Manhattan residents (including approximately 1,720 metered customers) south of 96th Street. Total system capacity is about 11,676 thousand pounds per hour (Mlb/hr). The distribution system is comprised of a continuous network of pipes (steel main pipes and steel and brass service and condensate piping)—in aggregate, about 105 miles of piping. The pipes’ physical location is directly correlated with the locations of generation sources and regional customer demand. Figure 21 shows the locations of several steam system assets.
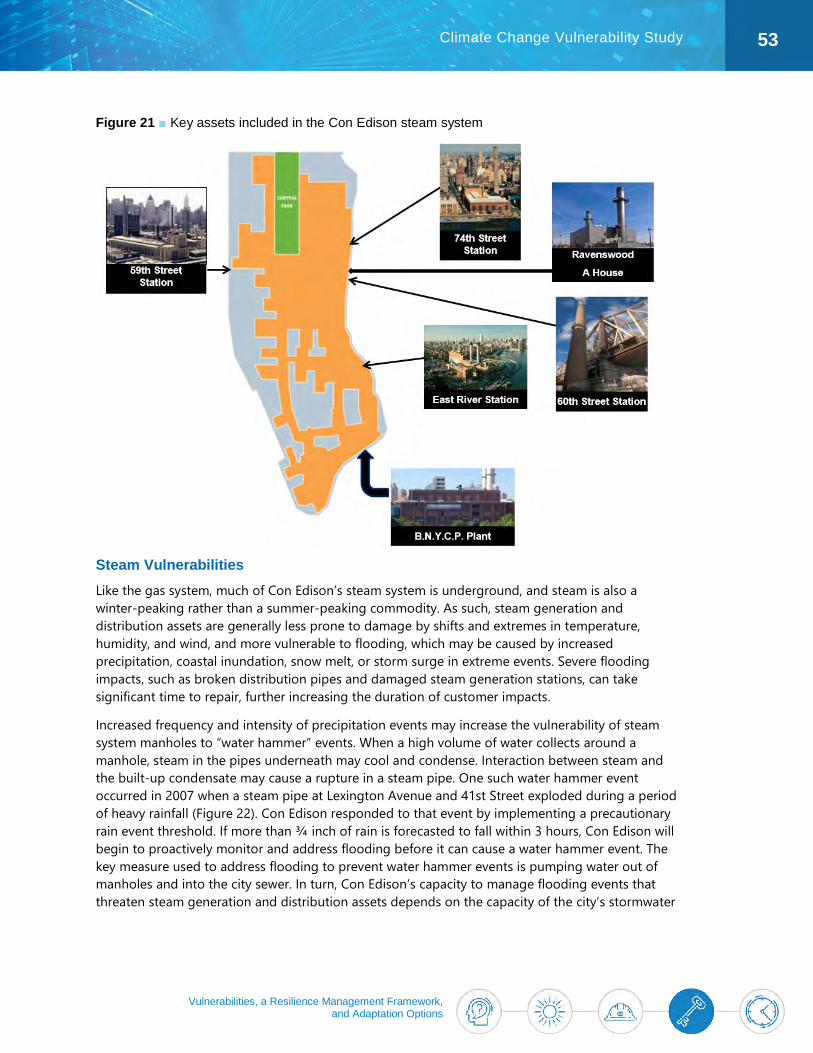
Vulnerabilities, a Resilience Management Framework, and Adaptation Options
53 Climate Change Vulnerability Study
Figure 21 ■ Key assets included in the Con Edison steam system
Steam Vulnerabilities Like the gas system, much of Con Edison’s steam system is underground, and steam is also a winter-peaking rather than a summer-peaking commodity. As such, steam generation and distribution assets are generally less prone to damage by shifts and extremes in temperature, humidity, and wind, and more vulnerable to flooding, which may be caused by increased precipitation, coastal inundation, snow melt, or storm surge in extreme events. Severe flooding impacts, such as broken distribution pipes and damaged steam generation stations, can take significant time to repair, further increasing the duration of customer impacts.
Increased frequency and intensity of precipitation events may increase the vulnerability of steam system manholes to “water hammer” events. When a high volume of water collects around a manhole, steam in the pipes underneath may cool and condense. Interaction between steam and the built-up condensate may cause a rupture in a steam pipe. One such water hammer event occurred in 2007 when a steam pipe at Lexington Avenue and 41st Street exploded during a period of heavy rainfall (Figure 22). Con Edison responded to that event by implementing a precautionary rain event threshold. If more than ¾ inch of rain is forecasted to fall within 3 hours, Con Edison will begin to proactively monitor and address flooding before it can cause a water hammer event. The key measure used to address flooding to prevent water hammer events is pumping water out of manholes and into the city sewer. In turn, Con Edison’s capacity to manage flooding events that threaten steam generation and distribution assets depends on the capacity of the city’s stormwater
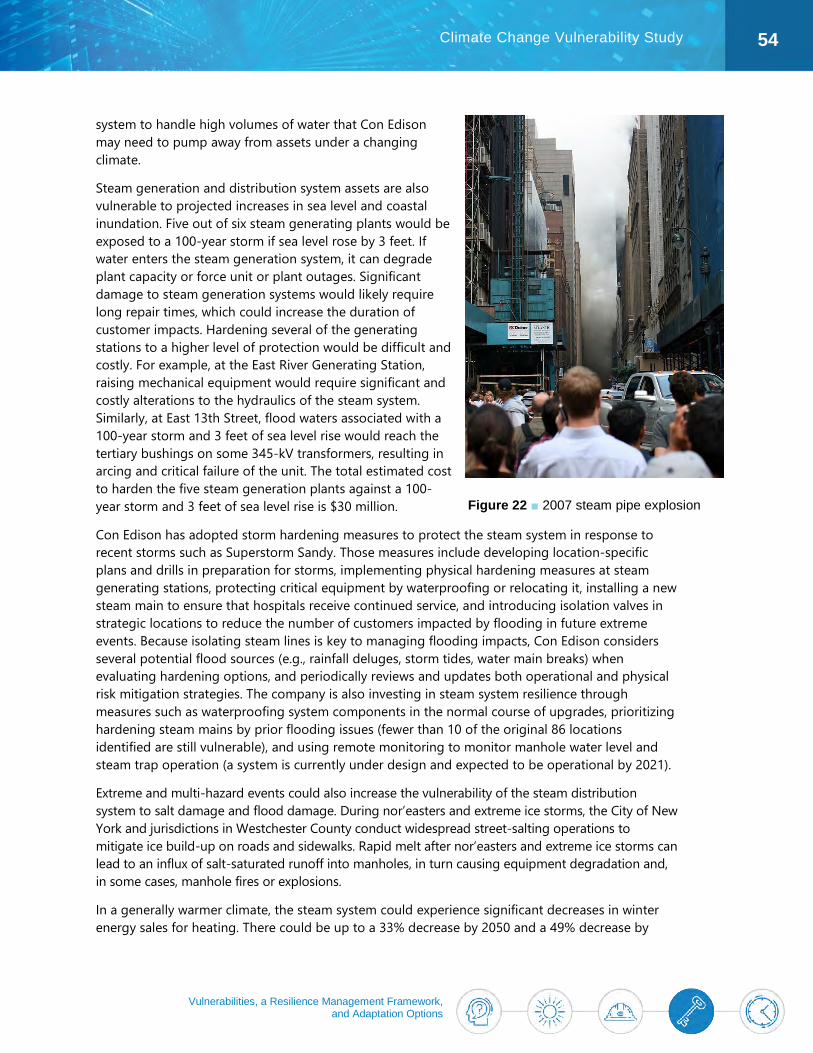
Vulnerabilities, a Resilience Management Framework, and Adaptation Options
54 Climate Change Vulnerability Study
system to handle high volumes of water that Con Edison may need to pump away from assets under a changing climate.
Steam generation and distribution system assets are also vulnerable to projected increases in sea level and coastal inundation. Five out of six steam generating plants would be exposed to a 100-year storm if sea level rose by 3 feet. If water enters the steam generation system, it can degrade plant capacity or force unit or plant outages. Significant damage to steam generation systems would likely require long repair times, which could increase the duration of customer impacts. Hardening several of the generating stations to a higher level of protection would be difficult and costly. For example, at the East River Generating Station, raising mechanical equipment would require significant and costly alterations to the hydraulics of the steam system. Similarly, at East 13th Street, flood waters associated with a 100-year storm and 3 feet of sea level rise would reach the tertiary bushings on some 345-kV transformers, resulting in arcing and critical failure of the unit. The total estimated cost to harden the five steam generation plants against a 100-year storm and 3 feet of sea level rise is $30 million.
Con Edison has adopted storm hardening measures to protect the steam system in response to recent storms such as Superstorm Sandy. Those measures include developing location-specific plans and drills in preparation for storms, implementing physical hardening measures at steam generating stations, protecting critical equipment by waterproofing or relocating it, installing a new steam main to ensure that hospitals receive continued service, and introducing isolation valves in strategic locations to reduce the number of customers impacted by flooding in future extreme events. Because isolating steam lines is key to managing flooding impacts, Con Edison considers several potential flood sources (e.g., rainfall deluges, storm tides, water main breaks) when evaluating hardening options, and periodically reviews and updates both operational and physical risk mitigation strategies. The company is also investing in steam system resilience through measures such as waterproofing system components in the normal course of upgrades, prioritizing hardening steam mains by prior flooding issues (fewer than 10 of the original 86 locations identified are still vulnerable), and using remote monitoring to monitor manhole water level and steam trap operation (a system is currently under design and expected to be operational by 2021).
Extreme and multi-hazard events could also increase the vulnerability of the steam distribution system to salt damage and flood damage. During nor’easters and extreme ice storms, the City of New York and jurisdictions in Westchester County conduct widespread street-salting operations to mitigate ice build-up on roads and sidewalks. Rapid melt after nor’easters and extreme ice storms can lead to an influx of salt-saturated runoff into manholes, in turn causing equipment degradation and, in some cases, manhole fires or explosions.
In a generally warmer climate, the steam system could experience significant decreases in winter energy sales for heating. There could be up to a 33% decrease by 2050 and a 49% decrease by
Figure 22 ■ 2007 steam pipe explosion
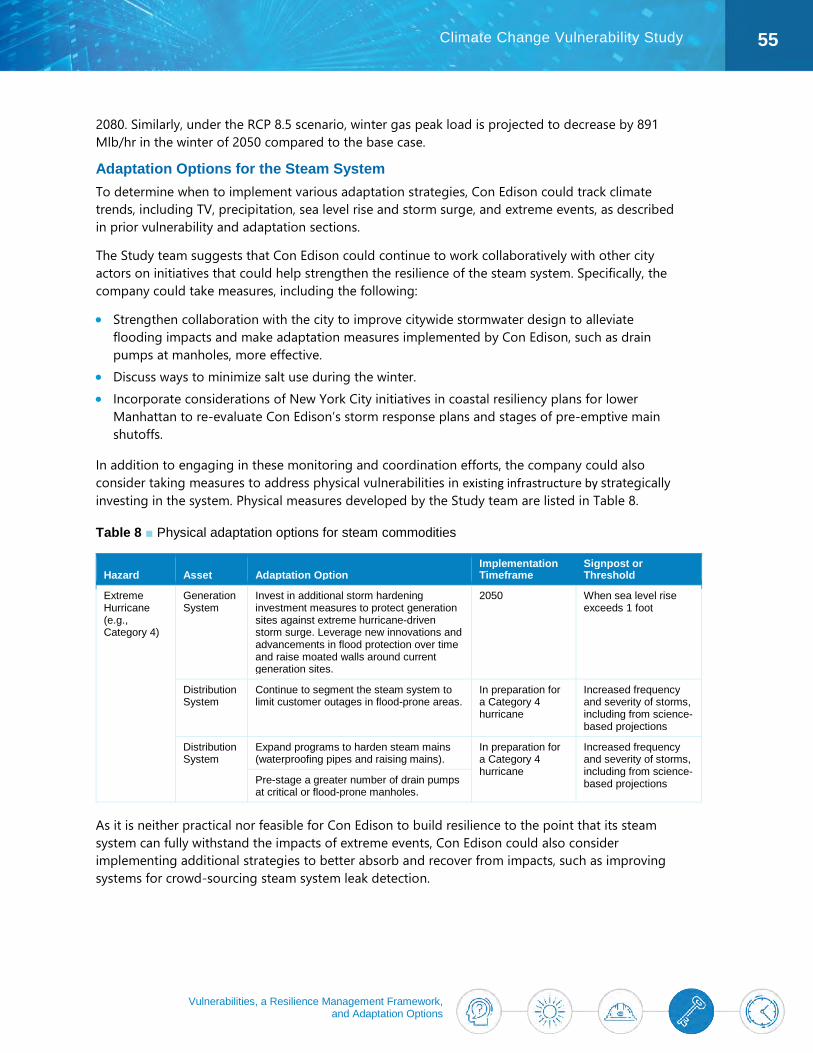
Vulnerabilities, a Resilience Management Framework, and Adaptation Options
55 Climate Change Vulnerability Study
2080. Similarly, under the RCP 8.5 scenario, winter gas peak load is projected to decrease by 891 Mlb/hr in the winter of 2050 compared to the base case.
Adaptation Options for the Steam System To determine when to implement various adaptation strategies, Con Edison could track climate trends, including TV, precipitation, sea level rise and storm surge, and extreme events, as described in prior vulnerability and adaptation sections.
The Study team suggests that Con Edison could continue to work collaboratively with other city actors on initiatives that could help strengthen the resilience of the steam system. Specifically, the company could take measures, including the following:
• Strengthen collaboration with the city to improve citywide stormwater design to alleviate flooding impacts and make adaptation measures implemented by Con Edison, such as drain pumps at manholes, more effective.
• Discuss ways to minimize salt use during the winter. • Incorporate considerations of New York City initiatives in coastal resiliency plans for lower
Manhattan to re-evaluate Con Edison’s storm response plans and stages of pre-emptive main shutoffs.
In addition to engaging in these monitoring and coordination efforts, the company could also consider taking measures to address physical vulnerabilities in existing infrastructure by strategically investing in the system. Physical measures developed by the Study team are listed in Table 8.
Table 8 ■ Physical adaptation options for steam commodities
Hazard Asset Adaptation Option Implementation Timeframe
Signpost or Threshold
Extreme Hurricane (e.g., Category 4)
Generation System
Invest in additional storm hardening investment measures to protect generation sites against extreme hurricane-driven storm surge. Leverage new innovations and advancements in flood protection over time and raise moated walls around current generation sites.
2050 When sea level rise exceeds 1 foot
Distribution System
Continue to segment the steam system to limit customer outages in flood-prone areas.
In preparation for a Category 4 hurricane
Increased frequency and severity of storms, including from science-based projections
Distribution System
Expand programs to harden steam mains (waterproofing pipes and raising mains).
In preparation for a Category 4 hurricane
Increased frequency and severity of storms, including from science-based projections Pre-stage a greater number of drain pumps
at critical or flood-prone manholes.
As it is neither practical nor feasible for Con Edison to build resilience to the point that its steam system can fully withstand the impacts of extreme events, Con Edison could also consider implementing additional strategies to better absorb and recover from impacts, such as improving systems for crowd-sourcing steam system leak detection.
Moving Towards Implementation
56 Climate Change Vulnerability Study
Moving Towards Implementation Initial Climate Projection Design Pathway Implementation of adaptation options to mitigate vulnerabilities requires clear climate design guidelines that incorporate forward-looking regional climate change projections. To this end, the Study team suggests that Con Edison could establish an “initial climate projection design pathway” that considers appropriate risk tolerance levels within the range of climate change projections. The initial climate projection design pathway is meant to guide preliminary planning and investments until and if Con Edison can refine the pathway to reflect new climate projections with reduced uncertainties, changes to Con Edison’s operating environment, and changes in city guidance. The following section outlines an adaptive management approach that allows Con Edison to monitor, manage, and design to acceptable levels of climate risk through time.
As an initial climate projection design pathway for decisions that require it, Con Edison will follow the conservative precedent set by the city’s climate resiliency design standards (e.g., Mayor’s Office of Recovery and Resiliency, 2019), combined with the state-of-the-art climate projections produced for this Study. Corresponding to city guidance, the same pathway may not apply uniformly across different climate change projections and hazards. More specifically, multiple climate projection design pathways may be required to address differences in the risk tolerance and projection uncertainty associated with different climate hazards. Under this framework, initial pathways could use the 50th percentile merged RCP 4.5 and 8.5 projections for sea level rise and high-end 90th percentile merged RCP 4.5 and 8.5 projections for heat and precipitation. Climate projection design pathways will be finalized for Con Edison’s Climate Change Implementation Plan.
Alternative considerations are necessary to inform pathways for rare and difficult-to-model extreme events without probabilistic projections, such as 1-in-100-year heat waves and strong, multi-faceted hurricanes. Rather than prescribing statements of probability, these types of extremes require the blending of plausible worst-case scenarios from a climate perspective with stakeholder-driven worst-case scenarios from an impact perspective. Until climate modeling can better resolve and simulate these types of rare extreme events, the union of these two perspectives is critical for determining acceptable risk tolerance levels and setting initial pathways.
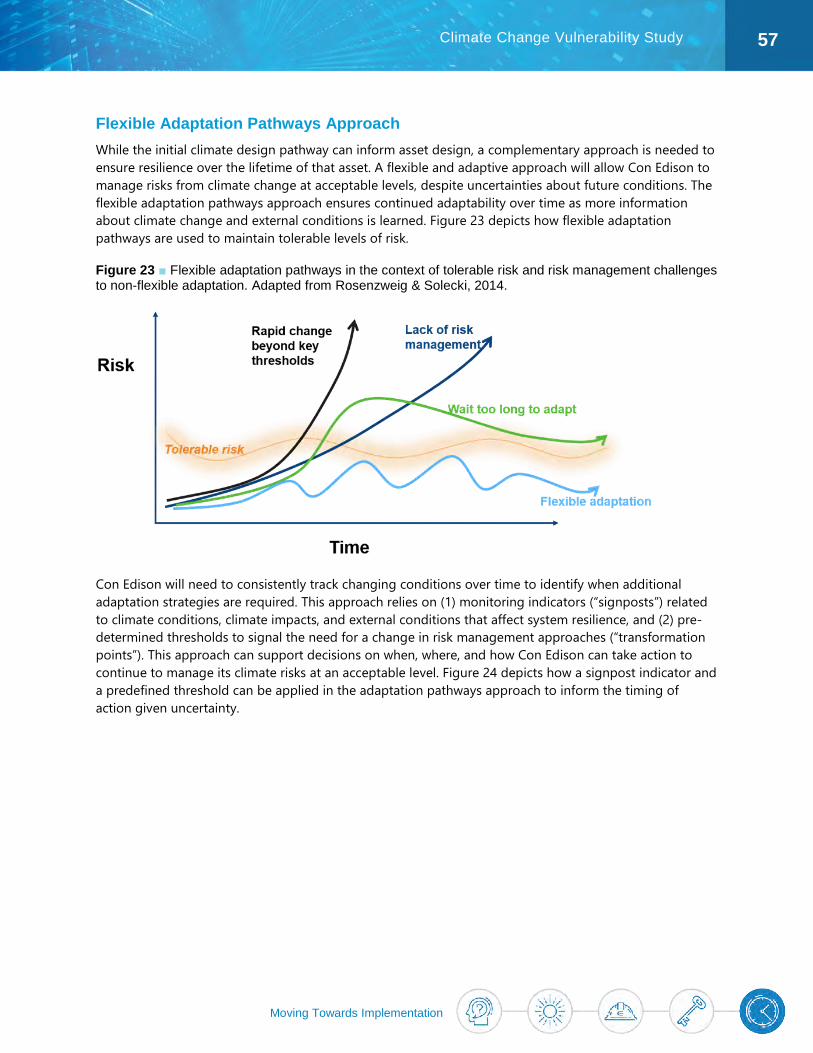
Moving Towards Implementation
57 Climate Change Vulnerability Study
Flexible Adaptation Pathways Approach While the initial climate design pathway can inform asset design, a complementary approach is needed to ensure resilience over the lifetime of that asset. A flexible and adaptive approach will allow Con Edison to manage risks from climate change at acceptable levels, despite uncertainties about future conditions. The flexible adaptation pathways approach ensures continued adaptability over time as more information about climate change and external conditions is learned. Figure 23 depicts how flexible adaptation pathways are used to maintain tolerable levels of risk.
Figure 23 ■ Flexible adaptation pathways in the context of tolerable risk and risk management challenges to non-flexible adaptation. Adapted from Rosenzweig & Solecki, 2014.
Con Edison will need to consistently track changing conditions over time to identify when additional adaptation strategies are required. This approach relies on (1) monitoring indicators (“signposts”) related to climate conditions, climate impacts, and external conditions that affect system resilience, and (2) pre-determined thresholds to signal the need for a change in risk management approaches (“transformation points”). This approach can support decisions on when, where, and how Con Edison can take action to continue to manage its climate risks at an acceptable level. Figure 24 depicts how a signpost indicator and a predefined threshold can be applied in the adaptation pathways approach to inform the timing of action given uncertainty.
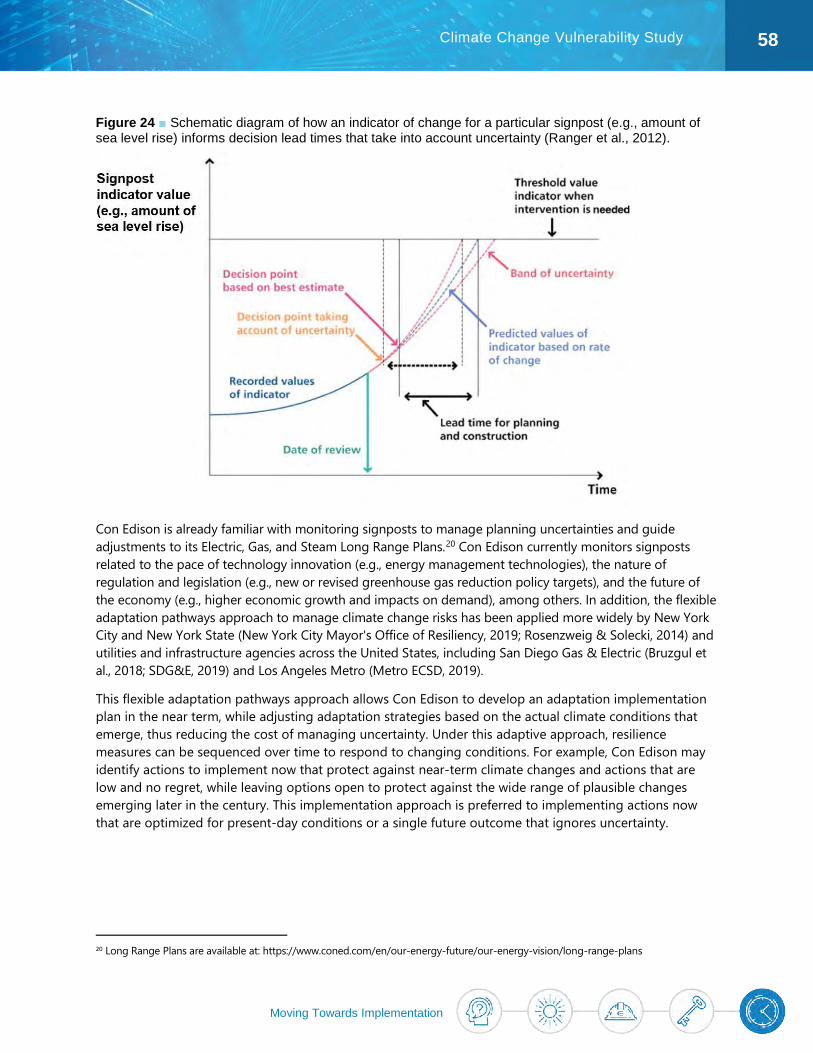
Moving Towards Implementation
58 Climate Change Vulnerability Study
Figure 24 ■ Schematic diagram of how an indicator of change for a particular signpost (e.g., amount of sea level rise) informs decision lead times that take into account uncertainty (Ranger et al., 2012).
Con Edison is already familiar with monitoring signposts to manage planning uncertainties and guide adjustments to its Electric, Gas, and Steam Long Range Plans.20 Con Edison currently monitors signposts related to the pace of technology innovation (e.g., energy management technologies), the nature of regulation and legislation (e.g., new or revised greenhouse gas reduction policy targets), and the future of the economy (e.g., higher economic growth and impacts on demand), among others. In addition, the flexible adaptation pathways approach to manage climate change risks has been applied more widely by New York City and New York State (New York City Mayor's Office of Resiliency, 2019; Rosenzweig & Solecki, 2014) and utilities and infrastructure agencies across the United States, including San Diego Gas & Electric (Bruzgul et al., 2018; SDG&E, 2019) and Los Angeles Metro (Metro ECSD, 2019).
This flexible adaptation pathways approach allows Con Edison to develop an adaptation implementation plan in the near term, while adjusting adaptation strategies based on the actual climate conditions that emerge, thus reducing the cost of managing uncertainty. Under this adaptive approach, resilience measures can be sequenced over time to respond to changing conditions. For example, Con Edison may identify actions to implement now that protect against near-term climate changes and actions that are low and no regret, while leaving options open to protect against the wide range of plausible changes emerging later in the century. This implementation approach is preferred to implementing actions now that are optimized for present-day conditions or a single future outcome that ignores uncertainty.
20 Long Range Plans are available at: https://www.coned.com/en/our-energy-future/our-energy-vision/long-range-plans
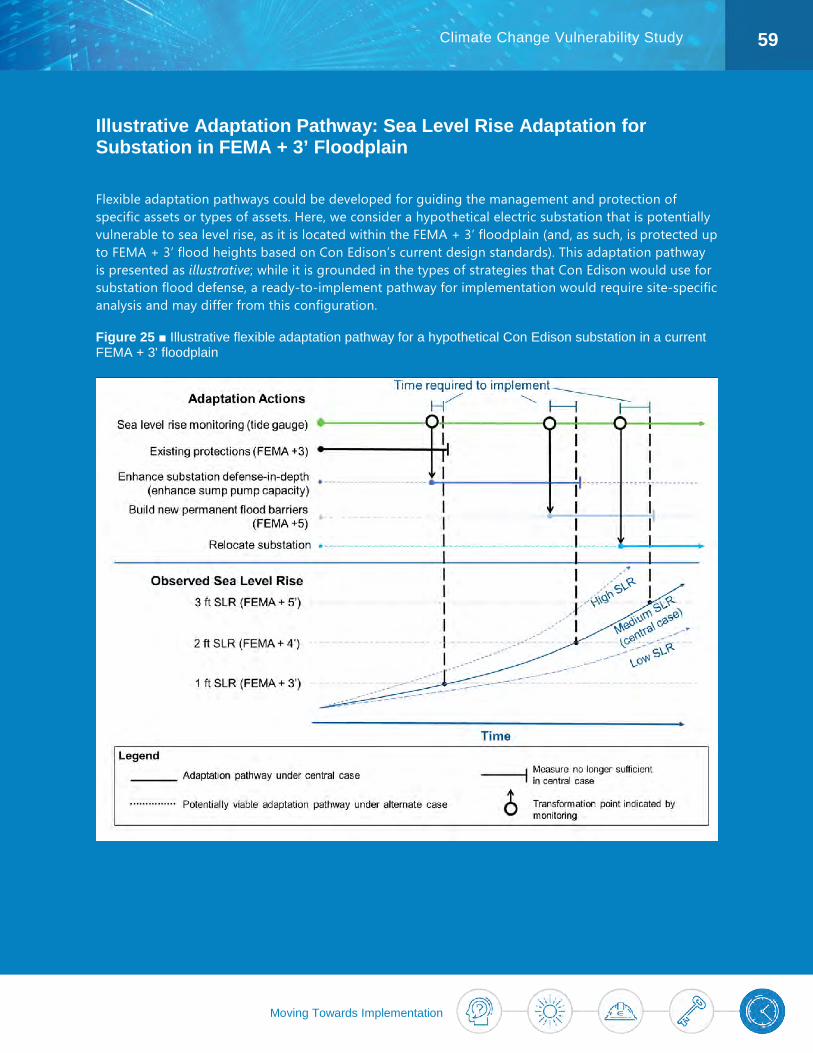
Moving Towards Implementation
59 Climate Change Vulnerability Study
Illustrative Adaptation Pathway: Sea Level Rise Adaptation for Substation in FEMA + 3’ Floodplain
Flexible adaptation pathways could be developed for guiding the management and protection of specific assets or types of assets. Here, we consider a hypothetical electric substation that is potentially vulnerable to sea level rise, as it is located within the FEMA + 3’ floodplain (and, as such, is protected up to FEMA + 3’ flood heights based on Con Edison’s current design standards). This adaptation pathway is presented as illustrative; while it is grounded in the types of strategies that Con Edison would use for substation flood defense, a ready-to-implement pathway for implementation would require site-specific analysis and may differ from this configuration.
Figure 25 ■ Illustrative flexible adaptation pathway for a hypothetical Con Edison substation in a current FEMA + 3' floodplain
Moving Towards Implementation
60 Climate Change Vulnerability Study
Figure 25 illustrates how the implementation of adaptation actions can be phased over time, with the implementation of new measures being triggered by observed sea level rise in excess of certain thresholds (transformation points). The timing of these transformation points is indicated by monitoring the rate of sea level rise at a local tide gauge (green line). Transformation points are set based on the point at which Con Edison needs to take action in order to implement a higher standard of protection before existing protections become insufficient.
In this adaptation pathway diagram, the implementation schedule of adaptation measures is illustrated based on a “central” sea level rise case. Measures based on this central scenario are illustrated with solid lines. If the actual pace of sea level rise deviates from the central case, monitoring of sea level rise may necessitate an accelerated or delayed implementation schedule
In this example, it is assumed that the substation already has existing protections to FEMA + 3’ based on Con Edison’s post-Superstorm Sandy hardening measures (black line). However, these protections will no longer be sufficient to provide the requisite 2 feet of freeboard under a 100-year flood scenario once sea level rise surpasses 1 foot.
• A trigger slightly under 1 foot leads to the first adaptation option, which is to supplement the substation’s defense-in-depth strategy with additional sump pump capacity.
• The second adaptation option is triggered when sea level rise approaches 2 feet, and includes building new permanent flood barriers to a FEMA + 5’ level.
• The final adaptation option, relocating the substation entirely, is triggered when sea level rise approaches 3 feet.
Each trigger is far enough in advance of the critical risk threshold (each foot of sea level rise, in this case) to have time for full implementation of the adaptation option.
Such a flexible adaptation pathway can allow Con Edison to better manage the costs of adaptation in the face of uncertainty, facilitating a prudent approach that avoids adapting too early or too late.
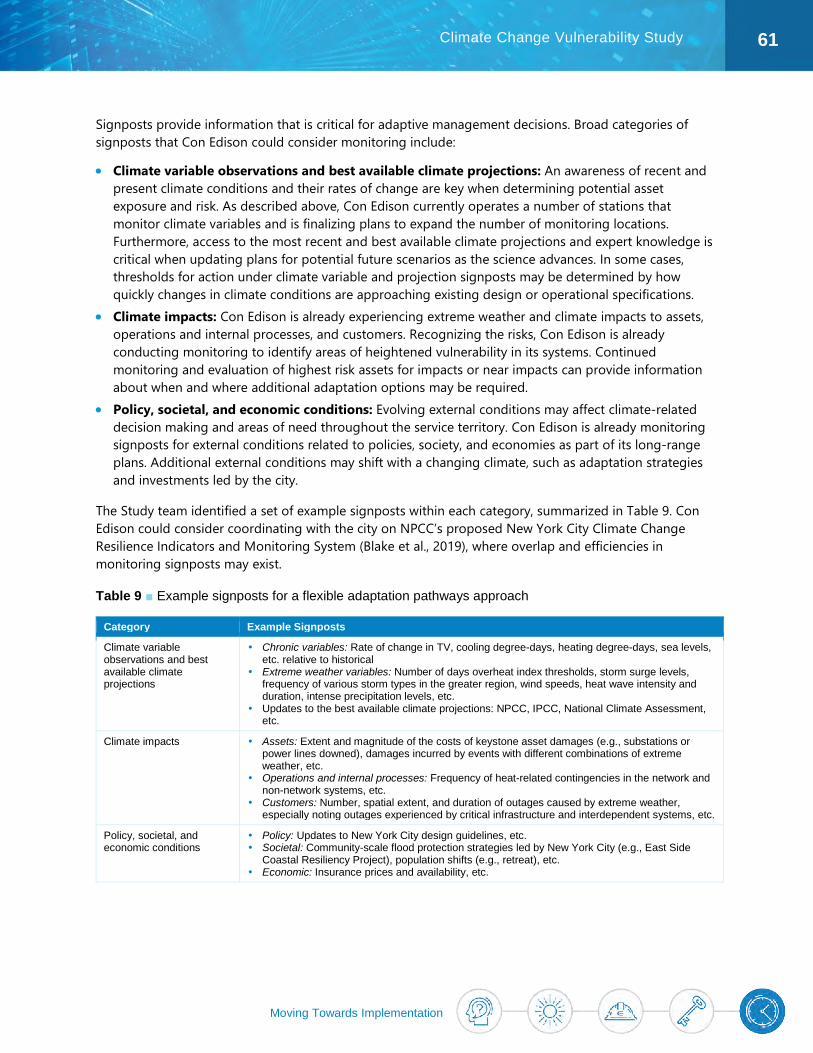
Moving Towards Implementation
61 Climate Change Vulnerability Study
Signposts provide information that is critical for adaptive management decisions. Broad categories of signposts that Con Edison could consider monitoring include:
• Climate variable observations and best available climate projections: An awareness of recent and present climate conditions and their rates of change are key when determining potential asset exposure and risk. As described above, Con Edison currently operates a number of stations that monitor climate variables and is finalizing plans to expand the number of monitoring locations. Furthermore, access to the most recent and best available climate projections and expert knowledge is critical when updating plans for potential future scenarios as the science advances. In some cases, thresholds for action under climate variable and projection signposts may be determined by how quickly changes in climate conditions are approaching existing design or operational specifications.
• Climate impacts: Con Edison is already experiencing extreme weather and climate impacts to assets, operations and internal processes, and customers. Recognizing the risks, Con Edison is already conducting monitoring to identify areas of heightened vulnerability in its systems. Continued monitoring and evaluation of highest risk assets for impacts or near impacts can provide information about when and where additional adaptation options may be required.
• Policy, societal, and economic conditions: Evolving external conditions may affect climate-related decision making and areas of need throughout the service territory. Con Edison is already monitoring signposts for external conditions related to policies, society, and economies as part of its long-range plans. Additional external conditions may shift with a changing climate, such as adaptation strategies and investments led by the city.
The Study team identified a set of example signposts within each category, summarized in Table 9. Con Edison could consider coordinating with the city on NPCC’s proposed New York City Climate Change Resilience Indicators and Monitoring System (Blake et al., 2019), where overlap and efficiencies in monitoring signposts may exist.
Table 9 ■ Example signposts for a flexible adaptation pathways approach
Category Example Signposts
Climate variable observations and best available climate projections
Chronic variables: Rate of change in TV, cooling degree-days, heating degree-days, sea levels, etc. relative to historical
Extreme weather variables: Number of days overheat index thresholds, storm surge levels, frequency of various storm types in the greater region, wind speeds, heat wave intensity and duration, intense precipitation levels, etc.
Updates to the best available climate projections: NPCC, IPCC, National Climate Assessment, etc.
Climate impacts Assets: Extent and magnitude of the costs of keystone asset damages (e.g., substations or power lines downed), damages incurred by events with different combinations of extreme weather, etc.
Operations and internal processes: Frequency of heat-related contingencies in the network and non-network systems, etc.
Customers: Number, spatial extent, and duration of outages caused by extreme weather, especially noting outages experienced by critical infrastructure and interdependent systems, etc.
Policy, societal, and economic conditions
Policy: Updates to New York City design guidelines, etc. Societal: Community-scale flood protection strategies led by New York City (e.g., East Side
Coastal Resiliency Project), population shifts (e.g., retreat), etc. Economic: Insurance prices and availability, etc.
Moving Towards Implementation
62 Climate Change Vulnerability Study
Selecting Cost-Effective Solutions As outlined in this Study, adapting to climate change will require investments in infrastructure and processes. Although some adaptation will be achieved through co-benefits from investments that Con Edison makes under existing processes, such as using distributed energy resources to meet growing electricity demand, other adaptation will require investments over and above those previously planned. The costs of those investments will ultimately be reflected in customers’ bills. In order to minimize the financial impact of adapting to climate change, a cost-effective resilience planning process should identify a target level of resilience along with associated metrics, strike a balance between proactive and reactive spending, consider both the costs and benefits to customers, and select adaptation strategies that provide optimal benefit at the lowest cost.
As the energy industry grapples with how best to build resilience to the changing climate, the issue of how to quantify the resilience of energy systems is front and center. There is currently no standard set of metrics for the resilience of energy systems. A 2017 report from the National Academies of Sciences, Engineering, and Medicine found that “there are no generally agreed-upon resilience metrics [for the electricity sector] that are widely used today,” also noting a contrast with the well-established set of electricity reliability metrics (NAS, 2017).
While there are a wide variety of energy resilience metrics that have been proposed or piloted in various contexts, most of these metrics fit within one of two broad categories. Performance-based metrics seek to quantify the resilience of the system through measurement of infrastructure performance during actual or modeled disruptive events. Attribute-based metrics, on the other hand, measure the presence of characteristics or features that are known or predicted to increase resilience performance in the event of a disruption. (Vugrin, Castillo, & Silva-Monroy, 2017).
Con Edison’s storm hardening investments after Superstorm Sandy were guided by a combination of performance-based metrics, such as “past performance” in the selective undergrounding of feeders, and attribute-based metrics, such as “reducing the number of customers served by a single circuit to fewer than 500 customers,” and adding “isolation devices to spurs and sub-spurs with open wire that are more than 2 spans in length” (Con Edison, 2013). Since the development of metrics is an active area of research and discussion, Con Edison could keep abreast of industry advances in resilience metrics for energy systems and incorporate those advances, where applicable, into its planning framework.
Even after a resilience metric(s) is selected, the question of exactly how much to spend on resilience or what the right level of resilience is, remains. One approach is to compare the societal cost of an outage against the cost of resiliency measures to shorten that outage. The total cost curve developed by ICF’s Mihlmester and Kumaraswamy (Figure 26) is one example of such an approach (Mihlmester & Kumaraswamy, 2013). It shows for a hypothetical utility the post-outage time needed to restore service to 90% of customers, known in the industry as “CR-90.” In this case, the lowest total costs, combining customer outage and grid-hardening costs, would be about $169 million for a 65-hour CR-90 restoration time. The graph also shows that getting the CR-90 time to less than a day would cost more than twice that amount.
For Con Edison, the “right” level of resiliency investment will be strongly linked to the climate projection design pathway selected for each of the climate stressors identified for resiliency planning.
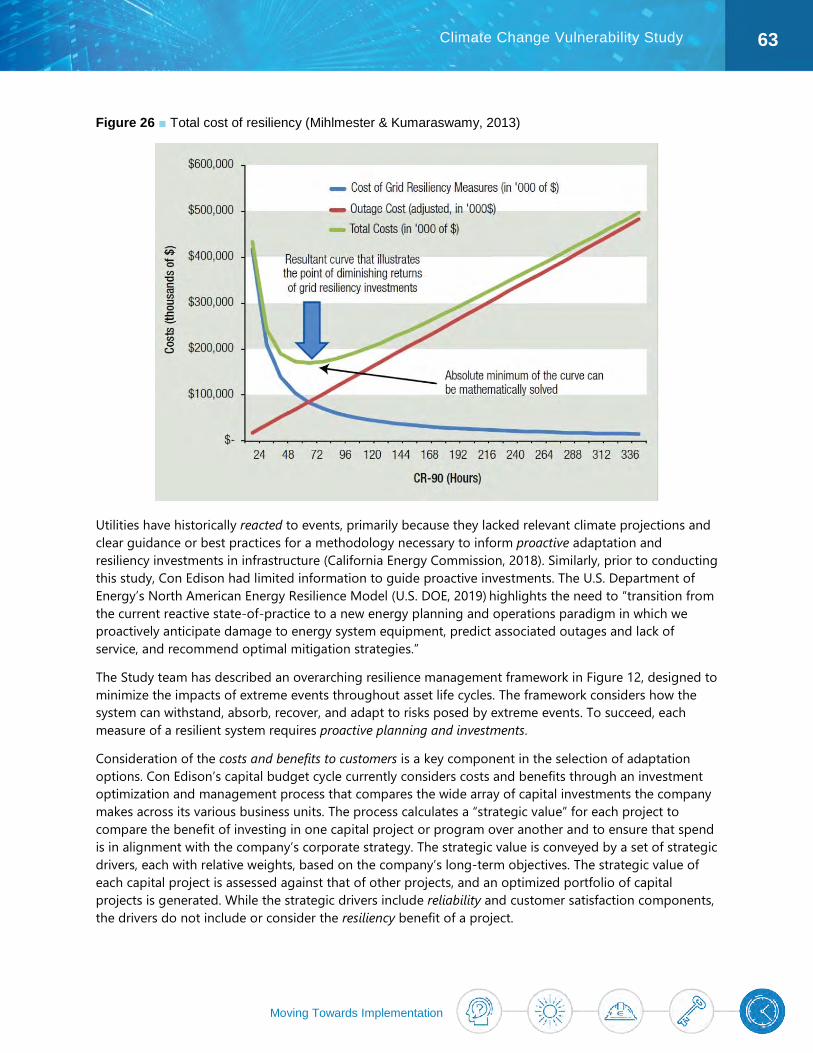
Moving Towards Implementation
63 Climate Change Vulnerability Study
Figure 26 ■ Total cost of resiliency (Mihlmester & Kumaraswamy, 2013)
Utilities have historically reacted to events, primarily because they lacked relevant climate projections and clear guidance or best practices for a methodology necessary to inform proactive adaptation and resiliency investments in infrastructure (California Energy Commission, 2018). Similarly, prior to conducting this study, Con Edison had limited information to guide proactive investments. The U.S. Department of Energy’s North American Energy Resilience Model (U.S. DOE, 2019) highlights the need to “transition from the current reactive state-of-practice to a new energy planning and operations paradigm in which we proactively anticipate damage to energy system equipment, predict associated outages and lack of service, and recommend optimal mitigation strategies.”
The Study team has described an overarching resilience management framework in Figure 12, designed to minimize the impacts of extreme events throughout asset life cycles. The framework considers how the system can withstand, absorb, recover, and adapt to risks posed by extreme events. To succeed, each measure of a resilient system requires proactive planning and investments.
Consideration of the costs and benefits to customers is a key component in the selection of adaptation options. Con Edison’s capital budget cycle currently considers costs and benefits through an investment optimization and management process that compares the wide array of capital investments the company makes across its various business units. The process calculates a “strategic value” for each project to compare the benefit of investing in one capital project or program over another and to ensure that spend is in alignment with the company’s corporate strategy. The strategic value is conveyed by a set of strategic drivers, each with relative weights, based on the company’s long-term objectives. The strategic value of each capital project is assessed against that of other projects, and an optimized portfolio of capital projects is generated. While the strategic drivers include reliability and customer satisfaction components, the drivers do not include or consider the resiliency benefit of a project.
Moving Towards Implementation
64 Climate Change Vulnerability Study
Con Edison developed and used a cost-benefit calculation model to prioritize storm hardening investments after Superstorm Sandy. The model estimated “the vulnerability of individual electric system assets based on the impact of electric system damage to customers and supporting critical infrastructure, the duration of an electric service outage, the likelihood of those assets being affected by either flooding or wind damage, and the reduction in vulnerability of those assets because of storm hardening initiatives.” (Con Edison, 2014)
Con Edison’s current distribution system planning process includes an evaluation of customer benefits resulting from investments. Con Edison’s Distributed System Implementation Plan (DSIP) (Con Edison, 2016) includes the consideration of distributed energy resources as one option to meeting growing demand. As part of Con Edison’s DSIP, the company has developed a Benefit Cost Analysis (BCA) Handbook that describes how to calculate individual benefits and costs. The BCA includes consideration of the unit cost of a particular option, per megawatt of delivery capacity, as well as an option’s “social cost.” Social cost accounts for the monetization of air pollution and carbon dioxide, using 20-year forecasts of marginal energy prices, the cost of complying with regulatory programs for constraining these pollutants, and the price paid for renewable energy credits. The social cost metric also qualitatively accounts for avoided water and land impacts. Beyond these environmental aspects, social cost accounts for net avoided restoration and outage costs to Con Edison, as well as net non-energy benefits (such as avoided service terminations, avoided uncollectable bills, and avoided noise and odor impacts).
This Study illustrates the use of multi-criteria analysis to compare criteria that may be difficult to quantify or monetize, or that may not be effectively highlighted in the financial analysis. This process identified additional complementary metrics that could be included in Con Edison’s planning and budget prioritization process to account for uncertainty in climate outcomes. These metrics fall into two categories: co-benefits and adaptation benefits. Under a non-stationary climate, co-benefits (environmental, reputational, safety, and customer financial benefits) can help planners more comprehensively evaluate response options considering the additional challenges that climate change can pose on the system. In addition, consideration of adaptation benefits (flexibility, reversibility, robustness, proven technology, and customer’s resilience) support long-term planning under climate uncertainty. These metrics allow for effective implementation of adaptation measures over time to achieve resilience. Con Edison’s current processes include some of the metrics identified in the multi-criteria analysis (environmental and safety) but not others (customer’s resilience and reversibility). Con Edison could work to incorporate this wider set of metrics as it incorporates resiliency planning into its broader capital budgeting process.
Key Issues to Be Addressed for Effective Implementation
Changes in the Policy/Regulatory and Operating Environment Changes in the policy/regulatory and operating environment other than climate change were not accounted for in this Study but will be an important consideration when moving toward implementation. For example, the prioritization of adaptation strategies, and even the understanding of vulnerabilities, will need to consider these other drivers of change. Likewise, as Con Edison undertakes studies on how these factors will impact its business, climate change impacts could be factored into those studies. Some examples of possible changes in Con Edison’s operating environment include:
• Climate change and clean energy targets: New York State and New York City have both adopted ambitious greenhouse gas emissions reduction targets (State of New York, 2019; City of New York, 2014), which will drive changes in the adoption of renewables, transportation electrification, energy storage, and
Moving Towards Implementation
65 Climate Change Vulnerability Study
so forth. It will also impact relative demand across the commodities (e.g., decreasing gas demand and increasing electricity demand).
• Technological advances: Advances in solar photovoltaics, energy storage, electric vehicles, and electrification of space heating are changing how and where electricity is generated and used.
• Customer response to climate change impacts: Customers will also have to respond to climate change impacts. This may include shifting away from flooded coastlines (depending on city-scale investments in coastal protection) and, with it, shifting demand away from portions of Con Edison’s system.
Coordination with External Entities Another critical need for effective implementation is coordination with external entities, including the City of New York and Westchester County, industry groups, equipment manufacturers, and others. Con Edison has limited authority to address certain vulnerabilities, such as the capacity of the city’s stormwater system, so coordination is necessary for developing a more resilient system. In addition, coordination is needed to ensure that Con Edison is not over-investing in locations that the city plans to protect or retreat from. This project seeded the necessary relationships; however, the continuation of the interactions will need to be specified in the governance section of the upcoming implementation plan.
Establishing a Reporting and Governance Structure Con Edison will need a continuing approach to updating stakeholders on climate risk management progress. Of the various reporting options, many companies are opting to follow the relatively new framework outlined by the Task Force on Climate-Related Financial Disclosures (TCFD).21 This framework emphasizes the need to assess both the physical risks of climate change, which is covered in this study, as well as the risks and opportunities presented by transition to a low-carbon economy. It requires consideration of the financial implications of the risks and opportunities, as well as a measurable risk management plan that is integrated with a strong governance structure.
Two risks that were not explored in this study, but would fit well in the TCFD framework, include:
• Costs and penalizations from service failure and outages: Costs associated with an outage event include restoration; collateral damage; customer claims; penalties, fines, audits, remediation, and reporting; and the financial impact of lost confidence. For example, in 2007, Con Edison was penalized $18 million for its 2006 service disruptions, which included a 9-day blackout in western Queens.
• Credit rating: Increasingly frequent and intense extreme weather events could also impact credit rating risks and insurance liabilities. Credit rating agencies like Standard & Poor’s and Moody’s have added “resiliency” as a component of their rating criteria, indicating the relevance of climate risk for creditworthiness (Shafroth, 2016). Similarly, utilities may be increasingly choosing to retain a higher level of insurance to cope with more frequent and destructive weather-related events. However, a higher level of insurance protection leads to higher costs that may ultimately be reflected on customers’ bills. Thus, while not as visible as physical asset or planning vulnerabilities, climate risks related to credit and insurance can have an impact on the utility.
Establishing a governance structure will be crucial for the successful continuation of Con Edison’s climate change adaptation work. The governance structure can be used to encourage and track progress on the implementation of adaptation strategies (i.e., performance against set metrics and targets), ensure specific
21 For more information on the Task Force on Climate-Related Financial Disclosures, see https://www.fsb-tcfd.org/
Moving Towards Implementation
66 Climate Change Vulnerability Study
people are on point for monitoring and implementing various strategies, and establish a frequency and process for reporting on risks and adaptation actions from individual employees to senior managers to Con Edison’s board of directors.
Next Steps As a next step from this Study, Con Edison will develop a detailed Climate Change Implementation Plan to operationalize the suggestions from this Climate Change Vulnerability Study. The implementation plan will:
• Review the Study and investigate whether recent progress in climate science may warrant inclusion. • Select climate change pathway(s) to incorporate into design standards and procedures. • Establish life cycle tables that provide timeframes of reference climate variables through 2080. • Aggregate input from subject matter experts on changes required for specifications/procedures and
choices for risk mitigation measures. • Develop a timeline and written plan for the implementation of risk mitigation measures. • Identify the scope and cost within the 5-year capital plan and 10- and 20-year long-range plans. • Establish signposts for the re-evaluation of measure installation schedules. • Conduct periodic progress meetings for external stakeholders. • Recommend a governance structure for climate change monitoring and updating.
REFERENCES
67 Climate Change Vulnerability Study
References Baja, K. (2018). Resilience Hubs: Shifting Power to Communities and Increasing Community Capacity. Urban Sustainability Directors Network. Retrieved from https://www.usdn.org/uploads/cms/documents/usdn_resiliencehubs_2018.pdf
Blake, R., Jacob, K., Yohe, G., Zimmerman, R., Manley, D., Solecki, W., & Rosenzweig, C. (2019). New York City Panel on Climate Change 2019 Report Chapter 8: Indicators and Monitoring. The New York Academy of Sciences.
Bruzgul, J., Kay, R., Rodehorst, B., Petrow, A., Hendrickson, T., Bruguera, M., . . . Revell, D. (2018). Rising Seas and Electricity Infrastructure: Potential Impacts and Adaptation Options for San Diego Gas and Electric (SDG&E). State of California Energy Commission.
California Energy Commission. (2018). Rising Sea and Electricity Infrastructure, Potential Impacts and Adaptation Options for San Diego Gas and Electric .
City of New York. (2014). Mayor de Blasio Commits to 80 Percent Reduction of Greenhouse Gas Emissions by 2050, Starting with Sweeping Green Buildings Plan. New York, NY, United States. Retrieved from https://www1.nyc.gov/office-of-the-mayor/news/451-14/mayor-de-blasio-commits-80-percent-reduction-greenhouse-gas-emissions-2050-starting-with#/0
Colle, B., Zhang, Z., Lombardo, K., Liu, P., Chang, E., & Zhang, M. (2013). Historical evaluation and future prediction in eastern North America and western Atlantic and western Atlantic extratropical cyclones in the CMIP5 models during the cool season. 26, 6882-6903.
Con Edison. (2013). Post Sandy Enhancement Plan. New York, NY. Retrieved from https://www.coned.com/-/media/files/coned/documents/services-outages/post_sandy_enhancement_plan.pdf
Con Edison. (2013). Storm Hardening and Resiliency Collaborative Report. New York, NY. Retrieved from http://documents.dps.ny.gov/public/Common/ViewDoc.aspx?DocRefId={E6D76530-61DB-4A71-AFE2-17737A49D124}
Con Edison. (2014). Amended Storm Hardening and Resiliency Collaborative Phase Two Report. New York, NY. Retrieved from http://documents.dps.ny.gov/public/Common/ViewDoc.aspx?DocRefId={8EF43E8C-3677-4561-A920-7BFAB1DF0DD9}
Con Edison. (2016). Distributed System Implementation Plan. New York, NY. Retrieved from https://www.coned.com/-/media/files/coned/documents/our-energy-future/our-energy-projects/cecony-dsip.pdf?la=en
Con Edison. (2019). Electric Long-Range Plan. New York, NY. Retrieved from https://www.coned.com/-/media/files/coned/documents/our-energy-future/our-energy-projects/electric-long-range-plan.pdf
DeConto, R. M., & Pollard, D. (2016). Contribution of Antarctica to past and future sea-level rise. 531(7596), 591-597.
REFERENCES
68 Climate Change Vulnerability Study
Fitzpatrick, M. C., & Dunn, R. R. (2019). Contemporary Climatic Analogs for 540 North American Urban Areas in the Late 21st Century. 10(1), 614.
GCRP. (2017). Climate Science Special Report: Fourth National Climate Assessment, Volume 1. Washington, DC.
Horton, R., & Liu, J. (2014). Beyond Hurricane Sandy: What might the future hold for tropical cyclones in the North Atlantic? 01(01), 1450007.
IPCC. (2013). The Physical Science Basis: Contribution of Working Group I to the Fifth Assessment Report of the Intergovernmental Panel on Climate Change. Cambridge, United Kingdom and New York, NY, USA: Cambridge University Press.
Kopp, R., DeConto, R., Bader, D., Hay, C., Horton, R., Kulp, S., . . . Strauss, B. (2017). Evolving Understanding of Antarctic Ice-Sheet Physics and Ambiguity in Probabilistic Sea-Level Projections. Earth's Future, 5(12), 1217-1233.
Kopp, R., Horton, R., Little, M., Mitrovica, J., Oppenheimer, M., Rasmussen, D., . . . Tebaldi, C. (2014). Probabilistic 21st and 22nd century sea-level projections at a global network of tide-gauge sites. Earth's Future, 2(8), 383-406.
Linkov, I., Anklam, E., Collier, A. A., DiMase, D., & Renn, O. (2014). Risk-based standards: integrating top-down and bottom-up approaches. Environmental Systems and Decisions., 34, 134-137.
Metro ECSD. (2019). Metro Climate Action and Adaptation Plan. Los Angeles, CA, United States. Retrieved from https://media.metro.net/projects_studies/sustainability/images/Climate_Action_Plan.pdf
Mihlmester, P., & Kumaraswamy, K. (2013). What Price, Resiliency? Public Utilities Fortnightly, 46-51.
NAS. (2017). Enhancing the Resilience of the Nation's Electricity System. The National Academies of Sciences, Engineering, and Medicine (NAS). Retrieved from https://www.nap.edu/catalog/24836/enhancing-the-resilience-of-the-nations-electricity-system
Nasim Rezaei, S., Chouinard, L., Legeron, F., & Langlois, S. (2015). Vulnerability Analysis of Transmission Towers subjected to Unbalanced Loads. Vancouver, Canada: 12th International Conference on Applications of Statistics and Probability in Civil Engineering. Retrieved from https://pdfs.semanticscholar.org/4d68/af2b2dd4f0073ed40744e57fcb9c9763899e.pdf
New York City Mayor's Office of Resiliency. (2019). Climate Resiliency Design Guidelines. Retrieved from https://www1.nyc.gov/assets/orr/pdf/NYC_Climate_Resiliency_Design_Guidelines_v3-0.pdf
New York Department of Public Service. (2018). 2017 Electric Reliability Performance Report. Office of Electric, Gas, and Water.
NPCC. (2013). Climate Risk Information 2013: Observations, Climate Change Projections, and Maps. (C. R. Solecki, Ed.) New York, NY, United States: Prepared for use by the City of New York Special Initiative on Rebuilding and Resiliency.
NPCC. (2019). Advancing Tools and Methods for Flexible Adaptation Pathways and Science Policy Integration. New York, NY, United States: The New York Academy of Sciences.
REFERENCES
69 Climate Change Vulnerability Study
Rosenzweig, C., & Solecki, W. (2014). Hurricane Sandy and Adaptation Pathways in New York: Lessons from a First Responder City. Global Environmental Change, 28, 395-408.
Sathaye, J. A. (2013). Estimating impacts of warming temperatures on California's electricity system. Global environmental change, 23(2), 499-511.
SDG&E. (2019). Flexible Sea Level Rise Adaptation Pathway for Montgomery Substation. Public Utilities Commission of the State of California. Retrieved from http://docs.cpuc.ca.gov/PublishedDocs/Efile/G000/M320/K713/320713398.PDF
Shafroth, F. (2016). Climate Change and Credit Ratings. Governing. Retrieved from https://www.governing.com/columns/public-money/gov-climate-change-credit-ratings.html
State of New York. (2019). Climate Leadership and Community Protection Act. New York, United States. Retrieved from https://legislation.nysenate.gov/pdf/bills/2019/S6599
U.S. DOE. (2019). U.S. DOE Energy Resilience Model. Retrieved from https://www.energy.gov/sites/prod/files/2019/07/f65/NAERM_Report_public_version_072219_508.pdf
Vugrin, E., Castillo, A., & Silva-Monroy, C. (2017). Resilience Metrics for the Electric Power. Sandia National Laboratories.
Zarzycki, C. M. (2018). Projecting Changes in Societally Impactful Northeastern U.S. Snowstorms. American Geophysical Union, 45(21), 12,067-12,075.
Moving Towards Implementation
APPENDICES
APPENDICES
71 Climate Change Vulnerability Study
Appendices To inform the conclusions of this Study, the Study team undertook a series of in-depth vulnerability assessments corresponding to the climate hazards representing outsized risks to Con Edison: temperature, humidity, precipitation, sea level rise, and extreme events. These are included as appendices. Each appendix includes detailed historical and projected climate conditions; corresponding climate-driven vulnerabilities to operations, planning, and infrastructure across the company’s electric, gas, and steam systems; and potential adaptation strategies to mitigate vulnerabilities.
For each hazard, the Study team collaborated with Con Edison subject matter experts to conduct a rapid screen of the sensitivity of operations, planning, and infrastructure to support a risk-first approach. Vulnerabilities were then selected for more detailed analyses, which focused on understanding asset vulnerabilities to climate change and, in turn, relevant adaptation options and evaluation of their costs and co-benefits. These analyses informed the development of flexible solutions and signposts to guide implementation of potential adaptation options through time.
Ultimately, the five appendices provide key context for the climate science, vulnerabilities, and adaptation strategies discussed in this report, and as such, can be referenced for more comprehensive information in each subject area.
• Appendix 1 – Temperature: Identifies how projected gradual trends in increasing temperature may affect operations, planning, and infrastructure across the electric, gas, and steam segments of Con Edison’s business.
• Appendix 2 – Humidity, Temperature Variable, and Load: Addresses climate variables—humidity (expressed through wet bulb temperature), heat waves, cooling degree-days, heating degree-days, and the combination of projected changes in wet and dry bulb temperatures—that have a direct effect on system loads and reliability. These variables are also specifically addressed in specifications and procedures associated with upgrading system capacity and maintaining system reliability.
• Appendix 3 – Changes in Precipitation Patterns: Discusses the potential for climate-driven changes in rainfall and frozen precipitation in Con Edison’s service territory, and the potential impacts of those changes on Con Edison’s assets and operations.
• Appendix 4 – Sea Level Rise and Changes in Coastal Storm Surge Potential: Examines the ways in which changes in sea level may affect operations, planning, and infrastructure across the electric, gas, and steam segments of Con Edison’s business.
• Appendix 5 – Extreme Events: Describes how extreme weather events (hurricanes, nor’easters, and heat waves), as well as concurrent or consecutive extreme events, may become more frequent and severe due to climate change, and considers their potential impact on operations, planning, and infrastructure across the electric, gas, and steam segments of Con Edison’s business over the coming century.