china’s energy future
TRANSCRIPT
China’s Energy Future
How economic rebalancing, environmental concerns,
and policy reforms will accelerate change
Richard G. Newell
Director, Duke University Energy Initiative and Gendell Professor of Energy and Environmental Economics,
Nicholas School of the Environment, Duke University
KAPSARC Workshop on ‘Reforming China’s Energy Economy’
November 12, 2015 | Riyadh, Saudi Arabia
Overview
Richard Newell, 11/12/2015, Riyadh 2
• Historical growth in China’s energy consumption
• Future energy projections
• Key drivers of China’s energy future
– Scale and structure of China’s economic growth
– Local and global environmental concerns in China
– Economic, energy, and environmental policy reforms
Historical growth in
China’s energy consumption
3Richard Newell, 11/12/2015, Riyadh
0%
10%
20%
30%
40%
50%
60%
70%
80%
90%
100%
1970 1975 1980 1985 1990 1995 2000 2005 2010
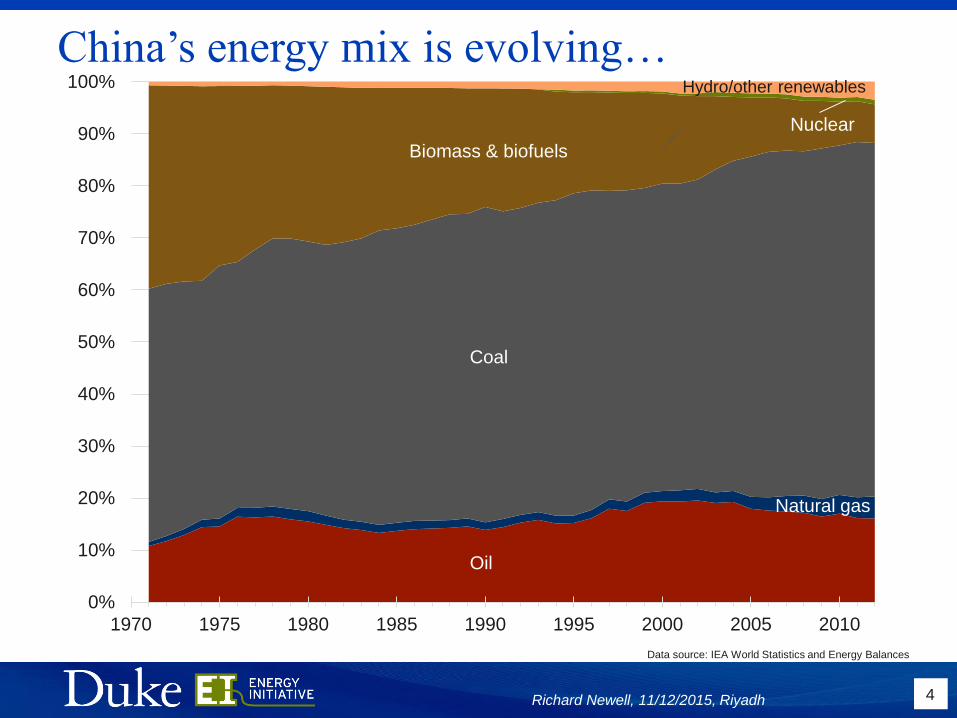
China’s energy mix is evolving…
4Richard Newell, 11/12/2015, Riyadh
Data source: IEA World Statistics and Energy Balances
Coal
Oil
Natural gas
Biomass & biofuels
Nuclear
Hydro/other renewables
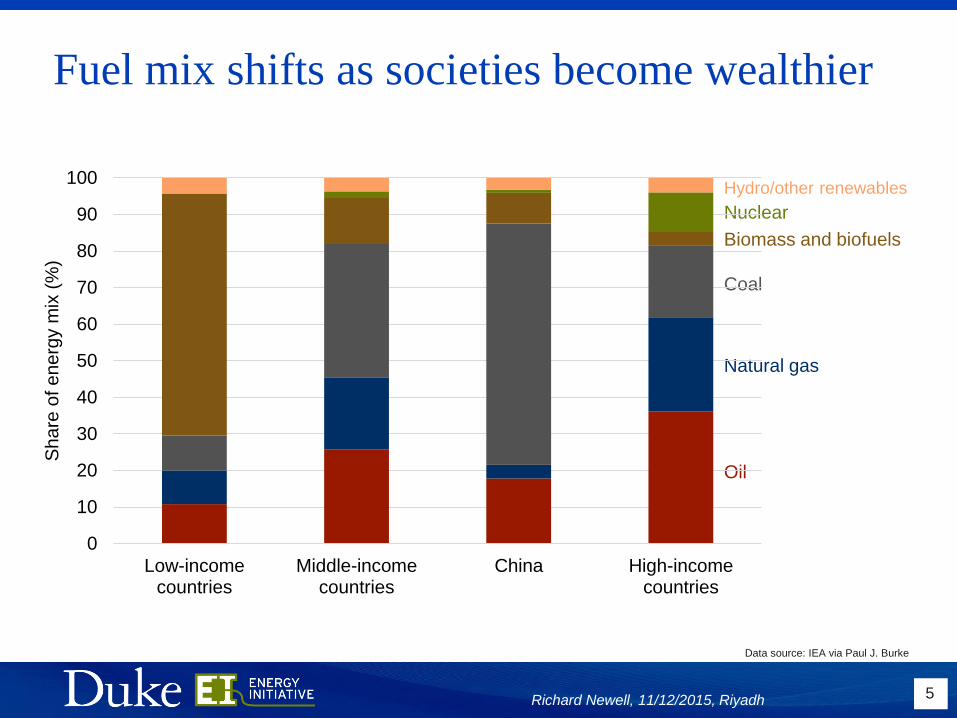
Fuel mix shifts as societies become wealthier
5Richard Newell, 11/12/2015, Riyadh
Data source: IEA via Paul J. Burke
Coal
Oil
Natural gas
Biomass and biofuels
Nuclear
Hydro/other renewables
0
10
20
30
40
50
60
70
80
90
100
Low-incomecountries
Middle-incomecountries
China High-incomecountries
Sh
are
of e
ne
rgy m
ix (
%)
0
20
40
60
80
100
120
1970 1975 1980 1985 1990 1995 2000 2005 2010
Quadrilli
on B
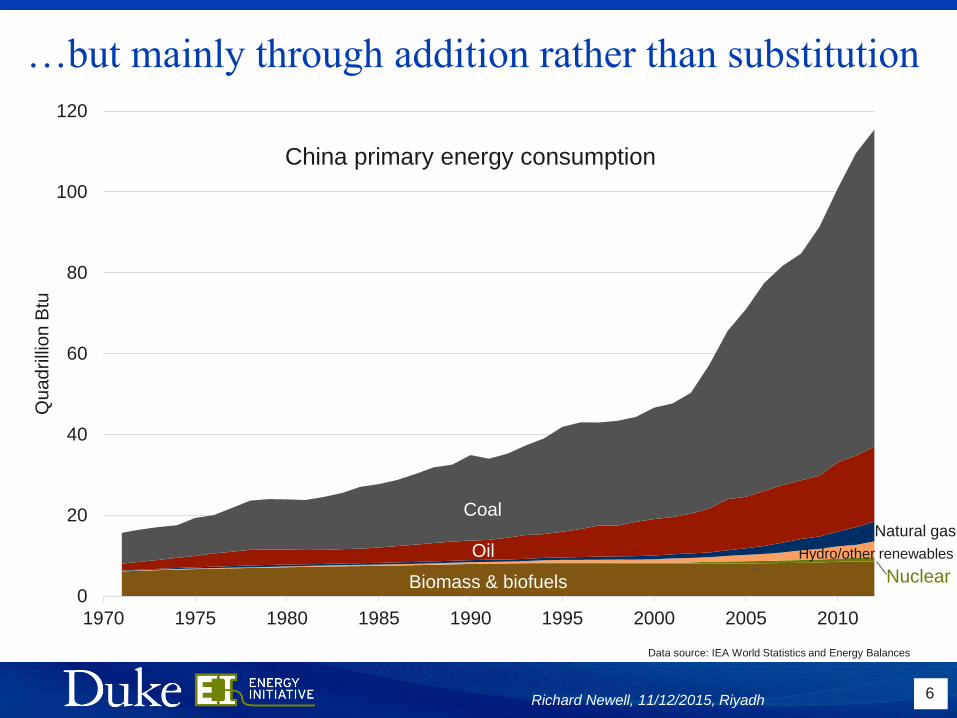
tu…but mainly through addition rather than substitution
6Richard Newell, 11/12/2015, Riyadh
Data source: IEA World Statistics and Energy Balances
Coal
OilNatural gas
Biomass & biofuels Nuclear
Hydro/other renewables
China primary energy consumption
Richard Newell, 11/12/2015, Riyadh 7
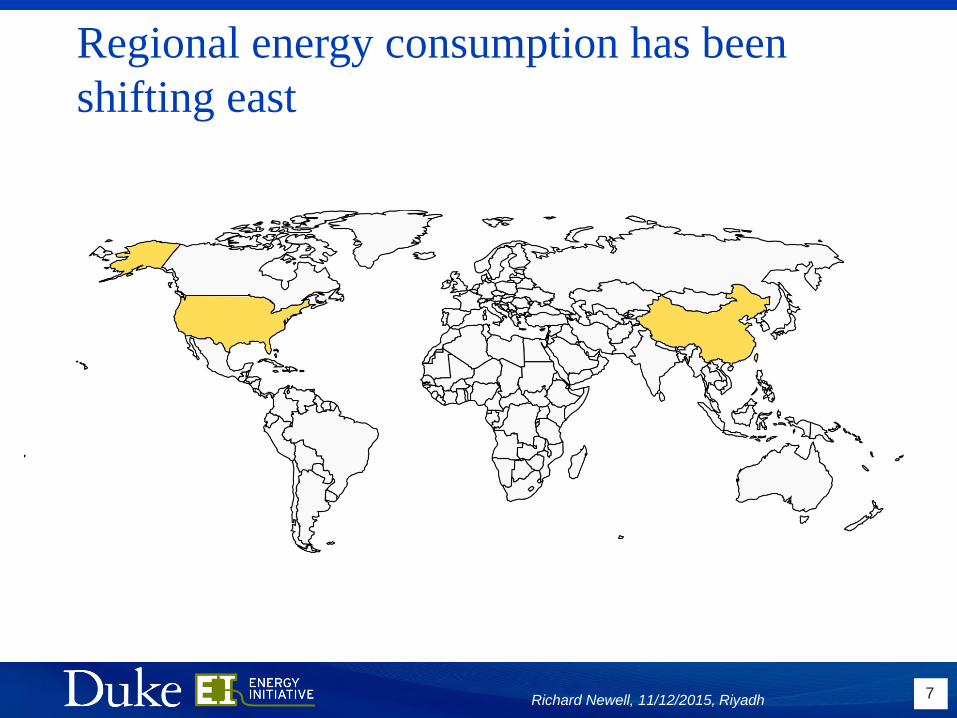
Regional energy consumption has been
shifting east

1971
8
$0.4 trillion
China’s GDP
Richard Newell, 11/12/2015, Riyadh
Country size
scaled by share
of global energy
consumption
Data source: IEA World Statistics. China’s GDP reflects purchasing power parity in 2005 US dollar.
.
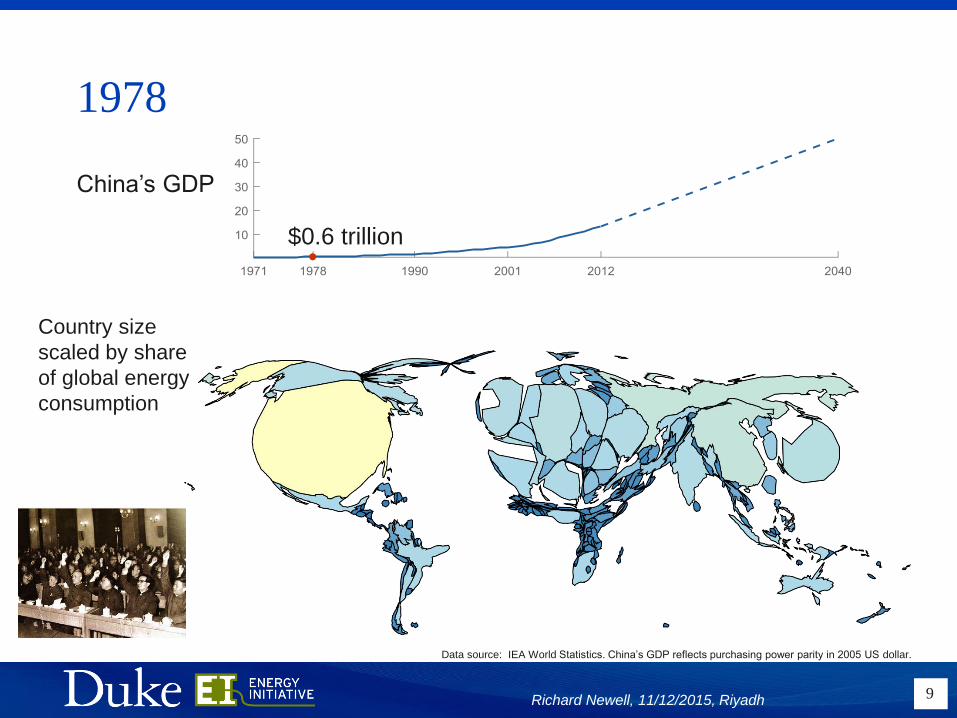
1978
9
$0.6 trillion
China’s GDP
Richard Newell, 11/12/2015, Riyadh
Country size
scaled by share
of global energy
consumption
Data source: IEA World Statistics. China’s GDP reflects purchasing power parity in 2005 US dollar.
.
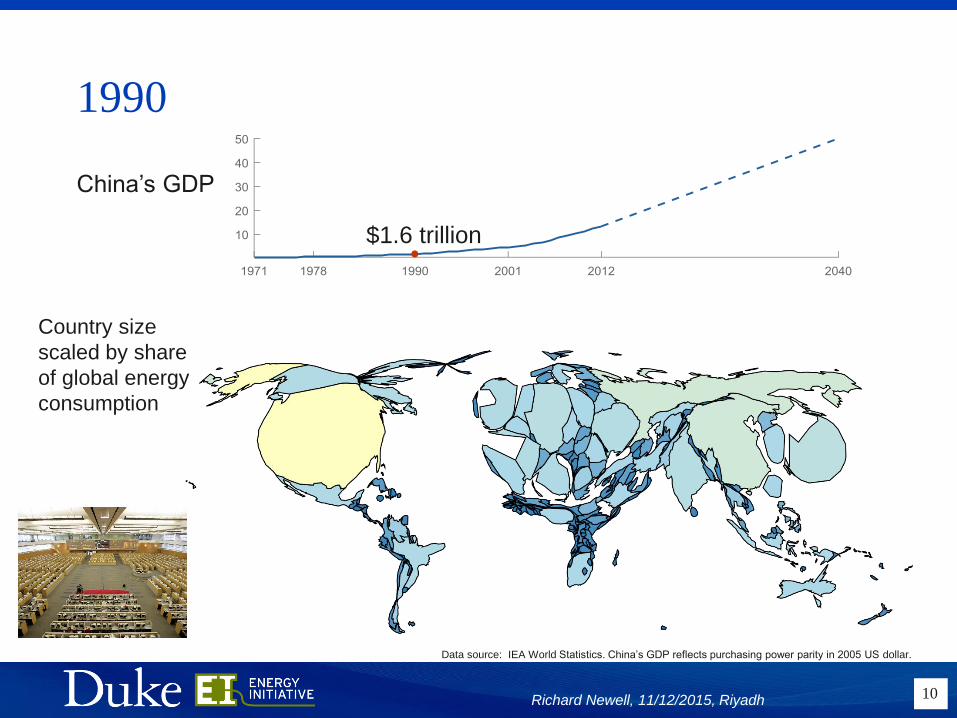
1990
10
$1.6 trillion
China’s GDP
Richard Newell, 11/12/2015, Riyadh
Country size
scaled by share
of global energy
consumption
Data source: IEA World Statistics. China’s GDP reflects purchasing power parity in 2005 US dollar.
.
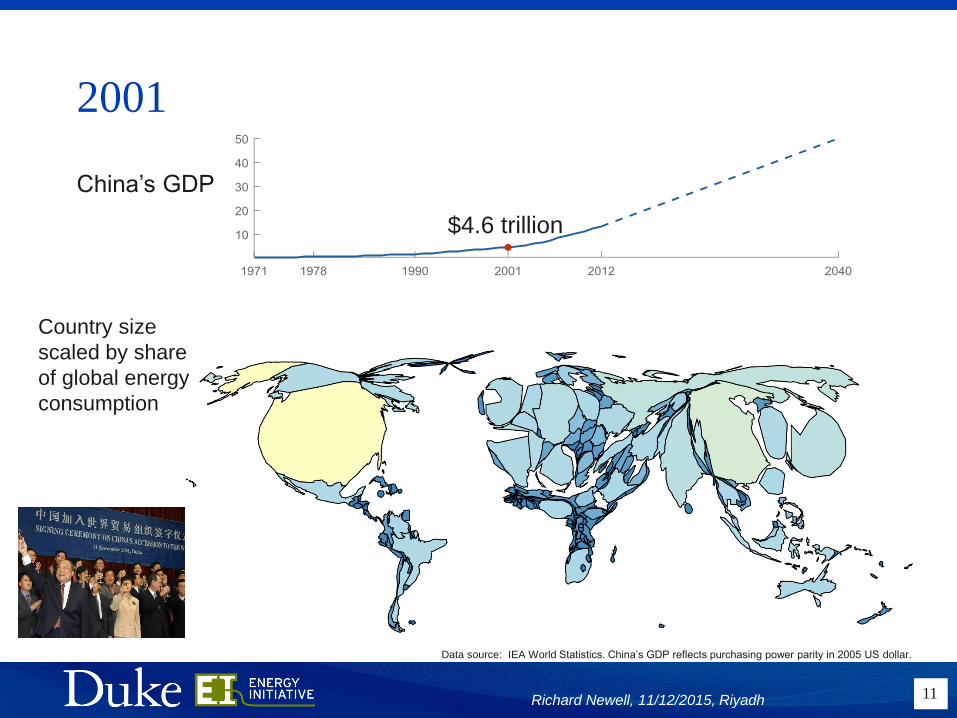
2001
11
$4.6 trillion
China’s GDP
Richard Newell, 11/12/2015, Riyadh
Country size
scaled by share
of global energy
consumption
Data source: IEA World Statistics. China’s GDP reflects purchasing power parity in 2005 US dollar.
.
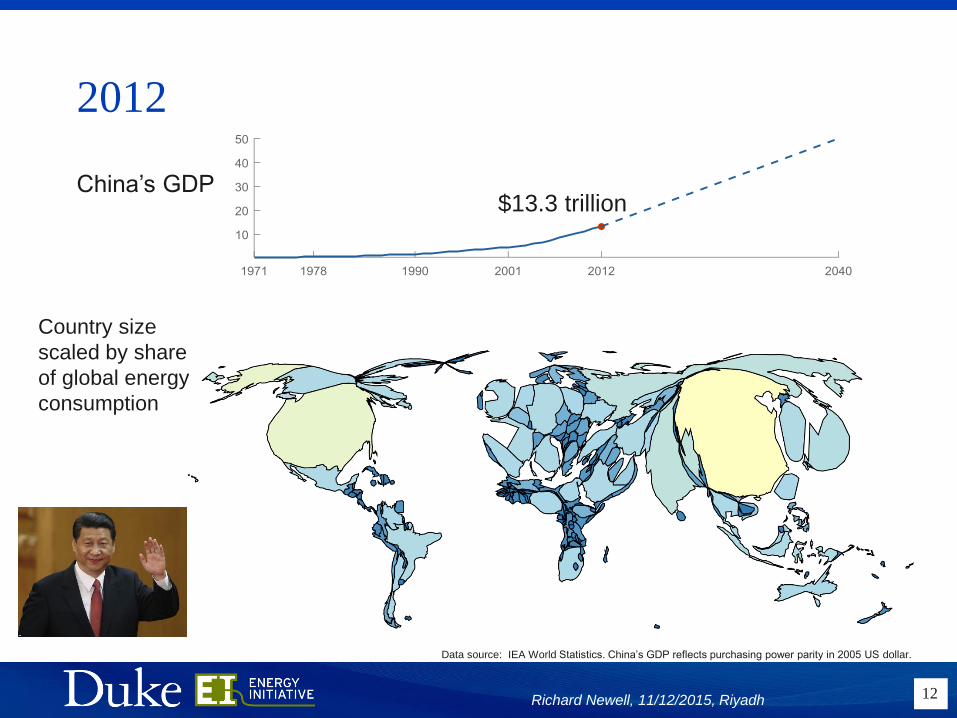
2012
12
$13.3 trllionChina’s GDP
$13.3 trillion
Richard Newell, 11/12/2015, Riyadh
Country size
scaled by share
of global energy
consumption
Data source: IEA World Statistics. China’s GDP reflects purchasing power parity in 2005 US dollar.
.
Future energy projections
13Richard Newell, 11/12/2015, Riyadh
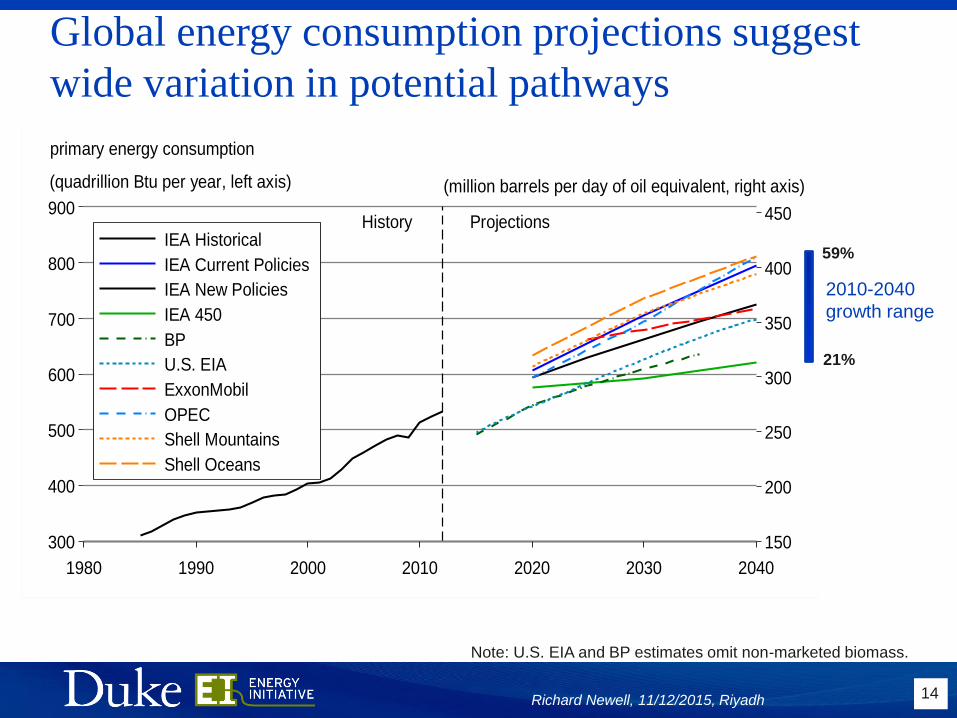
Global energy consumption projections suggest
wide variation in potential pathways
14
History Projections
(quadrillion Btu per year, left axis) (million barrels per day of oil equivalent, right axis)
150
200
250
300
350
400
450
300
400
500
600
700
800
900
1980 1990 2000 2010 2020 2030 2040
IEA Historical
IEA Current Policies
IEA New Policies
IEA 450
BP
U.S. EIA
ExxonMobil
OPEC
Shell Mountains
Shell Oceans
primary energy consumption
2010-2040
growth range
59%
21%
Note: U.S. EIA and BP estimates omit non-marketed biomass.
Richard Newell, 11/12/2015, Riyadh
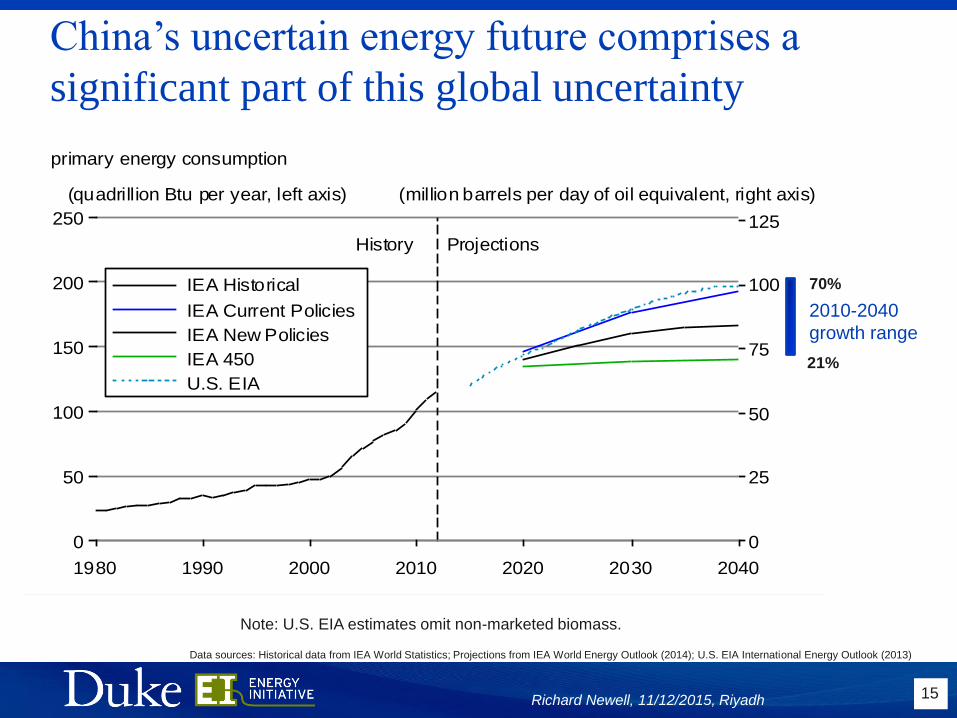
China’s uncertain energy future comprises a
significant part of this global uncertainty
15
Note: U.S. EIA estimates omit non-marketed biomass.
Richard Newell, 11/12/2015, Riyadh
History Projections
(quadrillion Btu per year, left axis) (million barrels per day of oil equivalent, right axis)
0
25
50
75
100
125
0
50
100
150
200
250
1980 1990 2000 2010 2020 2030 2040
IEA Historical
IEA Current Policies
IEA New Policies
IEA 450
U.S. EIA
primary energy consumption
2010-2040
growth range
70%
21%
Data sources: Historical data from IEA World Statistics; Projections from IEA World Energy Outlook (2014); U.S. EIA International Energy Outlook (2013)
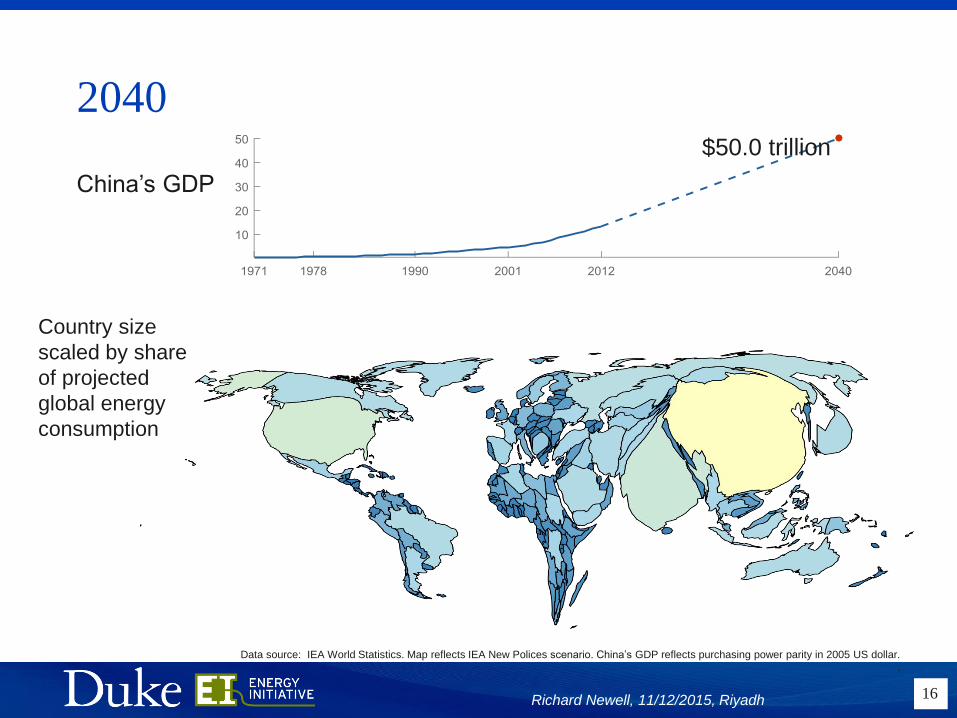
2040
16
$50.0 trillion
China’s GDP
Richard Newell, 11/12/2015, Riyadh
Country size
scaled by share
of projected
global energy
consumption
Data source: IEA World Statistics. Map reflects IEA New Polices scenario. China’s GDP reflects purchasing power parity in 2005 US dollar.
.
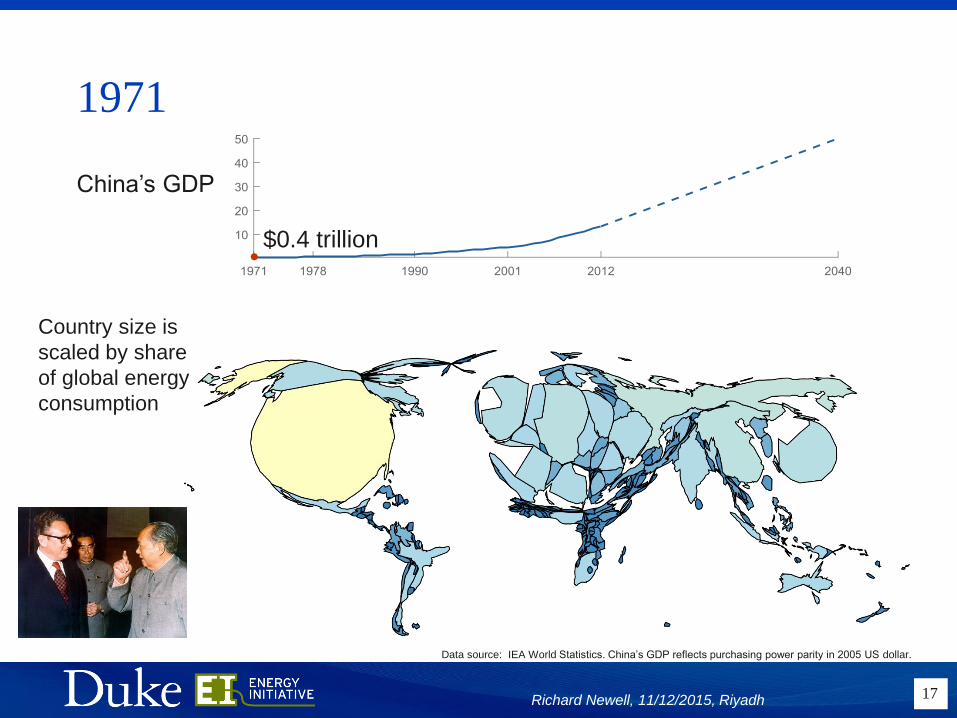
1971
17
$0.4 trillion
China’s GDP
Data source: IEA World Statistics. China’s GDP reflects purchasing power parity in 2005 US dollar.
.
Richard Newell, 11/12/2015, Riyadh
Country size is
scaled by share
of global energy
consumption
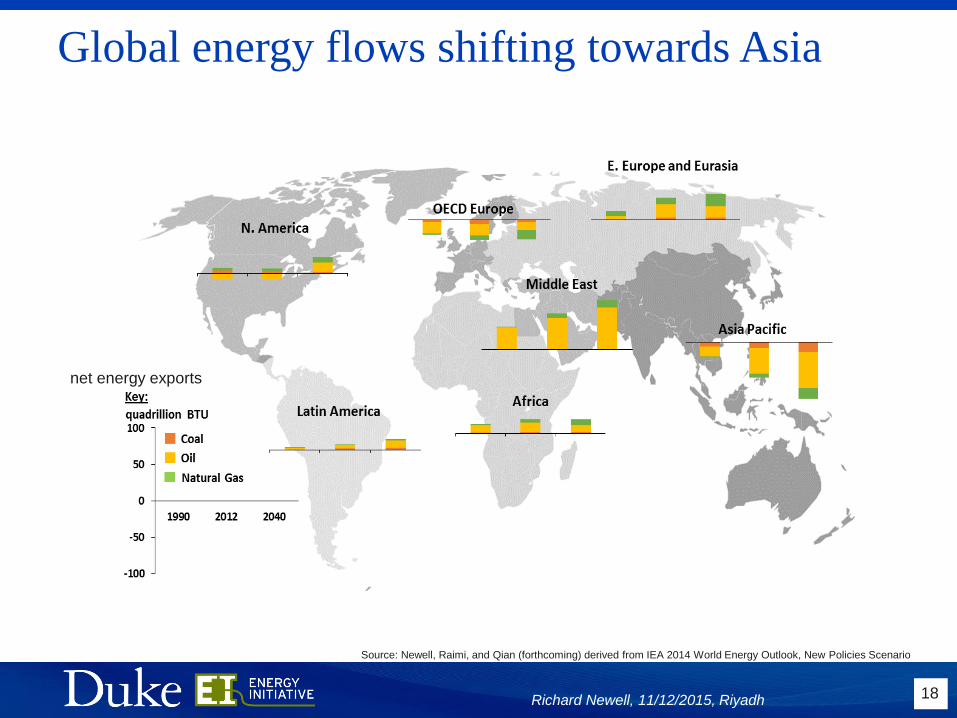
Global energy flows shifting towards Asia
18Richard Newell, 11/12/2015, Riyadh
Source: Newell, Raimi, and Qian (forthcoming) derived from IEA 2014 World Energy Outlook, New Policies Scenario
net energy exports
Key drivers of China’s energy future
19Richard Newell, 11/12/2015, Riyadh
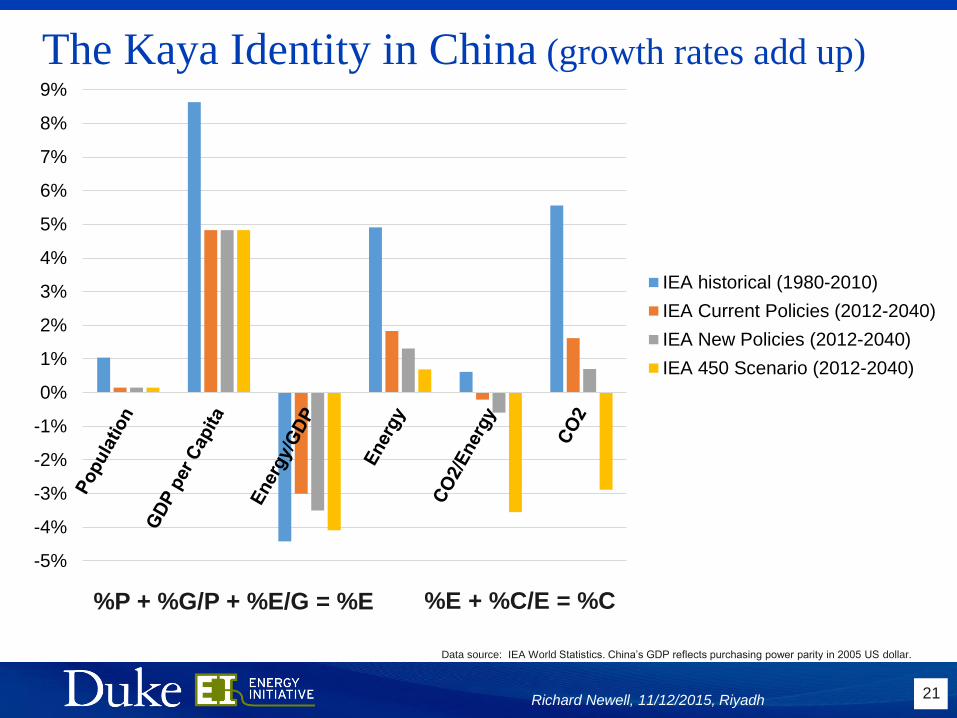
The Kaya Identity in China (growth rates add up)
21Richard Newell, 11/12/2015, Riyadh
%P + %G/P + %E/G = %E
-5%
-4%
-3%
-2%
-1%
0%
1%
2%
3%
4%
5%
6%
7%
8%
9%
IEA historical (1980-2010)
IEA Current Policies (2012-2040)
IEA New Policies (2012-2040)
IEA 450 Scenario (2012-2040)
%E + %C/E = %C
Data source: IEA World Statistics. China’s GDP reflects purchasing power parity in 2005 US dollar.
.
Scale and structure of
China’s future economic growth
22Richard Newell, 11/12/2015, Riyadh
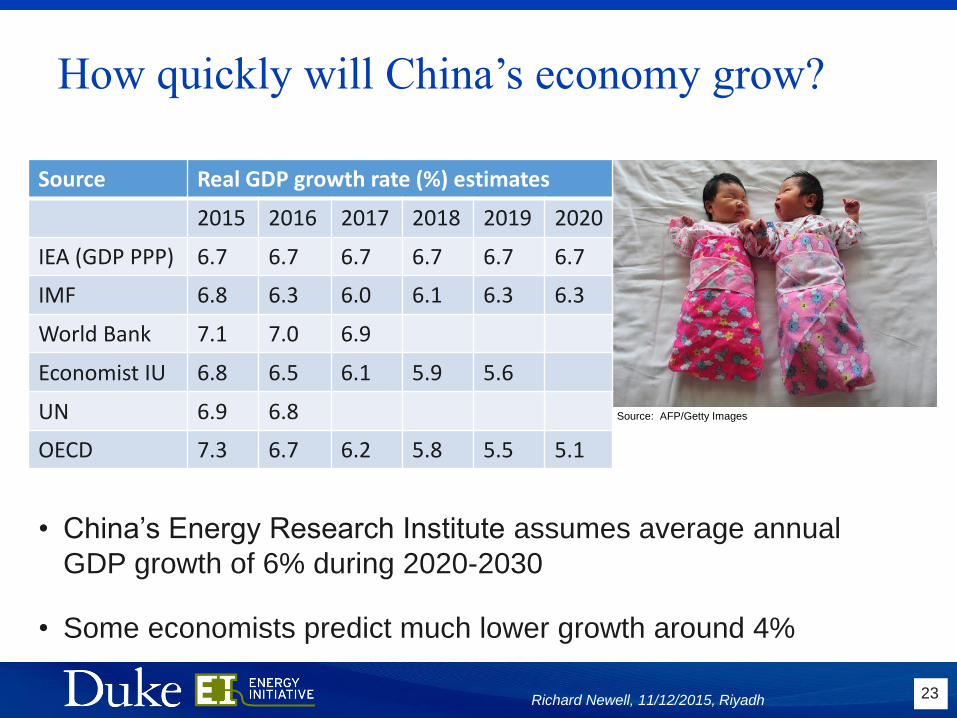
How quickly will China’s economy grow?
23Richard Newell, 11/12/2015, Riyadh
Source: AFP/Getty Images
Source Real GDP growth rate (%) estimates
2015 2016 2017 2018 2019 2020
IEA (GDP PPP) 6.7 6.7 6.7 6.7 6.7 6.7
IMF 6.8 6.3 6.0 6.1 6.3 6.3
World Bank 7.1 7.0 6.9
Economist IU 6.8 6.5 6.1 5.9 5.6
UN 6.9 6.8
OECD 7.3 6.7 6.2 5.8 5.5 5.1
• China’s Energy Research Institute assumes average annual
GDP growth of 6% during 2020-2030
• Some economists predict much lower growth around 4%
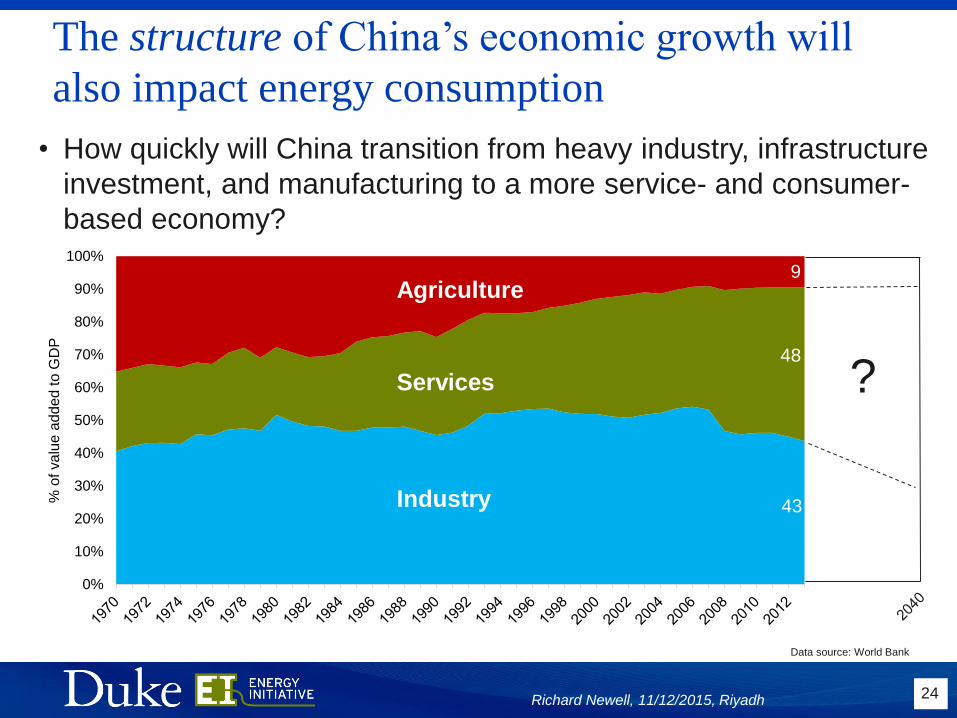
The structure of China’s economic growth will
also impact energy consumption
24
• How quickly will China transition from heavy industry, infrastructure
investment, and manufacturing to a more service- and consumer-
based economy?
Richard Newell, 11/12/2015, Riyadh
Data source: World Bank
0%
10%
20%
30%
40%
50%
60%
70%
80%
90%
100%
% o
f va
lue a
dd
ed
to
GD
P
Industry
Services
Agriculture
?
9
48
43

Market-oriented policy changes could also
accelerate change in China’s energy system
25Richard Newell, 11/12/2015, Riyadh
Example market-oriented policy reforms
Opening up fossil fuel assets to independent exploration
Reorganization of state-owned energy companies
Pricing deregulation
Expanded market mechanisms in the power sector
Liberalization of interest rates
Allowing Chinese to more easily buy foreign assets
Local and global environmental
concerns in China
26Richard Newell, 11/12/2015, Riyadh
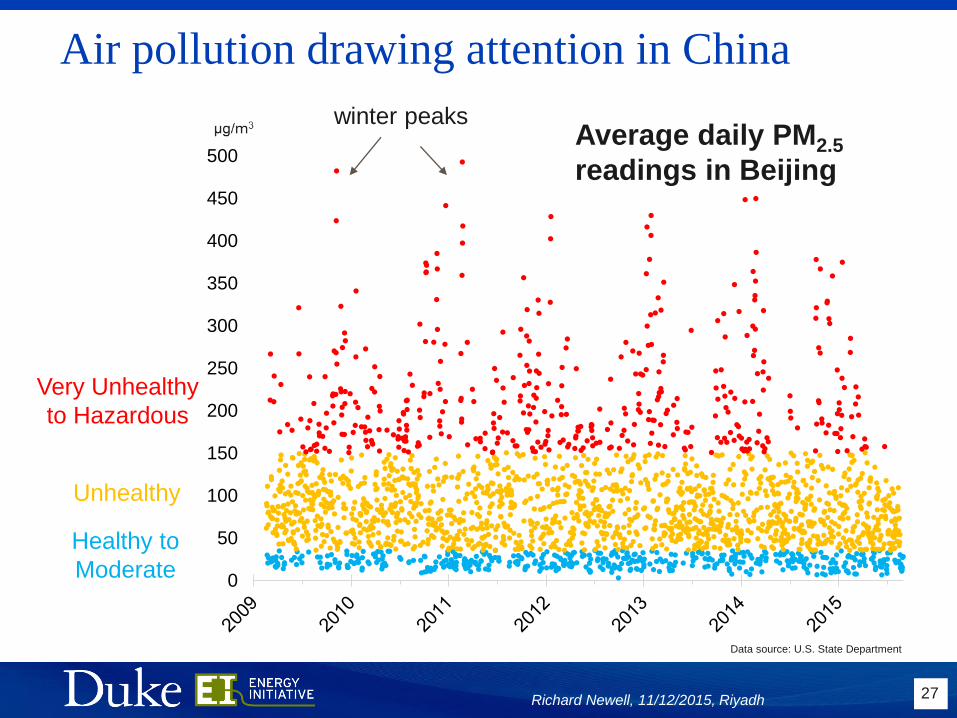
Air pollution drawing attention in China
27Richard Newell, 11/12/2015, Riyadh
Data source: U.S. State Department
Very Unhealthy
to Hazardous
Unhealthy
Healthy to
Moderate0
50
100
150
200
250
300
350
400
450
500Average daily PM2.5
readings in Beijing
winter peaks
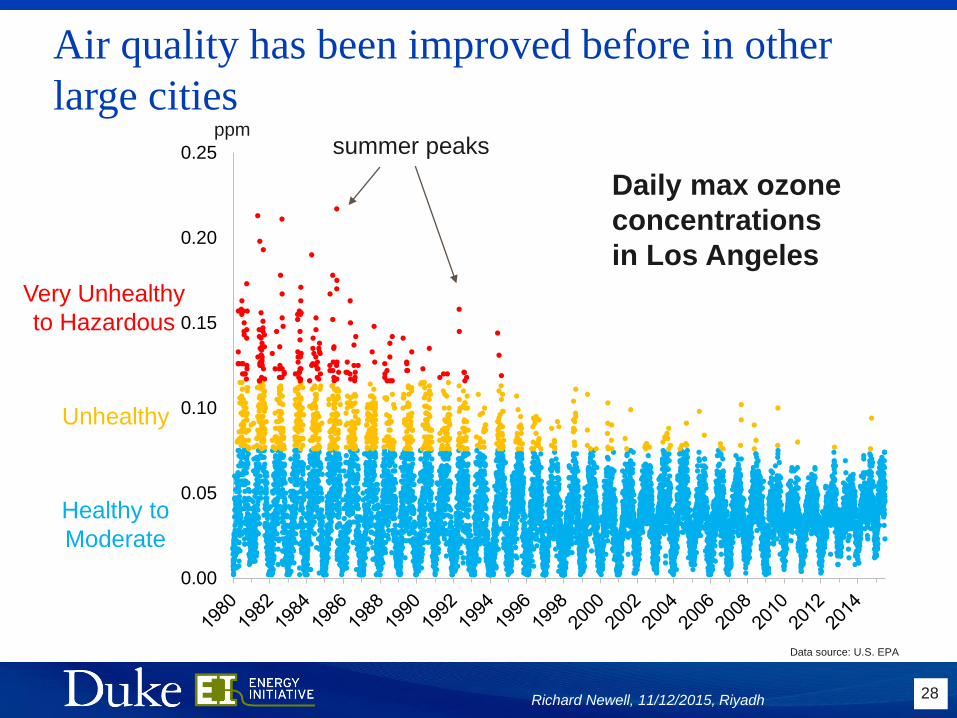
Air quality has been improved before in other
large cities
28Richard Newell, 11/12/2015, Riyadh
Data source: U.S. EPA
Very Unhealthy
to Hazardous
Unhealthy
Healthy to
Moderate
Daily max ozone
concentrations
in Los Angeles
0.00
0.05
0.10
0.15
0.20
0.25
ppmsummer peaks
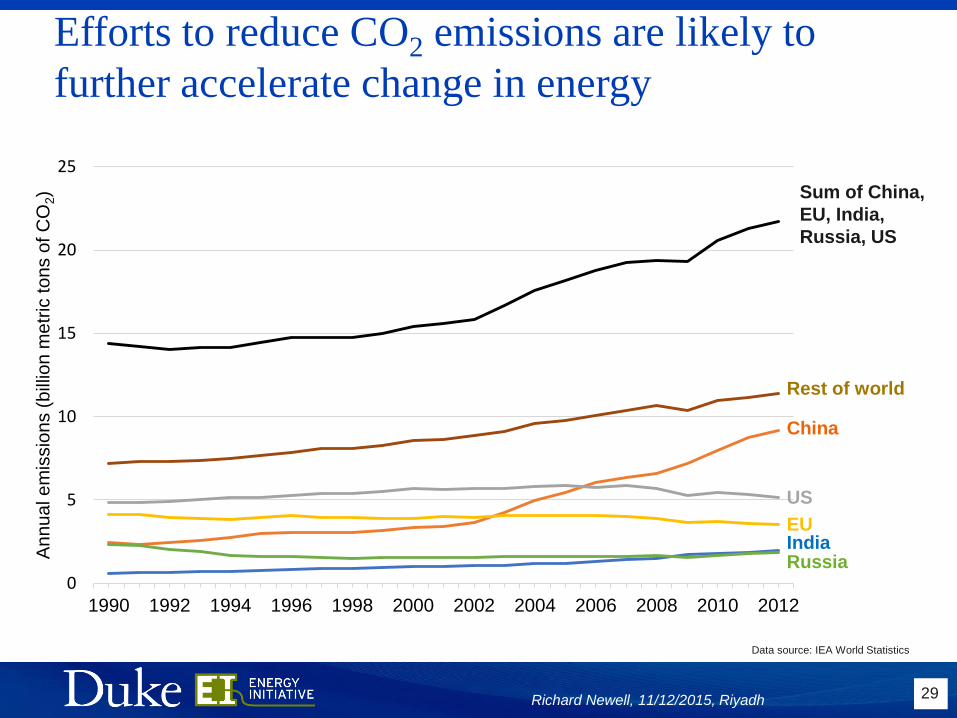
Efforts to reduce CO2 emissions are likely to
further accelerate change in energy
29Richard Newell, 11/12/2015, Riyadh
Data source: IEA World Statistics
0
5
10
15
20
25
1990 1992 1994 1996 1998 2000 2002 2004 2006 2008 2010 2012
An
nu
al e
mis
sio
ns (
bill
ion
me
tric
to
ns o
f C
O2) Sum of China,
EU, India,
Russia, US
Rest of world
China
US
EUIndiaRussia

Energy and environmental policy
reforms in China
30Richard Newell, 11/12/2015, Riyadh
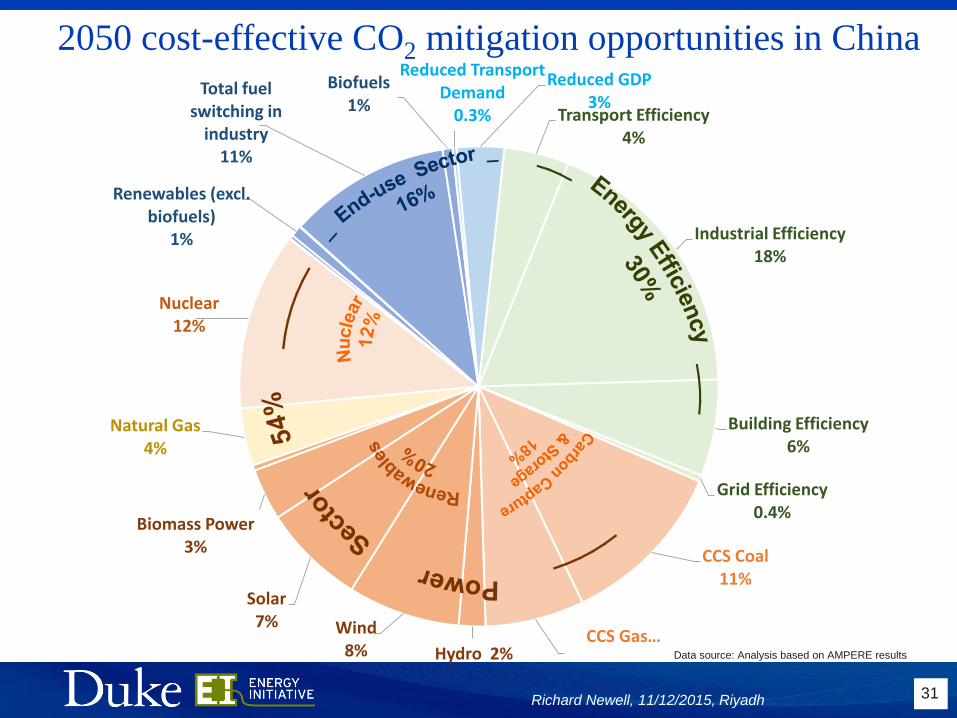
Transport Efficiency4%
Industrial Efficiency18%
Building Efficiency6%
Grid Efficiency0.4%
CCS Coal11%
CCS Gas…Hydro 2%
Wind8%
Solar7%
Biomass Power3%
Natural Gas4%
Nuclear12%
Renewables (excl. biofuels)
1%
Total fuel switching in
industry11%
Biofuels1%
Reduced Transport Demand
0.3%
Reduced GDP3%
2050 cost-effective CO2 mitigation opportunities in China
31
Data source: Analysis based on AMPERE results
Richard Newell, 11/12/2015, Riyadh
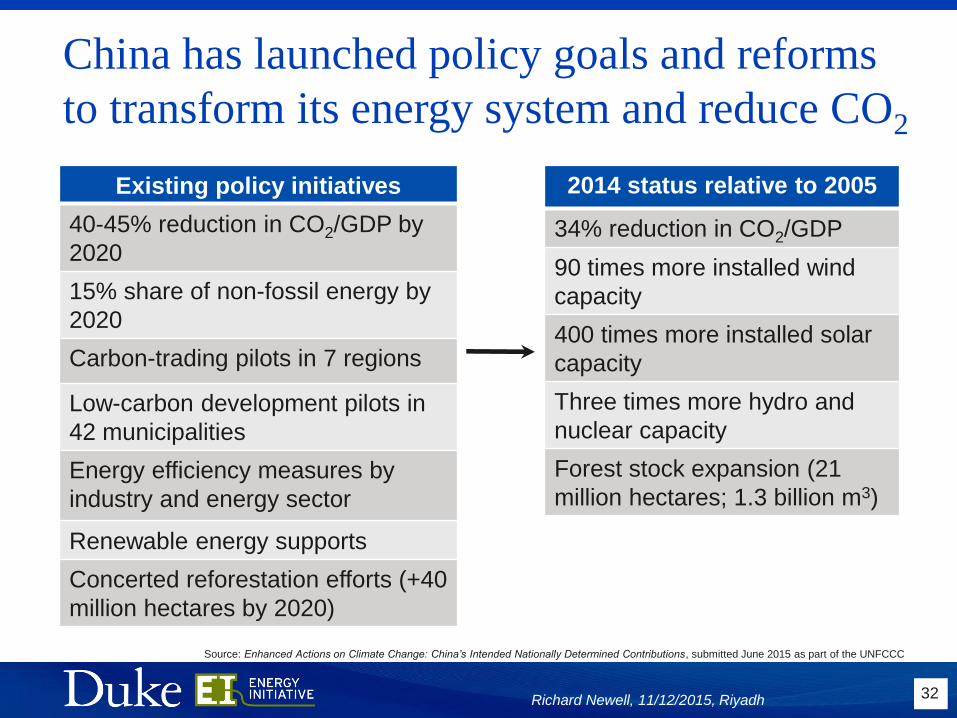
China has launched policy goals and reforms
to transform its energy system and reduce CO2
32Richard Newell, 11/12/2015, Riyadh
Existing policy initiatives
40-45% reduction in CO2/GDP by
2020
15% share of non-fossil energy by
2020
Carbon-trading pilots in 7 regions
Low-carbon development pilots in
42 municipalities
Energy efficiency measures by
industry and energy sector
Renewable energy supports
Concerted reforestation efforts (+40
million hectares by 2020)
2014 status relative to 2005
34% reduction in CO2/GDP
90 times more installed wind
capacity
400 times more installed solar
capacity
Three times more hydro and
nuclear capacity
Forest stock expansion (21
million hectares; 1.3 billion m3)
Source: Enhanced Actions on Climate Change: China’s Intended Nationally Determined Contributions, submitted June 2015 as part of the UNFCCC
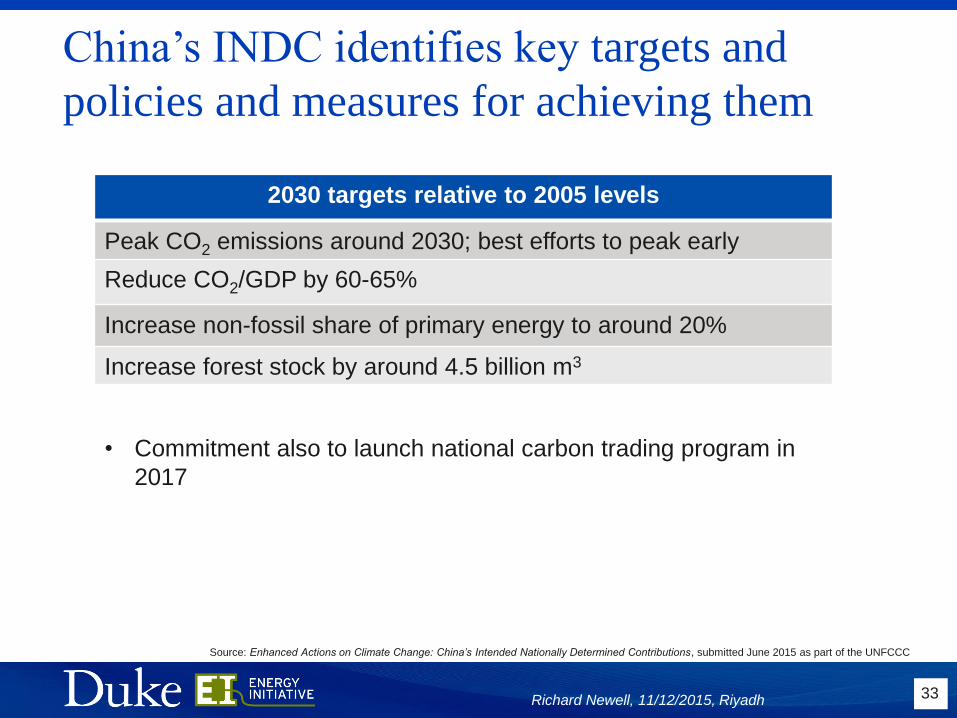
China’s INDC identifies key targets and
policies and measures for achieving them
33Richard Newell, 11/12/2015, Riyadh
2030 targets relative to 2005 levels
Peak CO2 emissions around 2030; best efforts to peak early
Reduce CO2/GDP by 60-65%
Increase non-fossil share of primary energy to around 20%
Increase forest stock by around 4.5 billion m3
Source: Enhanced Actions on Climate Change: China’s Intended Nationally Determined Contributions, submitted June 2015 as part of the UNFCCC
• Commitment also to launch national carbon trading program in
2017
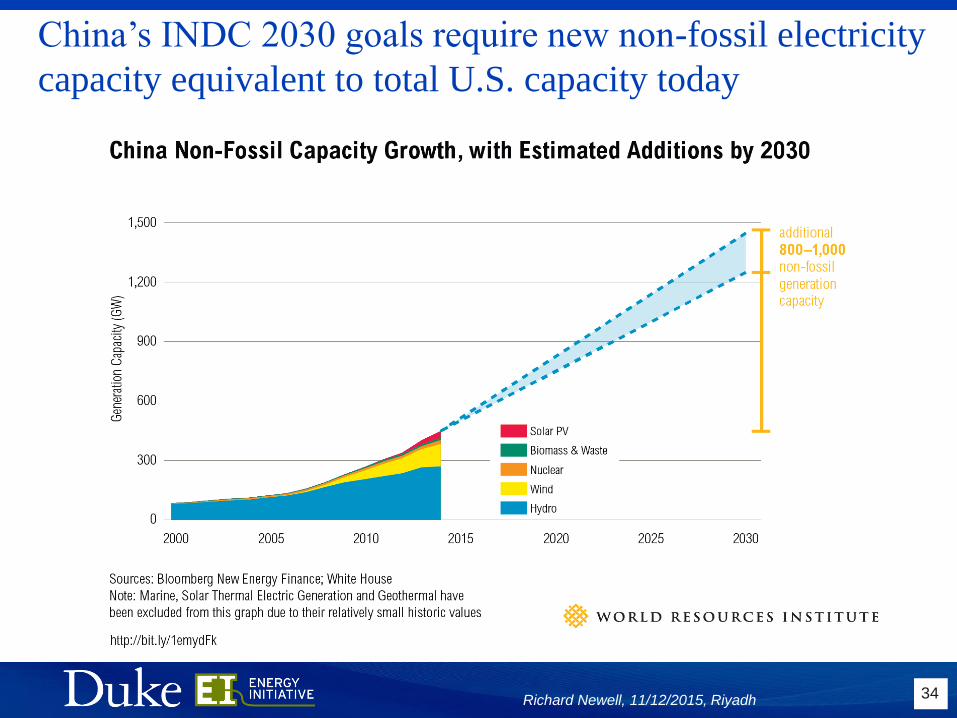
China’s INDC 2030 goals require new non-fossil electricity
capacity equivalent to total U.S. capacity today
34Richard Newell, 11/12/2015, Riyadh
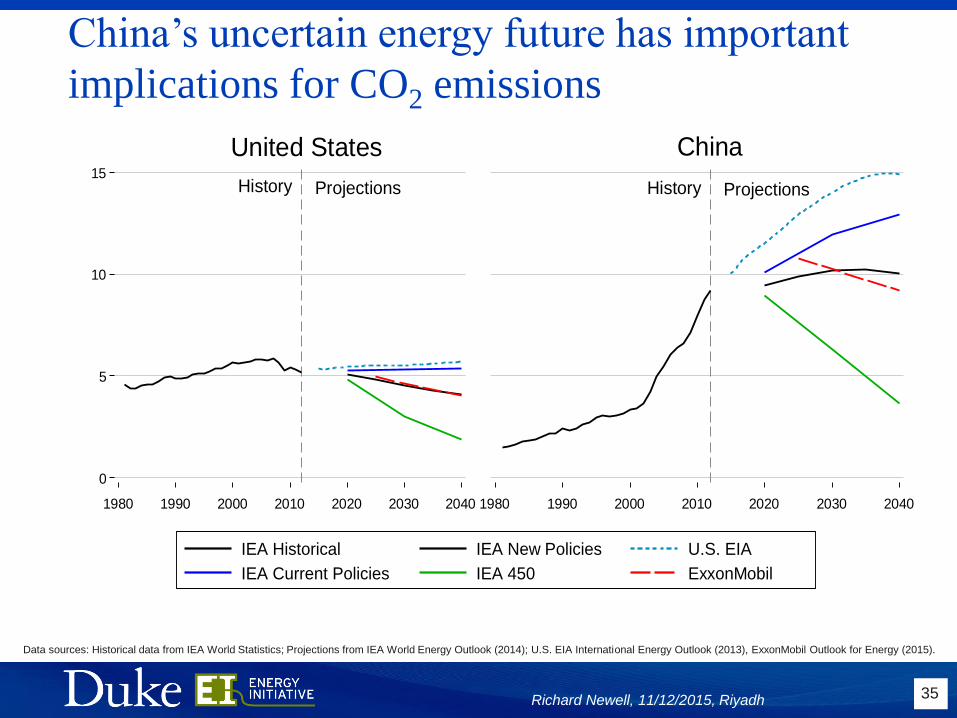
China’s uncertain energy future has important
implications for CO2 emissions
35
Data sources: Historical data from IEA World Statistics; Projections from IEA World Energy Outlook (2014); U.S. EIA International Energy Outlook (2013), ExxonMobil Outlook for Energy (2015).
History Projections
0
5
10
15
carb
on
dio
xid
e e
mis
sio
ns
(billion
me
tric
ton
nes)
1980 1990 2000 2010 2020 2030 2040
United States
History Projections
1980 1990 2000 2010 2020 2030 2040
China
IEA Historical
IEA Current Policies
IEA New Policies
IEA 450
U.S. EIA
ExxonMobil
Richard Newell, 11/12/2015, Riyadh
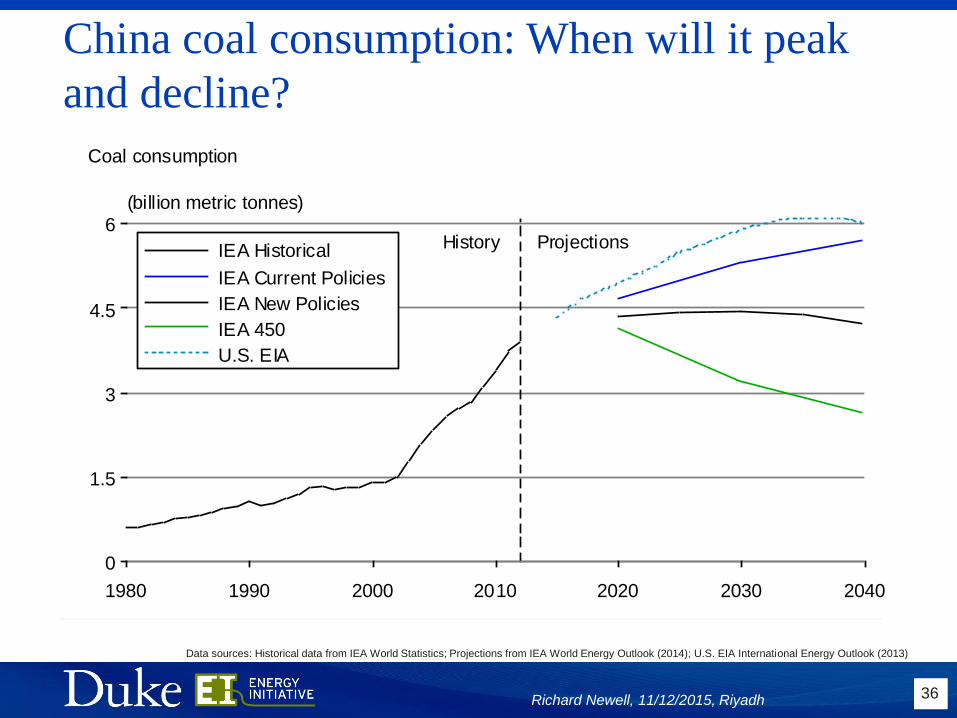
36Richard Newell, 11/12/2015, Riyadh
Data sources: Historical data from IEA World Statistics; Projections from IEA World Energy Outlook (2014); U.S. EIA International Energy Outlook (2013)
China coal consumption: When will it peak
and decline?
History Projections
(billion metric tonnes)
0
1.5
3
4.5
6
1980 1990 2000 2010 2020 2030 2040
IEA Historical
IEA Current Policies
IEA New Policies
IEA 450
U.S. EIA
Coal consumption
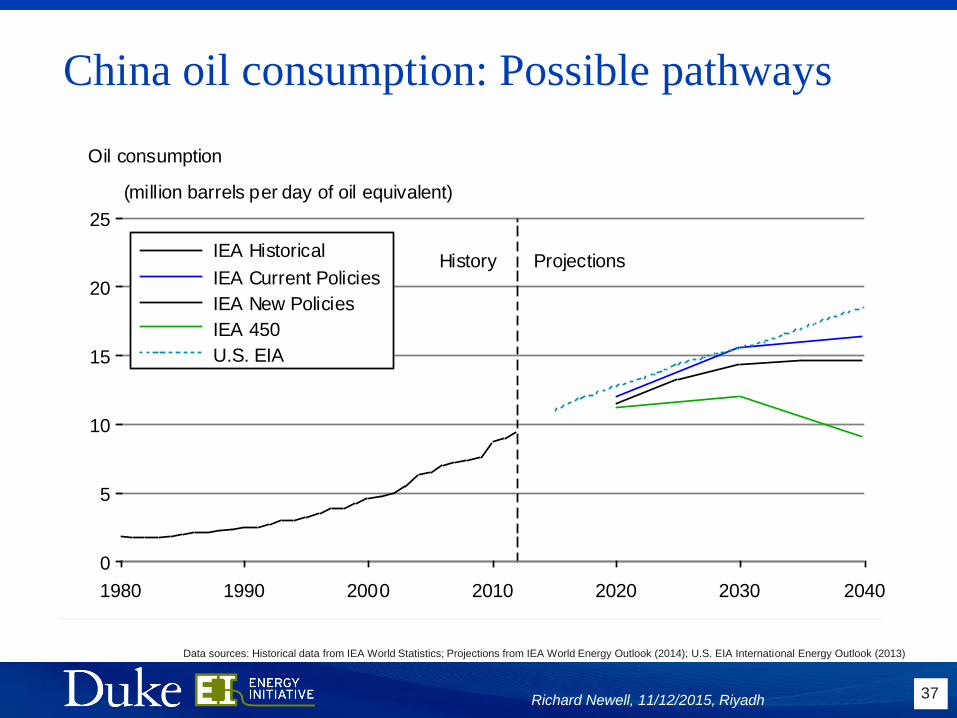
China oil consumption: Possible pathways
37Richard Newell, 11/12/2015, Riyadh
Data sources: Historical data from IEA World Statistics; Projections from IEA World Energy Outlook (2014); U.S. EIA International Energy Outlook (2013)
History Projections
(million barrels per day of oil equivalent)
0
5
10
15
20
25
1980 1990 2000 2010 2020 2030 2040
IEA Historical
IEA Current Policies
IEA New Policies
IEA 450
U.S. EIA
Oil consumption
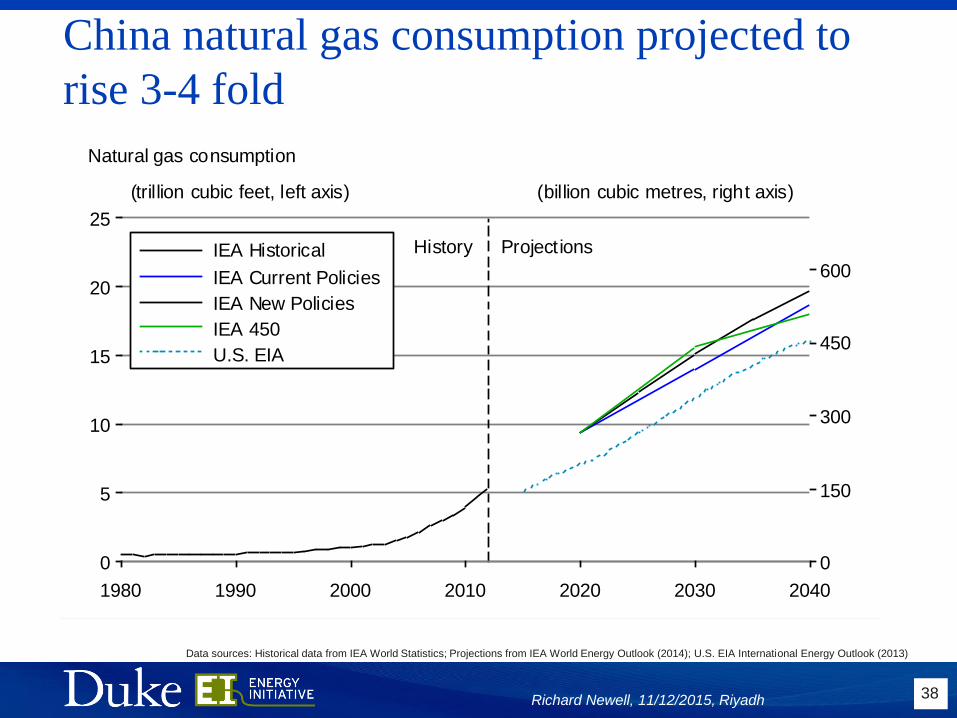
38Richard Newell, 11/12/2015, Riyadh
Data sources: Historical data from IEA World Statistics; Projections from IEA World Energy Outlook (2014); U.S. EIA International Energy Outlook (2013)
History Projections
(trillion cubic feet, left axis) (billion cubic metres, right axis)
0
150
300
450
600
0
5
10
15
20
25
1980 1990 2000 2010 2020 2030 2040
IEA Historical
IEA Current Policies
IEA New Policies
IEA 450
U.S. EIA
Natural gas consumption
China natural gas consumption projected to
rise 3-4 fold
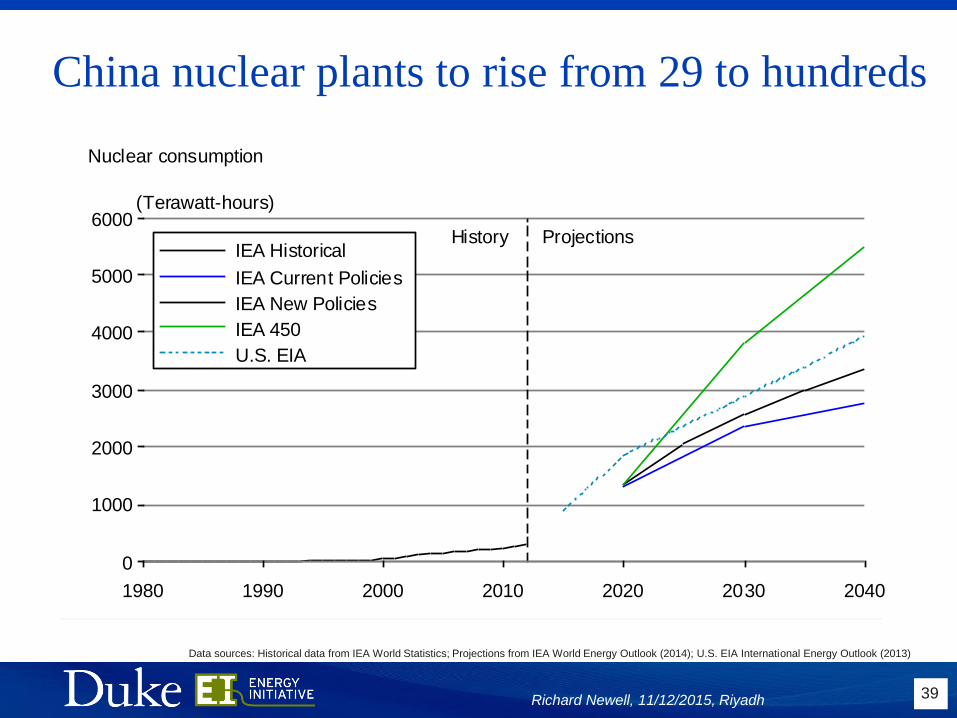
China nuclear plants to rise from 29 to hundreds
39Richard Newell, 11/12/2015, Riyadh
Data sources: Historical data from IEA World Statistics; Projections from IEA World Energy Outlook (2014); U.S. EIA International Energy Outlook (2013)
History Projections
(Terawatt-hours)
0
1000
2000
3000
4000
5000
6000
1980 1990 2000 2010 2020 2030 2040
IEA Historical
IEA Current Policies
IEA New Policies
IEA 450
U.S. EIA
Nuclear consumption
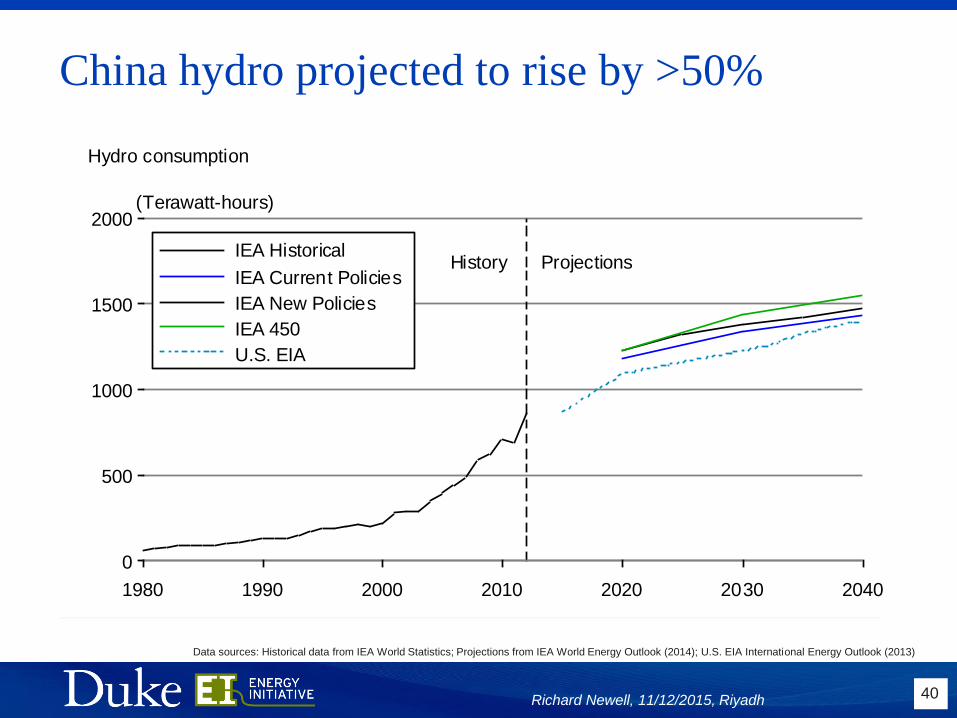
China hydro projected to rise by >50%
40Richard Newell, 11/12/2015, Riyadh
Data sources: Historical data from IEA World Statistics; Projections from IEA World Energy Outlook (2014); U.S. EIA International Energy Outlook (2013)
History Projections
(Terawatt-hours)
0
500
1000
1500
2000
1980 1990 2000 2010 2020 2030 2040
IEA Historical
IEA Current Policies
IEA New Policies
IEA 450
U.S. EIA
Hydro consumption
Conclusions
42
• China experiencing rapid growth in energy consumption since
~2000
• The link between economic growth and energy is weakening, but
growth is still a key driver
• Economic rebalancing will further reduce overall energy intensity
• Environmental concerns are spurring action in the energy sector
• There are a wide range of options in play for China’s policymakers
to accelerate change in its energy systems
Richard Newell, 11/12/2015, Riyadh
For more information
43
Richard Newell
Duke University Energy Initiative
energy.duke.edu
+1-919-681-8663
Richard Newell, 11/12/2015, Riyadh