china’s nuclear energy program: status and future … · china’s nuclear energy program: status...
TRANSCRIPT

China’s Nuclear Energy Program: Status and Future
IAEE Conference
Christhian Rengifo Senior Consultant,
International Nuclear Policy
September 2017

Presentation Outline
1. Introduction to UxC 2. UxC’s global nuclear power forecasts 3. China’s electricity situation 4. China’s nuclear energy program 5. China’s electricity overcapacity 6. Analysis 7. Conclusions
2

1. UxC – The Ux Consulting Company
► Provides nuclear consulting and market information services to suppliers, utilities, investors, and government agencies internationally ● Founded in March 1994 ● 15 professionals in company, plus consultant base ● Offices/Staff Located in: Atlanta, Boston, Austin.
► Three major lines of business ● Nuclear market consulting (fuel cycle & reactors) ● Publishing industry market reports ● Nuclear fuel price indicators and data services
3

325
350
375
400
425
450
475
500
525
550
575
2008 2010 2012 2014 2016 2018 2020 2022 2024 2026 2028 2030
Q3 Base Q3 High Q3 Low
GWe © UxC
2. UxC Global Nuclear Power Forecasts
4
Base Case: 2020: 390 GWe 2030: 444 GWe
Source: UxC Nuclear Power Outlook, Q3 2017
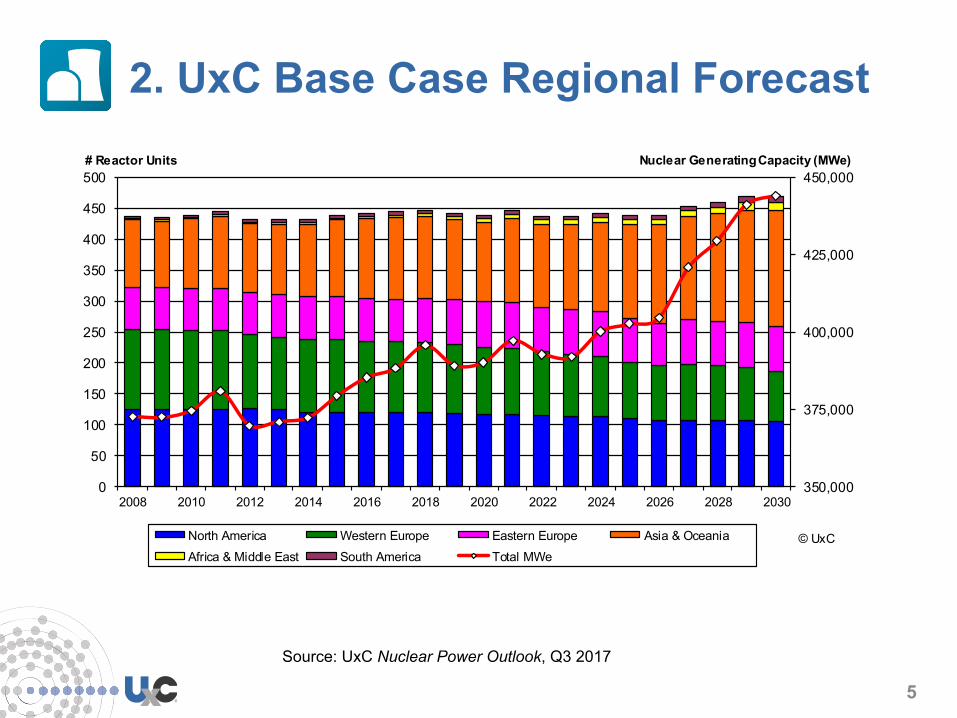
2. UxC Base Case Regional Forecast
5
Source: UxC Nuclear Power Outlook, Q3 2017
350,000
375,000
400,000
425,000
450,000
0
50
100
150
200
250
300
350
400
450
500
2008 2010 2012 2014 2016 2018 2020 2022 2024 2026 2028 2030
North America Western Europe Eastern Europe Asia & Oceania
Africa & Middle East South America Total MWe© UxC
# Reactor Units Nuclear Generating Capacity (MWe)

3. Electricity Situation in China (2016)
6
Generation: 5,989 TWh Capacity: 1,645 GWe
57%
20%
9%
4%5% 2% 3%
Coal Hydropower Wind Gas Solar Nuclear Others
65%
20%
4%3%
4% 4%
Coal Hydropower Wind Gas Nuclear Others
Source: China Electricity Council

3. China Electricity Supply & Demand
7
4,800
5,000
5,200
5,400
5,600
5,800
6,000
6,200
2012 2013 2014 2015 2016
Total Electricity Production
Total Electricity Demand
© UxCTeraw att-Hours (TWh)
Source: China Electricity Council

3. 13th Five Year Plan (2016-2020) for Power Development
8
China's Power Development Targets under the 13th FYP
2015 2020 Average Annual Increase
Total Generation Capacity (GWe) 1,530 2,000 5.5%
Total Electricity Demand (TWh) 5,690 6,800-7,200 3.6-4.8%
Generation Capacity by Fuel (GWe)
Conventional hydro power 297 340 2.8%
Pumped-storage hydro 23 40 11.7%
Nuclear power 27 58 16.5%
Wind power 131 210 9.9%
Solar power 42 110 21.2%
Coal 900 < 1,100 4.1%
Gas 66 110 10.8%
Source: 13th FYP for Power Development

4. China’s Nuclear Power Plants
9
Zhejiang
Guangdong
Jiangsu
Liaoning
Fujian
InOpera)on(36)
UnderConstruc)on(20)
Loca3onofChina’snuclearreactors(asofAugust2017)
Guangxi
Hainan
Shandong

4. Nuclear Energy in China: Current Status & Outlook
► As of August 2017 status: ● 36 reactors in commercial operation (32 GWe) ● 20 under construction (21 GWe)
► 2020 UxC Forecast (Base case): ● 49 units / 46 GWe
► 2030 UxC Forecast (Base case): ● 99 units / 103 GWe
► 3 Licensed Nuclear Power Utilities: ● China National Nuclear Power – publicly traded company (subsidiary of China
National Nuclear Corporation or CNNC – State-owned company) ● China General Nuclear– publicly traded company (subsidiary of China General
Nuclear Power Group or CGN – State-owned company) ● State Power Investment Corporation or SPIC (State-owned company) – merged
company between China Power Investment Corp. (CPIC) and State Nuclear Power Technology Corp. (SNPTC)
10
4. Reactor Designs: Operation & Construction*
► Canadian Design: 2 x CANDU ► Russian Design: 2 x VVERs and *2 VVERs ► French Design: 2 x M310 and *2 x EPRs ► U.S. Design: *4 x AP1000 ► Chinese Design: various CNPs, CPRs, and *4xHPR-1000 ► In the future, HPR-1000 and CAP designs (based on the
AP1000 design) are expected to be the basis for the nuclear fleet. Focus will be on domestic designs and not on additional imports.
11

5. Overcapacity?: Average Full Load Hours (FLH) of Power Plants
12
Indicator 1: Demand has been met by operating thermal and hydro plant sources at low FLH for a long time.
Source: China Electricity Council
0
1,000
2,000
3,000
4,000
5,000
6,000
7,000
8,000
9,000
2000 2002 2004 2006 2008 2010 2012 2014 2016
TotalAverage Hydro Thermal Nuclear Wind
© UxC FLH

0
1,000
2,000
3,000
4,000
5,000
6,000
7,000
8,000
Liaon
ing (H
ydro)
Liaon
ing (F
ossil
)
Liaon
ing (N
uclea
r)
Liaon
ing (W
ind)
Jiang
su
Jiang
su
Jiang
su
Jiang
su
Zhejia
ng
Zhejia
ng
Zhejia
ng
Zhejia
ng
Fujian
Fujian
Fujian
Fujian
Guang
dong
Guang
dong
Guand
ong
Guang
dong
Guang
xi
Guang
xi
Guang
xi
Guang
xi
Hainan
Hainan
Hainan
Hainan
FLH
5. Overcapacity?: Average FLH in Provinces with Nuclear Reactors (2016)
13
Source: China Energy Portal
Indicator 2: In provinces where nuclear reactors are located thermal and hydro power plans have low FLH. CGN Power reported in 2016 that it was operating at lower FLH when compared to 2015.

5. Overcapacity?: Reactor Construction and Operation Starts
14
0
1
2
3
4
5
6
7
8
9
10
11
1985 1988 1991 1994 1997 2000 2003 2006 2009 2012 2015
Operation Starts Construction Starts
© UxCUnits
Indicator 3: CGN Power reported in 2016, it had to delay the start of operation of one reactor due to market conditions.
As of August 2017: Only 1 reactor has started operation this year. No reactors have started construction.
Fukushima

5. Nuclear Plant Capacity Factors
15
0
5
10
15
20
25
30
78%
80%
82%
84%
86%
88%
90%
92%
2010 2011 2012 2013 2014 2015
Number of Operating Reactors Average Capacity Factor
© UxCCapacity Factor Units
Indicator 4: Capacity factors have gone down in the 2013-2015 period. In 2016, CGN reported that due to low demand, some units operated that year temporarily at reduced load or were offline.

6. Analysis: Nuclear Energy Forecasts for China
16
Source: UxC Nuclear Power Outlook, Q3 2017
0
20
40
60
80
100
120
140
2010 2012 2014 2016 2018 2020 2022 2024 2026 2028 2030
High Base Low
© UxCGWe
Base Case: 2020: 46 GWe
2030: 103 GWe

6. Factors Influencing China Forecasts
► Changes in energy supply in view of lower economic development
► Some nuclear operators are publicly traded companies: Are additional nuclear reactors a good investment in an over-supplied market?
► China is reforming its electricity market to address several related issues: ● Electricity overcapacity ● Grid connections ● Bringing the electricity system closer to market forces (e.g. electricity
prices and power market trading) ● Changes in FiT (FiT are also available for other sources)
► Wait for 14th FYP: Which sites? Which reactor designs? When?
17

6. China 13th Five Year Plan (2016- 2020) for Nuclear Energy
► By 2020, there should be 58 GWe in operation and 30 GWe under construction.
► Completion of AP1000 projects (Sanmen and Haiyang) ► Construction of HPR-1000 demonstration projects ► Start construction of CAP1400 demonstration project ► Start construction of a number of new reactors in
coastal areas. No plans for inland reactors.
18

7. Conclusions
► China will not meet its 2020 nuclear power targets ● The Fukushima accident clearly slowed the development of nuclear
energy in China (e.g. new safety reviews) ● There is electricity overcapacity and this will also slow down the
construction of nuclear reactors ● Lower economic development: less energy demand
► Based on the 13th FYP, China is planning to add more electricity capacity in the next years: ● Does more capacity in an already oversupplied market make sense
(in the short term)? In the long term: Phasing out coal. ► One way to use China’s large nuclear supply chain:
Build reactors abroad (e.g. HPR-1000 design) ● One Belt One Road push for reactor exports
19

20