chilean wine industry grape & wine technology centre & business school university of talca...
TRANSCRIPT

Chilean Wine Industry
Grape & Wine Technology Centre &Business School
University of TalcaCHILE

1548: First grape rootstocks brought to Chile.
Chronology
1654: Local production growth threatens Spain’s industry and Spain limits grape growth in Chile.
1758: According to John Byron, Chilean wine is as good as Madeira’s and much cheaper.
1851: Silvestre Ochagavia brought first French vines.1877: Exports to Europe start.
1920s: Prohibition motivates limits to grape growing.1960s: Demand motivates legal permission to water wine.

Chronology
1987-2002: Growth of small exporting firms.
1994: Establecimiento de la nueva ley de zonificacion vinicola y denominaciones de origen.
1980: New technology brought by Miguel Torres.
1982-86: Decrease in domestic consumption while big traditional firms graduately incorporate new technology.
1975-1980: Expansion of grape growing.
1975: Eliminated restriction to grape growing.

Trend in wine consumption in Chile (per capita), years 1970 - 2000.
65
4840
2518 18 15 15.813.1
18 201513
0
10
20
30
40
50
60
70
50 68 78 88 92 93 94 95 96 97 98 99 0
Year
Lite
rs p
er c
apita

Number of wineries, employees and average firm size Chile 1975 - 1995
ChileYear Small Medium+ Total Small Medium+ Total Small Medium+ Total1975 20 35 55 437 3,359 3,796 22 96 1181979 102 36 138 1,931 3,960 5,891 19 110 129
*Census '79 235 36 271 2,345 3,960 6,305 10 110 1201985 43 23 66 866 2,733 3,599 20 119 1391990 26 20 46 578 3,312 3,890 22 166 1881995 22 21 43 503 4,073 4,576 23 194 217
Number of firms Employees Firm Size
Sources: I.N.E Annual Manufacturing Survey of firms whit more than 10 employees. Small firms are those with 10-49 employees; medium+ firms are medium and large enterprise with 50 + employees.* The 1979 survey was broader: The “small firms” categories includes microenterprises with 5 - 9 employees.
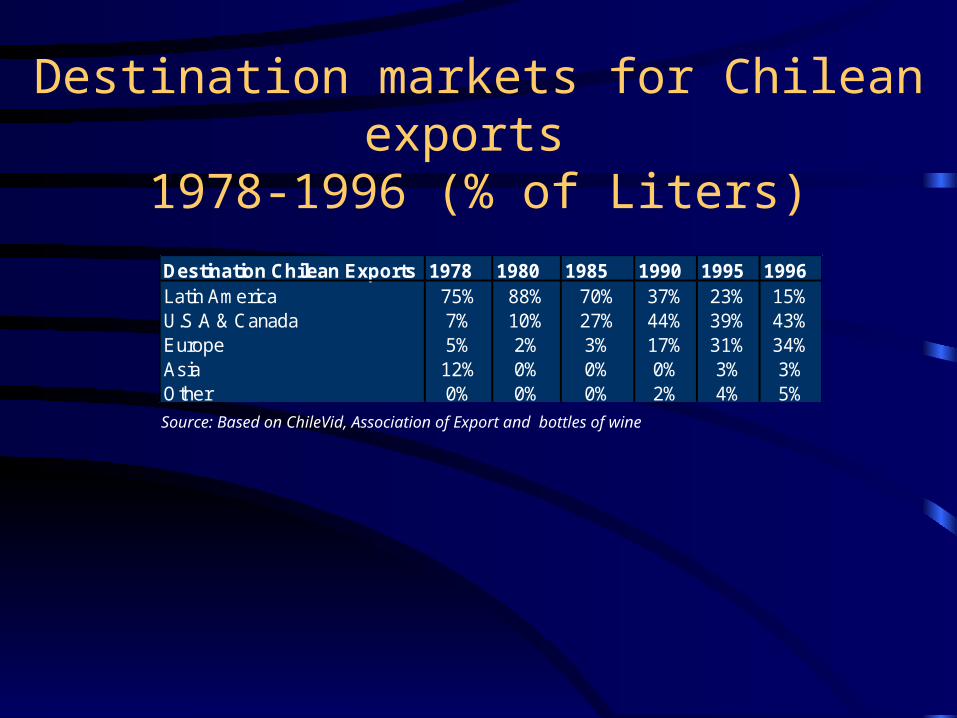
Destination Chilean Exports 1978 1980 1985 1990 1995 1996Latin America 75% 88% 70% 37% 23% 15%U.S.A & Canada 7% 10% 27% 44% 39% 43%Europe 5% 2% 3% 17% 31% 34%Asia 12% 0% 0% 0% 3% 3%Other 0% 0% 0% 2% 4% 5%
Destination markets for Chilean exports 1978-1996 (% of Liters)
Source: Based on ChileVid, Association of Export and bottles of wine

Area planted with grapes in Chile 1985-2000 (S.A.G.)
0
20000
40000
60000
80000
100000
120000
85 87 89 91 93 95 97 98 99 20 1
Year
Area
(ha) Wine
Table
Pisco
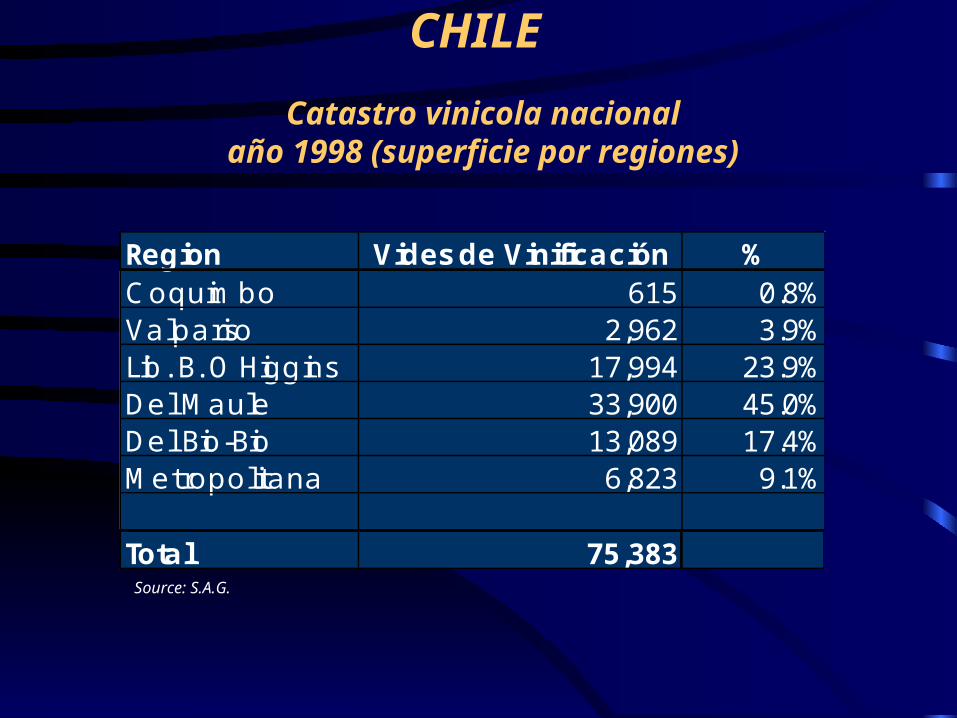
Catastro vinicola nacionalaño 1998 (superficie por regiones)
CHILE
Region Vides de Vinificación %Coquimbo 615 0.8%Valpariso 2,962 3.9%Lib. B. O'Higgins 17,994 23.9%Del Maule 33,900 45.0%Del Bio-Bio 13,089 17.4%Metropolitana 6,823 9.1%
Total 75,383Source: S.A.G.

Trend in chilean wine exports, years 1988-2000.
0
50
100
150
200
250
300
88 89 90 91 92 93 94 95 96 97 98 99 0
Year
Mill
ion
s of
Lite
rs
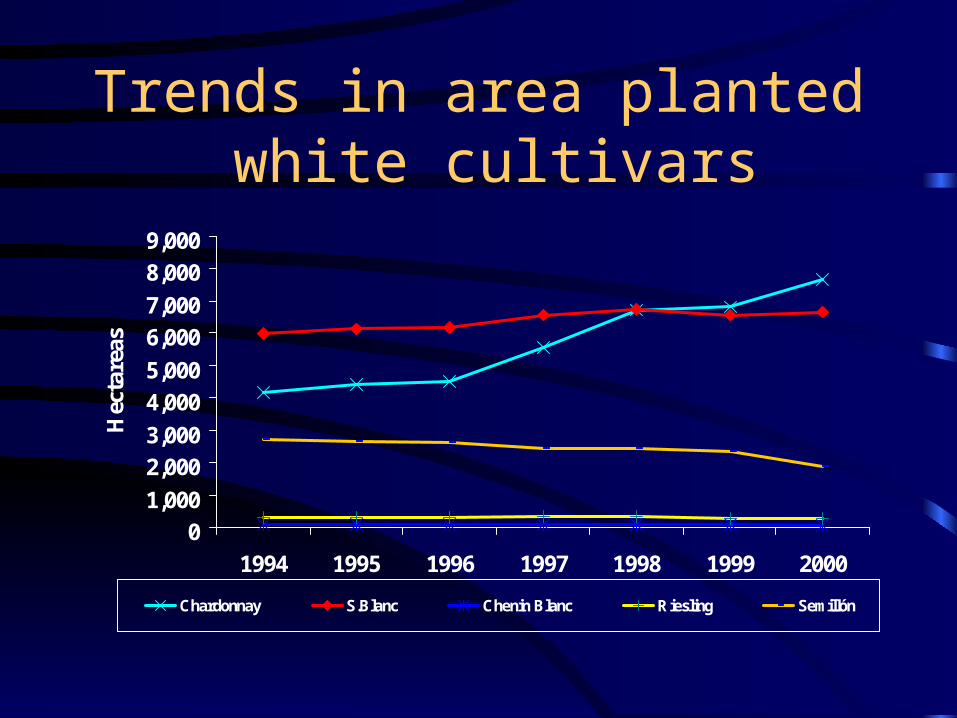
Trends in area planted white cultivars
0
1,000
2,000
3,000
4,000
5,000
6,000
7,000
8,000
9,000
1994 1995 1996 1997 1998 1999 2000
Hec
tare
as
Chardonnay S.Blanc Chenin Blanc Riesling Semillón

Trends in area planted red cultivars
0
5,000
10,000
15,000
20,000
25,000
30,000
35,000
40,000
1994 1995 1996 1997 1998 1999 2000
Hec
tare
as
C.Sauvignon Merlot Pinot Noir País

World wine production. % participation (O.I.V.)
1. Francia 21,3
2. Italia 21,0
3. España 11,6
4. EE.UU. 6,6
5. Argentina 4,5
6. Sudáfrica 3,6
7. Portugal 3,4
8. Alemania 3,0
9. Rumania 2,7
10. Australia 2,4
11. China 1,5
12. Grecia 1,5
13. Hungría 1,5
14. Chile 1,4
15. Yugoslavia 1,2
16. Rusia 1,0
17. Austria 0,7
18. Bulgaria 0,7
19. Croacia 0,6
20. Suiza 0,5
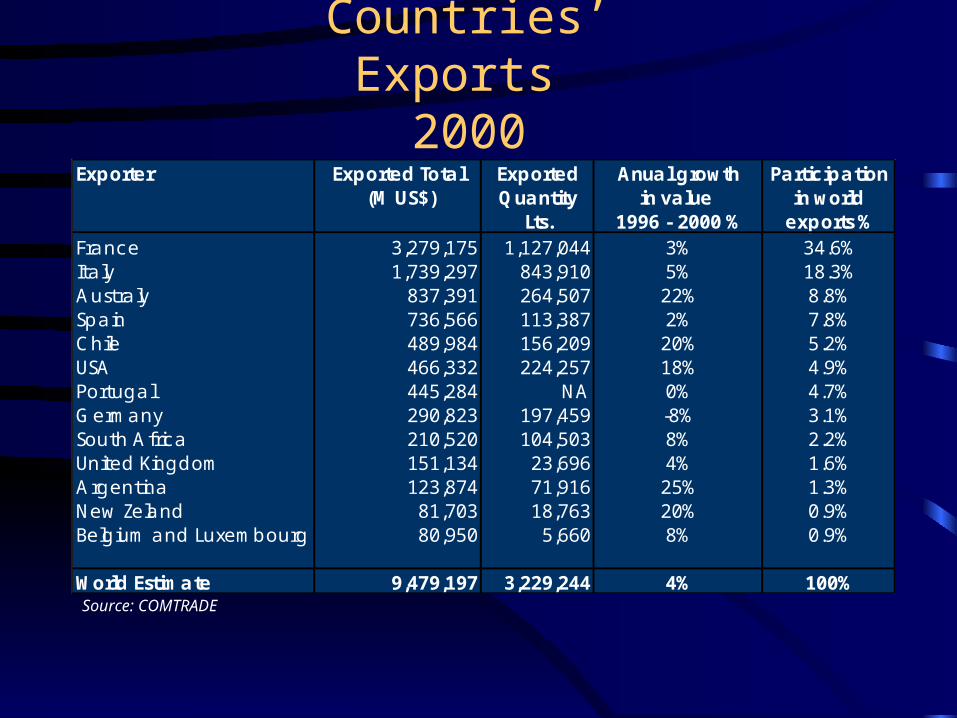
Countries’ Exports 2000
Exporter Exported Total Exported Anual growth Participation (M US$) Quantity in value in world
Lts. 1996 - 2000 % exports %France 3,279,175 1,127,044 3% 34.6%Italy 1,739,297 843,910 5% 18.3%Australy 837,391 264,507 22% 8.8%Spain 736,566 113,387 2% 7.8%Chile 489,984 156,209 20% 5.2%USA 466,332 224,257 18% 4.9%Portugal 445,284 NA 0% 4.7%Germany 290,823 197,459 -8% 3.1%South Africa 210,520 104,503 8% 2.2%United Kingdom 151,134 23,696 4% 1.6%Argentina 123,874 71,916 25% 1.3%New Zeland 81,703 18,763 20% 0.9%Belgium and Luxembourg 80,950 5,660 8% 0.9%
World Estimate 9,479,197 3,229,244 4% 100%Source: COMTRADE
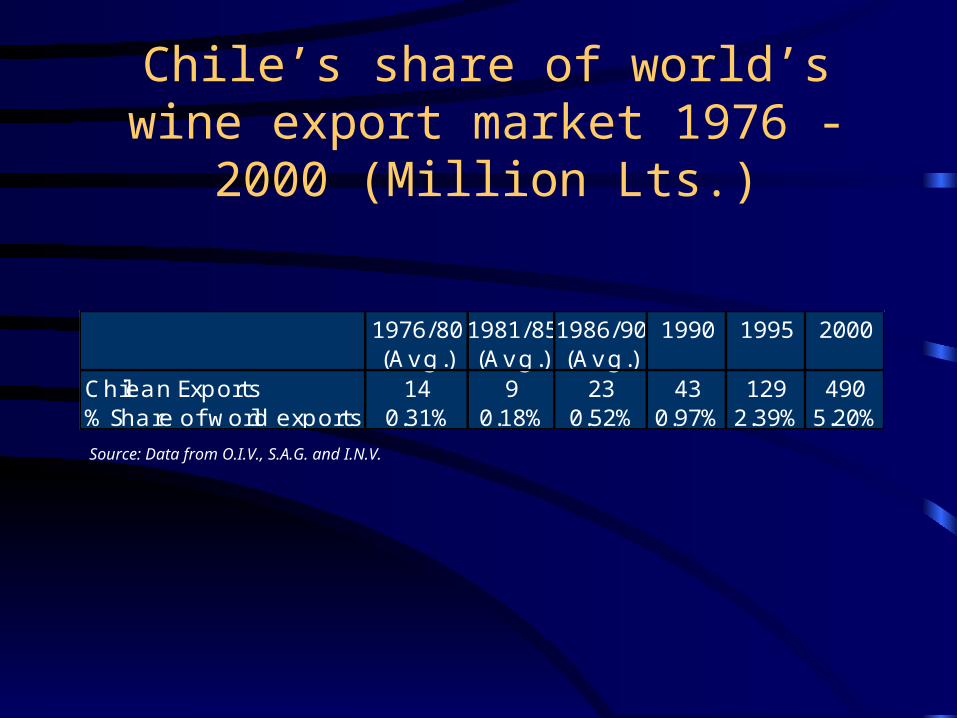
1976/801981/851986/90 1990 1995 2000(Avg.) (Avg.) (Avg.)
Chilean Exports 14 9 23 43 129 490% Share of world exports 0.31% 0.18% 0.52% 0.97% 2.39% 5.20%
Chile’s share of world’s wine export market 1976 - 2000 (Million Lts.)
Source: Data from O.I.V., S.A.G. and I.N.V.
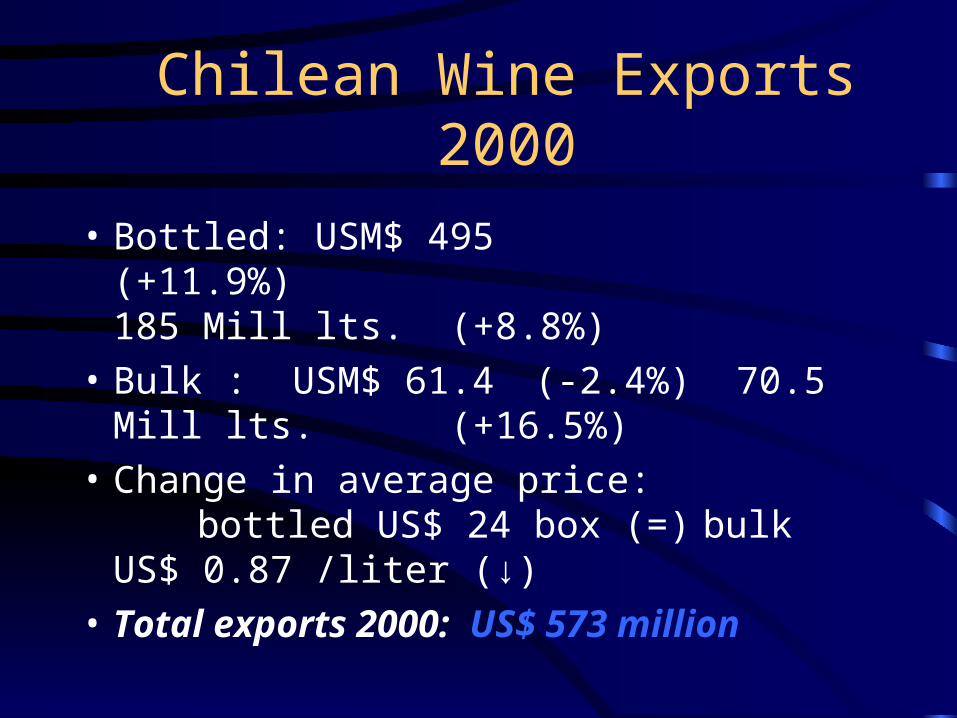
Chilean Wine Exports 2000
• Bottled: USM$ 495 (+11.9%) 185 Mill lts. (+8.8%)
• Bulk : USM$ 61.4 (-2.4%) 70.5 Mill lts. (+16.5%)
• Change in average price:bottled US$ 24 box (=)bulk US$ 0.87 /liter (↓)
• Total exports 2000: US$ 573 million

Main chilean wine markets
0%10%20%30%40%50%60%70%80%90%
100%
1980 1985 1990 1995 1996 1997 1998 1999 2000 2001
% e
n v
olu
men
Latinoamérica U.S.A., Canada y Mexico Europa Asia Otros

Ten major wine exporters 1988 and 2001
US$ Millions US$ Millions1988 2001
1 Concha y Toro 7.4 1 Concha y Toro 57.52 San Pedro 2.8 2 San Pedro 42.63 Santa Rita 2.2 3 Santa Rita 32.04 Sta Carolina 1.8 4 Viña Caliterra 20.35 Cousiño Macul 1.5 5 Sta Carolina 19.26 Undurraga 1.2 6 Undurraga 15.47 Cánepa 1.0 7 Errazuriz 15.18 M. Torres 0.7 8 Viña Carmen 15.09 Los Vascos 0.4 9 Valdivieso 14.9
10 Sta Emiliana 0.3 10 Viña Tarapaca 13.011 Otros 3.6 11 Otros 202.4
Total 22.9 Total 447.4
Sources: Newspaper Estrategia, May, Monday 11 of 1998. and Prochile
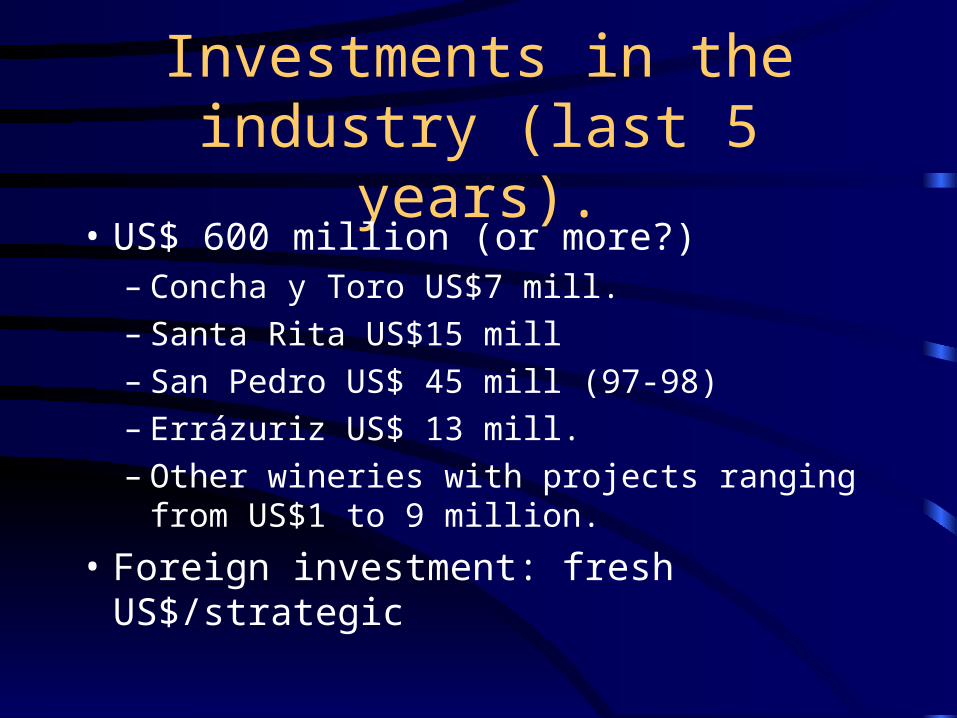
Investments in the industry (last 5 years).
• US$ 600 million (or more?)– Concha y Toro US$7 mill.– Santa Rita US$15 mill– San Pedro US$ 45 mill (97-98)– Errázuriz US$ 13 mill.– Other wineries with projects ranging from
US$1 to 9 million.
• Foreign investment: fresh US$/strategic

Quality puzzle
Climate soil
Cultivar/rootstock
Vitic. practices
Enologicalpractice

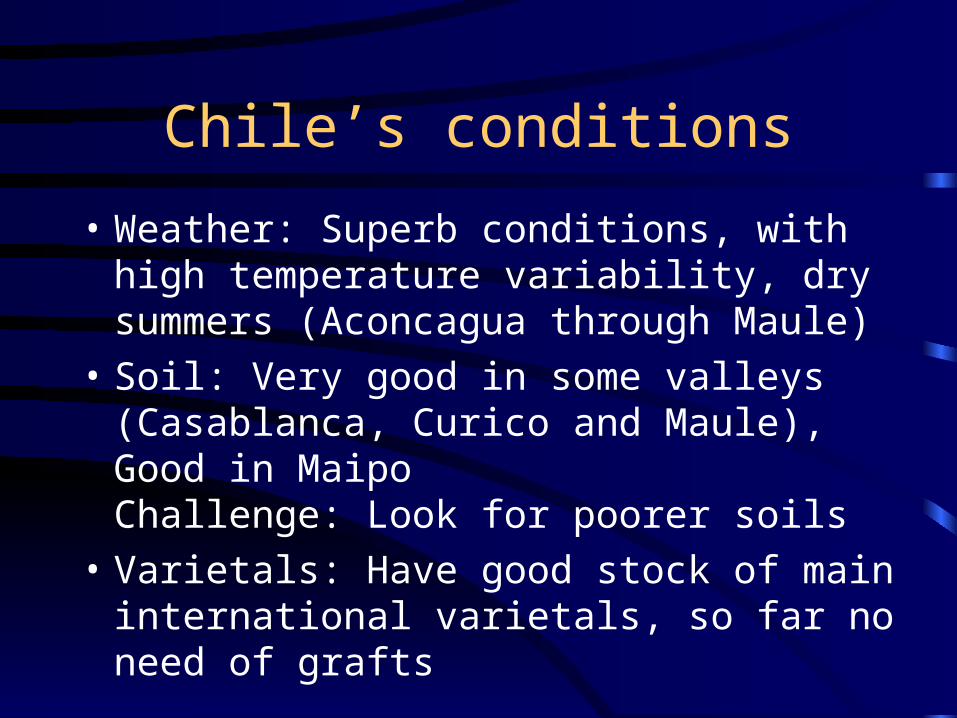
Chile’s conditions
• Weather: Superb conditions, with high temperature variability, dry summers (Aconcagua through Maule)
• Soil: Very good in some valleys (Casablanca, Curico and Maule), Good in MaipoChallenge: Look for poorer soils
• Varietals: Have good stock of main international varietals, so far no need of grafts
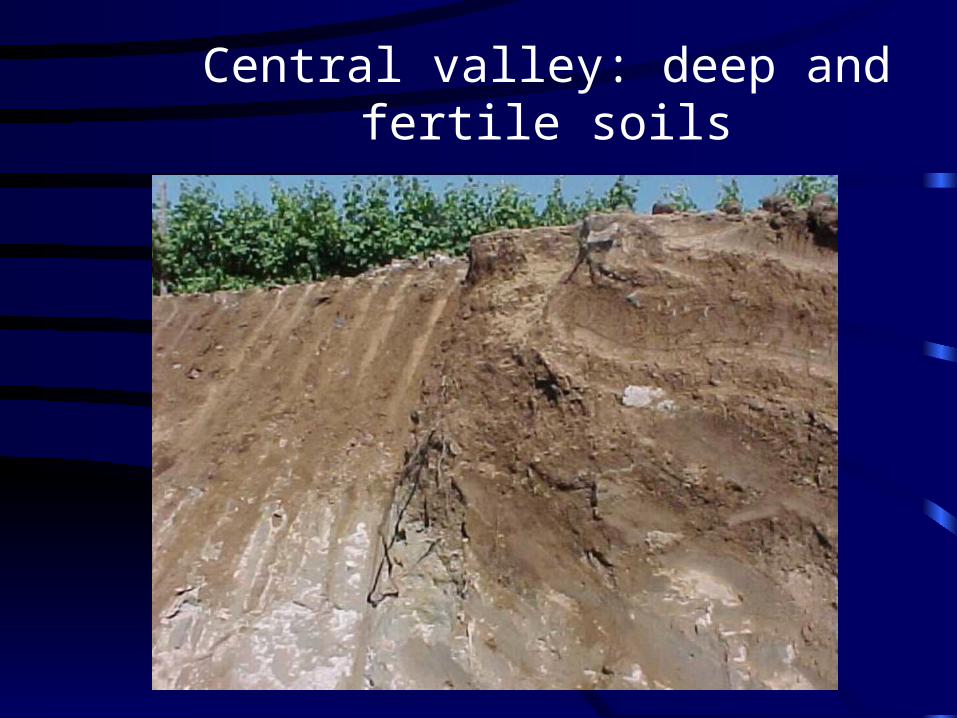
Central valley: deep and fertile soils

Coastal range and interior dryland: shallow and poor soils

Chilean viticulture industry:
• Large traditional producers of table wines
• Early new producers
• Late entries
• Fine wine producers (new viticulture)

Current Situation
• Large wineries buying grapes and wine cheap, selling fine through established commercializations channels
• Early new entries doing fine, with own grape and some purchased, having established brand and commercialization channels
• Late entries are doing well if have established enough sales through branding, otherwise struggling by selling too much in bulk

New viticulture
• Goals:– Maximize the production fruit of the best
quality at a low cost.– Improve efficiency (lower inputs,
mechanization, etc.)– Care for the environment (vineyard and labor) :
• Personal / Marketing
• Results to be seen, good prospect

Challenges/opportunities for growth:
• Chile is not alone: SA. Aust. USA, etc.
• Commercial barriers
• Others: filoxera, etc.
• New valleys, new wines
• Cultivar Carmenère
• Clean viticulture (organic /integrated)
• Investment in viticultural technology

Road Map
• Develop integrated strategies and technologies for:- Marketing- Winery- Vineyard
• Implement innovation approach founded on sistematic learning to provide quality and uniqueness
• Implement new viticulture
• Integrate with tourism

Grape&Wine Tech. Center: Goals
• Improve competitiveness of Chilean wines in export markets by solving technological problems of the wine industry
• Become a place for exchange of ideas between researchers, professionals and growers about problems of our industry
• Establish a permanent extension program in viticulture, enology and economic management for the industry.

END
THANK YOU

Research programs: viticulture
• Cultivar purity: development of DNA techniques for cultivar identification
• Phytosanitary purity: diagnosis and cleaning of grape viruses
• Introduction and testing of new cultivars, clones and rootstocks in Chile
• Local clonal selection: Carmenere & others

Research programs: viticulture
• Canopy management techniques and training systems
• Irrigation and plant nutrition strategies
• Vineyard mechanization:

Services to the industry
• Wine analysis
• Bud fertility analysis
• Virus analysis in grapes (ELISA)
• Identification on cultivars (DNA)
• Denomination of Origin Control
• Quality control of enological supplies

Services
• Irrigation schedulling in vineyards (SIAR)
• Soil and tissue analysis
• Site selection/evaluation for vineyard establishment
• Technical assistance(specific problem)

Production of wines for consumption(Thousands of liters )
CHILECHILE
Años Viniferas Total 1_ / Exports1991 237,404 282,2391992 212,757 316,535 74,0291993 223,981 330,246 85,0751994 276,648 359,383 107,3021995 290,904 316,737 125,3511996 337,273 382,369 187,2811997 381,667 430,758 268,4111998 444,007 526,550 369,7341999 371,428 428,015 388,4552000 570,426 641,822 434,666
Source: Elaborate by ODEPA with information of the SAGNote: 1_ / It doesn't include the production of concentrated must neither chicha
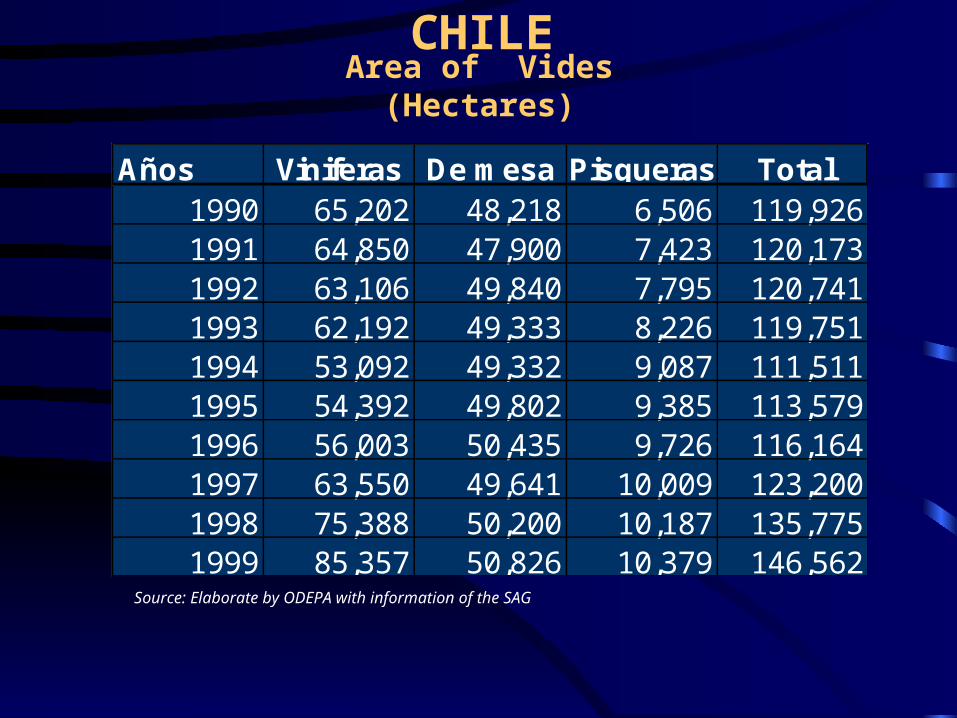
Area of Vides (Hectares)
CHILE
Años Viniferas De mesa Pisqueras Total1990 65,202 48,218 6,506 119,9261991 64,850 47,900 7,423 120,1731992 63,106 49,840 7,795 120,7411993 62,192 49,333 8,226 119,7511994 53,092 49,332 9,087 111,5111995 54,392 49,802 9,385 113,5791996 56,003 50,435 9,726 116,1641997 63,550 49,641 10,009 123,2001998 75,388 50,200 10,187 135,7751999 85,357 50,826 10,379 146,562
Source: Elaborate by ODEPA with information of the SAG

Area planted: white cultivars (ha)
• Chardonnay 7,672• Sauvignon Blanc 6,662• Mosc.Alejandría 5,978• Semillón 1,892• Torontel 1,067• White mixed vineyards 401• Chasselas 404
Area planted: white cultivars (ha)
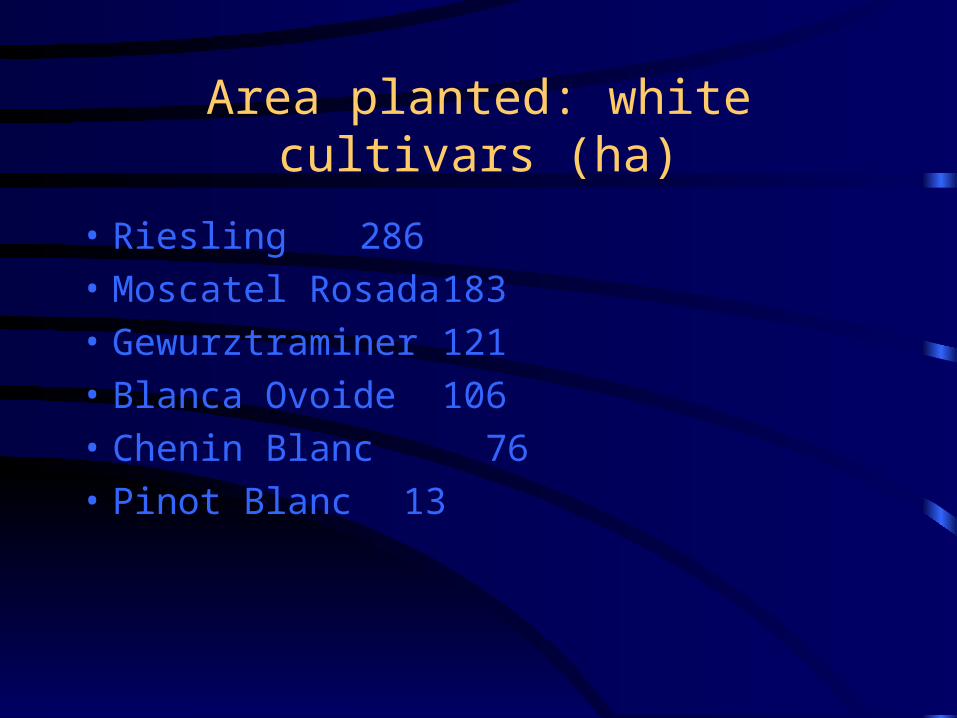
• Riesling 286• Moscatel Rosada 183• Gewurztraminer 121• Blanca Ovoide 106• Chenin Blanc 76• Pinot Blanc 13

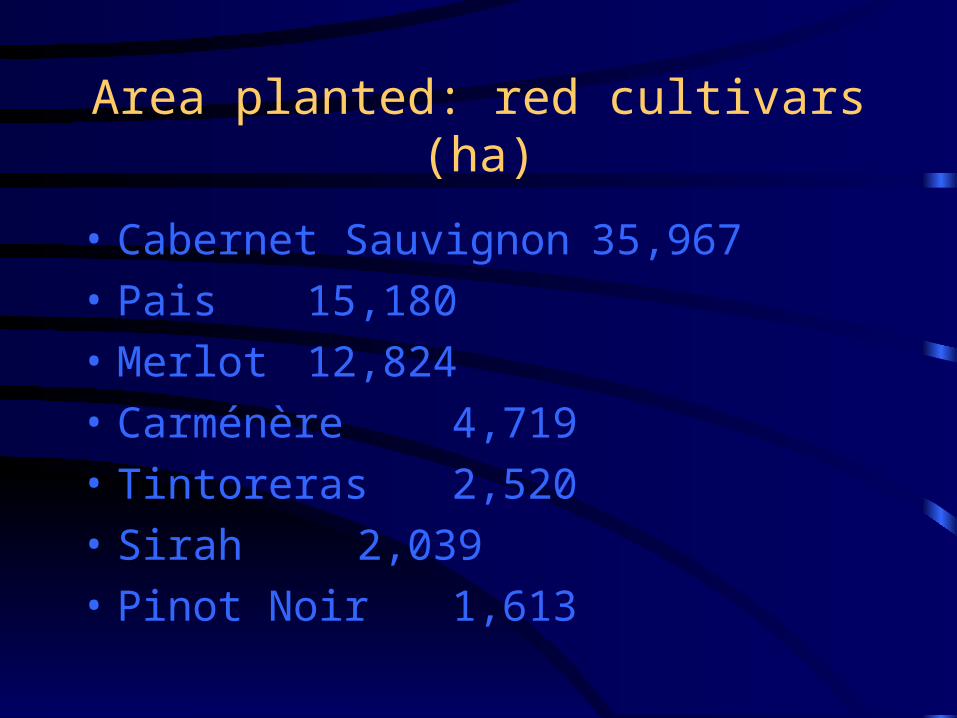
Area planted: red cultivars (ha)
• Cabernet Sauvignon 35,967• Pais 15,180• Merlot 12,824• Carménère 4,719• Tintoreras 2,520• Sirah 2,039• Pinot Noir 1,613
Area planted: red cultivars (ha)
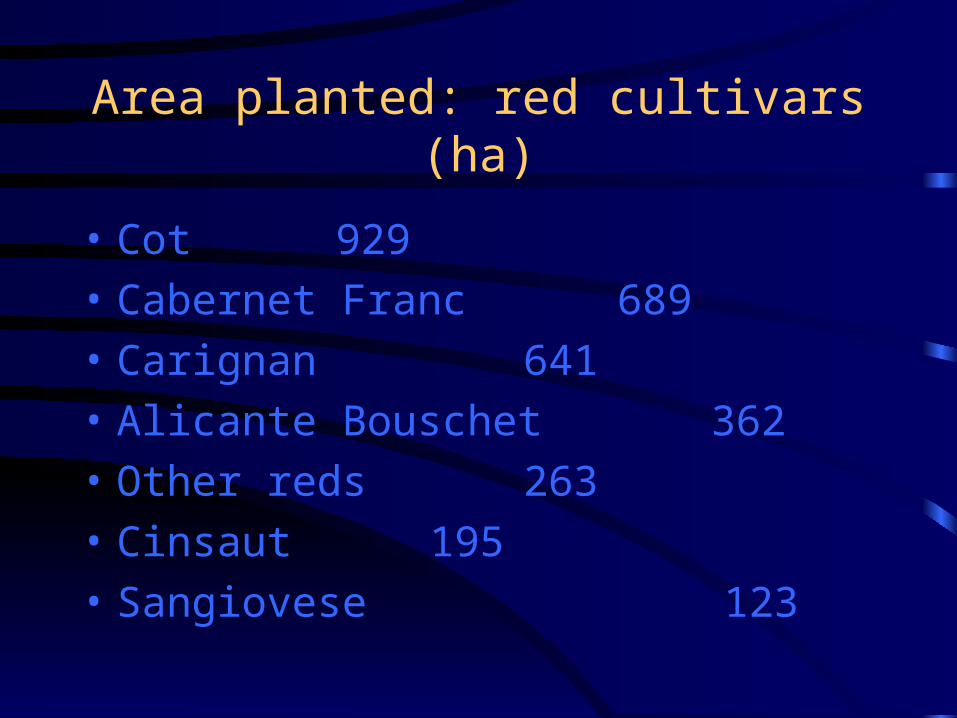
• Cot 929• Cabernet Franc 689• Carignan 641• Alicante Bouschet 362• Other reds 263• Cinsaut 195• Sangiovese 123

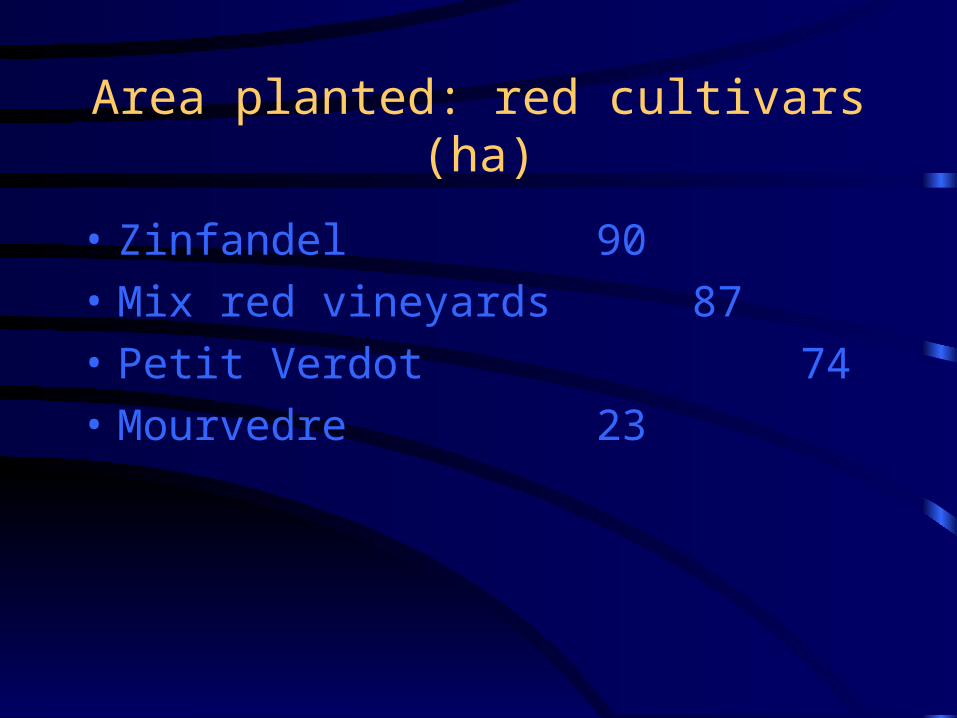
Area planted: red cultivars (ha)
• Zinfandel 90• Mix red vineyards 87• Petit Verdot 74• Mourvedre 23
Area planted: red cultivars (ha)
• Cabernet Sauvignon 35,967• Pais 15,180• Merlot 12,824• Carménère 4,719• Tintoreras 2,520• Sirah 2,039• Pinot Noir 1,613

Area planted: red cultivars (ha)
• Cot 929• Cabernet Franc 689• Carignan 641• Alicante Bouschet 362• Other reds 263• Cinsaut 195• Sangiovese 123
Area planted: red cultivars (ha)
• Zinfandel 90• Mix red vineyards 87• Petit Verdot 74• Mourvedre 23

World exports of wine. % participation (%) (O.I.V.)
1. Italia 26,3
2. Francia 21,4
3. España 11,7
4. Alemania 5,2
5. Bulgaria 3,6
6. Portugal 3,4
7. Chile 3,2
8. Moldavia 2,8
9. EE.UU. 2,8
10. Hungría 2,6
11. Australia 2,5
12. Argentina 2,1
13. Sudáfrica 1,7

Destination of Chilean bottled wine exports2001
Liters % US$ FOB %United Kingdom 39,588,237 24.98% 103,854,503 22.89%USA 25,585,716 16.15% 84,694,042 18.66%Germany 9,287,293 5.86% 27,372,734 6.03%Japan 8,500,678 5.36% 25,783,946 5.68%Canada 6,814,072 4.30% 21,759,013 4.79%Ireland 7,321,035 4.62% 21,558,298 4.75%Denmark 7,103,326 4.48% 19,374,041 4.27%Holland 6,402,263 4.04% 16,670,491 3.67%Sweden 5,051,072 3.19% 12,341,509 2.72%Brasil 4,664,927 2.94% 11,436,080 2.52%
Total 158,471,966 453,787,405
Country Quantity Amount