chapter 3 • bread for the world...
TRANSCRIPT

100 CHAPTER 3 • BREAD FOR THE WORLD INSTITUTE
Rick Reinhard

Chapter 3
www.hungerreport.org • 2017 Hunger Report 101
U.S. FragileSummary
The United States has adopted the Sus-tainable Development Goals (SDGs) along with the rest of the world, and in doing so has committed to ending hunger and pov-erty and achieving the other goals, both domestically and internationally by 2030. Every country is primarily responsible for achieving the goals within its own borders. As in all countries, the guiding principles in the United States are to leave no one behind, and then to reach the furthest behind first. These are principles sewn into the fabric of our nation since its inception. While we may not have lived up to them at all times, we have always recognized we can do better. With the SDGs we embrace this opportunity to do better for ourselves and the world as a whole.
• Provide housing assistance to all families with incomes of less than 30 percent of area median income.
• Expand the Earned Income Tax Credit (EITC) to childless workers.
• Reform the Temporary Assistance for Needy Families (TANF) program to ensure sufficient funding, increase States’ accountability, and better connect families to much needed child care and job training services.
• Create a public jobs program focused on connecting workers who have barriers to employment with in-demand job skills.
• Reform our criminal justice system by decriminalizing poverty, ending for-profit policing, and reducing barriers to work for formerly incarcerated individuals.
KEY POINTS

102 Chapter 1 • Bread for the World Institute
Place MattersSince 2000, poverty in the United
States has become dramatically more concentrated. Another way to think of it is that living in poverty is increasingly a place-based experi-ence. This is alarming if we hope to eliminate hunger and poverty and achieve other development goals in the United States. The places where people live determine many of the opportunities they have, as well as the barriers they face to escape poverty once and for all. Community-level resources play a vital role in helping individuals to be resilient and able to cope with shocks and stresses.
In 2014, 46.6 million people in the country (14.8 percent of the popula-tion) were living in poverty, defined that year as just under $24,000 a year for a family of four. Almost 14 million people lived in extremely poor communities, defined as com-
munities with poverty rates of 40 percent or more—twice as many as in 2000.1 Fifty-five percent of all people in poverty live in a community where at least 20 percent of the population is poor—up from 43.5 percent in 2000.2
2015 produced the first substantive indicators of broad based economic growth, with incomes growing the most for the lowest-earning workers. Between 2014 and 2015, the national poverty rate fell by 1.2 percent, the largest single-year reduction since 1999; there were 3.5 million fewer people living in poverty in 2015 than in 2014.3 As the Hunger Report goes to press, we do not yet have comprehensive data on concentrated poverty, but we do know in the 100 largest metropolitan areas, where 70 percent of people living in concentrated poverty reside, the poverty rate fell by a smaller margin of 0.9 percent.4
Large metropolitan areas may be the geographic center of concentrated poverty, but it is the mid-size and smaller metropolitan areas where concentrated poverty has grown the fastest.
102 Chapter 3 • Bread for the World Institute
Greater than 3 million
1 to 3 million
500,000 to1 million
250,000 to500,000
Less than250,000
0 15
2.2
6.3
3.4
7.4
6.4
0.5
6.9
12.9
8.4
9.4
3.2
3.1
4.7
5.5
3.0
1.9
4.7
6.1
6.6
4.8
5 10
LatinoTotal White Black
Source: Paul A. Jargowsky (August 2015), The Architecture of Segregation: Civil Unrest, the Concentration of Poverty, and Public Policy, The Century Foundation.
Figure 3.1 Change in Concentration of Poverty in Metropolitan Areas of Different Sizes Since 2000
In 2014, among all public schools,
while only 7.6 percent
of white students
were.2
42.6 percent of students of color were in high-poverty
schools
African American
Latino
White
1 in 4 African Americans and
1 in 6 Latinos live in high-poverty neighborhoods
compared to 1 in 13 whites.1

Chapter 3
www.hungerreport.org • 2016 Hunger Report 103
See Figure 3.1. Two such areas are Syracuse, New York, and Dayton, Ohio. Syracuse and Dayton are Rust Belt cities that have lost thousands of manufacturing jobs as firms moved overseas or to lower-cost states. The Great Recession and slow recovery since then have not been kind to either Syracuse or Dayton. Between 2007 and 2013, Syracuse lost 27 percent of its manufacturing jobs.5 Much of Dayton’s manufacturing sector is hitched to the auto industry, and when the industry began shed-ding jobs decades ago, Dayton shed jobs with it.
The bursting of the dot-com bubble in 2000 and then the onset of the Great Recession in 2007 led to increases in poverty nationwide. But this by itself cannot account for the dramatic rise in concentrated poverty. Elizabeth Kneebone and Natalie Holmes of the Brookings Institution explain, “If that growth had been shared evenly across places—imagine every census tract experienced the same percentage point increase in its poverty rate—then we might have expected just over 800 neighborhoods to cross the 40 percent threshold to become extremely poor over that time period. Instead, more than 2,700 tracts—over three times the expected number—joined the ranks of extremely poor neighborhoods.”6
The growth in concentrated poverty has affected people of color more than whites. About half of all those living in poverty are white, but they are less than one-fifth of those in areas of concen-trated poverty. Among people living in poverty, Latinos are more than three times as likely to be living in communities of concentrated poverty as whites are, and blacks are almost five times as likely. 7 Syracuse led the list of metropolitan areas with the highest concentrated poverty rates for black and Latino residents. Nearly 59 percent of poor black and 62 percent Latino residents lived
www.hungerreport.org • 2017 Hunger Report 103
People line up to collect food boxes at a distribution site in Saginaw, Michigan,
where poverty rates have soared in recent decades with the loss of manufacturing jobs.
Todd Post for Bread for the World
of U.S. households with annual incomes of less than $20,000 spend more than half of their income on rent alone.3
An estimated 1 in 5 individuals
leaving prison becomes homeless as soon as he or she
passes through the prison gates.4
59 PERCENT

104 Chapter 3 • Bread for the World Institute
in extremely poor neighborhoods in 2010-14.8 Figure 3.2 shows how concentrated poverty has increased for all Syracuse residents since 2000.
The growth in concentrated poverty is, in part, a resurgence of racial and ethnic segregation. Laws have been passed and government policies implemented to reduce racial inequalities and segregation. Many were the fruits of the Civil Rights Movement and the War on Poverty. But the share of black children growing up in concentrated poverty has not improved much as a result.9 One can travel to areas of the country where local officials appear never to have been informed of Brown vs. Board of Education, the landmark 1954 Supreme Court decision that declared separate public schools for black and white students unconstitutional. Today, public schools are more segregated than in 1968.10 The Civil Rights Project at UCLA reports that the percentage of schools described as “hyper-segregated, in which 90 percent or more of students are minorities,” has more than tripled since 1988, from 5.7 percent to 18.4 percent.11
Living in poverty is hard under any circumstances, but when so many of your neighbors are also struggling, you face many other burdens besides low income. High-poverty communi-ties have fewer job opportunities and thus higher unemployment, poorer performing schools, increased violence and more street crime, fewer full-service grocery stores and more fast food, more exposure to environmental toxins through substandard housing, and less access to health care and other services to facilitate economic mobility.12
A survey of research literature shows that the negative effects of concentrated poverty (e.g., crime and violence, youth dropping out of school, chronic food insecurity) typically are not vis-ible in neighborhoods with less than 20 percent poverty. They appear in neighborhoods at about
I81 I690
I481
I81
I81 I690
I481
I81
2000 2009-2013
Poverty Rate:0 to 20%20-40%40-60%60-80%80-100%Central City
Source: U.S. Census 2000 and ACS 2009-2013. Paul A. Jargowsky, The Architecture of Segregation (online appendix). Century Foundation and Center for Urban Research and Education (CURE), Rutgers University - Camden. August, 2015.
Figure 3.2 Syracuse Metropolitan Area

Chapter 3
www.hungerreport.org • 2017 Hunger Report 105
20 percent and increase rapidly as the poverty rate rises to 40 percent or higher.13
The effects on children of growing up in concentrated pov-erty start with mothers who are more likely to be malnourished and hungry during pregnancy and last a lifetime. See Figure 3.3. Research shows that regular exposure to vio-lence impairs children’s cognitive development and academic perfor-mance and thus has a direct effect on economic mobility.14
Recent contributions to the research on economic mobility show that upward mobility is as much a function of the places people live as of the people themselves.15 Based on a study of 5 million low-income families, Raj Chetty and Nathaniel Hendren of Harvard’s Equality of Opportunity Project found that for every year a child spends in a better neighborhood environment, her or his chances of economic success as an adult increase proportionally. To measure success, they use indicators such as income, attending college, and avoiding teenage pregnancy.16
For most households that have been poor, having an income below the poverty line is a tempo-rary situation. From the start of 2008 through the end of 2009 (a period coinciding with the worst recession in 75 years), nearly one-third of the U.S. population spent at least one month living in poverty; a fifth spent at least six months; and less than one-twentieth spent every month of this period in poverty.17
As we saw in developing countries, people move into and out of poverty, if poverty is indicated by a specific income. There may be reprieves, but generally households that move out of poverty don’t suddenly earn three times what they did before. They are still on the margins of poverty. If they live in the same place, conditions in their neighborhood probably haven’t changed. A little more income flowing into a household does not improve the schools or make the streets any safer. The destabilizing effects of living in a poor community are still a constant pressure. Despite this, too, people don’t automatically leave the old neighborhood as soon as their income rises a bit. They signed a lease, their children are settled in school. Moving out of poverty takes more than some extra hours of overtime pay.
Thus, the United States needs to focus special attention on communities of concentrated poverty to end hunger in the United States by 2030. There may not be a one-size-fits-all or a single all-encompassing policy solution that will get us there, but much progress can be made in reducing instability and fragility by setting and meeting the medium-term goal of reducing poverty rates in the very poorest communities to no more than 20 percent.
Adoption of Health-risk Behaviors
EarlyDeath
Disease, Disability,and Social Problems
Disrupted Neurodevelopment
Adverse Childhood Experiences
Social, Emotional and Cognitive Impairment
DEATH
BIRTH
Source: Centers for Disease Control and Prevention.
Figure 3.3 Mechanism by Which Adverse Childhood Experiences Influence Health and Well-Being Throughout the Lifespan

106 Chapter 3 • Bread for the World Institute
Box 3.1
Reversals in Life Expectancy in Rural America Since the 1990s, there has been an unprecedented increase in midlife death rates among rural white
women. Midlife death rates among rural white men are also rising, but not as dramatically as for women. The death rates among women ages 25-29 have increased by 37 percent, ages 30-44 by 48 percent, and ages 45-49 by 25 percent. Meanwhile, the death rates of rural people of color in these age groups, both men and women, continue to decline.
The last time researchers noted such a dramatic drop in life expectancy—anywhere in the world—was in the early 1990s after the collapse of the Soviet Union, when Russian men’s life expectancy fell by seven years due to alcoholism and other unhealthy behaviors.
The causes of the rising death rates among rural white women are a combination of drug and alcohol abuse, smoking, diseases related to obesity, and suicide.18 Women in their early 50s are dying of cirrhosis
of the liver at a rate double their rate at the end of the 20th century. Obesity increases the risk of liver disease, and a combination of obesity with alcohol abuse is particu-larly deadly, says George Koob, director of the National Institute on Alcohol Abuse and Alcoholism.19 As we now know, smoking greatly increases the risk of lung cancer, which now kills more women than breast cancer.
In a December 2015 study, Princeton economists Anne Case and Angus Deaton found that the increase in death rates was highest among whites with a high school education or less.20 Using data from the Centers for Disease Control and Prevention (CDC), they did not break down their findings by place, but Joel Achenbach and Dan Keating of the Washington Post since the study appeared used the same data to analyze the geographic implications.21
Although the increased death rate is occurring in rural areas nationwide, the South as well as Central Appalachia have been hardest hit. One likely reason is the declining number of jobs in the coal industry and manufacturing.
People with less education are having a more difficult time finding work—and paying for health care. At the same time, unemployment leads to poverty, unemployment and poverty contribute to obesity, depression, alcoholism, and drug addiction.
Achenbach and Keating quote Johns Hopkins University sociologist Andrew Cherlin, who suggests that the rising rates of self-destructive behavior may also be linked to dashed expectations. “The idea that today’s generations will do better than their parents’ generation is part of the American Dream,” says
Cherlin. “It may still be true for college-educated Americans, but not for the high-school-educated people we used to call the working class.”
These stressors have increased for everyone, but perhaps they are particularly harsh for women who may now be their family’s only or main breadwinner, while continuing to care for children and fulfill domestic responsibilities. Clearly, rising death rates call for increased attention to the struggles of many people in rural America.
Access to healthcare services is a problem in low-income rural areas, with fewer providers and a larger share of the population lacking health insurance compared to urban areas.
USDA / Bob Nichols

Chapter 3
www.hungerreport.org • 2017 Hunger Report 107
More and Better Affordable Housing Housing costs are at the center of concentrated poverty. People live in poor communities
because it’s what they can afford. Housing consumes the largest share of a low-income family’s budget, effectively dictating where the family can live. Federal housing programs assume that families spend no more than 30 percent of their income on housing. But the majority of families in poverty spend more than 50 percent of their income on housing, and in some metropolitan areas they spend more than 70 percent, leaving little room for food or much else.22
“Some days children go hungry because the rent eats first,” writes Matt Desmond, a sociolo-gist at Harvard and author of Evicted: Poverty and Profit in the American City.23 It’s a matter of simple arithmetic: if housing costs are reduced from 50 percent or 70 percent of family income to 30 percent, it will not only reduce the number of evictions and increase neighborhood stability, but also free up additional resources for food, clothing, medicine, and other necessities.
Evicted is focused on Milwaukee but tells a much broader story. From 2000 to 2010, median rents across the country increased anywhere from 21 percent to 37 percent, while the cost of utili-ties soared by more than 50 percent. Over the same period, median incomes did not nearly keep pace, rising only 7.3 percent for families headed by a high school graduate, and less for those without a high school degree.24
Given rent and utility costs rising far faster than incomes, evictions were bound to increase. This is precisely what the data show. In 2013, according to the American Housing Survey, one in eight poor families renting reported they could not pay rent consistently and expected to be evicted.25 Evictions rates are highest for women of color. If their household includes chil-dren, the risk of eviction triples. In Milwaukee, one in five black women report having been evicted at some point in her adult life; among Latinas, it is one in twelve; and among white women, one in fifteen. 26
Ironically, most public housing authorities, whose purpose is to make housing more affordable for low-income people, count an eviction as grounds for disqualifying an applicant for housing assistance. This creates a vicious circle where the families most in need of housing assistance are systematically denied help. Private landlords, of course, have the right to reject applicants with past evictions, but this also feeds into a relentless force pushing poor families with children into poorer and poorer neighborhoods, where living conditions are worst and crime rates are highest.
The good news is that adequately funded housing policies could be instrumental in reducing concentrated poverty and diversifying communities. In 2010, federal housing assistance lifted 37 percent of families that received it out of poverty, a higher share than was achieved by any other safety net program.27 The problem is that only one in four low-income families eligible for housing assistance receives it. It is basically not available to anyone who has fallen on hard times recently,28 because applicants spend years, sometimes decades, languishing on wait lists.
There are proposed solutions. One, which came out in 2013, was “perhaps the most radical recommendation to come out of a bipartisan commission in 40 years,”29 according to Barry Zigas, director of housing policy for the Consumer Federation of America and a member of the Bipartisan Housing Commission that made the recommendation.30
The bipartisan proposal was for a universal housing voucher program. The current voucher program would be extended to all households whose incomes are less than 30 percent of an area’s median income. For example, if half the families in a particular area earn more than
Adequately funded housing policies could be instrumental in reducing concentrated poverty and diversifying communities.

108 Chapter 3 • Bread for the World Institute
$60,000 a year and the other half earn less, the vouchers would go to all households earning less than about $18,000.
Currently the program costs about $51 billion a year. The extension would increase the cost by an estimated $22.5 billion a year through 2023.31 Let’s put that number in perspective by first considering its value in stabilizing communities—there is very clear evidence that it does.32 Second, let’s compare it with another housing policy, also said to be essential to family and com-munity stability, that costs $90 billion a year.33 Its usefulness in increasing community stability hasn’t really been shown by the studies done on it, however, and it may have contributed to the housing bubble34 that precipitated the Great Recession.
Why would a program proven to help low-income neighborhoods be considered too expensive at one-fourth the cost of another, less proven program? It looks very much as though it’s because the beneficiaries of the latter are primarily households that earn more than $100,000 a year. The second policy is the deductions for mortgage interest and property tax.
The National Low Income Housing Coalition (NLIHC) documents a nationwide shortage of 7.2 million rental units for extremely low-income renter households.35 See Figure 3.4. NLIHC
ME40
NH32
MA–45
CT–36
NY32
PA35 NJ–31
DE–32
MD–34VA30
WV50
OH38IN
30
MI29
IL33
WI26
MN37
IA39
MO37
AR41
LA35
TX24
OK47
KS39
NE36
ND64
SD43
MT41
ID27
WA29
OR22
CA21
AK21
HI36
WY41
CO25
UT33
NV17
AZ21 NM
28
NC30TN–37
KY38
SC39GA
28AL41
MS41
FL22
RI–40
VT53
25 or Fewer
Between 26 and 35
Between 36 and 40More than 40
Source: National Low Income Housing Coalition (2016), The Gap: The Affordable Housing Gap Analysis.
Figure 3.4 Units of Affordable Housing Available per 100 Low-income Renter Households by State

Chapter 3
www.hungerreport.org • 2017 Hunger Report 109
reports that by reducing the amount of a mortgage eligible for a tax deduction from $1 million to $500,000, it would be possible to save more than $20 billion that could be invested in affordable housing programs.36
The National Housing Trust Fund is a new program targeting housing assistance to very low-income families, the first such program since the Section 8 voucher program was created in 1974. While vouchers are a demand-side solution to the affordable housing shortage because they lower a family’s rent, the National Housing Trust Fund works on the supply side, providing grants to states to rehabilitate and build new units of affordable housing, 90 percent of which must be for rental housing. The National Housing Trust Fund was included in the 2008 Housing and Economic Recovery Act. But it was not capitalized until 2016 and is still under attack by some members of Congress.37
Coping with Permanent RecessionFood insecurity and poverty both spiked during the Great Recession, reaching highs of 14.9
and 15.1 percent respectively. They would certainly have risen higher but for the American Recovery and Reinvestment Act (ARRA). This $831 billion stimulus injected into the economy by the federal government also kept the unemployment rate from rising above 10 percent. ARRA created jobs and expanded the safety net to help people cope as production in the pri-vate sector slowed and then stopped. In times of recession, safety net programs are the most immediate and effective way government can help unemployed or underemployed workers and their families, the human casual-ties of recession.
The Great Recession officially ended seven years ago, but in many parts of the country, it did not end, or not entirely. If poverty rates, food insecurity rates, and unemployment rates remain the markers of a recession, then in many communities, recession is a fixed state. As far as anyone can tell, it appears to be a “new normal.” It follows that residents of these communi-ties need safety net programs as much as ever.
The household, rather than the community, is the primary focus of government safety net programs. As a result, we know less about the direct impact of safety nets on community-based outcomes than we do about household outcomes. We know that the negative impacts of poverty and hunger touch all members of a community, so it’s reasonable to presume the same of posi-tive impacts—that the safety net improves conditions in the community. Internationally, there is growing recognition that safety net programs and other social protections can help foster com-munity resilience—to climate change, for example. When disaster strikes a community, safety net programs that already exist can scale up quickly. Resilience is about more than bouncing back after a shock—before a shock hits, be it a recession or an earthquake, safety nets reduce the vulner-ability of people in the community by keeping them healthy.
In 2012, safety net programs lifted 48 million people out of poverty and reduced the annual poverty rate from 29.1 percent of the U.S. population to 13.8 percent.38 The safety net continues to play a large role in reducing poverty. In 2015, safety net programs cut the poverty rate nearly in half. See Figure 3.5, next page. In the previous section, we mentioned that a sizeable share of the families that received housing assistance were lifted above the poverty line as a result. The Earned Income Tax Credit (EITC) and the Supplemental Nutrition Assistance Program (SNAP, formerly known as
We know that the negative impacts of poverty and hunger touch all members of a community.

110 Chapter 3 • Bread for the World Institute
food stamps) have the largest effects of all in reducing poverty among non-elderly households with children, and will be the focus of sections below.
EITCThe EITC, a “refundable tax
credit,” benefits both workers and employers by subsidizing low-wage work. It helps support employment because with the federal subsidy, it is not as expensive to employ people. Workers who can claim the EITC (and workers with children who can claim the Child Tax Credit) get a refund on their taxes. In tax year 2014, the EITC and the CTC together lifted an estimated 9.4 mil-lion people out of poverty, 5 million of them children.39
The EITC is delivered in a lump sum payment that many families must use to pay off bills that have
accrued, including back rent. According to Desmond, February is the month with the fewest evictions, and it’s also when the majority of EITC payments are issued.40 Eligible filers in rural areas are less likely to claim the credit than filers in metropolitan areas, and at least one study suggests this may be because there are fewer tax preparers in rural areas.41
Low-wage workers who are childless adults do not benefit much at all from the EITC. The Center on Budget and Policy Priorities estimates that about 7.5 million low-income childless adults are taxed into poverty or deeper into poverty because the federal tax code is not supportive of them.42 Among the “childless” adults are many non-custodial parents, who could be making a sig-nificantly larger contribution to their children’s welfare if the EITC was expanded to include them.
Many workers who stand to benefit from extending the EITC to noncustodial parents are people with criminal records. In fact, nearly half of all children in the United States have a parent with a criminal record.43 In not quite four decades, the number of people who have been incarcer-ated rose by 500 percent. Communities of color have been affected most. The incarceration of so many people, particularly African American men, has had devastating consequences for families and communities. Robert DeFina and Lance Hannon of Villanova University estimated that if incarceration had not soared to the point where the term “mass incarceration” was coined, the U.S. poverty rate would be lower by at least 20 percent, perhaps by substantially more than that.44
The Center for American Progress calculates that expanding EITC benefits to childless workers would lead to $1.7 billion to $3.3 billion of community benefits annually in the form of improvements in public safety and lower recidivism, with the largest benefits accruing to com-munities that have been most affected by mass incarceration.45 This measure was proposed by the Obama administration and has gained bipartisan support in Congress.
26.3% 26.8%
Under 18
16.1%
All ages
14.3%
Counting no government assistance (before taxes)
Counting all government assistance (after taxes)
Note: Figures use the federal government’s Supplemental Poverty Measure (SPM).
Source: Center on Budget and Policy Priorities.
Figure 3.5 Safety Net Cut Poverty Rate Nearly in Half in 2015

Chapter 3
www.hungerreport.org • 2017 Hunger Report 111
SNAPFor nonelderly households, SNAP has the greatest
impact on reducing poverty of all of the safety net pro-grams. In 2014, SNAP kept 10 million people out of poverty, roughly half of them children.46 More than half of these households were in deep poverty, meaning that their incomes were half or less than half of the poverty line. In 2016, this would mean an income of $10,080 or less for a family of three. SNAP does more to lift children out of deep poverty than any other safety net program.
While SNAP benefits go directly to households, the program has clear economic benefits in local commu-nities as well. Every dollar spent on SNAP generates $1.74 in economic activity. Most of this stays in the local community, where SNAP benefits are generally spent promptly.47 Economists Alan Blinder and Mark Zandi analyzed ARRA policies to determine which made the biggest difference in mitigating the effects of the Great Recession. Temporarily increasing SNAP benefits pro-duced one of the biggest bangs for the buck.48
Beyond deep poverty, some people fall into the category of “extreme poverty,” meaning that they live on $2 a day or less. SNAP is the most important safety-net program for families in extreme poverty. In 2012, 1.33 million children (1.7 percent of all children) in the United States lived in extreme poverty for seven or more months of the year. Another 1.89 million children (2.4 percent of all children) were in extreme poverty for three to six months.49 Luke Schaeffer and Kathryn Edin, whose research is credited with drawing attention to $2-per-day poverty in the United States, show that SNAP benefits, when counted as income, reduce the extreme poverty rate by half.50 See Figure 3.6. But even with SNAP benefits included, there has been a statistically
significant increase in $2-per-day poverty since the beginning of the century. What Schaefer and Edin have shown very clearly is that for the poorest families, life has become a lot more pre-carious since the beginning of the century.
Schaefer and Edin’s methodology and conclusions have been challenged by analysts who argue that in the United States, people in extreme poverty consume more than their incomes would suggest.51 For example, if children receive a free break-fast and lunch in school, these in-kind benefits alone add up to more than $2 per day. This is the same criticism lodged against the official poverty measure—that failing to capture government
benefits gives an incomplete picture of a family’s resources. Schaefer and Edin answer their critics by noting: “To be without cash income in the United States is to be without a flexible resource that is vital to having a chance of bettering one’s circumstances in this country.”52 One cannot use SNAP benefits to pay bus fare to get to a job interview, or to put shoes on a child’s feet at the start of the school year.
Counting cashincome only
Counting cashincome plus SNAP
1,648,000
857,000
Source: Center on Budget and Policy Priorities.
Figure 3.6 SNAP Cuts Extreme Poverty Almost in Half
Number of households with children, in 2011, living on $2 or less per person per day
There has been a statistically significant increase in $2-per-day poverty since the beginning of the century.

112 Chapter 3 • Bread for the World Institute
Lessons from PolicyWhy did $2-per-day poverty rise, and with it, the importance of SNAP/food stamps as a lifeline
for families in the most precarious circumstances? These changes were set in motion by welfare reform legislation in 1996. Welfare reform replaced the open-ended cash assistance program Aid to Families with Dependent Children (AFDC) with a more restrictive program called Temporary Assistance for Needy Families (TANF). TANF is time-limited (“temporary”) and requires parents to meet work requirements.
In theory, work requirements sound like a good thing. Parents need to build skills in the workforce so they can become self-reliant when the program’s time limits expire. The problem is that parents have many barriers to employment that the program does not take into account and makes no provisions for. When TANF was enacted, Congress and the president promised that there would be adequate support for child care, which the program mostly has failed to deliver.
They promised that the program would provide adequate sup-port for transportation, which it mostly has failed to deliver; and they promised increased opportunities for training and education, which again TANF has mostly failed to deliver. Fed-eral TANF support for education or training activities is limited to one year.
The biggest problem of all with TANF was the decision to turn it into a state block grant. This gave states blanket permis-sion to establish eligibility criteria, design work requirements,
and decide how to use federal and state dollars in the program. Several states have exploited the flexibility they were granted. They have used TANF dollars for other purposes with federal lawmakers unable to hold them accountable—for example, funding college scholarships for indi-viduals who are not receiving or do not meet the eligibility criteria for TANF cash assistance.53 The block grant is not indexed to inflation and Congress has not increased funding for it, so its value has been eroded by one-third over the past 20 years.54
For these reasons and others, TANF is certainly no model for reducing hunger and poverty in the United States—yet many in Congress have touted the “success” of the 1996 welfare reform law. Some measure success not by reducing poverty, but by reducing the number of families receiving benefits. Bread for the World has participated in efforts with coalition partners to fight efforts in Congress to block grant SNAP, and in 2016 there has been no Congressional attempt to block grant the program.
When welfare reform was enacted, the U.S. economy was entering a boom that is unique in the past 30 years. The boom ended in 2000 when the dot-com bubble burst. The tight labor markets that made it possible for TANF parents to find jobs have vanished. Since then, a chronically weak labor market and an oversupply of low-wage workers has made it much more difficult for these families to gain a foothold in the economy. As their time limits in the program expired, they had neither jobs, nor skills, nor cash assistance. They sank deeper into poverty, some all the way into extreme poverty.
TANF completely failed to respond to the Great Recession. As Liz Schott of the Center on Budget and Policy Priorities explains, “While the number of unemployed doubled in the Great Recession, TANF caseloads rose only modestly, by 13 percent from December 2007 to December 2009. See Figure 3.7. In some states, caseloads even fell as the state reduced access to benefits. In contrast, SNAP provided the automatic counter-cyclical response that a safety net program
Jobs that pay a living wage are the only sustainable path out of hunger and poverty in the United States.

Chapter 3
www.hungerreport.org • 2017 Hunger Report 113
should have. TANF’s modest response to the recession would have been even weaker if the 2009 Recovery Act had not included additional funding to reimburse states for caseload increases.”55
In earlier chapters, we highlighted the role of conditional cash transfers in reducing poverty and hunger in developing countries. Cash transfers, conditional or unconditional, are a major reason the global poverty rate was cut in half and hunger was nearly cut in half between 1990 and 2015. In developing countries, the “conditions” are usually for parents to allow children to attend school rather than work on the family farm or for pregnant and nursing women to attend to their own and their children’s healthcare needs. Parents are not expected to build a school or clinic, or staff them with teachers or doctors, in order to receive the cash transfer.
In contrast, the 1996 welfare reform converted an unconditional cash transfer program into a conditional one, yet there was little support for parents to find and compete for a job within commuting distance, pay for transportation, or find and pay for child care on their earnings from a low-wage job. These are in fact societal problems that individuals are expected to solve by themselves.
Bouncing Off the Safety Net and Into the Job Market Jobs that pay a living wage are the only sustainable path out of hunger and poverty in the
United States. In low-income communities, the problem is not just a dearth of jobs, but that too few of the jobs that are within commuting distance pay living wages. For residents of high-poverty neighborhoods, the problem of job proximity has gotten worse since 2000.56 See Figure 3.8.
There is not one state, metropolitan area, or county in the United States where workers earning the prevailing minimum wage could afford a modest two-bedroom rental unit.57 A worker earning
THE RECESSION
120%
90
60
30
0
-30
2008 2009 20142010 2011 2012 2013
D M J S D M J S D M J S D M J S D M J S D M J S D M J S D
Change in national TANF families
Change in national SNAP families
Change in nationalnumber of
unemployedpersons
Source: Center on Budget and Policy Priorities.
Figure 3.7 TANF Responded Only Modestly to Recession

114 Chapter 3 • Bread for the World Institute
the federal minimum wage of $7.25 per hour in 2016 would need to work 112 hours per week, all 52 weeks of the year, just to afford a modest two-bedroom rental unit at a fair market rate.58 Some people used to say that this didn’t matter because minimum wage workers are teen-agers supported by their parents. But in fact, most are not. Seventy percent of minimum wage workers are age 20 or older, and 45 percent are 25 or older.59 Many are single parents struggling to balance work and family responsibilities.
Through the EITC, federal policymakers have committed to making low-wage jobs pay better for households with children. Also, 26 states and the District of Colombia have enacted their own versions of the EITC to complement the federal policy.60 State EITC benefits are often just a fraction of the federal
benefits, but every bit counts to a family struggling to get by on low-wage work. In 2014, Wash-ington, DC, became the first jurisdiction to extend the EITC to adults without dependent chil-dren. As discussed earlier, this is an important measure that helps both low-wage workers without children pay their bills and noncustodial parents contribute more to their children’s support.
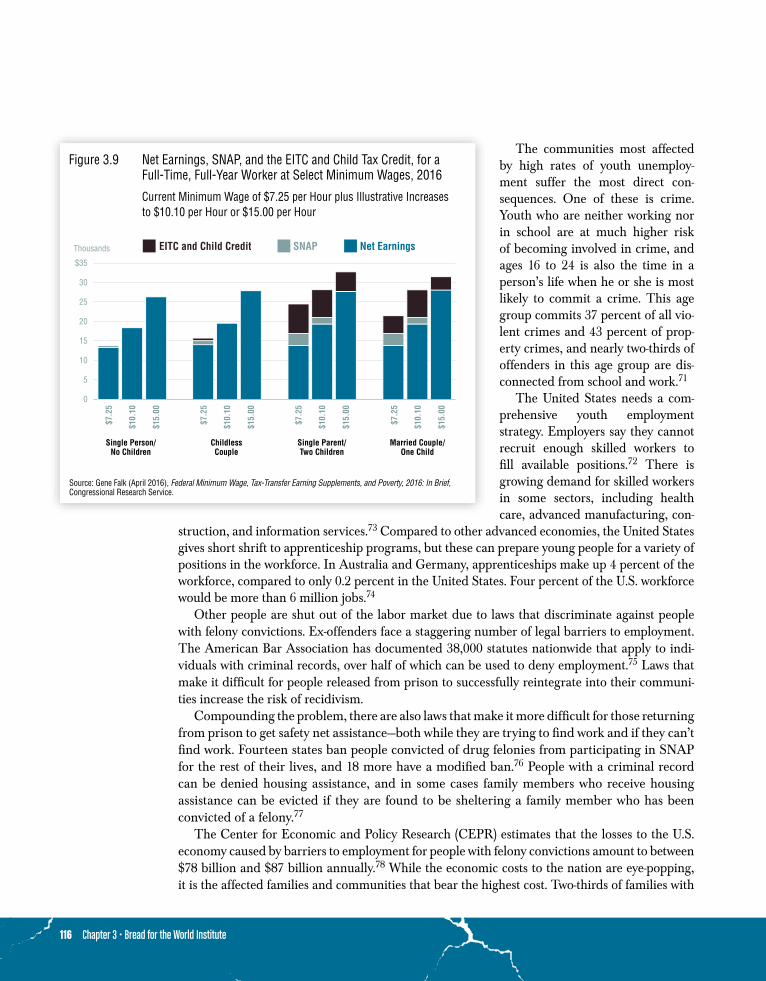
A single parent working full-time, year-round at the federal minimum wage ($7.25 an hour) is paid $15,080, not enough to lift any family with a child over the poverty line. Table 3.1 shows the 2016 federal poverty guidelines for different family sizes. With SNAP, the EITC, and the CTC, a single parent has an additional $9,300 in resources, lifting her annual income to $24,403 and putting her family over the poverty line. It’s still not a lot to live on, but it’s a substantial boost over what she is paid as a minimum-wage worker.61 In 2013, congressional Democrats proposed raising the federal minimum wage to $10.10 an hour, and since then, some of the country’s lowest-paid workers have organized to demand a federal minimum wage of $15 an hour. Figure 3.9, page 116, shows what the net effects would be of increasing the minimum wage to $10.10 an hour and $15 an hour for four family types. Critics argue that a jump to $15 will lead employers to find ways to hire fewer low-wage workers. Studies show that modest increases in the minimum wage do not depress employment. Some states and cities have adopted the $15 minimum wage, and the outcomes will be instructive.
Even with the EITC, low-wage workers are long overdue for a raise. For decades they have con-tributed to the increasing productivity of the U.S. economy and have not been compensated to any degree that’s even close to fair. From 1945 through 1970, workers up and down the income ladder received higher pay as productivity grew.62 Since 1970, however, wage growth and productivity
■ 2000
■ 2012600,000
500,000
400,000
300,000
200,000
100,000
0Total White Black Latino Asian Non-Poor Poor
-7%
-6%
-14%-17%
-9%
-6%
-17%
Source: Elizabeth Kneebone and Natalie Holmes (March 2015), The growing distance between people and jobs in metropolitan America, The Brookings Institution.
Figure 3.8 Change in Number of Jobs Near the Typical Large-Metro Resident, by Race, Ethnicity, and Poverty Status, 2000 and 2012

Chapter 3
www.hungerreport.org • 2017 Hunger Report 115
growth have been decoupled. If the minimum wage had continued to rise along with productivity growth, it would have been $18.42 an hour in 2014.63
This means that it’s not only minimum-wage workers who have been shut out of the benefits of the nation’s increasing productivity growth, because in 2015, the median hourly wage for all occupations was only $17.40.64 In other words, at least half of all workers today are earning less than what the minimum wage would be if everyone had gotten a fair share of productivity growth. Those who understand the wage and productivity trends, yet argue that the country can’t afford to raise the minimum wage, appear to be at best disingenuous.
The U.S. Department of Labor’s Bureau of Labor Statistics (BLS) tracks several indicators of unemployment and workforce participation. What we most often hear about, particularly in major media outlets, is the official unemployment rate. In BLS terminology this is the U-3 rate, defined simply as people who are out of work and looking for a job. The U-6 rate is a larger category that includes the U-3 population plus people who are “marginally attached” to the labor market. These are people “who are neither working nor looking for work but want and are available for a job and have looked for work sometime in the past 12 months; and people who work part time for economic reasons, who would have preferred full-time employment but were working part time because their hours had been cut back or because they could not find a full-time job.”65 The U-6 rate is typically twice as high or more as the U-3 rate.66 In August 2016, the most recent data available at this writing, the U-3 unemployment rate was 4.9 percent and the U-6 rate was 9.7 percent.67
Hard to EmploySome groups and individuals face barriers to employment. The education system has left
some people poorly prepared to compete for jobs in today’s economy. The high school gradua-tion rate is higher than at any time in the nation’s history,68 yet the U-3 and U-6 rates for high school graduates between the ages of 17 and 20 who are not enrolled in further schooling are 17.9 percent and 33.7 percent respectively.69 For more and more jobs, a high school diploma is no longer enough.
It’s not only those right out of high school who are struggling. There are far too few opportunities for people in their twenties who cannot afford a postsecondary education, or don’t excel in tradi-tional academic settings, but are motivated to work. In 2013, the unemployment rate among 23- and 24-year-olds not attending school was 28 percent, up from 20 percent at the turn of the century.70
Table 3.1 Federal Poverty Level Compared with Gross Earnings from Full-Time, All Year Work at the Federal Minimum Wage, 2016
Federal Poverty Level is for the 48 Contiguous States and the District of Columbia
Source: Gene Falk (April 2016), Federal Minimum Wage, Tax-Transfer Earning Supplements, and Poverty, 2016: In Brief, Congressional Research Service.
Family Size
Federal Poverty Level
Gross Earnings, Full-Time All Year at the Current Federal
Minimum Wage
Minimum Wage Earnings as a Percent
of the Federal Poverty Level
1 $11,880 $15,080 127%
2 $16,020 $15,080 94%
3 $20,160 $15,080 75%
4 $24,300 $15,080 62%
5 $28,440 $15,080 53%
6 $32,580 $15,080 46%
116 Chapter 3 • Bread for the World Institute
The communities most affected by high rates of youth unemploy-ment suffer the most direct con-sequences. One of these is crime. Youth who are neither working nor in school are at much higher risk of becoming involved in crime, and ages 16 to 24 is also the time in a person’s life when he or she is most likely to commit a crime. This age group commits 37 percent of all vio-lent crimes and 43 percent of prop-erty crimes, and nearly two-thirds of offenders in this age group are dis-connected from school and work.71
The United States needs a com-prehensive youth employment strategy. Employers say they cannot recruit enough skilled workers to fill available positions.72 There is growing demand for skilled workers in some sectors, including health care, advanced manufacturing, con-
struction, and information services.73 Compared to other advanced economies, the United States gives short shrift to apprenticeship programs, but these can prepare young people for a variety of positions in the workforce. In Australia and Germany, apprenticeships make up 4 percent of the workforce, compared to only 0.2 percent in the United States. Four percent of the U.S. workforce would be more than 6 million jobs.74
Other people are shut out of the labor market due to laws that discriminate against people with felony convictions. Ex-offenders face a staggering number of legal barriers to employment. The American Bar Association has documented 38,000 statutes nationwide that apply to indi-viduals with criminal records, over half of which can be used to deny employment.75 Laws that make it difficult for people released from prison to successfully reintegrate into their communi-ties increase the risk of recidivism.
Compounding the problem, there are also laws that make it more difficult for those returning from prison to get safety net assistance—both while they are trying to find work and if they can’t find work. Fourteen states ban people convicted of drug felonies from participating in SNAP for the rest of their lives, and 18 more have a modified ban.76 People with a criminal record can be denied housing assistance, and in some cases family members who receive housing assistance can be evicted if they are found to be sheltering a family member who has been convicted of a felony.77
The Center for Economic and Policy Research (CEPR) estimates that the losses to the U.S. economy caused by barriers to employment for people with felony convictions amount to between $78 billion and $87 billion annually.78 While the economic costs to the nation are eye-popping, it is the affected families and communities that bear the highest cost. Two-thirds of families with
$35
30
25
20
15
10
5
0
Thousands
Single Person/No Children
Single Parent/Two Children
ChildlessCouple
Married Couple/One Child
$7.2
5
$10.
10
$15.
00
$7.2
5
$10.
10
$15.
00
$7.2
5
$10.
10
$15.
00
$7.2
5
$10.
10
$15.
00
EITC and Child Credit SNAP Net Earnings
Source: Gene Falk (April 2016), Federal Minimum Wage, Tax-Transfer Earning Supplements, and Poverty, 2016: In Brief, Congressional Research Service.
Figure 3.9 Net Earnings, SNAP, and the EITC and Child Tax Credit, for a Full-Time, Full-Year Worker at Select Minimum Wages, 2016
Current Minimum Wage of $7.25 per Hour plus Illustrative Increases to $10.10 per Hour or $15.00 per Hour

Chapter 3
www.hungerreport.org • 2017 Hunger Report 117
an incarcerated member struggle to meet basic needs such as food and housing costs.79 Children growing up in a family with an incarcerated parent are at increased risk of being homeless80 and are more likely to drop out of school.81
Communities most affected by mass incarceration are among the most disadvantaged in the country, and they are disproportionately communities of color with the highest poverty and food insecurity rates. See Figure 3.10. Desmond argues that the disproportionately higher rates of eviction for single-parent families headed by black women are collateral damage from the incarceration of so many black men.82 One in nine black men between the ages of 20 and 34 is incarcerated.83 The incarceration of so many young men has caused a devastating loss of human capital in their communities.
Racism is undeniably a reason that so many black men have been sent to prison. Racial dis-crimination is evident in many areas, such as housing, education, employment, finance, health care, and the justice system. The evidence of racial disparities in sentencing is overwhelming. There are literally a million more whites than blacks with felony convictions, but there are more blacks than whites serving time for a felony.84 Black males are six times more likely to be incarcer-ated than white males and 2.5 times more likely than Latino males.85
BLS does not report separately on employment data of people with criminal records. According to a 2015 Kaiser Family Foundation/New York Times/CBS News Poll, 34 percent of prime working age men (25 to 54) who were not working reported having a criminal record.86 A plethora of online databases has made it easy for employers to verify whether an applicant has a
7,000
6,000
5,000
4,000
3,000
2,000
1,000
018-19 20-24 25-29 30-34 35-39 40-44 45-49 50-54 55-59 60-64 65+
Age
WhiteLatinoBlack
Source: U.S. Department of Justice.
Figure 3.10 State and Federal Prisoners per 100,000 Residents
Men, by race/ethnicity and age: 2013

118 Chapter 3 • Bread for the World Institute
criminal record. Surveys show that nine out of 10 employers conduct criminal background checks when hiring. Title VII of the Civil Rights Act of 1964 regulates criminal back-ground checks for employment; for example, employers are prohibited from posting job ads that include statements such as “no one with a criminal record need apply.”87 But the law is not aggressively enforced and many employers know this.
Some states have adopted what are known as “fair-chance” hiring practices. The term “ban the box” refers to no longer including on job applications a box to check whether or not one has ever been convicted of a crime. Answering yes, predictably, disqualifies most job applicants. For some types of jobs, employers may have a legiti-mate reason to know whether an applicant has a criminal record, but for the vast majority of jobs, it is unnecessary and becomes dis-
criminatory. Ban-the-box advocates, including Bread for the World Institute, contend that job applicants should at least have a chance to present themselves and their credentials first.
Research on the effects of ban-the-box policies has yielded mixed results so far. Two studies show that banning the box leads to fewer hires of black men and suggests that employers are stereotyping all black men as likely to have a criminal record. The National Employ-
ment Law Project, a proponent of ban-the-box, argues what these two studies show is the entrenched racism of some employers. It cites examples from Washington, DC; Durham, North Carolina; and Atlanta, Georgia, which show that banning the box increases the chances that people with criminal records will get jobs.88
Stereotyping all members of a group is illegal. Victoria Lipnic, head of the Equal Employ-ment and Opportunity Commission, says: “Where, in the absence of a criminal background check an employer chooses to use race as a proxy for criminal history, that employer is patently violating federal civil rights law. Were such a charge brought to the Commission and found to be true, I would have no difficulty bringing the full force of the agency to bear on such a transgressor.”89 Capable and accountable state institutions that will enforce the law, as we’ve highlighted in other parts of this report, play an important role in leading countries, including the United States, toward leaving no one behind.
For close to thirty years, D.C. Central Kitchen in the District of Columbia has trained hundreds of people with histories of incarceration for careers in the culinary arts.
Rick Reinhard for Bread for the World

Chapter 3
www.hungerreport.org • 2017 Hunger Report 119
Direct Job CreationDuring recessions, it’s standard operating procedure for governments to create jobs. It’s a
“countercyclical” tactic, which simply means it’s intended to counteract the recession. Many of us learned in school about the Works Progress Administration and the Civilian Conservation Corps, which employed millions of people during the Great Depression of the 1930s.
During the Great Recession, the ARRA stimulus package funded a program known as the TANF Emergency Fund. The program operated in 2009 and 2010 and provided 260,000 jobs, mainly in the private sector, in 39 states and the District of Columbia. An analysis of the impacts of the program showed that it had enduring benefits.
Participation led to significant increases in employment and earnings. Those who got a job through the program were more likely to be employed and have higher earnings a year after it ended, compared to a control group who had applied but did not get a subsidized job. Overall, the employers were satisfied with the workers and their productivity. Two-thirds of employers cre-ated positions for the workers after the program ended.90 The program particularly helped those who were “long-term unemployed,” meaning out of work for 27 weeks or more.
The success of the TANF Emergency Fund initiative makes a strong case for an ongoing federally-funded jobs program. The purpose of any public jobs program should be to support job creation when the economy is weak. Com-munities where the poverty rate is 40 percent or more have a perpetually weak economy. Such a program should target these communities and specifically include workers whom private sector employers would not be likely to hire, such as people with felony convictions, disconnected youth, and people who have been unemployed for a long time.
Policymakers subsidize job creation to fulfill governmental responsibilities as well. For example, every 10 years, the Census Bureau employs hundreds of thousands of people tempo-rarily to complete the decennial census. The 2010 Census employed 564,000 temporary workers, more than double the number supported by the TANF Emergency Fund.91
Census workers are employed to address a specific need. Similarly, government investments could help jump-start private sector job creation to meet urgent public needs. Investments in upgrading the nation’s infrastructure are both long overdue and absolutely essential to sustaining productivity growth. Retrofitting homes and office buildings to improve energy efficiency would help meet international agreements on reducing carbon emissions that contribute to climate change—and help save the planet. A $1 billion investment in the National Housing Trust Fund would support the construction of 10,000 rental homes and create an estimated 15,000 con-struction jobs.92 As we saw earlier, such affordable housing units are badly needed. All of these examples offer excellent opportunities for entry-level workers in construction. Construction jobs have traditionally enabled large numbers of people without a college degree to earn a good living.
Employment opportunities for individuals with criminal records could also be created by scaling up national service programs such as AmeriCorps, Volunteers in Service to America (VISTA), or the National Civilian Community Corps (NCCC). These programs could improve the quality of life and promote economic development in communities of concentrated poverty by targeting unmet needs and opportunities. When staffed by people from the communities, they could also contribute to social cohesion.
Investments in upgrading the nation’s infrastructure are both long overdue and absolutely essential to sustaining productivity growth.

120 Chapter 3 • Bread for the World Institute
Box 3.2
Jubilee HousingMarlysa D. Gamblin, Bread for the World Institute
Jubilee Housing is a faith-based organization in the District of Colombia that offers affordable housing and other supports for low-income individuals and families. Among the groups they serve are people who’ve recently been released from jail or prison.
Securing a safe and affordable place to live is one of multiple challenges returning citizens face. Many are released without a housing plan. Historically, corrections departments view this responsibility as
outside of their agency’s mission and purview. The reality is that the majority of those returning from jail or prison nationwide are either home-less, living in a shelter, or living with a family member short-term. David Thacher of the University of Michigan has highlighted the rising number of landlords relying on criminal back-ground checks when screening renters, which he terms as “institutional exclusion.”93
Jubilee’s Housing Reentry Initiative is a direct response to meet the housing needs for Washingtonians retuning to DC each year from incarceration in a climate of gentrification and high housing costs. The Reentry Initiative provides two separate homes in mixed-income neighborhoods for men and women to commu-nally live for six months to a year while each resident is given the emotional, career, and spiritual support needed to make the next step to full self-sufficiency. Each resident is paired with a case manager and eventually secures employ-ment to start saving for a place to live long-term.
One former resident of the reentry initiative, Alma Hunt, now has her own apartment. “If I didn’t have my own housing, my life would be in shambles. I was homeless, hungry and depressed before I went to Jubilee Housing and it got me on the right track. I was able to get a job because of their help and I didn’t feel like I was doing this all by myself since I was in a group setting. Being in the transitional housing prepared me for having my own apartment. Jubilee Housing meant a lot for me and now my stress and depression have gone down and I have my life back!”
According to the Center on Housing Policy, those who are unable to find adequate housing upon their release from prison are more than twice as likely to re-offend as those with stable housing. Julian Castro, Secretary of Housing and Urban Development (HUD), said that “the ability to find housing is an indispensable part of that second chance”94 for people returning to their communities from jail or prison.
Marlysa D. Gamblin is domestic advisor for policy and programs, specific populations, at Bread for the World Institute.
Alma Hunt has her own apartment through Jubilee Housing’s Reentry Initiative, a program that helps returning citizens transition from incarceration back to the community.
Joseph Molieri / Bread for the World

Chapter 3
www.hungerreport.org • 2017 Hunger Report 121
Presumed Guilty“At many points in American history, law enforcement enforced the status quo, a status quo
that was often brutally unfair to disfavored groups,” said FBI Director James Comey in a 2015 speech on law enforcement and race.95 The speech was motivated by what Comey said was an absence of candor and a reluctance to face hard truths about the United States’ long history of racism.
The speech came one day after the U.S. Department of Justice (DOJ) filed a civil lawsuit against the City of Ferguson, Missouri. The lawsuit cited routine “police misconduct, including discriminatory policing, unconstitutional stops, searches and arrests, and the use of unreason-able force.”96 At a press conference announcing the action, Attorney General Loretta Lynch described Ferguson as “a community in distress, in which residents felt under assault by their own police force.”97
Since the summer of 2014, millions of people of all races have come to see Ferguson as a symbol of a status quo that is brutally unfair to African Americans in particular. On August 9, 2014, Michael Brown, an 18-year-old African American man, was shot and killed by a white police officer, Darren Wilson. Brown and a friend, also a black man, had been stopped for jaywalking. Wilson alleges that Brown, who was unarmed, attacked him, although eyewitnesses disputed Wilson’s ver-sion of what happened.98 A grand jury heard testimony from Wilson and others and decided not to indict him.
In the aftermath of Michael Brown’s death, protests were staged in Ferguson and other communities around the country. The fledging organization Black Lives Matter emerged as a leader of the movement against racially-moti-vated police violence. Since Brown’s death, more unarmed black men have been killed by police. News and even images of their deaths have been posted on social media platforms, corroborating some “hard truths,” to use the FBI director’s words, about race and justice.
In July 2016, Stop the Killing Inc., an activist group located in Baton Rouge, LA, released footage that showed Alton Sterling, a 37-year-old African American man, being shot by white police officers. “You have to thank God for social media,” said Arthur Reed, the founder of the organization. “These stories are not new stories to the urban community. We’ve been saying that police are killing people and covering it up. But there’s that other side of society that hasn’t ever seen anything like this and will be quick to say, oh, man, no police officer is going to just kill you. These people are crazy. But now that we have footage, and we have video, we’re showing you exactly what’s going on and how it has been going on for so long. Right now, we just have a way of exposing it. And the sad part about it is that even though we are getting the video and we’re getting the actual killings, there’s still no accountability for what has taken place.”99
Police officers are rarely convicted of homicide or manslaughter for a fatal on-duty shooting,100 and it’s this failure of the criminal justice system to take action that particularly angers com-munities of color. In July 2016, following Alton Sterling’s death and the death of another African American man, Philando Castile, during a routine traffic stop in Falcon Heights, MN, eight police officers were killed in two separate attacks by lone gunmen in Dallas and Baton Rouge. Leaders of Black Lives Matter in these cities joined in grieving the deaths of the police officers.
Millions of people of all races have come to see Ferguson as a symbol of a status quo that is brutally unfair to African Americans in particular.

122 Chapter 3 • Bread for the World Institute
It is important to recognize the systemic nature of routine police misconduct. To illustrate this, we return to Ferguson. Soon after Michael Brown’s death, details emerged about the deep-rooted and significant tensions between Ferguson’s residents, a majority of whom are black, and the city’s police department, 95 percent white at the time. Arch City Defenders, a nonprofit legal defense organization, reported that the city of Ferguson’s second-largest source of revenue was fines and court fees, col-lected by “inflicting a kind of low level harassment involving traffic stops, court appearances, high fines, and the threat of jail for failure to pay.”101 In 2013, the city generated $2,635,400 in revenue this way—about $321 per household. The policy was worsened by the discriminatory way it was implanted as Figure 3.11 shows.
That was the context in which Darren Wilson stopped Michael Brown for jaywalking. It is certainly not common for a person stopped for jaywalking to end up dying at the hands of police, but the begin-ning of the incident was an all-too-common experi-ence for Ferguson’s African American residents. Brown’s death exposed an “offender-funded” justice system that is widely practiced around the country, and Ferguson is typical of how it is applied mainly to communities of color.
The Offender-funded Justice SystemIncreasingly, it is people charged with offenses who pay the criminal justice system’s costs,
according to a survey of all 50 states by National Public Radio and the Brennan Center for Justice at New York University Law School.102 In a majority of states, defendants can be billed for a public defender, inmates for room and board in jails and prisons, and parolees for the cost of their supervision. These revenue-generating practices have been adopted in many of the United States’ 6,500 municipal courts, according to Vanita Gupta, head of the civil rights division in the U.S. Justice Department.103 Some courts charge people “booking fees” after an arrest, regardless of whether the arrest results in a criminal charge.104 Fees imposed by courts are used to cover a range of expenses. In Allegan County, Michigan, court costs were used to finance a new fitness center for county employees.105
People of color, particularly those who are poor, face a much higher risk of being fined, arrested, and even incarcerated for minor offenses than other Americans.106 In 2013, Qumotria Kennedy, a single mother of two from Biloxi, Mississippi, spent five nights in jail because she owed $1,000 of unpaid fines from a traffic violation two years earlier. While she was in jail, she lost her part-time job cleaning motel rooms.107 “This is the real cycle of poverty,” says Barbara
Population searched
Once searched, whites were more likely to becaught carrying contrabandsuch as drugs or guns.
Arrest rate
White
Black
White
Black
Police searched a smallerproportion of white driversthan black drivers.
Contraband hit rate
White Black
34% 22%
Blacks were twice as likely as whites to be arrested during a traffic stop.
5%
10%
7%
12%
Source: Nazgol Ghandnoosh (2015), Black Lives Matter: Eliminating Racial Inequity in The Criminal Justice System, The Sentencing Project.
Figure 3.11 Ferguson Traffic Stops: Population Searched, Contraband Hit Rate, and Arrest Rate, 2013

Chapter 3
www.hungerreport.org • 2017 Hunger Report 123
Ehrenreich, author of Nickel and Dimed: On (Not) Getting By in America. “Criminal charges in turn lead to ever-mounting debt and, despite laws prohibiting debtors’ prisons, to incarceration.”108
Every year, Texas has a statewide “event,” the Great Texas Warrant Roundup, focused on collecting overdue fines from traffic violations. Police arrest and jail anybody who cannot pay, namely poor people. Judges will literally force people to empty their pockets in the courtroom, threatening them with jail time if they refuse.109 Valerie Gonzales, a 31-year-old woman with five children, is one of the plaintiffs in a class action lawsuit against the city of Austin. The Gonzales family is chronically poor and often homeless.
“The judge asked me no questions about my circumstances or my income,” said Gonzales, who had accumulated thousands of dollars in fines by failing to pay two parking tickets. “He asked me nothing about my background or my commitments or why I had been unable to pay earlier fines. All he told me was that I would go to jail if I didn’t pay a thousand dollars that day.”110 Gonzales did not have $1,000, so the judge sentenced her to 45 days in jail. Fortunately, a lawyer from the Texas Fair Defense Project filed a motion on her behalf that succeeded in con-verting her jail sentence to community service, and she spent only four days in jail. Gonzalez did not have a lawyer when she was originally sentenced because she could not afford the required court fee to be represented by a public defender.
Poor people of all races are less likely to contest such fees. They have few resources to hire an attorney and legal aid ser-vices are woefully underfunded. In Augusta, Georgia, Thomas Barrett, who is white, was jailed for failing to pay more than a $1,000 in fees added to a misdemeanor charge in 2012.111 At the time he was jailed, Barrett was homeless and had been selling plasma to pay off the fees.
Among low-income people, however, African Americans and Latinos are particularly vulnerable to being jailed because they are overrepresented among households that are asset poor. Fami-lies are considered asset poor when they do not have enough savings to live for three months on a poverty-level income. This requires “liquid” resources, assets such as bank accounts that can be quickly turned into cash. In 2014, African Americans and Latinos had a median liquid wealth of just $200 and $340 respectively, compared to $23,000 for whites.112
The United States does not have such extreme wealth disparities by accident. Past and present unjust public policies deliberately created them. Between 1934 and 1968, households of color received just 2 percent of Federal Housing Association loans. This was because of “redlining,” a policy of refusing loans to residents of an entire geographical area. People of color were therefore almost entirely shut out from buying a home, the single biggest asset most families will ever have.
The Fair Housing Act of 1968 banned redlining, but housing discrimination continued under less blatant, often unwritten practices. Most recently, lenders stripped huge amounts of wealth from communities of color during the subprime lending boom that led to the housing bubble of the early 2000s. Subprime lending is lending money at very high interest rates to borrowers who would not qualify for a mortgage loan at the prime rate. Subprime loans were pushed onto African American and Latino borrowers, even when they qualified for loans at the prime rate. The targeting was predatory and systematic. When the housing bubble burst, foreclosures prolif-erated across communities of color nationwide. Median wealth of African American and Latino households fell by 53 percent and 66 percent, respectively.113
African Americans and Latinos are particularly vulnerable to being jailed because they are overrepresented among households that are asset poor.

124 Chapter 3 • Bread for the World Institute
Poverty Is a CrimeDuring the first half of the 20th century, most people of color were excluded from welfare,
the cash assistance safety net for poor families. Legal scholar Kaaryn Gustafson has written extensively about racial discrimination and welfare policy, showing that public attitudes towards welfare turned decidedly hostile once it was opened to African Americans.114 By the mid-1960s, black single mothers were stereotyped as criminal, lazy, promiscuous welfare cheats.115
Some politicians encouraged such hostility, notably Ronald Reagan, who as governor of Cali-fornia in the 1960s and 1970s and as president in the 1980s, frequently portrayed welfare mothers as cheats who were defrauding the government and the taxpayers who supported them.116 To the contrary, however, during Reagan’s presidency the Department of Health and Human Ser-vices (then Health, Education, and Welfare) found that, “The greatest cheaters, according to the audits, are not individual welfare or health care recipients, but doctors and pharmacists and other providers of services who overbill the government.”117
The height of the hostility from policymakers came in 1996 with “welfare reform.” The criminal justice approach of get-tough-on-crime was politically popular, and, as Gustafson notes, welfare
reform adopted that approach. The new welfare system, TANF, blurred the line between welfare and the criminal justice system. TANF participants give up some of their civil rights. For example, once someone provides the welfare system with her personal infor-mation, law enforcement is permitted to access it without any basis to suspect that she has been engaged in wrongdoing.118
TANF criminalizes many coping strategies that families use out of economic necessity. TANF benefits are simply not enough to live on anywhere in the country. In 2015, TANF benefit levels for a family of three were less than $300 a month in 14 states, and the nationwide median for a family this size was $429 a month.119
Another source of income is essential. But if someone is found to have unreported earnings, she can be prosecuted for welfare fraud, which is a felony offense.120 Not reporting income from babysitting or braiding hair is a felony. Taking in a relative who helps pay rent or shares groceries is also a felony, even if it’s on an ad hoc basis. As Gustafson explains, “When it comes to violating the welfare rules, most welfare recipients are damned if they do and doomed if they don’t.”121
Desperation often forces parents to take risks that could get their benefits terminated or send them to prison. In November 2011, Anita McLemore, the mother of two teenagers, was sentenced to three years in prison in Jackson, Mississippi, for failing to report an earlier drug felony on applications for food stamp/SNAP benefits in 2006, 2007, 2009, and 2010. At the sentencing, she pleaded with the judge to allow her to postpone reporting to prison for two months so she could work extra hours to give her children money to visit her at the prison, six hours away. The judge denied her request. At no time did the judge ask about the family’s financial situation or allow McLemore to explain why she had not reported her drug-related felony convictions.122
The media often portray the dramatic decrease in the number of households receiving TANF in the late 1990s as a transition “from welfare to work.” This is not entirely true. About a quarter of the decline was due to sanctions123—loss of benefits for failing to follow the rules. Between 1997 and 1999, more than half a million families were subject to sanctions that applied to the
The new welfare system, TANF, blurred the line between welfare and the criminal justice system.

Chapter 3
www.hungerreport.org • 2017 Hunger Report 125
entire household. Sometimes, termi-nating a family’s cash assistance was a response far out of proportion to the “offense”—in some cases, it was for missing an appointment with a caseworker due to lack of transporta-tion.124 States with proportionately more African Americans receiving TANF benefits were more likely to impose stricter sanctions.125
Criminalizing coping strategies associated with economic despera-tion creates an endless loop between poverty and punishment. Welfare fraud laws, the “War on Drugs,” mandatory minimum sentences, and the crashing economy were some of the factors that led to large numbers of poor people with crim-inal convictions. The “solution” was mass incarceration, particularly of black men.
Earlier we discussed the devastation of neighborhoods with large numbers of men behind bars. Sooner or later, 95 percent of those currently incarcerated will return to the community. For men with criminal records, especially men of color, jobs in the formal economy are often simply out of reach. Alton Sterling had been trying to earn a living by selling CDs on the street when he was killed by police officers in Baton Rouge. Eric Garner, an unarmed black man whose death during an encounter with police was captured on video in 2014, had been trying to earn a living by selling cigarettes on the street in New York City.
Exiled from the formal economy because of their criminal records, these men have little choice but to rely on street hustling to survive. “The black men most likely to be left out of the formal economy—who have to engage in various illegal hustles to make ends meet—are far more likely to suffer from police violence than other black men,” says Lester Spence, a professor of political science at Johns Hopkins University.126
This explosion in the size of the prison population has caused large gaps in state, county, and municipal budgets. Criminal justice is the second-fastest-growing category of state budgets, behind only Medicaid, and 90 percent of that spending goes to prisons.127 See Figure 3.12. Marc Mauer of The Sentencing Project has calculated that at the current modest rate of decline in the size of the prison population, it will take until 2101 to return to the 1980 level.128 Simply releasing people, which is going far too slowly in any case, will not undo the damage caused by mass incar-ceration. The policy changes so far will not be enough to help end concentrated poverty. Those who are released need jobs and help reintegrating if they are to become resilient resources for their fragile communities.
2000
36.4
1985
6.7
1990
16.9
1995
26.1
2013
51.9
2010
51.4
2005
42.3
Source: Sentencing Project (January 2016), Fact Sheet: Trends in U.S. Corrections
Figure 3.12 State Expenditures on Corrections in Billions, 1985-2013

126 Chapter 3 • Bread for the World Institute
Fighting Racial Profiling in New Mexico
Marlysa D. Gamblin, Bread for the World Institute
The police department of Hobbs, New Mexico (population 43,000) has been accused of racial profiling since 2000. More than one federal civil rights lawsuit has been filed against it, and it has come in for criticism by the American Civil Liberties Union (ACLU).
Local civil rights organizations say that the majority of complaints of police bias that they receive come from the poorest areas of Hobbs, neighborhoods of concentrated poverty, where more than 20 percent of the residents live below the poverty line.
The National Association for the Advancement of Colored People (NAACP) is a national faith-based civil rights organization committed to ending hunger and poverty through advocacy. Recognizing the reality of racial discrimination in criminal justice, the local NAACP branch continues to work with local officials and people in the community to bring racial profiling to an end.
Such profiling can carry very serious consequences for individuals who are targeted. Larry Singleton, 61, is a veteran of the Navy who has lived in Hobbs for five years. Aggressive ticketing, fines for late payment or nonpayment of fines, and court costs ultimately led to Singelton’s car being impounded and his driver’s license revoked. It took him a month to regain his license—a month during which he was unable to go to work and was pushed into hunger. Joe Cotton, president of the local NAACP branch, explained that there are disproportionate police patrolling and ticketing in the southeast part of town, home to many low-
income Latinos and African Americans. “Over-policing has resulted in many of our residents falling deeper into hunger and poverty,”
Cotton said. “And when residents try to complain, the police department has given some residents the runaround … I receive complaints from residents almost weekly about harassment by the police officers who flood the [southeast] areas.”
The mayor of Hobbs has stated categorically that racial profiling is never acceptable, and there have been reports that the police department has recently improved. But part of the problem is that there is no public, transparent data to show what has changed or track the progress that is still needed. The Hobbs NAACP branch is calling for the police department to publish data on where police are patrolling so that residents can gauge whether law enforcement personnel and resources are being distributed fairly.
At the national level, the NAACP’s objectives include removing all barriers of racial discrimination through the democratic process and seeking the enactment and enforcement of federal, state, and local civil rights laws. Noting that racial profiling is a national problem that has not been improving,
The mayor of Hobbs has stated categorically that racial profiling is never acceptable.

Chapter 3
www.hungerreport.org • 2017 Hunger Report 127
the NAACP continues to advocate for improvements, examine records and trends of police activity, and include the issue as a legislative priority.
One bright sign at the state level, in April 2015, the New Mexico state legislature unanimously enacted legislation to end “civil asset forfeiture.” This practice is also known as “policing for profit” because it allows the police to seize personal property without ever charging a person with a crime. Thus, private citizens’ valuables reportedly often become the police department’s own property.
Emily Kaltenbach, the director of the Drug Policy Alliance’s New Mexico office, said, “Like other drug war programs, civil asset forfeiture is disproportionately used against poor people of color who cannot afford to hire lawyers to get their property back.” The victory shows that when policymakers track and scrutinize law enforcement activities, they can take action against some of the most unfair practices.
Marlysa D. Gamblin is domestic advisor for policy and programs, specific populations, at Bread for the World Institute.
Joe Cotton, president of the NAACP branch, is working with the mayor
and other officials in Hobbs, New Mexico, to
address racial tensions between the police and
black community.
Joseph Molieri / Bread for the World