chapter 2 – current transport situation, problems and...
TRANSCRIPT

The Project for Lahore Urban Transport Master Plan in the Islamic Republic of Pakistan
FINAL REPORT: VOLUME I of II
CHAPTER 2 – CURRENT TRANSPORT SITUATION, PROBLEMS AND ISSUES
2-121
2.6 People’s Perception of Travel Situation
The Study has conducted a large-scale HIS (Home Interview Survey) covering about
18,000 households. In the interview, a considerable number of questions were asked to
the respondent households in relation to their perception and opinion of traffic/ transport
situation in Lahore. Major findings from this interview are briefly described in the following:
2.6.1 General Traffic Situation and Congestion
Table 2.6.1 shows the perception of Lahore citizen of the present traffic situation. It is
amazing that nearly 90 % people opinion is that traffic situation is “very bad” or “bad”.
Figure 2.6.1 portrays the reasons why they think this situation has been brought about.
There are major reasons; “Increase of Car Traffic”, “Bad Driving Behaviour”, “Lack of
Enforcement” and “Lack of Public Transport”.
Table 2.6.1 People’s General Feeling on Present Traffic Situation
Opinion Number of Samples
Percentage (%)
Very Good 24 0.1 Good 239 1.4 Average 1,865 10.5 Bad 5,489 31.0 Very Bad 10,086 57.0
Source: JICA Study Team
Figure 2.6.1 Stated Causes of “Very Bad” or “Bad” Traffic Situation
22%
13%
23%
18%
19%
5% Increase of Car Traffic
Increase of Motorcycle Traffic
Bad Driving Behavior
Lack of Enforcement
Lack of Public Transport
Lack of Parking / Other Reasons
Source: JICA Study Team
Many people answered “Much Worse” or “Worse” of current traffic situation as compared
to 5 years ago as shown in Table 2.6.2. The percentage is highest regarding congestion
followed by safety. It is clear that most people are frustrated with the current traffic
situation. Figure 2.6.2 illustrates the distribution of respondent households who answered
“very bad regarding traffic congestion. Its percentage is high around the city center and its
surrounding areas.

The Project for Lahore Urban Transport Master Plan in the Islamic Republic of Pakistan
FINAL REPORT: VOLUME I of II
CHAPTER 2 – CURRENT TRANSPORT SITUATION, PROBLEMS AND ISSUES
2-122
Figure 2.6.2 Distribution of Respondent Households who Answered “Very Bad” regarding Traffic Congestion
Source: JICA Study Team

The Project for Lahore Urban Transport Master Plan in the Islamic Republic of Pakistan
FINAL REPORT: VOLUME I of II
CHAPTER 2 – CURRENT TRANSPORT SITUATION, PROBLEMS AND ISSUES
2-123
Table 2.6.2 Percentage of People who Answered “Much Worse” or “Worse” on Current Traffic Situation as Compared to 5 Years Ago
Subject Percentage answered “Much Worse” or “Worse” Congestion 80.4%
Safety 76.6% Convenience 68.6%
Source: JICA Study Team
2.6.2 Traffic Safety
In Lahore, traffic safety situation is serious. Nearly 20 % of households have experienced
traffic accidents in the past 5 years as shown in Table 2.6.3.
Table 2.6.3 “Have you got involved in traffic accidents in the past 5 years?”
Response Number of Samples Percentage Yes 3,416 19.3% No 14,266 80.7%
Total 17,682 100.0% Source: JICA Study Team
Traffic safety situation in Lahore is worsening rapidly. Figure 2.6.3 shows the distribution
of respondents who answered “Much Worse” of the current traffic situation as compared to
5 years ago. Its percentage tends to be higher in the city centre areas.

The Project for Lahore Urban Transport Master Plan in the Islamic Republic of Pakistan
FINAL REPORT: VOLUME I of II
CHAPTER 2 – CURRENT TRANSPORT SITUATION, PROBLEMS AND ISSUES
2-124
Figure 2.6.3 Distribution of Respondent Households who Answered Much Worse” Traffic Safety Situation as Compared to 5 Years Ago
Lahore citizen think that the reasons of this poor traffic safety are “Poor Road Condition”,
“Lack of Education”, “Increase of Traffic / Congestion”, “Poor Traffic Enforcement”, “Lack
of Facilities for Traffic Safety”, and so on as presented in Figure 2.6.4. It is noted that
“People’s Driving Manner” is not taken seriously as traffic safety. As to the behavior of
motorcyclist, people have generally negative impression such as “Very Bad” or “Bad”.
Source: JICA Study Team

The Project for Lahore Urban Transport Master Plan in the Islamic Republic of Pakistan
FINAL REPORT: VOLUME I of II
CHAPTER 2 – CURRENT TRANSPORT SITUATION, PROBLEMS AND ISSUES
2-125
Regarding traffic safety measures, majority thinks “Enhancement of People’s Awareness”
and “Improvement of Road” are most necessary measures, as illustrated in Figure 2.6.5
Figure 2.6.4 People’s Opinion on Reasons of Poor Traffic Safety
0%13%
4%
11%
38%
8%
11%
15%
People's Driving Manner
Increase of Traffic / Congestion
Lack of Traffic Signals
Poor Traffic Enforcement
Poor Road Condition
Lack of Traffic Signs
Lack of Facilities for Traffic Safety
Lack of Education
Source: JICA Study Team
Table 2.6.4 People’s Feeling on the Behavior of Motorcyclists
Response Number of Samples Percentage Very Good 24 0.1%
Good 358 2.0% Ok 3,294 18.6% Bad 5,853 33.1%
Very Bad 8,166 46.1% Total 17,695 100.0%
Source: JICA Study Team
Figure 2.6.5 People’s Opinion on Necessary Traffic Safety Measures
Source: JICA Study Team
26%
26%
10%
5%
3%
9%
7%
12%
2% 0%
Enhancement of People's Awareness
Improvement of Road
Traffic Safety Education / Campaign
Control of Motocycles Use
Control of Car Use
More Traffic Signals
More Safety Facilities for Pedestrians
Stricter Enforcement of Traffic Rules
Compulsory Use of Helmet in City Area
Others
The Project for Lahore Urban Transport Master Plan in the Islamic Republic of Pakistan
FINAL REPORT: VOLUME I of II
CHAPTER 2 – CURRENT TRANSPORT SITUATION, PROBLEMS AND ISSUES
2-126
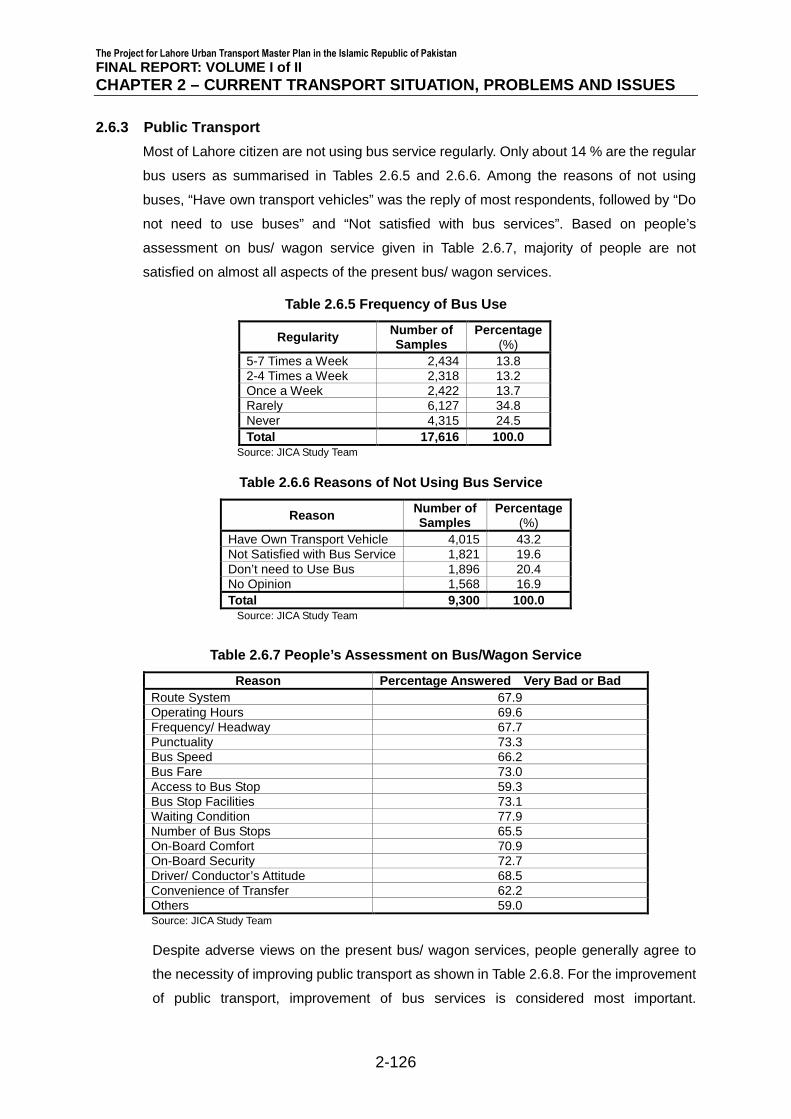
2.6.3 Public Transport
Most of Lahore citizen are not using bus service regularly. Only about 14 % are the regular
bus users as summarised in Tables 2.6.5 and 2.6.6. Among the reasons of not using
buses, “Have own transport vehicles” was the reply of most respondents, followed by “Do
not need to use buses” and “Not satisfied with bus services”. Based on people’s
assessment on bus/ wagon service given in Table 2.6.7, majority of people are not
satisfied on almost all aspects of the present bus/ wagon services.
Table 2.6.5 Frequency of Bus Use
Regularity Number of Samples
Percentage (%)
5-7 Times a Week 2,434 13.8 2-4 Times a Week 2,318 13.2 Once a Week 2,422 13.7 Rarely 6,127 34.8 Never 4,315 24.5 Total 17,616 100.0
Source: JICA Study Team
Table 2.6.6 Reasons of Not Using Bus Service
Reason Number of Samples
Percentage (%)
Have Own Transport Vehicle 4,015 43.2 Not Satisfied with Bus Service 1,821 19.6 Don’t need to Use Bus 1,896 20.4 No Opinion 1,568 16.9 Total 9,300 100.0
Source: JICA Study Team
Table 2.6.7 People’s Assessment on Bus/Wagon Service
Reason Percentage Answered Very Bad or Bad Route System 67.9 Operating Hours 69.6 Frequency/ Headway 67.7 Punctuality 73.3 Bus Speed 66.2 Bus Fare 73.0 Access to Bus Stop 59.3 Bus Stop Facilities 73.1 Waiting Condition 77.9 Number of Bus Stops 65.5 On-Board Comfort 70.9 On-Board Security 72.7 Driver/ Conductor’s Attitude 68.5 Convenience of Transfer 62.2 Others 59.0
Source: JICA Study Team
Despite adverse views on the present bus/ wagon services, people generally agree to
the necessity of improving public transport as shown in Table 2.6.8. For the improvement
of public transport, improvement of bus services is considered most important.

The Project for Lahore Urban Transport Master Plan in the Islamic Republic of Pakistan
FINAL REPORT: VOLUME I of II
CHAPTER 2 – CURRENT TRANSPORT SITUATION, PROBLEMS AND ISSUES
2-127
Development of air conditioned buses and rail based mass transit are also considered
as a necessity by the citizens of Lahore.
Table 2.6.8 People’s Opinion on the Necessity of Public Transport Improvement
Response Number of Samples Percentage Yes 15,925 90.5% No 970 5.5%
Don’t Know 356 2.0% No Opinion 349 2.0%
Total 17,600 100.0% Source: JICA Study Team
Table 2.6.9 “What types of public transport services must be improved? (Choose two)”
Mode Number of Samples Percentage Taxi/ Rickshaw 3,208 10.1 Bus Services 11,447 36.1 Aircon Buses 7,056 22.2 Underground Railway 5,084 16.0 Elevated Railway 2,344 7.4 Railway 2,596 8.2 Total 31,735 100.0
Source: JICA Study Team
2.6.4 Improvement of Transport System
Table 2.6.10, presents that possible measures for transport improvements as supported
by people. More than 90 % of people support “Construction/ Improvement of Roads”,
“Strict Traffic Control” and “Improvement of Walking Condition”. “Restricting Motorcycle”
seems to be the relatively unpopular response.
Table 2.6.10 People’s Attitude on Transport Improvement
Transport Improvements Percentage Answered “Strongly Support” or “Support”
Construction / Improvements of Roads
96.5
Strict Traffic Control 93.4 Restricting Motorcycle 49.0 Installation of Traffic Signals 82.6 Strict Parking Control 88.0 More Parking Facilities 89.2 Improvements of Walking Condition
91.5
Expansion of Bus Services 88.1 Introduction of Bus Lanes 87.5 Remove of Animal-driven Carts 64.8 Others 60.0
Source: JICA Study Team
Regarding public transport improvement measures, “Control of Air Pollution”, “Promotion
of People’s Understanding of Transport Problems and Measures”, “Construction of Bus
Exclusive Lane / Bus-way” and “Construction of Urban Railway” have a strong support
from the citizens of Lahore. “Removal of Animal-driven Carts” and “Removal of Qingqi”

The Project for Lahore Urban Transport Master Plan in the Islamic Republic of Pakistan
FINAL REPORT: VOLUME I of II
CHAPTER 2 – CURRENT TRANSPORT SITUATION, PROBLEMS AND ISSUES
2-128
also have a support to certain extent. Restrictive and economic measures on the use of
private vehicles (car and motorcycle) are unpopular, as summarized in Table 2.6.11.
Table 2.6.11 People’s Attitude on Public Transport Improvement Measures
Restrictive Measures Percentage Answered “Strongly Agree” or “Agree”
Restriction of Motorcycle Use on Service Roads 48.3 Restriction of Car Use in City Area 42.2 Increase of User Charges for Car 32.5 Increase of User Charges for Motorcycle 31.1 Construction of Bus Exclusive Lane / Bus Ways 83.8 Construction of Urban Railway (Elevated) 77.4 Construction of Urban Railway (Underground) 78.2 Construction of Urban Railway (At-Grade) 76.2 Control of Air Pollution 93.2 Promotion of People’s Understanding of Transport Problems and Measures
88.3
Removal of Rikshaw 51.5 Removal of Qinq Qi 61.6 Removal of Animal-driven Carts 63.8 Others 52.2 Source: JICA Study Team

The Project for Lahore Urban Transport Master Plan in the Islamic Republic of Pakistan
FINAL REPORT: VOLUME I of II
CHAPTER 2 – CURRENT TRANSPORT SITUATION, PROBLEMS AND ISSUES
2-129
2.7 Current Transport Problems and Issues
2.7.1 Road Network
Lahore is one of the most accessible cities of the Punjab Province. In addition to the
historic Grand Trunk Road (G.T. Road), a motorway (M-2) was completed in 1997 from
Lahore to Islamabad. The government has built underpasses to ease congestion and
prevent traffic jams, and according to official figures, Lahore transportation services have
improved to accommodate the growing number of visitors to the city. It is well connected
by air to other countries as well as all major cities of Pakistan. Buses, trains, taxis and
rickshaws are the other means of transport available in Lahore. The problems regarding
road infrastructure are summarized as follows:
1) Lack of Overpasses and Underpasses
Despite these improvements, Lahore struggles for safety on its roads, which are
dangerous because the number of vehicles overwhelms the road space. Massive
congestion occurs every day as millions of Lahorites travel through disorganized,
fast-moving traffic, and accidents are widespread. However the government is trying to
improve traffic conditions by constructing flyovers, underpasses, and conducting public
safety campaigns. As shown in Figure 2.7.1, the number of overpasses and underpasses
are still limited, only on few roads including Canal Bank Road.
Figure 2.7.1 Location of Overpasses and Underpasses in Lahore
Source: JICA Study Team

The Project for Lahore Urban Transport Master Plan in the Islamic Republic of Pakistan
FINAL REPORT: VOLUME I of II
CHAPTER 2 – CURRENT TRANSPORT SITUATION, PROBLEMS AND ISSUES
2-130
2) Encroachment
There is no segregation between markets and roads in Lahore. All roads are market
places in Lahore. LUTMP conducted RIS and recorded the extent of encroachment in
terms of percentage of road area illegally occupied within the right-of-way (RoW).
The Retail Encroachments are shown in Figure 2.7.2. The reasons will be:
� Many street vendors are working to earn their daily income.
� Parking spaces are limited or non-existent in most of commercial shops and business buildings.
Solutions to remove the encroachment will not be easy because it depends on a kind of
social policy. The possible solutions will be:
� The street vendors are required to develop their economy so as to discontinue the street vending (Overall economic development is needed.).
� The shops and buildings owners have to determine to invest for their required parking spaces.

The Project for Lahore Urban Transport Master Plan in the Islamic Republic of Pakistan
FINAL REPORT: VOLUME I of II
CHAPTER 2 – CURRENT TRANSPORT SITUATION, PROBLEMS AND ISSUES
2-131
Figure 2.7.2 Retail Encroachment – Road Inventory Surveys
Source: JICA Study Team
Other forms of encroachment result from the activities outside schools, industrial facilities,
hospitals and office spaces. Most of these are relatively minor, parking on main roads is
significant cause of encroachments, as shown in Figure 2.7.3.

The Project for Lahore Urban Transport Master Plan in the Islamic Republic of Pakistan
FINAL REPORT: VOLUME I of II
CHAPTER 2 – CURRENT TRANSPORT SITUATION, PROBLEMS AND ISSUES
2-132
Figure 2.7.3 Main Road Parking Encroachments
Source: LUTMP Road Inventory Surveys
There is rarely parking all along the entire length of a road section. It is quite common to
see parking along 25 % to 50 % of the road section, where commercial activity is
prevalent.
3) Lahore Ring Road (LRR) Construction
Over quarter of the LRR is complete and eastern section is now under construction. LRR
land acquisition process has been slow, however, it is anticipated that LRR Phase-I will be
operational by the end of 2012. Early completion of both phases of LRR is essential to
relieve the congestion in the inner city areas.
4) Lack of Ravi River Bridges
In the 1991 Master Plan prepared by Comprehensive Study on Transportation System in
Lahore, JICA, three additional bridges over Ravi River were proposed. The outstanding

The Project for Lahore Urban Transport Master Plan in the Islamic Republic of Pakistan
FINAL REPORT: VOLUME I of II
CHAPTER 2 – CURRENT TRANSPORT SITUATION, PROBLEMS AND ISSUES
2-133
one is from the south end of the Canal Bank Road to the north-west over the Ravi River.
For the development of the city to the west of the Ravi River, additional bridges over the
Ravi River would be required.
5) Development in the South-west of Lahore
Present new housing and industrial development schemes are mostly located in the
south-west quadrant of the city between Multan Road and Ferozepur Road. The
development of this area was initially proposed in the 1991 Master Plan prepared by JICA
Study and later confound by the 2001 Master Plan prepared by LDA. Development toward
east, north and even west were not considered due to fear of flooding from Ravi River
proximity to the international border with India.
For the balanced development of Lahore, all directional development should be sought
including road infrastructure development for smaller sub-centres, otherwise more people
will tend to travel to the city centre from a single (south-west Ferozepur Road) corridor
which is not sustainable.
6) Lack of Road Classification and Inventories
At present, road classification of each road is not clear, every authority has its own
definition and classification is not authorized by laws. For the long term development and
smooth implementation of each road, the classification should be well planned and the
road inventories should be prepared for a single classification for all the relevant agencies.
7) Vertical Clearance of Underpasses
In May 2010, several pupils sitting on the roof top of a bus were hit and killed at one of the
underpasses at Canal Bank Road. Existing vertical clearances of most of underpasses
varies and maximum is only 4 m, sub-standard even by American Association of State
Highway and Transportation Officials (AASHTO) standard (min. 4.3 m).
2.7.2 Public Transport Development
The public transport network in Lahore is currently under-developed, fragmented,
inadequately managed and highly inefficient.
1) Under-Development
It is estimated that there are 3.3 million passenger trips in the Study Area using public
transport (buses, wagons and other paratransit), whereas there are only 300 to 400 buses
(55 ft) are operated by 13 private companies. Evidently the public transport network is
under-developed and there is a great gap between the demand and provision of an
efficient and environment friendly public transport system. Despite a considerable
demand and several projects (Green, Orange, Blue and Purple Mass Rapid Transit lines),
there is currently no Rail-based Mass Transit (RMTS) line in Lahore.

The Project for Lahore Urban Transport Master Plan in the Islamic Republic of Pakistan
FINAL REPORT: VOLUME I of II
CHAPTER 2 – CURRENT TRANSPORT SITUATION, PROBLEMS AND ISSUES
2-134
2) Fragmentation
Historically, the provincial governments in Pakistan have owned and operated intercity
and urban public transport services. However, over the years, the government, according
to the guidelines of the World Bank, advocated to encourage the private sector in
operating public transport. The decline of state-owned public transport services created a
vacuum that was filled by private operators in accordance with these guidelines. Initially,
the market was opened to private operators in parallel with public-owned public transport.
However, the availability of public transport has not grown at the same rate as the
population. Therefore, a large number of small private operators were permitted to fulfil
this gap in a fragmented way. As a result, a chaotic mass of individually-owned small
vehicles (Wagon, Qingqi, Rickshaw etc.) operate in Lahore, competing for road space.
3) Inadequate Management
Public transport organizations have a long history of deficiency in professional,
administrative, and financial capacity to manage public transport service planning. In the
absence of human resources, coordination, research, and financial capacity of public
transport institutions in Punjab, public transport has now become fully the prerogative of
the private sector as described in the previous paragraph. The incomplete routes, high
fares, fewer-than-needed buses, gender discrimination, and even absence of buses in
some places are common in the urban areas. Whole public transport is grossly
mismanaged with least objective of service provision, limited and inadequate condition of
the public transport facilities (including buses, bus terminals and bus stops) and chaotic
use of road space (leap frogging by Wagons) due to absence of proper government
regulations and enforcement. Public transport operation should be improved by extending
franchised bus operations on all major corridors and restricting small vehicles operations
on feeder routes. It will require emphasis on high-capacity buses (50+ seats) rather than a
multitude of small vehicles.
Transport related functions (transport planning, engineering and maintenance, and
licensing, registration, regulation and operation of public transport routes) were not
concentrated into one single and efficient authority: TEPA has no longer any involvement,
and licenses are issued without assistance of any origin-destination data or transport
planning processes. LTC is established to regulate public transport operations, it is
anticipated to improve, albeit, the program has been limited over the last three years since
its operation.
Actually there are currently many public transport vehicles operating without valid license
and or even registration. About 25 % of mini-buses operate without any valid documents.
It has also been reported that many wagons are operating without any registration, and
The Project for Lahore Urban Transport Master Plan in the Islamic Republic of Pakistan
FINAL REPORT: VOLUME I of II
CHAPTER 2 – CURRENT TRANSPORT SITUATION, PROBLEMS AND ISSUES
2-135
that many do not follow the authorized route. Buses also suffer because of undue
competition with paratransit; there are wagons and coasters which provide licensed
services to neighbouring towns and, although they are not allowed to serve intra-urban
passengers, these compete illegally with bus routes by picking-up and dropping-off
passengers within Lahore district area.
In addition to unlicensed mini-bus and wagon services, there is increasing phenomenon of
Qingqis and Rickshaws. About 5,000 route permits have been issued to Qingqis, but it is
estimated that as many as 40,000 are currently operating in Lahore, many along primary
and secondary roads which are also served by licensed bus services. In parallel, the
presence of more than 80,000 rickshaws not only causes congestion but serious threat to
efficiency and service quality.
4) Performance
Due to rapid motorization increase in traffic volume over the last two decades, the road
network has many congested sections along arterial roads, which increases travel delays
and reduces bus travel speeds, implying a less competitive public transport network,
especially in the CBD where commercial and trading activities are concentrated.
Current public transport services are suffering greatly due to irregularity. On certain routes
waiting times for the passengers are too long, whereas on certain routes buses wait for
the passengers to be filled. Such a situation prevails because of the fact that routing and
licensing is not based on passenger demand analysis but based on convenience of
operators and the regulator. Efficiency is acceptable on certain routes but reliability is poor,
there being no scheduling at all. Quality of public transport services, as reported by users
is illustrated in Figure 2.7.4.

The Project for Lahore Urban Transport Master Plan in the Islamic Republic of Pakistan
FINAL REPORT: VOLUME I of II
CHAPTER 2 – CURRENT TRANSPORT SITUATION, PROBLEMS AND ISSUES
2-136
Figure 2.7.4 User Assessment of Public Transport Facilities Assessment Public Transport Facilities
0%
5%
10%
15%
20%
25%
30%
35%
40%
45%
50%
Very Good Good Fair Bad Very Bad
Transfer Facilities Comfort SafetyParking Area at Stations Air Quality Noise Levels
Source: JICA Study Team
2.7.3 Traffic Management
Mainly due to institutional issues, traffic management is highly inefficient and ineffective in
Lahore. Main aspects are: traffic laws, management of the public spaces, management of
the physical infrastructure, traffic control, also management of the drivers, provision of
pedestrian facilities and safety of all road users.
1) Traffic Laws
In general, traffic related regulations are insufficient, ineffective and obsolete; moreover,
enforcement of rules is quite weak. This generally implies a chaotic and an in-disciplined
traffic on roads, and therefore results in high rate of accident and even loss of life, injuries
and damages to the properties. This chaotic situation is exacerbated by the diversity of
the traffic in Lahore. The traffic laws are not though applied on pedestrians, cyclists,
animal-drawn carts and hand-pushed carts, even though these modes make up around
70% of the total road users. The typical traffic enforcement fines are quite low and are in
the range of around PKR 50 to 300. Also there are no appropriate punishments for
damaging the road infrastructure; and compensation for a death in a road accident is
around only PKR 10,000 with a third party insurance. Road safety is globally declining
resulting in increase in number of fatalities per year.
2) Management of Public Spaces
Management of the public spaces in Lahore is poor, resulting in disorderly traffic mixed
with various modes, many encroachments and illegal parking, and few facilities for
pedestrians and cyclists.
As illustrated by the following Figure 2.7.5, Lahore is characterized by a disorderly traffic
mix with pedestrians, animal-drawn carts, hand-pushed carts (fruit sellers, hawkers),

The Project for Lahore Urban Transport Master Plan in the Islamic Republic of Pakistan
FINAL REPORT: VOLUME I of II
CHAPTER 2 – CURRENT TRANSPORT SITUATION, PROBLEMS AND ISSUES
2-137
bicycles, motorbikes, rickshaws, Qingqis, cars, vans, mini-buses, inter-city coaches,
trucks etc. The animal driven vehicles and the other slow-moving non-motorized vehicles
need to be eliminated from using the main road and separated from general traffic. These
slow modes of traffic cause blocking back in traffic resulting in congestion, queues and
even severe traffic accidents. It is observed that such animal driven/ hand carts and slow
modes are frequently parked on footpaths, as a result the pedestrian walk in the main
carriageway, are major problem and reasons for pedestrian accidents.
Figure 2.7.5 Disorderly Traffic Mixed in Lahore
Source: JICA Study Team
Wide spread, encroachments of roadside, both permanent and temporary, reveal a lack of
parking policy in Lahore. Parking blocks sidewalks in many locations and inhibit both
pedestrian and vehicular flows. For instance, large Solid Waste Containers are placed on
main roads (as service roads are full with the parked vehicles). These obstruct traffic and,
while this procedure eases solid waste collection, it is clearly contrary to any modern
principles of traffic management. Due to encroachments, the slow modes and two
wheelers have to use higher speed lane which make travelling difficult and increase the
risk of accidents as well as traffic congestion. There is a strip commercial development
along most of the transportation corridors without proper offsets, set-backs, on and
off-street parking and access management as per the bye-laws; causing severe
encroachments and traffic congestion issues. Moreover, traffic police does not have the
adequate authority/ capacity or even interest to remove encroachments.
On the other hand, facilities for pedestrians and cyclists are either non-existent or
inadequate. These are the most vulnerable groups and are the victims of 50% road
accidents. Most sidewalks are in poor condition or encroached by parked vehicles or
commercial activities, garbage and hawkers forcing pedestrian to walk on the street and
therefore affecting traffic safety.
3) Management of the Physical Infrastructure
Management of the physical infrastructure particularly concerns road maintenance. The
poorly developed transport network in Lahore is under-maintained. One of the key
The Project for Lahore Urban Transport Master Plan in the Islamic Republic of Pakistan
FINAL REPORT: VOLUME I of II
CHAPTER 2 – CURRENT TRANSPORT SITUATION, PROBLEMS AND ISSUES
2-138
weaknesses in the system is indeed relatively low priority to the maintenance of existing
infrastructure. Roads are completely dilapidated condition resulting in frequent pavement
failures and require full rehabilitation. Road maintenance is generally ignored till
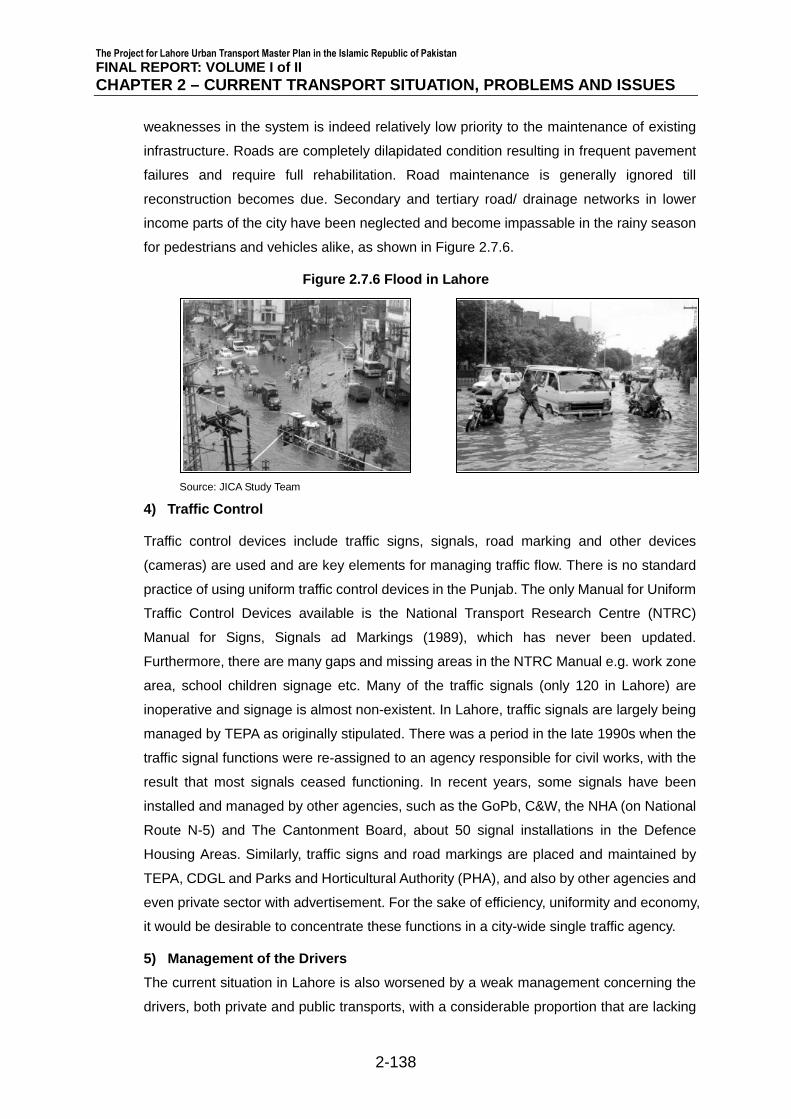
reconstruction becomes due. Secondary and tertiary road/ drainage networks in lower
income parts of the city have been neglected and become impassable in the rainy season
for pedestrians and vehicles alike, as shown in Figure 2.7.6.
Figure 2.7.6 Flood in Lahore
Source: JICA Study Team
4) Traffic Control
Traffic control devices include traffic signs, signals, road marking and other devices
(cameras) are used and are key elements for managing traffic flow. There is no standard
practice of using uniform traffic control devices in the Punjab. The only Manual for Uniform
Traffic Control Devices available is the National Transport Research Centre (NTRC)
Manual for Signs, Signals ad Markings (1989), which has never been updated.
Furthermore, there are many gaps and missing areas in the NTRC Manual e.g. work zone
area, school children signage etc. Many of the traffic signals (only 120 in Lahore) are
inoperative and signage is almost non-existent. In Lahore, traffic signals are largely being
managed by TEPA as originally stipulated. There was a period in the late 1990s when the
traffic signal functions were re-assigned to an agency responsible for civil works, with the
result that most signals ceased functioning. In recent years, some signals have been
installed and managed by other agencies, such as the GoPb, C&W, the NHA (on National
Route N-5) and The Cantonment Board, about 50 signal installations in the Defence
Housing Areas. Similarly, traffic signs and road markings are placed and maintained by
TEPA, CDGL and Parks and Horticultural Authority (PHA), and also by other agencies and
even private sector with advertisement. For the sake of efficiency, uniformity and economy,
it would be desirable to concentrate these functions in a city-wide single traffic agency.
5) Management of the Drivers
The current situation in Lahore is also worsened by a weak management concerning the
drivers, both private and public transports, with a considerable proportion that are lacking

The Project for Lahore Urban Transport Master Plan in the Islamic Republic of Pakistan
FINAL REPORT: VOLUME I of II
CHAPTER 2 – CURRENT TRANSPORT SITUATION, PROBLEMS AND ISSUES
2-139
proper training and licensing. Commuters and transporter have generally no traffic sense
resulting in a chaotic situation. A lack of operators discipline in this complex environment
reduces traffic capacity further and increases safety concerns. Traffic police also suffers
from inadequate strength and needs further training. There is finally a significant safety
issue concerning the motorbikes use, sometimes transporting two or more passengers,
often without helmet for both driver and passengers. The general situation causes a fatal
failure to follow traffic rules, which in turns leads to a worsening of congestion level and
contribute to road accidents.
2.7.4 Institutional Set-up
In LUTMP Phase-I, institutional issues of transport sector administration in Lahore were
reviewed through perusal of past studies and interviews of relevant organizations. As a
result, following was understood as the key current institutional problems. However, there
are still quotations pointed out in some reports or hearsays mentioned in some interviews.
1) Many Responsible Agencies and Duplication of Roles
There are at least 17 departments or agencies of the national, provincial and city district
Governments that play important role in the management of roads, public space and
transport services. In addition to these, there are nine TMAs. Among these, some roles
are assigned to plural organizations and as a result, such roles are prone to be neglected.
The matter is now further worsened by creation of government owned public companies
for public transport and waste management without clear delineation of power.
2) Insufficiently Trained Traffic Police
Traffic police is mainly responsible for traffic control and management, while capacity
building of traffic police has been neglected. In the past 20 years, information technology
in traffic management has been significantly advanced and training of traffic police has
failed to catch up with these advances.
Along with increase of traffic volume, roles of traffic police has been widened and
complicated, while training of traffic police is not adequate, this has resulted in low
efficiency in traffic control and road space management. As a result, people have not
respect of traffic police and their role in traffic management.
3) Shortage of Planning Expertise
The TD of the GoPb does not have any agency specialized in transport planning and as
result, has no trained staff or planning expertise. By this, every action and projects tend to
have a nature of a patchwork, which will impair investment efficiency. With this
background, the Transport Department has decided to establish the Transport Planning
Unit (TPU).

The Project for Lahore Urban Transport Master Plan in the Islamic Republic of Pakistan
FINAL REPORT: VOLUME I of II
CHAPTER 2 – CURRENT TRANSPORT SITUATION, PROBLEMS AND ISSUES
2-140
4) Outdated Transport-related Rules and Regulations
The transport sector in Pakistan is regulated through the federal and provincial
enactments which are (a) The Provincial Motor Vehicle Ordinance (MVO), 1965 (b) The
provincial Motor Vehicle Rules, 1969 (c) The Motor Vehicle Act, 1939 (d) The Fatal
Accidents Act, 1855 and (e) The National Highway Safety Acts.
Most of these well out dated and losing their proper workability to the 21st Century
transportation phenomena. These require review and amendment. For example, the MVO
1965 provides the mechanism, licensing and regulation of motor vehicles in particular and
for control of traffic but it does not cover all the aspects of the Road Traffic Control,
Regulation and the Public Space Management. It has provisions for the construction,
equipment and maintenance of motor vehicles but has not been updated for a very long
time.
The section 67 of the MVO, 1965 provides another aspect relating to accidents of motor
vehicles and causalities which specify the responsibility for compensation. However, the
principles relating to award of compensation in motor accident cases and the provisions
relating to insurance in the MVO, 1965 are extremely vague, uncertain and complicated.
5) Incomplete Implementation of Rules and Regulations
The MVO, 1965 is a consolidated and comprehensive law with various amendments over
the years. Despite the exhaustive nature of the ordinance and the matters contained
therein, the issue of effective enforcement is lacking, resulting in deterioration of traffic
conditions and motor vehicle affairs in general.
The criteria for granting various licenses like driving licenses, stage carriage licenses and
private/ public carrier licenses are contained in the ordinance but not followed by proper
enforcement. The discretion available to the traffic police officers and cumbersome penal
ticketing system in case of traffic rules violations have contributed towards corrupt
practices and deterioration of traffic system.
As for another example, the National Highway Safety Ordinance (NHSO), 2000 has
provision for “No Fault Accident Compensation” by a registered insurance company, but
the rules have not yet been framed to implement this provision. An urgent need is pointed
out in Pakistan to introduce new concepts within the MVO, 1965, commensurate for the
compensation for no fault liability.
Section 76 of the MVO, 1965 authorizes the Government to prescribe conditions for the
issue of permits to heavy transport vehicles. In reality, however, an offender driving an
over-loaded heavy vehicle is only asked to reduce the weight at the close-by storage point,
which is rarely exercised, resulting in the common and widespread road surface rutting.

Volume-I – Chapter-3
URBAN DEVELOPMENT CONTEXT
FFIINNAALL RREEPPOORRTT

The Project for Lahore Urban Transport Master Plan in the Islamic Republic of Pakistan (Phase II)
FINAL REPORT: VOLUME – I of II CHAPTER 3 – URBAN DEVELOPMENT CONTEXT
3-1
3. URBAN DEVELOPMENT CONTEXT
3.1 Alternative Urban Development Scenarios
3.1.1 Assessment of Past Urban Development in Lahore
1) Urban Area Formation in the Past
The origin of Lahore’s urban development is the Walled City. During British colonial era,
urban facilities including residence, parks and universities were constructed in the south
of the Walled City surrounding administrative centres. At present, a number of
administrative facilities such as provincial parliament, governor’s official residence and
government officer’s residences are concentrated in this area together with the Jinnah
Park, the University of Punjab, other colleges and many business/ commercial buildings.
This area boasts of its beautiful urbanization with low-coverage buildings, characterized
by wide streets and parks/ gardens covered by tall trees.
The Canal also has a salient influence on the formation of Lahore’s urban area. The
Canal Bank road runs in the east to south-west direction, and contributes largely to the
special urban scenery of Lahore having the canal in the center of the road. The canal has
its source in Larger BRB Canal upstream and supplies irrigation water to Lahore and
agricultural areas in Lahore and the south-west green belt.
In the north-east of this built-up area, the Lahore station is located. The railway is
basically for intercity long distance travel connecting Lahore with Rawalpindi and
Peshawar in the north and Karachi in the south. The agglomeration of iron/ steel
industries located in the north-east of the railway (about 150 ha) is considered to have
been once developed due to the proximity to the railway. Although it has little relation with
the railway transportation at present yet its production and sales functions still remain in
the same area. The road traffic generated from these industries, coupled with intra-city
bus terminal traffic on the opposite side of the railway, creates serious traffic congestion
between the Walled City and the Lahore Station.
Lahore’s population was about 2.5 million in 1960, which is less than third of the present.
As population increased with economic growth, urbanization went southward and
eastward. Eastward urbanization was led by the military as Cantonment, and southward
expansion was based on road and road transport. There is no evidence that railway
played any role in leading urbanization.
In the later decade of the Last Century (1980-1990), urban development pattern was
gradual outward expansion of the existing built-up areas. Motorcycles and auto-rickshaws,
which became popular, then, may have assisted this development. In the meantime, a
huge academic town of universities and colleges of about 10km2 was developed at the

The Project for Lahore Urban Transport Master Plan in the Islamic Republic of Pakistan (Phase II)
FINAL REPORT: VOLUME – I of II CHAPTER 3 – URBAN DEVELOPMENT CONTEXT
3-2
south-western end of the urban area. This academic town, however, is in the midst of
residential area at present.
Urban development pattern changed in 1990’s due to rapid motorization, commercial,
industrial and residential development occurred along arterial roads showing ribbon
development pattern along radial roads. In one word, the pattern changed from
concentric-contiguous pattern to starfish pattern. This pattern, however, is changing
again. The concentric-contiguous pattern is appearing again due to the following reasons:
New road development has become difficult (except for northern half of the LRR).
Insufficient capacity of radial arterial roads has become a restriction for large-
scale urban development between radial corridors.
Development permission system has started functioning (LDA was established in
1975 and legal system has been provided).
The concentric-contiguous pattern is seen mainly in the south and in the east. In
Cantonment, well-organized residential area (DHA) was developed by the military, and
the eastern section of the LRR further enforced this development. In the south,
development permissions were given to vast areas such as Engineering Town and
Chung. However, these areas are not necessarily built-up yet, and agricultural land and
other open space still remain in the midst of residential areas.
In the north of the Ravi River, ribbon-type development is still seen particularly along the
G.T. Road and Sheikhupura Road. Industrial, commercial and residential development of
this area is mainly due to the improvement of access condition by the Motorway.
The population of the Study Area is 9,928 thousand (8,652 thousand for Lahore District
and 7,571 thousand for built-up area of Lahore) as of 2010. Population density exceeds
1,700 /ha in some zones of the Walled City. However, it is sometimes below 50/ha in the
residential areas that are not fully built-up. In the remaining vacant parts of these
inefficient areas, high-rise buildings of up to 15 stories are often built. But the location is
not well-planned in general. In addition, LDA promotes many housing schemes, mostly in
the suburbs in the east and south.
LDA Regular Schemes: 52
Private Housing Schemes approved by LDA: 215
With regards to industrial estates, there are two salient industrial estates: one in the south
nears the border with Kasur District (Sundar Industrial Estate) and the other in the north
along Lahore-Sheikhupura Road. The former depends on a narrow 2-lane local road and
the later on a 6-lane National Highway. There is also industrial ribbon belt along G.T.

The Project for Lahore Urban Transport Master Plan in the Islamic Republic of Pakistan (Phase II)
FINAL REPORT: VOLUME – I of II CHAPTER 3 – URBAN DEVELOPMENT CONTEXT
3-3
Road (National Highway N-5) between Lahore and Muridke in the Study Area.
2) Assessment and Identified Problems
(i) Densely Built-up Area in the North
In the north of Lahore, there are extremely high-density built-up areas such as the Walled
City. The most salient advantage of this area is that a wide variety of functions exist in
proximity and the area does not generate many long-distance trips as compared to the
dense accumulation of population and urban functions. The close community incubates
local/ family industries and vitalizes people’s life. The disadvantage of the area is
obsolete residences with extreme high population density and poor sanitary condition
due to dust, sewerage and uncollected garbage. The advantage and disadvantage are in
a trade-off relation.
A large problem exists with the agglomeration of iron/ steel industries, which produces
traffic congestion as mentioned earlier. Its production efficiency is deteriorated due to its
dependency on road transport, and with limited access to main roads.
Congestion on the secondary and local roads of this area is serious due to mixed traffic
of car, bus, truck, auto-rickshaw, Qingqi, and animal-drawn carts and had drawn carts
mostly for movement of goods.
(ii) Government Building Area and Its Environs
This area consists of government buildings, offices, hotels, high-grade residences and so
on, and its environment such as greeneries, parks, gardens, historic buildings and wide-
carriageway roads needs to be inherited. This area is the actual CBD of Lahore. The
coverage of most buildings is low and high-rise buildings are few (mostly 3-5 stories, 10
stories at most). The space in this area for future possible development and
enhancement is sufficient because limited elevation of buildings in harmony with the
existing environment may suffice for immediate future needs.
The only problem of this area is that it is located in far north of Lahore, and it creates
large travel needs to/ from the southern and eastern residential areas. If urbanization
proceeds further to the south without strong public transport, there is a strong possibility
that the CBD functions would get paralyzed in the not too distant future.
(iii) Existing Built-up Residential Areas
This area consists mainly of residential areas constructed before 1990. With moderate
population density and reasonable road network, people’s life is comfortable and
convenient in general. This situation, however, is changing.
First, 3-7 story buildings are constructed along arterial roads. However, the location

The Project for Lahore Urban Transport Master Plan in the Islamic Republic of Pakistan (Phase II)
FINAL REPORT: VOLUME – I of II CHAPTER 3 – URBAN DEVELOPMENT CONTEXT
3-4
seems to be selected randomly without any city plan. Usually, this type of building is
admitted in limited areas to form urban functions in an orderly manner. Another problem
is related to the fact that the construction period seems very long. Due to this inefficient
investment (e.g. interest during construction), building construction does not contribute
much to the urban economy as seen in other cities of the world.
Second, there are many unused land spaces that seem to be increasing recently. Large-
scale disorderly development in the suburbs, results in deterioration of existing urban
area, and this again increases unused land spaces. This vicious cycle should be checked
early on. Such development cycle was also observed in the early redevelopment years of
Japan after the World War II.
Third, conversion from residence to commercial building is often seen in high-grade
residential areas. This increases convenience of the area, while this tends to aggravate
the living environment. It may be necessary to restrict this conversion. In addition, GoPb
has development rules established in 2009 which can deal with this situation.
In summary, this area is changing rapidly. Major effort should be made to create good
urban environment in this area.
(iv) University Area
As mentioned earlier, an academic town is located in the midst of residential area in the
south-west of Lahore. Its population density ranges 50-100 /ha (partially over 200 /ha)
showing that many staff and students stay in residences and dormitories on campus.
Travel demand to/ from outside is relatively small.
For instance, Zone 57 (Sikandar Block) is mostly university campus. This zone has
incoming 5,757 trips on commuting purpose, of which 2,723 trips or 47 % are intra-zonal.
Nearly half of the university staff lives on the campus. Number of “to-school” trips is
11,252, of which 4,405 or 39 % are intra-zonal. About 40 % of the students live on
campus.
The problem of this area is that the area hinders the north-south traffic flow due to the
lack of through road from this 4-5 km wide area. In addition to the above, there are other
universities, colleges, etc in the CBD or in the suburbs. Those in the suburbs have been
developed recently, such as the Institute of Technology located 10 km north of the Ravi
River and two universities located in the west of Nishtar Town and recently opened
Lahore School of Economics and University of South Asia on Burki Road in the east of
Lahore.
(v) Expansion of Urban Area toward the East and South
The expansion of urban areas toward east and south has created a number of problems
The Project for Lahore Urban Transport Master Plan in the Islamic Republic of Pakistan (Phase II)
FINAL REPORT: VOLUME – I of II CHAPTER 3 – URBAN DEVELOPMENT CONTEXT
3-5
due to vast and low-density development:
Poor community formation with weak internal relationship;
Inconvenient access to urban facilities;
Dependency on cars for commuting with large load on arterial roads.
The largest problem is lack of coordination between urban development projects and
arterial road development that support daily traffic needs of the residents. LDA
acknowledges this problem focusing on “increasing distances from city center, deficiency
in social and physical infrastructure, environmental degradation”.
It is essential for sound urban development to pursue maturation of urban area by filling
scattered unused open space and development of trunk transport system. As for unused
open space, it is recommended to classify it into the area to be urbanized or the area to
be conserved as green spaces.
(vi) Ribbon Development in the North
With regard to the ribbon development along arterial roads seen in the north, some
problems are identified:
Difficulty of land use at the back of ribbon development;
Low efficiency of the thinly developed area;
Degraded function of the arterial road.
Due to the reasons above, UK prohibited ribbon-type development by law in 19351.
Owing to this restriction, many British cities including London are generally compact and
efficient. In Japan, however, because ribbon-type development was admitted, suburban
land use became inefficient and functions of arterial roads were degraded. Disorderly
development in the suburbs damages city efficiency as a whole.
In the north, planned development should be pursued taking advantage of the following
favourable condition:
Proximity to the center of Lahore;
High mobility due to the Motorway and wide-carriageway arterial roads;
Vast open space usable for various projects of urban development.
Without planned development, ribbon-type development will further proceed and
‘concentric-contiguous’ development will become unfeasible.
1 Restriction of Ribbon Development Act

The Project for Lahore Urban Transport Master Plan in the Islamic Republic of Pakistan (Phase II)
FINAL REPORT: VOLUME – I of II CHAPTER 3 – URBAN DEVELOPMENT CONTEXT
3-6
(vii) Industrial Zones
Industrial development in Lahore has continued depending on existing arterial roads. This
was favourable to strengthen the basis of Lahore’s economy.
In the south, most industries are located in the shape of ribbon developments except for
some estates, and its production environment is not generally good in terms of
transportation of materials/ industrial products and workers. Immediate countermeasures
are required to prevent exodus of factories.
The developing industrial area in the north of Ravi River also has the problem of ribbon-
type development although the function of intercity arterial roads is much stronger than in
the south. Development of industrial estates is required. According to Sheikhupura Tehsil,
723 factories were established by 2000 in that Tehsil, and the reason of location was the
existence of intercity roads for 307 factories or 42.5 % of the total. In addition, the
factories are rice mills, iron steel re-rolling mills, tanneries, flour mills and so on. Most of
the factories are small except for sugar mills, polyester processing and fertilizer
production. Although no data is available after 2000, recent industrial developments can
be observed in this area.
(viii) Overall Urban Structure
As stated earlier, the CBD of Lahore is located in the north due to historical reasons and
urbanization spreads toward the south and the east. Due to poorly developed public
transport depending on a small number of buses, long-distance travel becomes more and
more uncomfortable, inconvenient and extremely difficult affecting economic performance
of Lahore.
The residential area spreading to the south and the east seems to have been developed
in a planned manner. However, developed areas are actually distributed widely like
islands in the sea with numerous vacant land plots. The overall population density of
these residential areas is very low. This incurs the issues of low efficiency of urban
infrastructure and the difficulty of public transport development.
Outside Lahore District, there are some urban clusters in Sheikhupura and Kasur District
such as Muridke, Raiwind area and Pattoki Tehsil areas. However, the interrelation of
these urban clusters with urban activities of Lahore is very weak, presumably due to
historical reason and the lack of high-mobility transport system.
The present urban structure is schematically illustrated in Figure 3.1.1.

The Project for Lahore Urban Transport Master Plan in the Islamic Republic of Pakistan (Phase II)
FINAL REPORT: VOLUME – I of II CHAPTER 3 – URBAN DEVELOPMENT CONTEXT
3-7
Figure 3.1.1 Present Urban Structure
Source: JICA Study Team
High-density urban area
CBD
Mixed-use urban area
Residential area
Industrial area
University area

The Project for Lahore Urban Transport Master Plan in the Islamic Republic of Pakistan (Phase II)
FINAL REPORT: VOLUME – I of II CHAPTER 3 – URBAN DEVELOPMENT CONTEXT
3-8
3.1.2 Alternative Urban Development Scenarios
In order to solve the urban problems mentioned above and to promote future
development, medium- to long-term urban development scenarios should be formulated.
Three scenarios have been developed;
Scenario1: assumes past natural tendency will continue without any political intervention
from the Government except for some ongoing projects such as LRR.
Scenario 2: assumes compact development with improvement of living environment and
mobility by development/ enhancement of public transport.
Scenario 3: assumes dispersed multi-core development by fostering suburban cities and
urban areas by restricting urban expansion of Lahore.
In order to determine the land use pattern for each scenario above, the result of land
development suitability analysis was taken into account. The analysis are based on three
factors; proximity to major roads, accessibility to city center and net population density.
Natural conditions were not considered due to the similarity over the entire Study Area.
This is presented in Figure 3.1.2, with its criteria shown in Table 3.1.1.
Table 3.1.1 Criteria for Land Development Suitability Analysis
Factor Weight (%)
Grade 5
(Good) 4 3 2 1 (Bad)
Proximity to major roads 25
<500m from trunk roads
<500m from primary roads
500-1000m from trunk roads
500-1000m from primary roads or <500m from secondary roads
500-1000m from secondary roads
Access time to city center 25 - 15 mins. 15-30
mins. 30-45 mins 45-60 mins 60 mins. or more
Net population density
50 < 50/ ha 50-100/ ha
100-150/ ha 150-250/ ha 250/ha or
more
Source: JICA Study Team
1) Scenario 1 (Zero Option – Trend)
This scenario assumes that the past tendency of urbanization will continue in the future.
Although there is a risk that this Scenario will further amplify the current urban problems
such as: inefficiency of urban infrastructure and worsening of traffic congestion, public
investment by the Government would be limited.
(i) Densely Built-up Area in the North
Population of this area will not increase much. Actually the population of the Walled City
has been stagnant already according to the “Sustainable Development of Walled City
Lahore Project”. As people’s income increases, residents of this area will move out
gradually looking for better living environment.

The Project for Lahore Urban Transport Master Plan in the Islamic Republic of Pakistan (Phase II)
FINAL REPORT: VOLUME – I of II CHAPTER 3 – URBAN DEVELOPMENT CONTEXT
3-9
(ii) Government Building Area and Its Environs
The needs for public facility and office spaces will increase according to the population
growth. Thus the floor area of this zone will increase accordingly. Although existing
greenery and open space will decrease slightly, its environmental impact will be minimal
considering strict land use restriction and its abundance.
(iii) Existing Built-up Residential Area
Although strong political intervention is not considered, vacant land space will be
gradually filled by buildings as a natural tendency. Moderate land use control based on
existing laws is assumed in this scenario.
(iv) University Area
No change is assumed in this scenario.
(v) Expansion of Urban Area toward the East and South
Population of LDA project areas and development permitted areas will reach its target by
2030 as planned. The rest of increased population is assumed to be distributed in newly
developed areas to the east of LRR, in the south of Defense Road, around Ravi Town
and so on. Moderate land use control based on existing laws is assumed in this scenario
as well.
(vi) Ribbon Development in the North
Ribbon development will further expand along arterial roads.
(vii) Industrial Zones
Considering the existing road network, industrial development will not precede much in
the south. In the north, however, it will expand taking advantage of the favourable road
condition.
(viii) Overall Urban Structure
In this scenario, urban structure will be the same as at present as a whole. Urban area
will expand mainly to the east and south. It is a car-oriented society. The resultant
scenario (Zero Option – Trend) is depicted in Figure 3.1.3.

The Project for Lahore Urban Transport Master Plan in the Islamic Republic of Pakistan (Phase II)
FINAL REPORT: VOLUME – I of II CHAPTER 3 – URBAN DEVELOPMENT CONTEXT
3-10
Source: JICA Study Team
Figure 3.1.2 Result of Land Development Suitability Analysis

The Project for Lahore Urban Transport Master Plan in the Islamic Republic of Pakistan (Phase II)
FINAL REPORT: VOLUME – I of II CHAPTER 3 – URBAN DEVELOPMENT CONTEXT
3-11
Figure 3.1.3 Urban Development Scenario 1 (Zero Option – Trend)
Source: JICA Study Team
High-density urban area
CBD
Mixed-use urban area
Residential area
Industrial area
University area

The Project for Lahore Urban Transport Master Plan in the Islamic Republic of Pakistan (Phase II)
FINAL REPORT: VOLUME – I of II CHAPTER 3 – URBAN DEVELOPMENT CONTEXT
3-12
2) Scenario 2 (Compact Development)
This scenario intends a compact urbanization led by public transport development. This
scenario is friendly to people’s travel, living environment and natural environment. Many
of the current urban problems will be alleviated although sizeable public investment and
administrative capacity of the government are required.
(i) Densely Built-up Area in the North
This scenario assumes a salient urban development project. The existing agglomeration
of iron/ steel industries will be relocated to suburbs and integrated development of this
area including the retaining of the bus terminal and railway station will be carried out
using this space. This intends to alleviate the problems of high density and traffic
congestion in the area. The development is of multi-purpose mainly of residential but
including business/ commercial functions. The environment of the Walled City may be
improved in relation to this project. Using the impact of this key project, similar projects
can be carried out one after another.
(j) Government Building Area and Its Environs
This scenario assumes integrated urban development in some obsolete areas to
enhance the CBD functions. Conservation of the present scenery and environment
should be pursued, too.
(k) Existing Built-up Residential Area
The three problems of this area will be tackled by designating specific areas or streets for
high-rise buildings and by stringent application of LDA’s land use rules to deal with
unused land space remaining in the area and land use conversion. In some cases,
relaxation of the rules may be necessary.
(ii) University Area
As for existing universities located in urbanized area, no action is assumed in this
scenario. The new academic town planned in Ferozewala Tehsil, where the University of
Engineering and Technology of Lahore has already located some of its faculties, should
be expanded by inviting high-grade education facilities, research organizations and
related business establishments. It is important to relate this academic town with the
adjacent industrial estate mentioned later so that this academic town becomes one of the
leading areas for high technology in the Punjab and Pakistan.
(iii) Expansion of Urban Area toward East and South
Population of LDA project areas and development permitted areas will reach its target by
2030 as planned. The rest of increased population is assumed to be distributed in areas

The Project for Lahore Urban Transport Master Plan in the Islamic Republic of Pakistan (Phase II)
FINAL REPORT: VOLUME – I of II CHAPTER 3 – URBAN DEVELOPMENT CONTEXT
3-13
to be developed near the railway stations and other public transport nodes to be
proposed in this master plan.
(iv) Ribbon Development in the North
This scenario assumes concentric-contiguous development of this area consisting of
industrial estates and an academic town mentioned above. Ribbon-type development
should be suppressed to enhance land use efficiency of this area. The industrial estates
are considered to become the relocation site of iron/ steel industries located in the north
of Lahore station at present. Residential development is also done in this area to absorb
the increasing of population.
(v) Industrial Zones
Development of industrial estates is assumed in this scenario in the north in connection
with the proposed academic town. In the south, improvement of access and arterial
roads should be carried out to strengthen the functions of the existing industries. The
road improvement includes some circumferential roads and Thokar Niaz Beg Canal
Road.
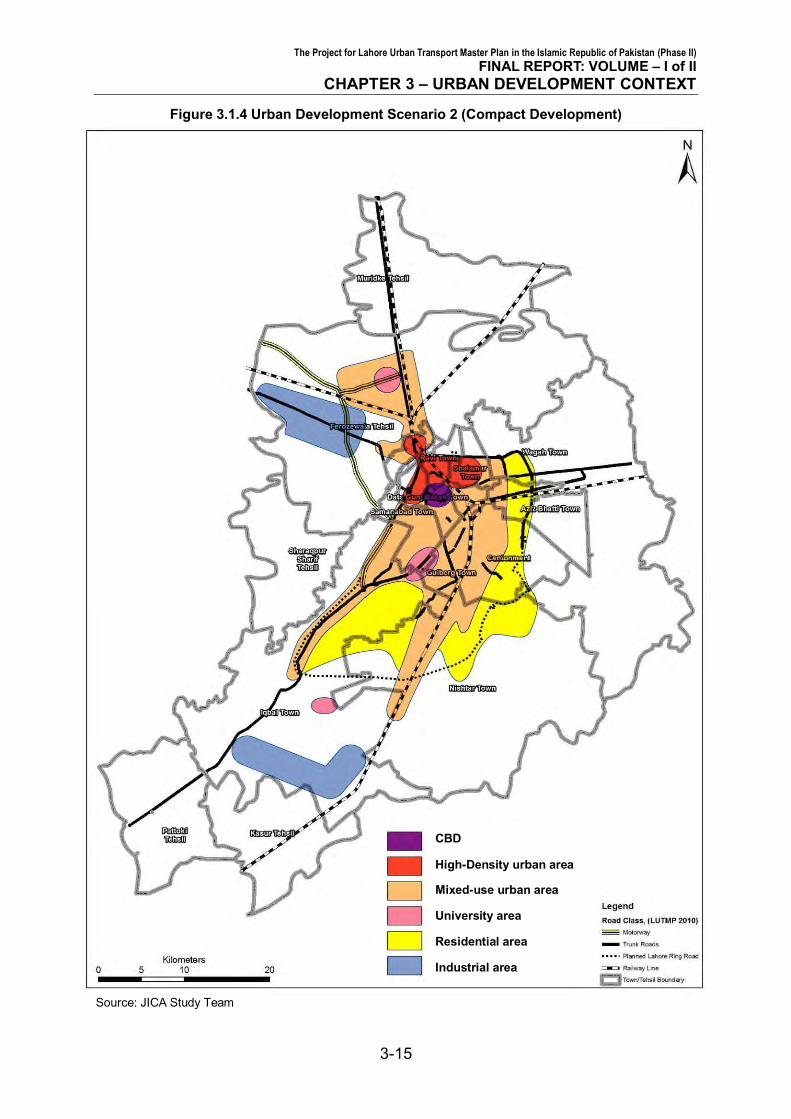
(vi) Overall Urban Structure
As this scenario assumes urban Rail-based Mass Transit System (RMTS) to be the trunk
public transport system of Lahore, dense urbanization will occur along these RMTS
routes. Urban RMTS facilitates people’s movement in the city as well as conservation of
suburban greenery and agriculture. RMTS usually reduces traffic congestion on roads.
The combination of industrial estates and academic town proposed in Ferozewala Tehsil
has a possibility to lead high-tech industrial development of not only Punjab but entire
Pakistan. As a whole, this scenario aims to vitalize various urban functions by combining
them closely with each other using improved mobility and enhanced land use efficiency.
The envisioned urban structure is shown in Figure 3.1.4.
3) Scenario 3 (Dispersed Multi-Core Development)
The core idea of this scenario is to increase absorptive capacity of Lahore for rapidly
growing population by developing suburban cities. Thus this scenario assumes less
population increase in the built-up areas of Lahore. Suburban development is proposed
in this scenario at Muridke, Raiwind area, and Pattoki Tehsil areas. Each of these areas
will be a sub-center of the metropolis of Lahore with its own CBD and surrounding
residential areas.

The Project for Lahore Urban Transport Master Plan in the Islamic Republic of Pakistan (Phase II)
FINAL REPORT: VOLUME – I of II CHAPTER 3 – URBAN DEVELOPMENT CONTEXT
3-14
(i) Densely Built-up Area in the North
Same as Scenario 2.
(ii) Government Building Area and Its Environs
Same as Scenario 2.
(iii) Existing Built-up Residential Area
Same as Scenario 2.
(iv) University Area
Same as Scenario 2.
(v) Expansion of Urban Area toward East and South
Population of LDA project areas and development permitted areas will reach its target by
2030 as planned. However, this scenario assumes no more development permitted in
Lahore except for the proposed academic town located in Ferozewala Tehsil. All the rest
of increased population is assumed to be accommodated in Muridke, Raiwind area and
Pattoki Tehsil areas. These three areas have their own accumulation of business/
commercial facilities. Enhancement of CBD functions will be pursued coupled with
residential development in the surrounding areas.
(vi) Ribbon Development in the North
Same as Scenario 2.
(vii) Industrial Zones
Same as Scenario 2.
(viii) Overall Urban Structure
The existing built-up areas in Lahore will mature with fewer vacant spaces/ plots,
industrial estates are located in the south and north, and there will be an academic town
in the north. To be more important, three cities will appear in the suburbs of Lahore with
urban functions and 300-500 thousand population. In the long run, high-speed, high
capacity transport system connecting Lahore and these sub-centers will be required.
In Tokyo, Japan, there is a conceptual plan called “Core Cities Linkage Plan”. The
intention of this plan is to transplant part of CBD functions of Tokyo to medium to large
cities located at 30-50 km distance from Tokyo. The objective of this plan is to alleviate
the negative impacts of high density and to prevent disorderly urbanization. At present
these core cities perform the central functions significantly. This concept is illustrated in
Figure 3.1.5.
The Project for Lahore Urban Transport Master Plan in the Islamic Republic of Pakistan (Phase II)
FINAL REPORT: VOLUME – I of II CHAPTER 3 – URBAN DEVELOPMENT CONTEXT
3-15
Figure 3.1.4 Urban Development Scenario 2 (Compact Development)
Source: JICA Study Team
High-Density urban area
CBD
Mixed-use urban area
Residential area
Industrial area
University area

The Project for Lahore Urban Transport Master Plan in the Islamic Republic of Pakistan (Phase II)
FINAL REPORT: VOLUME – I of II CHAPTER 3 – URBAN DEVELOPMENT CONTEXT
3-16
Figure 3.1.5 Urban Development Scenario 3 (Dispersed Multi-Core Development)
Source: JICA Study Team

The Project for Lahore Urban Transport Master Plan in the Islamic Republic of Pakistan (Phase II)
FINAL REPORT: VOLUME – I of II CHAPTER 3 – URBAN DEVELOPMENT CONTEXT
3-17
3.1.3 Assessment of Alternative Scenarios 1) Assessment by Scenario
The three scenarios described above are compared and an assessment is presented in
Table 3.1.2.
Table 3.1.2 Assessment of Alternative Scenarios
Component Scenario 1
(Trend) Scenario 2
(Compact Development) Scenario 3
(Multi-Core Dev.)
Transport Convenience
Chronic traffic congestion near the city center will become more serious (Grid-lock) due to expansion of urbanization.
Development of public transport enhances mobility of people and reduces traffic congestion on roads
Due to increase of sub-urban traffic, development of sub-urban public transport will become necessary.
Living Environment
Difficult to provide favorable living environment for many people due to continued over-saturation of the built-up area in the north and insufficient mobility in the expanded residential area.
Gradual enhancement of living environment can be expected in the built-up area in the north and high mobility due to public transport development in expanded urban area can be expected.
Gradual enhancement of living environment can be expected in the built-up area in the north and urban expansion in the area of poor mobility will be restricted. Living environment in Lahore will be much improved as a whole and that of suburban cities could be favorable, depending on city planning.
Impact on Natural
Environment
Due to lack of planning, disorderly land use will continue and conservation of greenery and agricultural land will become difficult.
Owing to planned urbanization control, conservation of greenery and agricultural land can be done in an orderly manner.
In terms of conservation of greenery and agricultural land, this scenario is the best for Lahore. However, the situation may become worse in suburban areas.
Reality Most realistic because public investment is minimal and government intervention is also the least; only with 2009 land use rules of LDA.
Though there are difficult targets of development of competitive public transport system and planned urban development, many cities in the world have overcome these issues. It is feasible if institutional and financial problems could be resolved.
Development of suburban cities needs tremendous efforts by the government. If this is not prepared in a timely manner, the situation will become the same as Scenario 1 (Zero Option - Trend).
Others
- -
If suburban cities are developed, high-speed rail transport system will be needed to connect these cities with Lahore.
Source: JICA Study Team

The Project for Lahore Urban Transport Master Plan in the Islamic Republic of Pakistan (Phase II)
FINAL REPORT: VOLUME – I of II CHAPTER 3 – URBAN DEVELOPMENT CONTEXT
3-18
2) Conclusion
Scenario 2 and 3 are both excellent for a city with a population over 10 million in terms of
mobility, living environment and conservation of greeneries and agricultural land. From
the viewpoint of reality, Scenario 1 (Zero Option - Trend) is the easiest way. However,
Scenario 2 and 3 are also realistic only if strong ‘political will’ and leadership are
guaranteed in planning and funding. Scenario 3, however, may be slightly weak in
flexibility because the timing of project implementation must be consistent with population
increase and high-speed transport system will be required in the long run to support the
intended structure of the metropolis.
In contrast, Scenario 2 has a flexibility to shift from Scenario 1 to Scenario 2 depending
on the timing of public transport development. In this sense it may be called Scenario 2a
(between Scenario 1 and 2).
3.1.4 Existing Land Use Rules of the Punjab and Its Use
1) Existing Land Use Rules of the Punjab
The GoPb enacted new land use rules on the 10th February, 2009 based on the 1975
Lahore Development Authority Act. The Rules intend to determine land use in controlled
areas according to land use classification. There are 6 land use classes, as follows:
1. Residential,
2. Commercial (including institutional),
3. Industrial,
4. Peri-urban,
5. Agricultural, and
6. Notified Areas. (e.g. specially designated development area)
For each of these classes, maximum height, coverage, floor to area ratio, etc. are
determined by size of the plot. Orderly development is thus ensured in the controlled area.
This specification is done by plot, and it is easy to understand for both government and
private developers since subdivision of a plot is prohibited by law (Subdivision Ordinance).
However, this detailed specification requires a long time for the government to prepare
and the consistency of these specifications with macroscopic land use plans is not
necessarily guaranteed. In addition, land use conversion from one class to the other is
allowed by paying the land use conversion tax if the conversion is deemed appropriate
judging from the environment nearby. LDA applies these rules mainly to the areas where
land use is changing rapidly or new development is foreseen because of the huge time
and cost required for land use classification of entire Lahore. In reality, built-up areas like

The Project for Lahore Urban Transport Master Plan in the Islamic Republic of Pakistan (Phase II)
FINAL REPORT: VOLUME – I of II CHAPTER 3 – URBAN DEVELOPMENT CONTEXT
3-19
Walled City and rural villages are excluded from application of these rules.
Although this system has a significant effect to improve the quality of urban areas, there
still remain some problems. Private developers tend to select arbitrarily development
areas for their convenience, and thus these are inefficient, and in many cases the
agricultural land remains in between developed areas (e.g. in the southern developing
areas of Lahore). LDA recognizes this problem and is seeking for measures for solution.
Another big issue is how to keep consistency between detailed land use classification
and the overall urban structure of Lahore. Strong political will may be needed to realize
an ideal land use for the entire metropolis.
2) Application of Present Land Use Rules toward Realization of the Scenario
As described above, GoPb has a strong power through LDA to realize planned land use.
In this section, how to use the present land use rules to attain the goals of Scenario 2 is
briefly discussed.
The basic assumption here is the future development of urban RMTS. Around planned
RMTS stations, development areas (assuming 800 m to 1000 m radius, 200ha and fifty
thousand population) should be determined first, and the mode of development (LDA
direct or through private developers) should be selected depending on the land use
condition such as the size of commercial area, type of public facilities to be developed,
size of parks/ greeneries, and open spaces.
Next step is the implementation of the development around RMTS stations. LDA has
enough capacity of these types development although their experience is based on
Radial or Trunk roads (e.g. development along Thokar Niaz Baig; Canal Bank Road). In
this scenario, the road is replaced by RMTS. If LDA does not implement the project
directly, private developer should be selected on a competitive basis based on land use
requirement and other condition. This procedure is allowed by the 2009 land use rules.
There is an important point in the RMTS-based development. While financial viability of
the project is not affected by the timing of implementation in the case of road-based
development, the synchronization of the timing of urban development and station
development is a critical factor to determine the financial (and also economic) viability of
the entire project in the case of RMTS-based development.
Korea amended the city planning law and its related rules and regulations in 2000-2003,
where the right of cancellation of development permit was given to local government
when private developer could not observe the planned timing of development. This
system may be added to the 2009 land use rules of Lahore, and would be an essential
pre-requisite for Scenario 2 and 2a.
The Project for Lahore Urban Transport Master Plan in the Islamic Republic of Pakistan (Phase II)
FINAL REPORT: VOLUME – I of II CHAPTER 3 – URBAN DEVELOPMENT CONTEXT
3-20
3) Proposal for a Development Benefit Recovery System
The development around RMTS stations produces a huge benefit for urban developers.
After developing a RMTS station, land price of the surrounding area naturally increases
many fold due to improved mobility, and the benefit becomes huge as a whole.
Theoretically, therefore, developers should pay a part of the benefit to the RMTS operator.
If this system is introduced, it can be a part of the funds required for the RMTS
development.
This system has been implemented in many cities of the world. For instance, subway line
No.1 in Osaka, Japan was subsidized in 1930’s by a new tax imposed on land owners
around stations (within 800 m radius) who were potential beneficiaries of the subway.
This tax was collected as a surcharge to the property tax.
3.1.5 Projects Assumed by Scenario
In order to materialize the three urban development scenarios shown above, a series of
urban development projects need to be implemented. Some projects are common among
the scenarios while others are unique to the scenario.
1) Proposed Urban Development Projects
Table 3.1.3 shows the proposed urban development projects needed for each scenario.
Table 3.1.3 Proposed Urban Development Projects
Project Scenario
Utilization of open space in built-up areas 1, 2, 3
Control of expanding urban area 1, 2
Environment improvement in northern densely built-up area 2, 3
Maturing of CBD 2, 3
Development of academic town 2, 3
Development of industrial estates 2, 3
Fostering suburban cities 3 Source: JICA Study Team
2) Project Description
(i) Utilization of Open Space in Built-up Areas
This is materialized only when “carrot and stick” strategy is applied to land developers or
land owners. As to “stick”, the 2009 land use rules should be strictly applied in the
controlled areas and need to be strengthened, for example, by imposing “non-utilization
surcharge” on unused land plots in the classified area.

The Project for Lahore Urban Transport Master Plan in the Islamic Republic of Pakistan (Phase II)
FINAL REPORT: VOLUME – I of II CHAPTER 3 – URBAN DEVELOPMENT CONTEXT
3-21
As to “carrot”, subdivision of land plot and high-rise buildings may be admitted under
certain condition, and a part of taxes may be exempted for a certain period when land is
used properly. For this purpose, the Subdivision Ordinance may be deregulated for large
land plots above a certain size if environmental degradation is not incurred.
(ii) Control of Expanding Urban Area
The principle of this project is the stringent application of the 2009 land use rules. In
Scenario 1, development will proceed along arterial roads, and development permit
should be given to developers so that remaining unused land area becomes minimal. In
Scenario 2, the most important is the political intervention to guide urban development to
RMTS station areas. Plans and concepts should be informed to the public, and the role of
LDA is quite significant as planner, developer and controller.
(iii) Environment Improvement in Northern Densely Built-up Area
The 150ha land produced by the relocation of the existing iron/ steel industries to the
suburbs is the key element of this project. In close coordination with the adjacent bus
terminal and railway station, the environment of the area will be largely improved by an
integrated multi-purpose development. The image of the central redevelopment building
is as follows:
First floor – Integrated transport terminal including Pakistan Railway, city bus and feeder transport. Shopping mall, office, park and road space.
Second floor – Artificial ground covering Lahore Station of Pakistan Railway. Business and commercial facilities. Pedestrian deck. Equipment room to support the complex building.
Third floor and above – Residence in principle.
The overall scale could be:
- Developed area : 300 ha;
- Floor area : 2,000 ha (1,500 ha residence);
- Population : 150 thousand (with population density at 500/ha); and
- No. of workers : 50 thousand
The residence here absorbs residents from the nearby area, and other environment
improvement projects will be promoted one after another in the adjacent area.
(iv) Maturation of CBD
The present CBD takes advantage of well developed social infrastructure including roads
and parks/ gardens. However, as population and economy grow, the function of this CBD
needs to be upgraded. For this purpose, a large-scale development project will be
necessary.
For this project, a comprehensive plan needs to be formulated including future number of

The Project for Lahore Urban Transport Master Plan in the Islamic Republic of Pakistan (Phase II)
FINAL REPORT: VOLUME – I of II CHAPTER 3 – URBAN DEVELOPMENT CONTEXT
3-22
workers, necessary floor space, building location, height of building, transport access,
pedestrian movement and conservation of greenery/ parks. For areas of government
buildings, the project should be implemented by LDA, while other areas can be
developed by private developers under control of LDA.
The present CBD of Lahore consists of the four zones shown in Table 3.1.4 and the
density of workers, particularly of tertiary sector (service and commercial), is quite high compared to the zones nearby.
Table 3.1.4 Workers Density in the Four Zones of CBD, 2010
Zone No.
Area Name
No. of Workers in Daytime (‘000)
Area (ha)
Density (/ha)
27 Anarkali 79 206 384 30 Qila Gujjar Singh 88 243 361 32 Mozang 37 145 256 33 Jinnah Hall 41 161 252
Total 244 755 324 Source: JICA Study Team
As seen in the table above, the density of daytime workers is not high as a CBD. For
instance, the same figure in Tokyo, Japan is 1,000-3,000 as of 2010. Although the
situation of Tokyo is not necessarily favorable, the room for future development is very
large in Lahore.
The present CBD of Lahore should remain as the CBD in the future too, because of the
well developed infrastructure and the abundant room for future upgrading. The current
workers density could be easily raised to 500/ha without any negative impact on
environment. For this upgrading project, high-rise building may be allowed in some
specific areas or streets.
(v) Development of Academic Town
The academic town proposed in the north of Ravi River is expected to be one of the high-
tech centers of Pakistan. The proposed site has favorable conditions such as well
developed road infrastructure, existence of The University of Engineering and
Technology, proximity to railway and industrial estates proposed nearby.
The overall scale of this project could be:
Development area: 1,500 – 2,000 ha; Campus area: 1,000 – 1,400 ha; No. of universities/ high-grade education organizations: 3 – 4; No. of research organizations: 30 – 50; Population: 100 – 150 thousand; No. of workers: 60 – 80 thousand; and No. of students: 60 – 80 thousand.

The Project for Lahore Urban Transport Master Plan in the Islamic Republic of Pakistan (Phase II)
FINAL REPORT: VOLUME – I of II CHAPTER 3 – URBAN DEVELOPMENT CONTEXT
3-23
(vi) Development of Industrial Estates
In the south-west of the academic town mentioned above, industrial estates will be
developed. The ribbon development along Lahore-Sheikhupura Road should be
absorbed. This is the relocation site of the existing industries located in Lahore. Modern
high-tech industries should be invited too to promote synergy with the proposed
academic town. The overall scale of this project could be:
Development area : 500 – 800 ha;
Floor area : 400 – 600 ha;
No. of enterprises : about 2,000; and
No. of workers: about 50 thousand.
(vii) Fostering Suburban Cities
This project, inherent to Scenario 3 only, intends to foster, Muridke, Raiwind area, and
Pattoki Tehsil areas, as suburban cities. The other aspect of this project is the stringent
restriction of urban area expansion in Lahore.
In this project, the role of District Government becomes essential. The experience of
LDA should be transferred to local government agencies in the field of planning, design,
contract preparation, implementation, control and monitoring.

The Project for Lahore Urban Transport Master Plan in the Islamic Republic of Pakistan (Phase II)
FINAL REPORT: VOLUME – I of II CHAPTER 3 – URBAN DEVELOPMENT CONTEXT
3-24
3.2 Socio-Economic Framework
3.2.1 Population
1) Past Trends in Population Growth Table 3.2.1 shows the past population trends for Pakistan, the Punjab, Lahore Division
and the Study Area. The latest census was conducted in 1998, and the 2010 figures have
been estimated by the Study Team after consulting various government agencies. Past
population trends and forecast for future years by various agencies and JICA Study Team
are shown in Figure 3.2.1.
Table 3.2.1 Past Population Trends of Pakistan, the Punjab, Lahore Division and the Study Area
Area Description Area Census Population (‘000) Annual Growth Rate (%)
(km2) 19611 19721 19811 19981 20101 1951-1961
1961-1972
1972-1981
1981-1998
1998-1910
Pakistan 796,096 42,880 65,309 84,254 132,352 168,258 2.43 3.90 2.87 2.69 2.02
The Punjab 205,345 25,464 37,607 47,292 73,621 93,682 2.17 3.61 2.58 2.64 2.03
Lahore Division 11,729 3,560 5,431 7,183 12,016 15,784 2.36 3.91 3.16 3.07 2.30
Lahore District 1,772 1,626 2,588 3,545 6,319 8,650 3.66 4.32 3.56 3.46 2.65
Kasur District 3,995 8542 1,1862 1,5282 2,376 3,016 1.16 3.03 2.86 2.63 2.01
Sheikhupura District 3,242 6563 1,0283 1,3383 2,2763 2,888 1.61 4.17 2.97 3.17 2.00
The Study Area 3,044 N/A N/A N/A 7,307 9,928 N/A N/A N/A N/A 2.59 Note 1: Census Year; Note 2: Lahore divided in to Lahore District and Kasur District; Note 3: Sheikhupura divided in to Sheikhupura
District and Nankana Sahib District in 2005. Source: Punjab Development Statistics, 2010
Figure 3.2.1 Past Population Trends of Pakistan and Future Forecast by Various Agencies
1.00
1.50
2.00
2.50
3.00
3.50
4.00
4.50
1991
1992
1993
1994
1995
1996
1997
1998
1999
2000
2001
2002
2003
2004
2005
2006
2007
2008
2009
2010
2011
2012
2013
2014
2015
2016
2017
2018
2019
2020
2021
2022
2023
2024
2025
2026
2027
2028
2029
2030
Popu
latio
n G
row
th %
p.a.
Pakistan Population Growth Rates
WB Tot-Pop-GrUN-Pop-GrPDS-Pop-Gr'Forecast'
Source: WB, UN and PDS 2010

The Project for Lahore Urban Transport Master Plan in the Islamic Republic of Pakistan (Phase II)
FINAL REPORT: VOLUME – I of II CHAPTER 3 – URBAN DEVELOPMENT CONTEXT
3-25
2) Population Projections
Due to lack of detailed demographic data, macroscopic approach has been taken. The
procedure of projection is as follows:
Step-1: Set future population growth rates for Pakistan:
2010 – 2015: 2.13 % p.a.
2015 – 2020: 2.03 % p.a.
2020 – 2025: 1.92 % p.a.
2025 – 2030: 1.82 % p.a.
The above growth rates are the same as the projection of the United Nations (UN)
Census Bureau, and also consistent with the recent Planning Commission’s paper
“Pakistan: Framework for Economic Growth”. These rates are higher than the targets of
the Mid-Term Development Framework 2005 – 10 (MTDF) which states 2010 population
growth rate at 1.63 %. Pakistan Transport Plan Study (PTPS, 2006 JICA), following the
MTDF approach, also used these low growth rates of 1.63 % for 2010 and 1.08 % for
2020. Considering the recent trends, however, these low growth rate projections have
proven to be unrealistic.
Step-2: Set future population share of the Punjab to Pakistan, and the Study Area to the
Punjab:
These shares can be calculated as shown in Table 3.2.2. The share of the Punjab has
been gradually diminishing, while the share of Lahore Division and the Study Area is on
the increasing trend. Note that the share of the Study Area can be calculated only for
1998 and 2010 due to the change of administrative boundaries of Districts, Tehsils and
Lahore Towns. Kasur District was separated out of Lahore District in 1976 and
Sheikhupura District was split in to Sheikhupura and Nankana Sahib District in 2005.
In addition, Lahore district Tehsils/ Towns have been created and merged in to number of
towns. Therefore at time it is almost impossible to do a direct area based comparison.
Table 3.2.2 Relation of Population between Pakistan, the Punjab, Lahore Division and the Study Area
Description 1961 1972 1981 1998 2010 Share (%) of Punjab to Pakistan 59.4 57.6 56.1 55.6 54.0 Share (%) of Lahore Division to Punjab 14.0 14.4 15.2 16.3 16.8
Share (%) of the Study Area to Punjab N/A N/A N/A 9.9 10.6 Source: Punjab Development Statistics
Assuming the same tendency between 1998 and 2010 continues in the future until 2030,
these shares can be calculated as follows:
2030 Share (%) of the Punjab to Pakistan: 51.3 %

The Project for Lahore Urban Transport Master Plan in the Islamic Republic of Pakistan (Phase II)
FINAL REPORT: VOLUME – I of II CHAPTER 3 – URBAN DEVELOPMENT CONTEXT
3-26
2030 Share of Lahore Division to the Punjab: 17.9 %
2030 Share of the Study Area to the Punjab: 11.7 %
Step-3: Calculate Future Population:
The results of projected population for Pakistan, Punjab and the Study Area is presented
in Table 3.2.3 and annual growth rate comparison for future years forecast is shown in
Figure 3.2.2.
The 2030 population of Pakistan was projected at 256.4 million. This is considerably
higher than the PTPS 2030 projection at 216.2 million. However, the UN Census Bureau
projected 2025 population at 245.1 million is considerably on the high side. Regarding
Lahore Metropolitan Area (LMA), “Integrated Master Plan for Lahore 2021” by LDA
projected population at 10.5 and 14.1 million for 2011 and 2021, respectively. Although
comparison cannot be made exactly due to the difference in the Study Areas, this
estimate seems to be considerably higher than the current projection. In addition, the
1991 JICA, Comprehensive Study on Transportation System in Lahore projected 2010
LMA population at 10.4 to 11.0 million. This is comparable to the LDA study forecasts.
Table 3.2.3 Population Forecasts
Province / Division / District
Estimated Population ('000) Annual Growth Rate (%) 2010 2015 2020 2025 2030 10-15 15-20 20-25 25-30
Pakistan 168,258 186,957 206,720 227,342 248,797 2.13 2.03 1.92 1.82 The Punjab 93,682 104,093 115,097 126,578 138,524 2.13 2.03 1.92 1.82 Lahore Division 15,784 17,772 19,913 22,191 24,609 2.40 2.30 2.19 2.09 The Study Area 9,928 11,362 12,925 14,615 16,429 2.74 2.61 2.49 2.37 Source: JICA Study Team
Figure 3.2.2 Annual Growth Rate Comparison for Future Year Forecast
3) Population Breakdown to the Study Area Zones
(i) General
The projected 2030 population is distributed to traffic zones according to the
Source: JICA Study Team

The Project for Lahore Urban Transport Master Plan in the Islamic Republic of Pakistan (Phase II)
FINAL REPORT: VOLUME – I of II CHAPTER 3 – URBAN DEVELOPMENT CONTEXT
3-27
methodology explained hereafter. After zonal breakdown, the difference is adjusted by
distributing the projected total to zones in proportion to the calculated figures as a result
of the zonal breakdown. 2020 population by zone was estimated by interpolation, and the
values by zone were adjusted to the projected total. The zonal breakdown methodology
is different by scenario.
(ii) Methodology of Population Breakdown to Study Area Zones
1. Ravi, Data Gunj Baksh, Samanabad and Shalamar Towns
The methodology is common for all scenarios. The density of these towns is extremely
high and needs to be reduced by political intervention. According to the “Sustainable
Development of Walled City Lahore Project”, there are already some zones where
population has started to decrease. It is a common phenomenon in many cities of the
world that the population of high-density areas has decreased and living environment has
been improved. Therefore population of these areas will certainly continue to decrease
for some time to come. However, political intervention is desirable rather than wait-and-
see attitude of natural change, for the betterment of the living environment.
The upper limit of population density for a low to medium height building areas population
density is set at 500 /ha, and 1,000 /ha in the case of super high-rise building areas. In
Lahore, super high-rise building is not admitted and excellent city scenery with open
skyline has been traditionally maintained. This tradition should be observed in the future.
It is assumed that population density of zones with more than 500 /ha be lowered to 500
/ha while population density of other zones remain unchanged.
2. Gulberg Town
This area boasts of its excellent environment with large residences, wide streets and
parks/ greeneries. For scattered open spaces including under-used facilities of Pakistan
Railway (PR), redevelopment projects should be promoted as proposed in the previous
chapter.
In Scenario 2 and 3, the population of zones 77 (Railway Colony) and 79 (Daras Barey
Mian) that include PR facilities is assumed to be 150 thousand. In other zones, it is
assumed that population will increase by 5 % (open space 1 % and its redeveloped
population density at 5 times of the present).
3. Aziz Bhatti Town
The western part of this area has been densely built-up, and the same assumption is
introduced as 1 above (Ravi and other towns). For other zones, Scenario 1 assumes that
urbanization spreads beyond LRR while Scenario 2 and 3 controls urbanization within
LRR. Upper limit of population density is set at 100 /ha. For zones already built up, the

The Project for Lahore Urban Transport Master Plan in the Islamic Republic of Pakistan (Phase II)
FINAL REPORT: VOLUME – I of II CHAPTER 3 – URBAN DEVELOPMENT CONTEXT
3-28
present population is maintained.
4. Wahgah Town
Present population density of this area is about 15 /ha showing low level of urbanization.
This is due to the government restriction on development for the defense reasons and
lack of arterial roads to Lahore city centre.
Similarly to Aziz Bhatti Town, Scenario 1 assumes that urbanization spreads beyond LRR
while Scenario 2 and 3 controls urbanization within LRR. Upper limit of population
density of newly developed areas is assumed at 100 /ha in all the scenarios.
5. Nishtar Town
This area remains under-developed with a population density of 19 /ha although a part of
northern area shows considerable urbanization. The area to the west of railway has been
developed mainly by private developers with relatively high standards although
numerous unused land plots are common. In the eastern area, Ferozepur Road has led
urbanization towards the south.
Scenario 1 assumes the following:
a. Population density of densely inhabited areas of more than 1,000 /ha located in
the north of this area be lowered to 500 /ha similarly to the northern densely built-
up area.
b. Population density of areas with a population density of 200-500 /ha should be
raised to 500 /ha.
c. Population density of areas with a population density of less than 200 /ha be
raised to 200 /ha.
d. Population density of suburban areas with a population density of 10-60 /ha at
present is raised to 100 /ha on average.
e. Other agricultural areas will remain as is.
Scenario 2 has the same assumption for densely inhabited area of more than 1,000 /ha
located in the north of this area (as above). Along the railway, new development areas
will have a population density at 200 /ha. For other areas urbanization is controlled within
the planned areas at average population density of 100 /ha.
Scenario 3 has the same assumption for densely inhabited areas of more than 1,000 /ha
located in the north of this area (as above). Urbanization is controlled within the planned
areas at average population density at 100 /ha. Planned development along the railway
is not assumed unlike Scenario 2.

The Project for Lahore Urban Transport Master Plan in the Islamic Republic of Pakistan (Phase II)
FINAL REPORT: VOLUME – I of II CHAPTER 3 – URBAN DEVELOPMENT CONTEXT
3-29
6. Iqbal Town
This area has been partially urbanized along Multan Road with a population density over
600 /ha. As a whole, however, urbanization level is low with an average population
density of 18 /ha. In this area, there are a number of urban development projects are
planned and prepared, and it is assumed that these projects will be implemented.
Population density of over-saturated areas will be lowered to 500 /ha at the highest. This
assumption is common for all scenarios.
Scenario 1 assumes conventional road-based urban development taking advantage of
LRR and other roads. This scenario assumes urbanization beyond LRR. Westward
development is not taken into account due to the risk of flooding of the Ravi. Assumed
population density is 100 /ha.
Scenario 2 assumes planned dense development around the stations of the proposed
RMTS to be developed in the long run. Planned population density is 200 /ha. Suburban
development is limited within the planned/ on-going projects. Its population density is set
at 100 /ha.
Scenario 3 assumes that suburban development be restricted within the planned/
ongoing projects. Its population density is set at 100 /ha.
7. Cantonment
This area is characterized by high-quality residences. In the west of the airport, the
residential area is already matured while future development is foreseen in the east.
Unlike Gulberg, unused land plots are limited.
Scenario 1 assumes that population density of already built up zones remain basically
as it is except for immature zones with a population density of less than 200 /ha that will
be raised to 200 /ha. For eastern zones, maximum population density is set at 100 /ha.
Scenarios 2 and 3 assume the same as Scenario 1. However, outside LRR,
urbanization is not considered and population will remain unchanged.
8. Tehsil Ferozewala Areas
This area has a large potential for future development due to the proximity to Lahore
CBD.
Scenario 1 assumes conventional ribbon development toward the north and north-west
along arterial roads. Population density is assumed at 200 /ha for the area near Ravi
Town and 100 /ha for other areas.
Scenario 2 and 3 assume planned development of the area taking advantage of the high
potential. The key project is the development of an academic town mentioned in the
The Project for Lahore Urban Transport Master Plan in the Islamic Republic of Pakistan (Phase II)
FINAL REPORT: VOLUME – I of II CHAPTER 3 – URBAN DEVELOPMENT CONTEXT
3-30
previous chapter. Population density is set at 100 /ha in the academic town, 200 /ha in
the surrounding residential area and 100 /ha for the high-quality residential area further
outside of the academic town.
9. Muridike, Pattoki and Kasur North (Raiwind)
These areas have been conventional rural villages without salient urban development.
In Scenario 1 and 2, no major change is foreseen.
Scenario 3 intends to utilize the potential of Lahore’s urbanization for developing these
areas as suburban cities by providing urban functions in the built-up areas and by
supplying residences in the surrounding area. The total population of this area should be
500-600 thousand with a population density of 200 /ha near the city center and 100 /ha in
the adjacent area.
10. Sharaqpur
In this area, population will not change much due to the absence of urban development
projects.
(iii) Results of Forecast Population Distribution
The resultant distributed forecast population by Towns and Tehsil is given in Table 3.2.4
and detailed in Figure 3.2.3 and 3.2.4. It is noted that population decrease is assumed in
Ravi, Data Gunj Baksh, Samanabad and Shalamar towns while significant increases are
forecast for Nishtar and Iqbal Towns, Cantonment and Ferozewala under all scenarios.
Large increase in population is assumed for Muridike, Raiwind and Pattoki as assumed
under Scenario 3.
The results might be considered as too drastic from practical point of view of Lahore
residents. However, political intervention, if applied properly, could have strong influence.
This is the reason why master planning is important. Of course there must be a strong
will of residents to guide Lahore to the desirable direction they choose whether Scenario
1, 2, 3, or another scenario as combination of the proposed scenarios.
In addition, the total population of the Study Area is controlled to be the same under all
three scenarios to facilitate an easy and direct comparison.

The Project for Lahore Urban Transport Master Plan in the Islamic Republic of Pakistan (Phase II)
FINAL REPORT: VOLUME – I of II CHAPTER 3 – URBAN DEVELOPMENT CONTEXT
3-31
Table 3.2.4 Summary of Forecast Population (‘000)
No. Town/ Tehsil in the Study Area 2010
2020 2030
Scenario I
Scenario II
Scenario III
Scenario I
Scenario II
Scenario III
1 Ravi 1007 978 971 976 949 938 947
2 Data Gunj Baksh 970 968 961 966 970 958 967
3 Samanabad 984 990 983 988 1002 990 999 4 Shalamar 854 790 784 788 720 711 717 5 Gulberg 778 850 926 931 937 1102 1112
6 AzizB 667 901 686 690 1175 714 721 7 Wagah 656 881 713 717 1145 784 792 8 Nishter 945 1906 2007 1399 3017 3226 1927 9 Iqbal 960 1840 1824 1366 2857 2818 1838
10 Cantt 831 1149 1018 1024 1521 1240 1251
11 Ferozewala 534 883 1268 1275 1288 2110 2130 12 Muridke 266 284 282 609 305 302 1005 13 Sharaqpur 101 108 107 107 116 114 115
14 Kasur 168 179 177 520 192 190 927 15 Patoki 207 221 219 568 238 235 983
1-10 Lahore 8653 11252 10873 9846 14291 13479 11270
11-13 Sheikhupura 901 1274 1656 1992 1708 2526 3250
14-15 Kasur 375 399 397 1088 430 424 1910
1-15 The Study Area 9928 12925 12925 12925 16429 16429 16429
Source: JICA Study Team

The Project for Lahore Urban Transport Master Plan in the Islamic Republic of Pakistan (Phase II)
FINAL REPORT: VOLUME – I of II CHAPTER 3 – URBAN DEVELOPMENT CONTEXT
3-32
Figure 3.2.3 2020 Population Forecast for Three Scenarios
Source: JICA Study Team

The Project for Lahore Urban Transport Master Plan in the Islamic Republic of Pakistan (Phase II)
FINAL REPORT: VOLUME – I of II CHAPTER 3 – URBAN DEVELOPMENT CONTEXT
3-33
Figure 3.2.4 2030 Population Forecast for Three Scenarios
Source: JICA Study Team
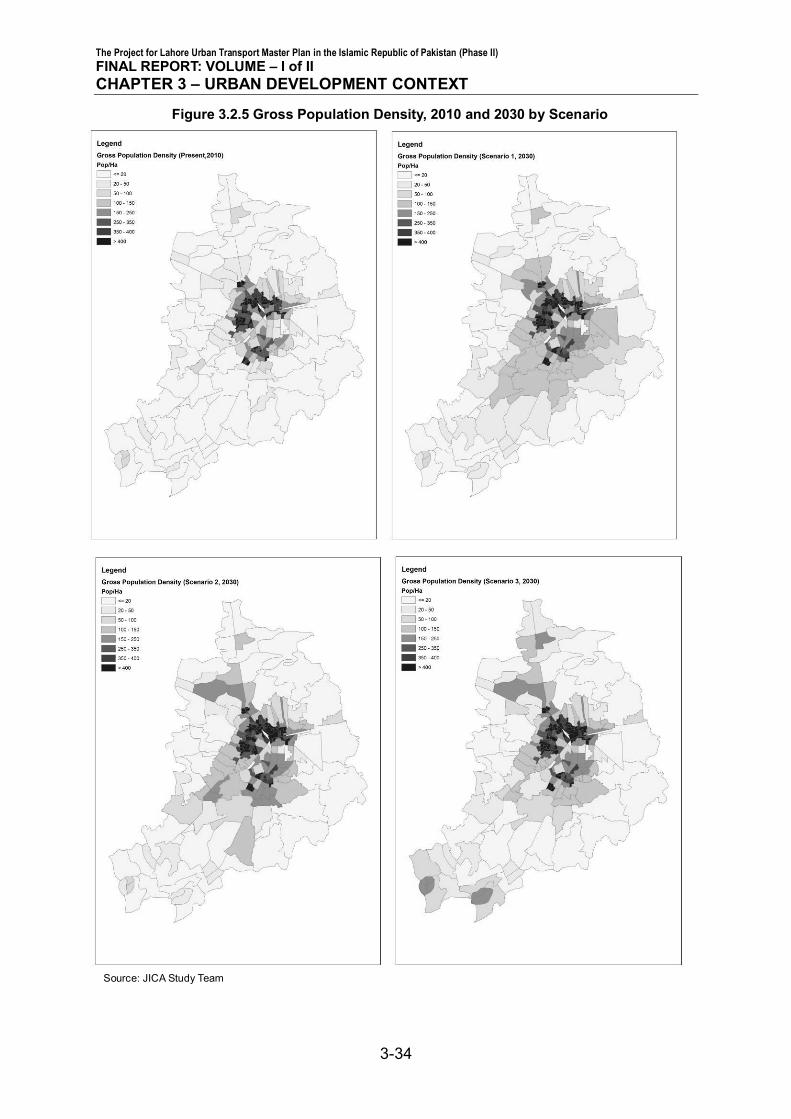
The Project for Lahore Urban Transport Master Plan in the Islamic Republic of Pakistan (Phase II)
FINAL REPORT: VOLUME – I of II CHAPTER 3 – URBAN DEVELOPMENT CONTEXT
3-34
Figure 3.2.5 Gross Population Density, 2010 and 2030 by Scenario
Source: JICA Study Team

The Project for Lahore Urban Transport Master Plan in the Islamic Republic of Pakistan (Phase II)
FINAL REPORT: VOLUME – I of II CHAPTER 3 – URBAN DEVELOPMENT CONTEXT
3-35
3.2.2 Employment 1) Ratio of Number of Workers to Population and Total Workers
According to LUTMP HIS, the ratio of Number of workers to population is 27.1 % for the
Study Area. This is extremely low compared to international standard employment
participation rate. This is due to the high unemployment rate and particularly the lack of
female workers due to social issues. However, female employment participation rate is
gradually progressing as can be seen in Table 3.2.5.
Table 3.2.5 Past Trend in Female (15 years +) Employment Participation Rate in Pakistan
1995 2000 2005 2006 2007 2008
10.7 13.5 16.8 18.8 19.0 19.8 Source: World Development Indicators 2010
Judging from this table, female labour participation rate is on an increasing trend, and it
will naturally be 21 % in 2020 and 33 % in 2030 if the past trend is to continues. Although
the basis is different between HIS (total population) and WDI (population age 15 years+),
only growth rate of labour participation rate is used for the analysis. Meanwhile, male
labour participation rate is assumed to be constant at 80 % in the future as no remarkable
change has been observed in the past.
Since male and female contribution to labour participation rate is 80:20 according to
World Development Indicators of WB, female labour participation rate will grow from
5.4 % (20 % of 27.1 %) in 2010 to 8.5 % (1.57 times of 5.4 %) in 2030 while male labour
participation rate will remain at 21.8 % (80 % of 27.1 %). Thus the total labour
participation rate will become 28.8 % in 2020 and 30.3 % in 2030.
As a result the total number of workers in 2020 and 2030 is estimated by multiplying
these ratios with population for entire Study Area as whole and for each zone. These are
3.8 million in 2020 and 5.1 million in 2030 for the Study Area. In addition, the current
labour participation rate by zone is almost constant at 26-29 % according to HIS.
Table 3.2.6 Forecast No. of Workers for the Study Area
Description 2010 2020 2030 Population ('000) 9,928 (100.0) 12,925 (130.2) 16,429 (165.5) Number of Workers ('000) 2,691 (100.0) 3,722 (138.3) 4,978 (185.0)
Participation Rate (%) 27.1 % 28.8 % 30.3 % Source: JICA Study Team

The Project for Lahore Urban Transport Master Plan in the Islamic Republic of Pakistan (Phase II)
FINAL REPORT: VOLUME – I of II CHAPTER 3 – URBAN DEVELOPMENT CONTEXT
3-36
2) Employment by Sector
(i) Primary Sector Employment
In Pakistan, the share of primary sector workers has dropped from 51.5 % in 1990 to
43.6 % in 2007, while the number of primary sector workers has increased by about 4
million during the same period. In the Study Area, however, the number of primary sector
workers is considered to have been and will continue decrease due to rapid urbanization.
In the period 1994 to 2000, urbanized area has increased by about 41 thousand hectare
(from 21 to 62 thousand hectare). Assuming this is due to the decrease of agricultural
land, and its declining rate is about 1 % per year. Assuming again that the number of
agricultural workers has decreased and will decrease at the same pace, the total number
of primary sector workers in the future will be as follows:
2010: 179 thousand 2020: 160 thousand 2030: 146 thousand
For zonal disaggregation of primary employment following steps were taken:
a. For 2030, no primary sector workers are assigned to zones in the CBD, High-Density Urban Area, Mixed-use Urban Area, University Area and Industrial Area.
b. For 2030, one half of primary sector workers of the present numbers are assigned to zones in the Residential Area.
c. For 2030, remaining primary sector workers are assigned to other zones in proportion to the present numbers.
d. The assigned result is adjusted to the predetermined control to total given above.
e. The 2020 numbers are estimated by interpolation using 2010 and 2030 figures. Then the assigned result is adjusted to the predetermined control to total given.
f. For primary sector workers, the number is assumed to be the same for daytime and nighttime (i.e. they live and work in the same zone).
(ii) Secondary and Tertiary Sector Employment
General
The sectoral composition of workers in the Study Area is characterized by the high
percentage of the tertiary sector at 78.3 % according to 2010 LUTMP HIS. Out of this
(78.3 %) 27.3 % is the contribution of wholesale/ retail commerce sector employment and
this is comparable to major cities in the world. However the remaining 51 % is very high
presumably due to contribution of provincial government and other public services
concentration in Lahore. As a result, the share of the secondary sector is small at 15.1 %
of the total employment.

The Project for Lahore Urban Transport Master Plan in the Islamic Republic of Pakistan (Phase II)
FINAL REPORT: VOLUME – I of II CHAPTER 3 – URBAN DEVELOPMENT CONTEXT
3-37
Due to the estimated improvement of labour participation rate, the growth of employment
is higher than population. Moreover, the number of secondary and tertiary workers will
grow rapidly due to the decrease of primary sector workers.
It is essential for the economy of Lahore to absorb more workers into the secondary
sector by effective political intervention. This is the reason why academic town and
industrial estates are proposed under development Scenario 2 and 3.
It is assumed that the number of tertiary sector workers increases in proportion to
population as seen in other major cities of the world. Once the number of tertiary sector
workers is estimated, the remainder is the number of workers of the secondary sector. In
addition, it is also assumed that the number of secondary and tertiary sector does not
change between daytime and nighttime as a whole for the Study Area considering the
present day/night ratio revealed by 2010 HIS (0.996 and 1.008 for the secondary and
tertiary sector, respectively). The results are tabulated below in Table 3.2.7 and
employment by sector for year 2010 is shown in Figure 3.2.6.
Table 3.2.7 Forecast No. of Workers by Employment Sector for the Study Area
Description 2010 2020 2030
No. ('000) % No. ('000) % No. ('000) %
Total Workers 2691 100.0 3722 100.0 4978 100.0
Primary Sector 179 6.6% 164 4.4% 154 3.1%
Secondary Sector 406 15.1% 819 22.0% 1339 26.9%
Tertiary Sector 2107 78.3% 2740 73.6% 3485 70.0% Source: JICA Study Team
Zonal Breakdown of Tertiary Sector Workers (night-time)
The ratio of the number of tertiary sector workers to population ranges between 0.22-
0.28 for most of the urbanized zones and 0.12-0.15 in the surrounding areas. It is
assumed that the number of tertiary sector workers is 25 % of population for zones
already built up or to be urbanized in the future and 15 % for other zones. The values
thus calculated are then adjusted to the control totals of predetermined above.
Zonal Breakdown of Tertiary Sector Workers (day-time)
First, planned number of workers is allocated to the proposed projects including
redevelopment of the super high-density area, CBD redevelopment and academic town.
The rest is then assigned to other zones in proportion to the present number of tertiary
sector workers (day-time).
Zonal Breakdown of Secondary Sector Workers (night-time)
This is calculated simply by subtracting the number of primary and secondary sector

The Project for Lahore Urban Transport Master Plan in the Islamic Republic of Pakistan (Phase II)
FINAL REPORT: VOLUME – I of II CHAPTER 3 – URBAN DEVELOPMENT CONTEXT
3-38
workers from the total employment.
Zonal Breakdown of Secondary Sector Workers (day-time)
For zones of industrial estates, planned number of secondary workers is allocated, and
the rest is then assigned to other zones in proportion to the present number of secondary
sector workers (day-time).
Figure 3.2.6 2010 Employment by Sector
Source: JICA Study Team
(iii) Result of Zonal Breakdown
Table 3.2.8 to 3.2.14 details the result of zonal breakdown of number of workers by
Town/ Tehsil for night-time and day-time population for the Study Area Towns and
Tehsils. All employment sectors Night-time comparison of forecast for different scenarios
are shown in Figure 3.2.7 and 3.2.8, and Day-time shown in Figure 3.2.9 and 3.2.10.

The Project for Lahore Urban Transport Master Plan in the Islamic Republic of Pakistan (Phase II)
FINAL REPORT: VOLUME – I of II CHAPTER 3 – URBAN DEVELOPMENT CONTEXT
3-39
Table 3.2.8 Summary Forecast Result of Zonal Breakdown of Number of Workers (All Employment Sectors, Night-time, ‘000)
No. Town/ Tehsil in the Study
Area 2010
2020 2030 Scenario
I Scenario
II Scenario
III Scenario
I Scenario
II Scenario
III 1 Ravi 293 278 277 281 273 271 279
2 Data Gunj Baksh 262 261 260 263 270 267 275
3 Samanabad 275 276 275 279 288 286 295 4 Shalamar 237 217 217 219 205 204 210 5 Gulberg 217 228 248 252 248 291 298 6 AzizB 174 244 183 186 329 201 206 7 Wagah 167 266 214 217 383 273 281 8 Nishter 251 618 645 460 1040 1096 705 9 Iqbal 252 513 506 382 812 797 535 10 Cantt 221 305 274 278 405 341 350 11 Ferozewala 146 274 382 393 422 651 675 12 Muridke 70 95 95 198 127 126 343 13 Sharaqpur 39 43 43 43 48 48 50 14 Kasur 40 47 47 131 56 56 232 15 Patoki 47 58 58 140 72 72 245
1-10 Lahore 2348 3206 3099 2817 4253 4026 3434 11-13 Sheikhupura 254 411 519 634 597 825 1068 14-15 Kasur 87 105 105 271 129 128 477
1-15 The Study Area 2689 3722 3722 3722 4978 4978 4978
Source: JICA Study Team
Figure 3.2.7 2020 Night Time Forecast for Workers of All Employment Sectors by Scenario
Source: JICA Study Team

The Project for Lahore Urban Transport Master Plan in the Islamic Republic of Pakistan (Phase II)
FINAL REPORT: VOLUME – I of II CHAPTER 3 – URBAN DEVELOPMENT CONTEXT
3-40
Figure 3.2.8 2030 Night Time Forecast for Workers of All Employment Sectors by Each Scenario
Source: JICA Study Team
Table 3.2.9 Summary Forecast Result of Zonal Breakdown of Number of Workers (All Employment Sectors, Day-time, ‘000)
No. Town/ Tehsil in the Study
Area 2010
2020 2030 Scenario
I Scenario
II Scenario
III Scenario
I Scenario
II Scenario
III
1 Ravi 325 421 443 443 541 589 589
2 Data Gunj Baksh 450 592 622 622 767 831 831
3 Samanabad 219 285 295 293 366 388 386
4 Shalamar 158 202 217 216 259 289 289
5 Gulberg 323 426 439 441 553 581 585
6 AzizB 111 150 147 147 198 193 193
7 Wagah 138 202 189 189 280 253 253
8 Nishter 198 344 270 271 520 360 363
9 Iqbal 298 465 418 419 669 568 570
10 Cantt 210 269 270 270 344 347 347
11 Ferozewala 113 157 198 200 213 299 303
12 Muridke 61 87 82 80 119 109 106
13 Sharaqpur 32 37 40 40 44 49 51
14 Kasur 31 37 40 39 46 52 50
15 Patoki 42 50 54 52 60 69 65
1-10 Lahore 2427 3354 3309 3311 4496 4400 4404 11-13 Sheikhupura 205 281 320 321 376 458 459
14-15 Kasur 73 87 94 91 106 121 115
1-15 The Study Area 2705 3722 3722 3722 4978 4978 4978
Source: JICA Study Team

The Project for Lahore Urban Transport Master Plan in the Islamic Republic of Pakistan (Phase II)
FINAL REPORT: VOLUME – I of II CHAPTER 3 – URBAN DEVELOPMENT CONTEXT
3-41
Figure 3.2.9 2020 Day-Time Forecast for Workers of All Employment Sectors by Each Scenario
Source: JICA Study Team
Figure 3.2.10 2030 Day-Time Forecast for Workers of All Employment Sectors by Each
Scenario
Source: JICA Study Team

The Project for Lahore Urban Transport Master Plan in the Islamic Republic of Pakistan (Phase II)
FINAL REPORT: VOLUME – I of II CHAPTER 3 – URBAN DEVELOPMENT CONTEXT
3-42
Table 3.2.10 Summary Forecast Result of Zonal Breakdown of Number of Workers (Primary Sector, Night-time and Day-time, ‘000)
No. Town/ Tehsil in the Study Area 2010
2020 2030
Scenario I
Scenario II
Scenario III
Scenario I
Scenario II
Scenario III
1 Ravi 5 3 3 3 1 1 1
2 Data Gunj Baksh 3 2 2 2 - - -
3 Samanabad 4 2 2 2 1 1 1 4 Shalamar 3 2 2 2 0 0 0 5 Gulberg 3 2 2 2 - - - 6 AzizB 5 4 4 4 2 2 3 7 Wagah 27 26 28 28 27 30 29 8 Nishter 27 24 24 25 22 22 24 9 Iqbal 18 16 16 17 14 13 15
10 Cantt 8 5 5 5 2 2 2 11 Ferozewala 27 27 26 28 29 27 31 12 Muridke 12 13 13 11 14 14 10 13 Sharaqpur 16 16 16 17 18 18 19 14 Kasur 8 9 9 8 9 9 8 15 Patoki 14 14 14 12 15 16 11
1-10 Lahore 103 85 86 88 70 71 75 11-13 Sheikhupura 54 56 55 56 60 59 60 14-15 Kasur 22 23 23 20 25 25 19
1-15 The Study Area 179 164 164 164 154 154 154
Source: JICA Study Team
Table 3.2.11 Summary Forecast Result of Zonal Breakdown of Number of Workers (Secondary Sector, Night-time, ‘000)
No. Town/ Tehsil in the Study Area 2010
2020 2030
Scenario I
Scenario II
Scenario III
Scenario I
Scenario II
Scenario III
1 Ravi 40 52 53 56 71 71 77
2 Data Gunj Baksh 32 45 45 48 64 64 70
3 Samanabad 40 54 55 58 75 76 82 4 Shalamar 36 42 42 45 53 53 58 5 Gulberg 23 34 38 40 49 57 62 6 AzizB 24 48 33 35 78 47 51 7 Wagah 29 67 50 53 113 77 83 8 Nishter 53 200 206 152 377 390 272 9 Iqbal 39 108 106 80 193 187 130
10 Cantt 29 51 49 52 81 76 83 11 Ferozewala 33 72 98 105 121 177 193 12 Muridke 13 29 29 62 48 48 120 13 Sharaqpur 5 5 5 5 6 6 6 14 Kasur 5 5 5 15 6 6 28 15 Patoki 6 6 6 15 7 7 25
1-10 Lahore 343 702 676 617 1152 1096 968 11-13 Sheikhupura 51 106 132 172 174 231 319 14-15 Kasur 11 11 11 30 13 13 53 1-15 The Study Area 405 819 819 819 1339 1339 1339
Source: JICA Study Team

The Project for Lahore Urban Transport Master Plan in the Islamic Republic of Pakistan (Phase II)
FINAL REPORT: VOLUME – I of II CHAPTER 3 – URBAN DEVELOPMENT CONTEXT
3-43
Table 3.2.12 Summary Forecast Result of Zonal Breakdown of Number of Workers (Secondary Sector, Day-time, ‘000)
No. Town/ Tehsil in the Study
Area 2010
2020 2030
Scenario I
Scenario II
Scenario III
Scenario I
Scenario II
Scenario III
1 Ravi 49 66 97 97 91 158 158
2 Data Gunj Baksh 47 72 93 93 107 151 151
3 Samanabad 28 39 56 54 56 90 88 4 Shalamar 27 36 54 54 48 88 88 5 Gulberg 35 55 67 69 81 108 112 6 AzizB 15 29 30 30 47 48 48 7 Wagah 28 67 56 56 114 91 91 8 Nishter 41 152 82 82 283 134 133 9 Iqbal 56 161 122 121 288 203 203
10 Cantt 33 56 63 63 86 100 100 11 Ferozewala 23 48 55 55 80 95 95 12 Muridke 11 26 23 23 44 37 37 13 Sharaqpur 3 3 6 6 4 10 10 14 Kasur 4 4 8 8 5 13 13 15 Patoki 5 5 10 10 6 16 16
1-10 Lahore 358 732 718 718 1200 1170 1170 11-13 Sheikhupura 37 78 84 84 128 141 141 14-15 Kasur 9 9 18 18 11 28 28
1-15 The Study Area 404 819 819 819 1339 1339 1339
Source: JICA Study Team
Table 3.2.13 Summary Forecast Result of Zonal Breakdown of Number of Workers (Tertiary Sector, Night-time, ‘000)
No. Town/ Tehsil in the Study
Area 2010
2020 2030
Scenario I
Scenario II
Scenario III
Scenario I
Scenario II
Scenario III
1 Ravi 248 223 222 223 201 199 201
2 Data Gunj Baksh 227 214 213 214 206 203 205
3 Samanabad 232 220 219 220 213 210 212 4 Shalamar 197 173 173 173 153 151 152 5 Gulberg 191 192 209 210 199 234 236 6 AzizB 147 193 146 147 249 152 153 7 Wagah 111 173 136 137 243 166 168 8 Nishter 171 394 415 283 640 684 409 9 Iqbal 195 389 385 286 606 598 390
10 Cantt 185 249 220 221 323 263 265 11 Ferozewala 87 175 258 260 273 448 452 12 Muridke 44 54 53 125 65 64 213 13 Sharaqpur 18 21 21 21 25 24 25 14 Kasur 27 33 33 108 41 40 197 15 Patoki 28 38 38 114 50 50 209
1-10 Lahore 1902 2419 2337 2113 3031 2859 2390 11-13 Sheikhupura 149 249 332 406 362 536 689 14-15 Kasur 54 71 71 221 91 90 405
1-15 The Study Area 2105 2740 2740 2740 3485 3485 3485
Source: JICA Study Team

The Project for Lahore Urban Transport Master Plan in the Islamic Republic of Pakistan (Phase II)
FINAL REPORT: VOLUME – I of II CHAPTER 3 – URBAN DEVELOPMENT CONTEXT
3-44
Table 3.2.14 Summary Forecast Result of Zonal Breakdown of Number of Workers (Tertiary Sector, Day-time, ‘000)
No. Town/ Tehsil in the Study Area 2010
2020 2030 Scenario
I Scenario
II Scenario
III Scenario
I Scenario
II Scenario
III 1 Ravi 272 352 343 343 449 430 430 2 Data Gunj Baksh 400 518 527 527 661 680 680 3 Samanabad 188 243 237 237 310 297 297 4 Shalamar 127 165 161 161 211 202 202 5 Gulberg 285 370 371 371 472 473 473 6 AzizB 91 117 114 114 149 143 143 7 Wagah 84 109 106 106 139 133 133 8 Nishter 130 168 164 164 214 205 205 9 Iqbal 223 288 281 281 368 352 352
10 Cantt 169 208 203 203 255 244 244 11 Ferozewala 63 82 117 117 105 178 178 12 Muridke 37 48 47 47 61 58 58 13 Sharaqpur 14 18 17 17 23 22 22 14 Kasur 19 25 24 24 31 30 30 15 Patoki 24 31 30 30 39 38 38
1-10 Lahore 1966 2537 2505 2505 3226 3159 3159 11-13 Sheikhupura 114 148 181 181 188 258 258 14-15 Kasur 43 55 54 54 70 68 68 1-15 The Study Area 2123 2740 2740 2740 3485 3485 3485
Source: JICA Study Team
3.2.3 Number of Students
1) Ratio of Students in the Same Age Group and Number of Students
(i) Ratio of Students in the Same Age Group
Ratio of students (high school and above) in the same age group is shown in Table
3.2.15 by Town/ Tehsil. These Towns/ Tehsils were classified into three groups; A, B and
C. A is a group of high income and a number of high schools, universities, etc. are
located in the same Town/ Tehsil. C belongs to the area of relatively low income with
insufficient number of high-grade education facilities, and B comes in between A and C.
This grouping may change in the future depending on economic growth and location of
high-grade education facilities.
Table 3.2.15 Ratio of Students in the Same Age Group
No. Town/ Tehsil Ratio of Students (%) Group 1 Ravi 39.6 B 2 Data Gunj Baksh 48.8 A 3 Samanabad 44.7 B 4 Shalamar 51.6 A 5 Gulberg 56.6 A 6 Aziz Bhatti 47.8 A 7 Wagah 30.5 C 8 Nishtar 31.4 C 9 Iqbal 43.2 B 10 Cantonment 51.8 A 11 Ferozewala 27.3 C 12 Muridike 31.9 C 13 Sharaqpur 32.9 C

The Project for Lahore Urban Transport Master Plan in the Islamic Republic of Pakistan (Phase II)
FINAL REPORT: VOLUME – I of II CHAPTER 3 – URBAN DEVELOPMENT CONTEXT
3-45
No. Town/ Tehsil Ratio of Students (%) Group 14 Kasur 42.8 B 15 Pattoki 28.6 C
1-15 The Study Area 43.2 B Source: JICA Study Team
In the world, this ratio is as follows2:
United States 57.1 (2005) UK 52.4 (2006) Germany 51.5 (2006) France 56.2 (2006) Japan 67.1 (2008) Korea 116.7 (2007)
In Lahore, this ratio is almost comparable with developed countries reflecting the fact that
a lot of academic and educational facilities are accumulated in Lahore. Actually the ratio
is only 6.4 % for entire Pakistan (2008, United Nations Educational Scientific and Cultural
Organization (UNESCO)). This trend/ tradition should be maintained also in the future.
(ii) Future No. of Students
It is assumed that the upper limit of the ratio of students in the same age group will
become as follows by 2030:
Group A: 55 %
Group B: 44 % (80 % of Group A)
Group C: 35 % (80 % of Group B)
The population ratio of zones belonging to Group A, B and C is 5:2:3 at present and the
weighted average of the Study Area is calculated at 46.8 % for 2030 and 45.0 % for 2020.
Average growth rate is 1.8 % p.a. The result is given in Table 3.2.16.
Table 3.2.16 Forecast Number of Students for the Study Area
Description 2010 2020 2030 Population ('000) 9,928 12,925 16,429 Population of the Age Group ('000) 1,986 2,665 3,386 Ratio of Students in the Age Group 0.43 0.45 0.49 No. of Students ('000) 857 1,163 1,597
Source: JICA Study Team
2) Zonal Breakdown of Student Population
(i) No. of Students (Night-time)
The number of students residing in a zone is first estimated by multiplying population with
the present ratio of number of students to population. Then it is adjusted to the total of
the Study Area control total as predetermined above. The result is presented in
Table 3.2.17.
2 source: Ministry of Education and Science, Japan

The Project for Lahore Urban Transport Master Plan in the Islamic Republic of Pakistan (Phase II)
FINAL REPORT: VOLUME – I of II CHAPTER 3 – URBAN DEVELOPMENT CONTEXT
3-46
Table 3.2.17 Forecast Number of Students (‘000) by Town/ Tehsil (Night-time)
No. Town/ Tehsil in Study Area 2010
2020 2030 Scenario
I Scenario
II Scenario
III Scenario
I Scenario
II Scenario
III 1 Ravi 80 84 82 84 90 86 89 2 Data Gunj Baksh 95 102 99 101 111 106 110 3 Samanabad 102 112 109 112 128 122 126 4 Shalamar 82 83 81 82 84 81 83 5 Gulberg 88 106 113 115 130 148 153 6 AzizB 64 84 71 72 112 81 84 7 Wagah 40 57 46 47 81 56 58 8 Nishter 59 122 134 90 209 237 133 9 Iqbal 83 169 177 131 291 306 198 10 Cantt 86 129 114 117 190 154 160 11 Ferozewala 29 59 82 84 101 155 160 12 Muridke 17 20 19 40 24 23 73 13 Sharaqpur 7 8 8 8 9 9 9 14 Kasur 14 17 16 46 20 19 90 15 Patoki 12 14 13 37 17 16 72
1-10 Lahore 778 1046 1025 949 1426 1376 1194 11-13 Sheikhupura 53 87 109 132 135 186 242 14-15 Kasur 26 31 30 83 37 35 162 1-15 The Study Area 857 1163 1163 1163 1597 1597 1597
Source: JICA Study Team
(ii) Number of Students (day-time)
For Scenario 1, the number of students by zone was estimated by distributing the
predetermined total in proportion to the present number of students (daytime).
For Scenario 2 and 3, 40 thousand students were allocated to the academic town
proposed in Ferozewala. Then the rest was distributed to zones in proportion to the
present numbers. The result is summarized in Table 3.2.18.
Table 3.2.18 Forecast Number of Students (‘000) by Town/ Tehsil (Day-time)
No. Town/ Tehsil in Study Area 2010
2020 2030 Scenario
I Scenario
II Scenario
III Scenario
I Scenario
II Scenario
III 1 Ravi 54 59 59 61 65 64 68 2 Data Gunj Baksh 186 212 214 221 249 247 261 3 Samanabad 136 155 156 161 181 180 190 4 Shalamar 66 69 70 72 74 74 78 5 Gulberg 129 154 163 168 189 204 216 6 AzizB 33 44 37 38 61 42 44 7 Wagah 26 44 31 32 70 37 39 8 Nishter 38 88 94 63 157 167 96 9 Iqbal 75 160 164 114 277 280 166
10 Cantt 63 111 94 97 180 134 141 11 Ferozewala 15 29 42 44 48 121 126 12 Muridke 14 16 16 30 19 19 52 13 Sharaqpur 5 5 6 6 7 6 7 14 Kasur 6 7 7 23 8 8 47 15 Patoki 11 12 13 35 15 15 69
1-10 Lahore 806 1094 1081 1027 1501 1428 1297 11-13 Sheikhupura 33 50 64 79 74 147 184 14-15 Kasur 16 19 19 58 23 22 116 1-15 The Study Area 855 1163 1163 1163 1597 1597 1597
Source: JICA Study Team
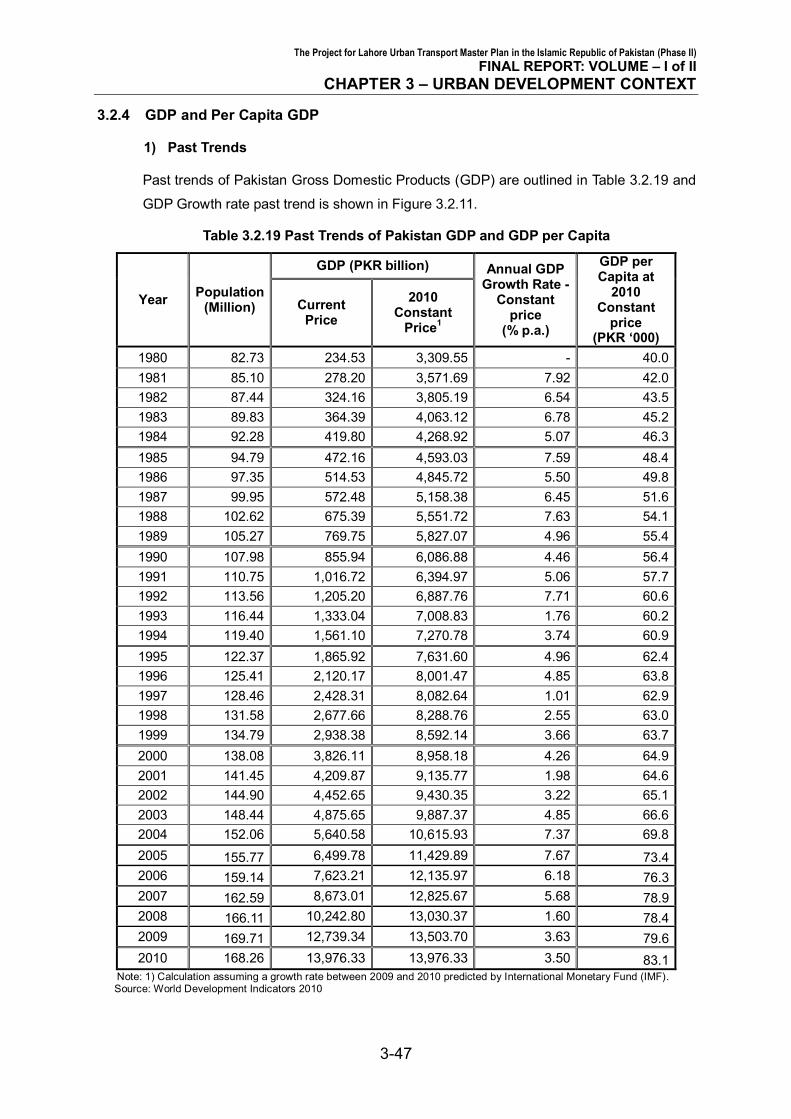
The Project for Lahore Urban Transport Master Plan in the Islamic Republic of Pakistan (Phase II)
FINAL REPORT: VOLUME – I of II CHAPTER 3 – URBAN DEVELOPMENT CONTEXT
3-47
3.2.4 GDP and Per Capita GDP
1) Past Trends
Past trends of Pakistan Gross Domestic Products (GDP) are outlined in Table 3.2.19 and
GDP Growth rate past trend is shown in Figure 3.2.11.
Table 3.2.19 Past Trends of Pakistan GDP and GDP per Capita
Year Population (Million)
GDP (PKR billion) Annual GDP Growth Rate -
Constant price
(% p.a.)
GDP per Capita at
2010 Constant
price (PKR ‘000)
Current Price
2010 Constant
Price1
1980 82.73 234.53 3,309.55 - 40.0 1981 85.10 278.20 3,571.69 7.92 42.0 1982 87.44 324.16 3,805.19 6.54 43.5 1983 89.83 364.39 4,063.12 6.78 45.2 1984 92.28 419.80 4,268.92 5.07 46.3 1985 94.79 472.16 4,593.03 7.59 48.4 1986 97.35 514.53 4,845.72 5.50 49.8 1987 99.95 572.48 5,158.38 6.45 51.6 1988 102.62 675.39 5,551.72 7.63 54.1 1989 105.27 769.75 5,827.07 4.96 55.4 1990 107.98 855.94 6,086.88 4.46 56.4 1991 110.75 1,016.72 6,394.97 5.06 57.7 1992 113.56 1,205.20 6,887.76 7.71 60.6 1993 116.44 1,333.04 7,008.83 1.76 60.2 1994 119.40 1,561.10 7,270.78 3.74 60.9 1995 122.37 1,865.92 7,631.60 4.96 62.4 1996 125.41 2,120.17 8,001.47 4.85 63.8 1997 128.46 2,428.31 8,082.64 1.01 62.9 1998 131.58 2,677.66 8,288.76 2.55 63.0 1999 134.79 2,938.38 8,592.14 3.66 63.7 2000 138.08 3,826.11 8,958.18 4.26 64.9 2001 141.45 4,209.87 9,135.77 1.98 64.6 2002 144.90 4,452.65 9,430.35 3.22 65.1 2003 148.44 4,875.65 9,887.37 4.85 66.6 2004 152.06 5,640.58 10,615.93 7.37 69.8 2005 155.77 6,499.78 11,429.89 7.67 73.4 2006 159.14 7,623.21 12,135.97 6.18 76.3 2007 162.59 8,673.01 12,825.67 5.68 78.9 2008 166.11 10,242.80 13,030.37 1.60 78.4 2009 169.71 12,739.34 13,503.70 3.63 79.6 2010 168.26 13,976.33 13,976.33 3.50 83.1
Note: 1) Calculation assuming a growth rate between 2009 and 2010 predicted by International Monetary Fund (IMF). Source: World Development Indicators 2010

The Project for Lahore Urban Transport Master Plan in the Islamic Republic of Pakistan (Phase II)
FINAL REPORT: VOLUME – I of II CHAPTER 3 – URBAN DEVELOPMENT CONTEXT
3-48
As seen in the table, Pakistan economy has been growing. However, the growth has not
been stable and has been fluctuating year to year. Although average growth rate was
4.9% between 1972 and 2010, it has declined recently (Pakistan: Framework for
Economic Growth, April 2011, Planning Commission).
Figure 3.2.11 Past Trends - Growth Rate at Constant Price (% of Per Annum)
-
1
2
3
4
5
6
7
8
9
1980
1981
1982
1983
1984
1985
1986
1987
1988
1989
1990
1991
1992
1993
1994
1995
1996
1997
1998
1999
2000
2001
2002
2003
2004
2005
2006
2007
2008
2009
Grow
th R
ate
-Con
stan
t Pric
e (%
p.a)
Years
Source: World Development Indicators, WB 2010
As for the Punjab, Lahore District as well as the Study Area, there is no GDP or GRDP
statistics available. However, Price Water House Coopers of UK estimated 2008 GDP of
Lahore in purchasing power parity (PPP) at USD 40 billion using population and income
statistics available for Lahore and other similar cities (Economic Outlook, Nov. 2009). In
this estimate, “Lahore” means urban agglomeration of Lahore based on UN definition,
and this is almost comparable to the Study Area.
We estimated 2010 GDP of the Study Area at about PKR 1,341 billion or USD 17 billion
at 2010 constant prices using GDP growth between 2008 and 2010 and the ratio between
PPP and 2010 constant price basis estimated by IMF (2010 Economic Outlook).
2) GDP Projections
In the absence of available data and considerable fluctuation of economy in the past, it is
difficult to forecast future GDP. In order to forecast GDP and GDP per Capita in the future
both for Pakistan and the Study Area, the following assumption were introduced:
A. For entire Pakistan, between 2010 and 2015, the forecast of IMF’s 2010 economic
outlook was referred. This assumes the following growth rates:
2010-11: 2.8 %
2011-12: 4.0 % 2012-13: 5.0 %

The Project for Lahore Urban Transport Master Plan in the Islamic Republic of Pakistan (Phase II)
FINAL REPORT: VOLUME – I of II CHAPTER 3 – URBAN DEVELOPMENT CONTEXT
3-49
2013-14: 5.5 % 2014-15: 6.0 %
2.8 % of 2010-11 is the same as the Planning Commission’s “Pakistan Economic
Outlook, Feb. 2011”. In this Study, these rates were taken and for 2016 and after, it
were assumed that the growth rate would be constant at 6.0 %. Then the average
growth for 2010-30 is 5.7 %. This is comparable to the forecast of Price Water House
Coopers at 5.6 % for 2008-25 (Economic Outlook, Nov. 2009).
B. For Lahore or the Study Area, no reference is exists as to GDP. Thus it was assumed
that the 2010 GDP of Lahore estimated above would grow in parallel to national
economy with slightly higher rate due to higher population increase.
The result is presented in Table 3.2.20 below. It should be noted that this is just an
approximation on most likely basis. However, this indicative estimate provides a relatively
good basis for transport demand forecast.
Table 3.2.20 Projected GDP and GDP per Capita for Pakistan and the Study Area
Year Population
(million)
Assumed GDP Growth Rate
(% p.a.)
GDP at 2010 Constant Price (PKR billion)
GDP per Capita at 2010 Constant
Price (PKR ‘000)
Pakistan LUTMP Pakistan LUTMP Pakistan LUTMP Pakistan LUTMP 2010 168.26 9.93 - - 13,976 1,341 83.1 135.1 2011 171.84 10.20 2.8 2.81 14,368 1,387 83.6 136.0 2012 175.50 10.48 4.0 4.01 14,942 1,451 85.1 138.4 2013 179.24 10.77 5.0 5.01 15,689 1,532 87.5 142.3 2014 183.06 11.06 5.5 5.52 16,552 1,626 90.4 147.0 2015 186.96 11.36 6.0 6.02 17,546 1,734 93.8 152.6 2016 190.75 11.66 6.0 6.02 18,598 1,848 97.5 158.5 2017 194.62 11.96 6.0 6.02 19,714 1,970 101.3 164.7 2018 198.58 12.28 6.0 6.02 20,897 2,101 105.2 171.1 2019 202.61 12.60 6.0 6.02 22,151 2,239 109.3 177.8 2020 206.72 12.93 6.0 6.02 23,480 2,387 113.6 184.7 2021 210.69 13.25 6.0 6.01 24,889 2,545 118.1 192.1 2022 214.73 13.58 6.0 6.01 26,382 2,712 122.9 199.8 2023 218.86 13.91 6.0 6.01 27,965 2,891 127.8 207.8 2024 223.06 14.26 6.0 6.01 29,643 3,081 132.9 216.1 2025 227.34 14.61 6.0 6.01 31,421 3,284 138.2 224.7 2026 231.48 14.96 6.0 6.01 33,307 3,500 143.9 234.0 2027 235.69 15.31 6.0 6.01 35,305 3,730 149.8 243.6 2028 239.98 15.68 6.0 6.01 37,423 3,975 155.9 253.6 2029 244.35 16.05 6.0 6.01 39,669 4,237 162.3 264.0 2030 248.80 16.43 6.0 6.01 42,049 4,515 169.0 274.8
Source: JICA Study Team
The Project for Lahore Urban Transport Master Plan in the Islamic Republic of Pakistan (Phase II)
FINAL REPORT: VOLUME – I of II CHAPTER 3 – URBAN DEVELOPMENT CONTEXT
3-50
3) Zonal Breakdown
For distributing the estimated Study Area GDP to traffic zones, the following procedure
was adopted:
1. Development of regression equation to estimate average per capita GDP by zone
based on sector distribution of employment. Using WDIs from 1980 to 2007 for
entire Pakistan, the following equation was developed:
y = c1 * p1 + c2 * p2 + c3 * p3 + c4
Where,
y: GDP per capita (PKR/person)
p1-p3: employment composition of the Primary, Second and Tertiary sectors (%)
c1-c4: parameters be determined by regression
The values of these parameters were estimated by least square regression method
as:
c1: 10,233.9 (1.216)
c2: 11,046.6 (1.295)
c3: 12,467.9 (1.515)
c4: -1,050,940.8 (-1.257)
Correlation Coefficient R2 = 0.82; and
figures in parenthesis give the (t-statistics); indicating that there is
good correlation and all parameters are statistically significant.
2. Using worker’s sectoral composition by zone, per capita GDP was calculated by the
above equation for each zone. For 2010, the result of HIS was used, and for 2020
and 2030, the estimated values described in previous sections were used.
3. By multiplying population with per capita GDP is estimated as above, GDP was
calculated by zone. The total of these values, however, is slightly different from the
GDP estimated earlier for the Study Area.
4. To keep consistency, the total GDP of the Study Area was distributed to zones in
proportion to the value by zone calculated in 3 above.
The results are presented in Tables 3.2.21, 3.2.22 and 3.2.23 for 2010, 2020 and 2030,
respectively.

The Project for Lahore Urban Transport Master Plan in the Islamic Republic of Pakistan (Phase II)
FINAL REPORT: VOLUME – I of II CHAPTER 3 – URBAN DEVELOPMENT CONTEXT
3-51
Table 3.2.21 2010 Estimated GDP and GDP per Capita by Town/Tehsil
No. Town/ Tehsil in the Study Area
Population ('000)
GDP (PKR,
billion)
GDP per Capita
(PKR, 000) 1 Ravi 1007 148 146.7 2 Data Gunj Baksh 970 145 149.4 3 Samanabad 984 144 146.3 4 Shalamar 854 125 145.2 5 Gulberg 778 119 152.2 6 AzizB 667 96 143.3 7 Wagah 656 75 112.9 8 Nishter 945 114 120.0 9 Iqbal 960 128 133.0
10 Cantt 831 120 144.0 11 Ferozewala 534 57 105.1 12 Muridke 266 30 110.9 13 Sharaqpur 101 8 73.7 14 Kasur 168 19 110.9 15 Patoki 207 20 95.5
1-10 Lahore 8,653 1,210 139.8 11-13 Sheikhupura 901 94 103.3 14-15 Kasur 375 39 102.4 1-15 The Study Area 9928 1341 135.1
Source: JICA Study Team

The Project for Lahore Urban Transport Master Plan in the Islamic Republic of Pakistan (Phase II)
FINAL REPORT: VOLUME – I of II CHAPTER 3 – URBAN DEVELOPMENT CONTEXT
3-52
Scen
ario
ISc
enar
io II
Scen
ario
III
Scen
ario
ISc
enar
io II
Scen
ario
III
Scen
ario
ISc
enar
io II
Scen
ario
III
1R
avi
978
971
976
194
192
192
197.
419
7.4
195.
92
Dat
a G
unj B
aksh
968
961
966
195
194
193
201.
120
1.1
199.
63
Sam
anab
ad99
098
398
819
519
419
319
6.5
196.
419
4.9
4S
hala
mar
790
784
788
156
155
154
196.
819
6.7
195.
35
Gul
berg
850
926
931
175
190
190
204.
920
4.7
203.
36
Azi
zB90
168
669
017
613
513
419
4.8
195.
719
4.1
7W
agah
881
713
717
144
113
113
162.
915
8.1
157
8N
isht
er19
0620
0713
9932
034
022
816
7.7
169.
216
2.6
9Iq
bal
1840
1824
1366
347
345
254
188.
518
918
5.8
10C
antt
1149
1018
1024
230
201
201
199.
719
7.2
195.
711
Fero
zew
ala
883
1268
1275
145
218
216
163.
117
1.9
168.
812
Mur
idke
284
282
609
4241
102
145.
114
4.6
166.
513
Sha
raqp
ur10
810
710
713
1212
112.
811
2.3
110.
414
Kas
ur17
917
752
030
3010
216
6.9
166.
519
615
Pat
oki
221
219
568
3434
109
152
151.
519
1.6
1-10
Laho
re11
252
1087
398
4621
2720
5418
4818
918
8.9
187.
711
-13
Shei
khup
ura
1274
1656
1992
198
271
329
154.
916
3.4
165
14-1
5Ka
sur
399
397
1088
6463
211
158.
615
8.2
193.
71-
15LU
TMP
Stud
y Ar
ea12
925
1292
512
925
2387
2387
2387
184.
718
4.7
184.
7
No.
Tow
n/ T
ehsi
l in
LUTM
PSt
udy
Area
Popu
latio
n ('0
00)
GDP
(PKR
bill
ion)
GEP
per
Cap
ita (P
KR '0
00)
Tabl
e 3.
2.22
202
0 Pr
ojec
ted
GD
P an
d G
DP
per C
apita
by
Tow
n/Te
hsil
Sou
rce:
JIC
A St
udy
Team

The Project for Lahore Urban Transport Master Plan in the Islamic Republic of Pakistan (Phase II)
FINAL REPORT: VOLUME – I of II CHAPTER 3 – URBAN DEVELOPMENT CONTEXT
3-53
Scen
ario
ISc
enar
io II
Scen
ario
III
Scen
ario
ISc
enar
io II
Scen
ario
III
Scen
ario
ISc
enar
io II
Scen
ario
III
1R
avi
949
938
947
272
268
266
285.
728
528
0.3
2D
ata
Gun
j Bak
sh97
095
896
728
428
027
829
2.3
291.
628
7.2
3S
aman
abad
1002
990
999
286
282
280
285.
128
4.4
279.
74
Sha
lam
ar72
071
171
720
620
320
228
6.2
285.
428
0.7
5G
ulbe
rg93
711
0211
1228
333
433
230
1.9
302.
229
8.2
6A
zizB
1175
714
721
339
207
205
288.
628
8.5
283.
97
Wag
ah11
4578
479
228
418
618
524
823
6.6
233.
38
Nis
hter
3017
3226
1927
764
828
469
253.
125
6.5
243.
49
Iqba
l28
5728
1818
3881
680
851
328
5.3
286.
527
9.1
10C
antt
1521
1240
1251
460
366
365
302.
129
5.1
291.
111
Fero
zew
ala
1288
2110
2130
331
568
560
256.
426
926
2.7
12M
urid
ke30
530
210
0566
6426
021
321
1.8
258.
313
Sha
raqp
ur11
611
411
521
2120
178.
917
7.2
171.
314
Kas
ur19
219
092
751
5028
526
3.6
262.
530
6.6
15P
atok
i23
823
598
359
5830
224
6.7
245.
430
6.7
1-10
Laho
re14
291
1347
911
270
3990
3756
3091
279.
227
8.6
274.
211
-13
Shei
khup
ura
1708
2526
3250
416
652
839
243.
425
825
8.1
14-1
5Ka
sur
430
424
1910
110
108
586
254.
325
330
6.7
1-15
LUTM
P St
udy
Area
1642
916
429
1642
945
1545
1545
1527
4.8
274.
827
4.8
No.
Tow
n/ T
ehsi
l in
LUTM
PSt
udy
Area
Popu
latio
n ('0
00)
GDP
(PKR
bill
ion)
GEP
per
Cap
ita (P
KR '0
00)
Tabl
e 3.
2.23
203
0 Pr
ojec
ted
GD
P an
d G
DP
per C
apita
by
Tow
n/Te
hsil
Sou
rce:
JIC
A St
udy
Team
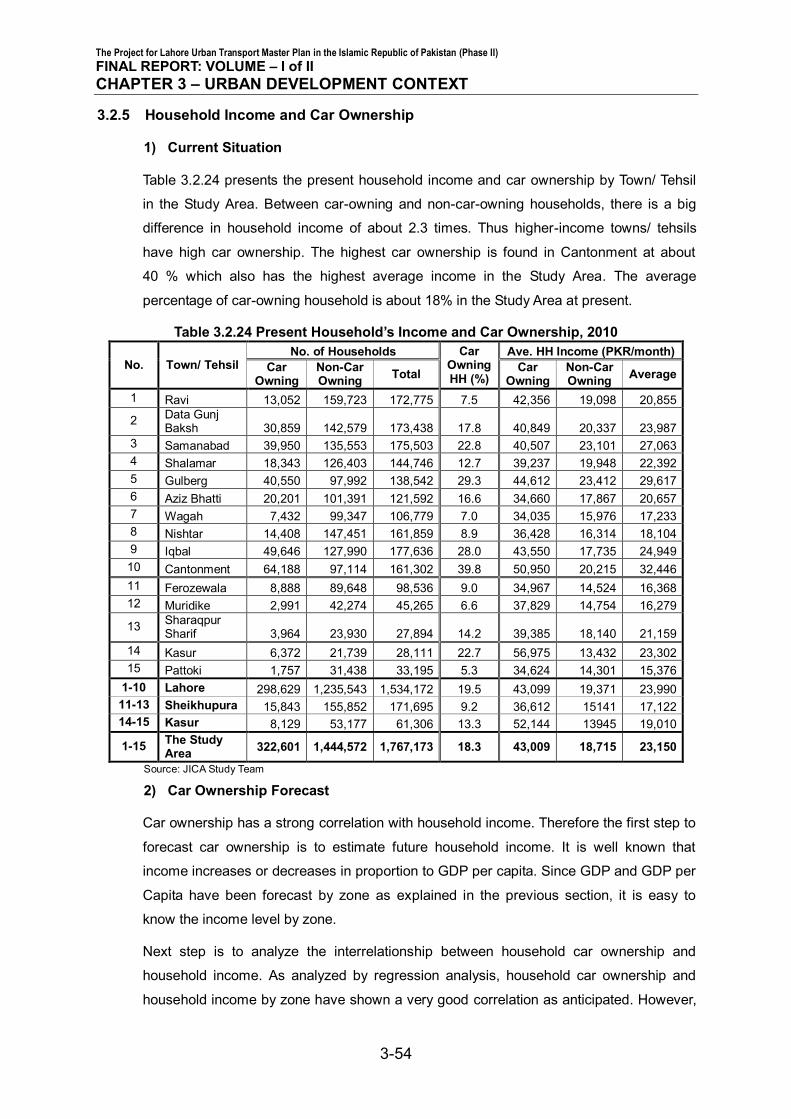
The Project for Lahore Urban Transport Master Plan in the Islamic Republic of Pakistan (Phase II)
FINAL REPORT: VOLUME – I of II CHAPTER 3 – URBAN DEVELOPMENT CONTEXT
3-54
3.2.5 Household Income and Car Ownership
1) Current Situation
Table 3.2.24 presents the present household income and car ownership by Town/ Tehsil
in the Study Area. Between car-owning and non-car-owning households, there is a big
difference in household income of about 2.3 times. Thus higher-income towns/ tehsils
have high car ownership. The highest car ownership is found in Cantonment at about
40 % which also has the highest average income in the Study Area. The average
percentage of car-owning household is about 18% in the Study Area at present.
Table 3.2.24 Present Household’s Income and Car Ownership, 2010
No. Town/ Tehsil No. of Households Car
Owning HH (%)
Ave. HH Income (PKR/month) Car
Owning Non-Car Owning Total Car
Owning Non-Car Owning Average
1 Ravi 13,052 159,723 172,775 7.5 42,356 19,098 20,855
2 Data Gunj Baksh 30,859 142,579 173,438 17.8 40,849 20,337 23,987
3 Samanabad 39,950 135,553 175,503 22.8 40,507 23,101 27,063 4 Shalamar 18,343 126,403 144,746 12.7 39,237 19,948 22,392 5 Gulberg 40,550 97,992 138,542 29.3 44,612 23,412 29,617 6 Aziz Bhatti 20,201 101,391 121,592 16.6 34,660 17,867 20,657 7 Wagah 7,432 99,347 106,779 7.0 34,035 15,976 17,233 8 Nishtar 14,408 147,451 161,859 8.9 36,428 16,314 18,104 9 Iqbal 49,646 127,990 177,636 28.0 43,550 17,735 24,949 10 Cantonment 64,188 97,114 161,302 39.8 50,950 20,215 32,446 11 Ferozewala 8,888 89,648 98,536 9.0 34,967 14,524 16,368 12 Muridike 2,991 42,274 45,265 6.6 37,829 14,754 16,279
13 Sharaqpur Sharif 3,964 23,930 27,894 14.2 39,385 18,140 21,159
14 Kasur 6,372 21,739 28,111 22.7 56,975 13,432 23,302 15 Pattoki 1,757 31,438 33,195 5.3 34,624 14,301 15,376
1-10 Lahore 298,629 1,235,543 1,534,172 19.5 43,099 19,371 23,990 11-13 Sheikhupura 15,843 155,852 171,695 9.2 36,612 15141 17,122 14-15 Kasur 8,129 53,177 61,306 13.3 52,144 13945 19,010
1-15 The Study Area 322,601 1,444,572 1,767,173 18.3 43,009 18,715 23,150
Source: JICA Study Team
2) Car Ownership Forecast
Car ownership has a strong correlation with household income. Therefore the first step to
forecast car ownership is to estimate future household income. It is well known that
income increases or decreases in proportion to GDP per capita. Since GDP and GDP per
Capita have been forecast by zone as explained in the previous section, it is easy to
know the income level by zone.
Next step is to analyze the interrelationship between household car ownership and
household income. As analyzed by regression analysis, household car ownership and
household income by zone have shown a very good correlation as anticipated. However,

The Project for Lahore Urban Transport Master Plan in the Islamic Republic of Pakistan (Phase II)
FINAL REPORT: VOLUME – I of II CHAPTER 3 – URBAN DEVELOPMENT CONTEXT
3-55
this analysis tends to lead very high forecast. Because all the zones have the same
weight in this analysis regardless of the size of zones. Hence, the following equation was
selected to forecast the future car ownership.
NC = 0.0000109 HI – 705.308
Where, NC: No. of cars by zone
HI: Total Household Income by zone
(R2=0.69, T-statistics: 21.6 for HI and -7.3 for Constant)
In addition, for extremely densely built-up 8 zones located in the center of the city, car
ownership rate was assumed to remain stable, and for other densely built-up 17 zones,
car ownership was assumed to grow only by 5 % and 10 % for 2020 and 2030,
respectively.
The result of forecast is shown in Table 3.2.25 to 3.2.30 for 2020 and 2030 by urban
development scenario and illustrated in Figure 3.2.12 for the three urban development
scenarios. Car ownership by Household will increase from 18 % in 2010 to 29-30 % and
43-45 % in 2020 and 2030, respectively.
Table 3.2.25 Household Income and Car Ownership, 2020 Scenario-I
No. Town/ Tehsil in the Study
Area
No. of Households Car Owning
HH (%)
Ave. HH Income (PKR/month)
Car Owning
Non-Car Owning Total Car
Owning Non-Car Owning Average
1 Ravi 29,648 137,496 167,144 17.7 48,385 23,716 28,092
2 Data Gunj Baksh 57,080 115,931 173,012 33.0 48,129 24,355 32,199
3 Samanabad 69,691 103,845 173,537 40.2 48,545 28,228 36,387 4 Shalamar 33,825 100,120 133,945 25.3 47,258 24,549 30,284 5 Gulberg 58,728 82,369 140,830 41.7 54,878 26,748 38,529 6 AzizB 44,745 112,869 157,614 28.4 46,256 22,442 29,202 7 Wagah 32,182 108,870 141,052 22.8 44,584 19,644 25,334 8 Nishter 72,150 242,613 314,763 22.9 44,938 19,685 25,473 9 Iqbal 86,361 208,907 294,943 29.3 63,753 27,270 37,983
10 Cantt 92,215 132,292 224,507 41.1 63,048 24,687 43,397 11 Ferozewala 32,946 128,259 161,204 20.4 46,199 20,182 25,499 12 Muridke 8,413 35,471 43,572 19.3 45,035 16,663 22,260 13 Sharaqpur 9,361 20,362 29,724 31.5 55,777 24,854 34,593 14 Kasur 7,566 22,389 29,955 25.3 70,066 18,918 34,749 15 Patoki 4,910 30,463 35,372 13.9 54,450 21,615 26,172
1-10 Lahore 576,627 1,345,313 1,921,347 30.0 52,858 23,853 32,918 11-13 Sheikhupura 50,720 184,092 234,500 21.6 47,774 20,021 26,050 14-15 Kasur 12,476 52,852 65,327 19.1 63,921 20,473 30,105
1-15 The Study Area 639,823 1,582,256 2,221,175 28.8 52,649 23,280 32,108
Source: JICA Study Team

The Project for Lahore Urban Transport Master Plan in the Islamic Republic of Pakistan (Phase II)
FINAL REPORT: VOLUME – I of II CHAPTER 3 – URBAN DEVELOPMENT CONTEXT
3-56
Table 3.2.26 Household Income and Car Ownership, 2020 Scenario-II
No. Town/ Tehsil in the Study
Area
No. of Households Car Owning
HH (%)
Ave. HH Income (PKR/month)
Car Owning
Non-Car Owning Total Car
Owning Non-Car Owning Average
1 Ravi 29,416 136,511 165,927 17.7 48,364 23,711 28,081
2 Data Gunj Baksh 56,788 114,964 171,752 33.1 48,093 24,335 32,190
3 Samanabad 69,349 102,924 172,273 40.3 48,505 28,197 36,372 4 Shalamar 33,601 99,369 132,970 25.3 47,235 24,539 30,274 5 Gulberg 60,726 93,129 153,587 39.5 54,861 25,381 37,081 6 AzizB 36,370 84,593 120,962 30.1 42,622 21,750 28,026 7 Wagah 25,479 90,619 116,098 21.9 39,623 19,806 24,155 8 Nishter 76,226 252,774 329,000 23.2 45,535 19,549 25,569 9 Iqbal 83,533 221,982 305,190 27.4 70,046 30,053 41,032 10 Cantt 84,854 112,909 197,763 42.9 64,367 24,984 45,183 11 Ferozewala 57,960 183,482 241,442 24.0 52,437 22,107 29,388 12 Muridke 8,314 35,253 43,255 19.2 44,815 16,641 22,177 13 Sharaqpur 9,254 20,254 29,507 31.4 55,484 24,752 34,390 14 Kasur 7,509 22,228 29,737 25.3 70,211 18,921 34,694 15 Patoki 4,811 30,304 35,115 13.7 54,303 21,582 26,065
1-10 Lahore 556,342 1,309,772 1,865,522 29.8 53,578 24,289 33,389 11-13 Sheikhupura 75,528 238988 314204 24.0 51,972 21,525 28,865 14-15 Kasur 12,319 52,532 64,851 19.0 63,999 20,456 30,021
1-15 The Study Area 644,189 1,601,293 2,244,578 28.7 53,570 23,738 32,658
Source: JICA Study Team
Table 3.2.27 Household Income and Car Ownership, 2020 Scenario-III
No. Town/ Tehsil in the Study
Area
No. of Households Car Owning
HH (%)
Ave. HH Income (PKR/month)
Car Owning
Non-Car Owning Total Car
Owning Non-Car Owning Average
1 Ravi 29,379 137,463 166,842 17.6 48,040 23,555 27,866
2 Data Gunj Baksh 56,734 115,965 172,699 32.9 47,862 24,185 31,964
3 Samanabad 69,247 103,977 173,223 40.0 48,201 28,012 36,083 4 Shalamar 33,577 100,126 133,704 25.1 46,953 24,381 30,050 5 Gulberg 60,685 94,017 154,435 39.3 54,552 25,248 36,807 6 AzizB 36,326 85,304 121,630 29.9 42,362 21,611 27,809 7 Wagah 25,412 91,326 116,739 21.8 39,470 19,658 23,971 8 Nishter 50,960 184,055 235,015 21.7 44,946 18,995 24,622 9 Iqbal 74,855 159,851 234,380 31.9 62,310 25,979 37,618 10 Cantt 84,751 114,103 198,854 42.6 64,091 24,840 44,883 11 Ferozewala 57,205 185,570 242,774 23.6 51,758 21,809 28,866 12 Muridke 21,488 70,615 91,791 23.4 51,061 17,807 25,652 13 Sharaqpur 9,146 20,524 29,670 30.8 54,676 24,420 33,747 14 Kasur 26,520 61,258 87,778 30.2 61,206 19,735 41,087 15 Patoki 28,539 62,994 91,534 31.2 72,443 22,971 38,396
1-10 Lahore 521,926 1,186,188 1,707,522 30.6 52,317 23,516 32,724 11-13 Sheikhupura 87,838 276709 364236 24.1 51,891 20,982 28,454 14-15 Kasur 55,059 124,253 179,312 30.7 67,031 21,375 39,713
1-15 The Study Area 664,823 1,587,150 2,251,069 29.5 53,466 22,891 32,592
Source: JICA Study Team

The Project for Lahore Urban Transport Master Plan in the Islamic Republic of Pakistan (Phase II)
FINAL REPORT: VOLUME – I of II CHAPTER 3 – URBAN DEVELOPMENT CONTEXT
3-57
Figure 3.2.12 2020 Percent of Car Owning Households for Three Scenarios
Source: JICA Study Team
Figure 3.2.13 2020 Average Household Monthly Income for Three Scenarios
Source: JICA Study Team

The Project for Lahore Urban Transport Master Plan in the Islamic Republic of Pakistan (Phase II)
FINAL REPORT: VOLUME – I of II CHAPTER 3 – URBAN DEVELOPMENT CONTEXT
3-58
Table 3.2.28 Household Income and Car Ownership, 2030 Scenario-I
No. Town/ Tehsil in the Study
Area
No. of Households Car Owning HH (%)
Ave. HH Income (PKR/month)
Car Owning
Non-Car Owning Total Car
Owning Non-Car Owning Average
1 Ravi 47,376 114,191 161,567 29.3 61,181 32,228 40,718
2 Data Gunj Baksh 83,113 90,319 173,432 47.9 62,539 31,949 46,609
3 Samanabad 101,160 73,817 174,977 57.8 64,336 37,399 52,972 4 Shalamar 49,663 72,604 122,268 40.6 60,929 32,259 43,904 5 Gulberg 84,680 70,790 155,203 54.6 73,789 35,570 56,484 6 AzizB 89,416 115,061 204,477 43.7 63,731 29,794 44,634 7 Wagah 68,466 112,617 181,083 37.8 61,094 25,490 38,952 8 Nishter 175,964 315,741 491,705 35.8 60,375 26,466 38,601 9 Iqbal 215,074 228,394 443,142 48.5 85,630 33,714 58,935
10 Cantt 149,386 148,758 298,144 50.1 82,872 31,293 64,086 11 Ferozewala 84,670 149,224 233,893 36.2 63,776 26,241 39,828 12 Muridke 15,404 31,783 46,876 32.9 60,453 20,739 33,928 13 Sharaqpur 16,280 15,697 31,977 50.9 79,497 34,123 57,224 14 Kasur 11,390 20,836 32,226 35.3 86,188 24,262 54,655 15 Patoki 12,008 26,046 38,054 31.6 74,094 29,738 43,735
1-10 Lahore 1,064,297 1,342,293 2,405,998 44.2 70,709 30,693 49,267 11-13 Sheikhupura 116,354 196704 312746 37.2 65,536 25,981 40,723 14-15 Kasur 23,398 46,883 70,280 33.3 79,981 27,304 48,742
1-15 The Study Area 1,204,049 1,585,879 2,789,025 43.2 70,365 29,980 48,293
Source: JICA Study Team
Table 3.2.29 Household Income and Car Ownership, 2030 Scenario-II
No. Town/ Tehsil in the Study
Area
No. of Households Car Owning
HH (%)
Ave. HH Income (PKR/month)
Car Owning
Non-Car Owning Total Car
Owning Non-Car Owning Average
1 Ravi 46,738 112,847 159,585 29.3 61,031 32,154 40,612
2 Data Gunj Baksh 82,173 89,132 171,305 48.0 62,385 31,861 46,503
3 Samanabad 100,047 72,784 172,831 57.9 64,154 37,276 52,835 4 Shalamar 49,046 71,722 120,768 40.6 60,780 32,172 43,790 5 Gulberg 92,078 90,996 182,807 50.4 73,630 31,466 52,750 6 AzizB 57,109 68,852 125,960 45.3 56,347 29,066 41,435 7 Wagah 49,364 78,275 127,639 38.7 52,095 25,881 36,019 8 Nishter 186,423 334,635 521,058 35.8 61,417 26,254 38,835 9 Iqbal 244,641 219,926 464,242 52.7 93,053 34,337 65,303
10 Cantt 126,773 113,960 240,733 52.7 85,726 31,322 68,420 11 Ferozewala 161,493 243,821 405,314 39.8 72,241 29,742 46,675 12 Muridke 15,146 31,467 46,301 32.7 60,043 20,672 33,691 13 Sharaqpur 15,989 15,596 31,585 50.6 78,784 33,881 56,612 14 Kasur 11,217 20,614 31,831 35.2 86,348 24,271 54,466 15 Patoki 11,731 25,856 37,588 31.2 73,843 29,657 43,447
1-10 Lahore 1,034,394 1,253,128 2,286,929 45.2 72,614 30,553 50,481 11-13 Sheikhupura 192,629 290,883 483,200 39.9 71,825 28,982 46,080 14-15 Kasur 22,948 46,470 9,418 33.1 79,955 27,267 48,499
1-15 The Study Area 1,249,971 1,590,481 2,839,548 44.0 72,607 30,144 49,684
Source: JICA Study Team
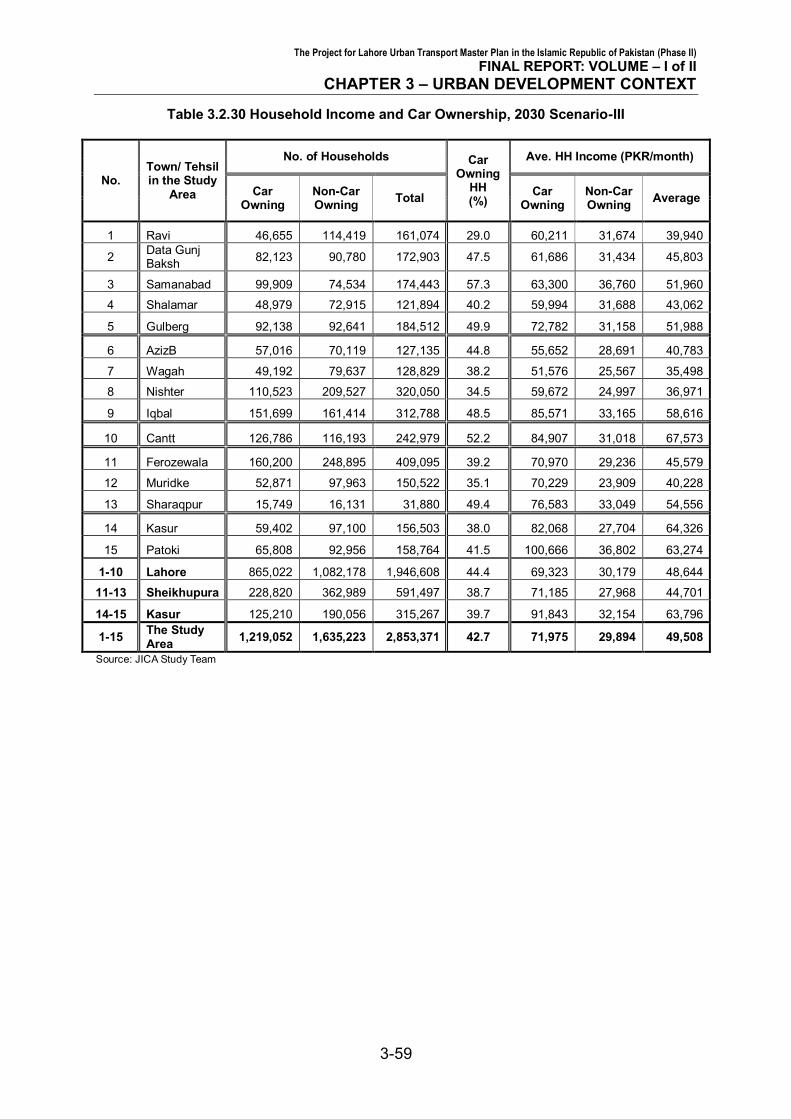
The Project for Lahore Urban Transport Master Plan in the Islamic Republic of Pakistan (Phase II)
FINAL REPORT: VOLUME – I of II CHAPTER 3 – URBAN DEVELOPMENT CONTEXT
3-59
Table 3.2.30 Household Income and Car Ownership, 2030 Scenario-III
No. Town/ Tehsil in the Study
Area
No. of Households Car Owning
HH (%)
Ave. HH Income (PKR/month)
Car Owning
Non-Car Owning Total Car
Owning Non-Car Owning Average
1 Ravi 46,655 114,419 161,074 29.0 60,211 31,674 39,940
2 Data Gunj Baksh 82,123 90,780 172,903 47.5 61,686 31,434 45,803
3 Samanabad 99,909 74,534 174,443 57.3 63,300 36,760 51,960
4 Shalamar 48,979 72,915 121,894 40.2 59,994 31,688 43,062
5 Gulberg 92,138 92,641 184,512 49.9 72,782 31,158 51,988
6 AzizB 57,016 70,119 127,135 44.8 55,652 28,691 40,783
7 Wagah 49,192 79,637 128,829 38.2 51,576 25,567 35,498
8 Nishter 110,523 209,527 320,050 34.5 59,672 24,997 36,971
9 Iqbal 151,699 161,414 312,788 48.5 85,571 33,165 58,616
10 Cantt 126,786 116,193 242,979 52.2 84,907 31,018 67,573
11 Ferozewala 160,200 248,895 409,095 39.2 70,970 29,236 45,579
12 Muridke 52,871 97,963 150,522 35.1 70,229 23,909 40,228
13 Sharaqpur 15,749 16,131 31,880 49.4 76,583 33,049 54,556
14 Kasur 59,402 97,100 156,503 38.0 82,068 27,704 64,326
15 Patoki 65,808 92,956 158,764 41.5 100,666 36,802 63,274
1-10 Lahore 865,022 1,082,178 1,946,608 44.4 69,323 30,179 48,644
11-13 Sheikhupura 228,820 362,989 591,497 38.7 71,185 27,968 44,701
14-15 Kasur 125,210 190,056 315,267 39.7 91,843 32,154 63,796
1-15 The Study Area 1,219,052 1,635,223 2,853,371 42.7 71,975 29,894 49,508
Source: JICA Study Team

The Project for Lahore Urban Transport Master Plan in the Islamic Republic of Pakistan (Phase II)
FINAL REPORT: VOLUME – I of II CHAPTER 3 – URBAN DEVELOPMENT CONTEXT
3-60
Figure 3.2.14 2030 Percent of Car Owning Households for Three Scenarios
Source: JICA Study Team
Figure 3.2.15 2030 Average Household Monthly Income for Three Scenarios
Source: JICA Study Team
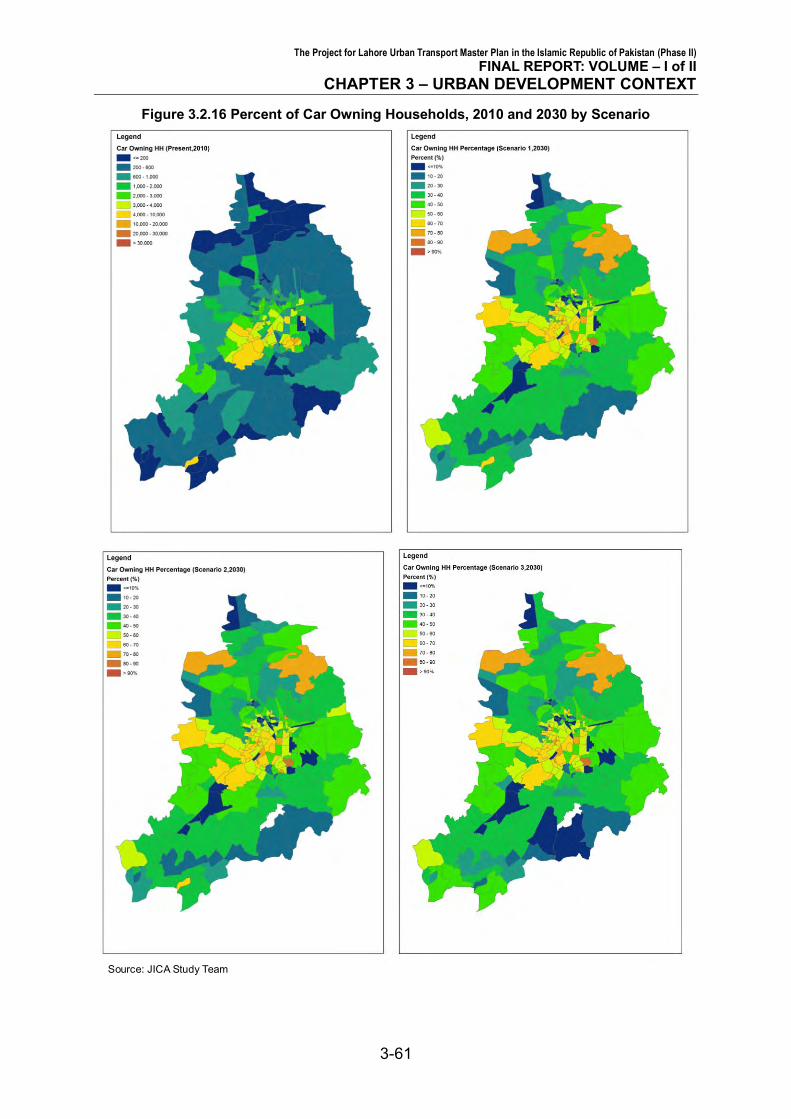
The Project for Lahore Urban Transport Master Plan in the Islamic Republic of Pakistan (Phase II)
FINAL REPORT: VOLUME – I of II CHAPTER 3 – URBAN DEVELOPMENT CONTEXT
3-61
Figure 3.2.16 Percent of Car Owning Households, 2010 and 2030 by Scenario
Source: JICA Study Team

The Project for Lahore Urban Transport Master Plan in the Islamic Republic of Pakistan (Phase II)
FINAL REPORT: VOLUME – I of II CHAPTER 3 – URBAN DEVELOPMENT CONTEXT
3-62
Figure 3.2.17 Average Household Monthly Income, 2010 and 2030 by Scenario
Source: JICA Study Team