changes in food crop diversification in...
TRANSCRIPT
33
CHANGES IN FOOD CROP DIVERSIFICATION IN INDONESIA
Masdjidin Siregar and Muhammad Suryadi
Indonesian Center for Agricultural Socio Economic Research and DevelopmentJl. A. Yani 70 Bogor 16161
INTRODUCTION
Background and Justification
After Indonesia’s economy was hit by the monetary crisis, the GDP’s growth rate was around 3.5 percent per year in 1999-2002. In 2002, unemployment rate was 9 percent with high growth rate of 19 percent in the period of 1992-2002. The proportion of population under poverty line was 18 percent in 2003; about 65 percent of them lived in rural areas. The present situation must be worse after the increase of oil prices since March 2005. Yet, agriculture is contributing 16 percent and 45 percent to the nation’s GDP and employment for labour force, respectively. The roles of agriculture in income generation, employment creation, and poverty alleviation would be significant for the near future.
During Indonesia’s 5th Year Plan (Pelita V) in 1989-1994, agricultural development put high priority on food crop diversification as an instrument for food and nutrition security, income growth, poverty alleviation, employment generation, cautious use of natural resources and sustainable development. In spite of the advantages of crop diversification, Karama et al. (1992) pointed out that there was no clear guideline for its implementation in Indonesia. Instead of diversifying food crops, the government has been enormously prioritising rice production to achieve rice self-sufficiency at the highest level. Consequently, development of CGPRT crops received low priority and food security in Indonesia relied on rice.
Agricultural census in 2003 indicated that 49 percent of total households in Indonesia earned their income from agriculture. About 71 percent of these agricultural households grew food crops (paddy and CGPRT crops), and around 39 percent of them grew CGPRT crops exclusively. Since most CGPRT crops are grown in less favourable land where soil fertility, land degradation, infrastructures and other supporting facilities are worse than those in irrigated lands, the proportion of people under poverty line in these unfavourable lands are higher than that in irrigated lands. This implies that, had the government prioritised the development of CGPRT crops in the past, poverty would have been expected to be lower and diversification of food crops would have improved as well.
34
Research Issues
The advantages of horizontal food crop diversification may include: (a) stabilize yields, (b) reduce pest and disease invasions and reduce the need for chemicals, (c) reduce risks (bio-physical and price risks), (d) potentially lead to greater economic benefits, (e) reduce dependency of food security on particular crop such as rice, and (f) encourage industrial use of CGPRT crops not only for producing food and feed but also for producing other possible products such as bio-fuel.
Factors promoting horizontal diversification are at both the demand and supply-side. The typical demand side factors are changes in income and consumer’s preference. On the supply sides, factors contributing to diversification are relative profitability, factor endowment and technological change. In general, the observed horizontal diversification is largely a demand-pull diversification (Pinggali and Rosegrant, 1995; and Joshi et al., 2003). Nevertheless, changes in income and taste need a relatively long time to take place since the two variables are dependent on economic development. Development of agro industries using secondary food crops as raw materials to produce food, feed, and other products seems to be a realistic policy measure to improve food crop diversification in Indonesia.
Although horizontal diversification is largely affected by the demand-side factors, there are possibilities for improving horizontal diversification of food crops from the supply-side. Yet, public policies relating to production, marketing, and international trade of food crops have been biased toward achieving high rice self-sufficiency level (see Simatupang, 1989; and Kasryno et al., 2004). Consequently, diversification of food crops in Indonesia has diminished. To improve diversification of food crops in Indonesia, it is essential that some or all of these particular policies be removed gradually. It is worthwhile to note that encouraging diversification of food crops through supply-side factors would also stimulate industrial uses of secondary food crops that, in turn, would become a pulling factor from the demand-side of food crop diversification.
Objectives of the Study
Since the performance of diversification based on CGPRT crops in Indonesia has diminished in the last three decades, the principle objective of this study is to investigate the socio-economic impacts of development, including trade liberalization on CGPRT crops. The specific objectives of this study are focused on the following aspects: (1) To review the benefits of food crop diversification; (2) To overview of food crop related policies; (3) Describing current status of CGPRT crops; (4) To suggest policy recommendations for the development of sustainable diverse agriculture for poverty alleviation.
Seven major CGPRT crops are studied; they are maize, soybean, groundnut, cassava, mungbean, sweet potato, and potato. Rice is also included in this study with a

35
consideration that rice-related policies, to large extent, affect resource allocation in general and, therefore, affect the development of CGPRT crops in particular.
Analytical Methods
Information on diversification-related policies is reviewed from the results of previous studies. The results of review are used to explain changes and trends of CGPRT crop production, consumption, exports, imports, and diversification.
In this paper, crop diversification is calculated by using Simpson’s Diversity Index based on the following equation:
SID = 1 – Σ (X i / Σ X i ) 2 (1)
Where:
SID = Simpson index of diversification
X i = Area of the ith crop
The minimum value of SID is 0 (the least diversified), whereas the maximum value is 1 (the most diversified). In computing the SID of food crops, paddy is also included (along with soybean, maize, cassava, groundnut, sweet potato, and potato) because paddy is an important crop in food crops-based cropping systems. Beside crop diversification index, crop specialization quotient (SQ) is also computed (equation 2):
SQ ij = (Aij / Σ Aij )/ (Ai / Σ Ai ) (2)
Where:
SQ ij = Specialization index of commodity i in region j
A ij = Harvested area of commodity i in region j
A i = Harvested area of commodity i in the country
If SQ ij is greater than 1 it means that the region j is specialized in commodity i.
BENEFITS OF FOOD CROP DIVERSIFICATION FOR POVERTY ALLEVIATION
The concept of agricultural diversification initially stems from the search for a means to reduce risk in terms of individual farm income risk and regional food supply risk. With only one or two food crops, farm income and regional food supply are much riskier to natural and market hazards than with a more diversified cropping system (Hedley, 1987). Since individual farm income is dependent on yields, input prices, and output prices, while yields and input prices are relatively stable, instability of farm income is merely driven by instability of output prices. Hence, a significant price drop of a crop would push farmers either to grow other crops or to completely leave their farms. In such a situation, agricultural diversification would be important for reducing the instability of rural income and therefore fostering rural economic growth and alleviating poverty.

36
In line with this argument, Timmer (1990) identified three reasons for policy makers to pay more attention to agricultural diversification: (a) when output prices are highly unstable, a well diversified and flexible agriculture provide more stable farm incomes, (b) diversification of rural economy is a significant source of income growth for rural people, provide better living standards and reducing rural-to-urban migration, (c) in the long run, a diversified cropping pattern is more sustainable than is intensive cultivation of a single crop.
Since agricultural diversification includes horizontal, regional, and vertical diversifications, Karama et al. (1992) identified several potential benefits of agricultural diversification: (1) As the results of agricultural diversification, increasing quantity and quality of foods and raw materials produced in diverse agro-ecological zones will provide more income for farmers, improve diet for the people, and reduce import demand; (2) Agricultural diversification will results in better utilization of natural resources; (3) Handling, marketing and processing of more foods and raw materials resulting from diversification will increase value added, employment, and therefore alleviate poverty; (4) The increasing income and diversified sources of foods will reduce the demand for rice; (5) Quality processed products, resulting from vertical diversification and vertical integration, will enhance the potential for exports and therefore will increase foreign exchange earnings.
In spite of the potential benefits of diversification, diversification indices of CGPRT crops in all provinces of Indonesia tend to decline and almost all provinces tend to specialize in rice (see Section 5.4). There are at least two reasons behind this trend: (1) Rice production related policies (such as price supports, irrigation development, and technology development through research and development, and farm credits through intensification programs) have not been favourable for crop diversification; (2) The technology and market mechanisms available for the CGPRT crops (palawija) are riskier than those available for rice. Furthermore, the environment where rice is grown is much more controllable for water than the environment where the CGPRT crops are grown. Consequently, diversification of CGPRT crops would increase the risk borne by farmers who previously carry out rice-dominated cropping system (Hedley, 1987). This is true in the lowland areas where sources of income tend to be based on rice. It might not be true in the upland areas because sources of income might be more diversified than in lowland areas.
OVERVIEW OF FOOD CROP RELATED POLICIES
Production Related Policies
The history of production policies on CGPRT crops in Indonesia was preceded by the implementation of production policies on rice intensification programs such as BIMAS, INMAS, INSUS, and SUPRA INSUS. To support these programs, the

37
government implemented several policies such as rehabilitation of irrigation systems, transfer of technology, establishment of low interest credit for rice farmers, rice marketing system through BULOG, floor price policy, input subsidy, improving agricultural research capacity to develop rice technology to local conditions, provision of inputs (seeds, fertilizers, and pesticides), multiplication and distribution of seeds, and the targets of area expansion of the intensification program
Having reached rice self-sufficiency in 1984, the government of Indonesia paid more attention to increase production of CGPRT crops. Several modifications of BIMAS program were implemented for maize and soybean, but rice intensification program continued to receive the highest priority thus far. In relation to soybean, the country implemented a series of soybean intensification programs, including UPSUS program (upaya khusus), which was known as a special program for soybean. In this program, the government sets the targets of area expansion, plays direct role particularly in distribution of improved seeds and facilitation of credit. This program, along with subsidized liming, price support and trade policies, has dramatically increased the harvested area of soybean from 896 thousand hectares in 1985 to 1.47 million hectares in 1993. Since then, as shown in Table 2, the growth rates of soybean by area were negative due to weak competitiveness of soybean compared to those of rice and other CGPRT crops such as maize and groundnut (Table 1).
Before 1970s, maize varieties in Indonesia had not been developed. Since the late 1970s, the State Company of PT Sang Hyang Sri produced new maize varieties, Arjuna and Harapan-6, which are responsive to the use of fertilizers and partially resistant to downy mildew. In 1983, PT Cargill produced C-1 hybrid seed. The more recent high-yielding varieties are CPI-1 and CPI-2 which were produced by PT Charoen Pokphan; Bisi was produced by PT Bright Indonesia Seed Industry, and Pioneer was produced by PT Pioneer (Erwidodo and Hadi, 1999). The use of these varieties multiplied the use of fertilizers and in turn increased yields of maize. For such a reason, the government also expanded maize area under intensification program (BIMAS).
In relation to potato, the government policies on potato production are very limited. Since 1995, the government implemented a production credit scheme for potato. The state bank (BRI) distributes the credit through Village Cooperative Units (KUD) to farmer groups. Although the membership of farmer group is required, evidence indicates that only large and well-educated farmers had much access to the credit for potato production.
Seed is the major component of potato production and so is the cost. To obtain quality seed of potato, the Government of West Java supported by JICA carried out a potato seed project involving a number of related agencies. Research Institute of Vegetables in Lembang is responsible in producing and sending potato plantlets G-0 (pathogen-free material) to Seed Farm Center at Pangalengan which multiplies them to produce G-1 and G-2. The G-2 is then sent to PD Mamin responsible for producing G-3. Through the Center of Rural Cooperative Unit, the G-3 is sold to certified seed growers
38
who produce G-4. Finally, the G-4 is bought by the Centre of Rural Cooperative Unit and then distributed to farmers (Erwidodo and Hadi, 1999).
Similar to the case of potato, the government also has never launched significant programs for other CGPRT crops such as cassava, sweet potato, groundnut, and mungbean, except the programs of variety and agronomic improvements carried out by the Central Research Institute for Food Crops (CRIFC).
The discussion in this section indicates that food production related policy puts first priority on rice production and the second priority on soybean and maize production. At the national and provincial levels, no specific production policy has been put on potato, cassava, sweet potato, and mungbean. This can be seen from the fact that these crops have not specifically included in intensification programs. This situation implies that government production-related policies in the past have not been directed toward the development of more diversified food crops.
Marketing and Price Support Policies
To assure domestic price stability and food security, the government assigns the Logistic Agency (BULOG) to maintain a minimum stock by importing and purchasing domestic production to stabilize rice price. To facilitate BULOG market operation, the government provides BULOG with soft credit from the Central Bank (Bank Indonesia). BULOG has built 433 rice storage facilities throughout the country with total capacity of 2.5 million metric tons. Note that the government procurement of rice accounted for only 6-7 percent of domestic rice production (Erwidodo and Hadi, 1999).
After the country reached rice self-sufficiency in 1984, rice import was not allowed. To maintain buffer stock for rice price stabilization, BULOG was authorized to only purchase rice from domestic production. This import restriction policy, however, was costly for two reasons: (a) since international rice price tended to decline, while domestic prices were higher than those in the world market, it would be cheaper for BULOG to import rice, (b) price stabilization policy became costly due to the high cost of domestic procurement and storage to maintain buffer stock. Since BULOG operational cost was subsidized through soft credit provision, the price stabilization policy is too costly.
Regardless cost, Simatupang (1989) pointed out that the floor price policy of rice resulted in relatively high and stable price of rice such that rice production is more profitable than the production of secondary food crops (CGPRT crops) because of the low risk of rice price. The effectiveness of this policy, however, declined since the policy is no longer supported by soft loan and BULOG’s organisational reform. BULOG can only absorb 6-7 percent of national production of paddy. The less effective floor price (HPP) policy can be seen from the fact that the ratio of farm gate price to HPP was around 99 percent in 2002 and 2003 (see Suryana and Hermanto, 2004). Although the floor price policy was less effective, the effect of the policies on rice price and stability at farm gate continued and, therefore, it did not encourage crop diversification.

39
Price support policy for CGPRT crops was first initiated for maize in 1978, while the price support policies for soybean began in 1980. No floor price policy was set up for cassava, potato, sweet potato, and groundnut. Similar to floor price of rice, the floor prices for maize and soybean were also set on the bases of production cost and return (including expected net return to farmers) and the previous market prices. Thus, the floor price was adjusted every year based on the variables. The floor price of maize was inflated by 10.9 percent per year, which was higher than that of rice (10.4%) and soybean (6.4%) (Amang and Sawit, 1999). This condition implies that the government paid more attention to maize and rice than to other CGPRT commodities.
To make the price support policy much more effective, the government implemented particular policies on market intervention for rice, maize and soybean. In the case of soybean, BULOG intervention in domestic market was relatively small and indirect. As soybean sole importer, BULOG and its trading companies had a monopoly on the importation and distribution of the commodity. BULOG imported soybean and sold it to private traders and KOPTI (the cooperatives of tofu and tempe producers), while KOPTI was assigned to procure soybean from farmers. Since the actual farm gate price of soybean was about 60 percent above the floor price, this particular policy was proven ineffective. Consequently, domestic soybean procurement by KOPTI did not work well. Private traders could carry out the procurement efficiently because domestic supply was much below the demand and, therefore, peak harvest production could be absorbed without lowering the farm gate price of soybean. During off-seasons, soybean price was still relatively low because the amount of imported soybean was also high. Up to this point, it is obvious that the government has not provided appropriate public policies for the marketing of soybean since BULOG only involved in importation of soybean, while KOPTI did not work well in soybean procurement, and price support policy for soybean was not effective.
In the case of maize, BULOG procured maize from farmers through village cooperatives (KUD) for the period of 1978-1988. At the beginning, the procurement was sizeable because inter-island and inter-provincial marketing of maize were entirely controlled by BULOG in order to balance supply and demand. The procurement was then drastically declined. Since 1988, BULOG no longer intervened in maize marketing because such intervention resulted in (a) substantial financial burdens to the government budget, (b) higher farm gate prices resulting from the competition with private traders, and (c) excess domestic demand particularly from feed industry. Since maize marketing is left to private companies and traders, they can purchase maize at the market price.Since then, the only floor price policy is applied for rice. This state of affairs indicates that the government involvement in maize marketing and price support policy for maize was very limited.
Since the Indonesian economy was hit by monetary crisis in 1997, the government capacity to implement price stabilization policy for rice declines. Furthermore, the agenda sponsored by the IMF has forced Indonesia to apply drastic

40
and broad-based reforms, including rice policy. The IMF insisted that BULOG operation and monopoly be limited to rice and all subsidies on rice and other food commodities be sharply reduced. In December 1998, the most dramatic reform in agriculture was implemented. The reform includes: (a) liberalization of rice market such that all importers, including BULOG, are allowed to import and distribute rice, (b) to avoid price drops in peak harvest period, the floor price of rice is implemented regionally, (c) in the periods of scarcity, special market operation with cheap rice price is implemented for the needy, and (d) elimination of subsidized fertilizers (urea, SP-36, and KCL) and pesticides. Since 2005, the government provided subsidy on natural gas price to produce fertilizers.
Food Diversification and Processing Related Policies
As a response to food crisis in the sixties, the government launched a campaign of ‘rice-maize’ staple food that had two meanings: (a) a mix of rice and maize in every meal, or (b) substitution of maize for rice in particular meals (breakfast, or lunch, or dinner). At the end of the first five-year development plan (PELITA-I), the government announced a Presidential Decree (INPRES no.14, 1974) on ‘food quality improvement’ (UPMMR) which was then modified by INPRES no.20, 1979 (Hasan, 1994). The emphasis of food quality improvement was translated as staple food diversification rather than overall food diversification, and how this policy should be implemented was not so clear.
Since 1991/1992, the Ministry of Agriculture launched a campaign on Diversified Food and Nutrition Program (DPG) with two objectives: (a) to strengthen food security at the household level, and (b) to improve rural people’s awareness to consume diversified foods having nutritional balance through house yard cultivation by various crops. Since 1998/1999, the program included development of local food alternatives. Since the coverage of this program was relatively small, it has insignificantly reduced per capita consumption of rice.
The government subsidies on wheat import, distribution and establishment of wheat flour processing have significantly increased the consumption of wheat products. In the second half of 1960s when the country faced foreign currency shortage the government intensively introduced wheat flour to avoid being dependent on rice import. During the period, rice as a staple food was characterized by unstable international price and thin international market. To stabilize food prices in particular and the national economy in general, it would be better for the country to import wheat because international price of wheat was relatively stable, international wheat market was relatively large, and the substitutability of wheat for rice was predicted high.
At the end of the sixties, USA facilitated a concession loan with low interest rate to purchase wheat from the US. In the period of 1968-73, the total import was 3.3 million metric tons of wheat (grain equivalent); 61 percent of which was imported from USA and 89 percent of the import budget was the concession loan. After the construction of 3

41
wheat flourmill plants in early 1970s, wheat import drastically increased up to 4.6 million metric tons in the period of 1973-78, but the proportion of concession loan for wheat import declined to 24 percent (Magiera, 1981 and Sawit, 2003).
Indonesia has become the sixth largest wheat importer in the world after Brazil, Egypt, Iran, Japan, and Algeria. Import of wheat grain increased from 3.7 million metric tons in 1997/98 to 4.1 million metric tons in 2000/01 (Sawit, 2003). The government subsidy for wheat import and distribution may in part account for. The real subsidy increased from Rp3 billion in 1976/77 to Rp17 billion in 1978/79. Instant noodle industry was even extremely subsidized. Based on the data of 1994, the industry was subsidized Rp 760 billion per year. In line with the ability to increase rice production, wheat import was reduced in 1980s, but wheat import has drastically been increasing after the government liberalized the markets of wheat and wheat flour in 1998. Noodle consumption, therefore, increased from 1.1 kg/cap/year in 1993 to about 2.3 kg/cap/year in 2002 (see Martianto and Ariani, 2004).
The rapid shift of consumption to wheat products by low and middle-income classes has significantly reduced the consumption of domestic production of food crops such as rice, cassava, sweet potato, sago and maize. An increase in import tariff for rice, when it is effective, would raise domestic price of rice. Since rice and wheat have a high substitutability to each other, any increase in import tariff for rice would increase the import of wheat and wheat flour significantly. Sawit (2003) suggested that wheat import should be levied at least as much as 50 percent of import tariff of rice. Such a policy would diversify consumption and in turn would diversify the production of food crops. Recently the import tariff wheat is only 5 percent.
International Trade Policies for Food Crops
Before 1989, the government heavily protected rice market in Indonesia, above all by using non-tariff barrier to increase rice self-sufficiency. In spite of heavy import restriction, rice imports increased substantially because domestic production could not meet the increasing demand for rice. Consequently, Indonesia has turned back to be one of the largest rice importers in the world. Rice import restriction was reduced since the government declared the concept of ‘rice self-sufficiency on trend’.
In the past, the government also imposed import tariff, import control and marketing policies to increase soybean production. The initial import tariff (30%) was implemented in the period of 1974-1985. It was reduced to 20 percent in the period of 1986-1988, 10 percent in 1989-1993, 7.5 percent in 1994, 5 percent in 1995, and 2.5percent in 1996, and finally it was phased out in 1997. This import tariff was ineffective because while the import tariff was decreasing, domestic price of soybean was increasing by 8.8 percent/year and in the period of 1984-1997.
The increasing domestic price of soybean was not only caused by the increasing domestic demand for soybean but more importantly caused by BULOG

42
monopoly on soybean importation. Erwidodo and Hadi (1999) found that the domestic price of soybean was always above the import parity prices. In 1995, for example, the domestic price of soybean was 94 percent higher than its import parity price. This situation provided substantial incentives for BULOG and its trading companies, but it increased the costs to poultry and other livestock producers, taxed small-scale tofu and tempe producers and consumers.
The highest production of soybean was reached in 1992. After 1992, the soybean production soybean has been decreasing due to its weak competitiveness. As shown in Tables 1, the R/C ratio of soybean was lower than that of rice or maize or groundnut or potato. The growth rate of soybean imports increased by 37.5 percent per year (Table 4).
Most of imported soybean was distributed to food processing and the cooperative of tofu and tempe producers (KOPTI), and only a small proportion was distributed to market. The main objective of this policy was to guarantee the soybean supply for household producers of tofu and tempe since the two soybean products are cheap sources of protein for low-income population. To make such intervention effective in boosting domestic soybean production, the government necessitated that KOPTI absorb at least 40 percent of domestic soybean production. The target, however, could not be met since the price of imported soybean was lower than that of domestically produced soybean.
BULOG also imported soybean flour and soybean meal (bungkil kedelai) for poultry industries. Since 1991, soybean imports have been mainly in the form of bean because domestic soybean meal industries began operating. To protect the industries, the government also imposed an import tariff of 35 percent on soybean meal. In June 1991, the government removed BULOG’s monopoly of soybean meal importation, while import tariff was reduced from 10 to 5 percent. In addition, 30 percent surcharge was applied which then removed in 1993. Instead of removing the surcharge, the government implemented a local content requirement that necessitated local feed industries to purchase 40 percent of their need from domestic sources. In 1994, the local content was reduced to 30 percent and import tariff was eliminated. The local content was reduced further to 20 percent, and then all trade regulations on soybean meals was totally removed in April 1996 (Bahri et al., 2002).
To protect farmers from severe effect of price drops, the government imposed import tariff policy for both maize grains and products (such as maize seeds, maize flours, maize starch for baking, sweet corn, crude maize oil, corn flakes and maize bran). The import tariff rate for maize grain was reduced from 15 percent in 1990 to 10 percent in 1995, and to 5 percent since 1996, but the domestic price of maize grain increased by 19 percent per year in 1991-2001 because domestic price of maize was not only affected by import tariff but also by the world maize price. This implies that the tariff policy for maize did not predominantly affect farm gate price as an incentive for maize farmers.
43
As a net exporter of cassava, Indonesia is granted an export quota. Despite the small share of Indonesia’s cassava (8%) in the global market, the quota was applied only for exports to Europe to prevent cassava price from falling. The quota increased from 500,000 metric tons in 1982 to 700,000 metric tons in 1983-1984, and finally to 825,000 metric tons afterward. In the period of 1988-1993, Indonesia’s exports of cassava exceed the quota, but after 1993 the cassava exports were drastically decreasing to 389,000 metric tons in 1996 and to 7,000 metric tons in 2002 (see Table 4). When cassava export declined while domestic production increased by 1% per year (Table 2), the domestic use certainly increased. Since domestic use for direct consumption decreased (see Table 3), domestic use for industrial use should be increasing. Unfortunately, information on the use cassava by types of industries is not adequately available.
As a net exporter of potato, Indonesia imposes import tariffs for fresh and chilled potato at 30 percent in 1989-1993, 25 percent in 1994-1995, 20 percent in 1996-1997, and 5 percent since 1998. Since the quantities of imported fresh potato were small (Table 4) while the imported potato is not a perfect substitute for domestically produced potato, then the tariff for fresh potato does not affect domestic production. No tariff has been imposed on potato seeds, while potato flour, flakes, and granules were terrified at 5 percent before 1995 and 0 percent afterward. Tariff rates for other potato-related products reduced from 30 percent in 1989-1993 to 15-25 percent in 1994-1997, and finally to 5 percent afterward.
After the economic crisis, the government immediately deregulates domestic rice market, including the removal of BULOG monopoly on rice import and import tariff. Recently, however, there has been a growing concern about the potential adverse effects of the deregulation. In the absence of import tariff, the decreasing trend of rice price in the world market lead to the increasing imports of rice and in turn it will reduce domestic rice production and farm income. To encourage farmers to grow paddy and sugarcane, the government still imposed tariffs for rice (34%) and sugar (25%) in May 2002 and became specific tariff in July 2002. The tariff policies reduce the farmers’ flexibility in the use of land because such policies do not bring about the real competitive circumstances among crops. Therefore, gradual tariff reduction followed by improvement in infrastructure at farm and marketing levels and agro-industrial development would lead to real competitiveness among crops and foster farm diversification driven by competitive market.
CURRENT STATUS OF FOOD CROPS
Competitive and Comparative Advantages of Food Crops
Table 1 presents financial and economic analyses of rice and CGPRT crop production. EPC of rice, which is greater than one, indicates that rice is more protected

44
than are the other crops. Rice, soybean, maize, groundnut, and potato have both competitive advantages (indicated by PCR less than one) and comparative advantages (indicated by DRC less than one), but soybean apparently has weak competitive and comparative advantage since both PCR and DRC of soybean are nearly equal to one. Siregar and Sumaryanto (2003) even found that both PCR and DRC of soybean are greater than one. It appears that maize, groundnut, and potato have higher comparative advantages than does rice.
Table 1. Net Returns, R/C, PCR, EPC and DRC of Paddy, Soybean, Maize, Groundnut and Potato Production in Selected Localities of Java, 2001
Financial Analysis Economic AnalysisNet Ruturns R/C PCR EPC DRC
CropsIrri-
gatedRainfed
Irri-gated
Rainfed
Irri-gated
Rainfed
Irri-gated
Rainfed
Irri-gated
Rainfed
Paddy
Soybean
Maize
Groundnut
Potato*
1695
104
1386
1331
-
938
-72
989
1178
11531
1.14
1.05
1.37
1.41
-
1.23
0.97
1.25
1.39
1.42
0.69
0.94
0.65
0.61
-
0.77
1.04
0.70
0.61
1.50
1.14
0.99
0.58
0.98
-
1.01
0.96
0.57
0.97
1.04
0.85
0.92
0.37
0.60
-
0.98
0.99
0.39
0.58
0.51Source: Summarized and computed from Anonymous (2003)Notes: Net returns (Rp000/ha); R/C = Returns to costs ratio; PCR = Private cost ratio; EPC = Effective
protection coefficients; DRC = Domestic resource cost ratio; *in upland
Since maize and groundnut do have comparative advantages, one may raise a question as to why Indonesia has been importing significant amounts of these CGPRT commodities every year. The question implicitly suggests that it would economically benefit Indonesia if the country produced the three commodities at home rather than importing them. The answer is straightforward. As depicted in Table 2, the growth rates of the total food crop area (rice and CGPRT crops) has been negative (-0.04%/year) or at least stagnant in the period of 1993-2003. This figure indicates that expanding the area for a particular crop would reduce the area of other crops. Given the current policies, it is unlikely to meet domestic demands for soybean, maize, and groundnut by domestic production without a new expansion of food crop area unless a policy change promoting the production of these CGPRT crops takes place. One of the policies, as has been discussed earlier, is the gradual reduction of import tariff for rice.
Trends in Production and Consumption of Food Crops
In the period of 1993-2003, the production growth rates of CGPRT crops were positive except that of soybean (Table 2). Relatively low yield of soybean stems from insignificant improvement of soybean varieties adapted to agro-ecological factors in
45
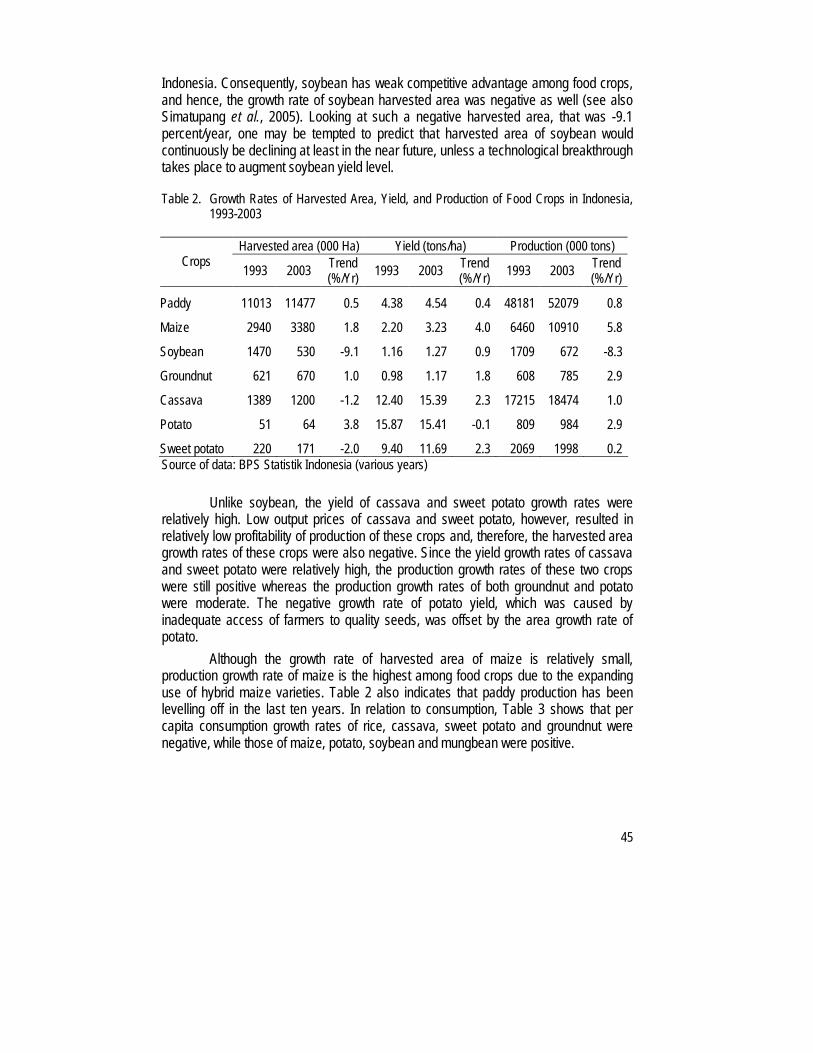
Indonesia. Consequently, soybean has weak competitive advantage among food crops, and hence, the growth rate of soybean harvested area was negative as well (see also Simatupang et al., 2005). Looking at such a negative harvested area, that was -9.1 percent/year, one may be tempted to predict that harvested area of soybean would continuously be declining at least in the near future, unless a technological breakthrough takes place to augment soybean yield level.
Table 2. Growth Rates of Harvested Area, Yield, and Production of Food Crops in Indonesia, 1993-2003
Harvested area (000 Ha) Yield (tons/ha) Production (000 tons)Crops
1993 2003Trend (%/Yr)
1993 2003Trend (%/Yr)
1993 2003Trend (%/Yr)
Paddy 11013 11477 0.5 4.38 4.54 0.4 48181 52079 0.8
Maize 2940 3380 1.8 2.20 3.23 4.0 6460 10910 5.8
Soybean 1470 530 -9.1 1.16 1.27 0.9 1709 672 -8.3
Groundnut 621 670 1.0 0.98 1.17 1.8 608 785 2.9
Cassava 1389 1200 -1.2 12.40 15.39 2.3 17215 18474 1.0
Potato 51 64 3.8 15.87 15.41 -0.1 809 984 2.9
Sweet potato 220 171 -2.0 9.40 11.69 2.3 2069 1998 0.2Source of data: BPS Statistik Indonesia (various years)
Unlike soybean, the yield of cassava and sweet potato growth rates were relatively high. Low output prices of cassava and sweet potato, however, resulted in relatively low profitability of production of these crops and, therefore, the harvested area growth rates of these crops were also negative. Since the yield growth rates of cassava and sweet potato were relatively high, the production growth rates of these two crops were still positive whereas the production growth rates of both groundnut and potato were moderate. The negative growth rate of potato yield, which was caused by inadequate access of farmers to quality seeds, was offset by the area growth rate of potato.
Although the growth rate of harvested area of maize is relatively small, production growth rate of maize is the highest among food crops due to the expanding use of hybrid maize varieties. Table 2 also indicates that paddy production has been levelling off in the last ten years. In relation to consumption, Table 3 shows that per capita consumption growth rates of rice, cassava, sweet potato and groundnut were negative, while those of maize, potato, soybean and mungbean were positive.

46
Table 3. Total and Average Consumption of Rice and CGPRT Crops, 1993-2002
Total consumption (000 ton / year) Consumption per capita (kg /year)Commodities
1993 1996 1999 2002 GR*(%/Yr)
1993 1996 1999 2002 GR*(%/Yr)
Rice 21940 22053 21491 21708 -0.1 116.0 111.2 103.6 100.3 -1.6
Maize 1381 2261 2780 2705 9.3 7.30 11.4 13.4 12.5 7.4
Cassava 2416 1561 2023 1839 -1.7 12.8 7.90 9.80 8.50 -3.0
Dried cassava 296 124 43 79 -4.5 1.56 0.63 0.21 0.36 -5.7
Sweet potato 1055 589 584 587 -5.0 5.60 3.00 2.80 2.70 -6.2
Potato 375 352 205 384 4.3 2.00 1.80 1.00 1.80 2.7
Groundnut 128 124 118 112 -1.4 0.68 0.63 0.60 0.57 -1.9
Soybean 20 21 11 23 7.3 0.10 0.10 0.05 0.10 5.6
Mungbean 108 145 65 124 7.7 0.57 0.73 0.31 0.57 5.9Source: BPS, Survei Sosial Ekonomi Nasional 1993, 1996, 1999, 2002
*GR=growth rates (% per year).
Trends in Exports and Imports of CGPRT Crops
The import quantities of soybean grain and soybean meal were also continuously increasing because domestic production could not meet accelerating demands for soybean and soybean meal. This is caused by the rapid growth of tofu and tempe processors, poultry, and feed industry. In 1993-2003, the domestic production of soybean grain declined by 8.3 percent per year (Table 2) while its domestic consumption increased by 7.3 percent per year (Table 3). Consequently, the import of soybean grain increased from 0.75 million metric tons in 1996 to 1.36 million metric tons in 2002 with a growth rate of 38 percent per year (Table 4). The import quantity of soybean meal also increased from 0.9 million metric tons in 1996 to 1.3 million metric tons in 2002 with a growth rate of 8.8 percent per year. It is obvious that the increasing import of soybean was not affected by the decreasing or zero rate of import tariff because the domestic price of soybean even increased by 14 percent per year in 1993-2003.
Indonesia carries out exports and imports of maize every year. Japan is the major destination of maize export from Indonesia. Table 4 shows that the trade balance of maize was always negative except in 1998. In 1998, domestic demand for maize dropped sharply due to the collapse of many poultry producers as the largest feed users. In recent years, except in 1998, the import quantity of maize has been very high, ranging from 0.6 to 1.26 million metric tons. Indonesia imported maize particularly from Argentina, USA, South Africa, and Vietnam.
The trade balance of maize was also negative but it was not as highly negative as in soybean. Unlike the growth rate of soybean production, the growth rate of maize production as depicted in Table 2 was positive (5.8% per year). Nevertheless, since the growth rate of maize consumption was 9.3 percent/year (Table 3), the trade balance of
47
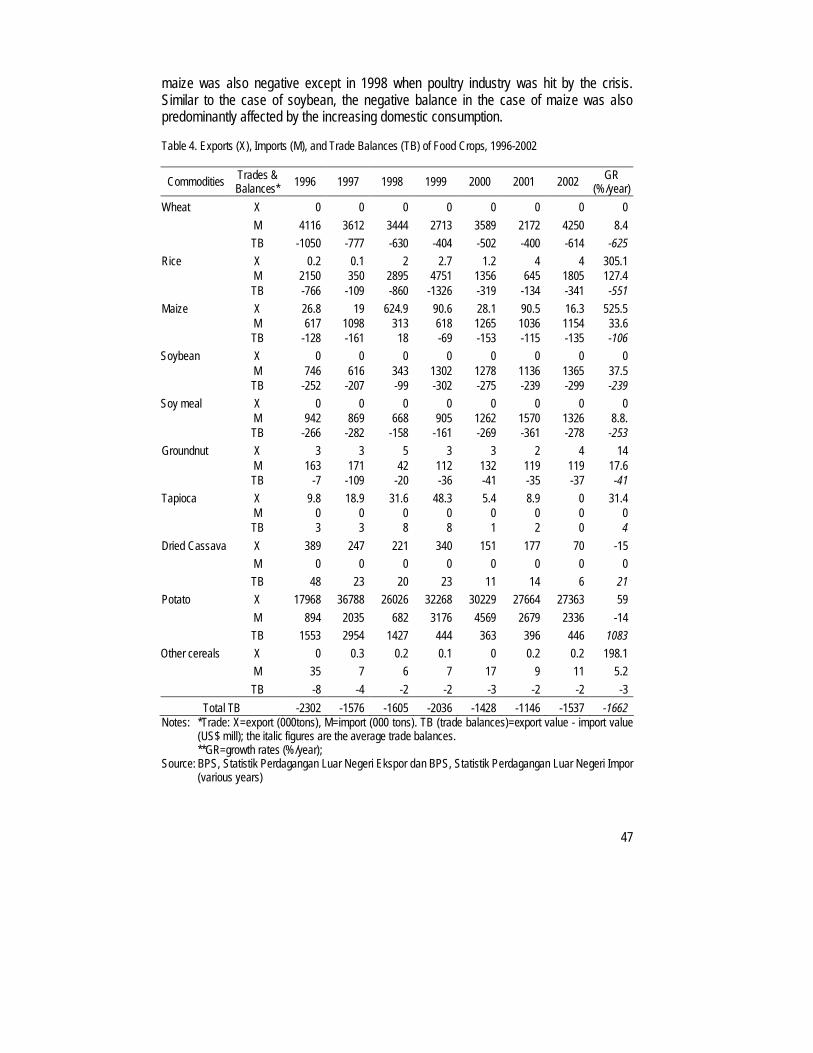
maize was also negative except in 1998 when poultry industry was hit by the crisis. Similar to the case of soybean, the negative balance in the case of maize was also predominantly affected by the increasing domestic consumption.
Table 4. Exports (X), Imports (M), and Trade Balances (TB) of Food Crops, 1996-2002
Commodities Trades &Balances*
1996 1997 1998 1999 2000 2001 2002 GR(%/year)
Wheat X 0 0 0 0 0 0 0 0
M 4116 3612 3444 2713 3589 2172 4250 8.4
TB -1050 -777 -630 -404 -502 -400 -614 -625
Rice X 0.2 0.1 2 2.7 1.2 4 4 305.1M 2150 350 2895 4751 1356 645 1805 127.4TB -766 -109 -860 -1326 -319 -134 -341 -551
Maize X 26.8 19 624.9 90.6 28.1 90.5 16.3 525.5M 617 1098 313 618 1265 1036 1154 33.6TB -128 -161 18 -69 -153 -115 -135 -106
Soybean X 0 0 0 0 0 0 0 0M 746 616 343 1302 1278 1136 1365 37.5TB -252 -207 -99 -302 -275 -239 -299 -239
Soy meal X 0 0 0 0 0 0 0 0M 942 869 668 905 1262 1570 1326 8.8.TB -266 -282 -158 -161 -269 -361 -278 -253
Groundnut X 3 3 5 3 3 2 4 14M 163 171 42 112 132 119 119 17.6TB -7 -109 -20 -36 -41 -35 -37 -41
Tapioca X 9.8 18.9 31.6 48.3 5.4 8.9 0 31.4M 0 0 0 0 0 0 0 0TB 3 3 8 8 1 2 0 4
Dried Cassava X 389 247 221 340 151 177 70 -15
M 0 0 0 0 0 0 0 0
TB 48 23 20 23 11 14 6 21
Potato X 17968 36788 26026 32268 30229 27664 27363 59
M 894 2035 682 3176 4569 2679 2336 -14
TB 1553 2954 1427 444 363 396 446 1083
Other cereals X 0 0.3 0.2 0.1 0 0.2 0.2 198.1
M 35 7 6 7 17 9 11 5.2
TB -8 -4 -2 -2 -3 -2 -2 -3
Total TB -2302 -1576 -1605 -2036 -1428 -1146 -1537 -1662Notes: *Trade: X=export (000tons), M=import (000 tons). TB (trade balances)=export value - import value
(US$ mill); the italic figures are the average trade balances. **GR=growth rates (%/year);
Source: BPS, Statistik Perdagangan Luar Negeri Ekspor dan BPS, Statistik Perdagangan Luar Negeri Impor (various years)

48
In the case of groundnut, the growth rate of domestic production (2.9%/year) was actually higher than that of domestic consumption (0.6%/year). Since production was still lower than consumption, the trade balance of groundnut was also negative, but the trade balance was not as highly negative trade balance as for soybean and maize.
The main cassava export product is dried-sliced manioc, whereas tapioca and pellet exports are minor. In the period of 1996-2002, the highest quantity of dried cassava export took place in 1996. After such year, the quantity of dried cassava export declined due to the decreasing domestic production and increasing domestic use.
Indonesia is a net exporter of potato. Export of potato increased from 365 metric tons in 1980 to 36,758 metric tons in 1997 with an average growth rate of 31 percent per annum. The major destination countries of potato exports are Malaysia and Singapore. No specific policy measure has take place in boosting this export. Potato is imported in the forms of seeds, fresh/chilled potato and frozen potato.
Imports of potato increased from 18.9 metric tons in 1988 to 2,035 metric tons in 1997 with an average growth rate of 68 percent. The major countries of origins are Australia, USA, and the Netherlands for potato seeds, Australia and the Netherlands for fresh/chilled potato, and USA for frozen potato (Erwidodo and Hadi, 1999).
Rice imports steadily increased after year 1984. In 1996, the country imported 2.1 million metric tons of rice due to domestic supply shortage resulting from drought. In 1998-99, the economic crisis and severe drought also increased the quantity of rice imports. Despite the fact that rice is the most protected food crop in Indonesia, the average rice imports in the 1996-2002 period was around 2 million metric tons (around US$ 520 million) per annum. This amount cannot be reduced significantly unless technological breakthrough takes place or the government expands paddy area outside Java. Note that the growth rate of paddy yield, that was 0.38 percent per year in the 1993-2003 period, indicating the levelling off of paddy yield in the country (see Table 2). Given the relatively stagnant technology of paddy production, the amount of rice import can only be substituted by domestic rice production if the country can expand irrigated paddy area outside Java at least 250,000 hectares, assuming that the average paddy yield is 4 metric tons per hectare.
Horizontal, Vertical and Regional Diversification of Food Crops
Horizontal diversification can be seen from how a farmer carries out cropping pattern in one year. A cropping pattern describes not only the frequency of cropping in one year but also the type of crops grown in each season or period. Cropping index, defined as the total planted area of all crops for one year divided by cultivated area, is usually used to measure cropping intensity. Previous study indicates that the cropping index in irrigated land is higher than that in dry land since higher cropping index requires better availability of water. In general, crop diversification in dry land where most CGPRT crops are grown is higher than that in irrigated land (see Anonymous, 1990).
49
Dry lands are generally marginal in a sense that the lands are characterized by low soil fertility, lack of infrastructures and facilities, and high rate of land degradation. Most farmers who grow CGPRT crops in dry land area are poor. It is necessary, therefore, that the government initiate a thorough program for CGPRT crop development in dry land because such a program would considerably reduce poverty incidence.
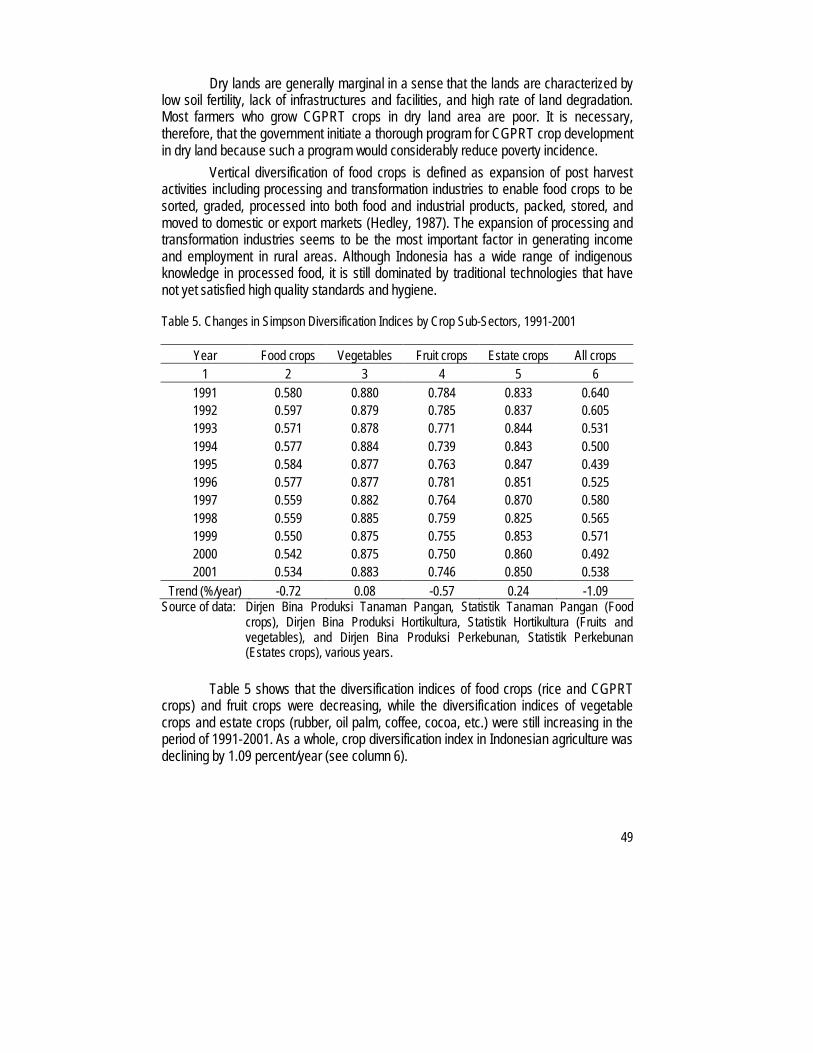
Vertical diversification of food crops is defined as expansion of post harvest activities including processing and transformation industries to enable food crops to be sorted, graded, processed into both food and industrial products, packed, stored, and moved to domestic or export markets (Hedley, 1987). The expansion of processing and transformation industries seems to be the most important factor in generating income and employment in rural areas. Although Indonesia has a wide range of indigenous knowledge in processed food, it is still dominated by traditional technologies that have not yet satisfied high quality standards and hygiene.
Table 5. Changes in Simpson Diversification Indices by Crop Sub-Sectors, 1991-2001
Year Food crops Vegetables Fruit crops Estate crops All crops1 2 3 4 5 6
1991 0.580 0.880 0.784 0.833 0.6401992 0.597 0.879 0.785 0.837 0.6051993 0.571 0.878 0.771 0.844 0.5311994 0.577 0.884 0.739 0.843 0.5001995 0.584 0.877 0.763 0.847 0.4391996 0.577 0.877 0.781 0.851 0.5251997 0.559 0.882 0.764 0.870 0.5801998 0.559 0.885 0.759 0.825 0.5651999 0.550 0.875 0.755 0.853 0.5712000 0.542 0.875 0.750 0.860 0.4922001 0.534 0.883 0.746 0.850 0.538
Trend (%/year) -0.72 0.08 -0.57 0.24 -1.09Source of data: Dirjen Bina Produksi Tanaman Pangan, Statistik Tanaman Pangan (Food
crops), Dirjen Bina Produksi Hortikultura, Statistik Hortikultura (Fruits and vegetables), and Dirjen Bina Produksi Perkebunan, Statistik Perkebunan (Estates crops), various years.
Table 5 shows that the diversification indices of food crops (rice and CGPRT crops) and fruit crops were decreasing, while the diversification indices of vegetable crops and estate crops (rubber, oil palm, coffee, cocoa, etc.) were still increasing in the period of 1991-2001. As a whole, crop diversification index in Indonesian agriculture was declining by 1.09 percent/year (see column 6).

50
Table 6. Changes in Diversification and Specialization of CGPRT Crops and Rice
SimpsonDiversification Indices
Specialized Crop 2)
Crops by trends inSpecialization Indices 2)Provinces 2)
1996 2002 Ch 3) DC 4) 1996 2002 Decreasing Increasing
NAD 0.431 0.332 D M R R S,G,P,Sw R,M,C
North Sumatra 0.449 0.428 D M R R R,S,G,C,P,Sw M
West Sumatra 0.222 0.204 D L R R R,M,S,G,P C,Sw
Riau 0.362 0.334 D M R R R,S,P,Sw M,G,C
Jambi 0.328 0.263 D M R R R,S,G,C M,P,Sw
South Sumatra 0.337 0.240 D L R R M,S,G,C,Sw R,P
Bengkulu 0.563 0.499 D M R R M,S,G,C,P,Sw R
Lampung 0.697 0.665 D H - - R,M,S,G,P,Sw C
West Java 0.333 0.309 D M R R R,M,S,G,C,Sw P
Central Java 0.614 0.561 D M - - M,S,C,P,Sw R,G
D.I. Yogyakarta 0.767 0.760 D H - - R,S,Sw M,G,C,P
East Java 0.680 0.650 D H - - M,S,C,P,Sw R,G
Bali 0.590 0.534 D M - R M,S,C,Sw R,G,P
West Nusa Tenggara 0.576 0.451 D M - R M,S,C,Sw R,G,P
East Nusa Tenggara 0.656 0.664 I H - - M,S,G,C R,P,Sw
West Kalimantan 0.262 0.205 D L R R R,M,S,G,C,Sw P
Central Kalimantan 0.200 0.225 I L R R R,M,S G,C,P,Sw
South Kalimantan 0.258 0.218 D L R R R,M,S,G,C P,Sw
East Kalimantan 0.267 0.253 D M R R R,S,G,C,Sw M,P
North Sulawesi 0.660 0.574 D M - - R,S,G,C,Sw M,P
Central Sulawesi 0.342 0.342 C M R R R,S,G,C,Sw M,P
South Sulawesi 0.536 0.446 D M R R M,S,G,C,P,Sw R
South-East Sulawesi 0.594 0.645 I H - - R,M,S,P G,C,Sw
Indonesia 0.466 0.426I = 3C = 1D=19
H = 5M=13L = 5
R=14(61%)
R=16(70%)
Source of data: Dirjen Bina Produksi Tanaman Pangan, Statistik Tanaman Pangan 1996 and 2002: 1) Total number of provinces = 232) A specialized crop is defined as a crop having specialization quotient greater than one; R=Rice; M=Maize;
S=Soybean; G=Groundnut; C=Cassava; P=Potato; Sw=Sweet potato3) Ch=Changes in diversification index: I = increased; D = decreased; C = constant 4) DC=Diversification index categories in 2002: H=High; M=Medium; L=Low; H > (Means+SD); L < (Means-
SD); and (Means-SD) < M < (Means+SD).

51
The declining diversification index of food crops obviously stemmed from such government policies as irrigation development, floor price, farm credit, and technological development policies which all were bias toward increasing rice production in order to achieve the highest level of rice self-sufficiency. For other crop groups, increasing imports of fruits has resulted in the declining diversification index of fruit crops, while the increasing domestic and export demands for vegetable and estates crops caused the increasing diversification indices of vegetable and estate crops.
Food crop diversification indices in most provinces were decreasing except in three provinces: Central Kalimantan, South East Sulawesi, and East Nusa Tenggara (see Table 6 column 4). Regardless the trend, the number of provinces that had high, medium and low diversification indices were 5, 13, 5 provinces, respectively (column 5).
In provinces where the diversification indices of food crops were decreasing, rice was still the only specialized crop. As depicted in column 6 and 7 (Table 6), 17 provinces specialized in rice, while 6 provinces had no specialized crop in 2002. In other words, no province had attempted to specialize in other crops than rice. Most likely, such a situation stemmed from the rice-bias policies in an attempt to attain as high level of rice self-sufficiency as possible at the cost of paying less attention to CGPRT crops.
Having decreasing food crops diversification, Bali and West Nusa-Tenggara did not specialize in any particular crop in 1996, but had rice as a specialized crop in 2002. Having also decreasing food crops diversification, five provinces (Lampung, Central Java, DI Yogyakarta, East Java, and North Sulawesi) had no specialized crop in 1996 and 2002. East Nusa Tenggara and South East Sulawesi, characterized by increasing food crops diversification, also had no specialized crop in 1996 and 2002.
Effects of Trade Liberalization
The previous section is devoted to discuss the effect of government policies in general and import tariff policy in particular on the actual domestic production, consumption and trade balance of each CGPRT commodity in the period of 1993-2003. In such a period the tariff policies were still applied though the rates were increasing. The next question is what the effect of phasing out the tariff would be on various important parameters of each commodity. Erwidodo and Hadi (1999) have accomplished some exercises using the concepts of consumer surplus/producer surpluses in their partial analysis. The objective was to analyze the impacts of reducing import tariff from 30 percent to 13.5 percent in the case of rice and the impacts of eliminating the last import tariffs of 5 percent in the cases of maize, soybean, and potato.
In the case of rice, for example, the tariff reduction by 16 percent would reduce producer price of rice by 12.6 percent, and eventually reduced yield and net farm revenue by 1.4 percent and 21.7 percent respectively (Table 7). Rice supply would decline by 2.8 percent, rice demand would increase by 2.4 percent, and rice import would increase be 1.692 million metric tons per annum. As a result, the net gain from the

52
16 percent cut of implicit tariff of rice would be around Rp1,832 billion, the consumer surplus gain would be Rp 4,910 billion and the producer surplus loss would be Rp 2,093 billion.
Table 7. Effects of Tariff Reduction on Rice, Maize, Soybean, and Potato
Tariff reductionsRice Maize Soybean PotatoEffects of tariff reductions on:
From 30% to14%
From 5% to0 %
From 5% to0 %
From 5% to0 %
a. Farm gate price (%) -12.6 -3.6 -3.3 -2.5
b. Yields (%) -1.4 -0.2 -9.6 -3.3
c. Farmers’ net returns (%) -21.7 -4.9 -4.6 -7.9
d. Domestic supply (%) -2.8 -1.7 -1.9 -2.2
e. Domestic demand (%) 2.4 3.1 1.6 0.3
f. Import (000 tons) 1,692 462 68 26
g. Consumer surplus (Rp bill/yr) 4,910 185.5 110.5 33.8
h. Producer loss (Rp bill/yr) 2,093 136.3 55.8 29.7
i. Gov. revenue loss (Rp bill/yr) 985 12.9 22.3 2.9
j. Net welfare gain (Rp bill/yr) 1,832 36.3 32.4 1.2
Source: summarized from Erwidodo and Hadi (1999).
COMPREHENDING THE BENEFIT OF CROP DIVERSIFICATION TO ALLEVIATE POVERTY
Price Related Policies
One important conclusion drawn is that agricultural diversification (including horizontal, regional and vertical diversification) may directly or indirectly have positive impacts on poverty alleviation since agricultural diversification may increase farmer’s income, reduce instability of rural income, foster rural economic growth, increase value added, create employment, improve diet for the people, and reduce import demand. However, developing agricultural diversification requires several conditions such as redirection of price-related policies, development of infrastructure, and enhancement of technology.
The impact of price stabilization policy through price support and import tariffs for rice in Indonesia has been empirically successful in maintaining the profitability of producing rice to encourage farmers to increase rice production. Farmers are responsive
53
to economic incentives in selecting crops to grow. However, giving incentives to a particular crop through price support implies disincentives to other commodities and therefore distorting the market mechanism. It is impossible to encourage food crop diversification if a strong price support policy for rice is maintained.
Expanding price stabilization policy of rice to maize and soybean is reasonable, but not for other CGPRT crops. Price stabilization policy may work well only when a particular commodity is less perishable for storage and has minor variations in quality. Nonetheless, since it is not easy for the government to establish an optimum pricing scheme that gives appropriate incentives for farmers to grow many crops, then pricing policy is not a good instrument to promote agricultural diversification (Timmer, 1990).
Since rice is the major staple food in Indonesia, food security, particularly for the poorest members of society is determined primarily by rice economy. In the short run, the level of rice price is the most important determinant of poverty at the household level because an individual household is either a net buyer or net seller of rice. High price of rice obviously would benefit net sellers of rice and, conversely, low price of rice would benefit net buyers of rice, particularly those who do not produce rice at all. This rice price dilemma has never been easily resolved (Timmer et al., 1983).
Almost all urban dwellers are net buyers of rice. About 14 percent of them are urban poor, while the proportion of the poor who reside in rural areas is also growing(see Table 8). In the rural areas, land is the most important productive asset and land ownership is a key determinant of both wealth and whether a particular household is a net buyer or a net seller of rice. The 1993 agricultural census indicates that about 28 percent of households own less than 0.25 ha of land, and most of them must be net buyers of rice because 0.25 ha of land is just enough to provide the average per capita consumption of rice for a family of five if the land is planted to rice. Note that rice-surplus farmers generate only about half of their family income from rice. A decline in rice-based income does not lead to proportional decline in household welfare. Timmer (2004) estimated that, when urban households are included, less than 20 percent of households are better off in the short run from higher rice prices, and very few of them are truly poor.
That rice prices play an important role in poverty reduction can be seen not only in terms of their direct effects on the poor segments of population but also in terms of structural transformation either in agriculture sector or in the economy as a whole. In agriculture sector, lower rice price would make rice production less profitable and, therefore, encourages rice farmers to diversify their cropping pattern and they can buy cheaper rice from the market. The farmers also begin to produce other crops such as fruits and vegetables that allow consumers to diversify their diet and increase their intake of protein, vitamin, and mineral. This process, however, needs to be led by market demand. To diversify rural economy leading to higher income and poverty reduction, there must be demand for commodities that farmers will grow instead of rice (Timmer, 2004).

54
Table 8. Number and Proportion of Population Under Poverty Line
Poverty line(Rp/cap/month)
Number of populationUnder poverty line (millions)
Proportion of populationUnder poverty line (%)Year
Urban Rural Urban Rural Total Urban Rural Total
1993 27,905 18,244 8.7 (33.6) 17.2 (66.4) 25.9 (100) 13.4 13.8 13.7
2002 130,499 96,512 13.3 (34.6) 25.1 (65.4) 38.4 (100) 14.46 21.10 18.4Source: BPS, Survei Sosial Ekonomi Nasional 1993 dan 2002, Figures in parentheses are the
percentages to the total
Low rice price also allows real wage to increase without any increase in the nominal wage paid by employers in industrial and service sectors of the economy. The combination of low nominal wage and high real wage would stimulate job creation and economic growth that are necessary for sustainable poverty reduction. It is worthwhile to note that the opposite direction may work as well. High rice price might encourage rice farmers to hire more workers, thus leading to higher nominal and real rural wages after correction of higher rice prices themselves. But the impact of such mechanisms depends crucially on the short-run increases of rice yields. Since rice yield have been levelling-off in the last several years, the impact of high rice price on employment would be trivial.
Non-Price Policies
Karama et al. (1992) identified several non-price related policies that may affects agricultural diversification: (a) macro-economic policies including fiscal, monetary, fiscal, and trade policies. These policies affect agricultural diversification andaffect inter sector and interregional movement of resources, growth and composition of agricultural production, and trade of agricultural production, (b) investment policies for infrastructures such as roads, transportation, communication, and information facilities. The implementation of these policies will reduce marketing costs, increase farm income and therefore encourage agricultural diversification, (c) agro-industry and export promotion policies. These policies will increase the demand for various agricultural products and therefore encourage agricultural diversification, and (d) agricultural technology development policy. This policy is important because no agricultural diversification program can obtain a success without appropriate agricultural technologies that enhance productivities.
CONCLUSIONS AND RECOMMENDATION
Most policies on production, marketing, price supports, food, and international trade of food crops in Indonesia have been biased toward rice. These rice-bias policies

55
have resulted in the decline of food crop diversification and food security has been heavily dependent on rice. Since developing irrigation is extremely expensive and competition in the use of diminishing water resources among agriculture, households, and industries has been very tight, it is essential that food crops be diversified. In order to promote food crop diversification, some policy changes are required: (1) Since price supports and import tariffs for food crops have been biased toward rice, the policies do not promote agricultural diversification, and therefore should be reduced gradually. Pricing-related policies are not good instruments to promote agricultural diversification because it is not easy to establish an optimum pricing scheme that gives appropriate incentives for the farmers to grow many crops; (2) Import tariff for imports of wheat and wheat products should be levied at least 15 percent. The government revenue from this tariff policy for wheat and wheat products should be devoted to improve competitive/comparative advantages of food crops and develop industrial demand for CGPRT crops through research and development.
REFERENCES
ADB, 2004. Agriculture and Rural Development Strategy Study. Collaborative Study (Indonesian Ministry of Agriculture, SEAMEO/SEARCA, Crescent, and IFPRI). ICASERD, Bogor.
Amang, B. and H.H. Sawit, 1999. Kebijakan Beras dan Pangan Nasional: Pelajaran dari Orde Baru dan Era Reformasi. Penerbit Institut Pertanian Bogor.
Anonymous, 1990. Penelitian Diversifikasi Pertanian dan Ketenaga-Kerjaan Tahap II. Kerjasama Penelitian antara Pusat Penelitian Agro Ekonomi Badan Litbang Pertanian dengan Lembaga Penelitian Institut Pertanian Bogor.
Anonymous, 2003. Analisa Daya Saing dan Struktur Proteksi Komoditas Palawija. Collaborative Study between Indonesian Centre for Agricultural Socio Economic Research and Development (ICASERD) and BAPPENAS/USAID/DAI, Bogor.
Badan Penelitian dan Pengembangan, Departemen Pertanian, Jakarta.
Bahri, S., B., Kustiari, R. Wittwer, G., 2002. Effects of Farm Policy Reform on Indonesia’s Secondary Food Crops, 2002. In Stringer, R., Erwidodo, Reidhanusetiawan, T., and Anderson, K. (eds.). Indonesia in a Reforming Economy: Effects on agriculture, trade and the environment. Centre for International Economic Studies. University of Adelaide, Australia.
Erwidodo and P.U. Hadi, 1999. Effects of Trade Liberalization on Agriculture in Indonesia: Institutional and Structural Aspects. Working Paper 41. The CGPRT Centre, Bogor
Erwidodo and P.U. Hadi, 1999. Effects of Trade Liberalization on Agriculture in Indonesia: Commodity Aspects. Working Paper 48. The CGPRT Centre, Bogor.
F., E. Pasandaran, and A.M. Fagi (eds): Ekonomi Padi dan Beras Indonesia.
Hasan, I.,1994. Menyukseskan Swasembada Pangan. Pangan, Vol.5, No.18, pp.9-15. Bolog, Jakarta.

56
Hedley, D.D. 1987. Diversification: Concepts and Directions in Indonesian Agricultural Policy. In Bottema, J.W.T., Dauphin, F., and Gijsbers, G. (eds): Soybean Reasearch and Development in Indonesia, CGPRT No. 10. The CGPRT Centre, Bogor.
Irawan, B., B. Winarso, I. Sadikin, and G.S. Hardono, 2002. Analisis Faktor Penyebab
Joshi, P.K., A. Gulati, P.S.Birthal, and L Tewari, 2003. Agriculture Diversification in South Asia: Patterns, Determinants, and Policy Implications.MSSD Discussion Paper No.57. International Food Policy Research Institute, Washington D.C.
Karama, A.S., Erwidodo, D.A. Darmawan, and E.B. Oyer, 1992. Agricultural Diversification and Its Impacts on Income Generation in Rural Areas. In proceeding of seminar and workshop on Poverty Alleviation With Sustainable Agricultural and Rural Development in Indonesia, organized by CASER and CIIFAD, Bogor.
Kasryno, F., A.M. Fagi, E. Pasandaran, 2004. Kebijakan Produksi Padi dan Diversifikasi Pertanian. In Kasryno, F., E. Pasandaran, and A.M. Fagi (eds): Ekonomi Padi dan Beras Indonesia. Badan Penelitian dan Pengembangan, Departemen Pertanian, Jakarta.
Magiera, S.L. 1981. Wheat Floor Consumption in Indonesia, BIES, VII (1). Canberra.
Martianto, D., and M. Ariani, 2004. Analisis Perubahan Konsumsi dan Pola Konsumsi Pangan Masyarakat Indonesia Dalam Dekade Terakhir, Paper presented in Widyakarya Nasional Pangan dan Gizi, 17-19 May, 2004, Jakarta.
Pelambatan Produksi Komoditas Pangan Utama. ICASERD, Bogor.
Pinggali, P.L. and Rosegrant. 1995. Diversifying Asian Rice Farming System: A Deterministic Paradigm. In Trends in Agricultural Diversification: Regional Perspective. Paper No. 180, pp. 107-26. Washington, D.C. The World Bank.
Sawit, M. H. 2003. Kebijakan Gandum/Terigu Harus Mampu Menumbuh dan Mengembangkan Industri Pangan Dalam Negeri. Analysis Kebijakan Pertanian (Agricultural Policy Analysis), Vol.1, No.2. Indonesian Centre for Agricultural Socio Economic Research and Development (ICASERD), Bogor.
Simatupang, P,. Marwoto, D.K.S. Swastika. 2005. Pengembangan Kedelai dan Kebijakan Penelitian di Indonesia. Makalah pada Lokakarya Pengembangan Kedelai di Lahan Sub-Optimal. BALITKABI, Malang.
Simatupang, P. 1989. Perkembangan Diversifikasi Produk Pangan di Indonesia, 1968-1987. Analisis CSIS: Menggapai Keadilan Sosial. Centre for Strategic and
International Studies, Jakarta.
Siregar, M. dan Sumaryanto. 2003. Analisis Daya Saing Usahatani Jagung di DAS Brantas. Working Paper No.23, ICASER, Bogor.
Siregar, M. dan Sumaryanto. 2003. Analisis Daya Saing Usahatani Kedelai di DAS Brantas. Jurnal Agro Ekonomi, 21 (1), ICASER, Bogor.
Suryana, A., and Hermanto. 2004. Kebijakan Ekonomi Perberasan Nasional. In Kasryno,
Timmer, C.P. 1990. Agricultural Diversification in Asia: Lessons from the 1980s and Issues for the1990s. Paper presented in a Workshop on Agricultural Diversification, Bogor, March 20-22.

57
Timmer, C.P. 2004. Indonesia’s Food Security in the Era of Surpermarkets : Supply Chains and Consumer Response. Paper presented in the Workshop Food and Nutrition (Widyakarya Nasional Pangan dan Gizi), Jakarta, 17-19 May 2004.
Timmer, C.P., W.P. Falcon, and S.R. Pearson. 1983. Food Policy Analysis. John Hopkins University Press for the World Bank. Baltimore, MD.