center for crop diversification ... 2014 user surve… · center for crop diversification feedback...
TRANSCRIPT

www.uky.edu/Ag/CCD/
Center for Crop Diversification Feedback Survey (AEC 2014-16)
September 2014 Miranda Hileman Combs1, Matt Ernst2, Timothy A. Woods3
1. Center History The Center for Crop Diversification (CCD) at the University of Kentucky is a virtual resource center offering printed and electronic resources on a variety of crops and marketing channels. This information is free and always electronically accessible. Small farmers across the region and the U.S. use Center resources, as do mid-sized and large producers, in decision-making and planning. Funding in 2013 from The Kentucky Agricultural Development Fund allowed expansion of the Center's Web-based marketing and production resources. These funds were used to develop online podcasts, webinars, video training, expanded price reports and new publications to meet the high demand for crop diversification information. Producers and Extension educators from surrounding states utilize many of the Center’s crop and marketing profiles, interactive crop budgets, and price reports. The CCD collaborates with Extension personnel in surrounding states to offer improved educational programming, aiming to increase and improve both producer and educator resources available through the CCD during the next several years. Specialty crops are defined by the USDA as “fruits and vegetables, tree nuts, dried fruits and horticulture and nursery crops, including floriculture.” Interest in producing and marketing specialty crops is consistently supported by the USDA, and efforts to disseminate research about the past performance and future potential of specialty crops in Kentucky continue at the University of Kentucky’s Center for Crop Diversification. The Center seeks to educate producers and Extension personnel who are seeking to identify profitability and farm viability options through specialty crops. Formerly known as the New Crop Opportunities Center and the Crop Diversification & Biofuel Research & Education Center (CDBREC), the Center coordinated multi-disciplinary teams of faculty, staff and students to establish research and set guidelines for producing and marketing selected crops at a profit. The Center was funded by a Special Research Grant from the USDA from July 1, 2000, to June 30, 2013.
1 Miranda Hileman Combs is a Senior Extension Associate in the Department of Agricultural Economics. She can be reached by phone at (859) 218-4384 or by email at [email protected]. 2 Matt Ernst is an independent contractor with the Department of Agricultural Economics. 3 Timothy A. Woods is an Extension Professor in the Department of Agricultural Economics. He can be reached by phone at (859) 257-7270 or by email at [email protected].

2
KY 64%
IN 13%
OH 7%
IL 5%
WV 5%
TN 4%
Other 2%
Figure 1. Response by State (n=119)
2. Extension Needs Related to Specialty Crops The Center launched a feedback survey in June 2014 asking respondents to evaluate the Center for Crop Diversification’s resources and website. Resources and programs from the CCD have tended toward a more regional nature, but a meaningful evaluation of the Center is needed, particularly as more formal regional collaboration is being pursued. The survey was sent to 467 regional technical support professionals, including Agriculture and Natural Resource (ANR) and Horticulture (HORT) agents, Extension Specialists, regional university collaborators and other agencies working with specialty crops in Kentucky and specialty crop support staff in surrounding states (mainly OH, IL, IN, TN, WV). Extension and related agency staff working with producers exploring specialty crops were targeted to provide an evaluation of the CCD resources, use of the resources in local programming, and additional resources and program needs that could potentially be provided through the Center. A total of 119 usable responses were received and are summarized here.
3. Agent Background and Affiliation We requested survey responses from a variety of Extension personnel as well as a diverse group of agency staff working with specialty crop producers. The majority of respondents came from Kentucky (Figure 1), with county-based ANR Extension personnel most likely to respond (Tables 1 & 2). A substantial number of responses (23%) also came from regional/state Extension personnel (Table 2). Responses were most likely from staff with eight or more years at their position (Table 3). The majority of respondents (85%) communicate regularly with horticulture-based clients (Table 4). The majority of respondents were Extension educators in Kentucky serving specialty crop clients, but a diversity
of agencies utilize the Center resources. Responses from states surrounding Kentucky indicate Extension educators in the region are already utilizing Center resources. There is a relatively high turnover and/or new support being put in place – around 1/3 of the individuals have been in their position for 4 years or less.
Table 1. Response by Institution or Agency (n=119)
Institution or Agency Number of Respondents % of Total Respondents
County-based Extension 80 67%
Regional or State Extension 27 23%
State Department of Agriculture 2 2%
Co-op/business development agency 4 3%
Other 6 5%

3
Table 2. Response by Agent or Educator (n=118)
Agent or Educator Number of Respondents % of Total Respondents
Agriculture and Natural Resource (ANR) 57 48%
Horticulture (HORT) 15 13%
Extension Specialist 17 14%
Extension Educator 4 3%
Extension Administration 2 2%
Local Food Systems and Small Farms Educator 5 4%
Other/Does not apply 18 15%
Table 3. Time Respondents Worked in this Position (n=118)
Length of Time Number of Respondents % of Total Respondents
Less than 1 year 9 8%
1 – 2 years 18 15%
3 – 4 years 12 10%
5 – 6 years 4 3%
7 – 8 years 11 9%
More than 8 years 64 54%
Table 4. Respondents Who Regularly Communicate with Horticulture-Based Clients (n=88)
Number of Respondents % of Total Respondents
No 13 15%
Yes 75 85%
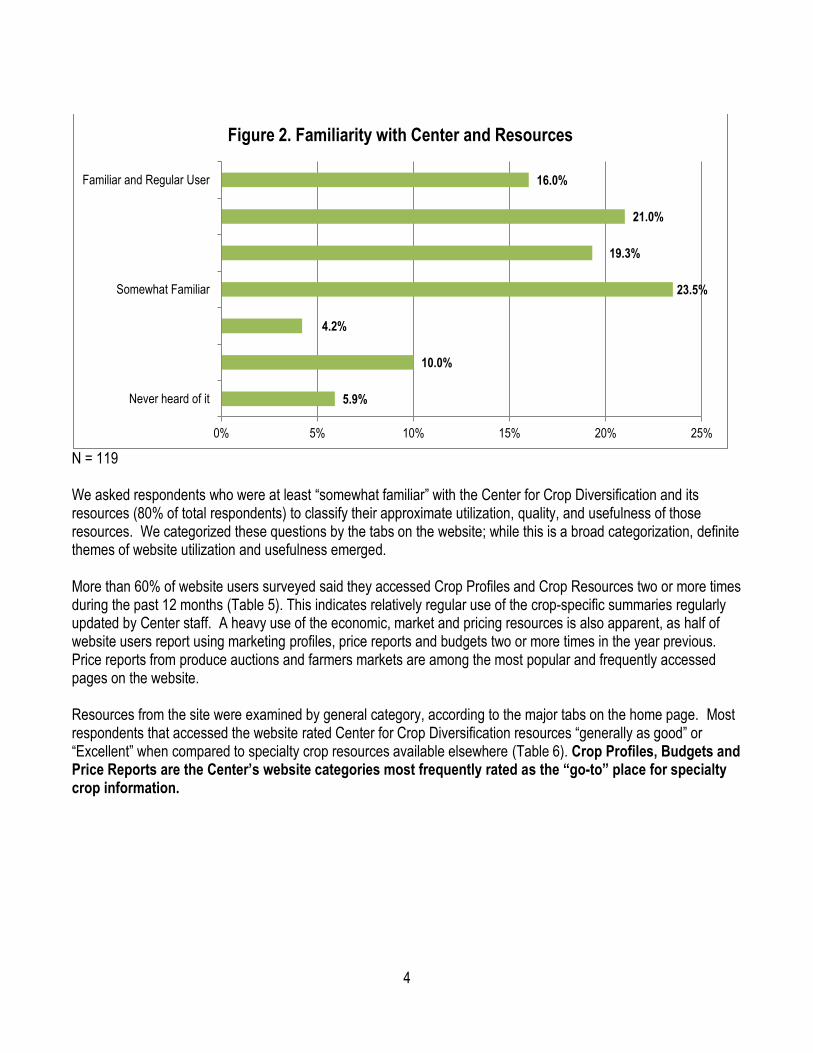
4. Evaluation of Resources On a scale rating familiarity with the Center for Crop Diversification and its resources, 16% of respondents noted they are a familiar and regular user of the website, while 64% responded that they are somewhat familiar with the website and Center resources (Figure 2). The other 20% of respondents who were unfamiliar with the Center for Crop Diversification and its resources were directed to the end of the survey where the questions related to future programming and resource creation. There is clearly a need to more widely promote the Center across the region. Agents in Kentucky and contiguous states are increasingly involved in regional work (see section 6); about 1/3 of those responding were from outside the state. It’s reasonable to expect there would be a much lower rate of familiarity about the Center among those that did not respond. ANR and HORT agents in Kentucky are introduced to the Center during an initial orientation, but wider and more frequent promotion is needed. ANR agents are commonly asked at least some questions related to specialty crops and should be aware of the profiles and marketing resources offered by the Center. Agents that have found their way to the Center appear to be actively utilizing the resources. The Center started an active effort to have a physical presence at the major specialty crop producer trade shows regionally in 2013-14.
4
N = 119 We asked respondents who were at least “somewhat familiar” with the Center for Crop Diversification and its resources (80% of total respondents) to classify their approximate utilization, quality, and usefulness of those resources. We categorized these questions by the tabs on the website; while this is a broad categorization, definite themes of website utilization and usefulness emerged. More than 60% of website users surveyed said they accessed Crop Profiles and Crop Resources two or more times during the past 12 months (Table 5). This indicates relatively regular use of the crop-specific summaries regularly updated by Center staff. A heavy use of the economic, market and pricing resources is also apparent, as half of website users report using marketing profiles, price reports and budgets two or more times in the year previous. Price reports from produce auctions and farmers markets are among the most popular and frequently accessed pages on the website. Resources from the site were examined by general category, according to the major tabs on the home page. Most respondents that accessed the website rated Center for Crop Diversification resources “generally as good” or “Excellent” when compared to specialty crop resources available elsewhere (Table 6). Crop Profiles, Budgets and Price Reports are the Center’s website categories most frequently rated as the “go-to” place for specialty crop information.
5.9%
10.0%
4.2%
23.5%
19.3%
21.0%
16.0%
0% 5% 10% 15% 20% 25%
Never heard of it
Somewhat Familiar
Familiar and Regular User
Figure 2. Familiarity with Center and Resources

5
Table 5. Approximate Use of Resources Over Last 12 Months (n=90)
Website tabs Not
Used Used Once Used 2 – 5 Times
Used More than 5 Times
Total Respondents
Using 2 or More Times
Research 29 20 28 9 86 43%
Crop Resources 20 13 37 20 90 63%
Crop Profiles 16 13 32 26 87 67%
Decision Tools 29 27 23 7 85 35%
Budgets 27 16 27 17 87 51%
Marketing 26 19 29 13 86 49%
Price Reports 33 12 20 24 88 50%
Related Sites 41 17 15 10 83 30%
Events 49 17 10 8 84 21%
Table 6. Quality and Usefulness of Resources (n=89)
Website Tabs
Not Used – no basis
for knowing
Not adequate
for the need
Adequate, but better resources elsewhere
Generally as good
Excellent Resources, my
“go to” place for specialty crop
information Total
Respondents
Research 26 1 8 40 12 87
Crop Resources 18 0 5 47 18 88
Crop Profiles 10 0 5 40 30 85
Decision Tools 23 2 6 47 7 84
Budgets 22 1 3 40 21 86
Marketing 23 2 7 44 9 85
Price Reports 22 2 6 39 20 87
Related Sites 35 2 9 33 6 84
Events 41 2 4 32 4 83
Survey respondents generally found the Center’s website user-friendly; 30% of respondents rated it very easy to navigate. Only 1% responded that they cannot find anything they are looking for on the website. The other 69% submitted a rating somewhere between the two extremes. The average rating was a 5.86 on a 1-10 scale, with 90% of users indicating some ease in website navigation. Respondents indicate the Center for Crop Diversification offers resources that are both high-quality and easily
accessible. Respondents indicate particular strength in the Center’s Crop Profiles, Budgets and Price Reports website sections. The website rates above average for ease of navigation, according to those surveyed.

6
5. Estimated Producer Impact from Center Utilization by Agents and Specialists We asked several questions relating to website use and referrals to infer how producers become aware of the Center for Crop Diversification and its resources. Respondents estimated more than 2,000 specialty crop clients were impacted by the Center in the last 12 months, through either website referrals or materials printed from the website. This confirmed anecdotes from Kentucky Extension staff who have stated they value accessing and printing Center materials, especially crop profiles, directly from the website. Direct impacts are estimated from completed surveys and summarized below. Estimates were obtained by multiplying the answer choice by the number of respondents who chose that answer. Estimated use by non-respondents, using a utilization rate of 25% of those responding, suggests an additional 1,500 specialty crop clients impacted by the CCD website. Supporting agents in the region that are seeking to provide direct local assistance with a variety of specialty crop production and marketing questions is a major goal of the Center. A total annual impact of 3,500 regional agent-to-specialty crop clients appears in line, and perhaps an underestimate, when compared against the average annual pageviews as tabulated by a Google Analytics query (Table 7). It is important to note that, as users gain familiarity with the site, site users often proceed directly to lower-level Web pages. There are certainly a large number of additional specialty crop clients going directly to the Center site. This is illustrated even in the large number of pageviews on the produce auction and farmers market price reports pages, reported in Table 7. Table 7. CCD Website Pageviews During the Past 24 Months (Google Analytics)
Website Tabs July 16, 2012 to
July 15, 2014 Simple Annual
Average
Research 726* 363*
Crop Resources 866 433
Crop Profiles 15,218 7,609
Decision Tools 1,182 591
Budgets 5,934 2,967
Marketing 2,085 1,042
Price Reports (Main Page) 2,585 1,292
Auction Price Reports 28,277 14,138
Farmers Market Price Reports 16,398 8,199
Related Sites 533 266
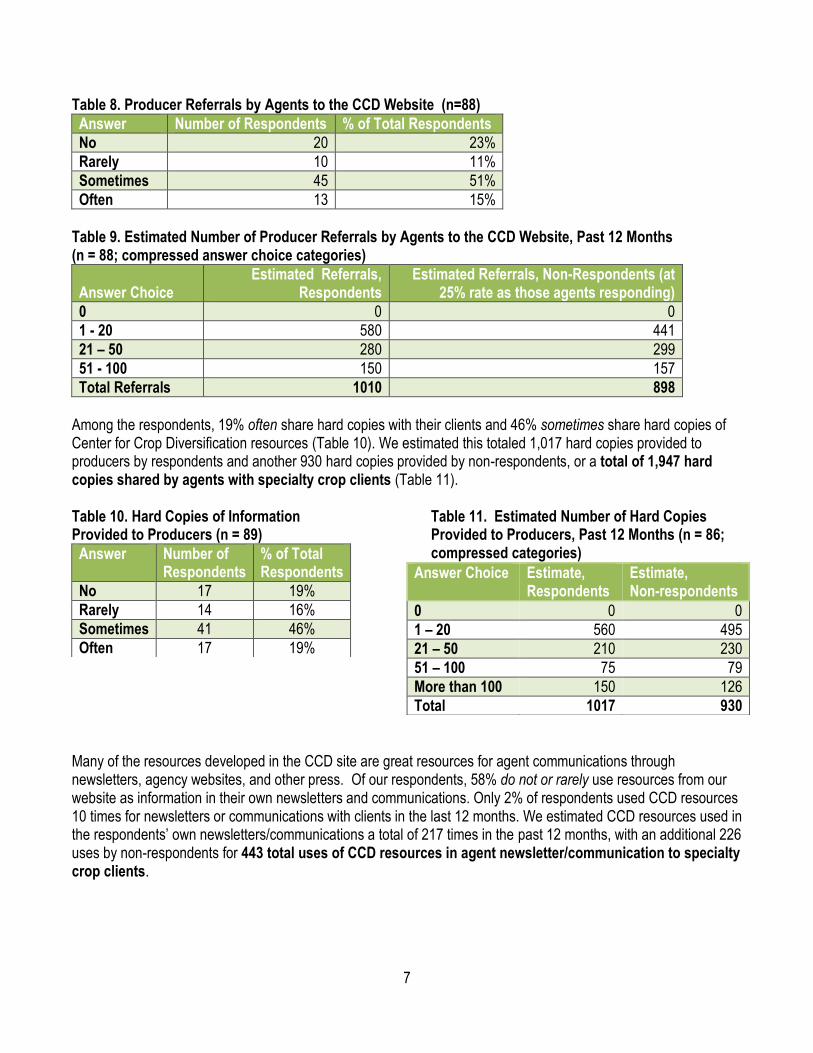
Events 1,281 640 * This value is only for the research tab and does not reflect greater numbers of pageviews of individual research reports accessed directly from Web searches and/or other links. Thanks to Christy Cassady for providing these data. A majority of agency respondents refer producers to the CCD website; 51% refer “Sometimes” and 15% refer “Often” (Table 8). Respondents made an estimated 1,030 referrals to the website during the last 12 months (Table 9). We estimate usage from those agents not responding at about 25% the rate of respondents for the purposes of approximating total reach. Using this estimated rate, 1,908 referrals of specialty crop producers by agents were made to the site over the past 12 months.
7
Table 8. Producer Referrals by Agents to the CCD Website (n=88)
Answer Number of Respondents % of Total Respondents
No 20 23%
Rarely 10 11%
Sometimes 45 51%
Often 13 15%
Table 9. Estimated Number of Producer Referrals by Agents to the CCD Website, Past 12 Months (n = 88; compressed answer choice categories)
Answer Choice Estimated Referrals,
Respondents Estimated Referrals, Non-Respondents (at
25% rate as those agents responding)
0 0 0
1 - 20 580 441
21 – 50 280 299
51 - 100 150 157
Total Referrals 1010 898
Among the respondents, 19% often share hard copies with their clients and 46% sometimes share hard copies of Center for Crop Diversification resources (Table 10). We estimated this totaled 1,017 hard copies provided to producers by respondents and another 930 hard copies provided by non-respondents, or a total of 1,947 hard copies shared by agents with specialty crop clients (Table 11). Table 10. Hard Copies of Information Provided to Producers (n = 89)
Table 11. Estimated Number of Hard Copies Provided to Producers, Past 12 Months (n = 86; compressed categories)
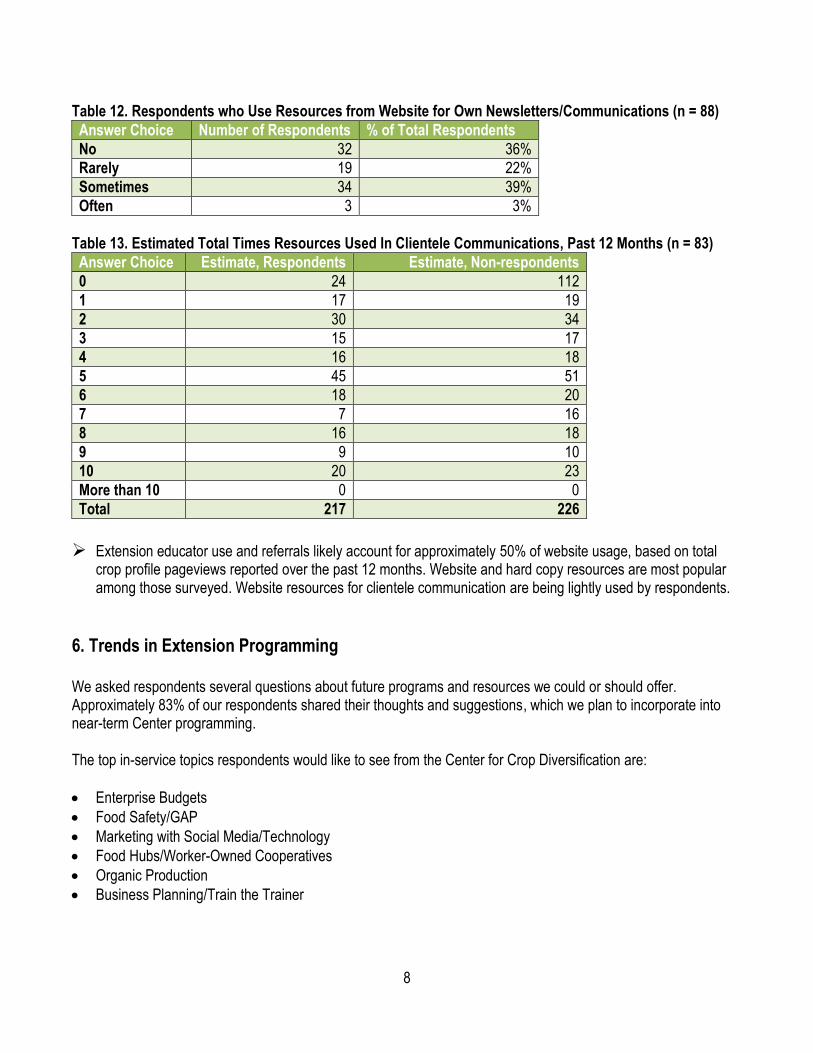
Many of the resources developed in the CCD site are great resources for agent communications through newsletters, agency websites, and other press. Of our respondents, 58% do not or rarely use resources from our website as information in their own newsletters and communications. Only 2% of respondents used CCD resources 10 times for newsletters or communications with clients in the last 12 months. We estimated CCD resources used in the respondents’ own newsletters/communications a total of 217 times in the past 12 months, with an additional 226 uses by non-respondents for 443 total uses of CCD resources in agent newsletter/communication to specialty crop clients.
Answer Number of Respondents
% of Total Respondents
No 17 19%
Rarely 14 16%
Sometimes 41 46%
Often 17 19%
Answer Choice Estimate, Respondents
Estimate, Non-respondents
0 0 0
1 – 20 560 495
21 – 50 210 230
51 – 100 75 79
More than 100 150 126
Total 1017 930
8
Table 12. Respondents who Use Resources from Website for Own Newsletters/Communications (n = 88)
Answer Choice Number of Respondents % of Total Respondents
No 32 36%
Rarely 19 22%
Sometimes 34 39%
Often 3 3%
Table 13. Estimated Total Times Resources Used In Clientele Communications, Past 12 Months (n = 83)
Answer Choice Estimate, Respondents Estimate, Non-respondents
0 24 112
1 17 19
2 30 34
3 15 17
4 16 18
5 45 51
6 18 20
7 7 16
8 16 18
9 9 10
10 20 23
More than 10 0 0
Total 217 226
Extension educator use and referrals likely account for approximately 50% of website usage, based on total
crop profile pageviews reported over the past 12 months. Website and hard copy resources are most popular among those surveyed. Website resources for clientele communication are being lightly used by respondents.
6. Trends in Extension Programming We asked respondents several questions about future programs and resources we could or should offer. Approximately 83% of our respondents shared their thoughts and suggestions, which we plan to incorporate into near-term Center programming. The top in-service topics respondents would like to see from the Center for Crop Diversification are:
Enterprise Budgets
Food Safety/GAP
Marketing with Social Media/Technology
Food Hubs/Worker-Owned Cooperatives
Organic Production
Business Planning/Train the Trainer

9
Production and marketing training for producers, as well as additional crop profiles, were most frequently listed as future programming desired by respondents (Table 14). Respondents were almost evenly split on their desire for videos and webinars, with at least one respondent noting bandwidth speed is an issue. Table 14. Types of Future Programming Desired by Respondents
Type of Programming % Respondents
Videos 47%
Webinars 47%
Podcasts 14%
Production Training for Producers 61%
Management Training for Producers 38%
Marketing Training for Producers 55%
Decision-making tools 46%
New Crop Profiles 57%
New Marketing Profiles 41%
N = 99
Respondents were encouraged to offer additional comments on this question. Selected responses included:
“I think hands-on production training for producers has the potential to be particularly effective. Our capabilities for this type of training at the South Farm have been enhanced with new facilities and a new farm manager.”
“Resources for the beginning farmer…especially…what do I do with my 5 acres? These folks have special and diverse needs.”
“We need entrepreneurial training on how to run a profitable business, different types of business structures, and we need training on setting up and running food hubs, cooperative groceries, etc.”
“Organic weed control and possibly Radio mp3 files that could be added to programming efforts.”
“Our clients often need a lot of hand holding in all aspects of their businesses, but don’t necessarily have time for webinars. They often need access to info that isn’t available and more detailed/specific from USDA websites – the center excels in this.”
“Limited internet bandwidth makes anything other than text very slow.”
1.0%
9.3%
54.6%
29.9%
5.2%
2.1%
4.1%
36.1%
42.3%
15.5%
0% 10% 20% 30% 40% 50% 60%
Decreased a lot
Decreased some
Stayed about the same
Increased some
Increased a lot
Figure 4. Current and Expected Regional Program Participation for Specialty Crops (n=97)
Expected
Current
10
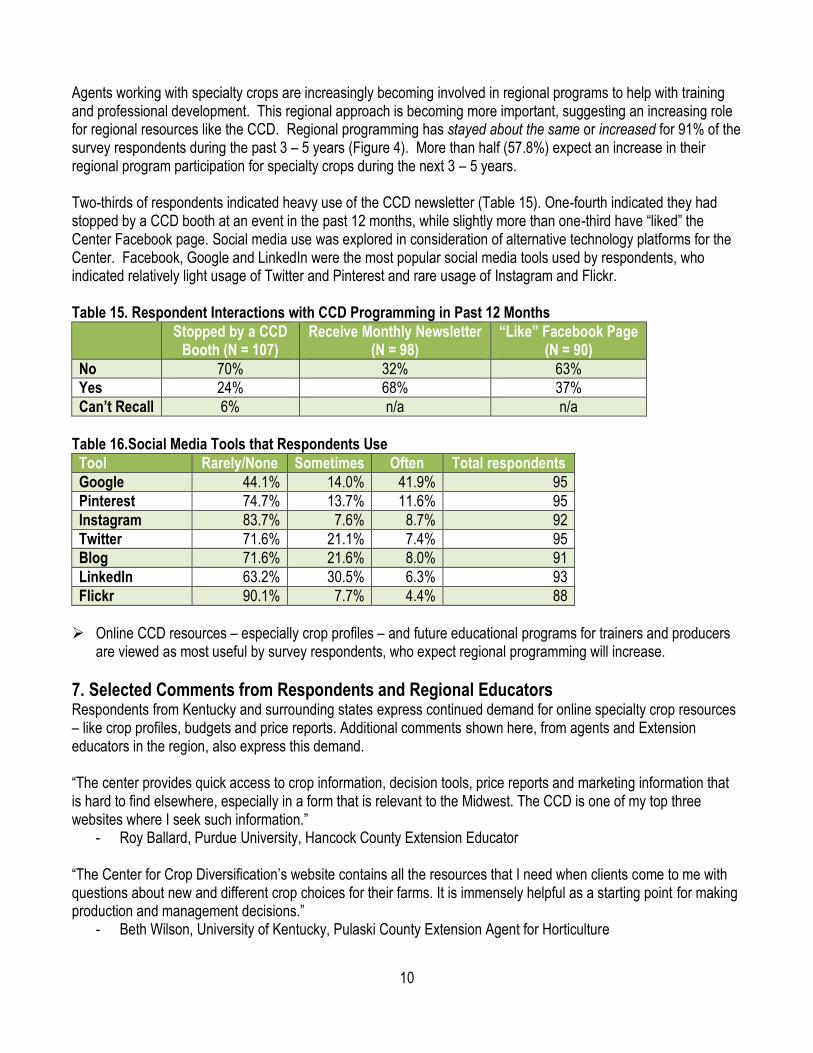
Agents working with specialty crops are increasingly becoming involved in regional programs to help with training and professional development. This regional approach is becoming more important, suggesting an increasing role for regional resources like the CCD. Regional programming has stayed about the same or increased for 91% of the survey respondents during the past 3 – 5 years (Figure 4). More than half (57.8%) expect an increase in their regional program participation for specialty crops during the next 3 – 5 years. Two-thirds of respondents indicated heavy use of the CCD newsletter (Table 15). One-fourth indicated they had stopped by a CCD booth at an event in the past 12 months, while slightly more than one-third have “liked” the Center Facebook page. Social media use was explored in consideration of alternative technology platforms for the Center. Facebook, Google and LinkedIn were the most popular social media tools used by respondents, who indicated relatively light usage of Twitter and Pinterest and rare usage of Instagram and Flickr. Table 15. Respondent Interactions with CCD Programming in Past 12 Months
Stopped by a CCD Booth (N = 107)
Receive Monthly Newsletter (N = 98)
“Like” Facebook Page (N = 90)
No 70% 32% 63%
Yes 24% 68% 37%
Can’t Recall 6% n/a n/a
Table 16.Social Media Tools that Respondents Use
Tool Rarely/None Sometimes Often Total respondents
Google 44.1% 14.0% 41.9% 95
Pinterest 74.7% 13.7% 11.6% 95
Instagram 83.7% 7.6% 8.7% 92
Twitter 71.6% 21.1% 7.4% 95
Blog 71.6% 21.6% 8.0% 91
LinkedIn 63.2% 30.5% 6.3% 93
Flickr 90.1% 7.7% 4.4% 88
Online CCD resources – especially crop profiles – and future educational programs for trainers and producers
are viewed as most useful by survey respondents, who expect regional programming will increase.
7. Selected Comments from Respondents and Regional Educators Respondents from Kentucky and surrounding states express continued demand for online specialty crop resources – like crop profiles, budgets and price reports. Additional comments shown here, from agents and Extension educators in the region, also express this demand. “The center provides quick access to crop information, decision tools, price reports and marketing information that is hard to find elsewhere, especially in a form that is relevant to the Midwest. The CCD is one of my top three websites where I seek such information.”
- Roy Ballard, Purdue University, Hancock County Extension Educator “The Center for Crop Diversification’s website contains all the resources that I need when clients come to me with questions about new and different crop choices for their farms. It is immensely helpful as a starting point for making production and management decisions.”
- Beth Wilson, University of Kentucky, Pulaski County Extension Agent for Horticulture

11
“As an agent, I rely on the Center for Crop Diversification website every time I get a question from clientele about a crop or process that I’m unfamiliar with. Farmers and landowners are looking for niche markets or seeking the next great money making crop while homeowners will want to experiment with something like hops for instance. There’s no way I can be familiar with all of the possible scenarios out there so I send them the Center for Crop Diversification link or mail them the publication. Armed with that profile we decide if they want to pursue it further and if so, there’s plenty of links provided. With all the resources it’s almost a one-stop-shop.”
- Keenan Bishop, University of Kentucky, Franklin County Extension Agent for ANR “As a commercial Horticulture Specialist and Agriculture Extension Educator I work with small acreage farmers that need to generate high value returns from their limited small acreage Appalachian farms. The Center for Crop Diversification has the best all around “package” of educational materials and resources providing me one stop shopping to get the necessary research based educational materials needed to teach and train my farmer clientele looking to diversify into high value specialty crops.”
- Brad Bergefurd, Ohio State University, Commercial Horticulture Extension Specialist “CCD resources are a useful tool for my clients in Illinois; especially those getting started in farming.”
- Deborah Cavanaugh-Grant, University of Illinois Extension, Local Food Systems and Small Farms Educator
“I have found both University of Kentucky personnel and the UK CCD website to provide timely, useful, easy to understand information on a wide variety of topics of interest to specialty growers I work with. Most recently, our team began a pilot Illinois Farmers Market Price Reporting project with CCD at six farmers markets throughout Illinois.”
- Steve Ayers, University of Illinois Extension, Local Food Systems Small Farms Educator
“The UK Center for Crop Diversification provides crop information, decision tools and marketing information that is helpful to many of the farmers that we work with; especially those considering a new crop enterprise. The website provides quick access to information that is useful and relevant; we utilize the information for many of the projects we analyze and we often refer clients and Extension Agents directly to it.”
- Rob Holland, Director, Center for Profitable Agriculture (University of Tennessee Extension)
7. Implications for Future Center for Crop Diversification Programming
The survey indicates the Center for Crop Diversification website is fulfilling a key need for providing specialty crop educational materials and enterprise analysis to Extension and agency educators in Kentucky and surrounding states. The website is also being seen as a regional resource directory for specialty crop marketing with the expansion of produce auction and farmers market price reports. The Center’s resources are viewed as being accessible to both established farmers and less-traditional but emerging clientele like the acreage owner. Based on survey responses, future plans for the Center for Crop Diversification can include:
Promoting the Center and all of our specialty crop resources more effectively
Educating Extension agents, educators and producers about how to use our website and resources
Providing trainings on specialty crop production, marketing, management, high tunnel production, and organic production for Extension agents and producers
Working with regional partners to develop resources and information relevant to our entire region
Making recent and very important information more easily accessible on the website
Creating more detailed crop production information to be used as a “Part 2” to our current crop profiles

12
Creating understandable and easily accessible decision-making tools for producers to narrow down specialty crop options specific to their situation
Updating enterprise budgets more regularly, generating new budgets, and creating opportunities to teach users how to use the budgets several times a year
Sharing video case studies of successful specialty crop producers and marketers who are willing to share lessons learned through their journey
Creating a partnership with the Kentucky Department of Agriculture to design a comprehensive GAP and Food Safety Training Program for Kentucky producers
Making newsletter articles and “press releases” about new specialty crop information more accessible to agents for their own monthly newsletters
Sharing monthly crop updates from UK research farms for agents to use in their monthly newsletters
Sharing innovative and technology-oriented marketing tools and strategies for Extension agents to teach their producers
Partnering with regional organizations to spread the word about our resources
Creating and widely disseminating information about starting food hubs, worker-owned cooperatives, etc.
Possibly adding business planning resources to our website in partnership with the Kentucky Small Business Development Center and/or the Kentucky Center for Agricultural and Rural Development
Previously reviewed by Christy Cassady, Extension Specialist in the Department of Horticulture.
Educational programs of Kentucky Cooperative Extension serve all people regardless of race, color, age, sex, religion, disability, or national origin.