cash transfers and climate-resilient development
TRANSCRIPT

Cash Transfers and Climate-resilient Development
Evidence from Zambia’s Child Grant Programme
Kathleen Lawlor, Sudhanshu Handa, David Seidenfeld
and the Zambia Cash Transfer Evaluation Team
Office of Research Working Paper
WP-2015-03 | May 2015

2
INNOCENTI WORKING PAPERS
UNICEF Office of Research Working Papers are intended to disseminate initial research contributions
within the programme of work, addressing social, economic and institutional aspects of the realization
of the human rights of children.
The findings, interpretations and conclusions expressed in this paper are those of the authors and do
not necessarily reflect the policies or views of UNICEF.
This paper has been extensively peer reviewed both internally and externally.
The text has not been edited to official publications standards and UNICEF accepts no responsibility for
errors.
Extracts from this publication may be freely reproduced with due acknowledgement. Requests to
utilize larger portions or the full publication should be addressed to the Communication Unit at
For readers wishing to cite this document we suggest the following form:
Lawlor, K., Handa, S., Seidenfeld, D. and the Zambia Cash Transfer Evaluation Team (2015). Cash
Transfers and Climate-resilient development: Evidence from Zambia’s Child Grant Programme,
Innocenti Working Paper No.2015-03, UNICEF Office of Research, Florence.
© 2015 United Nations Children’s Fund (UNICEF)
ISSN: 1014-7837

3
THE UNICEF OFFICE OF RESEARCH
In 1988 the United Nations Children’s Fund (UNICEF) established a research centre to support its
advocacy for children worldwide and to identify and research current and future areas of UNICEF’s
work. The prime objectives of the Office of Research are to improve international understanding of
issues relating to children’s rights and to help facilitate full implementation of the Convention on the
Rights of the Child in developing, middle-income and industrialized countries.
The Office aims to set out a comprehensive framework for research and knowledge within the
organization, in support of its global programmes and policies. Through strengthening research
partnerships with leading academic institutions and development networks in both the North and
South, the Office seeks to leverage additional resources and influence in support of efforts towards
policy reform in favour of children.
Publications produced by the Office are contributions to a global debate on children and child rights
issues and include a wide range of opinions. For that reason, some publications may not necessarily
reflect UNICEF policies or approaches on some topics. The views expressed are those of the authors
and/or editors and are published in order to stimulate further dialogue on child rights.
The Office collaborates with its host institution in Florence, the Istituto degli Innocenti, in selected
areas of work. Core funding is provided by the Government of Italy, while financial support for specific
projects is also provided by other governments, international institutions and private sources,
including UNICEF National Committees.
Extracts from this publication may be freely reproduced with due acknowledgement. Requests to
translate the publication in its entirety should be addressed to: Communications Unit,
For further information and to download or order this and other publications, please visit the website
at www.unicef-irc.org.
Correspondence should be addressed to:
UNICEF Office of Research - Innocenti
Piazza SS. Annunziata, 12
50122 Florence, Italy
Tel: (+39) 055 20 330
Fax: (+39) 055 2033 220
www.unicef-irc.org

4
CASH TRANSFERS AND CLIMATE-RESILIENT DEVELOPMENT: EVIDENCE FROM ZAMBIA’S CHILD GRANT PROGRAMME Kathleen Lawlor ([email protected])*, Sudhanshu Handa, David Seidenfeld and the Zambia Cash Transfer Evaluation Team
*corresponding author
UNICEF Office of Research
Abstract. Climate change is projected to dramatically disrupt rainfall patterns and agricultural yields in
Sub-Saharan Africa, potentially stalling and even reversing gains that have been made in the region’s
fight against poverty. Many of the coping strategies the rural poor use to cope with failed harvests and
other negative income shocks, such as reducing food consumption, selling off productive assets, and
pulling children out of school, can mire households in poverty traps – the self-reinforcing conditions
that cause poverty to persist. Avoiding detrimental coping strategies that degrade households’
capabilities, and thus ability to escape poverty, is essential for building resilience to climate change.
This study investigates whether cash transfers enable households facing weather and other negative
shocks to avoid coping strategies that lead to poverty traps. We capitalize on the randomized roll-out
of Zambia’s Child Grant programme and a panel of 2,515 households to estimate impacts. The
programme provides a monthly cash payment of 60 kwacha (U.S. $12) to poor households with
children under the age of five. We find that in the face of shocks, cash empowers poor, rural
households to employ coping strategies typically used by the non-poor, such as spending savings, and
also enables them to substantially increase their food consumption and overall food security. This
evidence demonstrates that extending relatively small cash payments unconditionally to the rural poor
is a powerful policy option for fostering climate-resilient development.
Keywords: climate resilience, poverty, cash transfers, nutrition, Zambia
Acknowledgements: This paper analyzes data collected for the impact evaluation of the Zambian Child
Grant Programme, which is being implemented by the American Institutes for Research and the
University of North Carolina at Chapel Hill under contract to UNICEF-Zambia. The evaluation is
commissioned by the Government of Zambia’s Ministry of Community Development, Mother and Child
Health, with support from DFID, Irish Aid, and UNICEF-Zambia. The members of the evaluation team,
listed by affiliation and then alphabetically within affiliation are: American Institutes of Research (Juan
Bonilla, Cassandra Jesse, Leah Prencipe, David Seidenfeld); FAO (Benjamin Davis, Josh Dewbre, Silvio
Diadone, Mario Gonzalez-Flores); UNICEF-Zambia (Charlotte Harland Scott, Paul Quarles van Ufford);
Government of Zambia (Vandras Luywa, Stanfield Michelo); DFID-Zambia (Kelley Toole); Palm
Associates (Alefa Banda, Liseteli Ndiyoi, Gelson Tembo, Nathan Tembo); UNICEF Office of Research
(Sudhanshu Handa); University of North Carolina at Chapel Hill (Sudhanshu Handa).

5
TABLE OF CONTENTS
1. Introduction 6
2. Poverty traps, shock coping and cash transfers: theory and evidence 8
3. The Zambia Child Grant Programme 9
4. Conceptual framework 10
5. Data and descriptive statistics 11
6. Estimation strategy 13
6.1 Testing assumptions of the impact estimate’s econometric models 13
6.2 Identification strategy for impact estimates 14
7. Results 16
8. Conclusions and policy implications 17
References 19
Appendix: Figures and Tables 22

6
1. INTRODUCTION
Climate change is projected to dramatically disrupt rainfall patterns and agricultural yields in Sub-
Saharan Africa (IPCC, 2014). Given the large share of Africa’s population living in rural areas (World
Bank, 2013a) and these communities’ dependence on rain-fed agriculture, climate change has the
potential to stall and even reverse gains that have been made in the region’s fight against poverty
(Shepherd et al., 2013). Frequent exposure to failed harvests and other negative income shocks is a
reality of life for the world’s rural poor and many of these communities have developed strategies for
coping with such shocks (Baez et al., 2013). However, some of these coping strategies can lead to
poverty traps – the self-reinforcing conditions that cause poverty to persist. For example, coping with
shocks by reducing food consumption, pulling children out of school, selling off productive assets, and
adopting risk-averse livelihood strategies that discourage growth can negatively affect human capital
formation and prospects for escaping poverty in the long run (Dasgupta, 1997; Carter and Barrett,
2006; Wood, 2011). The likelihood of households employing coping strategies that can lead to poverty
traps may be greater in the face of weather shocks, given their potential impact on food supplies and
livelihoods. Additionally, weather shocks’ covariance across a community weakens informal safety
nets, such as borrowing, further increasing household vulnerability (Skoufias, 2003; Baez et al., 2013;
Boone et al., 2013). Avoiding detrimental coping strategies that degrade households’ capabilities (per
Sen, 1999), and thus ability to escape poverty, is essential for building resilience to climate change
(Barrett and Constas, 2014).
This study investigates whether cash transfers enable households facing weather and other negative
income shocks to avoid adverse coping strategies that can lead to poverty traps. To test this
hypothesis, we harness data from the impact evaluation of Zambia’s Child Grant Programme. The Child
Grant Programme is one of the Government of Zambia’s largest social protection programmes. The
programme provides unconditional cash transfers of 60 kwacha (U.S. $12) per month to poor
households with children under five years old. A randomized control trial was implemented with 2,515
households to investigate the impact of the programme on a range of protective and productive
outcomes between 2010 and 2012, with the baseline data collected just prior to programme
implementation. In addition to containing extensive information on both treatment and control
households’ consumption, income, assets, and schooling decisions, the study also records the specific
types of shocks experienced by respondents as well as their stated coping strategies.
Weather shocks (droughts, floods, and storms) were the most commonly reported negative shock in
both survey rounds. These weather shocks increased substantially between rounds, from 42% of the
sample reporting such shocks in 2010 to 71% in 2012. Illness and changes in food prices were other
commonly experienced shocks (22% and 35% in 2012, respectively), in addition to a multitude of other
low-frequency shocks reported by households. Many households experienced multiple shocks and due
to the increase in weather shocks over time, only 15% of households reported having completely
avoided negative shocks in 2012. We investigate whether the cash transfer programme fostered
household resilience in the face of these myriad shocks and examine the impacts of cash on both
stated and revealed (i.e. behavioral) coping strategies. We also consider how the covariance of shocks
across a community affects coping strategies.
7
Given the preponderance of shocks these households experienced and the knock-on effects of
weather shocks in agricultural economies, we first develop a new framework for classifying negative
shocks. Because weather shocks can affect not only households’ production of agricultural goods for
both home consumption and market sales, but also the price of these goods (due to increased scarcity
or increased demand), we group together those shocks affecting agricultural production and prices.
Next, we group together all other negative shocks affecting households’ assets, labour supply, and
other sources of income. In addition to its basis in economic theory, this framework also has the nice
property of separating those shocks more likely to be covariate and exogenous to the household (the
agricultural production and price shocks) from those more likely to be idiosyncratic and the result of
endogenous household choices (the asset, labour, and other income shocks).
We find that amongst households facing agricultural production and price shocks, cash reduces the
likelihood of reducing food consumption and increases the likelihood of employing more resilient
coping strategies, such as spending savings. This analysis of stated coping strategies is supported by
the behavioral data, which show that receiving cash enables households to smooth food consumption
in the face of both covariate shocks affecting agricultural production and prices as well as other
idiosyncratic shocks affecting households’ labour, assets, and income. We also find that amongst those
households facing repeated shocks, the covariance of shocks across a community increases the
likelihood of being food insecure – but the cash transfer still works to dramatically decrease food
insecurity.
However, our analysis suggests that the timing of the transfer may matter. Our data allow us to
disentangle the effects of cash on coping with shocks, amongst those (1) shocked only at baseline,
prior to programme implementation; (2) shocked only after the programme began; (3) repeatedly
shocked; and (4) never shocked. The effect of cash on group (1) is akin to receiving cash as ex-post
disaster aid, while the effect of cash on group (2) [and somewhat group (3)] is akin to receiving cash
ex-ante as part of a proactive, climate-resilient development programme. We find that cash has
strong, positive impacts on food security when the transfer is received prior to shock exposure, but
some evidence that its impact may be weakened when received ex-post. But differential out-migration
between treatment and control households experiencing weather shocks at baseline limits our ability
to make strong causal statements regarding the timing of the cash transfer.
Taken together, these results have significant implications for the design of climate change adaptation
programmes. While cash transfers are not routinely considered in the policy discourse concerning
climate adaptation programming, because ex-ante transfers enable households to avoid negative
coping strategies and even increase food consumption in the face of covariate weather shocks, cash
transfers offer a sound approach for building climate-resilience amongst the world’s most vulnerable
and facilitating their “autonomous adaptation” to a changing environment (as suggested by Wood,
2011). And because cash also enables households to productively cope with the many other
idiosyncratic shocks the rural poor routinely face, cash transfers offer a “no-regrets” approach for
climate adaptation programmes (Wood, 2011).

8
2. POVERTY TRAPS, SHOCK COPING AND CASH TRANSFERS: THEORY AND EVIDENCE
On average, households tend to respond to negative income shocks by employing strategies that allow
them to maintain their typical level of consumption (World Bank, 2013b). However, because poor
households often lack access to mechanisms that facilitate consumption smoothing, such as insurance
and credit, strategies of the poor for coping with shocks tend to differ from those of wealthier
households (Morduch, 1995; Zimmerman and Carter, 2003; Carter et al., 2007; World Bank, 2013b).
Evidence shows that the rich are likely to use savings, obtain credit, or work more in response to
negative shocks, whereas the poor are more likely to sell off productive assets or reduce consumption
(World Bank, 2013b). Moving children from school to the labour force is another coping strategy
commonly employed by the poor (Beegle et al., 2004; de Janvry et al., 2006a and 2006b). The poor
may also resort to increased harvesting of common-pool resources (e.g., firewood, bushmeat, etc.) to
satisfy consumption and income needs in the face of shocks (Pattanayak and Sills, 2001).
All of these coping strategies commonly used by the poor can weaken their potential for escaping
poverty in this generation or the next by reducing household production, hindering the cognitive
development of young children via malnutrition, limiting household members’ future schooling and
work possibilities, or degrading the productivity of natural assets. This theory of ‘poverty traps’ is
articulated most eloquently by Dasgupta (1997) and supported by numerous studies analyzing long-
run poverty dynamics (e.g., Glewwe et al., 2000; Carter et al., 2007; Hoddinott et al., 2008; and as
summarized by Barrett et al., 2007 and World Bank 2013b).
Classical theories of macroeconomic growth – unconditional and conditional convergence – are often
applied at the microeconomic level for understanding household welfare trajectories (Carter and
Barrett, 2006). These theories posit that all nations/individuals can grow economically along an
exponential growth function. However, Barrett and Swallow (2005) and Carter and Barrett (2006) note
that an economic growth function may include multiple dynamic equilibria and argue that the concept
of poverty traps therefore contradicts classical theories of economic growth. Figure 1 depicts their
description of poverty trap dynamics.
In the space of future well-being mapped onto current well-being, welfare dynamics create an S-
shaped curve with three equilibrium points as shown. In this figure, WPL marks the poverty line. Those
at the middle equilibrium point (WC) can easily be pushed down into the low-level (poor) equilibrium
(WL) by negative income or asset shocks or easily pushed up to the high-level (non-poor) equilibrium
(WH) by positive shocks. Once households find themselves at either the low- or high-level equilibrium
they will tend to converge back to this point, despite small positive or negative income shocks that
temporarily knock them off. Those at the low-level equilibrium are thus in a poverty trap; those that
move above the middle equilibrium are moving along a self-propelled growth trajectory. This implies
that those at the middle equilibrium are at a highly unstable point, which marks an important
threshold.
Cash transfer programmes aim to help households escape poverty traps by providing cash that can be
used to increase consumption of food, schooling, and health services, thereby increasing adults’

9
capacity for work and preventing the intergenerational transmission of poverty to children. Cash
transfers should also foster resilience in the face of shocks and enable households to avoid coping
strategies that lead to poverty traps (Blank et al., 2010) – but the relationship between transfers and
shock responses has gone relatively unexamined, despite numerous impact evaluations of cash
transfer programmes (Wood, 2011). Among the studies that have investigated this topic, the focus has
been on households’ use of child labour as a shock response and impacts on schooling [see studies of
cash transfer programmes in Mexico by de Janvry et al. (2006a) and in Nicaragua by Gitter and Barham
(2009) and Maluccio (2005)]. Moreover, these studies examine cases in Latin America, with evidence
from African countries largely missing. Given greater dependence on subsistence farming, weaker
infrastructure and social services, and more severe poverty in sub-Saharan Africa, results from Latin
America probably cannot be generalized to the African context.
More research is currently needed to identify interventions that can help poor households avoid
coping strategies associated with poverty traps in the face of shocks. Following the theory and
evidence it might seem that the obvious answer is to make poor households non-poor via cash transfer
programmes. However, identifying the thresholds that define poverty traps remains a difficult task
(Carter and Barrett, 2006; Dercon, 2007) and Carter and Barrett (2006) argue these thresholds may
best be identified by measuring assets rather than consumption or income levels, which are the
targets of cash transfer programmes. This implies that cash transfers may not necessarily help
households avoid poverty traps even if the transfer is predicted to push households above a
consumption-based poverty line.
The weather-related risks posed by climate change, which will disproportionately affect the poor in
developing countries (IPCC, 2014), increase the importance of identifying interventions that can help
households living in remote rural areas respond to negative shocks.
3. THE ZAMBIAN CHILD GRANT PROGRAMME
The Zambian Child Grant Programme is an unconditional cash transfer programme being implemented
by Zambia’s Ministry of Community Development, Mother and Child Health. It is one of the
Government of Zambia’s largest social protection programmes. The goals of the programme are to
reduce extreme poverty and the intergenerational transmission of poverty to children. In addition to
the lack of conditionality, programme eligibility and administrative design are very straightforward
(compared to most cash transfer programmes). The only eligibility criterion for the programme is that
households have a child under the age of five. The size of the transfer is not adjusted for household
size. In the initial phase of the programme, only households with children under age three were
enrolled to ensure that every recipient household would receive the transfers for at least two years.
Enrolled households receive the equivalent of about $12 per month, which is estimated to be the cost
of purchasing one meal per day for an average-sized household for a month. Payments are received
every other month from a local paypoint manager.
The Ministry of Community Development, Mother and Child Health began implementing the
programme in 2010, in three districts with the highest rates of child mortality and malnutrition in

10
Zambia: Kalabo, Kaputa, and Shangombo. These districts are extremely remote, situated more than
two days car travel from the country’s capital, Lusaka, and share borders with Angola and the
Democratic Republic of Congo. During the rainy season, Shangombo and Kaputa become cut off from
the rest of the country by a floodplain and can only be reached by boat.
4. CONCEPTUAL FRAMEWORK
We examine whether receiving cash transfers affects households’ shock coping and consider the wide
range of possible strategies suggested in the literature to be commonly used by the poor. Because we
are primarily interested in the relationship between cash transfers and poverty traps, we distinguish
between (1) coping strategies hypothesized in the literature to lead to poverty traps, including
reducing food consumption, selling assets, sending children away or to work, and doing casual labour
for others;1 and (2) other coping strategies, many of which are generally considered to be positive,
such as starting a business, spending savings, and reducing non-food consumption. Borrowing from the
valuation literature on stated and revealed preferences, we examine both households’ stated coping
strategies as well as their revealed coping strategies (i.e., behavioral responses measured in the data).
For the revealed coping strategies, we focus on food consumption, given the centrality of this outcome
to avoiding poverty traps and building human capital. We use two measures of this outcome: per
capita monthly food consumption and whether a household ranks as severely food insecure, based on
their response to a series of questions commonly used to measure food security.2
Following Dercon (2002), Carter and Maluccio (2003), Takasaki et al. (2004), and Debela et al. (2012),
we distinguish between covariate and idiosyncratic shocks in our analysis, as the available strategy sets
for dealing with each type of shock should differ, with covariate shocks posing greater risk of poverty
trap coping (Skoufias, 2003). However, such a distinction is not necessarily easy to make. While
extreme weather events and price changes should be covariate shocks and other negative shocks, such
as job loss or illness tend to be idiosyncratic, this does not hold in all cases. For example, in the case of
communicable disease, illness can affect a large portion of a community at once and where shocks are
self-reported (as they are in our study), some might perceive a weather event as a negative shock
while others take no notice of it.3 The literature reflects various strategies for distinguishing between
covariate and idiosyncratic shocks: (1) use of the household-specific community mean (e.g., Debela et
al., 2012); (2) use of the general community mean (e.g., de Janvry et al., 2006a); or (3) establishing a
(somewhat arbitrary) cut-off for what constitutes “covariate” (e.g., Carter and Maluccio, 2003).
A second conceptual challenge for shock coping studies concerns how to identify the impact of a
specific shock (such as a weather shock) when households experience multiple shocks at once (e.g., a
weather shock, illness, and job loss in the same year). Some choose to only examine one type of shock
(e.g., Beegle et al., 2006; Jack and Suri, 2014) or examine shocks separately (e.g., de Janvry et al.,
1Casual labour for others (“piece work”) is often considered a negative coping strategy in this region. Boone et al. (2013) note that in Malawi such casual labour (“ganyu”) is often a coping strategy of last resort that can lead to poverty traps. This is because the labour on others’ farms is very low-wage and typically results in farmers delaying planting time on their own fields, which reduces yields. They argue farmers engage in such a sub-optimal allocation of off-farm labour because farmers in subsistence economies are severely cash-constrained. 2Based on the FANTA food security scoring system. 3This latter point of course highlights the potential for endogeneity bias with self-reported shock data. We discuss how our estimation strategy addresses potential endogeneity concerns in Section 2.5.2.
11
2006), even though households might have experienced multiple shocks. How to classify and group
together the numerous specific shocks households experience is another challenge, with no one
framework consistently used in the literature. For example, Carter and Maluccio (2003) group together
all reported shocks, including illness, job loss, crop failure, and theft, by converting them into
monetary values of loss; while Debela et al. (2012) distinguish between labour and non-labour shocks.
We employ the common strategy of using the household-specific community mean, which is the per
cent of the sample community that experienced a shock, exclusive of the household. This community
mean measure is useful for investigating how a marginal increase in shock covariance across a
community affects shock coping. But because we are particularly interested in weather shock coping,
we also develop a new framework for categorizing shocks that allows us to distinguish the weather-
related (and generally more covariate and plausibly exogenous) shocks from the non-weather (and
generally more idiosyncratic, possibly endogenous) shocks. Agricultural households in rural developing
economies tend to be both sellers and consumers of their own production. Weather shocks can
therefore impact not only households’ production of agricultural goods for both home consumption
and market sales, but also the price of agricultural goods that might be purchased or sold by affecting
their supply and demand. Additionally, weather shocks can increase crops’ susceptibility to disease and
pests, as well as damage crop storage facilities. For these reasons, we group together all shocks
affecting agricultural production and prices. We then group together all other negative shocks
affecting households’ assets, labour supply, and non-farm income. And because our unique dataset
contains households’ accounts of how they coped with each specific shock, we can use this
information to investigate the differences between how households cope with the largely covariate
agricultural production and price shocks versus the more idiosyncratic asset, labour, and other non-
farm income shocks.
We also compare the impacts of two policy design options: (1) extension of the cash transfer prior to
experiencing a negative income shock and (2) extension of the transfer in the wake of the shock. This
allows us to estimate the difference between what an ex-post disaster aid cash transfer programme
might be able to accomplish with one that is focused on building households’ climate resilience ex-
ante.
5. DATA AND DESCRIPTIVE STATISTICS
Zambia’s Child Grant Programme is being rolled out in phases, enabling the programme to first
conduct a rigorous evaluation of the pilot phase before scaling up. The evaluation employs a multi-site,
clustered randomized design. Thirty communities from each of three districts were first randomly
assigned to either treatment or control status. All eligible households within treatment communities
were then enrolled in the programme. Next, 28 households from each control and treatment
community were randomly selected to participate in the study. Baseline surveys were administered
prior to randomly assigning communities to treatment or control status and the start of the
programme. In sum, in 2010, baseline data were collected from 2,515 households living in 90
communities (45 control, 45 treatment) across Kaputa, Kalabo, and Shangombo. A second round of
data was collected in 2012.
12
In addition to collecting detailed information on children’s health and schooling, households were
asked about their consumption, income, assets, agricultural production, and other livelihood activities.
Households were also surveyed about their exposure to a long list of potential negative income shocks
as well as their specific coping strategies. Households in the sample are quite poor, with 92% living
below the poverty line4 and 90% ranking as severely food insecure. The vast majority are subsistence
farmers, farming, on average, less than 1 hectare of land. At baseline, only 22% of households sold
crops and only 13% purchased agricultural inputs (i.e., seeds, fertilizer, or pesticides). On average,
households live 19 km from food markets, though there is considerable variation in the study sample.
There were 221 households that migrated out of the study area after the collection of baseline data
(see Table 1). Handa et al. (2014) examine the effect this attrition had on the sample and find no
differential attrition between the control and treatment groups in terms of rates or their observable
household characteristics. These authors also investigate whether out-migration led to overall attrition
bias (i.e., whether those who remain in the sample are, on average, different from the overall baseline
sample). They find that the sample stays generally the same over time, in terms of observable
household characteristics, with the principal difference being that those who remained in the sample
were less likely to experience a weather shock at baseline. This follows from the observation that 72%
of the households that left the study lived in Kaputa district at baseline, where a lake important for
fishing and farming livelihoods is drying up, causing mass migration out of the area. While this out-
migration due to weather shocks does not bias our results, it does have implications for external
validity.
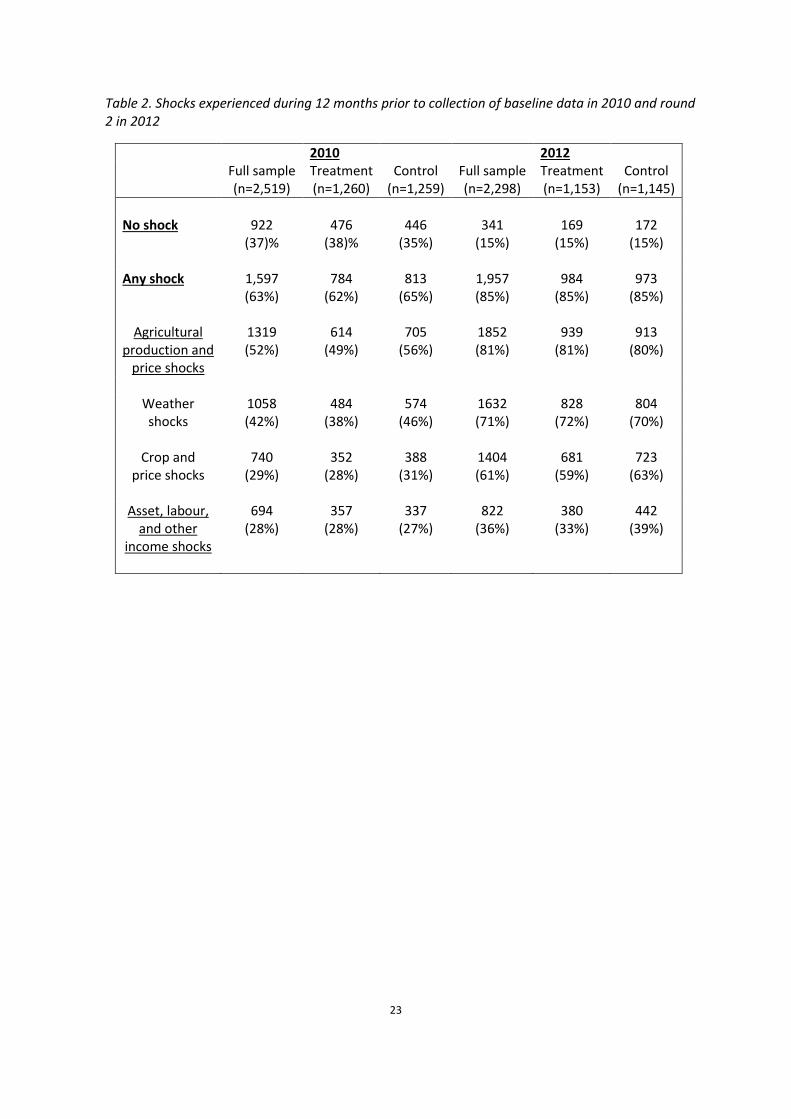
There was a sharp increase in the per cent of households experiencing negative weather shocks
(droughts, floods, or storms) between the survey waves – from 42% in 2010 to 71% in 2012 (Table 2).
When the shocks to crop production and prices, which are likely knock-on effects of the weather
shocks, are factored in, a total of 81% of the sample experienced agricultural production and price
shocks in 2012. Shocks to households’ assets, labour, and non-farm income show much lower
frequency in the sample (experienced by 36% of the sample in 2012) and their prevalence did not
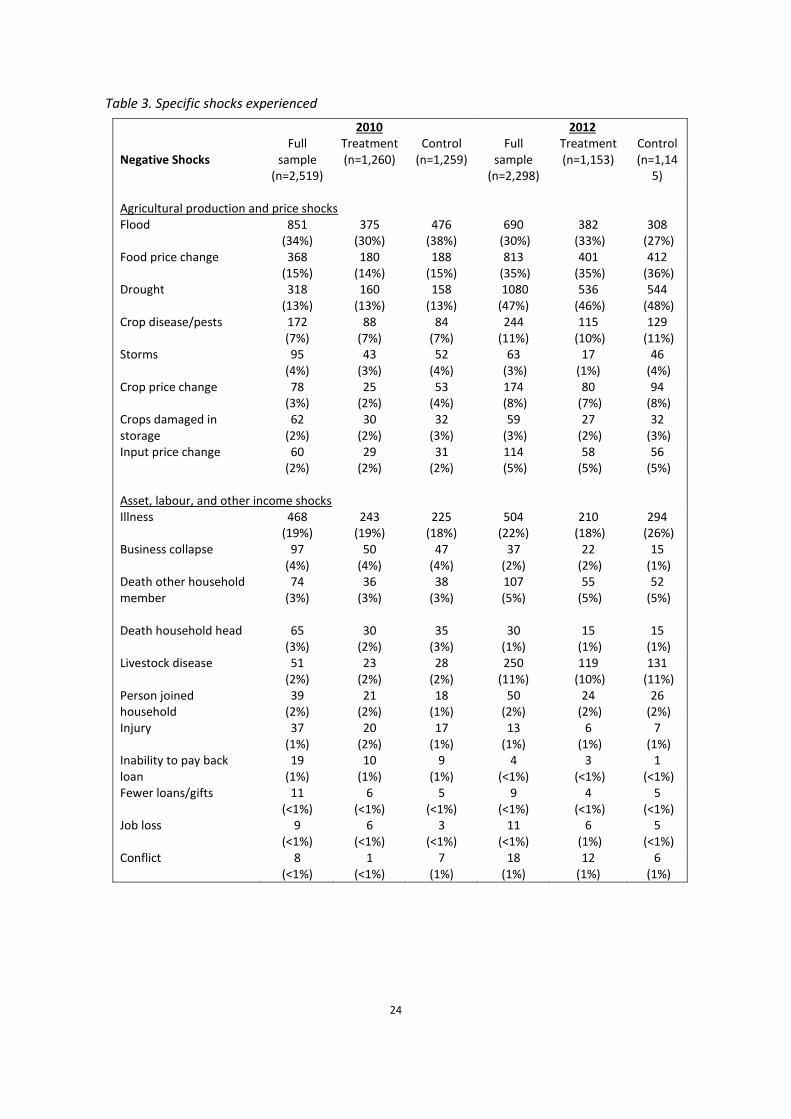
increase as sharply over time. Drought (47%), food price change (35%), floods (30%), illness (22%),
livestock disease (11%), and crop disease/pests (11%) were the most commonly reported shocks (see
Table 3).5
We investigate the covariance of each specific shock within communities by calculating the percent of
the sample that experienced the shock for each community. Table 4 shows the average of these
percentages for each shock. The average covariance levels for communities do not differ much from
the averages for the overall sample (Table 3) and indicate that the agricultural production and price
shocks are indeed much more covariate than the asset, labour, and other income shocks.
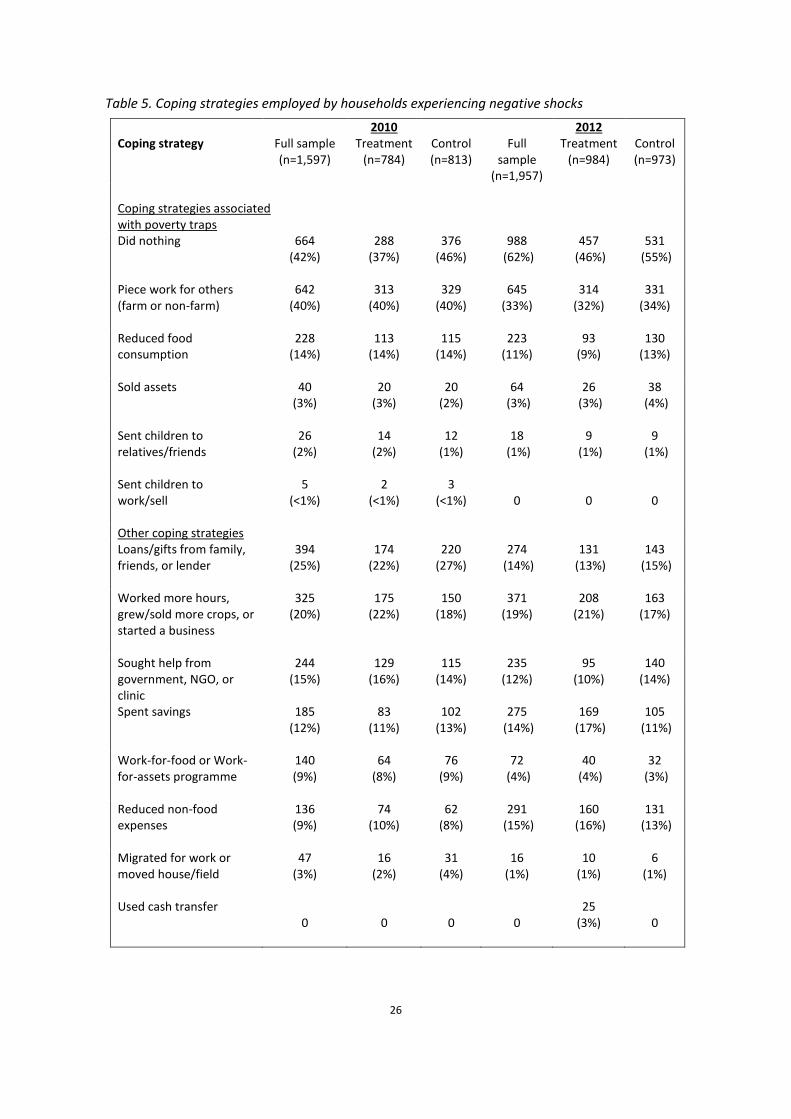
Households employed a wide range of coping strategies for dealing with these shocks. We asked
households about their primary as well as secondary coping strategy for each shock they reported.
4Households with total expenditures less than 93.37 kwacha per person per month in 2010 are considered to be severely poor. 5In the survey, households were asked about 21 specific shocks. If they said they experienced the shock, they were then asked whether the effect was positive or negative. We limit our analysis to those shocks reported by households to have a negative effect.

13
We combine the primary and secondary strategies to compute the tallies in Table 5. All of the principal
coping strategies identified in the literature as leading to poverty traps are represented in our dataset.
We also classify “doing nothing” as a poverty trap coping strategy based on empirical analysis of
household characteristics at baseline, which shows that households who “did nothing” in the wake of a
shock had significantly lower food consumption than those who reported a different coping strategy,
although they were similar along all other observable characteristics. Reducing food consumption
(including “doing nothing”) and doing piece work for others are the dominant poverty trap coping
strategies in our dataset.
6. ESTIMATION STRATEGY
6.1. Testing assumptions of the impact estimates’ econometric models
Due to random assignment of the programme, treatment status should not be correlated with
observed or unobserved characteristics of participating households or communities. We confirm
whether randomization yielded similar observable characteristics between treatment and control
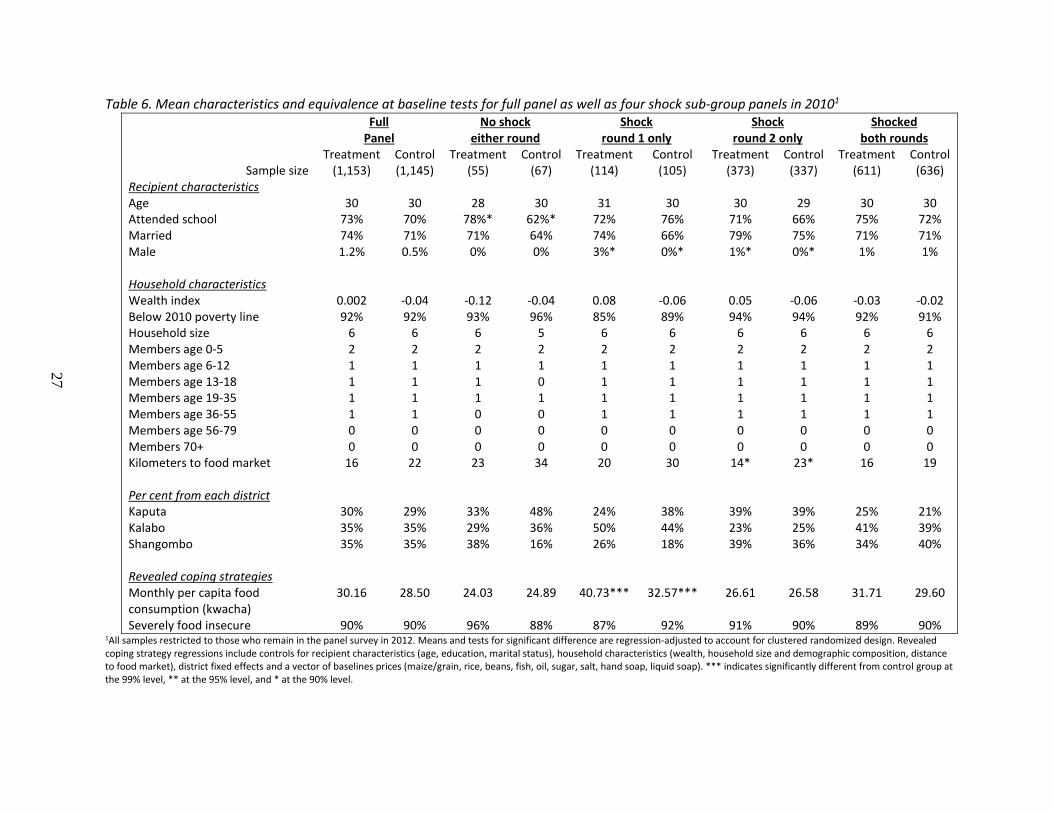
households by testing for their equivalence at baseline. We test for equivalence at baseline in terms of
basic characteristics of the recipient/respondent and household, self-reported shocks, and our key
outcomes of interest (stated and revealed coping strategies) and report these results in Tables 6 and 7.
We restrict our analysis to just the panel of households that remained in the survey for both rounds,
and cluster robust standard errors at the community-level (and do so for all subsequent models). We
examine equivalence at baseline for all variations of the sample used in subsequent impact estimates:
the full panel as well as the four shock sub-groups.
For the full panel, we find that randomization succeeded in producing balanced treatment and control
groups. We find no significant differences between treatment and control households along observable
characteristics, general shock exposure, and our key outcomes of interest – per capita food
consumption and overall food security. Households in treatment communities, however, were 7
percentage points less likely to report an agricultural production or price shock at baseline (see Table 7).
We also find some interesting differences between control and treatment households at baseline in
terms of stated coping strategies (Table 7). Prior to receiving cash, households in treatment
communities were more likely to increase household production or reduce non-food expenses in the
wake of agricultural production and price shocks than those residing in control communities. In the
face of asset, labour, and other negative income shocks, treatment households were more likely to do
piece work for others or participate in a work programme and less likely to obtain loans/gifts or “do
nothing”. These differences in stated shock coping strategies at baseline need to be considered when
examining our impact estimates, and draw our focus to examination of just those stated coping
strategies balanced at baseline.
Our analysis of revealed coping strategies (food consumption and food security score) breaks the full
panel down into four shock sub-groups, based on the temporal trends of shock experience. We
therefore test for equivalence at baseline for these four sub-groups as well and find that they are
generally balanced in terms of observable characteristics and our key outcomes of interest. This

14
equivalence at baseline allows us to attribute any estimated differences in revealed coping strategies
to the cash transfer programme. However, for those shocked at round 1 only, the control group has
significantly lower per capita food consumption. This suggests that in response to shocks amongst
households in the control group, it was the better off households who migrated out of the area and
the poorer households who stayed. This lack of equivalence at baseline prevents us from examining
the impact of cash on food consumption amongst those shocked only at baseline.
Next, we examine whether treatment and control households are experiencing the same time trend
with respect to shock exposure. The time trend could be different due to either (1) differential
weather patterns between treatment and control communities over time or (2) actual impacts of cash
on the likelihood of experiencing or perceiving a shock (i.e., cash might reduce the likelihood of falling
ill by improving nutrition or it might cause one to not notice a change in prices that other perceive as
significant). To test for differential time trends, we run a difference-in-difference model, specified in
Equation (1) as follows:
(1) Yigt = B0 + B1Postigt + B2Cashig + B3(Postigt*Cashig) + B4Xig + B5 Zg + Wg +Eigt
where Yigt measures whether a shock was reported by household i in district g in period t, Postigt is a
dummy variable equal to 1 if the observation is in 2012, Cashig is a dummy variable equal to 1 if the
household is in the treatment group, Xig represents a vector of household and recipient characteristics
measured at baseline, Zg, is a vector of baseline prices for food and other important consumption
goods, Wg is a district fixed effect, and Eigt is the error term. We include controls for baseline
characteristics and prices and district fixed effects to increase the precision of our estimates. The
coefficient of interest in this model is B3, which captures the effect of being in a treatment community
on self-reported shocks.
The interaction variable (Cash*Post) representing the effect of cash on self-reported negative shocks is
not significant for any of the three models presented in Table 8. Control and treatment households
therefore appear to be experiencing the same time trends with respect to shock exposure.
6.2. Identification strategy for impact estimates
To understand the impact of cash on households’ stated coping strategies, we run a series of first
difference models using the 2012 survey data and restricted to those who reported a negative shock.
This model can be written as:
(2) Yigt = B0 + B1Cashig + B2Xig + B3Zg + Wg +Eigt | Shock2012=1
where all terms are defined as they were in Equation (1), but now Yigt is a dummy variable coded as 1 if
a household reported using the specific coping strategy in question. The identifying assumption for this
model is that both the treatment and control groups would have had, on average, similar, shock
coping strategies in 2012, had the treatment group not received cash. However, our equivalence at
baseline tests shows that this assumption does not hold for certain shock coping strategies. Therefore,
we focus our discussion of results on those stated coping strategies balanced at baseline.

15
To further probe household coping strategies, we use both rounds of data and examine whether cash
may have affected households’ food consumption and overall food security score. Like Equation (2),
these models are conditional on households’ shock experience. We run four sets of models, as
specified below:
(3) Yigt = B0 + B1Postigt + B2Cashig + B3(Postigt*Cashig) + B4Xig + B5Zg +
Wgt +(eigt + it + vi) | Shock2010=1 & Shock 2012=1 (4) Yigt = B0 + B1Postigt + B2Cashig + B3(Postigt*Cashig) + B4Xig + B5Zg +
Wgt +(eigt + it + vi) | Shock2010=0 & Shock 2012=0 (5) Yigt = B0 + B1Postigt + B2Cashig + B3(Postigt*Cashig) + B4Xig + B5Zg +
Wgt +(eigt + it + vi) | Shock2010=1 & Shock 2012=0 (6) Yigt = B0 + B1Postigt + B2Cashig + B3(Postigt*Cashig) + B4Xig + B5Zg +
Wgt +(eigt + it + vi) | Shock2010=0 & Shock 2012=1
where terms reflect their definitions as described for Equations (1) and (2), though here Yigt is,
depending upon the series of models, monthly per capita food consumption or a dummy variable
coded as 1 if the household ranks as severely food insecure. For the purposes of transparency, we also
decompose the error term here into its various components, with eigt representing truly random error
and it representing unobserved household characteristics that vary over time and vi those that are
time-invariant. Time-invariant characteristics at the level of the treatment group (i.e., on average) are
removed in the differencing. And while, econometrically, unobserved time-varying characteristics at
the level of the treatment group remain in the error (as well as it and vi), the randomized research
design provides strong assurance that there are no systematic differences between the treatment and
control groups along either observed or unobserved characteristics. Therefore, there is little reason to
believe that our estimates reported in Tables 11 and 12 are biased by unobserved heterogeneity.
An alternative estimation strategy would be to run triple difference models on the full sample (where
Cash is interacted with both Shock and Post) with household fixed effects (to control for unobserved
time-invariant characteristics) to identify the effect of both receiving Cash and being shocked on food
security. Jack and Suri (2014) take such an approach in their analysis of how Kenya’s mobile money
system enables households to cope with illness shocks. However, the challenge with these models is
that they use only those who switch shock status between rounds to estimate the parameters of
interest (i.e., treatment effects). In our dataset, such an analytical approach does not make sense given
that many experienced shocks both rounds and amongst those that changed status over time, some
went from no shock in 2010 to a shock in 2012, while others experienced the opposite time trend – so
any effects of cash would be confounded by the experiences of these two sub-populations. From an
econometric standpoint, given the shock frequencies in our data and our randomized research design,
we believe our sets of difference-in-difference models are more appropriate (and more transparent).
Moreover, by disaggregating the analysis according to the temporal experience of shocks, we are able
to have a higher degree of external validity and answer an important policy design question: Does it
matter whether cash is extended before or after a household experiences a negative shock?
{Shocked both rounds}
{Never shocked}
{Shocked round 1 only}
{Shocked round 2 only}
16
7. RESULTS
We find that cash reduces the likelihood of employing negative coping strategies associated with
poverty traps and increases the likelihood of employing positive coping strategies. Tables 9 and 10
present the impacts of cash on stated coping. We run two sets of models for each coping strategy: the
first restricted to those who experienced agricultural production or price shocks in 2012; the second
restricted to those who experienced an asset, labour, or other negative income shock in 2012. We find
that amongst those who experienced an agricultural production or price shock, cash reduces the
likelihood of reducing food consumption (“doing nothing”) by 14 percentage points and increases the
likelihood of spending savings by 6 percentage points. Cash also increases the likelihood of using social
services (visiting the clinic or seeking help from the government or an NGO) by 2 percentage points in
the case of agriculture and price shocks and by 12 percentage points for other shocks. Importantly, all
of these stated coping strategies were balanced at baseline, implying that we can confidently attribute
the observed differences reported here to the cash transfer programme.
These impacts of cash on stated coping strategies are supported by our analysis of the behavioral data,
which shows that the programme has positive impacts on food consumption and overall food security
(Tables 11 and 12).6 We find that cash increases monthly per capita food expenditures by 31% for
those never shocked, by 35% for those shocked only after programme implementation (round 2), and
by 29% for those shocked both prior to and during the programme. [Because food consumption
amongst those shocked only prior to the start of the programme (round 1) was not balanced at
baseline, we can not estimate the impact of cash for this sub-group.] We see a similar trend with the
food security scores. Cash decreases the probability of being severely food insecure by 24 percentage
points amongst those never shocked, by 25 percentage points amongst those shocked at round 2 only,
and by 25 percentage points amongst those shocked at both rounds. For those shocked at round 1
only, we do not find evidence that cash has any effect on food security.
We then add a variable measuring shock prevalence in each of the 90 sample communities to our
difference-in-difference models to understand the effect of shock covariance on the impact of cash
(see Tables 13 and 14). This variable is the per cent in each community sample reporting a shock,
exclusive of the household. When this variable is added to the difference-in-difference models, the
effects of cash on food consumption and food security remain relatively unchanged from the original
estimates presented in Tables 11 and 12 – even though a one percentage point increase in community
shock prevalence increases the likelihood of being food insecure by 14 percentage points for those
shocked both rounds. For these two shock groups we also see that a one percentage point increase in
community shock prevalence increases their food consumption by 30 and 33 percent, respectively.
This suggests that the mechanism by which cash increases food security in the face of covariate shocks
is by enabling households to increase food production and/or purchases.
6For these difference-in-difference models, we group together agricultural production and price shocks with asset, labour, and other income shocks, since many households experienced both types of shocks and it is not possible to disentangle their effects in the revealed data measuring food consumption and food security.

17
8. CONCLUSIONS AND POLICY IMPLICATIONS
We find that cash transfers enable households to cope with negative shocks in ways that do not
increase the likelihood of falling into a poverty trap. Cash empowers the poor, rural households in our
study to employ shock-coping strategies commonly used by the non-poor, such as spending savings.
The cash transfers provided by Zambia’s Child Grant Programme are able to increase both food
consumption and food security even while the covariance of shocks within a community increases the
likelihood of being severely food insecure.
The most recent report from the Intergovernmental Panel on Climate Change (IPCC, 2014) states that
“Throughout the 21st century, climate-change impacts are projected to slow down
economic growth, make poverty reduction more difficult, further erode food security,
and prolong existing and create new poverty traps (p. 20) …”.
Our study provides evidence of a programme – unconditional cash transfers – that can work to help
households avoid the poverty traps that climate change threatens to create and entrench. Moreover,
we show that a specific programme design feature – extending cash to households before severe
shocks to agricultural production and prices occur – achieves strong, positive impacts on food
consumption and food security.
The international community concerned with climate change has become increasingly focused on
developing adaptation strategies in recent years. Crop insurance (Barrett et al., 2007; Baez et al., 2013)
and “ecosystem-based adaptation” (FAO and UNEP, 2013) are two potential adaptation strategies that
have received a great deal of attention – and for Africa in particular. However, the concept of using ex-
ante cash transfer programmes (i.e., as opposed to ex-post cash or in-kind disaster relief) as an
adaptation strategy for rural Africa has received little attention. This may be due to limited interaction
between the environmental policy community and the social protection community. There is clearly a
need to link these two policy communities and their attendant literatures.
While Wood (2011) argues that cash transfers should be given a greater role in climate adaptation and
the recent World Development Report (World Bank, 2013b) also highlights the value of cash transfers
for risk management and shock-coping in the context of climate change, to date there have been no
published evaluations of cash transfer programmes that focus on climate and adaptation questions.7
This study therefore fills an important gap in the literature and offers policy-relevant evidence that
should inform the design of climate adaptation programmes.
One advantage cash transfers offer over other potential adaptation interventions is their unique ability
to address the context of climate change, which is characterized by “deep uncertainty.” In their
discussion of the economics of risk and uncertainty in the 2014 World Development Report, The World
7Asfaw et al. (2011), however, report they are currently studying the impact of Lesotho’s cash transfer programme on farmers’ adaptation strategies, with a particular focus on changes in a series of specific farming practices. The 2014 World Development Report also reports advance results from evaluations of how cash transfer programmes in Ethiopia and El Salvador have helped households cope with droughts and natural disasters (World Bank, 2013(b), p. 104-105).

18
Bank describes problems of deep uncertainty as those where “…experts cannot agree on which models
to use…; on the probability distributions of key uncertain parameters…; or on the values of alternative
outcomes” (2013b, p. 93). Climate change is one such problem, because while models converge on
predictions of disrupted rainfall patterns in Africa, at the local level models diverge – some predict
decreases in rainfall and droughts, others predict increased rainfall and floods. Given that cash
transfers have already been demonstrated by numerous studies (Fiszbein and Schady, 2009) to reduce
both short-term poverty and its long-term determinants, they therefore offer a “no regrets” (Woods,
2011) strategy for climate-resilient development policy. Further, as also argued by Woods (2011) cash
transfers facilitate individuals’ autonomous adaptation and development decisions, making them both
congruent with a human rights framework that recognizes the importance of agency as well as
adaptation frameworks that embrace locally-based and diverse solutions.

19
REFERENCES
Asfaw, S., B. Davis, and J. Dewbre (2011). Cash transfer programmes in Sub-Saharan Africa: Measuring the impact on climate change adaptation. Presented at the 4th meeting of the Wye City Group on Statistics on Rural Development and Agriculture Household Income, Rio de Janeiro, Brazil, 9-11 Nov.
Baez, J.E., D. Kronick, and A.D. Mason (2013). Rural households in a changing climate. World Bank Policy Research Working Paper 6326
Barrett, C.B., and M.A. Constas (2014). Toward a theory of resilience for international development applications. PNAS, available at: www.pnas.org/cgi/doi/10.1073/pnas.1320880111
Barrett, C.B. and B.M. Swallow (2005). Fractal poverty traps. World Development 34(1): 1–15.
Barrett, C.B., B.J. Barnett, M.R. Carter, S. Chantarat, J.W. Hansen, A.G. Mude, D.E. Osgood, J.R. Skees, C.G. Turvey, and M.N. Ward (2007). Poverty traps and climate risk: Limitations and opportunities of index-based risk financing. IRI Technical Report 07-02. The International Research Institute for Climate and Society.
Beegle, K., R.H. Dehejia, and R. Gatti (2006). Child labour and agricultural shocks. Journal of Development Economics 81: 80-96.
Blank, L., S. Devereux, and S. Handa (2010). The case for social protection for children. Chp 2 in ‘Social Protection for Africa’s Children’, Handa, S., S. Devereux, and D. Webb (Eds.). Routledge: New York. p. 15-27.
Boone, R., K. Covarrubias, B. Davis, and P. Winters (2013). Cash transfer programmes and agricultural production: the case of Malawi. Agricultural Economics 44: 365-378.
Carter, M.R. and J.A. Maluccio (2003). Social capital and coping with economic shocks: An analysis of stunting of South African children. World Development 31(7): 1147-1163.
Carter, M.R. and C.B. Barrett (2006). The economics of poverty traps and persistent poverty: An asset-based approach. Journal of Development Studies 42(2): 187-199.
Carter, M.R., P.D. Little, T. Mogues, and W. Negatu (2007). Poverty traps and natural disasters in Ethiopia and Honduras. World Development 35(5): 835-856.
Cooper, P.J.M., R.D. Stern, M. Noguer, and J.M. Gathenya (2013). Climate Change Adaptation Strategies in Sub-Saharan Africa: Foundations for the Future. Chp. 13 Available at: http://dx.doi.org/10.5772/55133
Dasgupta, P. (1997). Nutritional status, the capacity for work, and poverty traps. Journal of Econometrics 77: 5-37.
Davies, M., B. Guenther, J. Leavy, T. Mitchell, and T. Tanner (2009). Climate change adaptation, disaster risk reduction and social protection: Complementary roles in agriculture and rural growth? IDS Working Paper 320. Institute of Development Studies (IDS): University of Sussex, Brighton, UK.
de Janvry, A., F. Finan, E. Sadoulet, and R. Vakis (2006a). Can conditional cash transfer programmes serve as safety nets in keeping children at school and from working when exposed to shocks? Journal of Development Economics 79: 349-373.

20
de Janvry, A., E. Sadoulet, P. Solomon, and R. Vakis (2006b). Uninsured risk and asset protection: Can conditional cash transfer programmes serve as safety nets? SP Discussion Paper No. 0604. Social Protection, World Bank: Washington, DC.
Debela, B., G. Shively, A. Angelsen, M Wik (2012). Economic shocks, diversification, and forest use in Uganda. Land Economics 88(1): 139-154.
Dercon, S. (2002). Income risk, coping strategies, and safety nets. World Bank Research Observer 17(2): 141-66.
Dercon, S. (2007). Comment on poverty traps and social protection policy. Institute of Development Studies (IDS) Bulletin 38(3): 39-42.
FAO and UNEP (2013). Conference Report: 1st Africa Food Security & Adaptation Conference: Harnessing Ecosystem-based Approaches for Food Security and Adaptation to Climate Change in Africa, Nairobi, 20-21 Aug.
Fiszbein, A. and N. Schady (2009). Conditional cash transfers: Reducing Present and Future Poverty. The World Bank: Washington, DC.
Gitter, S.R. and B.L. Barham (2009). Conditional cash transfers, shocks, and school enrolment in Nicaragua. Journal of Development Studies 45(10): 1747-1767.
Glewwe, P., H. Jacoby, and E. King (2000). Early childhood nutrition and academic achievement: a longitudinal analysis. Journal of Public Economics 81: 345-368.
Handa, S., D. Seidenfeld, B. Davis, G. Tembo and the Zambia Cash Transfer Evaluation Team (2014). Are cash transfers a silver bullet? Evidence from the Zambian Child Grant. Innocenti Working Paper no. 2014-08. UNICEF Office of Research: Florence.
Hoddinott, J., J.A. Maluccio, J.R. Behrman, R. Flores, and R. Martorell (2008). Effect of a nutrition intervention during early childhood on economic productivity in Guatemalan adults. The Lancet 371: 411-416.
IPCC (2014). Summary for policymakers. In: Climate Change 2014: Impacts, Adaptation, and Vulnerability. Part A: Global and Sectoral Aspects. Contribution of Working Group II to the Fifth Assessment Report of the Intergovernmental Panel on Climate Change [Field, C.B., V.R. Barros, D.J. Dokken, K.J. Mach, M.D. Mastrandrea, T.E. Bilir, M. Chatterjee, K.L. Ebi, Y.O. Estrada, R.C. Genova, B. Girma, E.S. Kissel, A.N. Levy, S. MacCracken, P.R. Mastrandrea, and L.L. White (eds.)]. Cambridge University Press: New York.
Jack, W. and T. Suri (2014). Risk sharing and transaction costs: Evidence from Kenya’s mobile money revolution. American Economic Review 104(1): 183-223.
Lemos, M. C., A. Agrawal, O. Johns, H. Eakin, D. Nelson, and N. Engle (2011). Building adaptive capacity to climate change in less developed countries.
Maluccio, J.A. (2005). Coping with the ‘Coffee Crisis’ in Central America: The Role of the Nicaraguan Red de Proteccion Social. Discussion Paper 188. Washington DC: International Food Policy Research Institute, Food Consumption and Nutrition Division.
21
Morduch, J. (1995). Income smoothing and consumption smoothing. Journal of Economic Perspectives 9(3): 103-114.
Pattanayak, S.K. and E.O. Sills (2001). Do tropical forests provide natural insurance? The microeconomics of non-timber forest product collection in the Brazilian Amazon. Land Economics 77(4): 595-612.
Sen, A. (1999). Development as Freedom. Anchor Books: New York.
Shepherd, A., T. Mitchell, K. Lewis, A. Lenhardt, L. Jones, L. Scott, and R. Muir-Wood (2013). The geography of poverty, disasters and climate extremes in 2030. Overseas Development Institute, London.
Skoufias, E. (2003). Economic crises and natural disasters: Coping strategies and policy implications. World Development 31(7): 1087-1102.
Takasaki, Y., B. Barham, O. Coomes (2004). Risk coping strategies in tropical forests: floods, illnesses, and resource extraction. Environment and Development Economics 9: 203-224.
Wood, R.G. (2011). Is there a role for cash transfers in climate change adaptation? International Conference on Social Protection for Social Justice, Institute of Development Studies, UK, 13-15 April.
World Bank (2013a). Global Monitoring Report 2013: Rural-Urban Dynamics and the Millennium Development Goals. Washington, DC: World Bank. DOI: 10.1596/978-0-8213-9806-7.
World Bank (2013b). World Development Report 2014: Risk and Opportunity – Managing Risk for Development. Washington, DC: World Bank. Doi: 10.1596/978-0-8213-9903-3.
Zimmerman, F. J. and M.R. Carter (2003). Asset smoothing, consumption smoothing and the reproduction of inequality under risk and subsistence constraints. Journal of Development Economics 71: 233-260.

22
APPENDIX: FIGURES AND TABLES
Figure 1. Welfare dynamics under the poverty trap hypothesis
From Barrett and Swallow (2005), p. 4
Table 1. Study sample sizes1
Treatment Control Total 2010 1,259 1,260 2,519 2012 1,145 1,153 2,298 Total 2,404 2,413 4,817
1 221 households migrated out of the sample
23
Table 2. Shocks experienced during 12 months prior to collection of baseline data in 2010 and round 2 in 2012
2010 2012 Full sample
(n=2,519) Treatment (n=1,260)
Control (n=1,259)
Full sample (n=2,298)
Treatment (n=1,153)
Control (n=1,145)
No shock 922
(37)% 476
(38)% 446
(35%) 341
(15%) 169
(15%) 172
(15%) Any shock 1,597
(63%) 784
(62%) 813
(65%) 1,957 (85%)
984 (85%)
973 (85%)
Agricultural
production and price shocks
1319 (52%)
614 (49%)
705 (56%)
1852 (81%)
939 (81%)
913 (80%)
Weather shocks
1058 (42%)
484 (38%)
574 (46%)
1632 (71%)
828 (72%)
804 (70%)
Crop and
price shocks 740
(29%) 352
(28%) 388
(31%) 1404 (61%)
681 (59%)
723 (63%)
Asset, labour,
and other income shocks
694 (28%)
357 (28%)
337 (27%)
822 (36%)
380 (33%)
442 (39%)
24
Table 3. Specific shocks experienced
2010 2012 Negative Shocks
Full sample
(n=2,519)
Treatment (n=1,260)
Control (n=1,259)
Full sample
(n=2,298)
Treatment (n=1,153)
Control (n=1,14
5) Agricultural production and price shocks Flood 851
(34%) 375
(30%) 476
(38%) 690
(30%) 382
(33%) 308
(27%) Food price change 368
(15%) 180
(14%) 188
(15%) 813
(35%) 401
(35%) 412
(36%) Drought 318
(13%) 160
(13%) 158
(13%) 1080 (47%)
536 (46%)
544 (48%)
Crop disease/pests 172 (7%)
88 (7%)
84 (7%)
244 (11%)
115 (10%)
129 (11%)
Storms 95 (4%)
43 (3%)
52 (4%)
63 (3%)
17 (1%)
46 (4%)
Crop price change 78 (3%)
25 (2%)
53 (4%)
174 (8%)
80 (7%)
94 (8%)
Crops damaged in storage
62 (2%)
30 (2%)
32 (3%)
59 (3%)
27 (2%)
32 (3%)
Input price change 60 (2%)
29 (2%)
31 (2%)
114 (5%)
58 (5%)
56 (5%)
Asset, labour, and other income shocks Illness 468
(19%) 243
(19%) 225
(18%) 504
(22%) 210
(18%) 294
(26%) Business collapse 97
(4%) 50
(4%) 47
(4%) 37
(2%) 22
(2%) 15
(1%) Death other household member
74 (3%)
36 (3%)
38 (3%)
107 (5%)
55 (5%)
52 (5%)
Death household head 65
(3%) 30
(2%) 35
(3%) 30
(1%) 15
(1%) 15
(1%) Livestock disease 51
(2%) 23
(2%) 28
(2%) 250
(11%) 119
(10%) 131
(11%) Person joined household
39 (2%)
21 (2%)
18 (1%)
50 (2%)
24 (2%)
26 (2%)
Injury 37 (1%)
20 (2%)
17 (1%)
13 (1%)
6 (1%)
7 (1%)
Inability to pay back loan
19 (1%)
10 (1%)
9 (1%)
4 (<1%)
3 (<1%)
1 (<1%)
Fewer loans/gifts 11 (<1%)
6 (<1%)
5 (<1%)
9 (<1%)
4 (<1%)
5 (<1%)
Job loss 9 (<1%)
6 (<1%)
3 (<1%)
11 (<1%)
6 (1%)
5 (<1%)
Conflict 8 (<1%)
1 (<1%)
7 (1%)
18 (1%)
12 (1%)
6 (1%)

25
Table 4. Covariance of shocks: Average per cent reporting the shock within a community cluster, averaged across communities
2010 2012 Negative shocks
Full sample (n=90)
Treatment (n=45)
Control (n=45)
Full sample (n=90)
Treatment (n=45)
Control (n=45)
Any shock 63% 62% 65% 85% 85% 85% Agricultural production and price shocks Flood 34% 30% 38% 29% 32% 26% Food price change 15% 14% 15% 36% 35% 36% Drought 13% 13% 13% 47% 47% 47% Crop disease/pests 7% 7% 7% 10% 10% 11% Storms 4% 3% 4% 3% 2% 4% Crop price change 3% 2% 4% 8% 7% 8% Crops damaged in storage 2% 2% 3% 3% 2% 3% Input price change 2% 2% 2% 5% 5% 5% Asset, labour, and other income shocks Illness 19% 20% 18% 22% 18% 26% Business collapse 4% 4% 4% 2% 2% 1% Death other household member
3% 3% 3% 5% 5% 5%
Death household head 3% 2% 3% 1% 1% 1% Livestock disease 2% 2% 2% 11% 11% 12% Person joined household 2% 2% 1% 2% 2% 3% Injury 1% 2% 1% 1% 1% 1% Inability to pay back loan 1% 1% 1% <1% <1% <1% Fewer loans/gifts <1% <1% <1% <1% <1% <1% Job loss <1% <1% <1% <1% 1% <1% Conflict <1% <1% <1% <1% <1% <1%
26
Table 5. Coping strategies employed by households experiencing negative shocks
Coping strategy
Full sample (n=1,597)
2010 Treatment
(n=784)
Control (n=813)
Full
sample (n=1,957)
2012 Treatment
(n=984)
Control (n=973)
Coping strategies associated with poverty traps Did nothing 664
(42%) 288
(37%) 376
(46%) 988
(62%) 457
(46%) 531
(55%)
Piece work for others (farm or non-farm)
642 (40%)
313 (40%)
329 (40%)
645 (33%)
314 (32%)
331 (34%)
Reduced food consumption
228 (14%)
113 (14%)
115 (14%)
223 (11%)
93 (9%)
130 (13%)
Sold assets 40
(3%) 20
(3%) 20
(2%) 64
(3%) 26
(3%) 38
(4%)
Sent children to relatives/friends
26 (2%)
14 (2%)
12 (1%)
18 (1%)
9 (1%)
9 (1%)
Sent children to work/sell
5 (<1%)
2 (<1%)
3 (<1%)
0
0
0
Other coping strategies Loans/gifts from family, friends, or lender
394 (25%)
174 (22%)
220 (27%)
274 (14%)
131 (13%)
143 (15%)
Worked more hours, grew/sold more crops, or started a business
325 (20%)
175 (22%)
150 (18%)
371 (19%)
208 (21%)
163 (17%)
Sought help from government, NGO, or clinic
244 (15%)
129 (16%)
115 (14%)
235 (12%)
95 (10%)
140 (14%)
Spent savings 185
(12%) 83
(11%) 102
(13%) 275
(14%) 169
(17%) 105
(11%)
Work-for-food or Work-for-assets programme
140 (9%)
64 (8%)
76 (9%)
72 (4%)
40 (4%)
32 (3%)
Reduced non-food expenses
136 (9%)
74 (10%)
62 (8%)
291 (15%)
160 (16%)
131 (13%)
Migrated for work or moved house/field
47 (3%)
16 (2%)
31 (4%)
16 (1%)
10 (1%)
6 (1%)
Used cash transfer
0
0
0
0 25
(3%)
0
27
Table 6. Mean characteristics and equivalence at baseline tests for full panel as well as four shock sub-group panels in 20101
Full Panel
No shock either round
Shock round 1 only
Shock round 2 only
Shocked both rounds
Sample size
Treatment (1,153)
Control (1,145)
Treatment (55)
Control (67)
Treatment (114)
Control (105)
Treatment (373)
Control (337)
Treatment (611)
Control (636)
Recipient characteristics Age 30 30 28 30 31 30 30 29 30 30 Attended school 73% 70% 78%* 62%* 72% 76% 71% 66% 75% 72% Married 74% 71% 71% 64% 74% 66% 79% 75% 71% 71% Male 1.2% 0.5% 0% 0% 3%* 0%* 1%* 0%* 1% 1% Household characteristics Wealth index 0.002 -0.04 -0.12 -0.04 0.08 -0.06 0.05 -0.06 -0.03 -0.02 Below 2010 poverty line 92% 92% 93% 96% 85% 89% 94% 94% 92% 91% Household size 6 6 6 5 6 6 6 6 6 6 Members age 0-5 2 2 2 2 2 2 2 2 2 2 Members age 6-12 1 1 1 1 1 1 1 1 1 1 Members age 13-18 1 1 1 0 1 1 1 1 1 1 Members age 19-35 1 1 1 1 1 1 1 1 1 1 Members age 36-55 1 1 0 0 1 1 1 1 1 1 Members age 56-79 0 0 0 0 0 0 0 0 0 0 Members 70+ 0 0 0 0 0 0 0 0 0 0 Kilometers to food market 16 22 23 34 20 30 14* 23* 16 19 Per cent from each district Kaputa 30% 29% 33% 48% 24% 38% 39% 39% 25% 21% Kalabo 35% 35% 29% 36% 50% 44% 23% 25% 41% 39% Shangombo 35% 35% 38% 16% 26% 18% 39% 36% 34% 40% Revealed coping strategies Monthly per capita food consumption (kwacha)
30.16 28.50 24.03 24.89 40.73*** 32.57*** 26.61 26.58 31.71 29.60
Severely food insecure 90% 90% 96% 88% 87% 92% 91% 90% 89% 90% 1All samples restricted to those who remain in the panel survey in 2012. Means and tests for significant difference are regression-adjusted to account for clustered randomized design. Revealed coping strategy regressions include controls for recipient characteristics (age, education, marital status), household characteristics (wealth, household size and demographic composition, distance to food market), district fixed effects and a vector of baselines prices (maize/grain, rice, beans, fish, oil, sugar, salt, hand soap, liquid soap). *** indicates significantly different from control group at the 99% level, ** at the 95% level, and * at the 90% level.

28
Table 7. Equivalence at baseline tests for exposure of full panel to shocks and stated coping strategies in 20101,2
Significantly different for treatment households Shocks Agricultural production or price shock 7 percentage points less likely* Asset, labour, and other income shock Any shock Stated coping strategies associated with poverty traps
Did nothing 9 percentage points less likely** (Other Shocks) Piece work for others (farm or non-farm) 9 percentage points more likely* (Other Shocks) Reduced food consumption Other stated coping strategies Loans/gifts from family, friends, or lender 10 percentage points less likely** (Other Shocks) Worked more hours, grew/sold more crops, or started a business
5 percentage points more likely* (Ag/Price Shocks)
Sought help from government, NGO, or clinic Spent savings Work-for-food or Work-for-assets programme 3 percentage points more likely* (Other Shocks) Reduced non-food expenses 3 percentage points more likely* (Ag/Price Shocks)
1Sample restricted to those who remain in the panel survey in 2012. Regressions include controls for recipient characteristics (age, education, marital status), household characteristics (wealth, household size and demographic composition, distance to food market), district fixed effects and a vector of baselines prices (maize/grain, rice, beans, fish, oil, sugar, salt, hand soap, liquid soap). Robust standard errors are clustered at the community level to account for the clustered randomized design. *** indicates significant differences at the 99% level, ** at the 95% level, and * at the 90% level. 2Analysis restricted to those coping strategies employed by 5% or more of households in at least one of the four time/treat sub-groups (i.e., 2010 control group that experienced shock, 2010 treatment group that experienced shock, etc.).

29
Table 8. Equivalent time trends between treatment and control households with respect to shock exposure1
Dependent variables (1/0 – Linear probability models)
Agricultural production or price shock
Asset, labour, and other income shock
Any shock
Constant 0.54*** (0.13)
0.12 (0.12)
0.57*** (0.12)
Time 0.24*** (0.04)
0.12*** (0.05)
0.20*** (0.03)
Treatment household
-0.08** (0.04)
0.002 (0.03)
-0.04 (0.04)
Treatment household * Time
0.08 (0.05)
-0.07 (0.06)
-0.02 (0.05)
Recipient characteristics Age 0.001
(0.001) 0.002* (0.001)
0.002 (0.001)
Attended school 0.05*** (0.02)
0.03 (0.02)
0.05*** (0.01)
Married 0.03 (0.02)
-0.02 (0.02)
0.001 (0.02)
Household characteristics Wealth index -0.01
(0.01) 0.03*** (0.01)
0.003 (0.01)
Household size 0.002 (0.02)
-0.03 (0.02)
0.003 (0.02)
Members age 0-5 0.0002 (0.02)
0.03 (0.02)
-0.003 (0.02)
Members age 6-12 -0.01 (0.02)
0.05** (0.02)
-0.002 (0.02)
Members age 13-18 -0.01 (0.02)
0.02 (0.03)
-0.02 (0.02)
Members age 19-35 -0.01 (0.02)
0.01 (0.02)
-0.005 (0.02)
Members age 36-55 0.02 (0.02)
0.005 (0.02)
0.02 (0.02)
Kilometers to food market (logged)
-0.02* (0.01)
-0.03** (0.01)
-0.02** (0.01)
Regional characteristics Kaputa District -0.22***
(0.04) -0.01 (0.04)
-0.16*** (0.04)
Shangombo District -0.03 (0.04)
0.05 (0.05)
0.005 (0.04)
N 4518 4518 4518
1Sample restricted to those who remain in the panel survey in 2012; robust standard errors are clustered at the community level to account for the clustered randomized design and included in parentheses below coefficients. Parameter estimates for vector of baseline prices (maize/grain, rice, beans, fish, oil, sugar, salt, hand soap, liquid soap) not shown. Kalabo district omitted. *** indicates significant differences at the 99% level, ** at the 95% level, and * at the 90% level.

30
Table 9. The impact of cash on coping strategies associated with poverty traps amongst households experiencing negative income shocks in the 12 months prior to collection of round 2 data in 20121,2
Dependent variable: coping strategy employed (1) – Linear probability model Did Nothing Piece work for
others Reduced food consumption
Agric./Price Agric./Price Agric./Price Constant 0.87***
(0.18) 0.19
(0.14) 0.03
(0.15) Cash -0.14***
(0.04) 0.01
(0.03) -0.03 (0.03)
Recipient characteristics Age -0.001
(0.002) -0.001 (0.001)
0.002 (0.001)
Attended school 0.01 (0.02)
-0.04* (0.02)
0.007 (0.02)
Married -0.02 (0.03)
0.02 (0.02)
0.02 (0.02)
Household characteristics Wealth index -0.01
(0.01) -0.02* (0.01)
-0.01* (0.01)
Household size -0.04 (0.04)
0.04 (0.03)
-0.03 (0.02)
Members age 0-5 0.05 (0.04)
-0.05 (0.03)
0.04 (0.02)
Members age 6-12 0.05 (0.04)
-0.03 (0.03)
0.03 (0.02)
Members age 13-18 0.04 (0.04)
-0.04 (0.03)
0.04 (0.03)
Members age 19-35 0.05 (0.04)
-0.04 (0.03)
0.03 (0.03)
Members age 36-55 0.05 (0.04)
-0.04 (0.04)
0.02 (0.03)
Kilometers to food market (logged) 0.004 (0.01)
-0.001 (0.01)
0.02** (0.01)
Regional characteristics Kaputa 0.15**
(0.06) -0.11***
(0.03) -0.10* (0.05)
Shangombo -0.49*** (0.06)
0.45*** (0.05)
0.02 (0.05)
N 1823 1823 1823
1Sample restricted to those who remain in the panel survey in 2012; robust standard errors are clustered at the community level to account for the clustered randomized design and included in parentheses below coefficients. Parameter estimates for vector of baseline prices (maize/grain, rice, beans, fish, oil, sugar, salt, hand soap, liquid soap) not shown. Kalabo district omitted. *** indicates significant differences at the 99% level, ** at the 95% level, and * at the 90% level. 2Analysis restricted to those coping strategies (1) employed by 5% or more of households in at least one of the four time/treat sub-groups (i.e., 2010 control group that experienced shock, 2010 treatment group that experienced shock, etc.) and (2) balanced at baseline. No coping strategies associated with poverty traps met these criteria in the case of non-agricultural/price shocks.

31
Table 10. The impact of cash on coping strategies not associated with poverty traps amongst households experiencing negative income shocks in the 12 months prior to collection of round 2 data in 20121,2
Dependent variable: coping strategy employed (1) – Linear probability model Loans or
gifts Grew/sold
additional crops, worked more,
started business
Sought help from government or NGO
Spent savings
Work-for-food/ Work-for-assets
Ag/Price Other Agric./Price
Other Agric./Price
Other Agric./Price
Constant 0.005 (0.10)
-0.04 (0.12)
0.02 (0.02)
0.15 (0.21)
-0.02 (0.09)
0.04 (0.17)
-0.03 (0.08)
Cash 0.002 (0.02)
0.03 (0.03)
0.02** (0.01)
0.12** (0.06)
0.06*** (0.02)
0.04 (0.04)
0.0004 (0.01)
Recipient characteristics Age 0.002**
(0.001) 0.002
(0.002) 0.003
(0.0003) 0.0002 (0.002)
0.0001 (0.001)
0.0003 (0.002)
-0.001 (0.001)
Attended school 0.02 (0.02)
0.03 (0.02)
0.004 (0.007)
-0.07** (0.03)
-0.003 (0.02)
-0.03 (0.03)
0.01 (0.01)
Married -0.01 (0.02)
-0.08*** (0.03)
-0.003 (0.01)
0.06 (0.04)
-0.001 (0.01)
0.04 (0.04)
-0.01 (0.01)
Household characteristics Wealth index 0.0002
(0.005) 0.0003 (0.01)
-0.002 (0.001)
-0.02 (0.02)
0.03*** (0.01)
0.02* (0.01)
-0.01* (0.003)
Household size -0.03 (0.02)
-0.02 (0.03)
-0.01* (0.004)
-0.07** (0.03)
-0.002 (0.03)
0.001 (0.03)
0.01 (0.01)
Members age 0-5 0.03 (0.02)
-0.002 (0.03)
0.004 (0.004)
0.08** (0.03)
-0.01 (0.03)
-0.01 (0.04)
-0.004 (0.01)
Members age 6-12 0.02 (0.02)
0.03 (0.03)
0.006* (0.003)
0.08** (0.04)
0.01 (0.03)
0.0002 (0.04)
-0.02 (0.01)
Members age 13-18 0.03 (0.02)
0.03 (0.04)
0.01 (0.005)
0.08** (0.03)
-0.001 (0.03)
0.002 (0.04)
-0.01 (0.01)
Members age 19-35 0.02 (0.02)
0.04 (0.04)
0.01* (0.01)
0.04 (0.03)
-0.01 (0.03)
0.01 (0.04)
-0.01 (0.02)
Members age 36-55 0.01 (0.02)
0.04 (0.04)
0.01* (0.004)
0.0001 (0.03)
-0.01 (0.03)
-0.004 (0.04)
-0.0002 (0.01)
Kilometers to food market (logged) -0.01 (0.01)
0.01 (0.01)
0.003 (0.002)
-0.03 (0.02)
0.02*** (0.01)
-0.01 (0.02)
0.002 (0.004)

32
Regional characteristics Kaputa -0.05*
(0.03) -0.04 (0.04)
-0.003 (0.005)
-0.20*** (0.07)
-0.01 (0.03)
-0.06 (0.06)
-0.001 (0.01)
Shangombo -0.01 (0.04)
0.14** (0.06)
0.01 (0.01)
0.09 (0.08)
0.02 (0.03)
-0.10* (0.06)
0.08*** (0.02)
N 1823 809 1823 809 1823 809 1823
1Sample restricted to those who remain in the panel survey in 2012; robust standard errors are clustered at the community level to account for the clustered randomized design and included in parentheses below coefficients. Parameter estimates for vector of baseline prices (maize/grain, rice, beans, fish, oil, sugar, salt, hand soap, liquid soap) not shown. Kalabo district omitted. *** indicates significant differences at the 99% level, ** at the 95% level, and * at the 90% level. 2Analysis restricted to those coping strategies (1) employed by 5% or more of households in at least one of the four time/treat sub-groups (i.e., 2010 control group that experienced shock, 2010 treatment group that experienced shock, etc.) and (2) balanced at baseline.

33
Table 11. The impact of cash on food consumption amongst households experiencing and avoiding negative income shocks1,2
Dependent variable: Per capita food consumption (logged) No shock
either round Shock
round 2 only Shock
both rounds Constant 10.5***
(0.49) 10.4*** (0.25)
10.7*** (0.22)
Time 0.39*** (0.09)
0.26*** (0.08)
0.10 (0.06)
Cash 0.07 (0.17)
-0.03 (0.06)
0.04 (0.06)
Cash*Time 0.31* (0.17)
0.35*** (0.10)
0.29*** (0.09)
Recipient characteristics Age 0.01
(0.01) 0.005* (0.002)
0.0004 (0.002)
Attended school 0.06 (0.11)
0.08** (0.04)
0.11*** (0.04)
Married -0.10 (0.09)
-0.01 (0.05)
0.05 (0.04)
Household characteristics Wealth index 0.11
(0.07) 0.15*** (0.02)
0.16*** (0.02)
Household size -0.12 (0.12)
-0.01 (0.05)
-0.05 (0.04)
Members age 0-5 -0.08 (0.12)
-0.11* (0.06)
-0.10** (0.05)
Members age 6-12 -0.05 (0.12)
-0.11* (0.06)
-0.08* (0.04)
Members age 13-18 0.04 (0.14)
-0.01 (0.06)
-0.05 (0.05)
Members age 19-35 0.18 (0.13)
-0.03 (0.06)
-0.06 (0.05)
Members age 36-55 0.15 (0.11)
-0.03 (0.06)
-0.01 (0.05)
Kilometers to food market (logged)
-0.02 (0.04)
0.02 (0.02)
0.03* (0.02)
Regional characteristics Kaputa -0.38**
(0.16) -0.22***
(0.08) -0.20***
(0.07) Shangombo -0.45***
(0.12) -0.31***
(0.06) -0.24***
(0.07) N 240 1393 2455
1Sample restricted to those who remain in the panel survey in 2012; robust standard errors are clustered at the community level to account for the clustered randomized design and included in parentheses below coefficients. Parameter estimates for vector of baseline prices (maize/grain, rice, beans, fish, oil, sugar, salt, hand soap, liquid soap) not shown. Kalabo district omitted. *** indicates significant differences at the 99% level, ** at the 95% level, and * at the 90% level. 2Analysis restricted to those shock groups balanced at baseline along per capita food consumption.

34
Table 12. The impact of cash on food security amongst households experiencing and avoiding negative income shocks1
Dependent variable: Severely food insecure (1) – Linear Probability Model No shock
either round Shock
round 1 only Shock
round 2 only Shock
both rounds Constant 1.40***
(0.25) 1.0*** (0.18)
0.94*** (0.10)
1.17*** (0.11)
Time -0.05 (0.08)
-0.08 (0.05)
-0.04 (0.03)
-0.07** (0.03)
Cash 0.05 (0.07)
-0.01 (0.05)
0.03 (0.03)
0.01 (0.04)
Cash*Time -0.24** (0.11)
-0.0004 (0.07)
-0.25*** (0.04)
-0.20*** (0.04)
Recipient characteristics Age -0.004
(0.004) 0.002
(0.002) 0.004*** (0.001)
0.0005 (0.001)
Attended school 0.05 (0.07)
-0.01 (0.04)
-0.001 (0.02)
-0.05** (0.02)
Married -0.03 (0.05)
0.004 (0.05)
-0.05* (0.03)
-0.03* (0.02)
Household characteristics Wealth index -0.04
(0.02) -0.04** (0.02)
-0.03*** (0.01)
-0.04*** (0.01)
Household size 0.05 (0.09)
0.05 (0.04)
-0.01 (0.04)
-0.01 (0.03)
Members age 0-5 -0.12 (0.09)
-0.02 (0.04)
0.04 (0.04)
0.06** (0.03)
Members age 6-12 -0.03 (0.09)
-0.02 (0.05)
0.02 (0.03)
0.02 (0.03)
Members age 13-18 -0.09 (0.11)
-0.07 (0.05)
0.01 (0.04)
0.04 (0.03)
Members age 19-35 -0.05 (0.10)
-0.07 (0.05)
0.04 (0.04)
-0.003 (0.03)
Members age 36-55 -0.03 (0.08)
-0.05 (0.04)
0.004 (0.04)
-0.02 (0.03)
Kilometers to food market (logged)
-0.04* (0.02)
-0.003 (0.02)
-0.001 (0.01)
-0.01 (0.01)
Community characteristics Kaputa 0.09
(0.10) 0.01
(0.06) 0.01
(0.04) -0.01 (0.04)
Shangombo -0.04 (0.09)
-0.15* (0.09)
-0.02 (0.06)
-0.13*** (0.04)
N 240 428 1385 2445
1Sample restricted to those who remain in the panel survey in 2012; robust standard errors are clustered at the community level to account for the clustered randomized design and included in parentheses below coefficients. Parameter estimates for vector of baseline prices (maize/grain, rice, beans, fish, oil, sugar, salt, hand soap, liquid soap) not shown. Kalabo district omitted. *** indicates significant differences at the 99% level, ** at the 95% level, and * at the 90% level.

35
Table 13. The impact of cash on food consumption amongst households experiencing and avoiding negative income shocks, controlling for the effect of shock covariance1,2
Dependent variable: Per capita food consumption (logged) No shock
either round Shock
round 2 only Shock
both rounds Constant 10.3***
(0.50) 10.2*** (0.27)
10.5*** (0.22)
Time 0.35*** (0.09)
0.16** (0.08)
0.05 (0.06)
Cash 0.06 (0.16)
-0.03 (0.06)
0.06 (0.06)
Cash*Time 0.31* (0.17)
0.34*** (0.10)
0.28*** (0.08)
Community shock covariance (fraction excluding household)
0.25 (0.24)
0.34** (0.14)
0.29** (0.14)
Recipient characteristics Age 0.01
(0.01) 0.005* (0.002)
0.0002 (0.002)
Attended school 0.06 (0.11)
0.08** (0.04)
0.11*** (0.04)
Married -0.10 (0.09)
-0.01 (0.05)
0.05 (0.04)
Household characteristics Wealth index 0.10
(0.07) 0.15*** (0.02)
0.16*** (0.02)
Household size -0.11 (0.12)
-0.01 (0.05)
-0.04 (0.04)
Members age 0-5 -0.09 (0.12)
-0.11* (0.06)
-0.10** (0.05)
Members age 6-12 -0.06 (0.12)
-0.11* (0.06)
-0.08* (0.04)
Members age 13-18 0.03 (0.14)
-0.01 (0.06)
-0.05 (0.05)
Members age 19-35 0.17 (0.13)
-0.02 (0.06)
-0.06 (0.05)
Members age 36-55 0.14 (0.11)
-0.03 (0.06)
-0.01 (0.05)
Kilometers to food market (logged) -0.02 (0.04)
0.02 (0.02)
0.04** (0.02)
Regional characteristics Kaputa -0.33*
(0.18) -0.19** (0.08)
-0.16** (0.07)
Shangombo -0.45*** (0.12)
-0.34*** (0.07)
-0.22*** (0.07)
N 240 1393 2455
1Sample restricted to those who remain in the panel survey in 2012; robust standard errors are clustered at the community level to account for the clustered randomized design and included in parentheses below coefficients. Parameter estimates for vector of baseline prices (maize/grain, rice, beans, fish, oil, sugar, salt, hand soap, liquid soap) not shown. Kalabo district omitted. *** indicates significant differences at the 99% level, ** at the 95% level, and * at the 90% level. 2Analysis restricted to those shock groups balanced at baseline along per capita food consumption.
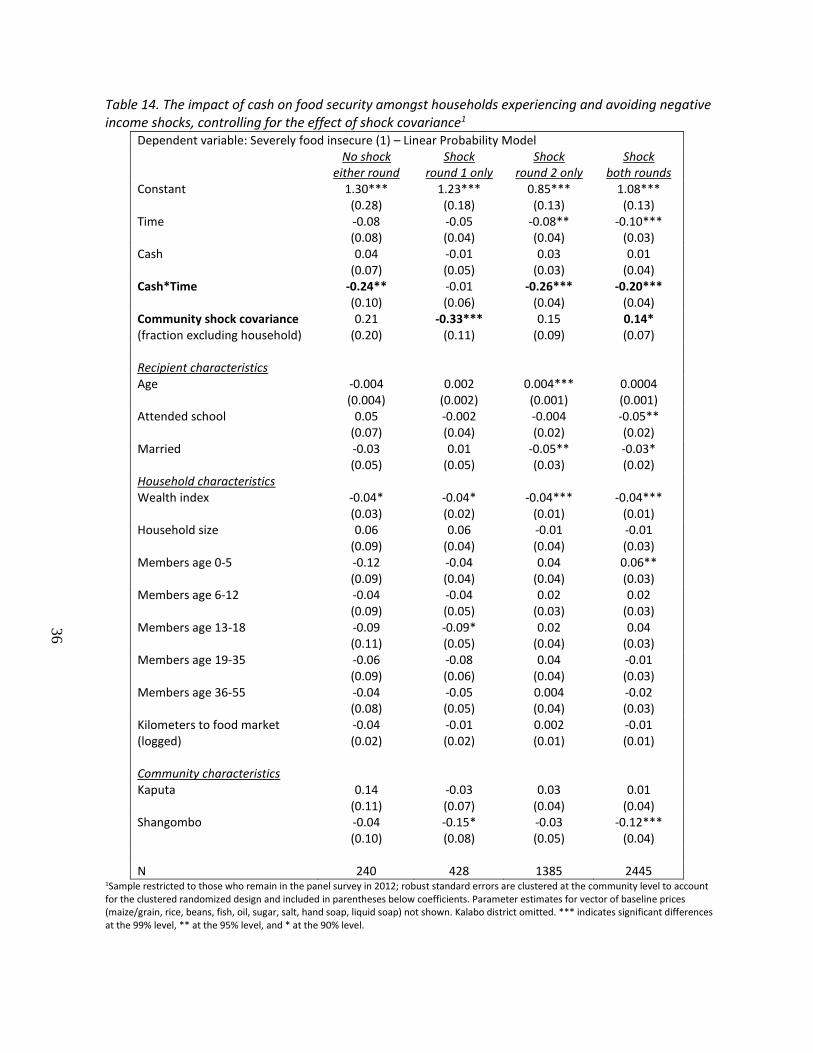
36
Table 14. The impact of cash on food security amongst households experiencing and avoiding negative income shocks, controlling for the effect of shock covariance1
Dependent variable: Severely food insecure (1) – Linear Probability Model No shock
either round Shock
round 1 only Shock
round 2 only Shock
both rounds Constant 1.30***
(0.28) 1.23*** (0.18)
0.85*** (0.13)
1.08*** (0.13)
Time -0.08 (0.08)
-0.05 (0.04)
-0.08** (0.04)
-0.10*** (0.03)
Cash 0.04 (0.07)
-0.01 (0.05)
0.03 (0.03)
0.01 (0.04)
Cash*Time -0.24** (0.10)
-0.01 (0.06)
-0.26*** (0.04)
-0.20*** (0.04)
Community shock covariance (fraction excluding household)
0.21 (0.20)
-0.33*** (0.11)
0.15 (0.09)
0.14* (0.07)
Recipient characteristics Age -0.004
(0.004) 0.002
(0.002) 0.004*** (0.001)
0.0004 (0.001)
Attended school 0.05 (0.07)
-0.002 (0.04)
-0.004 (0.02)
-0.05** (0.02)
Married -0.03 (0.05)
0.01 (0.05)
-0.05** (0.03)
-0.03* (0.02)
Household characteristics Wealth index -0.04*
(0.03) -0.04* (0.02)
-0.04*** (0.01)
-0.04*** (0.01)
Household size 0.06 (0.09)
0.06 (0.04)
-0.01 (0.04)
-0.01 (0.03)
Members age 0-5 -0.12 (0.09)
-0.04 (0.04)
0.04 (0.04)
0.06** (0.03)
Members age 6-12 -0.04 (0.09)
-0.04 (0.05)
0.02 (0.03)
0.02 (0.03)
Members age 13-18 -0.09 (0.11)
-0.09* (0.05)
0.02 (0.04)
0.04 (0.03)
Members age 19-35 -0.06 (0.09)
-0.08 (0.06)
0.04 (0.04)
-0.01 (0.03)
Members age 36-55 -0.04 (0.08)
-0.05 (0.05)
0.004 (0.04)
-0.02 (0.03)
Kilometers to food market (logged)
-0.04 (0.02)
-0.01 (0.02)
0.002 (0.01)
-0.01 (0.01)
Community characteristics Kaputa 0.14
(0.11) -0.03 (0.07)
0.03 (0.04)
0.01 (0.04)
Shangombo -0.04 (0.10)
-0.15* (0.08)
-0.03 (0.05)
-0.12*** (0.04)
N 240 428 1385 2445
1Sample restricted to those who remain in the panel survey in 2012; robust standard errors are clustered at the community level to account for the clustered randomized design and included in parentheses below coefficients. Parameter estimates for vector of baseline prices (maize/grain, rice, beans, fish, oil, sugar, salt, hand soap, liquid soap) not shown. Kalabo district omitted. *** indicates significant differences at the 99% level, ** at the 95% level, and * at the 90% level.