cash transfers and women's economic inclusion
TRANSCRIPT

Cash transfers and women’s economic inclusion
Experimental evidence from Zambia


Cash transfers and women’s economic inclusion
Experimental evidence from Zambia
Francesca Viberti, Silvio Daidone, Noemi Pace, Nicholas Sitko
FOOD AND AGRICULTURE ORGANIZATION OF THE UNITED NATIONS
Rome, 2021
Required citation:
Viberti, F., Daidone, S., Pace, N. and Sitko, N. 2021. Cash transfers and women's economic inclusion – Experimental evidence from Zambia. Rome,
FAO. https://doi.org/10.4060/cb7510en
The designations employed and the presentation of material in this information product do not imply the expression of any opinion whatsoever on the
part of the Food and Agriculture Organization of the United Nations (FAO) concerning the legal or development status of any country, territory, city or
area or of its authorities, or concerning the delimitation of its frontiers or boundaries. The mention of specific companies or products of manufacturers,
whether or not these have been patented, does not imply that these have been endorsed or recommended by FAO in preference to others of a similar
nature that are not mentioned.
The views expressed in this information product are those of the author(s) and do not necessarily reflect the views or policies of FAO.
ISBN 978-92-5-135269-4
© FAO, 2021
Some rights reserved. This work is made available under the Creative Commons Attribution-NonCommercial-ShareAlike 3.0 IGO licence (CC BY-
NC-SA 3.0 IGO; https://creativecommons.org/licenses/by-nc-sa/3.0/igo/legalcode).
Under the terms of this licence, this work may be copied, redistributed and adapted for non-commercial purposes, provided that the work is appropriately
cited. In any use of this work, there should be no suggestion that FAO endorses any specific organization, products or services. The use of the FAO
logo is not permitted. If the work is adapted, then it must be licensed under the same or equivalent Creative Commons licence. If a translation of this
work is created, it must include the following disclaimer along with the required citation: “This translation was not created by the Food and Agriculture
Organization of the United Nations (FAO). FAO is not responsible for the content or accuracy of this translation. The original [Language] edition shall
be the authoritative edition.”
Disputes arising under the licence that cannot be settled amicably will be resolved by mediation and arbitration as described in Article 8 of the licence
except as otherwise provided herein. The applicable mediation rules will be the mediation rules of the World Intellectual Property Organization
http://www.wipo.int/amc/en/mediation/rules and any arbitration will be conducted in accordance with the Arbitration Rules of the United Nations
Commission on International Trade Law (UNCITRAL).
Third-party materials. Users wishing to reuse material from this work that is attributed to a third party, such as tables, figures or images, are responsible
for determining whether permission is needed for that reuse and for obtaining permission from the copyright holder. The risk of claims resulting from
infringement of any third-party-owned component in the work rests solely with the user.
Sales, rights and licensing. FAO information products are available on the FAO website (www.fao.org/publications) and can be purchased through
[email protected]. Requests for commercial use should be submitted via: www.fao.org/contact-us/licence-request. Queries regarding rights
and licensing should be submitted to: [email protected].
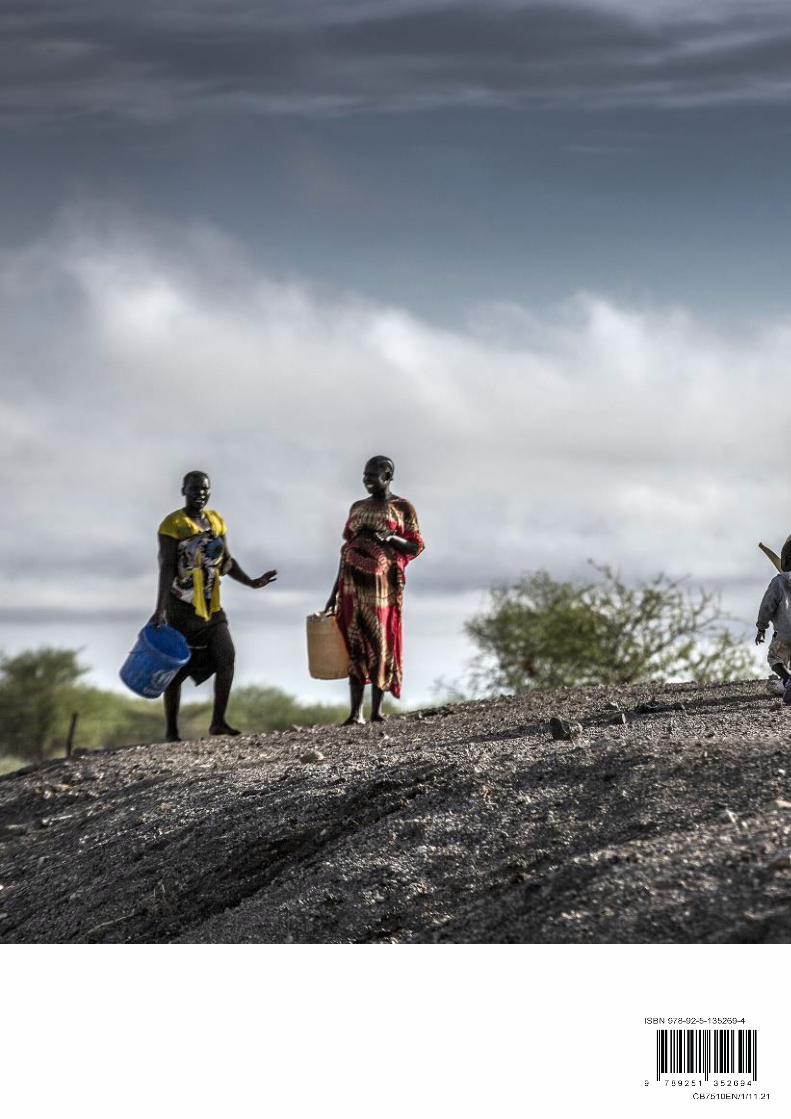
Photo credit front and back cover: ©FAO/Luis Tato
iii
Abstract
This paper investigates whether an increase in exogenous income through the Child Grants model of the
Social Cash Transfer programme in Zambia fosters economic inclusion among rural women. We conceptualize
economic inclusion as a transformative process comprised of four pillars: productive capacity, financial
inclusion, social power, and psychological assets. Using experimental data, we find strong evidence of direct
impacts of the Child Grant on the productive capacity, financial inclusion, and psychological assets of rural
women. In addition to these direct impacts, we implement a mediation analysis to explore the potential
mediating role of psychological assets in affecting the other pillars of economic inclusion. Through this
approach, we find indicative evidence of indirect and mutually reinforcing relationships between changes in
psychological assets brought about through the Child Grant and improvements in the productive capacity
and financial inclusion of beneficiaries. Such results suggest that cash transfers might be effective in
promoting women’s economic inclusion, both through the direct monetary effect and through the mediated
effect of psychological assets.
Key words: cash transfer, women’s economic inclusion, time preferences, future expectations, randomized
control trial, mediation analysis

v
Contents 1. Introduction ....................................................................................................................................... 1
2. Conceptual framework: outcomes of interest and hypotheses ............................................................. 4
3. Background and experimental design ............................................................................................... 10
3.1 The Zambia child grant model of the social cash transfer programme..................................................... 10
3.2 Data and study sample .............................................................................................................................. 11
3.3 Empirical strategy ...................................................................................................................................... 12
3.3.1 Direct impact of the child grant on women’s economic inclusion ..................................................... 12
3.3.2 Mediated impact of the child grant on women’s economic inclusion ............................................... 13
3.4 Baseline descriptive data ........................................................................................................................... 14
4. Results ............................................................................................................................................. 16
4.1 Direct impact of the Zambia child grant model of the social cash transfer programme .......................... 16
4.1.1 Productive capacity: non-farm businesses ......................................................................................... 16
4.1.2 Financial inclusion: women’s savings ................................................................................................. 17
4.1.3 Social power: women’s decision-making power ................................................................................ 18
4.1.4 Psychological assets: time preferences and future expectations....................................................... 19
4.2 Mediation analysis ..................................................................................................................................... 21
5. Conclusion ....................................................................................................................................... 24
Annexes ............................................................................................................................................... 26
Annex 1. Indicators of women’s economic inclusion – baseline summary statistics ...................................... 26
Annex 2. Mediators – baseline summary statistics ......................................................................................... 27
Annex 3. Control variables – baseline summary statistics .............................................................................. 28
Annex 4. Direct impact of zambia child grant on female-leaded non-farm enterprises – non-linear model . 29
Annex 5. Direct impact of zambia child grant on women’s savings – non-linear model ................................ 30
Annex 6. Direct impact of zambia child grant on women’s savings – difference-in-differences model ......... 31
Annex 7. Direct impact of zambia child grant on women’s decision-making power – non-linear model ...... 32
Annex 8. Direct impact of zambia child grant on women’s decision-making power – difference-in-
differences model ............................................................................................................................................ 33
Annex 9. Direct impact of the zambia child grant on time preferences – non-linear model (probit) ............ 34
Annex 10. Direct impact of the zambia child grant on time preferences – difference-in-differences model 35
annex 11. Direct impact of zambia child grant on women’s future expectations (only consistent
respondents) – linear model ........................................................................................................................... 36
Annex 12. Direct impact of zambia child grant on women’s future expectations (only consistent
respondents) – non-linear model .................................................................................................................... 37
Annex 13. Direct impact of zambia child grant on women’s future expectations (only consistent
respondents) – difference-in-differences ........................................................................................................ 38
Annex 14. Direct impact of zambia child grant on women’s future expectations (all respondents) – non-
linear model ..................................................................................................................................................... 39
Annex 15. Direct impact of zambia child grant on women’s future expectations (all respondents) –
difference-in-differences ................................................................................................................................. 40
Annex 16. Mediated impact of zambia child grant on women’s economic inclusion mediated by future
expectations – one year .................................................................................................................................. 41
Annex 17. Mediated impact of zambia child grant on women’s economic inclusion mediated by future
expectations – three years .............................................................................................................................. 42

vi
Annex 18. Mediated impact of zambia child grant on women’s economic inclusion mediated by future
expectations – five years ................................................................................................................................. 43
References ........................................................................................................................................... 44
FIGURE 1. Direct and Mediated Effect of Zambia Child Grant model of the Social Cash Transfer ................................ 8
TABLES 1. Direct Impact of Zambia Child Grant on female-leaded Non-Farm Enterprises ......................................... 17
2. Direct Impact of Zambia Child Grant on women’s savings .......................................................................... 18
3. Direct Impact of Zambia Child Grant on Women’s Decision-Making Power .............................................. 19
4. Direct Impact of the Zambia Child Grant on Time Preferences .................................................................. 20
5. Direct Impact of Zambia Child Grant on women’s future expectations ...................................................... 21
6. Impact of the Zambia Child Grant on women’s economic inclusion mediated by time preferences ......... 22
7. Impact of Zambia Child Grant on women’s economic inclusion mediated by future expectations ........... 23
vii
Abbreviations and acronyms
AIR American institute for research
CG Child grant
CGP Child grant programme
CWACs Community welfare assistance committees
DFID Department for international development
HFIAS Household food insecurity access scale
ILO International labour organization
IMF International monetary fund
MCTG Multiple category transfer grant
MEL Money earlier or later model
NFE Non-farm enterprise
ODI Overseas development institute
OECD Organisation for economic co-operation and development
RCT Randomized control trial
RTP Rate of time preference
SCT Social cash transfers programme
UNICEF United nations international children's emergency fund
UN Women United nations entity for gender equality and empowerment of women
USD United states dollar
ZKW Zambian kwacha

1
1. Introduction
The principle of “leaving no one behind” places economic inclusion at the heart of the 2030 Agenda for
Sustainable Development. While there are various definitions of economic inclusion (see for example FAO,
2020; World Bank, 2021; OECD, 2011), in general it is viewed as a transformative process that enhances “the
ability of individuals to participate in, contribute to and benefit from growth processes” (OECD, 2011). The
concept builds on the recognition that the factors that trap people and places in poverty are
multidimensional, and therefore require flexible and multi-sectoral solutions (World Bank, 2021; Banerjee et
al., 2015; Daidone et al., 2019; Barrientos, 2012; Pace et al., 2018). These factors often revolve around the
pervasive material and social constraints that limit the capacity of poor and vulnerable populations from
engaging in and benefiting from economic processes (Lundberg and Pollak, 1996; Quisumbing and Maluccio,
1999; Duflo, 2012; Barrett and Carter, 2013; Balboni et al., 2020). In addition, emerging evidence suggests
that behavioural and psychological factors linked to poverty and vulnerability shape the economic choices
and actions of the poor and, therefore, can play a deterministic role in economic inclusion processes
(VeneKlasen and Miller 2002; Handa et al., 2014; Dalton et al., 2014; Appadurai, 2004).
Behavioural and psychological constraints to economic inclusion have only recently garnered attention in
development discourse (Handa et al., 2014; Banerjee et al., 2011). Evidence on the “psychology of scarcity,”
for example, suggests that the mental stresses of poverty induce psychological shifts away from goal-oriented
livelihood choices and toward habitual activities and decision-making that are biased toward immediate
consumption (Molotsky and Handa, 2021; Handa et al., 2020; Sheehy-Skeffington, 2018; Mani et al., 2013;
Mullainthan and Shaffir, 2013; Shah et al., 2012; Schwabe and Wolf, 2009). This myopic focus on immediate
consumption may shape peoples’ economic decision-making capacity and agency within the economic
sphere (Farah and Hook, 2017; Ericson and Laibson, 2018; Haushofer and Fehr, 2014; Tanaka et al., 2010). As
evidence shows, women are more likely than men to live in poverty and faces multiple hindrances in
satisfying their needs (UN Women, 2018). For instance, they are more likely to suffer from food insecurity
and malnutrition (FAO et al., 2018), water and shelter deprivation (Gordon et al., 2004), and sanitation
deprivation (WaterAid, 2003). Due to such gender disparities, women’s opportunities for education,
employment and other daily activities, which might help them escape poverty, are significantly restricted
(United Nations, 2018). Hence, women living in poverty have to deal with several gendered discriminations
men are exempted from on top of the economic hardships, and such social discriminations reduce their
opportunities of improving their life conditions. This explains why women are highly vulnerable to the
phenomenon of cognitive scarcity, and its negative consequences when it comes to decision-making (Zhang
and Gordon, 2020).
2
Fostering economic inclusion, therefore, requires more than simply addressing the material constraints that
limit people’s participation in economic life. It also requires strengthening the psychological capacity of
marginalized or vulnerable people to engage in economic activities that are oriented beyond immediate
consumption. Fundamentally, this entails a shift in intertemporal discount rates, which, in turn, is closely
linked to changes in time preference for money and more optimistic expectations about the future (Handa
et al., 2020; Laajaj, 2017; Ifcher and Zarghamee, 2011).
Identifying programmatic interventions that simultaneously address the material constraints to economic
inclusion while strengthening the psychological assets of the poor is critical for sustaining economic inclusion
processes (Bertrand et al., 2004; Anand and Lea, 2011). Cash transfer programmes offer a potential avenue
for achieving these multiple objectives. There is a large and growing literature demonstrating that providing
cash to poor and marginalized individuals triggers meaningful changes in economic choices. In rural contexts,
these changes include greater investments in agricultural production (Todd et al., 2010; Boone et al., 2013;
Daidone et al., 2019; Ambler et al., 2020); diversification in more commercialized agricultural production
(Prifti et al., 2020), and investment in rural non-farm enterprises, and accumulation of productive assets and
savings (Covarrubias et al., 2012; Handa et al., 2015; Haushofer and Shapiro, 2016; Handa et al., 2018).
Drawing on economic theory, these studies posit that cash transfers foster productive investments by helping
to reduce liquidity constraints (income effect) and consumption risks (insurance effect) that hinder
investments in the context of pervasive market failures (Daidone et al., 2019). Yet, the impacts of cash on
recipients may extend beyond income and insurance effects. Experimental evidence from the pilot of the
Zambia’s Social Cash Transfer programme in Monze district suggests that cash transfers may influence
recipient’s intertemporal discount rates by altering their time preferences for money (Handa et al., 2020).
However, it is not clear if these behavioural and psychological changes contribute to measurable changes in
economic behaviours.
In this article, we explore the complex dynamics between participation in cash transfer programmes and the
multidimensional factors that characterize economic inclusion. We do this using experimental evidence from
the Child Grant (CG) model of the Social Cash Transfer programme in Zambia, which provides unconditional
cash transfers to women within extremely poor households who are mothers or caregivers of children under
five years of age. Given the context of the CG data used in this study, our analysis focuses in particular on
questions related to the economic inclusion of rural women. Policies and programmes to foster economic
inclusion for rural women have both intrinsic and instrumental value (de Brauw et al., 2014). On the one
hand, increased economic inclusion of rural women is necessary to create a more just and equitable society.
By fostering greater autonomy and independence in the productive sphere, rural women are able to exert
greater social and political influence in their communities and society more broadly (OECD, 2011). On the
3
other hand, women’s economic inclusion is linked to a broader set of desirable economic outcomes, such as
decreased income inequality, increased economic diversification, and increased overall growth (World Bank,
2021; IMF, 2018).
We conceptualize women’s economic inclusion as a transformative process that leads to greater income-
generating capacity, while addressing the productive, financial, social, and psychological factors that hinder this
process (FAO 2020; World Bank, 2021). We operationalize this by assessing the impacts of receiving cash on four
pillars of economic inclusion. The first pillar is productive capacity, measured in terms of starting non-farm
enterprises that are gendered as female in the study region—beer brewing, petty trading, and fish trading (Natali
et al., 2016)— as well as accumulating assets within these enterprises. The second pillar is financial inclusion,
measured in terms of an ability of women to save and the quantity saved. The third pillar is social power, measured
as increased decision-making power over personal and household economic choices. The final pillar assesses
changes in psychological assets, measured in terms of changes in time preference— the subjective value attributed
to present over future consumption (Balakrishnan, et al., 2020; Cohen et al., 2020) — and expectations about the
future.
The paper makes several contributions to the literature on economic inclusion in general, and the impacts of
cash transfer programmes on economic inclusion in particular. First, it assesses the impacts of an exogenous
cash transfer on the multiple pillars of economic inclusion, thereby offering an approach for measuring
progress on economic inclusion. Second, the article contributes to the small and growing literature on the
impacts of cash transfers on behavioural and psychological parameters related to economic inclusion in rural
spaces and extends this literature by focusing particularly on rural women. Finally, in addition to measuring
the direct casual impacts of exogenous cash on economic inclusion outcomes, we employ a mediation
analysis to explore whether observed impacts of cash on productive outcomes (productive capacity and
financial inclusion) are influenced by improvements in recipients’ psychological assets. Understanding the
interrelationships between individuals’ psychological assets and productive actions, and the role that policies
and programmes play in strengthening these, is an important step toward developing effective economic
inclusion and anti-poverty policies.
4
2. Conceptual framework: outcomes of interest and hypotheses
In this article, we bring together the distinct literature on women’s economic inclusion and impacts of cash
transfers to inform our empirical analysis and hypotheses. Our conceptual starting point is that the economic
inclusion of rural women is a transformative process, involving a transition from a situation of limited power
and lack of access and control over economic assets to a situation of advanced decision-making power and
control over economic resources (Taylor and Pereznieto, 2014). VeneKlasen and Miller (2002) identified four
specific directions in which this increase in power and agency occurs: power to make economic decision
within households, communities and local economy; power over financial, physical and knowledge-based
assets; power with, which is the ability to organize with other economic actors, and power within, meaning
improved psychological assets, including self-esteem and sense of entitlement.
We map these dimensions of transformation onto four outcome variables to measure the impacts of cash
transfers on women’s economic inclusion in the context of the remote rural districts that are the focus of this
study. The first outcome we call productive capacity, which is measured in terms of starting a non-farm
enterprise and the value of assets owned for these enterprises. Participation in non-farm business activities
is critical for economic inclusion of rural women, as it offers a pathway toward greater financial independence
and exit from low-wage informal employment in which they are frequently trapped (Chant and Pedwell,
2008; Meagher, 2010; Malta et al., 2019; Hunt and Samman, 2016; Kabeer et al., 2012; Buvinic and Furst-
Nichols, 2014; Grown, 2014).
To construct variables related to non-farm enterprises, we use responses from the business module of the
survey, which was administered to the main female respondent only at follow-up. The first outcome
measures the impact on the extensive margin as the share of households that run at least one of the typical
female-led enterprises in the previous twelve months. In the three Zambian districts of Kalabo, Shangombo
and Kaputa, which are the focus of this study, survey data shows that beer brewing, petty trading, and fish
trading are the predominate female-led and account for 70 percent of the total active businesses of women
(Natali et al., 2016). Second, we construct a variable to measure the impact intensively in terms of the value
of assets owned for those activities and their average monthly profit.
5
The second outcome we consider is financial inclusion, which we measure in terms of the ability of women
to save and quantity saved. We compute these outcomes using responses from the saving module of the
questionnaire, which was administered to the primary caregiver and recipient of the transfer. First,
respondents were asked whether they were saving at the time of the interview. We use these binary
responses to compute an outcome that is the share of women savers. For positive responses, the enumerator
then asked about the amount saved in the last month, which we use to construct a continuous variable, with
a value of 0 for those not saving at the time of the interview. 1
Literature shows that the ability to save has a transformative effect on women’s lives, since it allows them to
manage risk, smooth consumption, improve their resilience to shocks and increase their agency (Hendricks,
2019). Indeed, one of the biggest obstacles for women’s economic inclusion is the lack of access to economic
resources and the lack of freedom to use them independently (Hunt and Samman, 2016; Taylor and
Pereznieto, 2014; Klugman et al., 2014). Personal savings for women are an important source of economic
resources, as well as a tool to expand their economic choices and to increase their control over personal and
household expenditures (ODI, 2016; Klugman et al., 2014). Evidence also shows that improvements in savings
of women generates a range of beneficial multipliers, including better outcomes for children (e.g., education
and health), household nutrition, and community development (Duflo, 2003; Prina, 2015).
The third outcome we consider is social power, which we measure using variables that capture women’s
decision-making power over a range of personal and household economic activities. Gendered differences in
economic decisions-making power within households reflects patriarchal social structures that segregate
women’s sphere of influence to domestic tasks and men’s to productive one (Alesina et al., 2013; Santos Silva
and Klansen, 2021). However, evidence shows that intra-household decision-making power is influenced by
changes in women’s control over economic resources (Duflo, 2012; Lundberg and Pollak, 1996; Quisumbing
and Maluccio, 1999). As suggested by the Nash cooperative bargaining models of household behaviour,
increased control over resources by women implies an increased “threat point” for exiting the household,
which gives women greater bargaining power within the household, and translates into greater decision-
making power over household and personal choices (de Brauw et al., 2014).
1 Ninety-four percent of respondents at both baseline and follow-up keep their savings at home and only around three percent keep their savings in official institutions, such as post offices or banks.
6
To measure women’s decision-making power we make use of four decision-making questions in the women’s
empowerment module. Namely: 1) who decides how the money the respondent earns will be used; 2) who
decides how the money the respondent’s partner earns will be used; 3) who makes decision about major
household purchases, and; 4) who makes decision about making purchasing for daily household’s needs.
Responses are coded as one if the respondent indicated that she is either sole or joint decision-maker. In
addition, we construct an index using those binary variables following the summary index methodology of
Anderson (2008), which is a weighted mean of the four responses.
Our final economic inclusion outcomes are psychological assets, measured in terms of changes in time
preferences and expectations about the future. Theoretical models of decision-making ascribe a
determinative role in economic decision-making to individuals’ time preferences and expectations about the
future (Balakrishnan, et al., 2020 Cohen et al., 2020; Handa et al., 2014). In the context of the remote and
poor regions that are the focus of this study, two phenomena shape the relationships between economic
inclusion and individuals’ subjective time preferences and future expectations. First, individuals prefer to
smooth consumption evenly over time (Harrison et al., 2007; Harrison et al., 2005: Holt and Laury, 2002,
2005). Second, households that are eligible for the CG lack the resources and markets to allow them to
separate their production from consumption decisions, since consumption choices directly depend on their
production (Daidone et al., 2019). In context of missing insurance and credit markets and in the absence of
social safety nets, these two factors push individuals to rationally internalize the risk of negative shocks to
consumption in their productive choices, favouring safer but less productive and profitable options (Prifti et
al., 2019; Boucher et al., 2009; Lamb, 2003; Mendola, 2007; Dercon, 1996; Morduch, 1995). This behaviour
is also known as the Ramsey discount framework, and helps to explain how households make logical inter-
temporal consumption and investment decisions using a rate of time preference (RTP) to discount future
consumption in order to maximise lifetime utility, based on their expectations about future life conditions
(Di Falco et al., 2011). As a result, pessimistic expectations and preferences for immediate utility may
relegate households to subsistence oriented economic choices, and thus hinder processes of economic
inclusion. 2
2 All indicators of women’s economic inclusion have been tested for statistical differences at baseline between treatment and control group, using t-test of means across groups and clustered errors2, and no significant difference has been detected (see Annex 1 and Annex 2).
7
Women’s time preferences are derived from a set of task choices, which ask respondents to choose between
a smaller-sooner or larger-later pair of outcomes. 3 In the case of the Zambia CG impact evaluation survey,
non-incentivized lotteries were administered to one woman per household, either the biological mother or
the primary caregiver of a child aged 0-5 living in the household. Participants were asked about five different
intertemporal tasks, each entailing two possible options: accepting an immediate gain of ZKW 200, which
remains stable throughout the five tasks, or waiting one month to receive a larger sum. This larger sum
increased throughout the tasks. More precisely, future gains amount to ZKW 200, 4 ZKW 300, ZKW 400, ZKW
600 and ZKW 800 respectively. To put these amounts into context, ZKW 200 is equivalent to about USD 40,
which represents a substantial income increase considering that the average daily per-capita consumption
pre-treatment is ZMW 1,05 (20 USD cents).
In order to estimate consistent time preferences, intertemporal choices must follow the monetary
monotonicity property, which requires that subjects prefer more money to less given a fixed time horizon
(Freeman et al., 2016). We, therefore, excluded inconsistent responses, where participants were willing to
wait for a certain amount, but not willing to wait for a higher gain. This allows us to identify one single
switching point for each respondent, which is a proxy for their intertemporal discount rate. (Handa et al.,
2020; Andersen et al., 2006; Harrison et al., 2002). Moreover, as discussed in Laajaj (2017), future
expectations influence discount rates, so that pessimistic individuals tend to be more myopic as a way to
reduce anxiety about the uncertainty of the future. To estimate the impact on the Zambia CG on time
discounting, we create five dummy variables, one for each task administered, and one for “impatient”
respondents, defined as those who are never willing to wait in any task.
Future expectations are computed based on responses to a series of questions which ask if the respondent
anticipates a better life in one, three or five years from the moment of the interview.5 The specific question
is: “Do you think your life will be better in one/three/five years?”. The three options are asked separately, so
that respondents have to answer to each of them. To estimate the impact on the Zambia CG on future
expectations, one dummy variable for each of the three question is constructed, and one additional variable
for “pessimistic” respondents who do not foresee life improvement in either one, three or five years.
3 These questions come from a “Money Earlier or Later” (MEL) model, and more precisely through the Multiple Price List variant (Cohen et al., 2020; Freeman et al., 2016) 4 This response was included to test whether or not respondents understood the time preference questions. However, qualitative interviews show that people may rationally choose to wait for an equal amount of money if they are unsure how to spend it or have no place to keep it securely (Handa et al., 2020). 5 For the analysis, two set of indicators have been created, one including all the respondents, and one filtering-out respondents showing a double switching pattern of response. The aim is to compare the results and to assess whether inconsistent respondents represent a possible source of bias in the estimation.
8
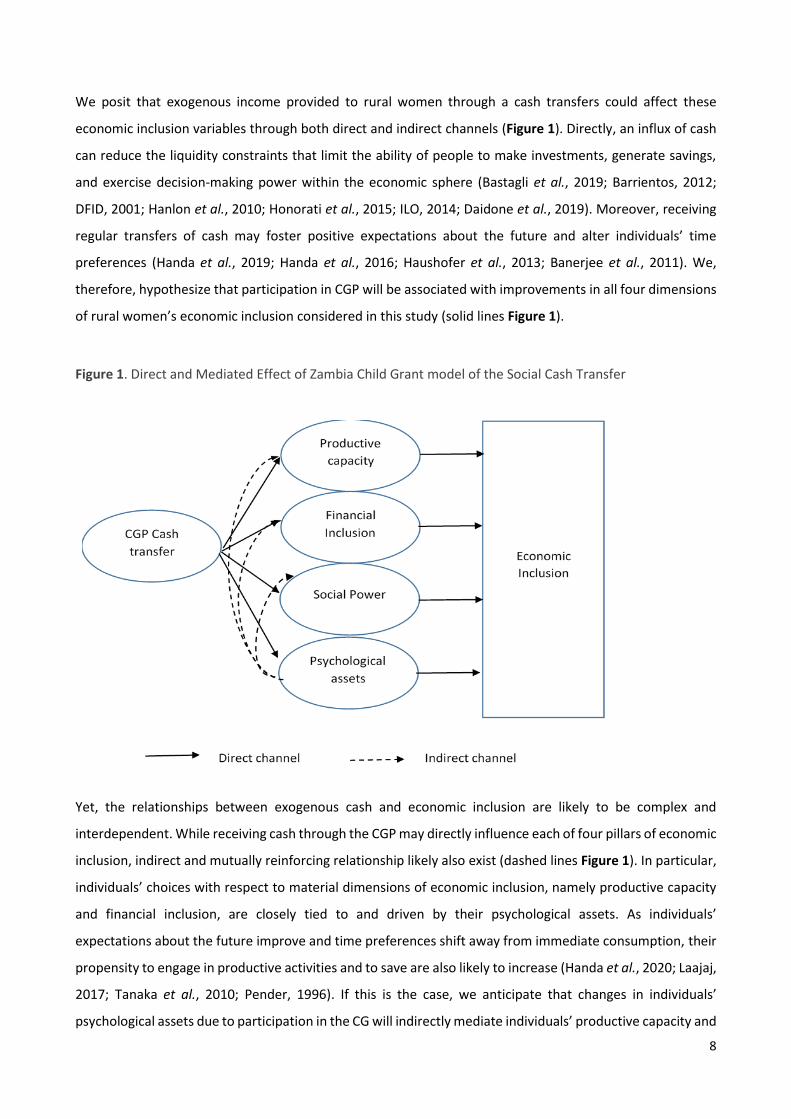
We posit that exogenous income provided to rural women through a cash transfers could affect these
economic inclusion variables through both direct and indirect channels (Figure 1). Directly, an influx of cash
can reduce the liquidity constraints that limit the ability of people to make investments, generate savings,
and exercise decision-making power within the economic sphere (Bastagli et al., 2019; Barrientos, 2012;
DFID, 2001; Hanlon et al., 2010; Honorati et al., 2015; ILO, 2014; Daidone et al., 2019). Moreover, receiving
regular transfers of cash may foster positive expectations about the future and alter individuals’ time
preferences (Handa et al., 2019; Handa et al., 2016; Haushofer et al., 2013; Banerjee et al., 2011). We,
therefore, hypothesize that participation in CGP will be associated with improvements in all four dimensions
of rural women’s economic inclusion considered in this study (solid lines Figure 1).
Yet, the relationships between exogenous cash and economic inclusion are likely to be complex and
interdependent. While receiving cash through the CGP may directly influence each of four pillars of economic
inclusion, indirect and mutually reinforcing relationship likely also exist (dashed lines Figure 1). In particular,
individuals’ choices with respect to material dimensions of economic inclusion, namely productive capacity
and financial inclusion, are closely tied to and driven by their psychological assets. As individuals’
expectations about the future improve and time preferences shift away from immediate consumption, their
propensity to engage in productive activities and to save are also likely to increase (Handa et al., 2020; Laajaj,
2017; Tanaka et al., 2010; Pender, 1996). If this is the case, we anticipate that changes in individuals’
psychological assets due to participation in the CG will indirectly mediate individuals’ productive capacity and
Figure 1. Direct and Mediated Effect of Zambia Child Grant model of the Social Cash Transfer
9
financial inclusion (Handa et al., 2014; Banerjee et al., 2011). Evidence of both direct and mediated impacts
of CG on economic inclusion would be indicative of a transformational process of economic inclusion
involving mutually reinforcing and self-sustaining feedback loops generated through the intervention.
10
3. Background and experimental design
3.1 The Zambia child grant model of the social cash transfer programme
Despite generally strong economic growth over the last two decades and reductions in overall poverty headcount
rates, rural poverty rates remain persistently high in Zambia. Indeed, rural poverty rates are almost three times
higher (77.9 percent) than the levels observed in urban areas (27.5 percent) according to the latest available
statistics (World Bank, 2015). The challenge of entrenched rural poverty is particularly acute for rural women, who
face a range of social, cultural, and economic constraints to engaging in remunerative income generating activities
(Davis et al., 2010).
In response to the challenges of persistent rural poverty, vulnerability and social exclusion, the Government of
Zambia prioritized the development and expansion of social protection for rural people in the Fifth National
Strategic Development Plan (Government of the Republic of Zambia, 2006). An important component of the
country’s social protection response is the Social Cash Transfer (SCT) programme. The SCT was initially piloted in
the districts of Kalomo (2003), Kazungula (2005), Chipata (2006), Monze (2006) and Katete (2007), and mainly
targeted destitute and incapacitated/labour-constrained households. Between 2010 and 2014, the programme
increased its scale and institutional strength, while targeting was subdivided into two streams: i) the Child Grant
(CG) model, reaching households with children under the age of five, and; ii) the Multiple Category Transfer Grant
(MCTG) model, providing support to households with other forms of vulnerability.
This analysis focuses on the CG model, which was rolled out in the districts of Kalabo, Shangombo and Kaputa6
between 2010 and 2012. The Government targeted these three districts because they had the highest rates of
mortality, morbidity, stunting and wasting among children under five in the country. The CG targets all household
with children under five years of age with an unconditional cash transfer. However, during the pilot, the CG model
enrolled only households with children under three years of age to ensure that beneficiaries would receive the
transfer for two years.
Through the CG, mothers or primary care givers of the children received ZMW 55 per month (USD 11), which was
later increased to ZMW 60 (USD 12). The value of the transfer did not vary by the number of children, and
payments occurred every two months through a local paypoint manager. Based on the average of five members
per household in the sample, the benefit accounts for an additional ZMW 11 per capita per month, which
represents a 27 percent increase to the household’s monthly expenditure (the average monthly per capita
expenditure in recipient households before the implementation of the CG was KMW 40.74).
6 In 2014 the Government of Zambia reformed its cash grants system and harmonized the existing models with one common set of eligibility criteria. Recipients of the CG and MCTG were gradually re-targeted for the new programme and phased out if they were no longer eligible. As of 2019, the approximate reach of the SCT is of 632 000 households (UNICEF, 2019).
11
To gauge the impact of the CG on recipient, a rigorous 24-months impact evaluation was embedded in the pilot.
Studies based on these data show generally strong impacts on recipient livelihoods. Handa et al., (2015), for
example, find that the CG increased per capita consumption by ZMW 15.18, which is more than the per capita
value of the transfer itself (ZMW 11). This contributed to a reduction in extreme poverty (headcount rate reduced
by five percent and poverty gap and squared poverty gap by almost 11 percent); improvements in food security
(especially for infant and child feeding); an increase crop and livestock production, inputs investment (land, seeds,
fertilizer and hired labour); asset accumulation (tools and animal ownership, business assets), and non-farm
business activities. Also, a shift from agricultural wage labour to family agricultural and non-agricultural business
has been observed (Handa et al., 2015; Daidone et al., 2019).
The evidence on the CG model’s impact on women is also compelling. After 24 months, the cash transfer increased
the proportion of women savers by around 23 percentage points (Handa et al., 2015), while small animal livestock
holding, which typically fall under the control of women (Njuki and Sanginga, 2013) increased by between 3
percentage points (ducks) and 15.4 percentage points (chickens) (Handa et al., 2015). The programme also
contributed to an increase of 15 percentage points in women’s participation in non-farm businesses relative to
the control group (Natali et al., 2016). Finally, Bonilla et al. (2017) find an increase in sole or joint decision-making
in 5 out of 9 domains (children’s schooling, own income, partner’s income, children’s clothes, family visits).
Nevertheless, magnitude of change (0.34) is quite small, suggesting that patriarchal social structures continue to
shape the capacity of rural women to exercise control over economic decisions within households.
3.2 Data and study sample
The data used for this study comes from a total of 2,515 households (14,565 individuals) from 90 Community
Welfare Assistance Committees (CWACs) that were randomly selected and assigned to immediate or delayed
participation in the CG in Kalabo, Shangombo and Kaputa districts, Zambia. The first stage of randomization
involved selecting 30 CWACs within each district through a lottery, after which CWACs members and Ministry staff
identified all eligible households with at least one child under 3 years old. This resulted in more than 100 eligible
households in each CWAC. By flip of a coin, half of the CWAC were assigned to treatment and the other half to the
control groups. Finally, 28 households were randomly sampled from each CWAC to be interviewed for the impact
evaluation. Baseline data collection was conducted before the division into treatment and control group in order
to avoid possible biasing of responses. Both baseline and follow-up data collection rounds occurred during the
lean season (September through February), when households have the least amount of food left from the previous
harvest, and thus hunger and poverty are more severe.
12
Because we are interested specifically in impacts on rural women, we exclude from the analysis households where
the main respondent is male (47 households). In addition, 138 households where the main female respondent
changes between baseline and follow-up are dropped, in order to allow perfect comparability of women’s time
preferences and expectations. Finally, households that dropped out of the programme are excluded from the
analysis, even though AIR (2013) investigated in detail both differential and overall attrition, and did not find any
differential attrition after twenty-four months. 7 The resulting final panel sample comprises a total of 4382
households (2191 for each wave).
3.3 Empirical strategy
In this section, we first present the estimation strategy adopted to investigate the direct impact of CG model of
the Social Cash Transfer on women’s economic inclusion (section 3.3.1). We then discuss the mediation analysis
conducted to investigate the indirect impact of CG via the mediating role of time preferences and expectations
(section 3.3.2).
3.3.1 Direct impact of the Child Grant on women’s economic inclusion
To assess whether the cash transfers had an impact on women’s economic inclusion, we took profit of the
experimental design of program roll-out and we used the panel sample to conduct a Single Difference analysis at
follow-up. This approach allowed us to overcome the potential issue of lack of baseline data on non-farm
enterprises. For consistency reasons, the same methodology has been applied to all the indicators. Nevertheless,
when data are also available at baseline, a difference-in-differences estimation is conducted for robustness check.
(Eq.1) 𝑌ℎ = 𝛽0 + 𝛽1𝑇ℎ + 𝛽2𝑋ℎ + 𝜀ℎ
Y is one of the indicators for economic inclusion (productive capacity, financial inclusion, social power, for
household h, T is the dummy variable identifying the treated households h for T equal 1, and X is a vector of
exogenous characteristics including: socio-demographic characteristics of the main respondents and of the
household (age, education, marital status, household members, roof and wall material, toilet conditions, water
availability, consumption); negative income shocks (weather shocks, crop failure, death or illness of breadwinner),
and; district of residence. Standard errors are clustered at CWAC level, and weights adjusted for attritions and the
probability of selection were used to provide population-level estimates of the impact of the programme.
7 Differences in the overall attrition are mainly due to a lower rate of response at follow-up in Kaputa district. Daidone et al. (2014) expanded the analysis by assessing the randomness of attrition, and no significant determinant of attrition beside residing in Kaputa has been identified, including the treatment indicator. This confirms that attritors are balanced and randomly distributed across treatment and control group, hence they do not entail a source of bias.
13
3.3.2 Mediated impact of the child grant on women’s economic inclusion
To assess whether the CG affects women’s economic inclusion through changes in women’s time preference and
future expectations we apply a mediation analysis methodology, first introduced by Baron and Kenny (1986) and
later developed by Imai et al. (2010; 2010b; 2011). The goal of mediation analysis is to assess the role of possible
intermediate variables that explains alternative causal mechanisms between the independent and the outcome
variable (Imai et al., 2010; Keele et al., 2015). The model proposed by Baron and Kenny (1986) is a linear structural
equation that allows the decomposition of the total impact into the mediated effect of the treatment, which
represents the hypothesized causal mechanism through which the mediator affect the outcome, and the direct
effect of the treatment, representing all other channels through which the program impact the outcome (Imai et
al., 2011: 768). In other words, this approach allows us to disentangle if and to what extent the impact of the
independent variable (treatment status) on the outcome variable (productive capacity, financial inclusion, and
social power) is mediated by time preferences/future expectations (Baron and Kenny, 1986).
The validity of mediation analysis’ causal interpretation relies on the so-called sequential ignorability assumption,
which implies that two ignorability assumptions are made sequentially (Imai et al., 2010; Imai et al., 2010b).
Ignorability assumption: 8
{𝑌ℎ(𝑡′, 𝑚), 𝑀ℎ(𝑡)} ⫫ 𝑇ℎ|𝑋ℎ = 𝑥 (Eq. 2)
𝑌ℎ(𝑡′, 𝑚) ⫫ 𝑀ℎ(𝑡)|𝑇ℎ = 𝑡, 𝑋ℎ = 𝑥 (Eq. 3)
where 0 < Pr (𝑇ℎ = 𝑡|𝑋ℎ = 𝑥) and 0 < Pr(𝑀ℎ = 𝑚|𝑇ℎ = 𝑡, 𝑋ℎ = 𝑥) for t=0,1 and all x and m in the support for
Xh and Mh, respectively. The first part, namely the ignorability of treatment assignment states that, given the
observed pre-treatment confounders, treatment status is assumed to be statistically independent of potential
outcome variables and mediators. In other words, treatment status must be exogenous from both women’s
economic inclusion and time preferences/future expectations. In the specific case of this research, the
experimental design of the program, namely Randomized Control Trial (RCT), satisfies the first part of sequential
ignorability. The second part is the ignorability of the mediator, given the treatment status and the observed pre-
treatment confounders. For this part to hold, all the pre-treatment covariates that affect the relationship between
the outcome variable and the mediator must be included in the model (Keele et al., 2015). When both parts of the
sequential ignorability assumption hold, the average causal direct effect and the mediated effect can be estimated
with the following two linear equations:
8 Where Th is the treatment indicator, Mh is the mediator and Xh is a vector of confounders for households h
14
𝑀𝑒𝑑𝑖𝑎𝑡𝑜𝑟ℎ = 𝛼0 + +𝛼1𝑇ℎ + 𝑎2𝑋ℎ + 𝜀ℎ (Eq. 4)
𝑌ℎ = 𝛾0 + 𝛾2𝑇ℎ + 𝑦2𝑋ℎ𝑡 + 𝛾3𝑀𝑒𝑑𝑖𝑎𝑡𝑜𝑟ℎ + 𝜀ℎ (Eq. 5)
According to this method, the total effect of the treatment is decomposed in a direct effect and a mediated effect.
The direct effect (�̂�2 from Equation 5) is the impact of the cash transfer on women’s economic inclusion, controlling
for the mediator and a set of confounding factors that might influence the impact. The mediated effect (�̂�1 from
Equation 4 multiplied by �̂�3 from Equation 5) is equal to the direct impact of the program on the mediator (�̂�1
from Equation 4) multiplied by the effect of the mediator on women’s economic inclusion (�̂�3 from Equation 5). It
represents the part of the impact on women’s economic inclusion due to changes in the mediator, in this case
changes in time preferences and future expectations separately, always controlling for the same set of
confounding factors.
3.4 Baseline descriptive data
All control variables were tested for statistical differences between treatment and control group, using t-test of
means across groups and clustered errors. Out of 24 variables, only 1 showed statistically significant differences,
namely the average number of females per household, which is higher in the treatment group (see Annex 3).
Besides checking for statistical balance between the two groups, baseline descriptive statistics provide a snapshot
of demography, wellbeing and lifestyle of the sample before the start of the cash transfer. Sample characteristics
are presented with control and treatment group combined since they are similar and they both represent eligible
candidates of the CG. First, the households included in the sample are evenly distributed among the three districts
of implementation. The average household size is five, and overall female and male population are balanced. The
average age is 15, denoting an extremely young sample, and the average age of the female main respondents is
29. Most female main respondents are married (73 percent), and the majority of them did not complete primary
education (71 percent). Households’ food insecurity is measured according to the Household Food Insecurity
Access Scale Methodology (Coates et al., 2007), and the average score is 15, on a scale from 0 to 24, where highest
score indicates more severe food insecurity. 9 A total of 53 percent of the sample lies above the average food
insecurity score. The average weekly per capita expenditure for food consumption is ZKW 8.9, which drops to ZKW
7.3 for the most food insecure households. Housing conditions of both treatment and control group are basic,
with 95 percent of the sample lacking access to improved toilet facilities, 95 percent with thatched roof, 68 percent
live in houses without burnt brick walls, and 78 percent without access to safe drinking water. In terms of negative
shocks to income, 5.3 percent of the households were affected by flood in the previous year, 4.9 percent were
affected by drought and six percent by chronic illnesses. Taken together, these data suggest that the population
9 The standard version of the HFIAS includes 9 questions, with a score ranging from 0 to 27. Nevertheless, in this specific case one question has been dropped from the analysis, namely eating limited variety of food, as it was asked only at follow-up.
15
in this study face considerable material hardship, and thus substantial barriers to actively engaging in and
benefiting from economic growth opportunities.
These barriers are reflected in indicators of economic inclusion. Only 16.8 percent of female respondents indicated
that they were saving at baseline, with an average quantity saved per month of ZKW 18.7 (approximately $3.50).10
Most of the respondents declared to be involved in household economic-decisions together with their partners:
56 percent indicated that they are involved in decisions on how to spend their personal earnings; 50 percent are
involved in the decisions about how to spend their partners’ earnings; 59 percent participate in decisions on major
household purchases, and; 65 percent participate in decisions on daily household purchases. These responses
result in an average decision-making index of 0.59.
In terms of time preferences at baseline, 20.5 percent of respondents declared that they are not willing to wait
one month for any of the amount of money offered in the time task. On the other hand, 15 percent of respondents
are willing to wait for the sum of ZKW 200 (approximately $37.5), while the majority of interviewed (37 percent)
switched from the immediate gain to the future prize at ZKW 300 (approximately $56.3). In terms of future
expectations, 31 percent of respondents do not foresee any improvement in one, three or five years. The
percentage of those positive about the future increases throughout the task, with 52 percent declaring to have
better life expectations in one year, 55 percent in three years and over 60 percent in five years.
10 Baseline data for non-farm business are not available as data have been collected only at follow-up.
16
4. Results
We divide this section into two sub-sections. In the first, we present the results of the direct impacts of the CG on
the four pillars of women’s economic inclusion. In the second, we explore if the CG cash transfer generates indirect
impacts on material dimensions of economic inclusion (productive capacity and financial inclusion) through
changes in psychological outcomes (time preferences and expectations).
4.1 Direct impact of the Zambia child grant model of the social cash transfer programme
4.1.1 Productive capacity: non-farm businesses
After 24-months, the program was highly successful at fostering rural women’s productive capacity by increasing
new business investments and increased profitability and asset value in already existing ones (see Table 1). We
find that the share of households running any type of non-farm business is 17 percent higher in the treatment
group at follow-up. This result is consistent with Daidone et al. (2019) that document an increase of the share of
households operating a non-farm business of 17 percentage points. Most of the increase in engagement in non-
farm enterprises is caused by a significant growth in female-dominated enterprises of petty trade, beer brewing
and fish trade. Indeed, the share of households running at least one of these enterprises in the treatment group
is 11.8 percent higher compared to the control. Furthermore, not only was the program successful in increasing
extensively female entrepreneurship, it also improved the economic value and performance of these businesses.
Female-led non-farm business in the treatment group are more profitable, registering a higher average monthly
profit compared to the control group (ZKW 43 more, approximately $8.1), and with more monthly investments in
assets (ZKW 15 more, approximately $2.81). Results are robust also for non-linear estimations (see Annex 4).
These results highlight the transformative impact a small but recurring cash transfer can have in alleviating the
constraints that rural women face in engaging in and benefiting from productive economic activities.

17
Table 1. Direct Impact of Zambia Child Grant on female-leaded Non-Farm Enterprises
NFE (all) Female-led NFE NFE asset value
(female-led)
NFE profit
(female-led)
(1) (2) (3) (4) (5) (6) (7) (8)
Unadj. Adj. Unadj. Adj. Unadj. Adj. Unadj. Adj.
T 0.172*** 0.171*** 0.114** 0.118*** 14.79** 15.03*** 43.40** 43.35**
(0.0460) (0.0380) (0.0378) (0.0320) (4.562) (4.358) (16.07) (13.79)
N 2191 2191 2191 2191 2191 2191 2191 2191
R2 0.031 0.105 0.016 0.075 0.007 0.026 0.015 0.075
Linear weighted estimations models with robust standard errors clustered at CWAC level in parenthesis. Unadjusted models do not include control variables, while
Adjusted models include control variables such as, information on the household’s head (age, completed primary education, married), demographic characteristics of the
household (n. of male and female members, n. of members per age group), housing conditions (toilet, wall, roof, water), household consumption and self-assessed poverty,
shocks (drought, flood, illness, bread-earner death), district of residence.
+ p < 0.10, * p < 0.05, ** p < 0.01, *** p < 0.001
4.1.2 Financial inclusion: women’s savings
After 24-months, the Child Grant positively affected women’s savings, increasing both their propensity to save
and the amount of savings. Results show a 24.8 percent increase in women saving in the treatment group
compared to the control at follow-up (158 percent increase from the baseline) (see Table 2). This result is
consistent with Daidone et al. (2019) that find an increase of 24 percent in the share of households saving (both
male and female headed households). Moreover, women in the treatment group save on average ZKW 52 more
than the control group at follow-up (258 percent increase from the baseline) (see Table 2). Results are robust for
non-linear and for difference-in-differences estimations (see Annex 5 and 6). This finding highlights the impact the
CGP has on increasing the capacity of women to save and is indicative of broader improvements in their economic
autonomy and capacity to maneuverer within the economic sphere. Savings also reflect changes in recipients’
intertemporal discount rates and an improvement in their expectations about the future (Loewenstein and Prelec,
1992; Loayza et al., 2000).

18
Table 2. Direct Impact of Zambia Child Grant on women’s savings
Currently Saving
Amount saved (last month)
(1) (2) (3) (4)
Unadj. Adj. Unadj. Adj.
T 0.248*** 0.248*** 54.96*** 52.29***
(0.0334) (0.0323) (12.84) (11.15)
N 2191 2191 2190 2190
R2 0.068 0.090 0.013 0.055
Linear weighted estimations models with robust standard errors clustered at CWAC level in parenthesis.
Unadjusted models do not include control variables, while Adjusted models include control variables such as,
information on the household’s head (age, completed primary education, married), demographic characteristics
of the household (n. of male and female members, n. of members per age group), housing conditions (toilet,
wall, roof, water), household consumption and self-assessed poverty, shocks (drought, flood, illness, bread-
earner death), district of residence. For the variable “amount saved” one observation has been excluded as it
was a source of bias being an outlier.
+ p < 0.10, * p < 0.05, ** p < 0.01, *** p < 0.001
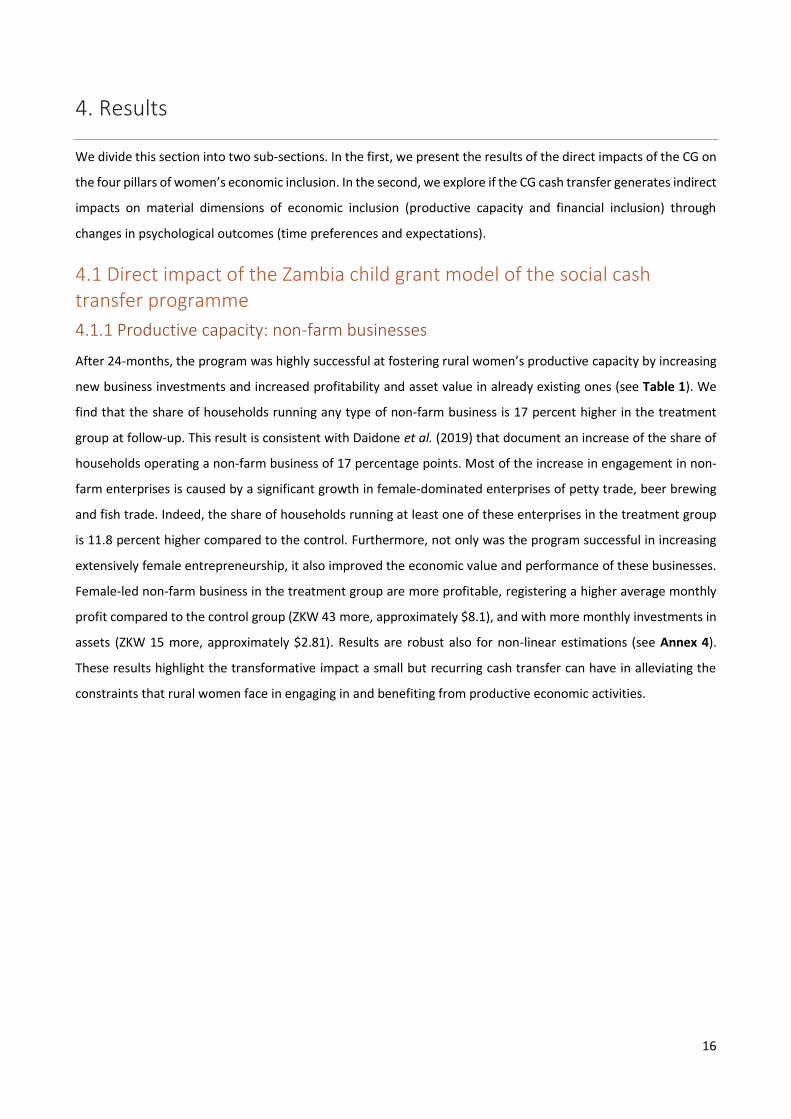
4.1.3 Social power: women’s decision-making power After 24-months, no impacts are found on women’s decision-making power, with no statistically significant
difference between the treatment and the control group in any of the five indicators (see Table 3). Results are
robust for both non-linear and difference-in-differences estimations (see Annex 7 and 8). Hence, despite being
highly successful in influencing material dimensions of economic inclusion—productive capacity and financial
inclusion— the CG did not have any meaningful impact on women’s social power. These results are in line with
findings of Bonilla et al. (2017), and they imply that gender norms around economic activities are strongly shaped
by patriarchal structures within households and societies. Shifts in decision-making power within a household
require broader structural shifts in gendered norms. Thus, women’s economic inclusion will not be achieved simply
by addressing material constraints but will also require concerted efforts to foster women’s social power at
multiple levels.
19
Table 3. Direct Impact of Zambia Child Grant on Women’s Decision-Making Power
Own Earnings
Partner Earnings Major hh purchases Daily hh purchases Index
(1) (2) (3) (4) (5) (6) (7) (8) (9) (10)
Unadj. Adj. Unadj. Adj. Unadj. Adj. Unadj. Adj. Unadj. Adj.
T -0.0278 -0.0191 0.0433 0.0429 -0.00895 -0.00130 0.00589 0.00942 0.00715 0.0112
(0.0293) (0.0284) (0.0376) (0.0356) (0.0318) (0.0251) (0.0203) (0.0191) (0.0197) (0.0193)
N 2191 2191 2191 2191 2191 2191 2191 2191 2191 2191
R2 0.001 0.038 0.002 0.050 0.000 0.092 0.000 0.042 0.000 0.026
Linear weighted estimations models with robust standard errors clustered at CWAC level in parenthesis. Unadjusted models do not include control variables, while
Adjusted models include control variables such as, information on the household’s head (age, completed primary education, married), demographic characteristics
of the household (n. of male and female members, n. of members per age group), housing conditions (toilet, wall, roof, water), household consumption and self-
assessed poverty, shocks (drought, flood, illness, bread-earner death), district of residence
+ p < 0.10, * p < 0.05, ** p < 0.01, *** p < 0.001
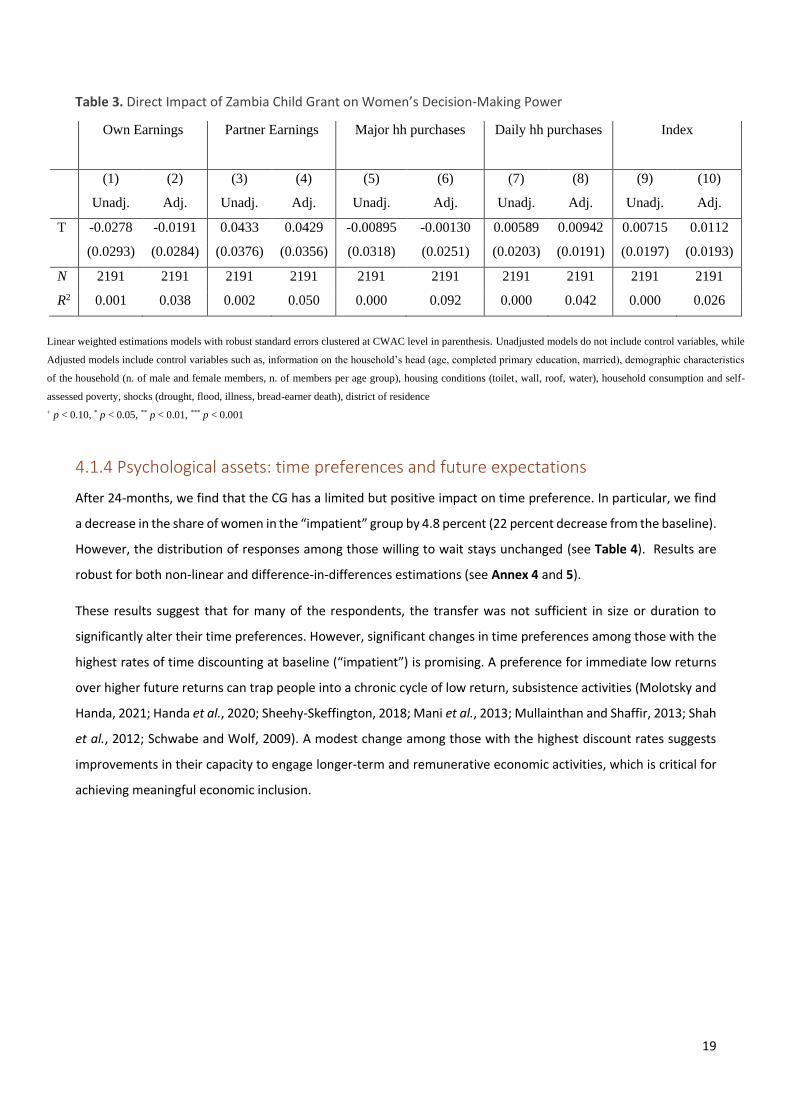
4.1.4 Psychological assets: time preferences and future expectations
After 24-months, we find that the CG has a limited but positive impact on time preference. In particular, we find
a decrease in the share of women in the “impatient” group by 4.8 percent (22 percent decrease from the baseline).
However, the distribution of responses among those willing to wait stays unchanged (see Table 4). Results are
robust for both non-linear and difference-in-differences estimations (see Annex 4 and 5).
These results suggest that for many of the respondents, the transfer was not sufficient in size or duration to
significantly alter their time preferences. However, significant changes in time preferences among those with the
highest rates of time discounting at baseline (“impatient”) is promising. A preference for immediate low returns
over higher future returns can trap people into a chronic cycle of low return, subsistence activities (Molotsky and
Handa, 2021; Handa et al., 2020; Sheehy-Skeffington, 2018; Mani et al., 2013; Mullainthan and Shaffir, 2013; Shah
et al., 2012; Schwabe and Wolf, 2009). A modest change among those with the highest discount rates suggests
improvements in their capacity to engage longer-term and remunerative economic activities, which is critical for
achieving meaningful economic inclusion.
20
Table 4. Direct Impact of the Zambia Child Grant on Time Preferences
Impatient
KW 200 KW 300 KW 400 KW 600 KW 800
(1) (2) (3) (4) (5) (6) (7) (8) (9) (10) (11) (12)
Unadj. Adj. Unadj. Adj. Unadj. Adj. Unadj. Adj. Unadj. Adj. Unadj. Adj.
T -0.048 -0.0486+ 0.010 0.007 0.046 0.039 -0.003 0.003 -0.015 -0.012 0.000 -0.002
(0.029) (0.0266) (0.016) (0.014) (0.037) (0.033) (0.028) (0.024) (0.019) (0.017) (0.008) (0.007)
N 2191 2191 2191 2191 2191 2191 2191 2191 2191 2191 2191 2191
R2 0.004 0.049 0.000 0.024 0.002 0.035 0.000 0.035 0.001 0.025 0.000 0.015
Linear weighted estimations models with robust standard errors clustered at CWAC level in parenthesis Unadjusted models do not include control variables, while
Adjusted models include control variables such as, information on the household’s head (age, completed primary education, married), demographic characteristics
of the household (n. of male and female members, n. of members per age group), housing conditions (toilet, wall, roof, water), household consumption and self-
assessed poverty, shocks (drought, flood, illness, bread-earner death), district of residence
+ p < 0.10, * p < 0.05, ** p < 0.01, *** p < 0.001
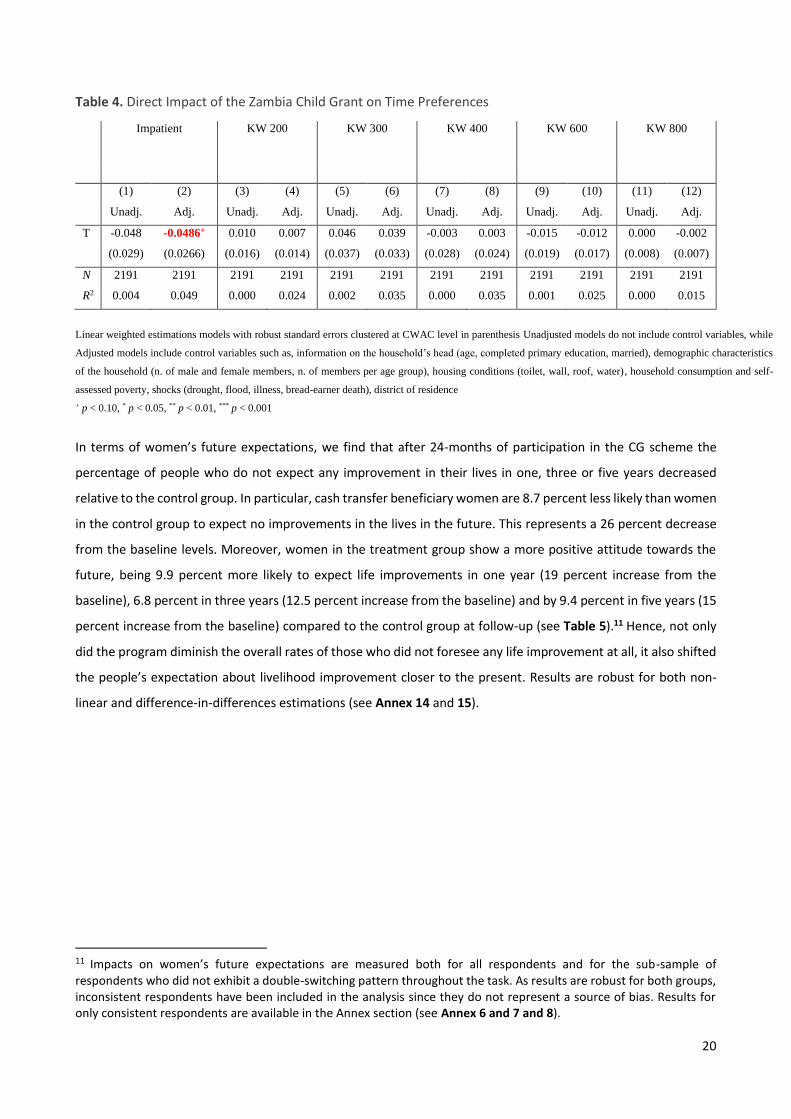
In terms of women’s future expectations, we find that after 24-months of participation in the CG scheme the
percentage of people who do not expect any improvement in their lives in one, three or five years decreased
relative to the control group. In particular, cash transfer beneficiary women are 8.7 percent less likely than women
in the control group to expect no improvements in the lives in the future. This represents a 26 percent decrease
from the baseline levels. Moreover, women in the treatment group show a more positive attitude towards the
future, being 9.9 percent more likely to expect life improvements in one year (19 percent increase from the
baseline), 6.8 percent in three years (12.5 percent increase from the baseline) and by 9.4 percent in five years (15
percent increase from the baseline) compared to the control group at follow-up (see Table 5).11 Hence, not only
did the program diminish the overall rates of those who did not foresee any life improvement at all, it also shifted
the people’s expectation about livelihood improvement closer to the present. Results are robust for both non-
linear and difference-in-differences estimations (see Annex 14 and 15).
11 Impacts on women’s future expectations are measured both for all respondents and for the sub-sample of respondents who did not exhibit a double-switching pattern throughout the task. As results are robust for both groups, inconsistent respondents have been included in the analysis since they do not represent a source of bias. Results for only consistent respondents are available in the Annex section (see Annex 6 and 7 and 8).
21
Table 5. Direct Impact of Zambia Child Grant on women’s future expectations
Pessimist
1 Year 3 years 5 years
(1) (2) (3) (4) (5) (6) (7) (8)
Unadj. Adj. Unadj. Adj. Unadj. Adj. Unadj. Adj.
T -0.0874*** -0.0869*** 0.102** 0.0997** 0.0679* 0.0688** 0.0949*** 0.0942***
(0.0183) (0.0175) (0.0338) (0.0320) (0.0262) (0.0237) (0.0211) (0.0198)
N 2191 2191 2191 2191 2191 2191 2191 2191
R2 0.025 0.044 0.013 0.031 0.007 0.035 0.020 0.041
Linear weighted estimations models with robust standard errors clustered at CWAC level in parenthesis. Unadjusted models do not include
control variables, while Adjusted models include control variables such as, information on the household’s head (age, completed primary
education, married), demographic characteristics of the household (n. of male and female members, n. of members per age group), housing
conditions (toilet, wall, roof, water), household consumption and self-assessed poverty, shocks (drought, flood, illness, bread-earner death),
district of residence.
+ p < 0.10, * p < 0.05, ** p < 0.01, *** p < 0.001
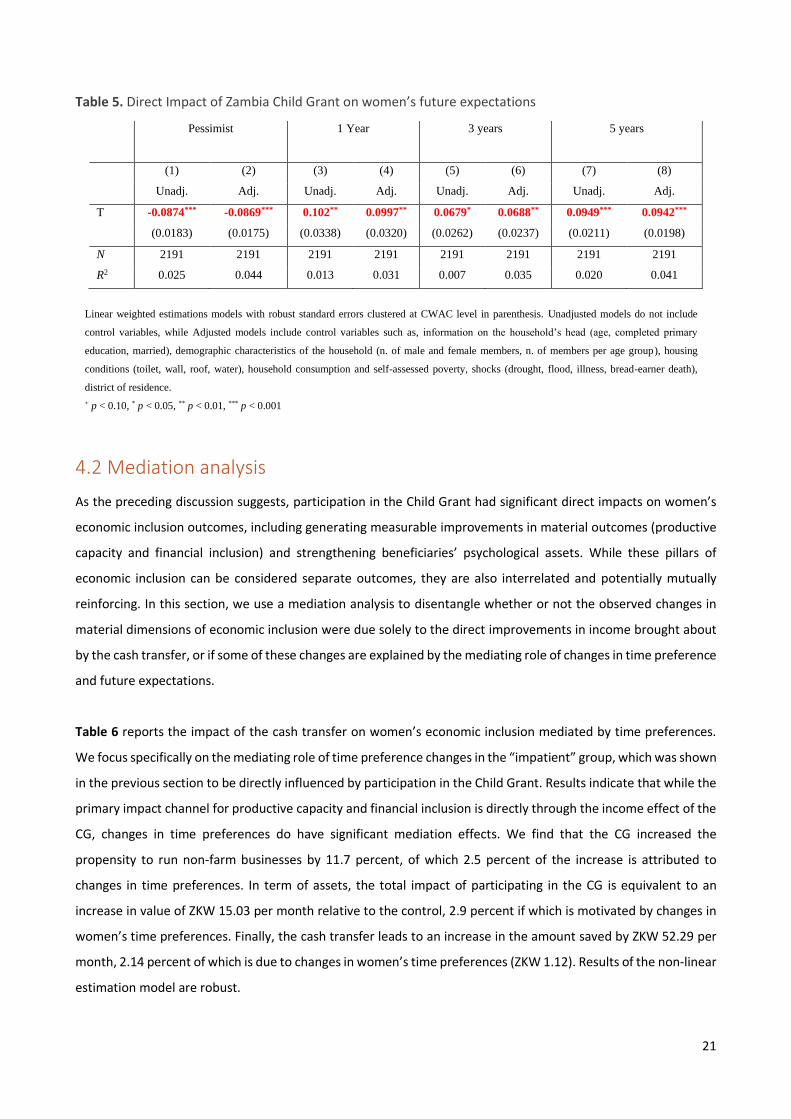
4.2 Mediation analysis
As the preceding discussion suggests, participation in the Child Grant had significant direct impacts on women’s
economic inclusion outcomes, including generating measurable improvements in material outcomes (productive
capacity and financial inclusion) and strengthening beneficiaries’ psychological assets. While these pillars of
economic inclusion can be considered separate outcomes, they are also interrelated and potentially mutually
reinforcing. In this section, we use a mediation analysis to disentangle whether or not the observed changes in
material dimensions of economic inclusion were due solely to the direct improvements in income brought about
by the cash transfer, or if some of these changes are explained by the mediating role of changes in time preference
and future expectations.
Table 6 reports the impact of the cash transfer on women’s economic inclusion mediated by time preferences.
We focus specifically on the mediating role of time preference changes in the “impatient” group, which was shown
in the previous section to be directly influenced by participation in the Child Grant. Results indicate that while the
primary impact channel for productive capacity and financial inclusion is directly through the income effect of the
CG, changes in time preferences do have significant mediation effects. We find that the CG increased the
propensity to run non-farm businesses by 11.7 percent, of which 2.5 percent of the increase is attributed to
changes in time preferences. In term of assets, the total impact of participating in the CG is equivalent to an
increase in value of ZKW 15.03 per month relative to the control, 2.9 percent if which is motivated by changes in
women’s time preferences. Finally, the cash transfer leads to an increase in the amount saved by ZKW 52.29 per
month, 2.14 percent of which is due to changes in women’s time preferences (ZKW 1.12). Results of the non-linear
estimation model are robust.

22
Table 6. Impact of the Zambia Child Grant on women’s economic inclusion mediated by time preferences
Linear model
Non-linear model
(1) (2) (3) (4) (5) (6) (7) (8) (9) (10)
impatient fem_NFE asset_fNFE save qty.save impatient fem_NFE asset_fNFE save qty.save
T -0.0486+ 0.114*** 14.59*** 0.247*** 51.17*** -0.0461+ 0.110*** 14.72*** 0.239*** 52.23***
(0.0266) (0.0315) (4.192) (0.0322) (10.91) (0.0254) (0.0302) (4.290) (0.0289) (10.96)
impatient -0.0625* -9.084* -0.0181 -23.18** -0.0616* -9.661* -0.0197 -26.47**
(0.0294) (4.412) (0.0385) (8.148) (0.0293) (4.469) (0.0391) (9.451)
Direct
Impact
0.114*** 14.59*** 0.247*** 51.17*** 0.110*** 14.72*** 0.239*** 52.23***
Mediated
Impact
0.003+ 0.44+ 0.00 1.12** 0.003+ 0.44+ 0.00 1.21+
Total
Impact
0.117*** 15.03*** 0.248*** 52.29*** 0.113*** 15.16*** 0.239*** 53.45***
N 2191 2191 2191 2191 2190 2191 2191 2191 2191 2190
R2 0.049 0.077 0.028 0.090 0.056
Linear weighted estimations models with robust standard errors clustered at CWAC level in parenthesis. Control variables include information on the
household’s head (age, completed primary education, married), demographic characteristics of the household (n. of male and female members, n. of members
per age group), housing conditions (toilet, wall, roof, water), household consumption and self-assessed poverty, shocks (drought, flood, illness, bread-earner
death), district of residence. For the variable “quantity saved” one observation has been excluded as it was a source of bias being an outlier.
+ p < 0.10, * p < 0.05, ** p < 0.01, *** p < 0.001
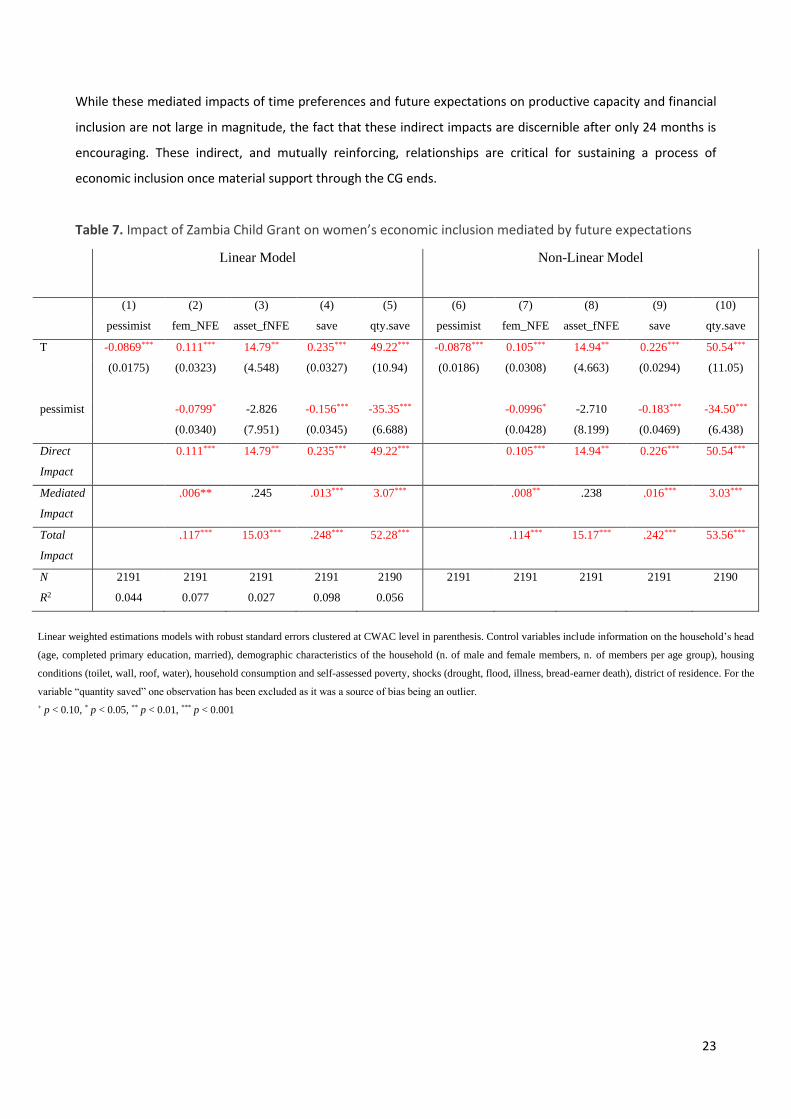
As shown in Table 7, mediated impacts of women’s future expectations on productive capacity and financial
inclusion are also found. Focusing on changes in expectation in the “pessimist” group, 12 we find that of the 11.7
percent increase in propensity to run non-farm businesses due to the CG, five percent of this due to a diminished
rate of pessimism among women in the treatment group. Similarly, of the 24.8 percent increase in women who
are currently saving due to the CG, 5.2 percent of the increase is the result of changes in women’s future
expectations. Focusing on the quantity saved, we find that the program increased the amount saved by ZKW 52.28,
5.26 percent of which is due to changes in women’s future expectations (for a value of ZKW 3.07). Results of the
non-linear estimation model are robust. Therefore, even though limited, future expectations seem to have played
a role in the enhancement of women’s economic inclusion.
12 All of the other indicators of future expectations have been used as mediators and estimations are available in the Annex section (see Annex 16, 17, 18).
23
While these mediated impacts of time preferences and future expectations on productive capacity and financial
inclusion are not large in magnitude, the fact that these indirect impacts are discernible after only 24 months is
encouraging. These indirect, and mutually reinforcing, relationships are critical for sustaining a process of
economic inclusion once material support through the CG ends.
Table 7. Impact of Zambia Child Grant on women’s economic inclusion mediated by future expectations
Linear Model
Non-Linear Model
(1) (2) (3) (4) (5) (6) (7) (8) (9) (10)
pessimist fem_NFE asset_fNFE save qty.save pessimist fem_NFE asset_fNFE save qty.save
T -0.0869*** 0.111*** 14.79** 0.235*** 49.22*** -0.0878*** 0.105*** 14.94** 0.226*** 50.54***
(0.0175) (0.0323) (4.548) (0.0327) (10.94) (0.0186) (0.0308) (4.663) (0.0294) (11.05)
pessimist -0.0799* -2.826 -0.156*** -35.35*** -0.0996* -2.710 -0.183*** -34.50***
(0.0340) (7.951) (0.0345) (6.688) (0.0428) (8.199) (0.0469) (6.438)
Direct
Impact
0.111*** 14.79** 0.235*** 49.22*** 0.105*** 14.94** 0.226*** 50.54***
Mediated
Impact
.006** .245 .013*** 3.07*** .008** .238 .016*** 3.03***
Total
Impact
.117*** 15.03*** .248*** 52.28*** .114*** 15.17*** .242*** 53.56***
N 2191 2191 2191 2191 2190 2191 2191 2191 2191 2190
R2 0.044 0.077 0.027 0.098 0.056
Linear weighted estimations models with robust standard errors clustered at CWAC level in parenthesis. Control variables include information on the household’s head
(age, completed primary education, married), demographic characteristics of the household (n. of male and female members, n. of members per age group), housing
conditions (toilet, wall, roof, water), household consumption and self-assessed poverty, shocks (drought, flood, illness, bread-earner death), district of residence. For the
variable “quantity saved” one observation has been excluded as it was a source of bias being an outlier.
+ p < 0.10, * p < 0.05, ** p < 0.01, *** p < 0.001
24
5. Conclusion
In this article, we developed an empirical strategy to measure the impacts of the Child Grant (CG) model of the
Social Cash Transfer programme in fostering economic inclusion among rural women in Zambia. We conceptualize
economic inclusion as a transformative process comprised of four pillars: productive capacity, financial inclusion,
social power, and psychological assets. As argue that promoting economic inclusion requires policies and
programmes that directly influence these pillars, while at the same time generating indirect feedback loops and
mutually reinforcing dynamics between the pillars. These direct and indirect pathways are essential for initiating
and sustain a process of economic transformation.
Using experimental data from the Zambia CG evaluation, we measure the direct impacts of the cash transfer on
the four pillars of economic inclusion and the indirect relationships between the psychological and material pillars
of economic inclusion. We find strong evidence of direct impacts of CG on the productive capacity, financial
inclusion, and psychological assets of rural women. However, we do not find any direct impacts in terms of
women’s social power, measured in terms of improved decision-making power within the household. This is a
critical weakness and highlights the limitations of cash transfers in terms of fostering meaningful economic
inclusion for rural women. Indeed, while Social Protection has the potential to address different gender
dimensions of poverty and vulnerability, its impacts are not automatically empowering or transformative (FAO,
2018). Interventions should be designed to recognize women’s productive roles, alleviate their reproductive care
burdens and support their social and economic position besides providing income support for women’s economic
inclusion to be achieved (UN Women, 2015; Holmes and Jones, 2013; FAO, 2018). To address these limitations, it
is important to consider integrating cash transfers with complementary programmes designed to address social
and cultural barriers that limit women’s decision-making power within households and beyond. This “plus” may
include, among others, in-kind transfers, psychosocial support, vocational training or access and linkage to services
(Roelen et al., 2017; Esser et al., 2019), for which evidence is scarce since it remains mostly a challenge to turns
this knowledge into concrete actions. Difficulties in mainstreaming gender in design and implementation of Social
Protection programmes are caused by a limited understanding of how gender inequalities shape women’s
experience of poverty, and by failing to understand the critical importance of integrating gender specific elements
into the social protection cycle (FAO, 2018).
In addition to these direct impacts, we utilize a mediation analysis to explore indirect relationship between pillars
of economic inclusion. Through this approach, we find indicative evidence of indirect and mutually reinforcing
relationships between changes in psychological assets brought about through the CG and improvements in the
productive capacity and financial inclusion of beneficiaries. Evidence of these indirect pathways is important,
because by kick starting these mutually reinforcing relationships a process of economic inclusion can be better
sustained after income support from the CG ends.
25
Closing the economic gender gap, particularly in rural areas, is fundamental for achieving the global ambition to
end poverty. Enabling a process of economic inclusion of rural women is critical for this ambition and is consistent
with the normative principle of leaving no one behind. Our results suggest that providing economically
marginalized rural women with regular transfers of cash can help to initiate and sustain this process. Yet cash
alone is not sufficient. Innovative policies and programmes that address the material, social, and psychological
constraints to economic inclusion in a holistic manner are required. This builds on the recognition that these
barriers are multi-faceted, and therefore require multi-dimensional actions to address them.
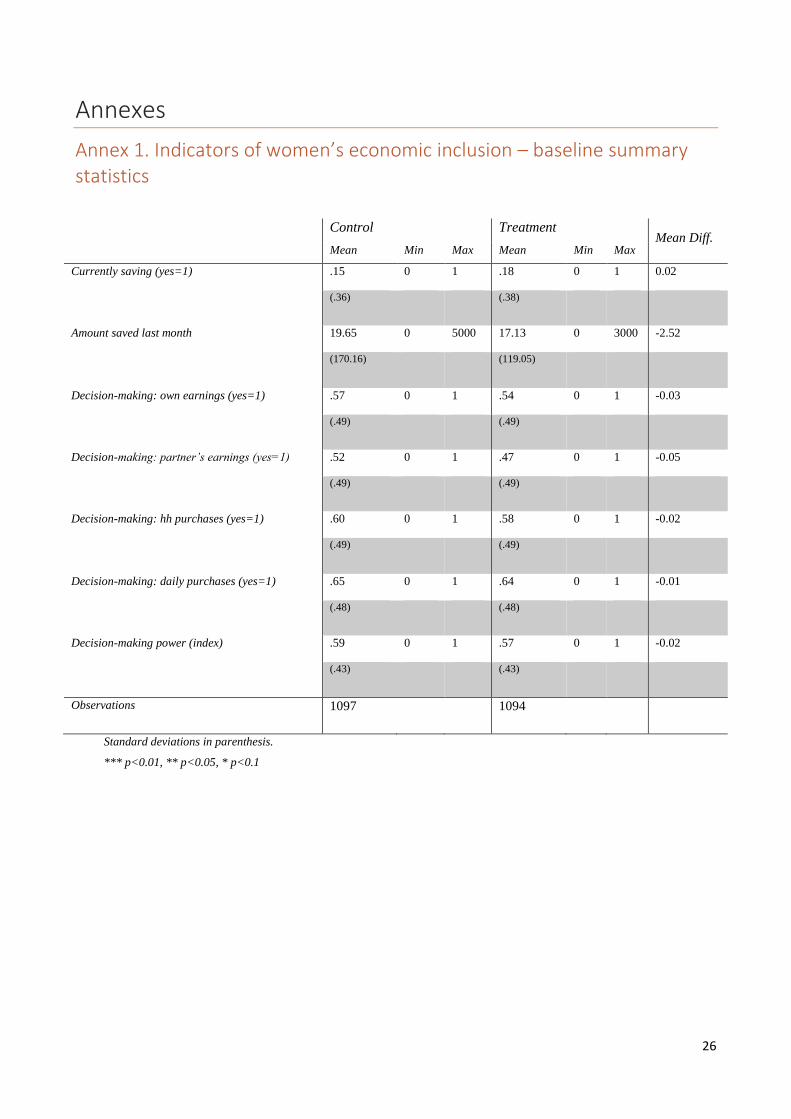
26
Annexes
Annex 1. Indicators of women’s economic inclusion – baseline summary statistics
Control Treatment Mean Diff.
Mean Min Max Mean Min Max
Currently saving (yes=1) .15 0 1 .18 0 1 0.02
(.36) (.38)
Amount saved last month 19.65 0 5000 17.13 0 3000 -2.52
(170.16) (119.05)
Decision-making: own earnings (yes=1) .57 0 1 .54 0 1 -0.03
(.49) (.49)
Decision-making: partner’s earnings (yes=1) .52 0 1 .47 0 1 -0.05
(.49) (.49)
Decision-making: hh purchases (yes=1) .60 0 1 .58 0 1 -0.02
(.49) (.49)
Decision-making: daily purchases (yes=1) .65 0 1 .64 0 1 -0.01
(.48) (.48)
Decision-making power (index) .59 0 1 .57 0 1 -0.02
(.43) (.43)
Observations 1097 1094
Standard deviations in parenthesis.
*** p<0.01, ** p<0.05, * p<0.1
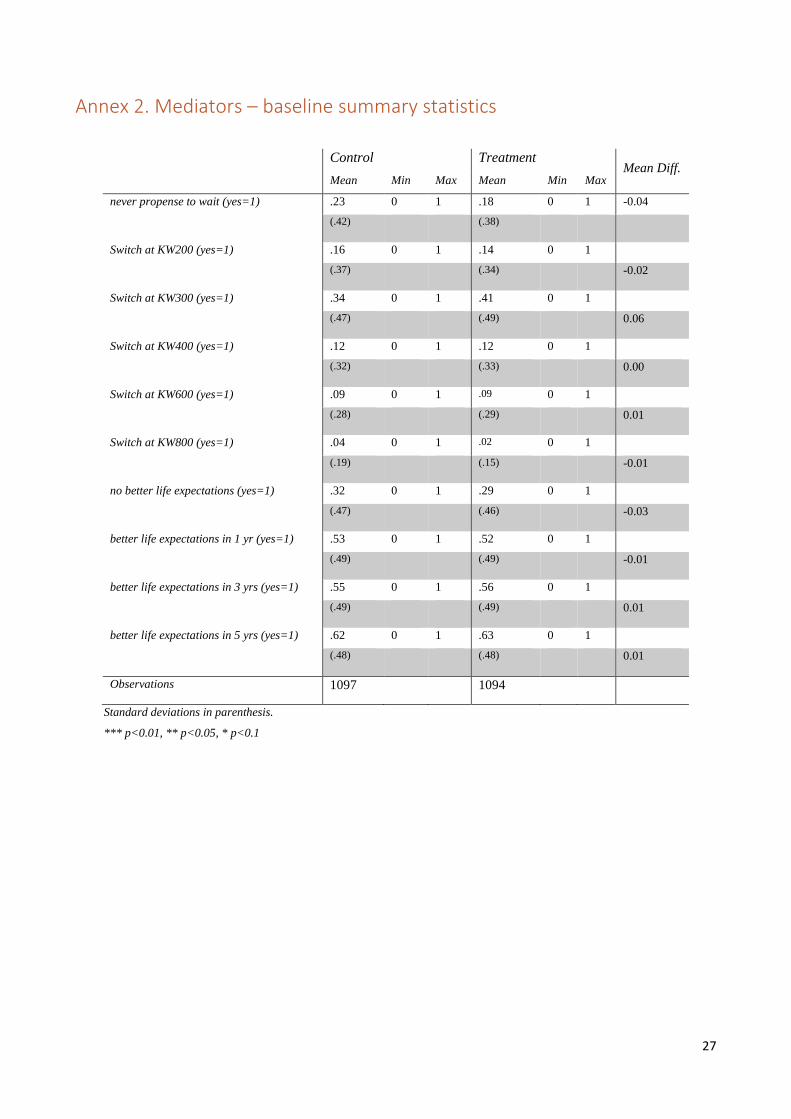
27
Annex 2. Mediators – baseline summary statistics
Control Treatment Mean Diff.
Mean Min Max Mean Min Max
never propense to wait (yes=1) .23 0 1 .18 0 1 -0.04
(.42) (.38)
Switch at KW200 (yes=1) .16 0 1 .14 0 1
(.37) (.34) -0.02
Switch at KW300 (yes=1) .34 0 1 .41 0 1
(.47) (.49) 0.06
Switch at KW400 (yes=1) .12 0 1 .12 0 1
(.32) (.33) 0.00
Switch at KW600 (yes=1) .09 0 1 .09 0 1
(.28) (.29) 0.01
Switch at KW800 (yes=1) .04 0 1 .02 0 1
(.19) (.15) -0.01
no better life expectations (yes=1) .32 0 1 .29 0 1
(.47) (.46) -0.03
better life expectations in 1 yr (yes=1) .53 0 1 .52 0 1
(.49) (.49) -0.01
better life expectations in 3 yrs (yes=1) .55 0 1 .56 0 1
(.49) (.49) 0.01
better life expectations in 5 yrs (yes=1) .62 0 1 .63 0 1
(.48) (.48) 0.01
Observations 1097 1094
Standard deviations in parenthesis.
*** p<0.01, ** p<0.05, * p<0.1
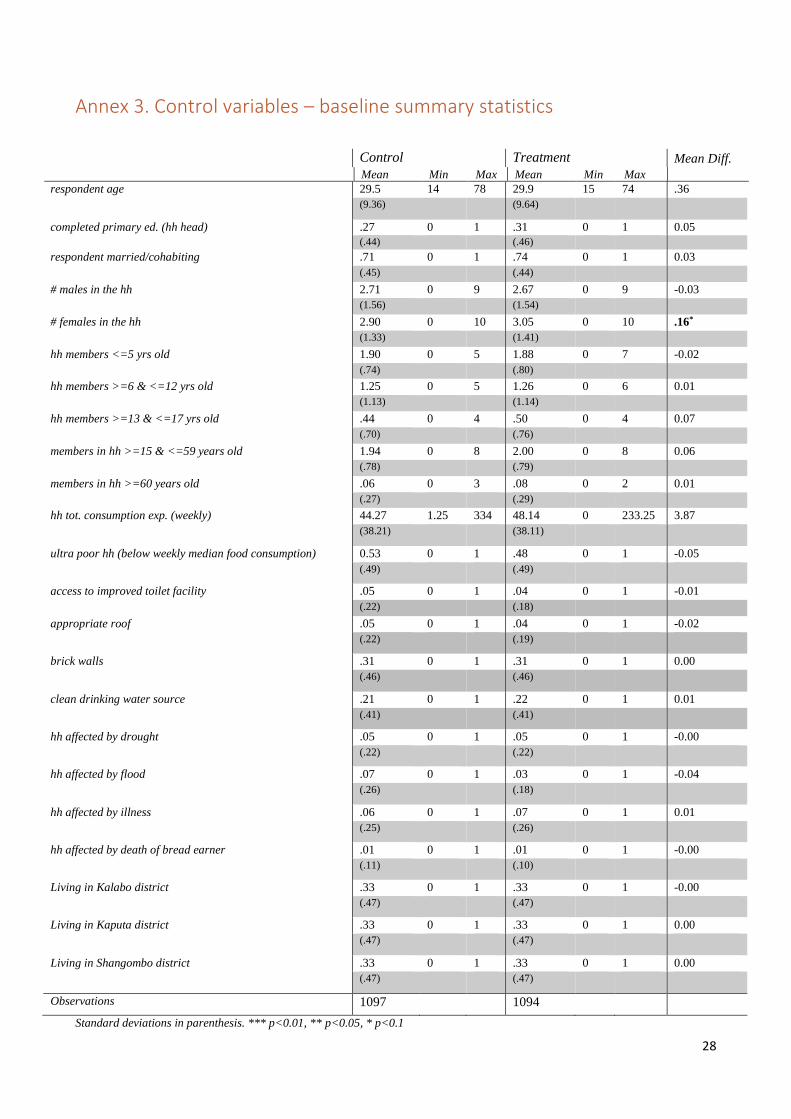
28
Annex 3. Control variables – baseline summary statistics
Control Treatment Mean Diff. Mean Min Max Mean Min Max
respondent age 29.5 14 78 29.9 15 74 .36
(9.36) (9.64)
completed primary ed. (hh head) .27 0 1 .31 0 1 0.05
(.44) (.46)
respondent married/cohabiting .71 0 1 .74 0 1 0.03
(.45) (.44)
# males in the hh 2.71 0 9 2.67 0 9 -0.03
(1.56) (1.54)
# females in the hh 2.90 0 10 3.05 0 10 .16*
(1.33) (1.41)
hh members <=5 yrs old 1.90 0 5 1.88 0 7 -0.02
(.74) (.80)
hh members >=6 & <=12 yrs old 1.25 0 5 1.26 0 6 0.01
(1.13) (1.14)
hh members >=13 & <=17 yrs old .44 0 4 .50 0 4 0.07
(.70) (.76)
members in hh >=15 & <=59 years old 1.94 0 8 2.00 0 8 0.06
(.78) (.79)
members in hh >=60 years old .06 0 3 .08 0 2 0.01
(.27) (.29)
hh tot. consumption exp. (weekly) 44.27 1.25 334 48.14 0 233.25 3.87
(38.21) (38.11)
ultra poor hh (below weekly median food consumption) 0.53 0 1 .48 0 1 -0.05
(.49) (.49)
access to improved toilet facility .05 0 1 .04 0 1 -0.01
(.22) (.18)
appropriate roof .05 0 1 .04 0 1 -0.02
(.22) (.19)
brick walls .31 0 1 .31 0 1 0.00
(.46) (.46)
clean drinking water source .21 0 1 .22 0 1 0.01
(.41) (.41)
hh affected by drought .05 0 1 .05 0 1 -0.00
(.22) (.22)
hh affected by flood .07 0 1 .03 0 1 -0.04
(.26) (.18)
hh affected by illness .06 0 1 .07 0 1 0.01
(.25) (.26)
hh affected by death of bread earner .01 0 1 .01 0 1 -0.00
(.11) (.10)
Living in Kalabo district .33 0 1 .33 0 1 -0.00
(.47) (.47)
Living in Kaputa district .33 0 1 .33 0 1 0.00
(.47) (.47)
Living in Shangombo district .33 0 1 .33 0 1 0.00
(.47) (.47)
Observations 1097 1094
Standard deviations in parenthesis. *** p<0.01, ** p<0.05, * p<0.1

29
Annex 4. Direct impact of zambia child grant on female-leaded non-farm enterprises – non-linear model
NFE
fem. led NFE asset value profit
(1) (2) (3) (4) (5) (6) (7) (8)
Unadj. Adj. Unadj. Adj. Unadj. Adj. Unadj. Adj.
T 0.169*** 0.167*** 0.113** 0.113*** 14.79** 15.17*** 43.40** 42.15**
(0.0438) (0.0360) (0.0371) (0.0307) (4.561) (4.460) (16.07) (13.45)
N 2191 2191 2191 2191 2191 2191 2191 2191
Non-Linear weighted estimations models with robust standard errors clustered at CWAC level in parenthesis. Results report marginal effect. Unadjusted models do not
include control variables, while Adjusted models include control variables such as, information on the household’s head (age, completed primary education, married),
demographic characteristics of the household (n. of male and female members, n. of members per age group), housing conditions (toilet, wall, roof, water), household
consumption and self-assessed poverty, shocks (drought, flood, illness, bread-earner death), district of residence.
+ p < 0.10, * p < 0.05, ** p < 0.01, *** p < 0.001
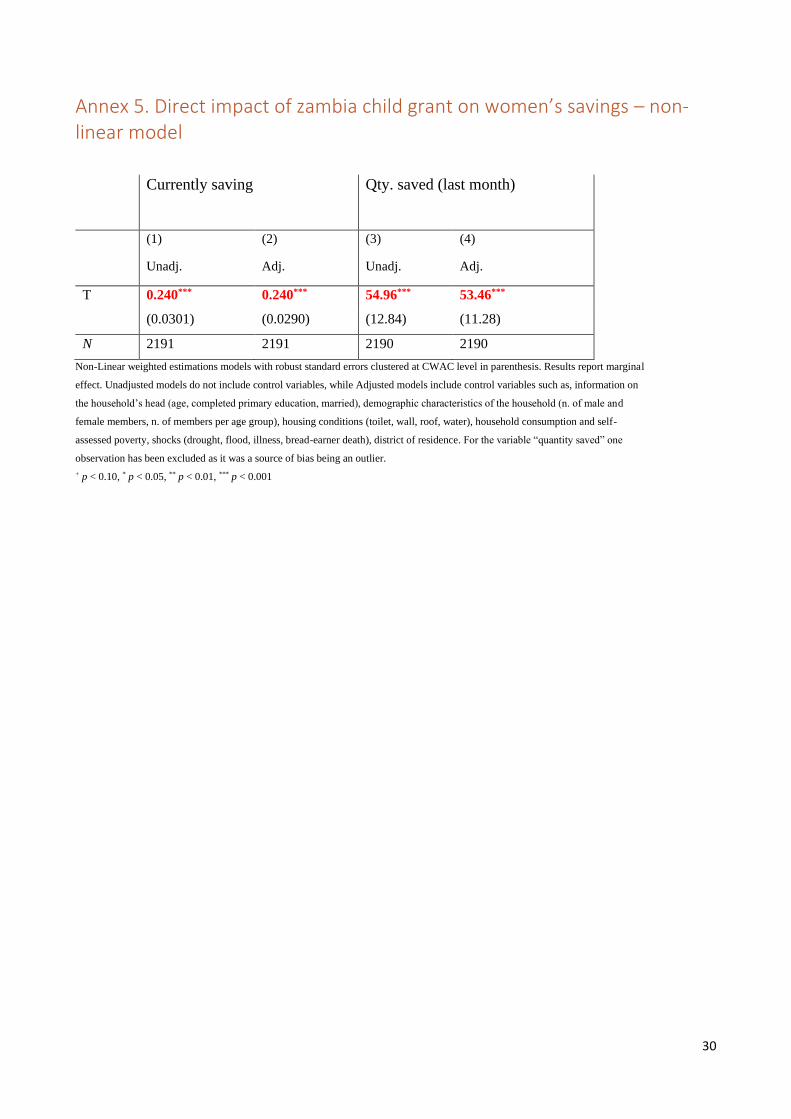
30
Annex 5. Direct impact of zambia child grant on women’s savings – non-linear model
Currently saving
Qty. saved (last month)
(1) (2) (3) (4)
Unadj. Adj. Unadj. Adj.
T 0.240*** 0.240*** 54.96*** 53.46***
(0.0301) (0.0290) (12.84) (11.28)
N 2191 2191 2190 2190
Non-Linear weighted estimations models with robust standard errors clustered at CWAC level in parenthesis. Results report marginal
effect. Unadjusted models do not include control variables, while Adjusted models include control variables such as, information on
the household’s head (age, completed primary education, married), demographic characteristics of the household (n. of male and
female members, n. of members per age group), housing conditions (toilet, wall, roof, water), household consumption and self-
assessed poverty, shocks (drought, flood, illness, bread-earner death), district of residence. For the variable “quantity saved” one
observation has been excluded as it was a source of bias being an outlier.
+ p < 0.10, * p < 0.05, ** p < 0.01, *** p < 0.001
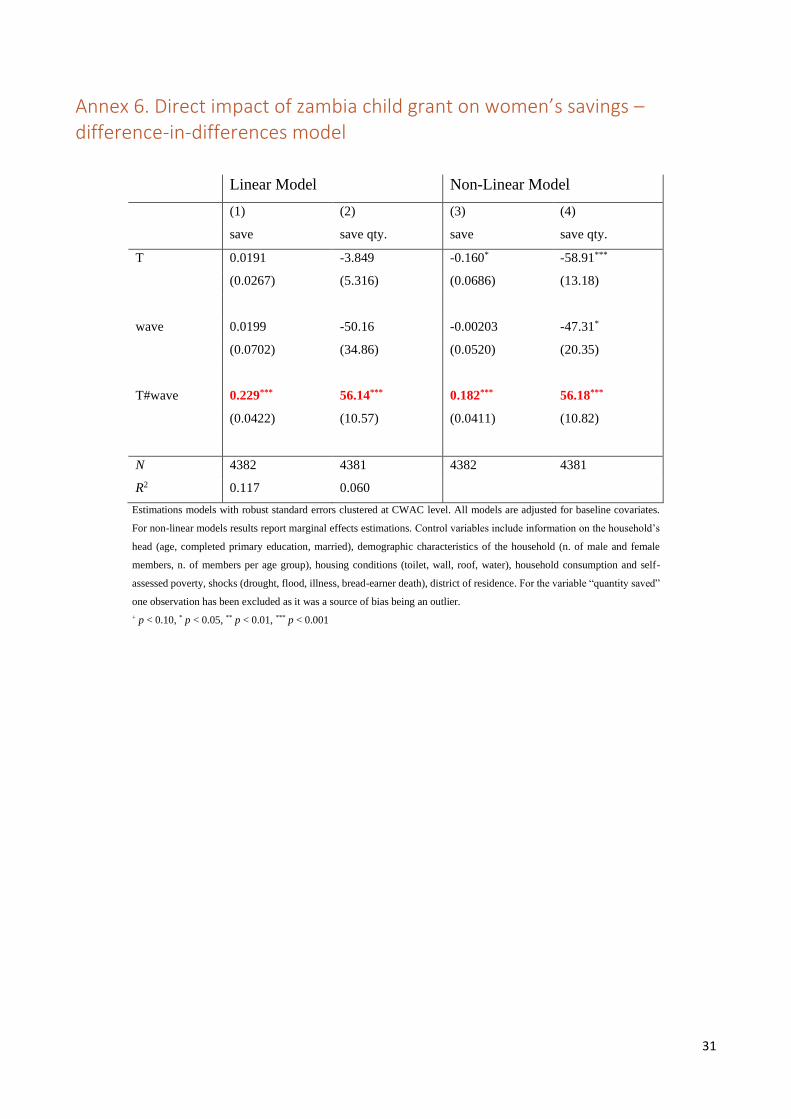
31
Annex 6. Direct impact of zambia child grant on women’s savings – difference-in-differences model
Linear Model Non-Linear Model
(1) (2) (3) (4)
save save qty. save save qty.
T 0.0191 -3.849 -0.160* -58.91***
(0.0267) (5.316) (0.0686) (13.18)
wave 0.0199 -50.16 -0.00203 -47.31*
(0.0702) (34.86) (0.0520) (20.35)
T#wave 0.229*** 56.14*** 0.182*** 56.18***
(0.0422) (10.57) (0.0411) (10.82)
N 4382 4381 4382 4381
R2 0.117 0.060
Estimations models with robust standard errors clustered at CWAC level. All models are adjusted for baseline covariates.
For non-linear models results report marginal effects estimations. Control variables include information on the household’s
head (age, completed primary education, married), demographic characteristics of the household (n. of male and female
members, n. of members per age group), housing conditions (toilet, wall, roof, water), household consumption and self-
assessed poverty, shocks (drought, flood, illness, bread-earner death), district of residence. For the variable “quantity saved”
one observation has been excluded as it was a source of bias being an outlier.
+ p < 0.10, * p < 0.05, ** p < 0.01, *** p < 0.001
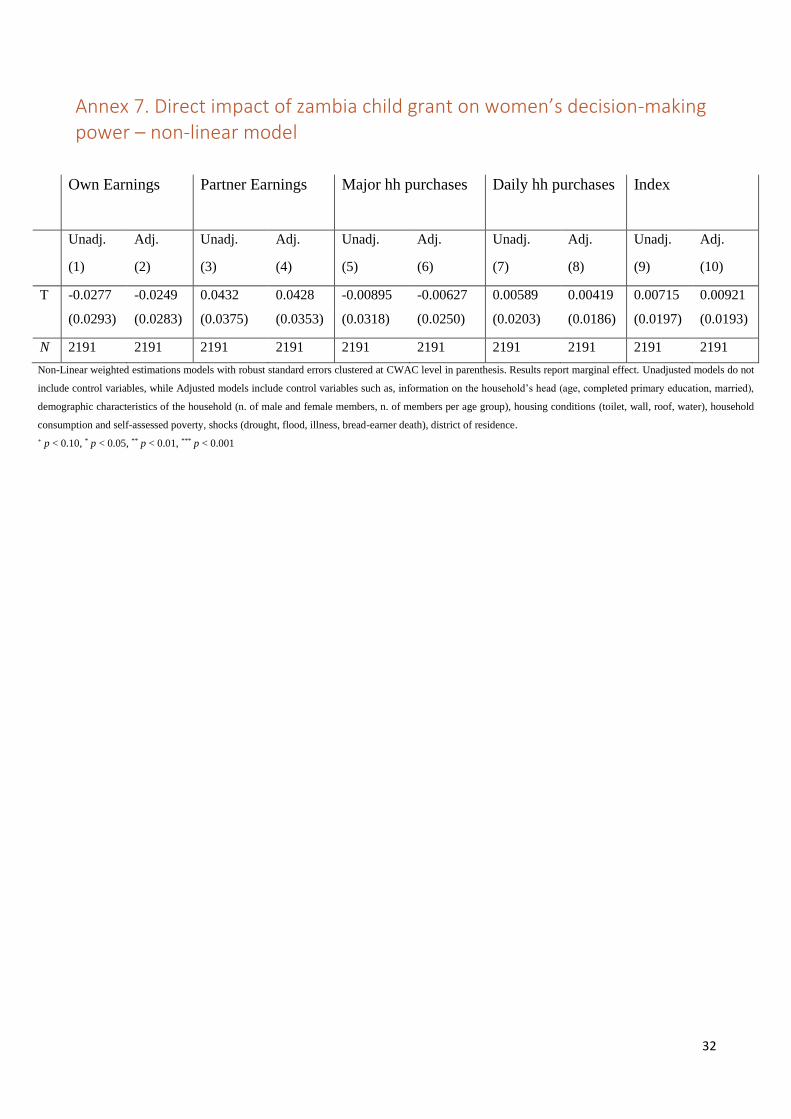
32
Annex 7. Direct impact of zambia child grant on women’s decision-making power – non-linear model
Own Earnings
Partner Earnings Major hh purchases Daily hh purchases Index
Unadj. Adj. Unadj. Adj. Unadj. Adj. Unadj. Adj. Unadj. Adj.
(1) (2) (3) (4) (5) (6) (7) (8) (9) (10)
T -0.0277 -0.0249 0.0432 0.0428 -0.00895 -0.00627 0.00589 0.00419 0.00715 0.00921
(0.0293) (0.0283) (0.0375) (0.0353) (0.0318) (0.0250) (0.0203) (0.0186) (0.0197) (0.0193)
N 2191 2191 2191 2191 2191 2191 2191 2191 2191 2191
Non-Linear weighted estimations models with robust standard errors clustered at CWAC level in parenthesis. Results report marginal effect. Unadjusted models do not
include control variables, while Adjusted models include control variables such as, information on the household’s head (age, completed primary education, married),
demographic characteristics of the household (n. of male and female members, n. of members per age group), housing conditions (toilet, wall, roof, water), household
consumption and self-assessed poverty, shocks (drought, flood, illness, bread-earner death), district of residence.
+ p < 0.10, * p < 0.05, ** p < 0.01, *** p < 0.001
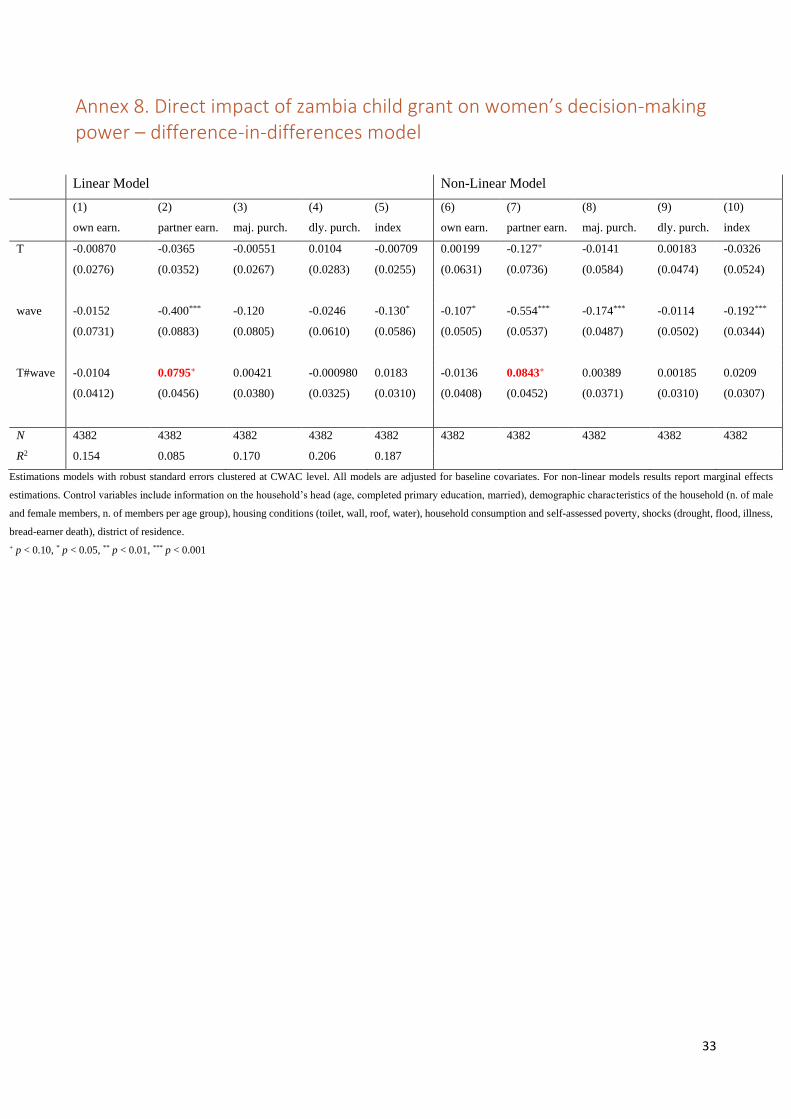
33
Annex 8. Direct impact of zambia child grant on women’s decision-making power – difference-in-differences model
Linear Model Non-Linear Model
(1) (2) (3) (4) (5) (6) (7) (8) (9) (10)
own earn. partner earn. maj. purch. dly. purch. index own earn. partner earn. maj. purch. dly. purch. index
T -0.00870 -0.0365 -0.00551 0.0104 -0.00709 0.00199 -0.127+ -0.0141 0.00183 -0.0326
(0.0276) (0.0352) (0.0267) (0.0283) (0.0255) (0.0631) (0.0736) (0.0584) (0.0474) (0.0524)
wave -0.0152 -0.400*** -0.120 -0.0246 -0.130* -0.107* -0.554*** -0.174*** -0.0114 -0.192***
(0.0731) (0.0883) (0.0805) (0.0610) (0.0586) (0.0505) (0.0537) (0.0487) (0.0502) (0.0344)
T#wave -0.0104 0.0795+ 0.00421 -0.000980 0.0183 -0.0136 0.0843+ 0.00389 0.00185 0.0209
(0.0412) (0.0456) (0.0380) (0.0325) (0.0310) (0.0408) (0.0452) (0.0371) (0.0310) (0.0307)
N 4382 4382 4382 4382 4382 4382 4382 4382 4382 4382
R2 0.154 0.085 0.170 0.206 0.187
Estimations models with robust standard errors clustered at CWAC level. All models are adjusted for baseline covariates. For non-linear models results report marginal effects
estimations. Control variables include information on the household’s head (age, completed primary education, married), demographic characteristics of the household (n. of male
and female members, n. of members per age group), housing conditions (toilet, wall, roof, water), household consumption and self-assessed poverty, shocks (drought, flood, illness,
bread-earner death), district of residence.
+ p < 0.10, * p < 0.05, ** p < 0.01, *** p < 0.001
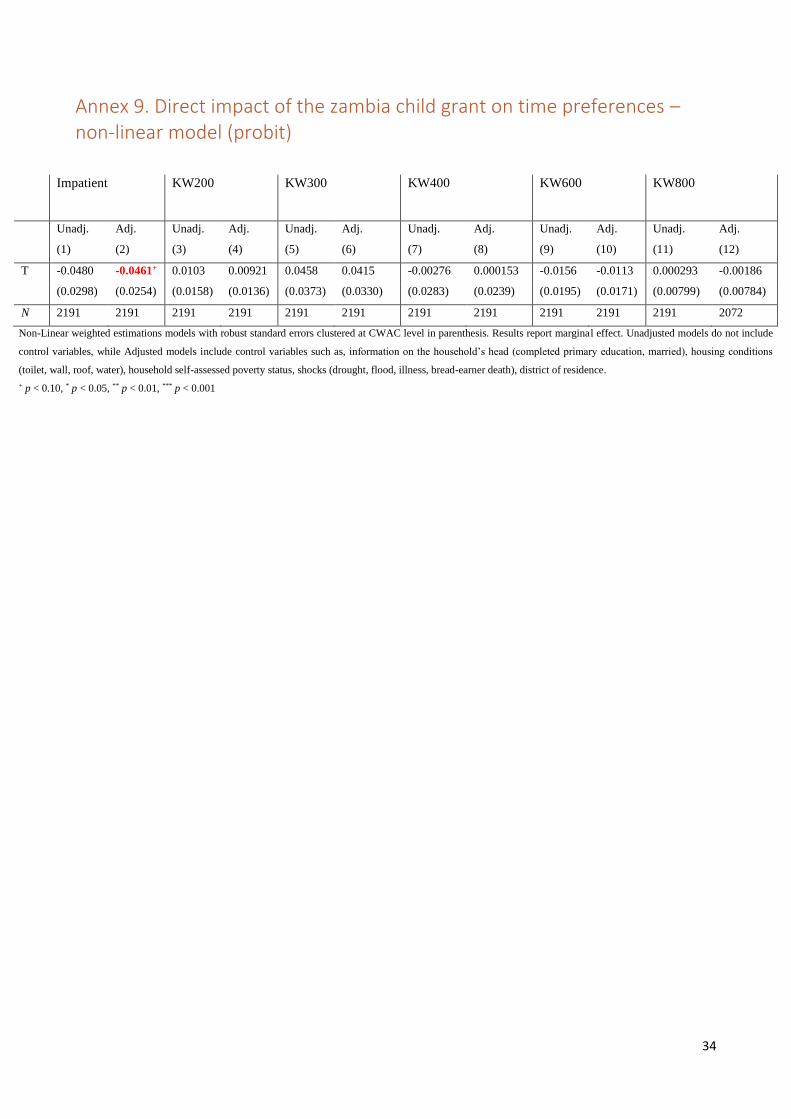
34
Annex 9. Direct impact of the zambia child grant on time preferences – non-linear model (probit)
Impatient
KW200 KW300 KW400 KW600 KW800
Unadj. Adj. Unadj. Adj. Unadj. Adj. Unadj. Adj. Unadj. Adj. Unadj. Adj.
(1) (2) (3) (4) (5) (6) (7) (8) (9) (10) (11) (12)
T -0.0480 -0.0461+ 0.0103 0.00921 0.0458 0.0415 -0.00276 0.000153 -0.0156 -0.0113 0.000293 -0.00186
(0.0298) (0.0254) (0.0158) (0.0136) (0.0373) (0.0330) (0.0283) (0.0239) (0.0195) (0.0171) (0.00799) (0.00784)
N 2191 2191 2191 2191 2191 2191 2191 2191 2191 2191 2191 2072
Non-Linear weighted estimations models with robust standard errors clustered at CWAC level in parenthesis. Results report marginal effect. Unadjusted models do not include
control variables, while Adjusted models include control variables such as, information on the household’s head (completed primary education, married), housing conditions
(toilet, wall, roof, water), household self-assessed poverty status, shocks (drought, flood, illness, bread-earner death), district of residence.
+ p < 0.10, * p < 0.05, ** p < 0.01, *** p < 0.001
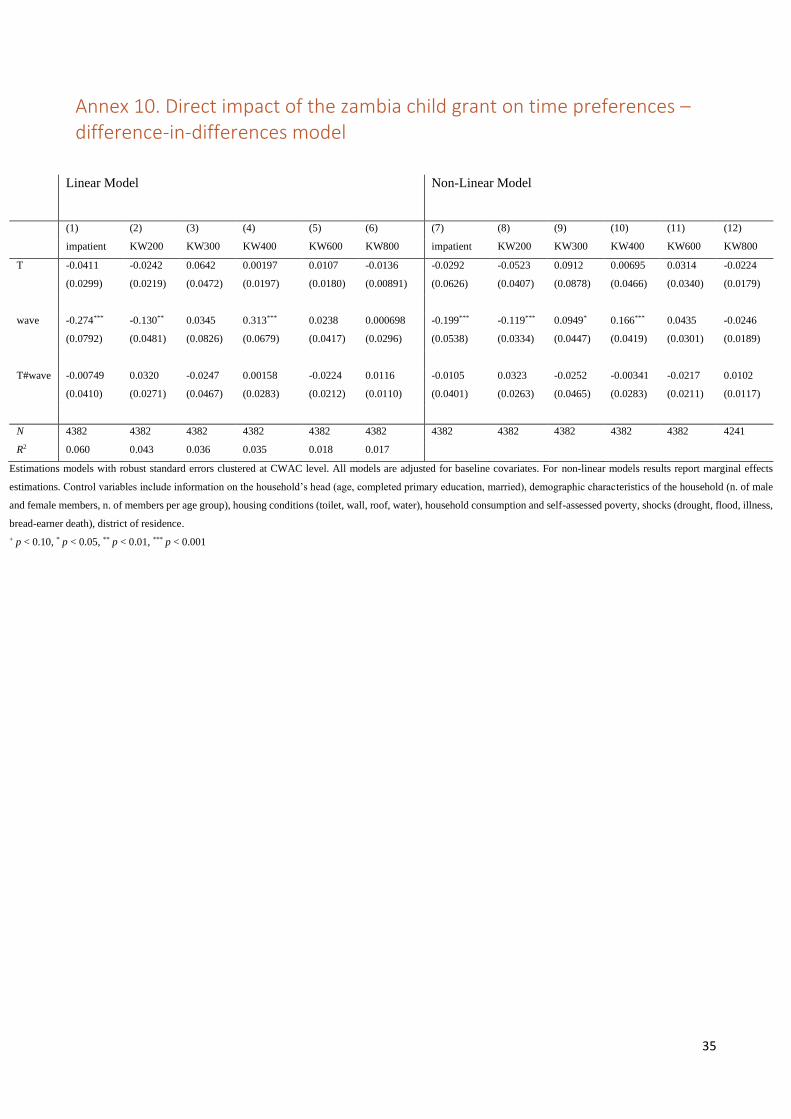
35
Annex 10. Direct impact of the zambia child grant on time preferences – difference-in-differences model
Linear Model
Non-Linear Model
(1) (2) (3) (4) (5) (6) (7) (8) (9) (10) (11) (12)
impatient KW200 KW300 KW400 KW600 KW800 impatient KW200 KW300 KW400 KW600 KW800
T -0.0411 -0.0242 0.0642 0.00197 0.0107 -0.0136 -0.0292 -0.0523 0.0912 0.00695 0.0314 -0.0224
(0.0299) (0.0219) (0.0472) (0.0197) (0.0180) (0.00891) (0.0626) (0.0407) (0.0878) (0.0466) (0.0340) (0.0179)
wave -0.274*** -0.130** 0.0345 0.313*** 0.0238 0.000698 -0.199*** -0.119*** 0.0949* 0.166*** 0.0435 -0.0246
(0.0792) (0.0481) (0.0826) (0.0679) (0.0417) (0.0296) (0.0538) (0.0334) (0.0447) (0.0419) (0.0301) (0.0189)
T#wave -0.00749 0.0320 -0.0247 0.00158 -0.0224 0.0116 -0.0105 0.0323 -0.0252 -0.00341 -0.0217 0.0102
(0.0410) (0.0271) (0.0467) (0.0283) (0.0212) (0.0110) (0.0401) (0.0263) (0.0465) (0.0283) (0.0211) (0.0117)
N 4382 4382 4382 4382 4382 4382 4382 4382 4382 4382 4382 4241
R2 0.060 0.043 0.036 0.035 0.018 0.017
Estimations models with robust standard errors clustered at CWAC level. All models are adjusted for baseline covariates. For non-linear models results report marginal effects
estimations. Control variables include information on the household’s head (age, completed primary education, married), demographic characteristics of the household (n. of male
and female members, n. of members per age group), housing conditions (toilet, wall, roof, water), household consumption and self-assessed poverty, shocks (drought, flood, illness,
bread-earner death), district of residence.
+ p < 0.10, * p < 0.05, ** p < 0.01, *** p < 0.001

36
Annex 11. Direct impact of zambia child grant on women’s future expectations (only consistent respondents) – linear model
Pessimist
1 year 3 years 5 years
Unadj. Adj. Unadj. Adj. Unadj. Adj. Unadj. Adj.
(1) (2) (3) (4) (5) (6) (7) (8)
T -0.0875*** -0.0872*** 0.103** 0.100** 0.0716** 0.0719** 0.0972*** 0.0961***
(0.0185) (0.0176) (0.0338) (0.0320
)
(0.0267) (0.0240) (0.0210) (0.0199)
N 2174 2174 2174 2174 2174 2174 2174 2174
R2 0.025 0.044 0.013 0.031 0.008 0.038 0.021 0.041
Linear weighted estimations models with robust standard errors clustered at CWAC level in parenthesis. Unadjusted models do not include control
variables, while Adjusted models include control variables such as, information on the household’s head (age, completed primary education,
married), demographic characteristics of the household (n. of male and female members, n. of members per age group), housing conditions (toilet,
wall, roof, water), household consumption and self-assessed poverty, shocks (drought, flood, illness, bread-earner death), district of residence.
+ p < 0.10, * p < 0.05, ** p < 0.01, *** p < 0.001
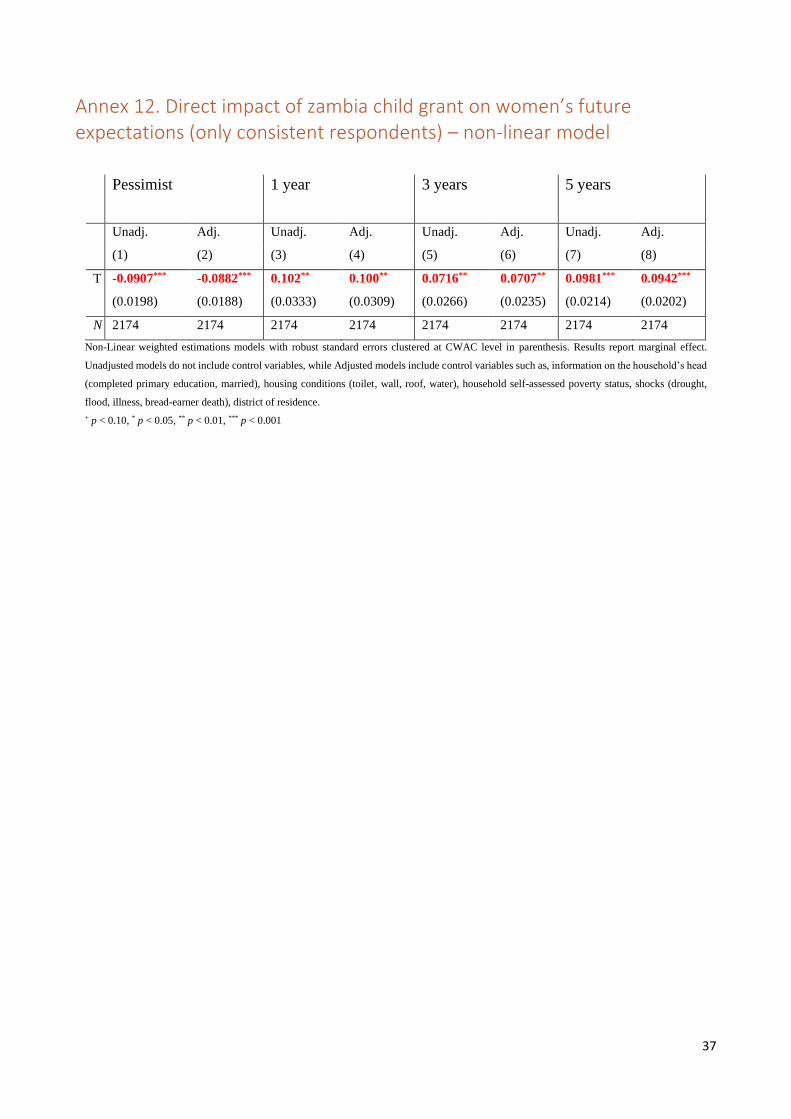
37
Annex 12. Direct impact of zambia child grant on women’s future expectations (only consistent respondents) – non-linear model
Pessimist
1 year 3 years 5 years
Unadj. Adj. Unadj. Adj. Unadj. Adj. Unadj. Adj.
(1) (2) (3) (4) (5) (6) (7) (8)
T -0.0907*** -0.0882*** 0.102** 0.100** 0.0716** 0.0707** 0.0981*** 0.0942***
(0.0198) (0.0188) (0.0333) (0.0309) (0.0266) (0.0235) (0.0214) (0.0202)
N 2174 2174 2174 2174 2174 2174 2174 2174
Non-Linear weighted estimations models with robust standard errors clustered at CWAC level in parenthesis. Results report marginal effect.
Unadjusted models do not include control variables, while Adjusted models include control variables such as, information on the household’s head
(completed primary education, married), housing conditions (toilet, wall, roof, water), household self-assessed poverty status, shocks (drought,
flood, illness, bread-earner death), district of residence.
+ p < 0.10, * p < 0.05, ** p < 0.01, *** p < 0.001
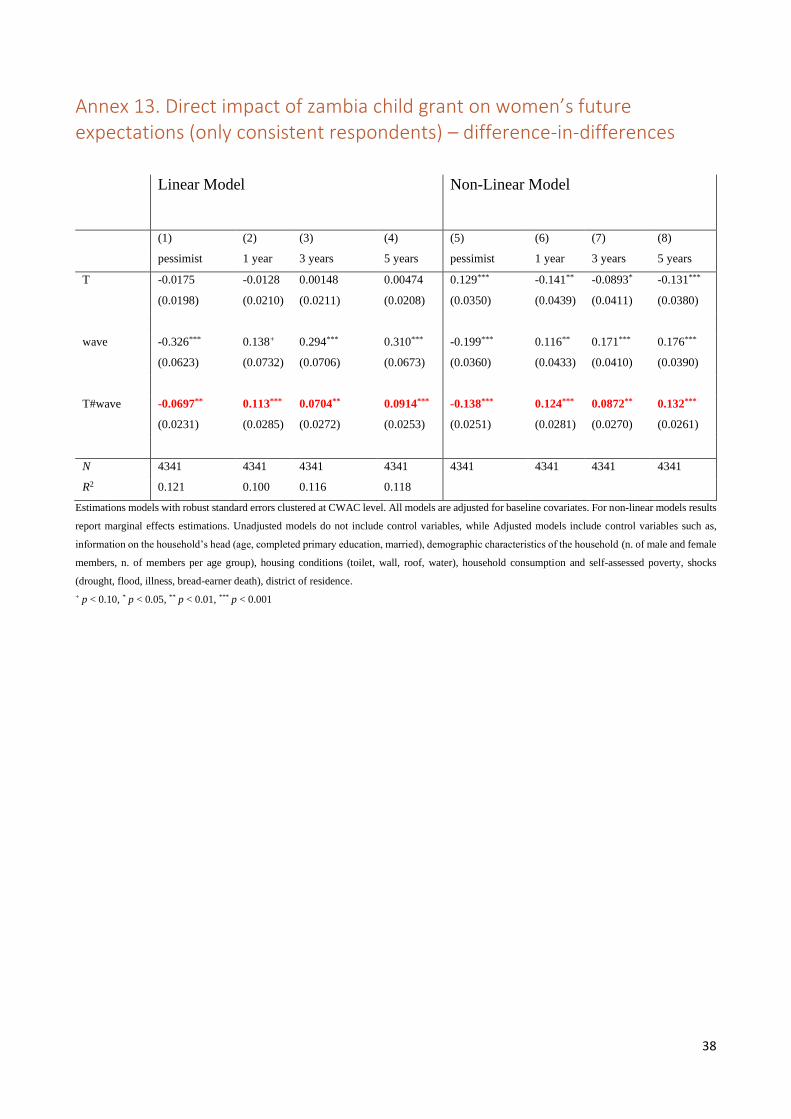
38
Annex 13. Direct impact of zambia child grant on women’s future expectations (only consistent respondents) – difference-in-differences
Linear Model
Non-Linear Model
(1) (2) (3) (4) (5) (6) (7) (8)
pessimist 1 year 3 years 5 years pessimist 1 year 3 years 5 years
T -0.0175 -0.0128 0.00148 0.00474 0.129*** -0.141** -0.0893* -0.131***
(0.0198) (0.0210) (0.0211) (0.0208) (0.0350) (0.0439) (0.0411) (0.0380)
wave -0.326*** 0.138+ 0.294*** 0.310*** -0.199*** 0.116** 0.171*** 0.176***
(0.0623) (0.0732) (0.0706) (0.0673) (0.0360) (0.0433) (0.0410) (0.0390)
T#wave -0.0697** 0.113*** 0.0704** 0.0914*** -0.138*** 0.124*** 0.0872** 0.132***
(0.0231) (0.0285) (0.0272) (0.0253) (0.0251) (0.0281) (0.0270) (0.0261)
N 4341 4341 4341 4341 4341 4341 4341 4341
R2 0.121 0.100 0.116 0.118
Estimations models with robust standard errors clustered at CWAC level. All models are adjusted for baseline covariates. For non-linear models results
report marginal effects estimations. Unadjusted models do not include control variables, while Adjusted models include control variables such as,
information on the household’s head (age, completed primary education, married), demographic characteristics of the household (n. of male and female
members, n. of members per age group), housing conditions (toilet, wall, roof, water), household consumption and self-assessed poverty, shocks
(drought, flood, illness, bread-earner death), district of residence.
+ p < 0.10, * p < 0.05, ** p < 0.01, *** p < 0.001
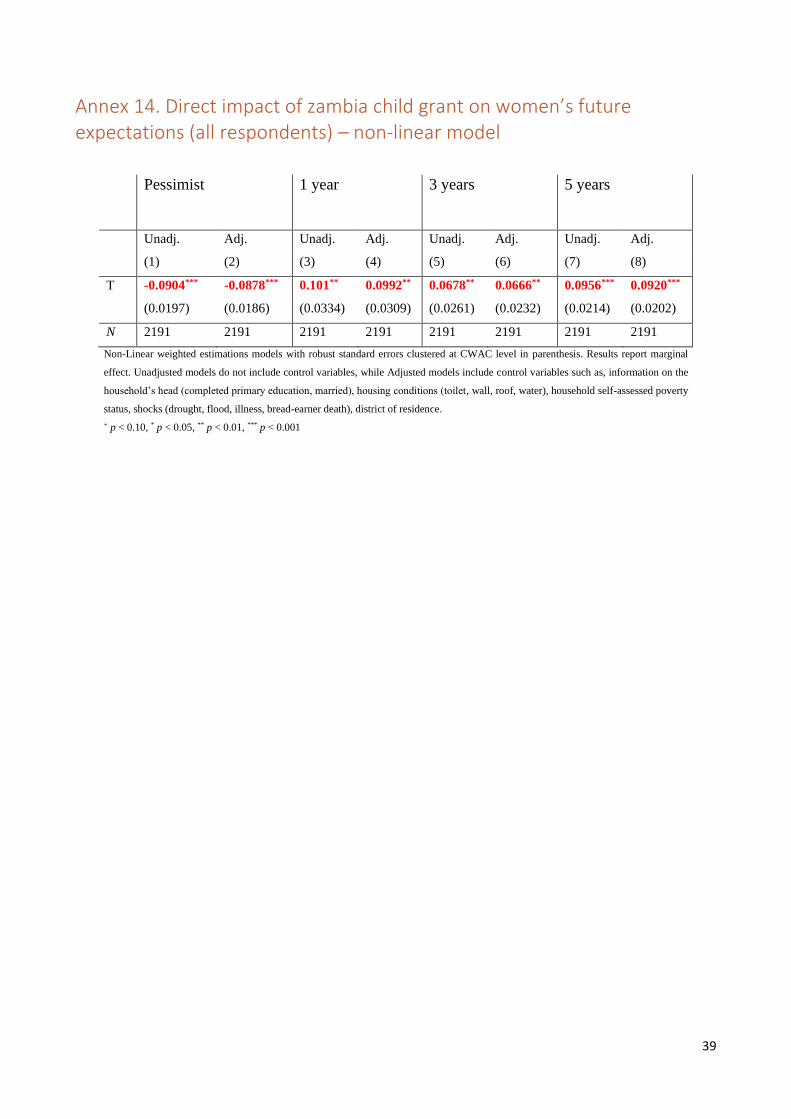
39
Annex 14. Direct impact of zambia child grant on women’s future expectations (all respondents) – non-linear model
Pessimist
1 year 3 years 5 years
Unadj. Adj. Unadj. Adj. Unadj. Adj. Unadj. Adj.
(1) (2) (3) (4) (5) (6) (7) (8)
T -0.0904*** -0.0878*** 0.101** 0.0992** 0.0678** 0.0666** 0.0956*** 0.0920***
(0.0197) (0.0186) (0.0334) (0.0309) (0.0261) (0.0232) (0.0214) (0.0202)
N 2191 2191 2191 2191 2191 2191 2191 2191
Non-Linear weighted estimations models with robust standard errors clustered at CWAC level in parenthesis. Results report marginal
effect. Unadjusted models do not include control variables, while Adjusted models include control variables such as, information on the
household’s head (completed primary education, married), housing conditions (toilet, wall, roof, water), household self-assessed poverty
status, shocks (drought, flood, illness, bread-earner death), district of residence.
+ p < 0.10, * p < 0.05, ** p < 0.01, *** p < 0.001
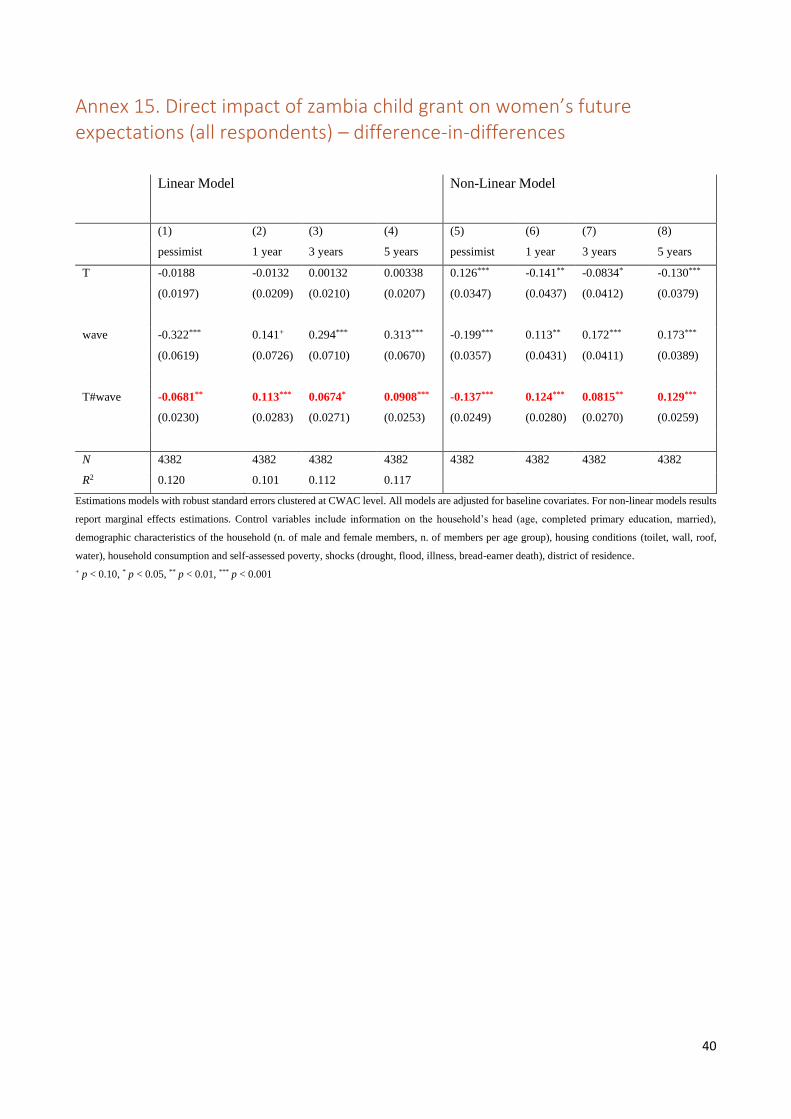
40
Annex 15. Direct impact of zambia child grant on women’s future expectations (all respondents) – difference-in-differences
Linear Model
Non-Linear Model
(1) (2) (3) (4) (5) (6) (7) (8)
pessimist 1 year 3 years 5 years pessimist 1 year 3 years 5 years
T -0.0188 -0.0132 0.00132 0.00338 0.126*** -0.141** -0.0834* -0.130***
(0.0197) (0.0209) (0.0210) (0.0207) (0.0347) (0.0437) (0.0412) (0.0379)
wave -0.322*** 0.141+ 0.294*** 0.313*** -0.199*** 0.113** 0.172*** 0.173***
(0.0619) (0.0726) (0.0710) (0.0670) (0.0357) (0.0431) (0.0411) (0.0389)
T#wave -0.0681** 0.113*** 0.0674* 0.0908*** -0.137*** 0.124*** 0.0815** 0.129***
(0.0230) (0.0283) (0.0271) (0.0253) (0.0249) (0.0280) (0.0270) (0.0259)
N 4382 4382 4382 4382 4382 4382 4382 4382
R2 0.120 0.101 0.112 0.117
Estimations models with robust standard errors clustered at CWAC level. All models are adjusted for baseline covariates. For non-linear models results
report marginal effects estimations. Control variables include information on the household’s head (age, completed primary education, married),
demographic characteristics of the household (n. of male and female members, n. of members per age group), housing conditions (toilet, wall, roof,
water), household consumption and self-assessed poverty, shocks (drought, flood, illness, bread-earner death), district of residence.
+ p < 0.10, * p < 0.05, ** p < 0.01, *** p < 0.001
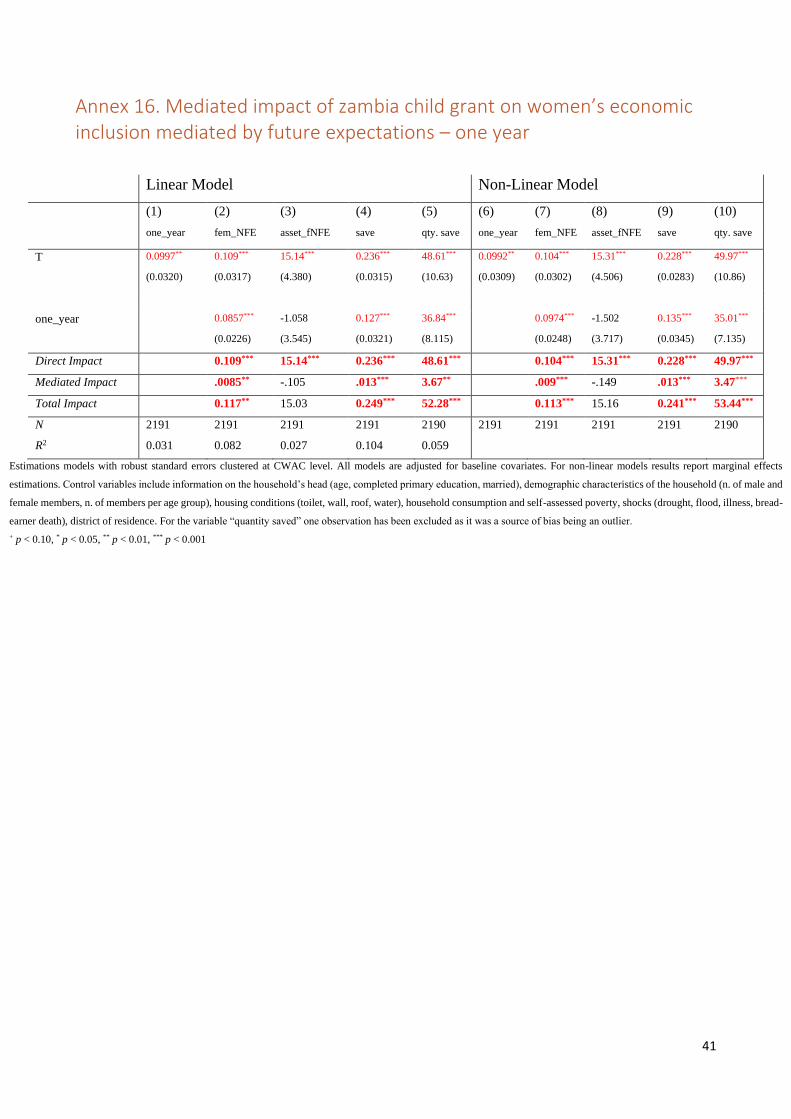
41
Annex 16. Mediated impact of zambia child grant on women’s economic inclusion mediated by future expectations – one year
Linear Model Non-Linear Model
(1) (2) (3) (4) (5) (6) (7) (8) (9) (10)
one_year fem_NFE asset_fNFE save qty. save one_year fem_NFE asset_fNFE save qty. save
T 0.0997** 0.109*** 15.14*** 0.236*** 48.61*** 0.0992** 0.104*** 15.31*** 0.228*** 49.97***
(0.0320) (0.0317) (4.380) (0.0315) (10.63) (0.0309) (0.0302) (4.506) (0.0283) (10.86)
one_year 0.0857*** -1.058 0.127*** 36.84*** 0.0974*** -1.502 0.135*** 35.01***
(0.0226) (3.545) (0.0321) (8.115) (0.0248) (3.717) (0.0345) (7.135)
Direct Impact 0.109*** 15.14*** 0.236*** 48.61*** 0.104*** 15.31*** 0.228*** 49.97***
Mediated Impact .0085** -.105 .013*** 3.67** .009*** -.149 .013*** 3.47***
Total Impact 0.117** 15.03 0.249*** 52.28*** 0.113*** 15.16 0.241*** 53.44***
N 2191 2191 2191 2191 2190 2191 2191 2191 2191 2190
R2 0.031 0.082 0.027 0.104 0.059
Estimations models with robust standard errors clustered at CWAC level. All models are adjusted for baseline covariates. For non-linear models results report marginal effects
estimations. Control variables include information on the household’s head (age, completed primary education, married), demographic characteristics of the household (n. of male and
female members, n. of members per age group), housing conditions (toilet, wall, roof, water), household consumption and self-assessed poverty, shocks (drought, flood, illness, bread-
earner death), district of residence. For the variable “quantity saved” one observation has been excluded as it was a source of bias being an outlier.
+ p < 0.10, * p < 0.05, ** p < 0.01, *** p < 0.001
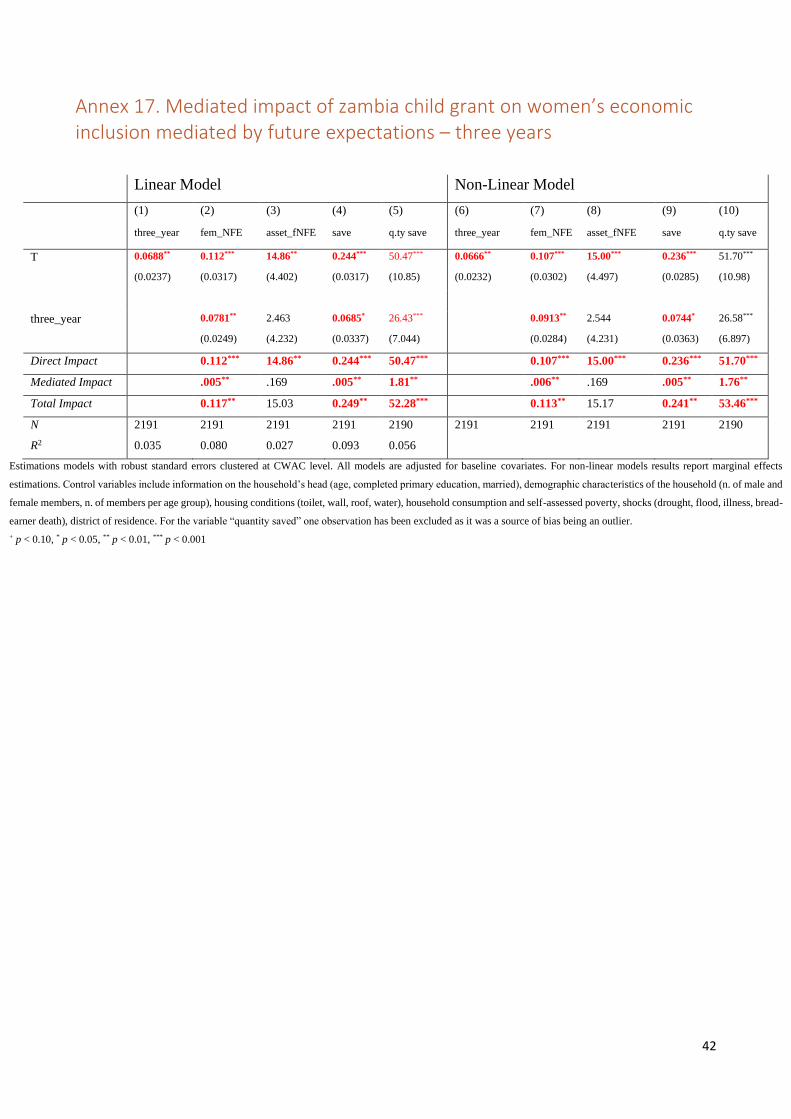
42
Annex 17. Mediated impact of zambia child grant on women’s economic inclusion mediated by future expectations – three years
Linear Model Non-Linear Model
(1) (2) (3) (4) (5) (6) (7) (8) (9) (10)
three_year fem_NFE asset_fNFE save q.ty save three_year fem_NFE asset_fNFE save q.ty save
T 0.0688** 0.112*** 14.86** 0.244*** 50.47*** 0.0666** 0.107*** 15.00*** 0.236*** 51.70***
(0.0237) (0.0317) (4.402) (0.0317) (10.85) (0.0232) (0.0302) (4.497) (0.0285) (10.98)
three_year 0.0781** 2.463 0.0685* 26.43*** 0.0913** 2.544 0.0744* 26.58***
(0.0249) (4.232) (0.0337) (7.044) (0.0284) (4.231) (0.0363) (6.897)
Direct Impact 0.112*** 14.86** 0.244*** 50.47*** 0.107*** 15.00*** 0.236*** 51.70***
Mediated Impact .005** .169 .005** 1.81** .006** .169 .005** 1.76**
Total Impact 0.117** 15.03 0.249** 52.28*** 0.113** 15.17 0.241** 53.46***
N 2191 2191 2191 2191 2190 2191 2191 2191 2191 2190
R2 0.035 0.080 0.027 0.093 0.056
Estimations models with robust standard errors clustered at CWAC level. All models are adjusted for baseline covariates. For non-linear models results report marginal effects
estimations. Control variables include information on the household’s head (age, completed primary education, married), demographic characteristics of the household (n. of male and
female members, n. of members per age group), housing conditions (toilet, wall, roof, water), household consumption and self-assessed poverty, shocks (drought, flood, illness, bread-
earner death), district of residence. For the variable “quantity saved” one observation has been excluded as it was a source of bias being an outlier.
+ p < 0.10, * p < 0.05, ** p < 0.01, *** p < 0.001

43
Annex 18. Mediated impact of zambia child grant on women’s economic inclusion mediated by future expectations – five years
Linear Model Non-Linear Model
(1) (2) (3) (4) (5) (6) (7) (8) (9) (10)
five_year fem_NFE asset_fNFE save qty. save five_year fem_NFE asset_fNFE save qty. save
T 0.0942*** 0.114*** 14.96** 0.238*** 50.23*** 0.0920*** 0.109*** 15.10*** 0.230*** 51.46***
(0.0198) (0.0320) (4.455) (0.0316) (11.00) (0.0202) (0.0306) (4.566) (0.0283) (11.11)
five_year 0.0358 0.700 0.110*** 21.86** 0.0462 0.685 0.124*** 21.74**
(0.0294) (5.484) (0.0296) (6.557) (0.0333) (5.463) (0.0354) (6.661)
Direct Impact 0.114*** 14.96** 0.238*** 50.23*** 0.109*** 15.10*** 0.230*** 51.46***
Mediated Impact .003+ .065 .01*** 2.05*** .004+ .063 .011** 1.99***
Total Impact 0.117*** 15.02 0.248*** 52.28*** 0.113*** 15.16 0.241*** 53.46***
N 2191 2191 2191 2191 2190 2191 2191 2191 2191 2190
R2 0.041 0.075 0.026 0.096 0.056
Estimations models with robust standard errors clustered at CWAC level. All models are adjusted for baseline covariates. For non-linear models results report marginal effects
estimations. Control variables include information on the household’s head (age, completed primary education, married), demographic characteristics of the household (n. of male and
female members, n. of members per age group), housing conditions (toilet, wall, roof, water), household consumption and self-assessed poverty, shocks (drought, flood, illness, bread-
earner death), district of residence. For the variable “quantity saved” one observation has been excluded as it was a source of bias being an outlier.
+ p < 0.10, * p < 0.05, ** p < 0.01, *** p < 0.001
44
References Alesina, A., Giuliano, P., Nunn, N. 2013. On the Origins of Gender Roles: Women and the Plough. The Quarterly Journal
of Economics, vol. 128(2). 469-530 pp. (also available at https://doi.org/10.1093/qje/qjt005).
Ambler, K., de Brauw, A. and Godlonton, S. 2020. Cash Transfers and Management Advice for Agriculture: Evidence from
Senegal. The World Bank Economic Review, 34:3. 597-617 pp. (also available at
https://doi.org/10.1093/wber/lhz005).
American Institute for Research (AIR). 2013. Zambia’s Child Grant Program: 24-month impact report. Washington, DC:
Seidenfeld, D.; Handa, H.; Davis, B. and Tembo, G. (also available at:
https://assets.publishing.service.gov.uk/government/uploads/system/uploads/attachment_data/file/304213/Za
mbia-Child-Grant-Prog-24-Month-Impact-Report1.pdf)
Anand, P., Lea, S. 2011. The psychology and behavioural economics of poverty. Journal of Economic Psychology, vol. 32
(2), 2011. 284-293 pp. (also available at: https://doi.org/10.1016/j.joep.2010.11.004).
Andersen, S., Harrison, G.W., Lau, M.I. and Rutstrom, E.E. 2006. Elicitation using multiple price list formats. Experimental
Economics, vol. 9. 383-405 pp. (also available at: https://doi.org/10.1007%2Fs10683-006-7055-6).
Anderson, M. L. 2008. Multiple Inference and Gender Differences in the Effects of Early Interventions: A Reevaluation of
the Abecedarian, Perry Preschool, and Early Training Projects. Journal of the American Statistical Association, vol.
103, no. 484. 1481-1495 pp. (also available at: https://doi.org/10.1198/016214508000000841).
Appadurai, A. 2004. The capacity to aspire, in V. Rao and M. Walton (eds.) Culture and Public Action. The International
Bank for reconstruction and Development. Washington, DC: The World Bank. 59-84. pp.
Balakrishnan, U., Haushofer, J., Jakiela, P. 2020. How soon is now? Evidence of present bias from convex time budget
experiments. Experimental Economics, 23(2). 294-321 pp. (also available at: https://doi.org/10.1007/s10683-019-
09617-y).
Balboni, C.; Bandiera, O.; Burgess, R.; Ghatak, M. and Heil, A. 2020. Why Do People Stay Poor? STICERD—Economic
Organisation and Public Policy Discussion Paper no. 067. Suntory and Toyota International Centres for Economics
and Related Disciplines, LSE. (also available at: Why Do People Stay Poor? (repec.org)).
Banerjee, A.V.; Duflo, E.; Raghabendra, C. and Shapiro, J. 2011. Targeting the Hard-Core Poor: An Impact Assessment.
Jameel Poverty Action Lab Working Paper.
Banerjee, A., Duflo, E., Goldberg, N., Karlan, D., Osei, R., Parienté, W., Shapiro, J., Thuybaert, B., Udry C. 2015. A
multifaceted program causes lasting progress for the very poor: Evidence from six countries. Science, 348 (6236).
(also available at: https//doi.org/1721.1/97047).
45
Baron, R.M. and Kenny, D.A. 1986. The moderator-mediator variable distinction in social psychological research:
Conceptual, strategic and statistical consideration. Journal of Personality and Social Psychology, 5. 1173-1182 pp.
(also available at: https//doi.org/10.1037//0022-3514.51.6.1173).
Barrett, C.B; and Carter, M. R. 2013. The Economics of Poverty Traps and Peristent Poverty: Empirical and Policy
implications. The Journal of Development Studies, 49: 7. 976-990 pp. (also available at:
https://doi.org/10.1080/00220388.2013.785527).
Barrientos, A. 2012. Social Transfer and Growth: What do we know? What do we need to find out? World Development,
40(1): 11-20. (also available at: https://doi.org/10.1016/j.worlddev.2011.05.012).
Bastagli, F.; Hagen-Zanker, J.; Harman, L.; Barca, V.; Sturge, G. and Schmidt, T. 2019. The impact of Cash transfers. A
review from the Evidence of Low- and Middle-Income Countries. Journal of Social Policy, 48(3). 569-594 pp. (also
available at: https://doi.org/10.1017/S0047279418000715).
Bertrand, M., Mullainathan, S., Shafir, E. 2004. A Behavioral-Economics View of Poverty. American Economic Review, 94
(2). 419-423 pp. (also available at: https://doi.org/10.1257/0002828041302019).
Boone, R., Covarrubias, K., Davis, B. and Winters, P. 2013. Cash Transfers Programs and Agricultural Production: the
case of Malawi. Agricultural Economics, 44. 365-378 pp. (also available at: https://doi.org/10.1111/agec.12017).
Bonilla, J., Castro Zarzur, R., Handa, S., Nowlin, C., Peterman, A., Ring, H., and Seidenfeld, D. 2017. Cash for Women’s
Empowerment? A Mixed-Method Evaluation of the Government of Zambia’s Child Grant Program. World
Development, vol. 95. 55-72 pp. (also available at: https://doi.org/10.1016/j.worlddev.2017.02.017).
Boucher, S.R.; Guirkinger, C. and Trivelli, C. 2009. Direct Elicitation of credit Constraint: Conceptual and Practical Issues
with an Application to Peruvian Agriculture. Economic and Cultural Change, vol. 57, No. 4. 609-640 pp. (also
available at: https://doi.org/10.1086/598763).
Buvinic, M. and Furst-Nichols, R. 2014. Promoting women’s economic empowerment: What works? Washington, DC,
World Bank. (also available at: Promoting Women's Economic Empowerment: What Works? (worldbank.org)).
Chant, S. and Pedwell, C. 2008. Women, Gender and the Informal Economy: An Assessment of ILO Research and
Suggested Ways Forward. International Labour Organization (ILO) Discussion Paper. ILO, Geneva. (also available at:
Microsoft Word - DEPTS-External-2008-02-0341-1-En.doc (ilo.org)).
Coates, J., Swindale, A., and Blinsky, P. 2007. Household Food Insecurity Access Scale (HFIAS) for Measurement of
Household Food Access: Indicator Guide (v. 3). Washington, D.C.: FHI 360/FANTA. (also available at: Microsoft
Word - HFIAS_v3_Aug07.doc (fao.org)).
Cohen, J. D.; Ericson, K. M.; Laibson, D. and White, J. M. 2020. Measuring time preferences. Journal of Economic
Literature, 58(2). 299-347 pp. (also available at: https://doi.org/10.1257/jel.20191074).

46
Covarrubias, K.; Davis, B. and Winters, P. 2012. From protection to production: productive impacts of the Malawi Social
Cash Transfer scheme. Journal of Development Effectiveness, 4:1. 50-77 pp. (also available at:
https://doi.org/10.1080/19439342.2011.641995).
Dalton, P. S.; Ghosal, S. and Mani, A. 2014. Poverty and Aspirations Failure. The Economic Journal, 126 (590). 165-188
pp. (also available at: https://doi.org/10.1111/ecoj.12210).
Daidone, S., Davis, B.; Handa, S. and Winters, P. 2019. The household and Individual-Level Productive Impacts of Cash
Transfer Programs in Sub-Saharan Africa. American Journal of Agricultural Economics, 101(5). 1401-1431. pp.
(also available at: https://doi.org/10.1093/ajae/aay113).
Davis, B., Winters, P., Carletto, G., Covarrubias, K., Quiñones, E.J., Zezza, A., Stamoulis, K., Azzarri, C., Di Giuseppe, S.
2010. A Cross-Country Comparison of Rural Income Generating Activities. World Development, Vol. 38(1). 48-63
pp. (also available at: https://doi.org/10.1016/j.worlddev.2009.01.003).
De Brauw, A., Gilligan, D., Hoddinott, J. and Roy, S. 2014. The Impact of Bolsa Família on Women’s Decision Making
Power. World Development 59. 487-504 pp. (also available at: https://doi.org/10.1016/j.worlddev.2013.02.003).
Dercon, S. 1996. Risk, Crop Choice and Savings: Evidence from Tanzania. Economic Development and Cultural Change,
vol. 44, No. 3. 485-513 pp. (also available at: https://doi.org/10.1086/452229).
DFDI.2011. Cash Transfers Literature Review. Department for International Development: London. (also available at:
cash-transfers-literature-review.pdf (calpnetwork.org).
Di Falco, S.; Damon, M. and Kohlin, G. 2011. Environmental Shocks, Rates of Time Preference and Conservation: A
Behavioural Dimension of Poverty Traps? Working Paper.
Duflo, E. 2003. Grandmothers and Granddaughters: Old-Age Pensions and Intrahousehold Allocation in South Africa. The
World Bank Economic Review 17 (1). 1–25 pp. (also available at: https://doi.org/10.1093/wber/lhg013).
Duflo, E. 2012. Women Empowerment and Economic Development. Journal of Economic Literature, 50(4). 1051-1079 pp.
(also available at: https://doi.org/10.1257/jel.50.4.1051).
Ericson, K., and Laibson, D. 2018. Chapter 1 - Intertemporal choice. In Bernheim, E.B., DellaVigna, S. and Laibson, D. (Eds)
(2018). Handbook of Behavioral Economics: Applications and Foundations 1, Volume 2. Amsterdam, North
Holland. 1-67 pp.
Esser, A., Bilo, C. and Tebaldi, R. 2019. How can cash transfer programmes work for women and children? A review of
gender- and child-sensitive design features. IPC Working Paper 178. Brazilia, International Policy Centre for
Inclusive Growth (IPC-IG).
FAO. 2018. FAO Technical Guide 1 – Introduction to gender-sensitive social protection programming to combat rural
poverty: Why is it important and what does it mean? FAO, Rome. (also available at:
http://www.fao.org/3/ca2026en/CA2026EN.pdf).
47
FAO. 2020. The contribution of social protection to economic inclusion in rural areas. FAO, Rome. (also available at:
http://www.fao.org/3/cb2458en/CB2458EN.pdf).
Faraha, M., Hook, C. 2017. Trust and the poverty trap. PNAS, 114(21), 5327-5329. (also available at:
https://doi.org/0.1073/pnas.1704798114).
Freeman, D.; Manzini, P.; Mariotti, M. and Mittone, L. 2016. Procedures for Eliciting Time Preferences. IZA Discussion
Papers 9857, Institute of Labor Economics (IZA). (also available at: http://ftp.iza.org/dp9857.pdf).
Gordon, D., Nandy, S., Pantazis, C., Pemberton, S., & Townsend, P. 2004. Child poverty in the developing world.
International Journal of Epidemiology, Vol 33, (2). 437–438 pp. (also available at:
https://doi.org/10.1093/ije/dyh079).
Government of the Republic of Zambia. 2006. Fifth National Development Plan 2006-2010: Broad-based wealth and job
creation through citizenry participation and technological advancement. Lusaka. (also available at:
https://www.thegef.org/sites/default/files/ncsa-documents/ZAMBIA-FNDP.pdf).
Grown, C. 2014. Missing women: Gender and the extreme poverty debate. Washington, DC, USAID. (also available at:
https://usaidlearninglab.org/sites/default/files/resource/files/Gender & Extreme Poverty_Missing Women.pdf).
Handa, S.; Martorano, B.; Halpern, C.; Pettifor, A. and Thirumurthy, H. 2014. Subjetcive Well-being, Risk Perceptions
and Time Discounting: Evidence from a Large-Scale Cash Transfer Programme. Innocenti Working Paper No. 2014-
02. UNICEF Office of Research, Florence. (also available at: https://www.unicef-
irc.org/publications/pdf/wp2014_02_ashu_martorano_fin.pdf).
Handa, S.; Seidenfeld, D.; Davis, B. and Tembo, G. 2015. The Social and Productive Impacts of Zambia’s Child Grant.
Journal of Policy Analysis and Management, vol. 35, no. 2. 357-397 pp. (also available at:
https://doi.org/10.1002/pam.21892).
Handa, S.; Martorano, B.; Halpern, C.T.; Pettifor, A. and Thirumurthy, H. 2016. Time Discounting and Credit Market
Access in a Large-Scale Cash Transfer Programme. Journal of African Economies, vol 25 (3), 367–387 pp. (also
available at: https://doi.org/10.1093/jae/ejv031).
Handa, S., Natali, L., Seidenfeld, D., Tembo, G. and Davis, B. 2018. Can unconditional cash transfers raise long-term living
standards? Evidence from Zambia. Journal of Development Economics, 133. 42-65 pp. (also available at:
https://doi.org/10.1016/j.jdeveco.2018.01.008).
Handa, S.; Seidenfeld, D. and Tembo, G. 2020. The impact of a Large Scale Poverty Targeted Cash Transfer Program on
Inter-temporal choice. Economic Development and Cultural Change, vol.69 (1). (also available at:
https://doi.org/10.1086/702997).
Hanlon, J.; Barrientos, A. and Hulme, D. 2010. Just give money to the poor: the development revolution from the global
South. Kumarian Press: West Hartford, CT.
48
Harrison, G.W.; Lau, M.I. and Melonie, B. 2002. Estimating Individual Discount Rates in Denmark: A Field Experiment.
American Economic Review, 92(5). 1606-17 pp. (also available at:
https://doi.org/10.1257/000282802762024674).
Harrison, G.; Morten, I.L.; Rutstrom, E.E. and Melonie, B. 2005. Eliciting Risk and Time Preferences Using Field
Experiments: Some Methodological Issues. In Carpenter, J.; Harrison, G.W. and List, J.A. (Eds.). Field Experiments
in Economics. JAI Press.
Harrison, G.W.; Lau, M.I. and Rutstrom, E.E. 2007. Estimating Risk Attitudes in Denmark: A Field Experiment.
Scandinavian Journal of Economics, 109(2). 341-368 pp. (also available at: https://doi.org/10.1111/j.1467-
9442.2007.00496.x).
Haushofer, J. and Shapiro, J. 2013. Household Responses to Income Changes: Evidence from an Unconditional Cash
Transfer Program in Kenya. Working Paper. (also available at: https://www.poverty-
action.org/publication/household-response-income-changes-evidence-unconditional-cash-transfer-program-
kenya).
Haushofer, J., and Fehr, E. 2014. On the psychology of poverty. Science, 344(6186). 862-867 pp. (also available at:
https://doi.org/10.1126/science.1232491).
Haushofer, J., and Shapiro, J. 2016. The Short-Term Impact of Unconditional Cash Transfers to the Poor: Experimental
Evidence from Kenya. Quarterly Journal of Economics 131 (4). 1973–2042 pp. (also available at:
https://doi.org/10.1093/qje/qjw025).
Hendriks, S. 2019. The Role of Financial Inclusion in driving women’s economic empowerment. Development in Practice,
29:8. 1029-1038 pp. (also available at: https://doi.org/10.1080/09614524.2019.1660308).
Holmes, R. and Jones, N. 2013. Gender and social protection in the developing world: Beyond mothers and safety nets.
Zed Books: London.
Holt, C.A. and Laury, S.K. 2002. Risk Aversion and Incentive Effects. American Economic Review 92. 1644-1655 pp. (also
available at: https://doi.org/10.1257/000282802762024700).
Holt, C.A. and Laury, S.K. 2005. Risk Aversion and Incentive Effects: New Data. American Economic Review 95902-912.
pp. (also available at: https://doi.org/10.1257/0002828054201459).
Honorati, M., Gentilini, U. and Yemtsov, R.G. 2015. The State of Social Safety Nets 2015. Washington D.C.: International
Bank for Reconstruction and Development/The World Bank. (also available at: 9781464805431.pdf
(worldbank.org)).
Hunt, A. and Samman, E. 2016. Women’s Economic Empowerment: navigating enablers and constraints. ODI Research
Report. Overseas Development Institute (ODI), London. (also available at: 10683.pdf (odi.org)).

49
Ifcher, J. and Zarghamee, H. 2011. Happiness and Time Preference: The Effect of Positive Affect in a Random-Assignment
Experiment. American Economic Review 101, no. 7:3109–129. (also available at:
https://doi.org/10.1257/aer.101.7.3109).
Imai, K.; Keele, L. and Tingley, D. 2010. A general approach to mediation analysis. Psychological methods, vol. 15, (4).
309-334 pp. (also available at: https://doi.org/10.1037/a0020761).
Imai, K.; Keele, L. and Yamamoto, T. 2010b. Identification, Inference and Sensitivity Analysis for Causal Mediation Effects.
Statistical Science, vol.25(1). 1-71 pp. (also available at: https://doi.org/10.1214/10-STS321).
Imai, K.; Keele, L; Tingley, D. and Yamamoto, T. 2011. Unpacking the Black Box of Causality: Learning about Causal
Mechanisms from Experimental and Observational Studies. American Political Science Review, vol. 105(4). (also
available at: https:/doi.org/10.1017/S0003055411000414).
ILO. 2014. World Social Protection Report 2014/15. ILO, Geneva. (also available at: World Social Protection Report
2014/15 (ilo.org)).
IMF. 2018. Pursuing women’s economic empowerment. Employment working paper no. 212. (also available at:
pp053118pursuing-womens-economic-empowerment (1).pdf).
Kabeer, N. 2012. Women’s economic empowerment and inclusive growth: Labour markets and enterprise development.
International Development Research Centre, 44(10). 1–70 pp. (also available at:
kabeerWomen'sEconomicEmpowermentLabourMarkets (lse.ac.uk)).
Keele, L.; Tingley, D. and Yamamoto, T. 2015. Identifying mechanisms behind policy interventions via causal mediation
analysis. Journal of Policy Analysis and Management, 34(4). 937-963 pp. (also available at:
https://doi.org/10.1002/pam.21853).
Klugman, J. et al. 2014. Voice and Agency: Empowering Women and Girls for Shared Prosperity. World Bank Group
Washington, DC. (also available at: Voice and Agency : Empowering Women and Girls for Shared Prosperity
(worldbank.org)).
Lamb, J. R. 2003. Fertilizer use, risk, and off-farm labor markets in the semi-arid tropics of India. Department of
Agricultural and Resource Economics, Report no. 23. (also available at: 6517871.pdf (core.ac.uk)).
Laajaj, R. 2017. Endogenous Time Horizon and Behavioral Poverty Trap: Theory and Evidence from Mozambique. Journal
of Development Economics 127:187–208. (also available at: https://doi.org/10.1016/j.jdeveco.2017.01.006).
Loayza, N., Schmidt-Hebbel, K., Servén, L. 2000. Saving in Developing Countries: An Overview. The World Bank Economic
Review. Vol. 14(3). 393–414 pp. (also available at: https://doi.org/10.1093/wber/14.3.393).
Loewenstein, G., Prelec, D. 1992. Anomalies in Intertemporal Choice: Evidence and an Interpretation. The Quarterly
Journal of Economics, 107(2). 573-597 pp. (also available at: https://doi.org/10.2307/2118482).
50
Lundberg, S., and Pollak, R. A. 1996. Bargaining and distribution in marriage. The Journal of Economic Perspectives,
10(4). 139–158 pp. (also available at: https://doi.org/10.1257/jep.10.4.139).
Malta, V.; Kolovich, L.; Martinez Leyva, A. and Mendes Tavares, M. 2019. Informality and Gender Gaps Going Hand in
Hand. IMF Working Paper. (also available at: Informality and Gender Gaps Going Hand in Hand in: IMF Working
Papers Volume 2019 Issue 112 (2019)).
Mani, A., Mullainathan, S., Shafir, E., & Zhao, J. 2013. Poverty impedes cognitive function. Science, 341(6149). 976–980
pp. (also available at: https://doi.org/doi:10.1126/science.1238041).
Meagher, K. 2010. The empowerment trap: gender, poverty and the informal economy in sub-Saharn Africa. In Chant, S.
(Eds.), The International Handbook of gender and poverty. Cheltenham (UK): Edward Elgar Publishing Limited.
Mendola, M. 2007. Farm household production theories: A review of ‘institutional’ and ‘behavioral’ responses. Asian
Development Review, 24(1). 49-68 pp. (also available at: Asian Development Review (think-asia.org)).
Molotsky, A., Handa, S. 2020. The Psychology of Poverty: Evidence from the Field. Journal of African Economies, 30(3).
207-224 pp. (also available at: https://doi.org/10.1093/jae/ejaa010).
Morduch, J. 1995. Income smoothing and consumption smoothing. Journal of Economic Perspectives, 9 (3). 103-114 pp.
(also available at: https://doi.org/10.1257/jep.9.3.103).
Mullainathan, S., & Shafir, E. 2013. Scarcity: The true cost of not having enough. Penguin Books, London.
Natali, L., Handa, S., Peterman, A., Seidenfeld, D., Tempo, G. 2016. Making Money Work: Unconditional Cash Transfers
allow women to save and re-invest in rural Zambia. Innocenti Working Paper No.2016-02. UNICEF Office of
Research. Firenze. (also available at: Making Money Work: Unconditional cash transfers allow women to save and
re-invest in rural Zambia (unicef-irc.org)).
Njuki, J. and Sanginga, P. 2013. Women, Livestock Ownership and Markets Bridging the Gender Gap in Eastern and
Southern Africa. Routledge, London.
OECD. 2011. Women’s economic empowerment. Issues Paper. (also available at: 47561694.pdf (oecd.org)).
ODI. 2016. Women’s economic empowerment. Navigating enablers and constraints. (also available at: 10683.pdf
(odi.org)).
Pace N, Daidone S, Davis B, Handa S, Knowles M, Pickmans R. 2018. One plus one can be greater than two: Evaluating
synergies of development programmes in Malawi. Journal of Development Studies, 54(11). 2023-2060 pp. (also
available at: https://doi.org/10.1080/00220388.2017.1380794).
Pender, J. 1996. Discount rates and credit markets: Theory and evidence from rural India. Journal of Development
Economics, 50(2). 257-296 pp. (also available at: https://doi.org/10.1016/S0304-3878(96)00400-2).

51
Prifti, E., Daidone, S., Pace, N. and Davis, B. 2019. Unconditional cash transfers, risk attitudes and modern inputs demand.
Applied Econometrics, v.53. 100-118 pp. (also available at: pe_2019_53_100-118.pdf (rssi.ru)).
Prifti, E., Daidone, S., Pace, N., Davis, B. 2020. Stuck exchange: Can cash transfers push smallholders out of autarky?. The
Journal of International Trade & Economic Development, 29(5). 495-509 pp. (also available at:
https://doi.org/10.1080/09638199.2019.1702711).
Prina, S. 2015. Banking the Poor via Savings Accounts: Evidence from a Field Experiment. Journal of Development
Economics 115. 16–31 pp. (also available at: https://doi.org/10.1016/j.jdeveco.2015.01.004).
Quisumbing, A., and Maluccio, J. 1999. Intrahousehold allocation and gender relations: New empirical evidence. Policy
Research Report on Gender and Development Working Paper Series, No. 2. (also available at: Intrahousehold
allocation and gender relations | IFPRI : International Food Policy Research Institute).
Roelen, K., Devereux, S., Abdulai, A., Martorano, B., Palermo, T. and Ragno, L. 2017. How to Make ‘Cash Plus’ Work:
Linking Cash Transfers to Services and Sectors. Innocenti Working Paper 2017-10. UNICEF Office of Research,
Florence. (also available at: How to Make ‘Cash Plus’ Work: Linking Cash Transfers to Services and Sectors (unicef-
irc.org)).
Santos Silva, M., Klasen, S. 2021. Gender inequality as a barrier to economic growth: a review of the theoretical literature.
Review of Economics of the Household, vol. 19. 581–614 pp. (also available at: https://doi.org/10.1007/s11150-
020-09535-6).
Schwabe L, and Wolf, O.T. 2009. Stress prompts habit behavior in humans. Journal of Neuroscience, 29 (22). 7191-7198
pp. (also available at: https://doi.org/10.1523/JNEUROSCI.0979-09.2009).
Shah, A.K, Mullainathan, S-, Shafir, E. 2012. Some consequences of having too little. Science, 338 (6107). 682-685 pp.
(also available at: https://doi.org/10.1126/science.1222426).
Sheehy-Skeffington, J. 2018. Decision-making up against the wall: A framework for understanding the behavioural
dimension of low socio-economic status. In A. K. Üskül & S. Oishi (Eds.), Socio-economic environment and human
psychology: Social, ecological, and cultural perspectives (Vol. 1, pp. 105–128). Oxford: Oxford University Press.
Tanaka, T., Camerer, C., Nguyen, Q. 2010. Risk and Time Preferences: Linking Experimental and Household Survey Data
from Vietnam. American Economic Review, 100(1). 557-571 pp. (also available at:
https://doi.org/10.1257/aer.100.1.557).
Taylor, G. and Pereznieto, P. 2014. Review of evaluation approaches and methods used by interventions on women and
girls’ economic empowerment. ODI, London. (also available at: Review of evaluation approaches and methods
used by interventions on women and girls' economic empowerment | odi.org).
52
Todd, J. E., Winters, P. and Hertz, T. 2010. Conditional Cash Transfers and Agricultural Production: Lessons from the
Oportunidades Experience in Mexico. The journal of Development Studies, 46:1. 39-67 pp. (also available at:
https://doi.org/10.1080/00220380903197945).
United Nations. 2018. The Sustainable Development Goals Report 2018. (also available at:
TheSustainableDevelopmentGoalsReport2018-EN.pdf (un.org)).
UN Women. 2015. Progress of the world’s women 2015-2016. Transforming economies, realizing rights. UN Entity for
Gender Equality and the Empowerment of Women, New York, USA. (also available at: poww-2015-2016-en.pdf
(unwomen.org)).
UN Women. 2018. UN Women Annual Report 2017–2018. (also available at: 9769_Txt_C4_spreads.indd (unwomen.org)).
VeneKlasen, L. and Miller, V. 2002. A new weave of power, people and politics: The action guide for advocacy and
citizen participation. Rugby: Practical Action Publishing.
WaterAid. 2013. We can’t wait: A report on sanitation and hygiene for women and girls. (also available at: We can't wait
(wateraid.org)).
World Bank. 2015. Mapping Subnational Poverty in Zambia. The World Bank Group, Washington DC. (also available at:
Mapping Subnational Poverty in Zambia (worldbank.org)).
World Bank. 2021. The State of Economic Inclusion. The Potential to Scale. The World Bank Group, Washington DC. (also
available at: The State of Economic Inclusion Report 2021: The Potential to Scale (worldbank.org)).
Zhang, M., & Gordon, D. 2020. Understanding Gender Inequality in Poverty and Social Exclusion through a Psychological
Lens: Scarcities, Stereotypes, and Suggestions. In F. Cheung & D. Halpern (Eds.), The Cambridge Handbook of the
International Psychology of Women (Cambridge Handbooks in Psychology, pp. 390-401). University Press,
Cambridge. (also available at: https://doi.org/10.1017/9781108561716.033).