cargo handling equipment productivity analysis of the
TRANSCRIPT
World Maritime University World Maritime University
The Maritime Commons: Digital Repository of the World Maritime The Maritime Commons: Digital Repository of the World Maritime
University University
World Maritime University Dissertations Dissertations
2000
Cargo handling equipment productivity analysis of the Chittagong Cargo handling equipment productivity analysis of the Chittagong
Port Authority [Bangladesh] Port Authority [Bangladesh]
A.S.M. Shahjahan World Maritime University
Follow this and additional works at: https://commons.wmu.se/all_dissertations
Recommended Citation Recommended Citation Shahjahan, A.S.M., "Cargo handling equipment productivity analysis of the Chittagong Port Authority [Bangladesh]" (2000). World Maritime University Dissertations. 320. https://commons.wmu.se/all_dissertations/320
This Dissertation is brought to you courtesy of Maritime Commons. Open Access items may be downloaded for non-commercial, fair use academic purposes. No items may be hosted on another server or web site without express written permission from the World Maritime University. For more information, please contact [email protected].
WORLD MARITIME UNIVERSITYMalmö, Sweden
CARGO HANDLING EQUIPMENTPRODUCTIVITY ANALYSIS OF THECHITTAGONG PORT AUTHORITY
By
A S M SHAHJAHANBangladesh
A dissertation submitted to the World Maritime University in partial fulfilmentof the requirements for the award of the degree of
MASTER OF SCIENCE
in
PORT MANAGEMENT
2000
© Copyright A S M Shahjahan, 2000
ii
DECLARATION
I certify that all the material in this dissertation that is not my own work has been
identified, and that no material is included for which a degree has previously been
conferred on me.
The contents of this dissertation reflect my own personal views, and are not
necessarily endorsed by the University.
……………………………….. (Signature)
……………………………….. (Date)
Supervised by:
Name: R. Prasad
Office: Lecturer, Port Management
World Maritime University
Assessor:
Name: Bernard Francou
Office: Associate Professor, Port Management
World Maritime University
Co-assessor:
Name: Patrick M. Alderton
Office: Former Resident Professor, Ports and Shipping Administration
World Maritime University

iii
ACKNOWLEDGEMENTS
All praise to almighty Allah who has given me the opportunity to study at the World
Maritime University to achieve the knowledge of different fields of the maritime
industry.
My sincere thanks to the management of Chittagong Port Authority for nominating
me, and to the Tokyo Foundation, Japan for providing me with the fellowship to
participate and study at WMU.
I am grateful to all the academic and non-academic staff of this university, visiting
professors and different organizations who contributed generously
Special thanks to my supervisor, all professors and lecturers of Port Management,
who closely offered assistance for me to complete this dissertation on time.
I wish to express my gratitude to all of my colleagues and friends at WMU and
others in distant places including my country who helped me by providing
information and advice regarding this dissertation.
Last but not least, I wish to remember the tremendous sacrifices made by my family,
spouse and children and to whom I dedicate my modest achievements.
iv
ABSTRACT
Title of Dissertation: Cargo handling equipment productivity analysis of the
Chittagong Port Authority
Degree: MSc
The dissertation is a study of port cargo handling equipment and its productivity in
order to find out the possible solutions to improve the efficiency of equipment and
the port as well.
Ports are the key points of the global transport network. Presently, world sea borne
trade constitutes more than 90% of world trade in volume. Hence, the importance of
ports for handling cargo is unanimously recognized. In the present era of
competition, a cost-effective and reliable cargo handling service at Chittagong port is
important not only for the port but also for the economy of the country as a whole.
Containerization is an important revolution in the maritime field. With the rapid
technological developments, many state-of-the-art techniques and innovations are
contributing enormously to this phenomenon. Chittagong port is also influenced by
this global and regional trend. The introduction of Information Technology (IT),
dedicated container terminals, sophisticated cargo handling equipment, skilled
manpower and a sound environment can ensure and enhance the performance of
Chittagong Port Authority (CPA) in the future.
The present situation of the cargo handling equipment is not satisfactory for various
reasons, from an improper inventory of the equipment to problems in maintenance
and operation, insufficient facilities and other such influencing factors that are the
main aspects of equipment productivity analysis.
v
The concluding chapters of the dissertation carefully examine the present
drawbacks of port cargo handling equipment and try to find solutions and
recommendations in this regard.
KEYWORDS: Cost-effective, Performance, Productivity, Cargo handling,
Containerization, Information Technology, Innovation
vi
TABLE OF CONTENTS
Declaration ii
Acknowledgements iii
Abstract iv
Table of Contents vi
List of Tables x
List of Figures xii
List of Abbreviations xiii
1 Introduction
1.1 An overview 1
1.2 Identification of problems 4
1.3 Importance of analysis 5
1.4 Dissertation objectives 5
1.5 Research methodology 6
1.6 The scope of analysis 6
1.7 Organization of the dissertation 7
2 Cargo handling equipment and its management at CPA 8 2.1 Introduction 8
2.2 Cargo handling equipment systems 9 2.3 Organization 12
2.4 Equipment 14
2.4.1 Equipment Management 14
2.4.2 Existing facilities 14
vii
2.4.3 Types of equipment 17
2.4.4 Facilities at Inland Container Depot (ICD) 20
2.4.5 Other related facilities 20
2.4.6 New equipment and facilities 21
2.5 Equipment maintenance 22
2.5.1 Methods and procedures 22
2.5.2 Maintenance by local workshops 25
2.6 Equipment booking and operation 26
2.6.1 Booking and operation system 26
2.6.2 Working procedure and working time 26
2.7 Analysis of equipment performance and productivity 27
2.7.1 Maintenance performance 27
2.7.2 Operational performance 31
2.7.3 Cost-benefit of equipment 34
2.8 Training and human resources development 35
2.8.1 Present position of training 36
2.8.2 Short comings in the training system 36
2.9 Conclusion 37
3 Factors influencing equipment productivity 39
3.1 Introduction 39
3.2 Port and Equipment Management 40
3.3 Factors directly affecting equipment maintenance /operation 41
3.4 Traffic forecasting 50
3.5 Congestion at the Port 53
3.6 PEST Analysis 55
3.7 Inter departmental Coordination and co-operation 57
3.8 Port Management Information system 58
3.9 Government interference 60
3.10 Conclusion 60
viii
4 Comparisons with other ports 61
4.1 Introduction 61
4.2 Local ports 62
4.3 Regional ports 62
4.4 European ports 66
4.5 SWOT Analysis 68
4.5.1 Local Port (MPA) 69
4.5.2 Regional Ports 70
4.6 Conclusion 72
5 Solutions 73
5.1 Introduction 73
5.2 First Solution: Maintaining a proper equipment Inventory 73
5.2.1 Advantages 79
5.2.2 Constraints 79
5.3 Second Solution: Improving performance of 79
maintenance and operation
5.3.1 Advantages 89
5.3.2 Constraints 89
5.4 Third Solution: Giving more autonomy to the port 89
5.4.1 Advantages 90
5.4.2 Constraints 91
5.5 Conclusion 91
6 Conclusion and recommendations 92
6.1 Conclusion 92
6.2 Recommendations 93
ix
References 97
Appendices 102
Appendix 1 Map showing location of the Port 102
Appendix 2 Map showing import–export cargo movement 103
Appendix 3 Organizational chart of the port 104
Appendix 4 Container handling equipment categories 105
Appendix 5 Prices of different types of container handling equipment 106
Appendix 6 Daily equipment position of CPA 107
Appendix 7 Annual inspection and testing of forklift 108
Appendix 8 Growth of world sea borne trade 109
Appendix 9 Growth of trade is higher than GDP 110
Appendix 10 Map showing container ports of South Asia 111
Appendix 11 Key economic ratio (South Asia) 112
Appendix 12 Forecasting procedure 113
x
LIST OF TABLES
Table 1 CPA cargo and container handling throughput 2
Table 2.1 Features of different types of container handling equipment 11
Table 2.2 State of container handling equipment 18
Table 2.3 State of general cargo handling equipment 19
Table 2.4 Related facilities for cargo handling in GCB and CCT 20
Table 2.5 Facilities to be created in CPA by 2001/2002 and 2005/2007 22
Table 2.6 Preventive maintenance schedule of forklift truck 24
Table 2.7 Downtime, availability, and utilization rate of general 27
Cargo handling equipment by type
Table 2.8 Downtime, availability, and utilization rate of container 28
handling equipment by type
Table 2.9 Demand availability of container handling equipment 30
Table 2.10 List of holidays and leave in CPA 31
Table 2.11 Performance indicators of CPA from 1995/96 to 1998/99 32
Table 2.12 Hourly operating cost (in USD) of equipment 34
Table 2.13 Training courses for mechanical branch 36
Table 2.14 Revenue surplus of CPA 37
Table 3.1 Effect of equipment inventory 42
Table 3.2 Economic life calculation of a 3 -ton forklift truck 43
Table 3.3 Projected container throughput from previous study reports 51
Table 3.4 Container throughput forecast upto 2005 52
Table 3.5 Key economic ratios, Bangladesh 53
Table 3.6 Dwell time of containers at CPA 55
Table 4.1 Comparison of throughputs of regional ports 63
Table 4.2 Nepal transit through CPA 64
Table 4.3 Comparison of data with different regional ports 64
Table 4.4 Future container handling capacities in Indian subcontinent 65
xi
Table 4.5 Throughput in Hamburg-Le havre range 66
Table 4.6 Comparison of equipment performance (CPA & Europe) 67
Table 4.7 Annual operating costs comparison with European ports 68
Table 5.1 Moves calculation for required container handling equipment 76
Table 5.2 Requirements of container handling equipment 77
Table 5.3 Requirements of general cargo handling equipment 78
Table 5.4 Requirement of container and general cargo berths 86
Table 5.5 Requirement of storage area for containers and general cargoes 88
xii
LIST OF FIGURES
Figure 2.1 Organization chart of mechanical branch 13
Figure 2.2 Rough sketch locating cargo handling equipment workshops 16
Figure 2.3 Picture of a CPA zonal workshop - D 17
Figure 3.1 Maintenance work organization of workshops 45
Figure 3.2 PEST Factors 56
Figure 3.3 Decision focus of MIS 59
Figure 5.1 The equipment planning process 74
xiii
LIST OF ABBREVIATIONS
CCT Chittagong Container Terminal
CEPZ Chittagong Export Processing Zone
CFS Container Freight Station
CPA Chittagong Port Authority
DFI Direct Foreign Investment
EMIS Equipment Management Information System
EPZ Export Processing Zone
FCL Full Container Load
GCB General Cargo Berth
GDP Gross Domestic Product
GNP Gross National Product
ICD Inland Container Depot
IT Information Technology
JNPT Jawaharlal Neheru Port Trust
LCL Less Container Load
MBWA Management By Wandering Around
MIS Management Information System
MPA Mongla Port Authority
MTBF Mean Time Between Failures
MTTR Mean Time To Repair
OMIS Operation Management Information System
PEST Political, Economical, Social and Technical
PSA Port of Singapore Authority
SWOT Strengths, Weaknesses, Opportunities and Threats
TEU Twenty Feet Equivalent Unit
UNCTAD United Nations Conference on Trade and Development
1
CHAPTER 1
INTRODUCTION
1.1 An overviewChittagong Port Authority (CPA) is a technical and economical entity and is used as
an interface, a link, a gateway and a logistic platform for facilitating national and
international trade. Cargo handling equipment of CPA occupies an important
position in port operations and needs to be analyzed for its improvement.
CPA is the state-owned service organization. It is the biggest port in Bangladesh,
situated on the right bank of Kornafully, at a distance of about 9 nautical miles from
the shore line of Bay of Bengal, at Chittagong, in the south-eastern part of the
country (Appendix 1).
Although the port is not located at a strategic position compared to the main East-
West sea route, it has endless possibilities to grow in the future because of its own
big market and regional traffic. The attractiveness of ports is no longer based on
strategic location but on the provision of efficient and prompt services and on their
being linked to efficient land and sea transport net works [United Nations
Conference on Trade and Development (UNCTAD), Newsletter, November 1999].
Also political stability and strong commitment of the government is the key factor for
its development. CPA handled about 14 million tonnes of cargo including container
throughput of 366,000 TEUs in 1998-99. So, the port occupies a position amongst
the top hundred container ports in the world. Trade through both general cargo and
containers is growing steadily. But significant is, looking at the previous 10 years,
2
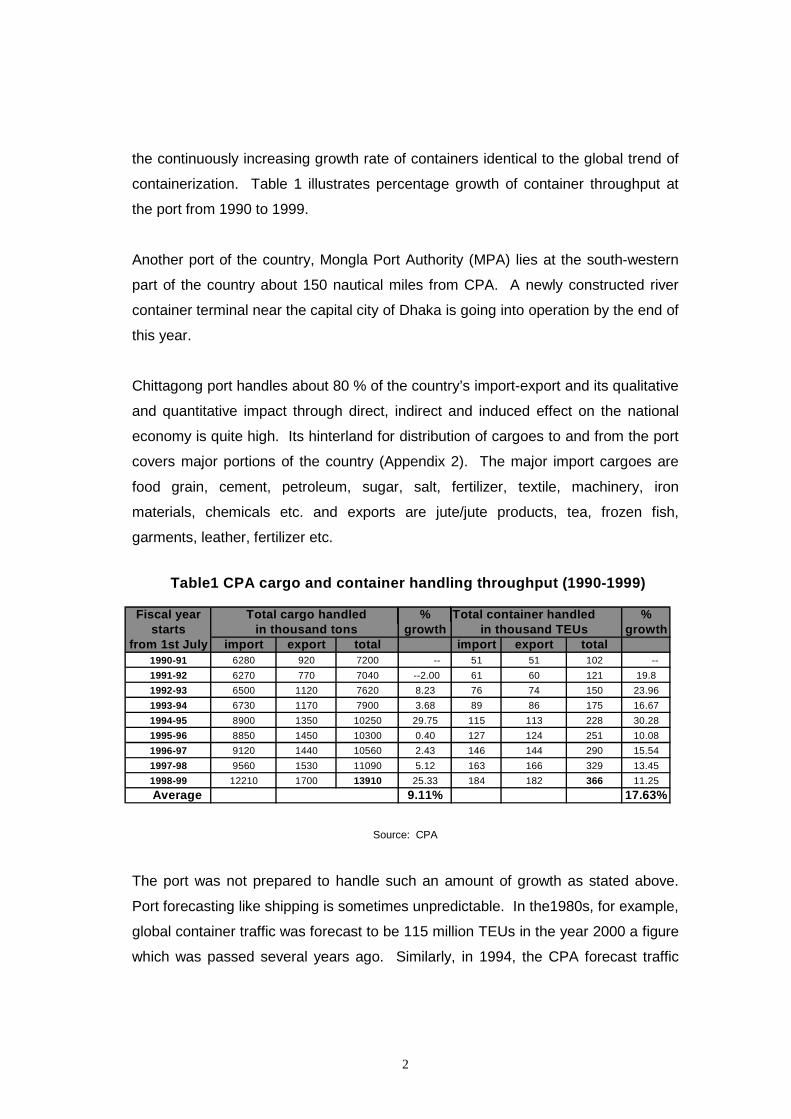
the continuously increasing growth rate of containers identical to the global trend of
containerization. Table 1 illustrates percentage growth of container throughput at
the port from 1990 to 1999.
Another port of the country, Mongla Port Authority (MPA) lies at the south-western
part of the country about 150 nautical miles from CPA. A newly constructed river
container terminal near the capital city of Dhaka is going into operation by the end of
this year.
Chittagong port handles about 80 % of the country’s import-export and its qualitative
and quantitative impact through direct, indirect and induced effect on the national
economy is quite high. Its hinterland for distribution of cargoes to and from the port
covers major portions of the country (Appendix 2). The major import cargoes are
food grain, cement, petroleum, sugar, salt, fertilizer, textile, machinery, iron
materials, chemicals etc. and exports are jute/jute products, tea, frozen fish,
garments, leather, fertilizer etc.
Source: CPA
The port was not prepared to handle such an amount of growth as stated above.
Port forecasting like shipping is sometimes unpredictable. In the1980s, for example,
global container traffic was forecast to be 115 million TEUs in the year 2000 a figure
which was passed several years ago. Similarly, in 1994, the CPA forecast traffic
Table1 CPA cargo and container handling throughput (1990-1999)
Fiscal year Total cargo handled % Total container handled %starts in thousand tons growth in thousand TEUs growth
from 1st July import export total import export total1990-91 6280 920 7200 -- 51 51 102 --1991-92 6270 770 7040 --2.00 61 60 121 19.81992-93 6500 1120 7620 8.23 76 74 150 23.961993-94 6730 1170 7900 3.68 89 86 175 16.671994-95 8900 1350 10250 29.75 115 113 228 30.281995-96 8850 1450 10300 0.40 127 124 251 10.081996-97 9120 1440 10560 2.43 146 144 290 15.541997-98 9560 1530 11090 5.12 163 166 329 13.451998-99 12210 1700 13910 25.33 184 182 366 11.25
Average 9.11% 17.63%
3
275,000 TEUs in 2000, was already passed in 1996-97. This growth is the result of
severe competition among ports and the economic developments of countries.
Like shipping companies, it now appears that port authorities and stevedoring
companies are following the path of globalization and economies of scale by
enlargement. The emergence of fourth generation ports is the new concept where
large port or terminal operators are entering into partnership or alliance to operate
the ports on a bigger scale with increased benefits and competition. Hutchinson
Port Holdings and Port of Singapore Authority (PSA) corporations, for example,
operate 17 and 7 ports respectively in different regions of the world.
Of course, such types of merging and competition are driven by two forces:
dedicated container terminal and sophisticated cargo handling equipment. The
major capital investments of a port are spent in these two fields in order to optimize
port profitability. Developing ports, like CPA, have no alternative other than these
two main aspects to improve efficiency. In this context, port cargo handling
equipment performance should be analyzed carefully and action taken accordingly.
Bangladesh is one of the least developing countries of South Asia. More than 126
million people in a land of 144,000 sq. km. need rapid development of its economy
for survival. This can only be possible by developing its maritime fields: ports,
shipping and other related activities. In the present world, the leading maritime
countries Japan, Netherlands, Singapore have developed their economies by
improving ports, shipping and creating many value added activities in the related
fields.
In this context, CPA as a premier port of Bangladesh could be a source of economic
power by improving its performance in every aspect and creating a lot of value
added activities to generate huge indirect employment. The port is a big
organization headed by a chairman and consists of 15 departments responsible for
different port functions. An organizational structure of the port has been placed in
Appendix 3. Port cargo handling operation is the focal point of all port functions.
4
The traffic/operation department and mechanical branch are mainly responsible for
cargo handling equipment operations.
Cargo handling equipment is the main component of cargo handling operations. It is
estimated that 40% of a port’s capital budget is spent on the procurement and
maintenance of cargo handling equipment. So, it is most important for port
management to put the required emphasis on maintaining a proper inventory and
maintenance of the equipment.
The political and economic situation of the country and inter departmental co-
operation influence a port’s functions enormously. Another important influencing
factor is the government interference in major investment in the port. As mentioned
above, there is a rising cargo handling trend, which could be accelerated if there is
no interference from the government to create facilities at the port in time.
This dissertation aims at describing and analyzing the cargo handling equipment
productivity/performance of the Chittagong Port Authority based on identification of
the problems/influences of maintenance and operation of the equipment and other
related factors in order to find the useful solutions in this regard.
1.2 Identification of problemsNo problems can be solved without their identification in the first place. This is also
true in the case of port cargo handling equipment. However, the normal tendency
of port and equipment management personnel is that they try to solve the symptoms
rather than the problems without concentrating on the root causes. Equipment is a
sensitive item in port operations. Maintenance of equipment and its operation
involve a lot of factors at different stages which need to be solved in time in order to
avoid any breakdowns which may affect the chain of operations. During
identification, the following points require attention so that the problems can be
handled and solved quickly:
1. What problems exist in relation to equipment maintenance?
2. What factors affect the maintenance and its performance?
5
3. How can equipment performance be improved?
1.3 The importance of the AnalysisIn the maritime field, ships and ports are the two fields competing with each other
fiercely to cope with the innovations and technological changes day by day. If a port
fails to follow the changes in shipping, in time it will fall behind the competition. The
changes in ports are mainly in connection with port cargo handling techniques and
construction of dedicated terminals. This changing technology involves a huge
amount of investment and needs proper maintenance and supervision.
Secondly, any improvement in this field demands careful observation. Particular
factors and how much they influence the activities of operation and maintenance of
equipment can be easily identified if the segments of activities are analyzed
minutely. For example, if the performance of maintenance work in one month falls
significantly compared to the previous month, there can be number of reasons
behind this. They should be analyzed so that measures can be taken promptly.
Thirdly, the probability of occurrence of breakdown decreases if the faults are
analyzed thoroughly and actions are taken on the basis of the findings.
Similarly, the behavior and skills of manpower, such as that concerns the operators
and technicians, should be analyzed periodically for training needs assessment.
Finally, efficiency, which is the key word of operation and maintenance of
equipment, can be improved by analyzing every piece of work. For this reason,
comparison with similar ports or a standard is also essential.
1.4 Dissertation objectivesThe objectives of this dissertation are as follows:
• To study and analyze the present inventory of cargo handling equipment
6
• To discuss the productivity and cost benefit of the equipment
• To analyze the problems/factors related with maintenance and operation
• To find out the training needs of the employees
• To compare the equipment performance and related activities with other ports
• To identify the management role in equipment productivity
• To identify awareness needs among the employees about importance of port
cargo handling equipment
• To suggest possible solutions and recommend some measures to eliminate the
problems of equipment in order to improve the port efficiency
1.5 Research methodology In order to achieve the above objectives, the following methods were followed during
the research period.
• Conducting research study at WMU library, Internet and other possible sources.
• Exchanging ideas and views with different personnel of CPA.
• Collecting data from the mechanical branch and other departments of CPA.
• Consultation with resource persons of World Maritime University (WMU)
including both staff and students.
• Consultation with experts at some developed ports in Europe and Japan during
field studies.
• E -mail correspondence with different personnel and organizations.
1.6 The scope of the analysisFor this analysis the present situation of cargo handling equipment and the related
factors are studied. It is observed during research that different ports do not
provide the detailed data of cargo handling equipment and productivity. However,
efforts were made mainly to find out the CPA’s present position with regards to other
developed and growing ports in the region and Europe and how difficulties and
limitations can be overcome successfully.
7
1.7 Organization of the dissertationThis dissertation is organized into six chapters in order to describe, identify, and
analyze port cargo handling equipment and its productivity and to find out the
possible solutions and recommendations to achieve the desired standard.
Chapter One is an introduction, which provides a general overview of the port in
relation to basic study including the objectives, importance of study, research
methodology, limitation of the analysis and its organization.
Chapter Two provides information about the present situation of port cargo handling
equipment at CPA. It states the current equipment management, facilities,
maintenance procedures, training system of the employees, equipment booking and
operational procedures, present performance/ productivity.
Chapter Three identifies the main problems of equipment maintenance and
operation, influencing factors of equipment productivity. These are in the areas of
port and equipment management, management related with operation, stores and
human resources development, management information system, inter-
departmental coordination and co-operation and PEST (i.e. Political, Economic,
Social and Technical) factors.
Chapter Four compares CPA with different ports. For this reason, local ports,
regional ports and European ports are selected. Comparisons with local ports and
other ports are done with a view to focus on the present position of CPA.
Chapter Five provides the possible solutions to the present and future needs of
cargo handling equipment and explains the merits and constraints of each solution.
Finally, Chapter Six draws a conclusion with some recommendations. To conclude
the analysis, all previous chapters are highlighted by key points. Recommendations
are given to adopt suitable measures on short, medium and long-term bases to
improve the present situation and achieve the desired targets and also to be a
useful tool for further research and analysis in this field.
8
CHAPTER 2
CARGO HANDLING EQUIPMENT AND ITS MANAGEMENT AT CPA
2.1 IntroductionLike in any port, cargo handling equipment of the Chittagong Port Authority plays a
vital role in operations. The main objective of the port is to ensure good and
effective services to its customers at minimum cost. Good services are mostly
offered by the equipment, facilities and the management. The total cargo handling
area of CPA is divided into two main parts: General Cargo Berth (GCB) and
Chittagong Container Terminal (CCT).
The cargo handling of CPA has been increasing day by day since 1977, when the
first container handling operation was started with private equipment at the port.
This was thanks to the contribution of private shipping lines such as Cobra
Consortium, US Lines, Maersk Lines, APL, Sea Land, Container and Terminal
services and others who used their own equipment to handle the containers when
CPA had no container handling equipment of its own. With growing demand from
the shipping companies and increased traffic in the country, CPA engaged M/S
Mounsell consultant of Australia in 1980, to study different aspects of cargo handling
including containerization in CPA. Based on the recommendations of the
consultants, the Port Authority developed interim container handling facilities for
containers in GCB area in 1984 and simultaneously built new multipurpose berths in
1986. But the berths could not be brought into full use for want of back-up facilities
such as container handling equipment, workshop for running operation and
maintenance of cargo handling equipment and container terminal. CPA had
sufficient funds of its own at all times to invest in developing the facilities. In spite of
9
that, due to political unrest and lack of sufficient autonomy, it could not acquire and
/or replace equipment in time.
However, at present CPA owns different types of equipment (general cargo and
container handling) as seen in the list in Tables 2.2& 2.3. Due to the shortage of
equipment, the port entered into a contract three years earlier with a private
company to operate and maintain 4 more straddle carriers on lease. CPA has
another cargo handling operation activity at ICD (Inland Container Depot) in Dhaka.
ICD was established in 1987 by CPA and has been considered as a part of CPA,
which serves as a cargo consolidation or de-consolidation centre transporting cargo
to and from inland destinations.
CPA is going to procure, by 2001/2002, a number of cargo handling equipment
including gantry crane, investing USD 60.4 m from its own budget. Work on a
project has already started and will be implemented in two phases.
It is noticed that the equipment management is lacking in capability to use the
available facilities efficiently due to various constraints. There are also bottlenecks
in equipment operation and the maintenance system. Manpower related with the
system requires more skills and knowledge to perform the work to the required
standards. This chapter attempts to introduce the cargo handling equipment system,
describe and explain the existing facilities, future procurement, maintenance and
operation systems, equipment productivity including the training position of the port.
2.2 Cargo handling equipment systemPort management throughout the world are becoming more conscious about the
need to provide modern equipped berths with the additional capital intensive cargo
handling techniques involving low labour contents as a means of their general
competitiveness and encouraging trade through their ports (Branch, 1986, p.86).
Different types of equipment is used for cargo handling in different countries
depending upon the factors such as the nature of the cargo, handling costs,
10
resources available including land, labour and equipment, weather conditions,
competitive situation compared with other ports, types of vessels, distribution
arrangements, tidal conditions, inter-modal transport facilities etc.
Presently, containerization is booming in the shipping and port industry. Modern
container handling equipment is the main discussion point over all other equipment
and facilities. Although CPA has both conventional and modern types of container
handling equipment such as forklifts and straddle carriers, it is old and inadequate.
CPA is going to procure more sophisticated equipment including gantry cranes both
for quays and yards.
Today, different types of cargo handling system are in use for container handling.
Container handling system starts at the quayside where containers can be handled
to and from the ships by the jib cranes, multipurpose cranes, gantry cranes and
even mobile cranes. Quay transfer may be done by tractor-trailers, by straddle
carriers or by heavy duty lift trucks. In the container yard, stacking and de-stuffing
may be carried out by straddle carriers, yard gantry cranes or a variety of lift
trucks/reach stackers. Receipt and delivery operations may also involve these
equipment types as well as tractor-trailer systems.
So, the shore handling operation can mainly be grouped into four different container
handling sub-systems:
1. The Tractor-trailer system in which containers are both handled and stored on
‘’over the road’’ chasis or terminal trailers, and are moved around terminal by
heavy duty tractor units.
2. Heavy duty Forklift or Front end loader system, in which heavy duty forklift
trucks are used to perform quay transfer and yard operation, called direct system
or in combination with other equipment called relay system.
3. Straddle carrier system, in which quay transfer, stacking and other duties are
performed by straddle carrier, called direct system. Straddle carriers are used for
in yard stacking while quay transfer and other movements are performed by
tractor-trailer sets or other equipment, called relay system.
11
4. Gantry Crane system, in which the container is equipped with Rubber Tyred
Gantry or Rail Mounted Gantry crane for stacking and unstacking with tractor-
trailers for quay transfer and other movements.
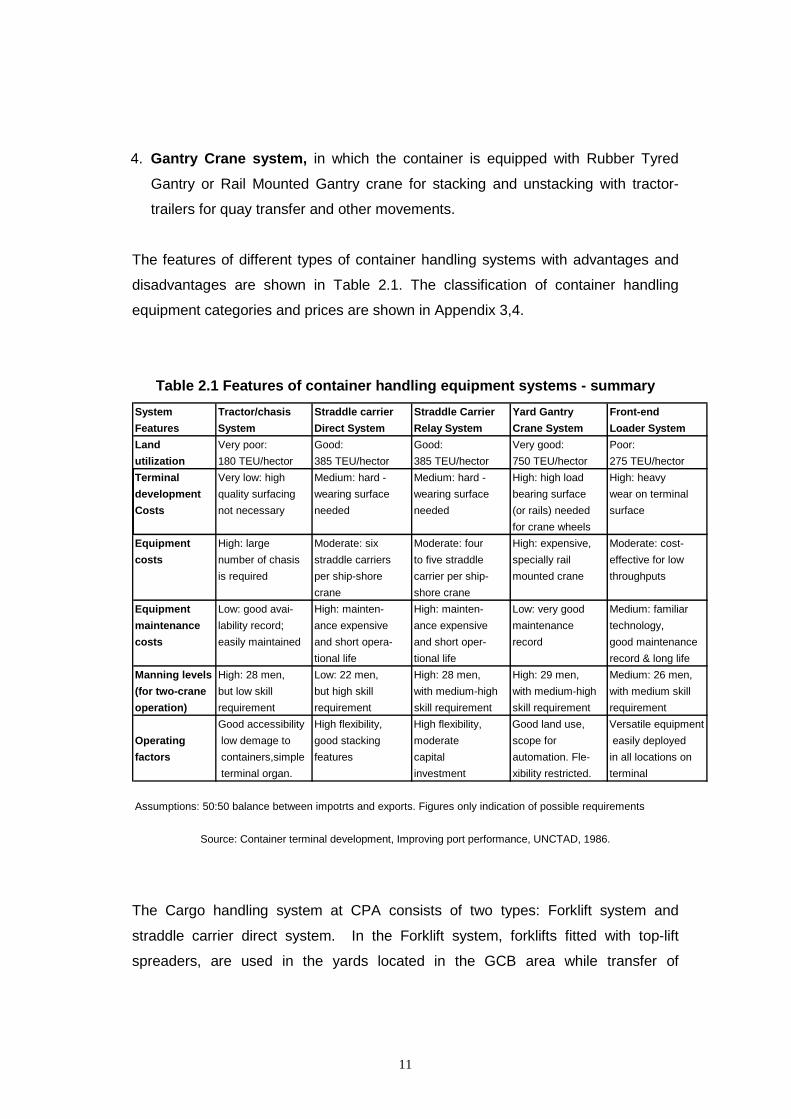
The features of different types of container handling systems with advantages and
disadvantages are shown in Table 2.1. The classification of container handling
equipment categories and prices are shown in Appendix 3,4.
Table 2.1 Features of container handling equipment systems - summary
Source: Container terminal development, Improving port performance, UNCTAD, 1986.
The Cargo handling system at CPA consists of two types: Forklift system and
straddle carrier direct system. In the Forklift system, forklifts fitted with top-lift
spreaders, are used in the yards located in the GCB area while transfer of
System Tractor/chasis Straddle carrier Straddle Carrier Yard Gantry Front-end Features System Direct System Relay System Crane System Loader SystemLand Very poor: Good: Good: Very good: Poor:utilization 180 TEU/hector 385 TEU/hector 385 TEU/hector 750 TEU/hector 275 TEU/hectorTerminal Very low: high Medium: hard - Medium: hard - High: high load High: heavy development quality surfacing wearing surface wearing surface bearing surface wear on terminalCosts not necessary needed needed (or rails) needed surface
for crane wheelsEquipment High: large Moderate: six Moderate: four High: expensive, Moderate: cost-costs number of chasis straddle carriers to five straddle specially rail effective for low
is required per ship-shore carrier per ship- mounted crane throughputscrane shore crane
Equipment Low: good avai- High: mainten- High: mainten- Low: very good Medium: familiarmaintenance lability record; ance expensive ance expensive maintenance technology, costs easily maintained and short opera- and short oper- record good maintenance
tional life tional life record & long lifeManning levels High: 28 men, Low: 22 men, High: 28 men, High: 29 men, Medium: 26 men,(for two-crane but low skill but high skill with medium-high with medium-high with medium skilloperation) requirement requirement skill requirement skill requirement requirement
Good accessibility High flexibility, High flexibility, Good land use, Versatile equipmentOperating low demage to good stacking moderate scope for easily deployedfactors containers,simple features capital automation. Fle- in all locations on
terminal organ. investment xibility restricted. terminal
Assumptions: 50:50 balance between impotrts and exports. Figures only indication of possible requirements
12
containers between the quay side and yard are done by tractor-trailers. In the
Straddle carrier system, a Straddle carrier is used in CCT for both yard operations
as well as transfer between quayside and yards.
Straddle carriers are chosen as the handling system in CCT considering the
versatility and flexibility of the equipment, the need for a high level of container
selectivity and relative economy of the land use compared to forklifts.
CPA has been using forklifts effectively from the initial stage of container handling
since1985. These are used in container yards of the GCB area which are small in
size and irregular shapes. Their bearing capacity is insufficient for the current
requirements. The consequence is that both the yards and equipment are damaged
frequently. Empty containers are handled in both GCB and CCT areas by light duty
forklifts with side shift spreader.
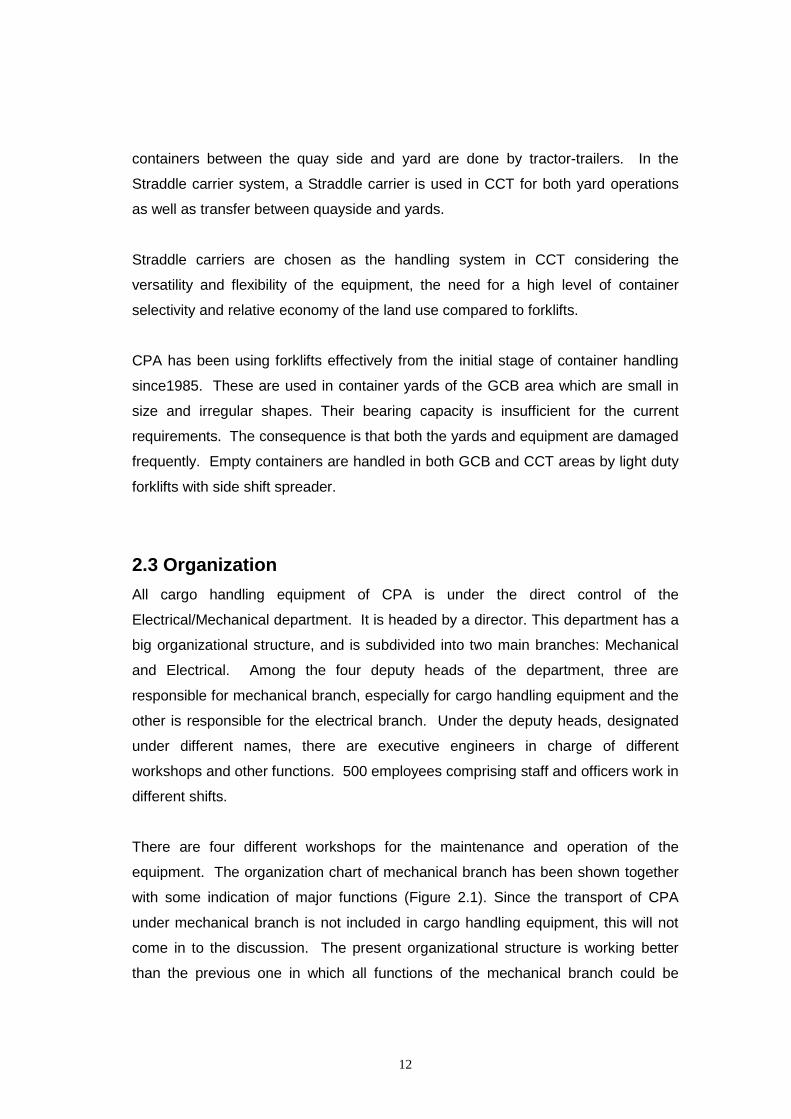
2.3 OrganizationAll cargo handling equipment of CPA is under the direct control of the
Electrical/Mechanical department. It is headed by a director. This department has a
big organizational structure, and is subdivided into two main branches: Mechanical
and Electrical. Among the four deputy heads of the department, three are
responsible for mechanical branch, especially for cargo handling equipment and the
other is responsible for the electrical branch. Under the deputy heads, designated
under different names, there are executive engineers in charge of different
workshops and other functions. 500 employees comprising staff and officers work in
different shifts.
There are four different workshops for the maintenance and operation of the
equipment. The organization chart of mechanical branch has been shown together
with some indication of major functions (Figure 2.1). Since the transport of CPA
under mechanical branch is not included in cargo handling equipment, this will not
come in to the discussion. The present organizational structure is working better
than the previous one in which all functions of the mechanical branch could be
13
performed under one central workshop. Due to a decentralization of functions of the
mechanical branch, the previous central workshop under a new structure split into
one central workshop and three zonal workshops in different locations of the port
protected area. This is the result of an increased volume of work in the mechanical
branch due to the continuous growth in traffic.
Figure 2.1 Organization chart of mechanical branch
NOTE: XEN= EXECUTIVE ENGINEER, MECH= MECHANICAL, Z= ZONAL WORKSHOPEQPT.= EQUIPMENT, R & M= REPAIR AND MAINTENANCE
Source: Mehanical branch, CPA
DIRECTOR(ELECTRICAL-MECHANICAL)
MECHANICAL BRANCH ELECTRICAL BRANCH
DEPUTY CHIEF ENGINEERADMINISTRATION
PROCUREMENT CELLTRANSPORT WORKSHOP
WORKSHOP MANAGERCENTRAL WORKSHOP
R&M OF GENERALCARGO HANDLING
EQUIPMENT
PLANT MANAGERZONAL WORKSHOPSR & M OF CONTAINERHANDLING EQPT. AND
OPERATION OF ALL EQPT.
XEN(MECH)TRANSPORT
XEN (MECH)PROCUREMENT CELL
XEN (MECH) R & M
XEN (MECH) STORE
XEN (MECH) Z- A/B
XEN (MECH) Z-C
XEN (MECH) Z-D
14
2.4 Equipment2.4.1 Equipment ManagementManagement of equipment is accomplished by a group of people as shown in the
organization chart. The main functions related to the equipment management are as
follows:
• To set objectives and performance standards for the department.
• To plan and forecast the equipment necessary for efficient cargo handling
operation in CPA.
• To take appropriate measures to maintain proper equipment inventory.
• To prepare cost-effective budget for management and maintenance of the
equipment
• To organize and supervise the overall maintenance of the equipment to ensure
equipment availability at all times.
• To arrange and implement continuous training and motivation schemes for the
employees.
• To maintain discipline in order to achieve the smooth functioning of all activities.
• To measure and ensure quality in maintenance and all other related functions by
controlling, reviewing and monitoring the activities and applying standard
procedures and techniques with respect to set objectives and standards.
In addition, the management of mechanical branch has to perform other functions
including maintaining a close relationship with port management and other
departments. All functions as stated above are not accomplished by the equipment
management properly due to different constraints and managers working under
equipment management are not equally capable of supporting all functions.
2.4.2 Existing facilities As said earlier, quality of cargo handling equipment is one of the key factors of port
productivity. The equipment owned by the CPA at present is broadly divided into
two categories: general (break bulk) cargo and container handling equipment.
Facilities of different kinds have been created to maintain the equipment and to keep
it in operation effectively. The establishment of three zonal workshops and one
15
central workshop are important among the facilities. The locations of the workshops
have been shown in Figure 2.2.
• Zonal and central workshopsThree zonal workshops (A/B, C & D) have been established in port protected areas
at almost equal distances from one another so that the equipment can go back and
forth from the operations point to the workshops within the shortest possible time so
as to give quick response during any operational failure/accident or maintenance
problem. The central workshop is not placed at center point of the three workshops.
Originally the idea was that all major repairs such as engine and transmission
overhauling, fuel pump testing and repairs, etc. could be done in this workshop.
Later on, however, considering that the two zonal workshops (C & D) are will be
more useful so that they can be used directly for the maintenance and operation of
container handling equipment, the central workshop is now only used for major
repairs and the maintenance of general cargo handling equipment.
Zonal workshop A/B accounts for all general cargo handling equipment. Facilities
available in this workshop include a dedicated area for preventive maintenance and
running maintenance, open pavement space for preserving different types of
equipment, fuel tank and pumps, distilled water making plant, equipment booking
and other administrative offices.
Zonal workshops C and D account for all container handling equipment, and are
used for parking, booking and maintenance of this equipment. Workshop-D was
established as a container handling equipment workshop jointly with Chittagong
Container Terminal. So, this workshop is better equipped, with repair and
maintenance facilities, than workshop-C.
Facilities available at workshop D are overhead crane, servicing bay, diesel pumps,
machine shop, equipment repairing areas, tyre repairing shop, battery charging
room, electrical maintenance room, sub-store for spares, welding facilities, engine
overhauling room and a covered shed for corrective maintenance. Moreover,
workshop has an L-shaped two storied building. The top floor of this building houses
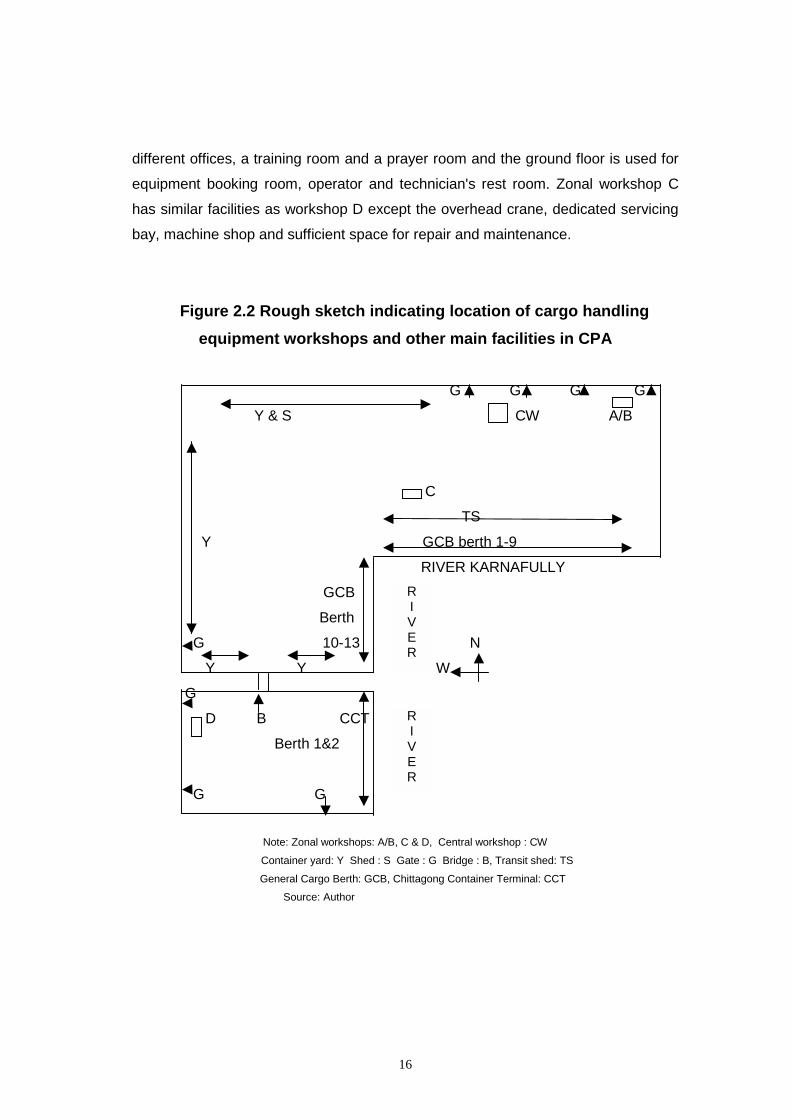
16
different offices, a training room and a prayer room and the ground floor is used for
equipment booking room, operator and technician's rest room. Zonal workshop C
has similar facilities as workshop D except the overhead crane, dedicated servicing
bay, machine shop and sufficient space for repair and maintenance.
Figure 2.2 Rough sketch indicating location of cargo handlingequipment workshops and other main facilities in CPA
G G G G
Y & S CW A/B
C
TS
Y GCB berth 1-9
RIVER KARNAFULLY
GCB
Berth
G 10-13 N
Y Y W
G
D B CCT
Berth 1&2
G G
Note: Zonal workshops: A/B, C & D, Central workshop : CW
Container yard: Y Shed : S Gate : G Bridge : B, Transit shed: TS
General Cargo Berth: GCB, Chittagong Container Terminal: CCT Source: Author
RIVER
RIVER
17
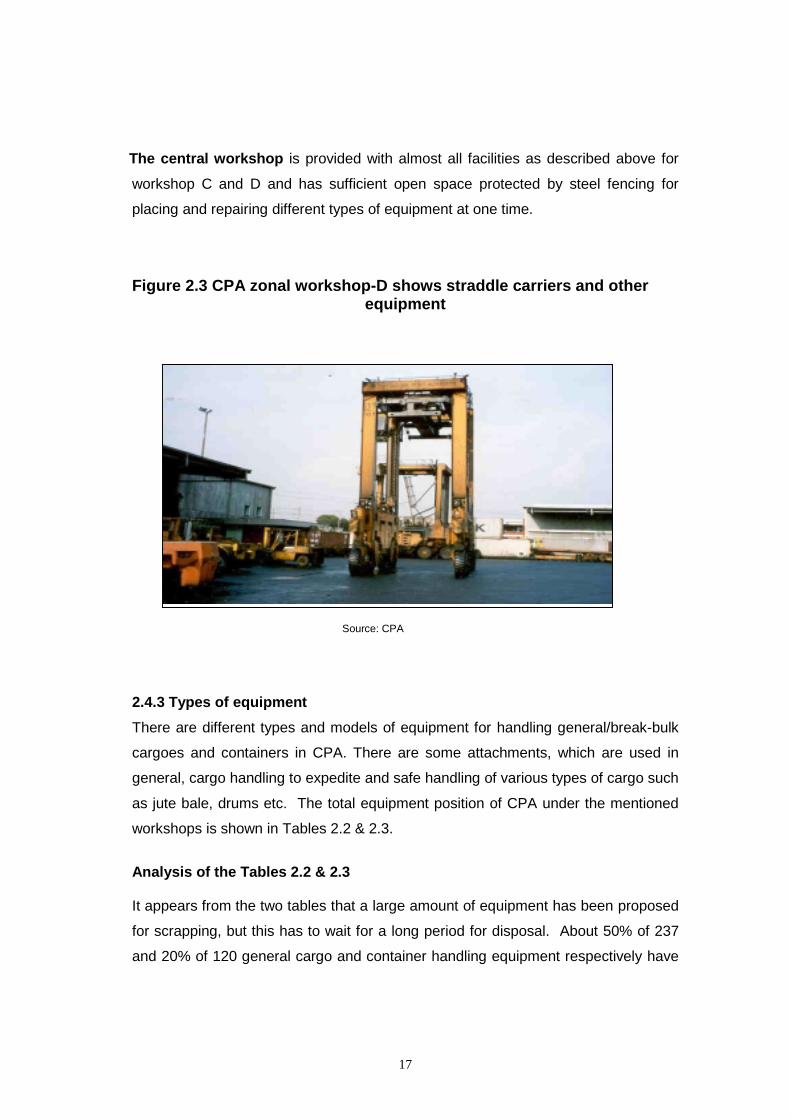
The central workshop is provided with almost all facilities as described above for
workshop C and D and has sufficient open space protected by steel fencing for
placing and repairing different types of equipment at one time.
Figure 2.3 CPA zonal workshop-D shows straddle carriers and otherequipment
Source: CPA
2.4.3 Types of equipmentThere are different types and models of equipment for handling general/break-bulk
cargoes and containers in CPA. There are some attachments, which are used in
general, cargo handling to expedite and safe handling of various types of cargo such
as jute bale, drums etc. The total equipment position of CPA under the mentioned
workshops is shown in Tables 2.2 & 2.3.
Analysis of the Tables 2.2 & 2.3
It appears from the two tables that a large amount of equipment has been proposed
for scrapping, but this has to wait for a long period for disposal. About 50% of 237
and 20% of 120 general cargo and container handling equipment respectively have
18
surpassed their economic lives. The economic life of equipment is that period
during which it can be operated at minimum average annual total cost.
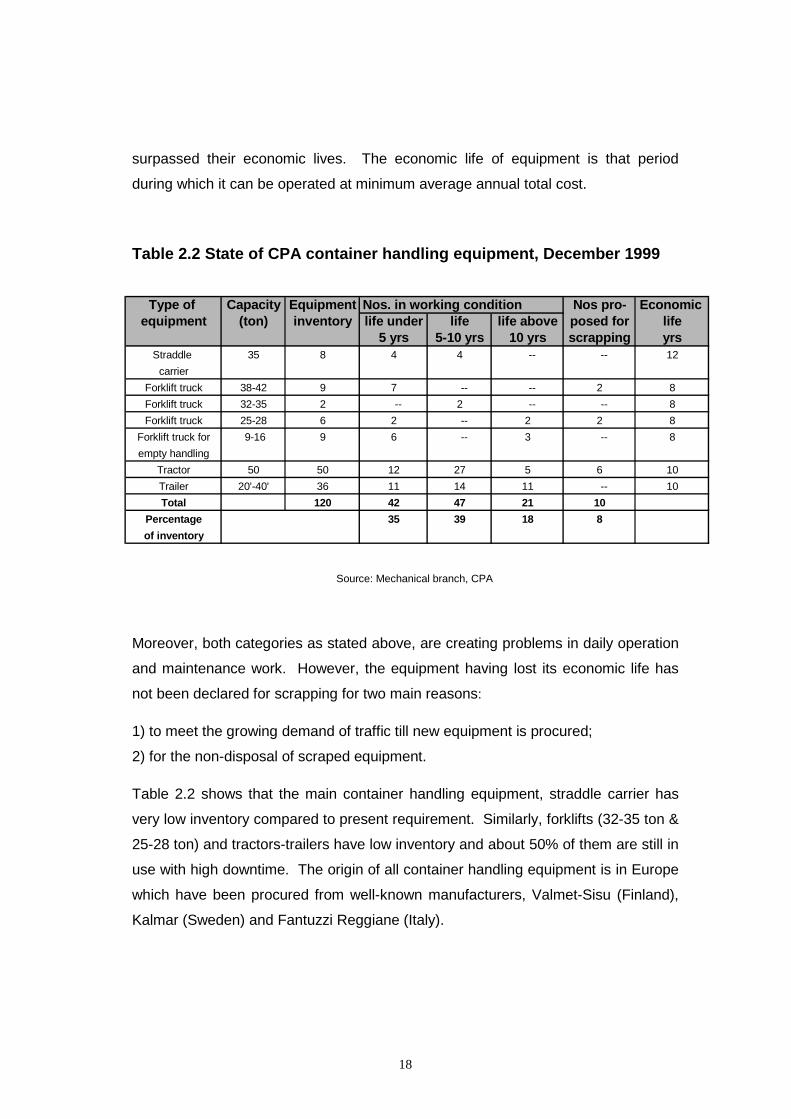
Table 2.2 State of CPA container handling equipment, December 1999
Source: Mechanical branch, CPA
Moreover, both categories as stated above, are creating problems in daily operation
and maintenance work. However, the equipment having lost its economic life has
not been declared for scrapping for two main reasons:
1) to meet the growing demand of traffic till new equipment is procured;
2) for the non-disposal of scraped equipment.
Table 2.2 shows that the main container handling equipment, straddle carrier has
very low inventory compared to present requirement. Similarly, forklifts (32-35 ton &
25-28 ton) and tractors-trailers have low inventory and about 50% of them are still in
use with high downtime. The origin of all container handling equipment is in Europe
which have been procured from well-known manufacturers, Valmet-Sisu (Finland),
Kalmar (Sweden) and Fantuzzi Reggiane (Italy).
Type of Capacity Equipment Nos. in working condition Nos pro- Economic equipment (ton) inventory life under life life above posed for life
5 yrs 5-10 yrs 10 yrs scrapping yrsStraddle 35 8 4 4 -- -- 12
carrierForklift truck 38-42 9 7 -- -- 2 8Forklift truck 32-35 2 -- 2 -- -- 8Forklift truck 25-28 6 2 -- 2 2 8
Forklift truck for 9-16 9 6 -- 3 -- 8empty handling
Tractor 50 50 12 27 5 6 10Trailer 20'-40' 36 11 14 11 -- 10Total 120 42 47 21 10
Percentage 35 39 18 8of inventory
19
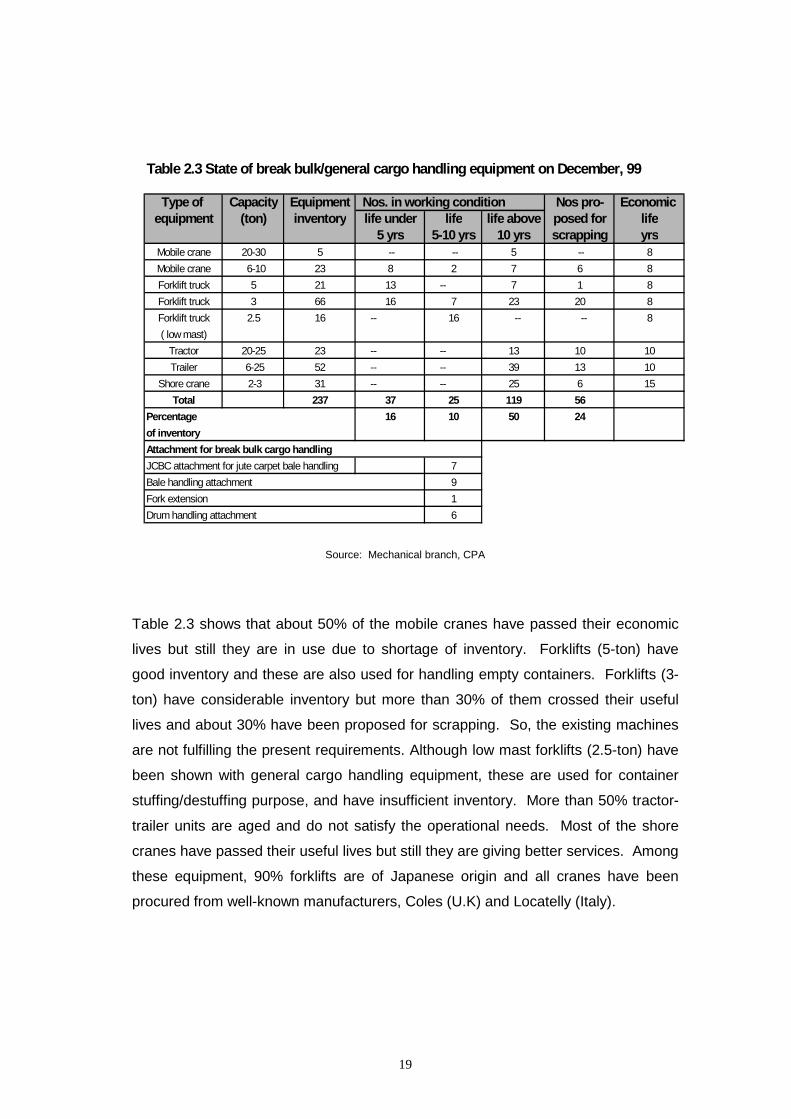
Source: Mechanical branch, CPA
Table 2.3 shows that about 50% of the mobile cranes have passed their economic
lives but still they are in use due to shortage of inventory. Forklifts (5-ton) have
good inventory and these are also used for handling empty containers. Forklifts (3-
ton) have considerable inventory but more than 30% of them crossed their useful
lives and about 30% have been proposed for scrapping. So, the existing machines
are not fulfilling the present requirements. Although low mast forklifts (2.5-ton) have
been shown with general cargo handling equipment, these are used for container
stuffing/destuffing purpose, and have insufficient inventory. More than 50% tractor-
trailer units are aged and do not satisfy the operational needs. Most of the shore
cranes have passed their useful lives but still they are giving better services. Among
these equipment, 90% forklifts are of Japanese origin and all cranes have been
procured from well-known manufacturers, Coles (U.K) and Locatelly (Italy).
Table 2.3 State of break bulk/general cargo handling equipment on December, 99
Type of Capacity Equipment Nos. in working condition Nos pro- Economic equipment (ton) inventory life under life life above posed for life
5 yrs 5-10 yrs 10 yrs scrapping yrsMobile crane 20-30 5 -- -- 5 -- 8Mobile crane 6-10 23 8 2 7 6 8Forklift truck 5 21 13 -- 7 1 8Forklift truck 3 66 16 7 23 20 8Forklift truck 2.5 16 -- 16 -- -- 8( low mast)
Tractor 20-25 23 -- -- 13 10 10Trailer 6-25 52 -- -- 39 13 10
Shore crane 2-3 31 -- -- 25 6 15Total 237 37 25 119 56
Percentage 16 10 50 24of inventoryAttachment for break bulk cargo handling JCBC attachment for jute carpet bale handling 7Bale handling attachment 9Fork extension 1Drum handling attachment 6
20
2.4.4 Facilities at the Inland Container Depot (ICD)The equipment facilities at ICD have been arranged by a private company since
1997 under lease contract. Prior to that time, CPA had been operating ICD
container handling operation with its own equipment since its establishment in 1987.
Presently, two big container handling forklifts (32 &36 ton) and 5 small forklifts (3 &
8 ton) are handling about 40,000 TEUs per year. It has area of 50,000-sq. m. for
container storage. ICD is serving the needy port users of distant places and
contributing as a part of the overall transport chain.
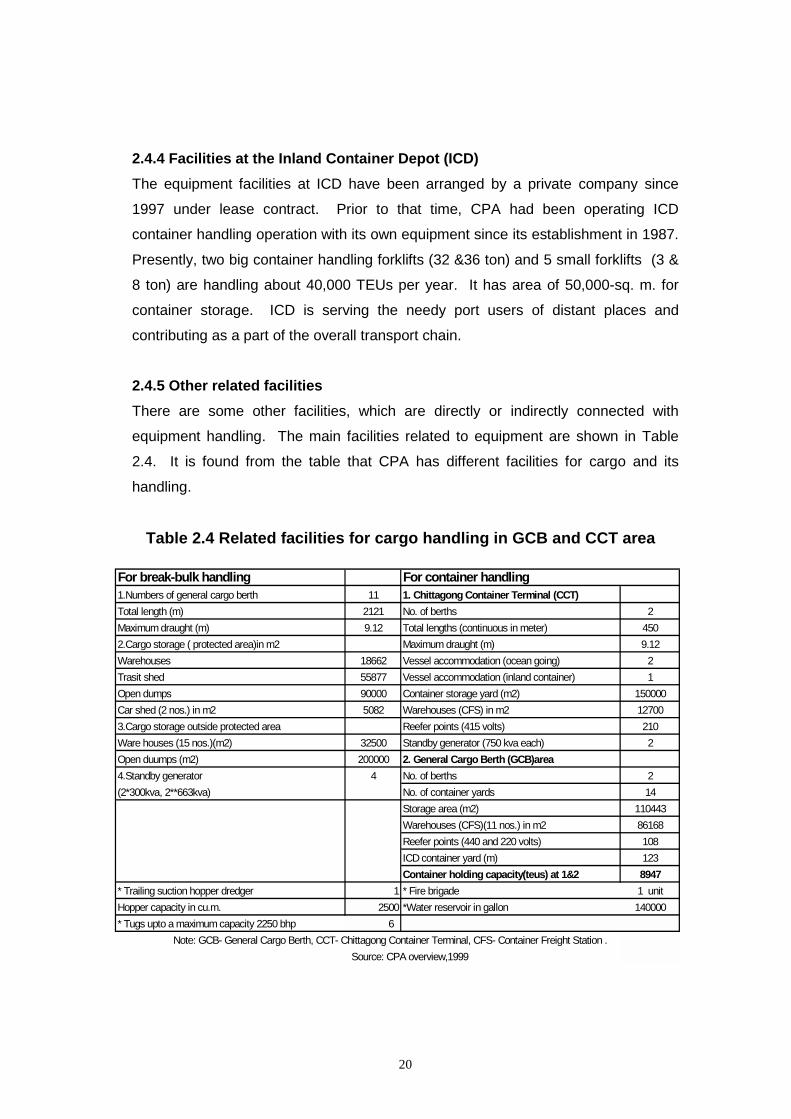
2.4.5 Other related facilitiesThere are some other facilities, which are directly or indirectly connected with
equipment handling. The main facilities related to equipment are shown in Table
2.4. It is found from the table that CPA has different facilities for cargo and its
handling.
Table 2.4 Related facilities for cargo handling in GCB and CCT area
For break-bulk handling For container handling 1.Numbers of general cargo berth 11 1. Chittagong Container Terminal (CCT)Total length (m) 2121 No. of berths 2Maximum draught (m) 9.12 Total lengths (continuous in meter) 4502.Cargo storage ( protected area)in m2 Maximum draught (m) 9.12Warehouses 18662 Vessel accommodation (ocean going) 2Trasit shed 55877 Vessel accommodation (inland container) 1Open dumps 90000 Container storage yard (m2) 150000Car shed (2 nos.) in m2 5082 Warehouses (CFS) in m2 127003.Cargo storage outside protected area Reefer points (415 volts) 210Ware houses (15 nos.)(m2) 32500 Standby generator (750 kva each) 2Open duumps (m2) 200000 2. General Cargo Berth (GCB)area4.Standby generator 4 No. of berths 2(2*300kva, 2**663kva) No. of container yards 14
Storage area (m2) 110443Warehouses (CFS)(11 nos.) in m2 86168Reefer points (440 and 220 volts) 108ICD container yard (m) 123Container holding capacity(teus) at 1&2 8947
* Trailing suction hopper dredger 1 * Fire brigade 1 unitHopper capacity in cu.m. 2500 *Water reservoir in gallon 140000* Tugs upto a maximum capacity 2250 bhp 6 Note: GCB- General Cargo Berth, CCT- Chittagong Container Terminal, CFS- Container Freight Station .
Source: CPA overview,1999
21
Both the GCB and CCT areas are provided with berths, storage area and standby
generator etc. Other facilities include: dredger for regular maintenance dredging in
channel, tugs for pilotage, fire brigade and provision for water supply to ships.
There are several special berths and storage facilities for dry and liquid bulk cargoes
outside the CPA protected area operated by other companies.
2.4.6 New Equipment and facilitiesShortage of equipment is the burning question of the port today. If the equipment is
not procured or replaced after a definite interval on the basis of traffic forecast, a
catastrophic disaster might happen in port operations in the future. This kind of
situation has been faced by the port several times and it influences the port itself
and national economy greatly. However, it is expected that port is soon going to buy
a number of containers handling equipment including gantry crane, by 2001/2002,
and to construct a new container terminal with back up facilities by 2005/2007.
Work on two projects, named as ''Procurement of container handling equipment
including gantry crane’’ and ‘’ Construction of a container terminal at the New
mooring area of Chittagong Port” has already started. An International tender for
the first project has been invited and for the other project will be invited soon. The
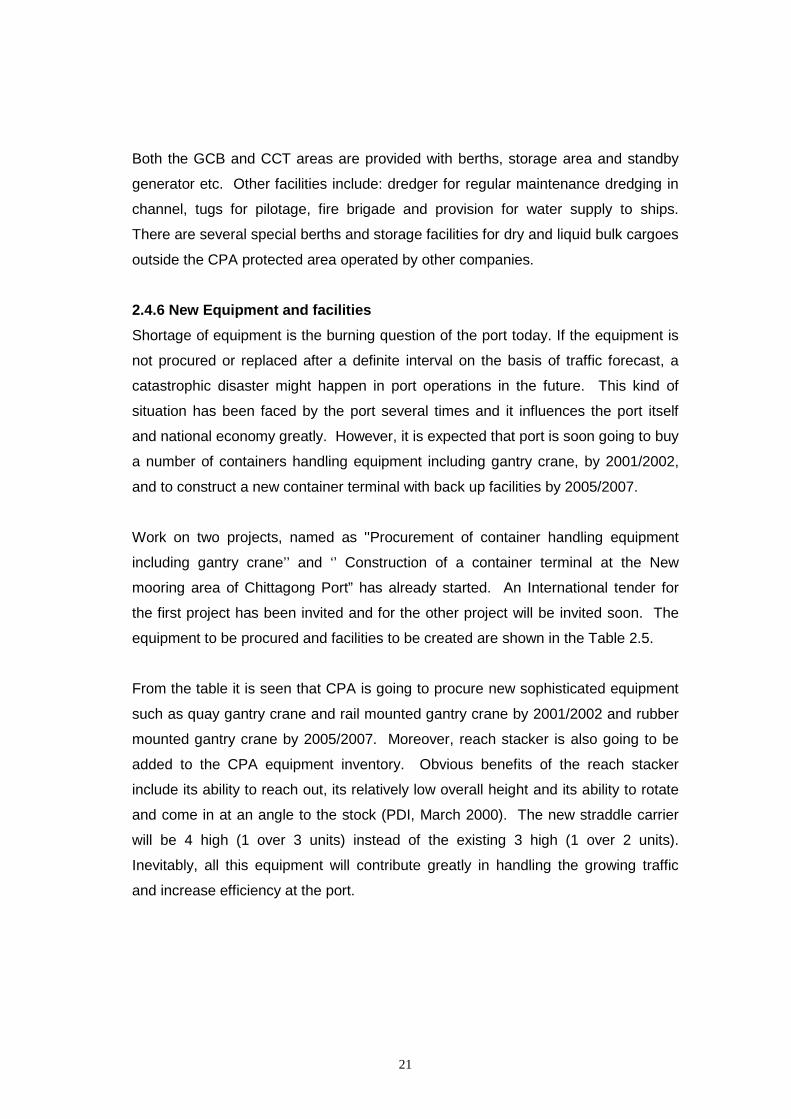
equipment to be procured and facilities to be created are shown in the Table 2.5.
From the table it is seen that CPA is going to procure new sophisticated equipment
such as quay gantry crane and rail mounted gantry crane by 2001/2002 and rubber
mounted gantry crane by 2005/2007. Moreover, reach stacker is also going to be
added to the CPA equipment inventory. Obvious benefits of the reach stacker
include its ability to reach out, its relatively low overall height and its ability to rotate
and come in at an angle to the stock (PDI, March 2000). The new straddle carrier
will be 4 high (1 over 3 units) instead of the existing 3 high (1 over 2 units).
Inevitably, all this equipment will contribute greatly in handling the growing traffic
and increase efficiency at the port.
22
Table 2.5 New facilities to be created by 2001/2002 and 2005/2007
Source: Project proforma, CPA, 1999
2.5 Equipment maintenanceMaintenance of equipment is the most important aspect of equipment productivity.
Equipment deteriorates and fails to attain its economical life because of poor
maintenance. Due to technological growth of equipment handling systems, much
sophisticated equipment has been procured by numerous ports to improve their
productivity. This equipment needs proper maintenance and management. In a
modern container terminal, the total equipment budget can amount to 45 % total
terminal budget operations (Toubhans, 1999, p. 45). CPA has both conventional
and modern equipment. As mentioned earlier, it has a big organizational structure
for the maintenance and management of equipment.
2.5.1 Methods and proceduresThere are three broad categories of maintenance: 1) Preventive maintenance, 2)
Corrective maintenance, and 3) Designing-out maintenance.
Preventive maintenance is mainly based on routine inspection of equipment at
scheduled time in order to avoid major breakdown of the equipment.
*C o n s tru c tio n o f N e w M o o rin g c o n ta in er te rm in a l b y 2 00 5 /20 0 7Len g th o f th e be rths (m ) 1 000S to rage a rea (m 2 ) 220 000*E q u ip m en t w ill b e p ro cu re d b y 2 00 1 /20 0 2 20 0 5 /2 0 07
p h a se -1 p h a se -2S h ip to s ho re G an try c ran e (4 0T ) 4 n il 4R a il m oun te d ya rd ga n try c rane (40 T ) 1 n il n ilR ubb er m oun te d ya rd ga n try c rane (40T ) n il n il 6S tra dd le c a rrie r (4 h ig h ) 1 3 3 4R eac h s ta ck e r (5 h igh ) 9 9 n ilF o rk lift truck s (12 -16 T ) n il 3 5Low m a s t fo rk lift truc k (2 .5T ) n il 5 n ilT e rm ina l tra c to r (5 0T ) 2 2 2 6 4 5(w ith tra ile r)T ra ile r (20 '/4 0 ') 2 7 1 7
23
Corrective maintenance involves mainly breakdown repairs resulting from irregular
component failures and damages due to accidents, which are caused by defective
components and human errors.
Designing-out maintenance is mainly set out to remove the need for maintenance.
At the CPA both preventive and corrective maintenance are done at its own
workshops. Designed-out maintenance is done rarely when there is a necessity to
improve/design a system in order to upgrade or prevent it from failure. Another type
of maintenance concerns attending very frequently to solve the running defects
during operation. This is called running maintenance.
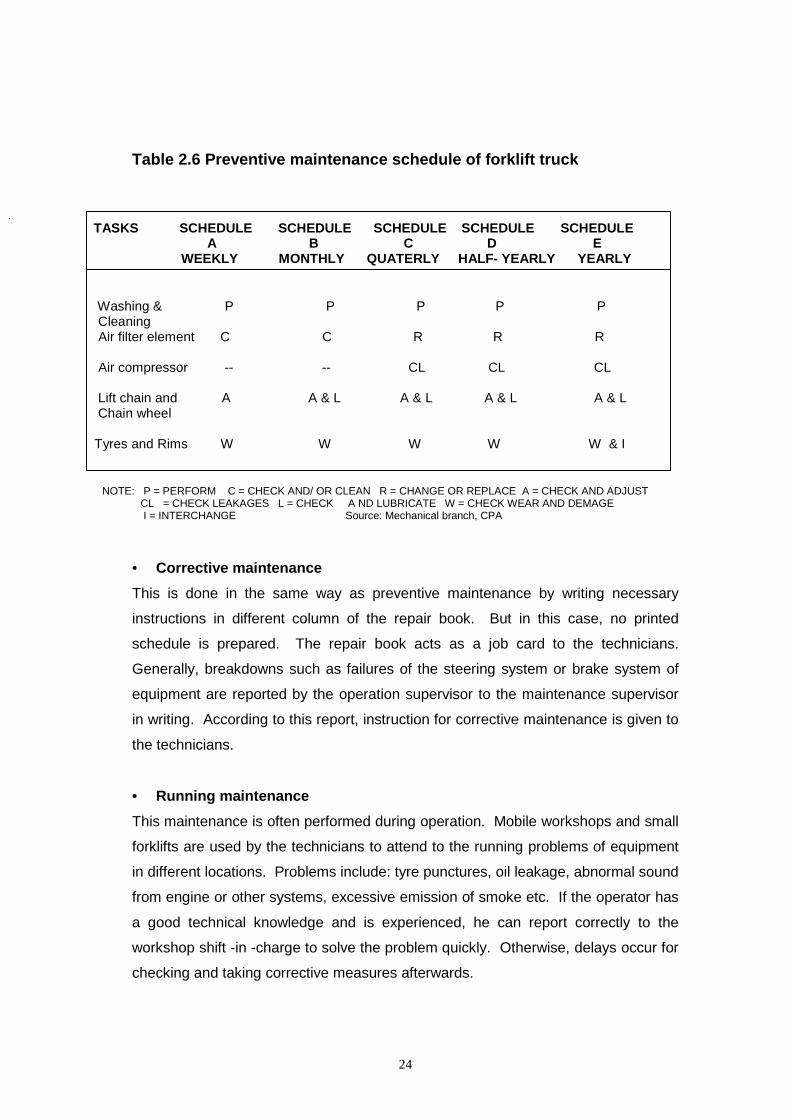
• Preventive maintenanceThis maintenance for all types of equipment is done according to a monthly
schedule prepared by the engineer in-charge at the end of every month. All
equipment is grouped by type and model in order to list out maintenance tasks to
prepare weekly, monthly, quarterly, half-yearly and yearly schedules according to
the manufacturers recommendations. These schedules are printed in ready-made
forms for instant use. Technicians assigned for doing maintenance work are
instructed by the supervisor giving instructions in a repair book where name, type of
maintenance (weekly or monthly, for example), and time of starting work are noted.
The repair book is used as a document instead of a job card for giving instructions to
the technicians and keeping records of all types of repairs. After finishing the work,
the technician fills out the respective form and deposits it with the supervisor with
the repair book, filling the columns of spare parts used, completion time and
signature.
Importance is given to perform this type of maintenance according to the time
schedule so that no equipment is left without maintenance. But, practically, due to
various constraints such as shortage of employees, absenteeism etc. only 60-70%
of the work is performed every month. The preventive maintenance schedule of a
general type is shown below (Table 2.6). This table shows how different tasks are
performed according to weekly, monthly, quarterly, half yearly and yearly schedules.
Same procedure is followed for other types of equipment.
24
Table 2.6 Preventive maintenance schedule of forklift truck
TASKS SCHEDULE SCHEDULE SCHEDULE SCHEDULE SCHEDULE A B C D E WEEKLY MONTHLY QUATERLY HALF- YEARLY YEARLY
Washing & P P P P P Cleaning Air filter element C C R R R
Air compressor -- -- CL CL CL
Lift chain and A A & L A & L A & L A & L Chain wheel
Tyres and Rims W W W W W & I
NOTE: P = PERFORM C = CHECK AND/ OR CLEAN R = CHANGE OR REPLACE A = CHECK AND ADJUST CL = CHECK LEAKAGES L = CHECK A ND LUBRICATE W = CHECK WEAR AND DEMAGE I = INTERCHANGE Source: Mechanical branch, CPA
• Corrective maintenanceThis is done in the same way as preventive maintenance by writing necessary
instructions in different column of the repair book. But in this case, no printed
schedule is prepared. The repair book acts as a job card to the technicians.
Generally, breakdowns such as failures of the steering system or brake system of
equipment are reported by the operation supervisor to the maintenance supervisor
in writing. According to this report, instruction for corrective maintenance is given to
the technicians.
• Running maintenanceThis maintenance is often performed during operation. Mobile workshops and small
forklifts are used by the technicians to attend to the running problems of equipment
in different locations. Problems include: tyre punctures, oil leakage, abnormal sound
from engine or other systems, excessive emission of smoke etc. If the operator has
a good technical knowledge and is experienced, he can report correctly to the
workshop shift -in -charge to solve the problem quickly. Otherwise, delays occur for
checking and taking corrective measures afterwards.
25
• Working hoursThe daily working hours of the maintenance staff are 8 hours, called general shift
from 7-30 to 16-30hrs excluding one-hour interval for lunch. Generally,
maintenance work is done during the general shift, but some maintenance staff are
booked in two shifts, 6.00 to 14.00 and 14.00 to 22.00 hrs to attend to emergencies
and the running repairs of two shift operations. Since CPA does not have sufficient
and good equipment to meet the traffic demand of everyday, some maintenance
staff has to be booked daily including on weekly and government holidays on
overtime to attend to the breakdown of equipment.
• Spares and storesSpares and stores are the key points of maintenance. All spare parts issued are
entered in the register as per requisition slip/form from the maintenance supervisor
to store keeper. About 95% of spare parts are imported mainly from equipment
suppliers in foreign countries and the remaining spares are procured locally from
local suppliers. Demand for the foreign spares is placed in the beginning of the year.
It takes a minimum of 6 months to 1 year or even more to procure the spares, which
disturbs the maintenance work badly. Computerization of all spare parts is going on
in different workshops but not in a planned manner.
2.5.2 Maintenance by local workshopsThere are shortages of some special categories of skilled people and facilities in
CPA workshops. Sometimes assistance such as machining works and special tools
are needed from the out sources to perform engine and transmission overhauling,
fuel pump repairs and other special jobs. Engine machining work is done on a
yearly contract basis by the local workshops. Some spare parts are manufactured
by some local reputed workshops in an emergency, though the longevity of these
parts is not the same as the original ones.
26
2.6 Equipment booking and operation 2.6.1 Booking and operation systemThe booking of Cargo handling equipment is done from respective zonal workshops.
The traffic department of CPA is mainly responsible for the operation of equipment
after booking. According to the requisition received from the traffic department,
equipment is booked to specific locations. The daily booking position is sent to
higher management and operation department (Appendix 5).
Before putting into operation, each equipment operator has to check the equipment,
called pre-operational checks, as specified in the check list book. The main items of
checklist book are physical condition of the equipment such as condition of tyres,
battery, any oil leakage, functions of different levers and switches of panel board
inside operator’s cabin including brakes, steering, lifting systems and all oil and fuel
levels in the tanks.
2.6.2 Working procedures and working time Operators are under the direct control of mechanical branch but they have to obey
the orders and instructions of traffic officers during operation. If there is any
requirement for repairs and maintenance during the operational period, the
equipment operator sends a message to the shift in-charge at the workshop by
wireless set fitted on the equipment. The shift in-charge takes the necessary step
for repairs either by sending a technician to the site or bringing back the equipment
to the workshop. Two mobile workshops are available at two zonal workshops to
attend running repairs at the sites.
Cargo operations are carried out in two shifts (day and night) but there are
provisions for doing work after shifts, called evening through and morning through.
Since the port is open for 24 hours, the operators have to do this work as overtime
during emergency periods such as the sailing schedule of ships, exporting
perishable goods or importing emergency spares or raw materials for industries.
Every shift is for 8 hours excluding intervals for lunch/dinner.
27
2.7 Analysis of equipment performance and productivityEquipment performance and productivity are closely related. According to Francou
(1999), performance means the total optimization of all elements related to the
equipment to get the desired productivity. Productivity of equipment is mainly based
on performance of maintenance and operation. The yearly maintenance
performance and utilization of general and container handling equipment for 1999 is
summarized in the Tables 2.7 & 2.8. Another Table 2.9 shows the demand
availability of container handling equipment. The tables are discussed in the
following sections of maintenance and operation performance.
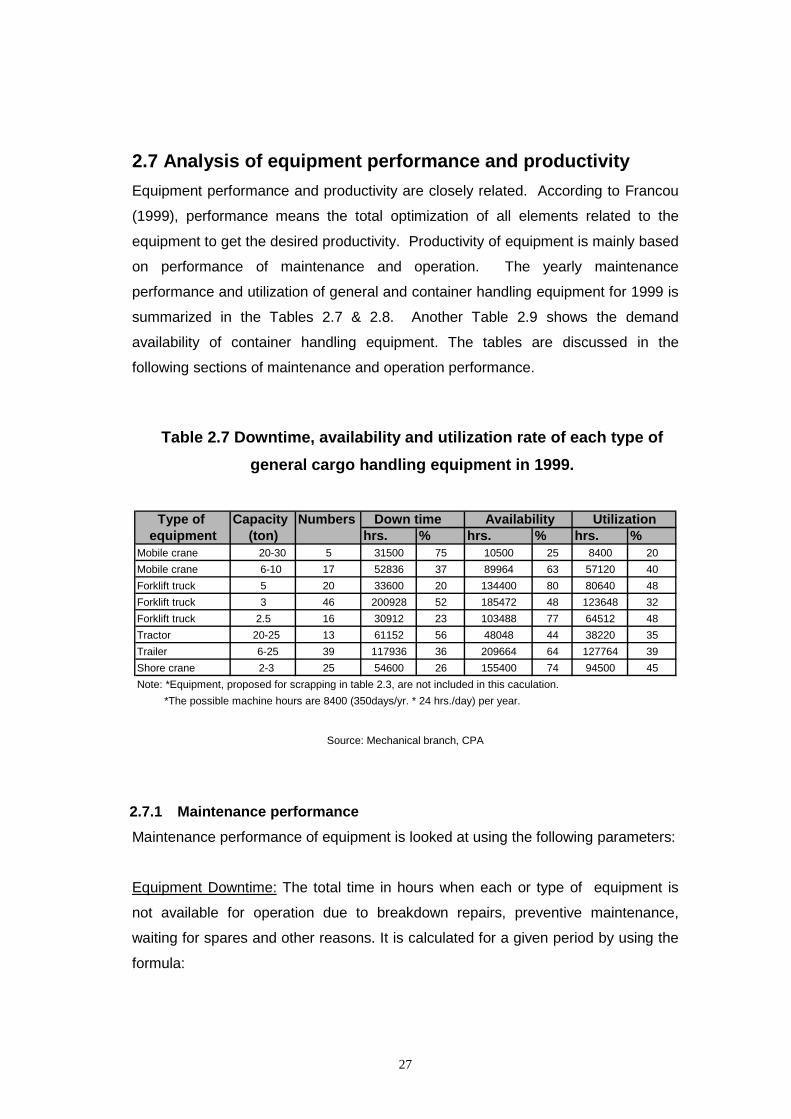
Table 2.7 Downtime, availability and utilization rate of each type ofgeneral cargo handling equipment in 1999.
Source: Mechanical branch, CPA
2.7.1 Maintenance performanceMaintenance performance of equipment is looked at using the following parameters:
Equipment Downtime: The total time in hours when each or type of equipment is
not available for operation due to breakdown repairs, preventive maintenance,
waiting for spares and other reasons. It is calculated for a given period by using the
formula:
Type of Capacity Numbers Down time Availability Utilizationequipment (ton) hrs. % hrs. % hrs. %
Mobile crane 20-30 5 31500 75 10500 25 8400 20Mobile crane 6-10 17 52836 37 89964 63 57120 40Forklift truck 5 20 33600 20 134400 80 80640 48Forklift truck 3 46 200928 52 185472 48 123648 32Forklift truck 2.5 16 30912 23 103488 77 64512 48Tractor 20-25 13 61152 56 48048 44 38220 35Trailer 6-25 39 117936 36 209664 64 127764 39Shore crane 2-3 25 54600 26 155400 74 94500 45Note: *Equipment, proposed for scrapping in table 2.3, are not included in this caculation. *The possible machine hours are 8400 (350days/yr. * 24 hrs./day) per year.
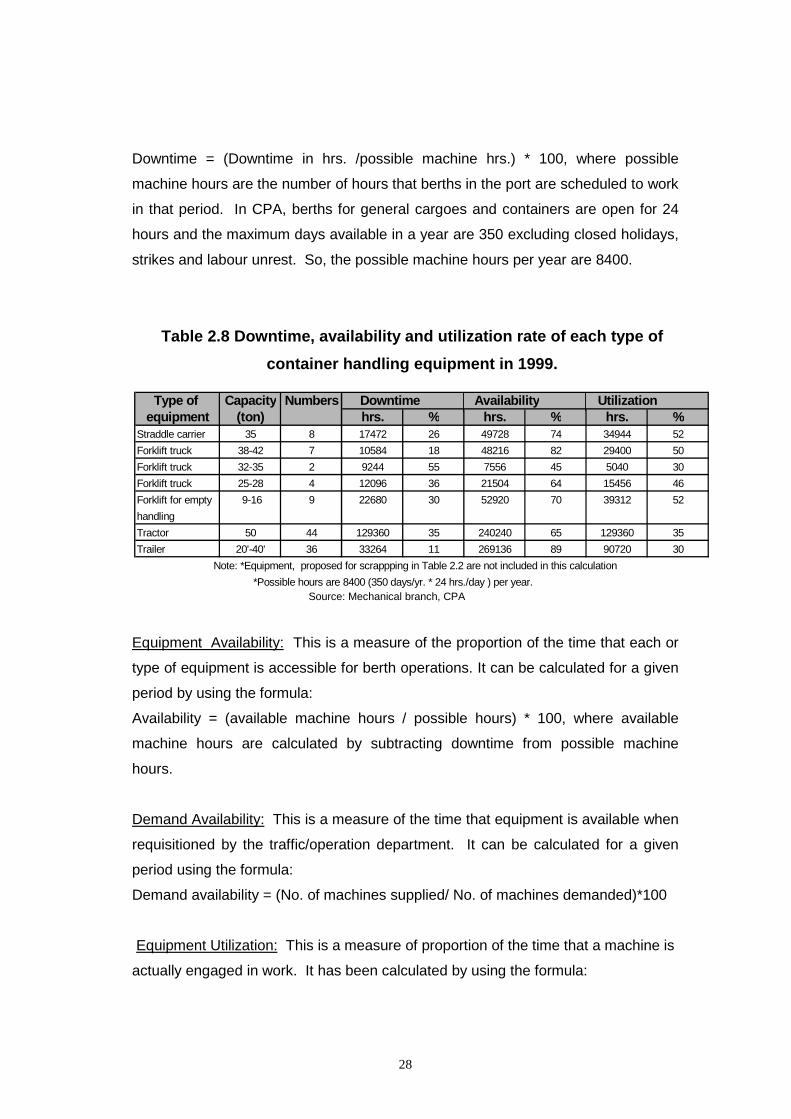
28
Downtime = (Downtime in hrs. /possible machine hrs.) * 100, where possible
machine hours are the number of hours that berths in the port are scheduled to work
in that period. In CPA, berths for general cargoes and containers are open for 24
hours and the maximum days available in a year are 350 excluding closed holidays,
strikes and labour unrest. So, the possible machine hours per year are 8400.
Table 2.8 Downtime, availability and utilization rate of each type ofcontainer handling equipment in 1999.
Source: Mechanical branch, CPA
Equipment Availability: This is a measure of the proportion of the time that each or
type of equipment is accessible for berth operations. It can be calculated for a given
period by using the formula:
Availability = (available machine hours / possible hours) * 100, where available
machine hours are calculated by subtracting downtime from possible machine
hours.
Demand Availability: This is a measure of the time that equipment is available when
requisitioned by the traffic/operation department. It can be calculated for a given
period using the formula:
Demand availability = (No. of machines supplied/ No. of machines demanded)*100
Equipment Utilization: This is a measure of proportion of the time that a machine is
actually engaged in work. It has been calculated by using the formula:
Type of Capacity Numbers Downtime Availability Utilizationequipment (ton) hrs. % hrs. % hrs. %
Straddle carrier 35 8 17472 26 49728 74 34944 52Forklift truck 38-42 7 10584 18 48216 82 29400 50Forklift truck 32-35 2 9244 55 7556 45 5040 30Forklift truck 25-28 4 12096 36 21504 64 15456 46Forklift for empty 9-16 9 22680 30 52920 70 39312 52handling Tractor 50 44 129360 35 240240 65 129360 35Trailer 20'-40' 36 33264 11 269136 89 90720 30 Note: *Equipment, proposed for scrappping in Table 2.2 are not included in this calculation *Possible hours are 8400 (350 days/yr. * 24 hrs./day ) per year.
29
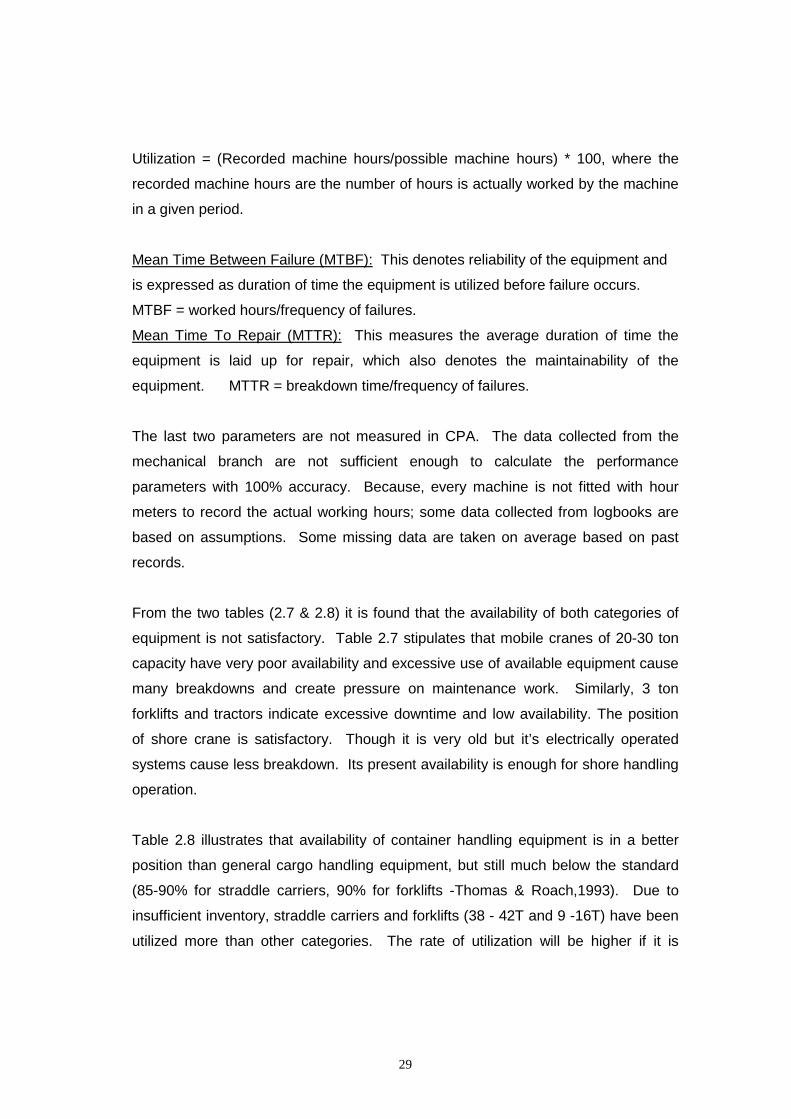
Utilization = (Recorded machine hours/possible machine hours) * 100, where the
recorded machine hours are the number of hours is actually worked by the machine
in a given period.
Mean Time Between Failure (MTBF): This denotes reliability of the equipment and
is expressed as duration of time the equipment is utilized before failure occurs.
MTBF = worked hours/frequency of failures.
Mean Time To Repair (MTTR): This measures the average duration of time the
equipment is laid up for repair, which also denotes the maintainability of the
equipment. MTTR = breakdown time/frequency of failures.
The last two parameters are not measured in CPA. The data collected from the
mechanical branch are not sufficient enough to calculate the performance
parameters with 100% accuracy. Because, every machine is not fitted with hour
meters to record the actual working hours; some data collected from logbooks are
based on assumptions. Some missing data are taken on average based on past
records.
From the two tables (2.7 & 2.8) it is found that the availability of both categories of
equipment is not satisfactory. Table 2.7 stipulates that mobile cranes of 20-30 ton
capacity have very poor availability and excessive use of available equipment cause
many breakdowns and create pressure on maintenance work. Similarly, 3 ton
forklifts and tractors indicate excessive downtime and low availability. The position
of shore crane is satisfactory. Though it is very old but it’s electrically operated
systems cause less breakdown. Its present availability is enough for shore handling
operation.
Table 2.8 illustrates that availability of container handling equipment is in a better
position than general cargo handling equipment, but still much below the standard
(85-90% for straddle carriers, 90% for forklifts -Thomas & Roach,1993). Due to
insufficient inventory, straddle carriers and forklifts (38 - 42T and 9 -16T) have been
utilized more than other categories. The rate of utilization will be higher if it is
30
calculated with respect to actual available hours per year (available machine hours –
non-working hours for lunch/dinner) rather than possible machine hours per year.
The two tables clearly show that both types of equipment have considerable
downtime. The causes of downtime are mainly due to aged machines, lack of
workshop performance, bad driving practices, shortage of spare parts, working
environment, weather condition etc. On the other hand, poor utilization of some of
the equipment categories of both types is due to excessive idle time. Idle time is the
available hours that are lost due to administrative procedures, bad weather,
spending more time by the operators and labours for lunch/dinner etc.
On the other hand, Table 2.9 shows that during 6 months period almost all
categories of equipment have less supply against demand which indicates
considerable shortage of operable equipment in CPA.
Table 2.9 Demand availability of container handling equipment, April-Sept./99
Note: Generally demand has been placed based on existing inventory. It does not truly reflect the needs
Source: Mechanical branch, CPA
All machines for cargo handling have been procured under perfect competition from
reputed manufacturers as said before. Satisfactory performances have been found
from most of the machines and after sales services of the manufacturers were good.
But because of many factors that will be discussed latter, timely maintenance of
engines, transmissions, lifting systems, etc. according to manufacturer’s
recommendations, is not performed which increases downtime and reduces the
performances of these systems substantially.
Equipment Capacity Total demanded Total supplied % Availabilitytype (ton) numbers numbers against demandStraddle carrier 35 2280 1506 66Forklift truck 38-42 2244 1740 78Forklift truck 32-35 744 144 19Forklift truck 25-28 2232 1158 52Forklift truck 9-16 1860 738 40Tractor-trailer 50 13020 4626 36
31
Utilization of labour force: Proper utilization of manpower is an important criterion
for measuring performance of maintenance of equipment. It can be calculated by
measuring annual utilized man-hours and annual man-hours available. But officially
this is also not measured. In CPA many hours are lost due to internal and external
factors such as unauthorized absence, bad weather, political and trade union strikes
and huge amount of public and private holidays. However, a simple analysis of
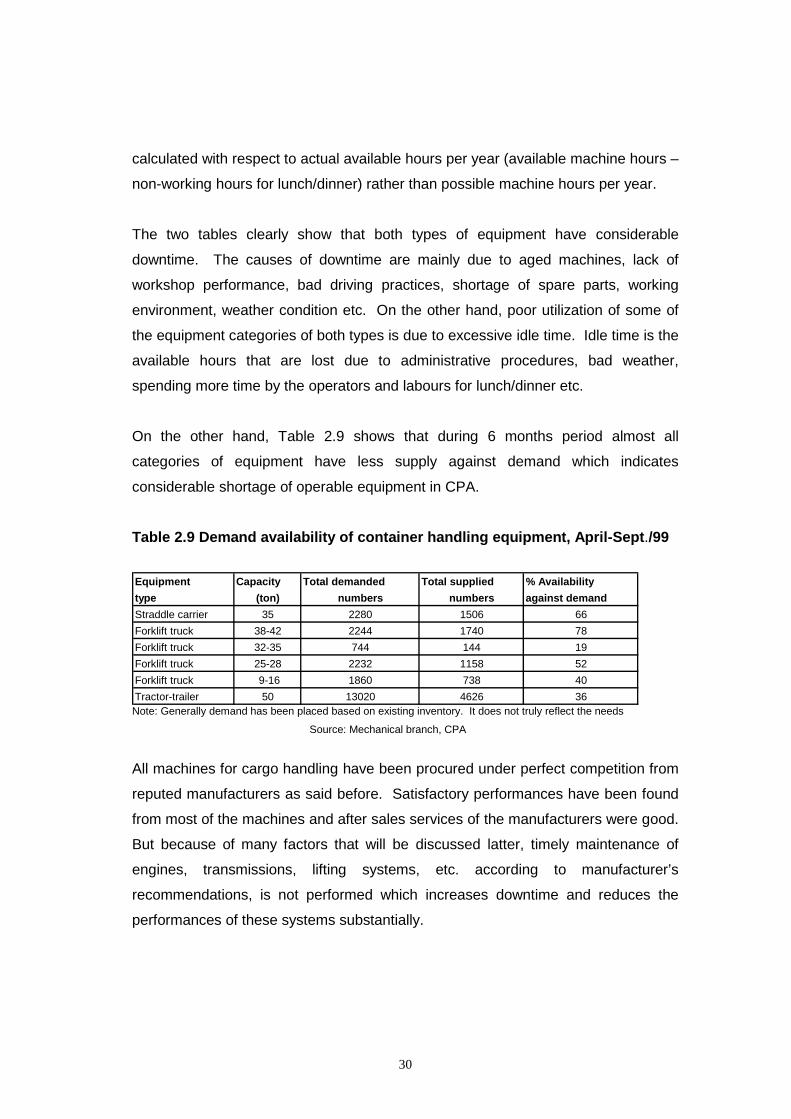
different types of leave and holidays ( Table 2.10) for workshop employees shows
that in a year more than 50% of the days are spent on leave, including government
and weekly holidays. The excessive leave provision sometimes creates a terrible
situation for maintenance and operation.
Table 2.10 List of holidays and leave in CPA
Name of annual leave and holidays days Casual leave 20
Earned leave 33
Medical leave 16
Optional holidays 3
Government holidays 27
Weekly holidays 104
Total 203
Source: CPA
The above parameters/indicators can be useful for measuring the maintenance
performance/efficiency of CPA equipment.
2.7.2 Operational performanceThe berth operations, ship operation, transfer operation, storage operation and
receipt/delivery operation are directly connected with operational performance of the
equipment. The total operational performances of CPA are summarized in the
following (Table 2.11).
32
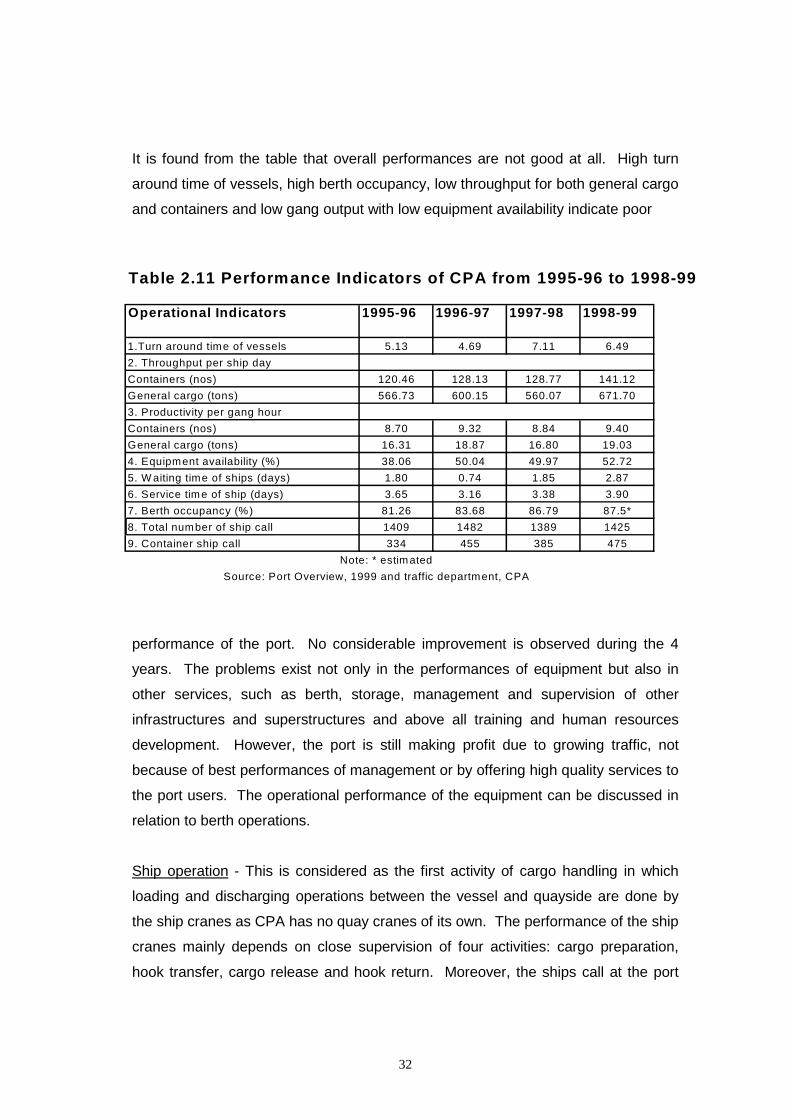
It is found from the table that overall performances are not good at all. High turn
around time of vessels, high berth occupancy, low throughput for both general cargo
and containers and low gang output with low equipment availability indicate poor
performance of the port. No considerable improvement is observed during the 4
years. The problems exist not only in the performances of equipment but also in
other services, such as berth, storage, management and supervision of other
infrastructures and superstructures and above all training and human resources
development. However, the port is still making profit due to growing traffic, not
because of best performances of management or by offering high quality services to
the port users. The operational performance of the equipment can be discussed in
relation to berth operations.
Ship operation - This is considered as the first activity of cargo handling in which
loading and discharging operations between the vessel and quayside are done by
the ship cranes as CPA has no quay cranes of its own. The performance of the ship
cranes mainly depends on close supervision of four activities: cargo preparation,
hook transfer, cargo release and hook return. Moreover, the ships call at the port
Table 2.11 Performance Indicators of CPA from 1995-96 to 1998-99
Operational Indicators 1995-96 1996-97 1997-98 1998-99
1.Turn around time of vessels 5.13 4.69 7.11 6.492. Throughput per ship dayContainers (nos) 120.46 128.13 128.77 141.12General cargo (tons) 566.73 600.15 560.07 671.703. Productivity per gang hourContainers (nos) 8.70 9.32 8.84 9.40General cargo (tons) 16.31 18.87 16.80 19.034. Equipment availability (%) 38.06 50.04 49.97 52.725. W aiting time of ships (days) 1.80 0.74 1.85 2.876. Service time of ship (days) 3.65 3.16 3.38 3.907. Berth occupancy (%) 81.26 83.68 86.79 87.5*8. Total number of ship call 1409 1482 1389 14259. Container ship call 334 455 385 475 Note: * estimated Source: Port Overview, 1999 and traffic department, CPA
33
are conventional types and their cranes and derricks are not efficient to receive and
delivery the cargoes/containers promptly. The gang performance at the port is not
satisfactory because of poor control and unskilled labour in the gangs. The gangs
are not properly trained for handling different types of cargo applicable to different
size and pattern of ships. They are neither paid well or offered good incentives
compared to developed ports. Their regular income is not more than US$ 3 per day
and also there is no assurance of work everyday.
Quay transfer operation - This links shipboard activities with transit shed or
warehouses or storage yards. Carefully equipping and planning of the transfer
operation is often the most effective single method of measuring ship-handling
productivity. Since, 1991 the port has been using straddle carriers and their
performance is quite satisfactory. It has been found that because of equipment non-
availability in transfer operation a serious congestion results, which slows down not
only berth operations but also normal equipment performance. For example, if a
tractor-trailer enters the gate for taking delivery of a container in peak period, it takes
long time, even 7-8 hours due to long queue at the gate.
Storage operation – This operation provides a buffer between the ship operation and
receiving/delivery operation. The efficiency of storage operation depends on the lay
out of the yard/shed, equipment availability, documentation and supervision and
coordination of the four operations. Excessive dwell time at the sheds and yards
often creates congestion at the port and reduces the efficiency of equipment as well
as total berth operations.
Receiving and delivery operation - This operation is also a link in the chain of the
other three operations. Control of movements inside the port protected area is not
strict and gate controls for the transport arrivals and departures are very poor due to
unplanned security management. Moreover, custom formalities and port
documentation system along with non-availability of equipment retards the whole
operation considerably.
.
34
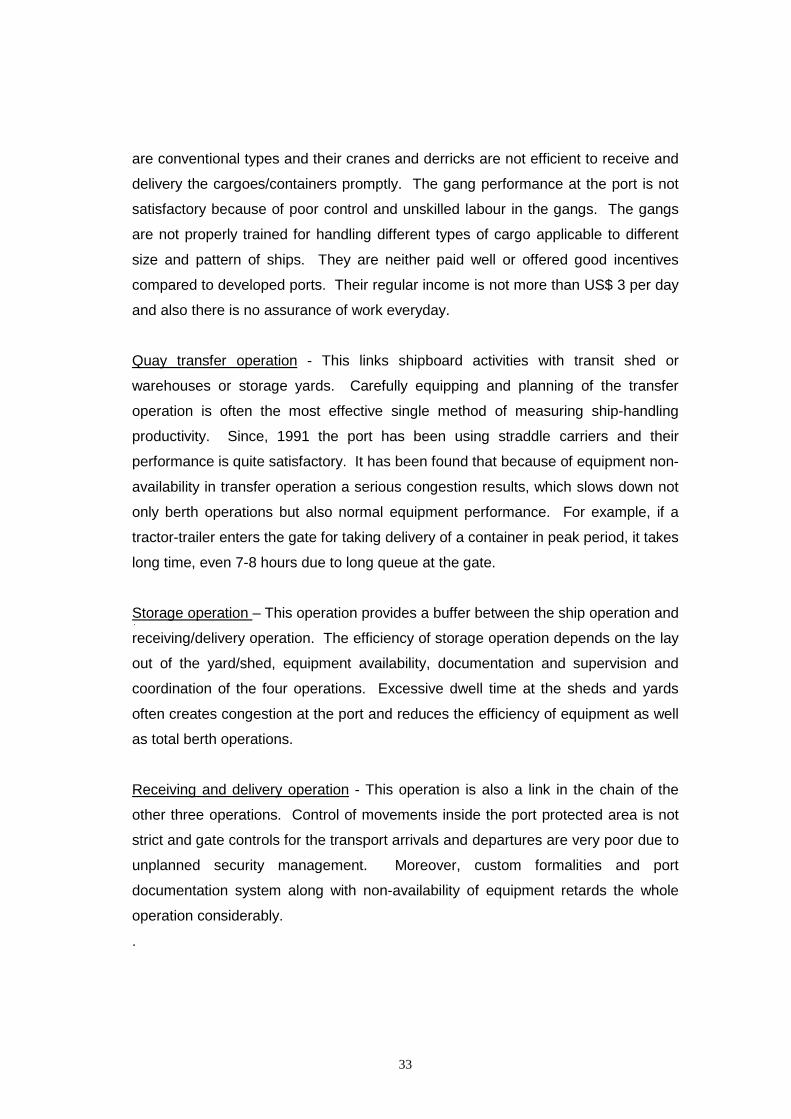
2.7.3 Cost-benefit of equipmentTo calculate the cost-benefit of equipment proper records of costs and benefits of
each piece of machine is essential. In CPA, up to date records of costs of different
types of equipment are not available. On the other hand, CPA tariff structure is such
that tariff is not charged equipment-wise directly. According to tariff schedule, tariffs
are charged on loading/unloading/stuffing/unstuffing/lift-on/lift-off etc. heads for
handling different status of containers. The charges on container handling
equipment are also included in these charges.
However, efforts are taken to calculate the annual/hourly operating costs of 3 main
types of CPA container handling equipment for the year 1998 (Table 2.12). Annual
operating costs is an important parameter to find the economic life of equipment
Random-sampling method is applied for this calculation. To find out average annual
operating cost, three machines are selected from each type and after aggregating
the annual operating costs, average yearly operating costs of each type and each
machine are calculated. All data related with this calculation is collected from the
different records but 10% confused data is estimated.
Table 2.12 Hourly operating cost (in USD) of equipment
Note: Percentage shown below costs is the percentage of annual operating costs, all costs are in US $Source: Compilation of data from mechanical branch and author’s experience
The table shows that the annual operating cost is the summation of annual running
costs and annual maintenance costs. The average hourly operating cost is
calculated dividing aggregate annual operating costs of 3 machines by total annual
Type of Annual running costs Annual maintenance costs Annual Annual Hourly equipment Fuel/power Labour Spares Consumable Labour operating operating operating
costs hours costsStraddle carrier 20000 4000 27000 2000 3000 56000 4200 13(35T) 36% 7% Total = 32000 (57%)Forklift truck 16000 4000 20000 1400 3000 44400 3700 12(38T) 36% 9% Total = 24400 (55%)Terminal tractor 4000 3000 4500 1000 2500 15000 1800 8(50T) 27% 20% Total = 8000 (53%)
35
operating hours. In this calculation, overhead cost is not included. The main feature
of this calculation is that labour costs in CPA are very low in comparison with other
costs. For example, the average salary and allowances per month of each
operator/maintenance staff is 150 USD only.
Finally, it can be said that for total cost-benefit analysis of CPA equipment, the
calculation of costs of other infra-structure facilities, berths, yards, roads and other
inputs which have been used for the equipment, need to be taken into consideration
as partial expenses. So, it is difficult to find out separately the cost and benefit of
equipment.
However, after finding the yearly operating cost of the equipment, the economic life
of the equipment may be calculated as discussed latter, which could be a good
measure of performance for the management’s guidance.
2.8 Training and human resources developmentAbout 500 employees are involved in the management, maintenance and operation
of cargo handling equipment under the mechanical branch. The staff directly
involved with maintenance and operation of equipment, are offered training by the
experts of equipment suppliers or CPA personnel trained for this purpose, after
procurement of the new equipment. The training courses last for 2 or 3 weeks. A
human resource development project was accomplished by CPA in 1989-90 to
develop its people in various fields, which was conducted by Louis Berger
International Inc., USA. At that time, the consultants offered training to different
categories of maintenance staff, operators and management personnel, and
developed some training instructors and gave some recommendations for the future
training activities. The development of human resources relates to every aspect of
the ports relating with its personnel: recruitment, integration, supervision, allocation
of tasks, remuneration, assignments, transfer, promotion and training. There are
bottlenecks in almost all of these subjects. Here, mainly, the training aspects of
human resource development are discussed.
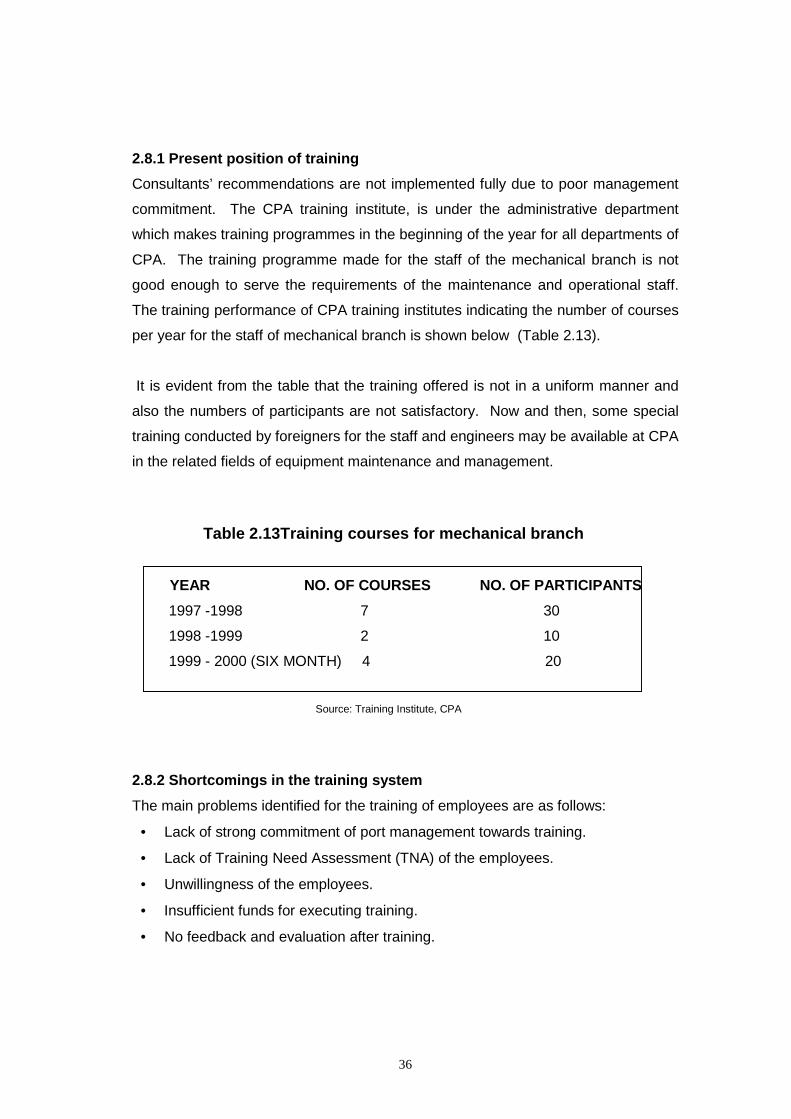
36
2.8.1 Present position of trainingConsultants’ recommendations are not implemented fully due to poor management
commitment. The CPA training institute, is under the administrative department
which makes training programmes in the beginning of the year for all departments of
CPA. The training programme made for the staff of the mechanical branch is not
good enough to serve the requirements of the maintenance and operational staff.
The training performance of CPA training institutes indicating the number of courses
per year for the staff of mechanical branch is shown below (Table 2.13).
It is evident from the table that the training offered is not in a uniform manner and
also the numbers of participants are not satisfactory. Now and then, some special
training conducted by foreigners for the staff and engineers may be available at CPA
in the related fields of equipment maintenance and management.
Table 2.13Training courses for mechanical branch
YEAR NO. OF COURSES NO. OF PARTICIPANTS 1997 -1998 7 30
1998 -1999 2 10
1999 - 2000 (SIX MONTH) 4 20
Source: Training Institute, CPA
2.8.2 Shortcomings in the training systemThe main problems identified for the training of employees are as follows:
• Lack of strong commitment of port management towards training.
• Lack of Training Need Assessment (TNA) of the employees.
• Unwillingness of the employees.
• Insufficient funds for executing training.
• No feedback and evaluation after training.
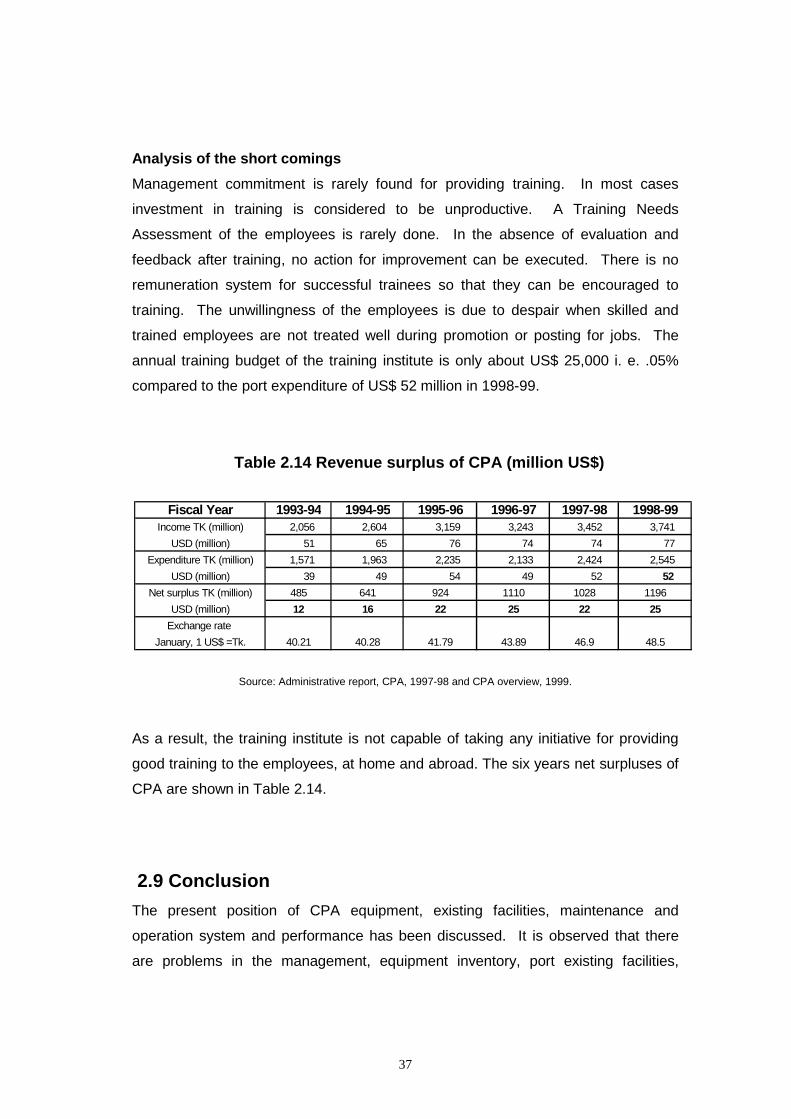
37
Analysis of the short comingsManagement commitment is rarely found for providing training. In most cases
investment in training is considered to be unproductive. A Training Needs
Assessment of the employees is rarely done. In the absence of evaluation and
feedback after training, no action for improvement can be executed. There is no
remuneration system for successful trainees so that they can be encouraged to
training. The unwillingness of the employees is due to despair when skilled and
trained employees are not treated well during promotion or posting for jobs. The
annual training budget of the training institute is only about US$ 25,000 i. e. .05%
compared to the port expenditure of US$ 52 million in 1998-99.
Table 2.14 Revenue surplus of CPA (million US$)
Source: Administrative report, CPA, 1997-98 and CPA overview, 1999.
As a result, the training institute is not capable of taking any initiative for providing
good training to the employees, at home and abroad. The six years net surpluses of
CPA are shown in Table 2.14.
2.9 ConclusionThe present position of CPA equipment, existing facilities, maintenance and
operation system and performance has been discussed. It is observed that there
are problems in the management, equipment inventory, port existing facilities,
Fiscal Year 1993-94 1994-95 1995-96 1996-97 1997-98 1998-99Income TK (million) 2,056 2,604 3,159 3,243 3,452 3,741
USD (million) 51 65 76 74 74 77 Expenditure TK (million) 1,571 1,963 2,235 2,133 2,424 2,545
USD (million) 39 49 54 49 52 52 Net surplus TK (million) 485 641 924 1110 1028 1196
USD (million) 12 16 22 25 22 25Exchange rate
January, 1 US$ =Tk. 40.21 40.28 41.79 43.89 46.9 48.5
38
manpower training and equipment maintenance and operation. It is paramount to
analyze the details of the problems in order to find out solutions in these fields. So,
the subsequent chapter tries to explain the internal and external problems/factors
affecting performance of equipment.
39
CHAPTER 3
FACTORS INFLUENCING EQUIPMENT PRODUCTIVITY
3.1 IntroductionCargo handling equipment is an integral part of port operation. Port performance /
productivity can not reach its desired goal without equipment performance. This
performance solely depends upon management, more specifically on management
of equipment, maintenance and operation systems. The system is handicapped
most frequently by internal and external forces. Internal forces are active within the
system and inside the port, external forces influence the system from outside the
port.
CPA has about 8000 permanent employees of its own placed in 15 departments,
besides, the nearly 20 thousand people under different categories of port users
including 10 thousand daily rated registered dock labours, are directly or indirectly
involved with the port in various ways. The mechanical branch, responsible for
maintenance of the equipment, has to maintain good relations among other
departments in order to continue uninterrupted port operations. CPA lies in the
heart of Chittagong, the second largest city of Bangladesh with 3.5 million people.
Near the port lies the country’s largest Export Processing Zone (EPZ). As a result,
any disturbance in the city or surrounding industrial zone influences port operations.
Also the PEST factors influence considerably. This chapter attempts to identify and
analyze such factors including the inherent problems of equipment maintenance
and the operations.
40
3.2 Port and Equipment ManagementPort and equipment management are closely related to each other. Both play a vital
role in port cargo handling equipment productivity. The main objective of the port in
regards to cargo handling equipment is to give cost-effective services to the port
users through performance of international standards. For this reason, port
management has great responsibility to ensure the acquisition of equipment in time
and to maintain it properly in order to cope with the operational demand.
Equipment inventory and traffic forecasting, the two main aspects of port operations
are planned by the planning department of CPA with the assistance of equipment
and operation management. Nowadays, a good amount of port investment is
needed for the acquisition of modern cargo handling equipment to suit the growing
technological developments in port and shipping. After acquisition, continuous and
effective maintenance demands a huge investment and high quality management. If
the equipment management responsible for the maintenance of equipment fails to
maintain the equipment effectively, the following effects could occur:
• Low equipment availability
• Additional investment
• Additional maintenance and operating costs
• Low equipment productivity/ performance
• Lower competitiveness of the port
• Impact on country’s economy
In fact, CPA has been suffering from problems on account of these factors for a long
time. One can not guess from the outside that the port is facing problems because it
has good financial reserves, growing traffic and a lot of activities compared to other
organizations. But port performance indicators (Table 2.11) stipulate that no
parameter is the sign of actual progress in the case of CPA. First of all, the internal
problems that exist in equipment maintenance and operation which directly influence
the equipment performance, need attention.
41
3.3 Factors directly affecting maintenance and operation The main factors are grouped under the following headings:
• Poor equipment inventory and too much old equipment
• No standard system of maintenance
• Non-availability of spare parts
• Poor supervision and control of maintenance work
• Poor leadership
• Lack of control and supervision of operators
• Bad driving practices
• Lack of skilled manpower
• Poor incentives and motivation schemes
• Shortage of technicians and operators
• Poor working environment
• Employee participation
Analysis of the Factors
• Poor equipment inventory and too much old equipmentThe state of cargo handling equipment (Tables 2.2 & 2.3) indicates the
management’s inability to maintain a proper equipment inventory. This is the job of
port management to ensure an adequate equipment inventory for smooth cargo
handling operations at all times. But in recent years, management has failed to do
this due to various reasons and constraints such as the inability to obtain timely
government approval, government interference, cumbersome bureaucratic
procedures, failure to forecast the future traffic etc. As a result, port has been facing
congestion frequently. How equipment shortage affect a port has been shown in
Table 3.1 This table illustrates only 15 straddle carriers in a terminal produced chaos
whereas 20 straddle carriers can serve the function smoothly with no congestion.
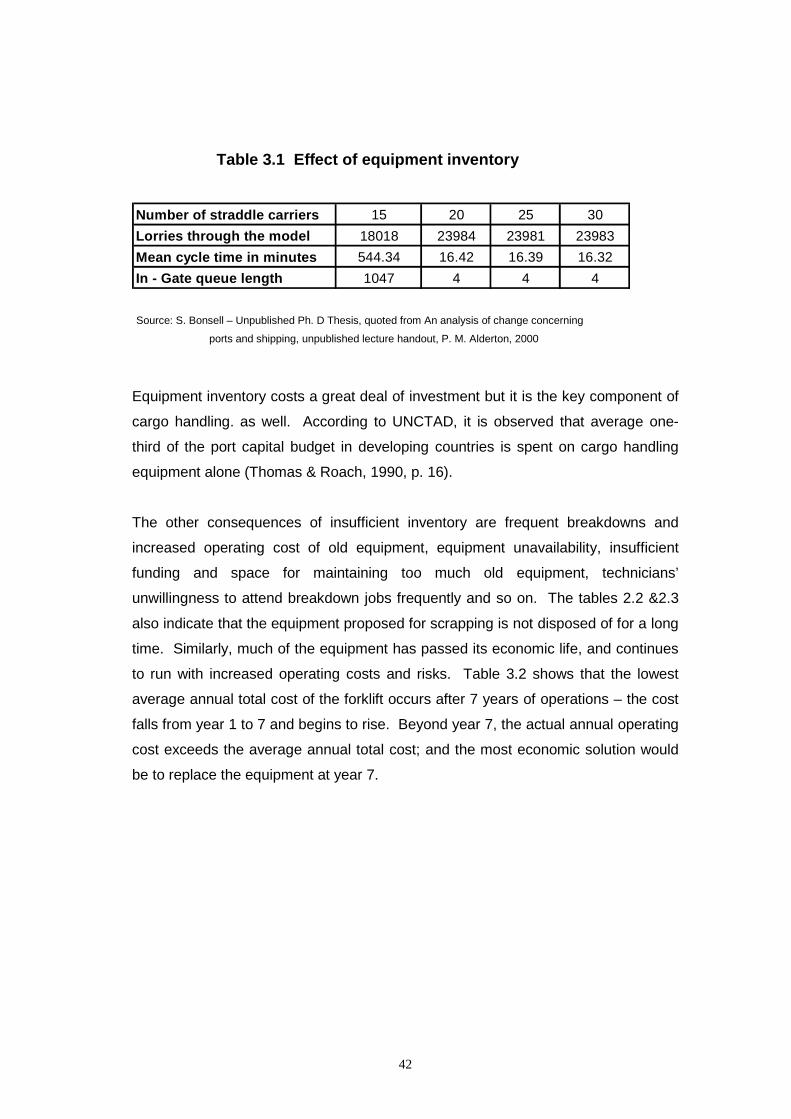
42
Table 3.1 Effect of equipment inventory
Source: S. Bonsell – Unpublished Ph. D Thesis, quoted from An analysis of change concerning
ports and shipping, unpublished lecture handout, P. M. Alderton, 2000
Equipment inventory costs a great deal of investment but it is the key component of
cargo handling. as well. According to UNCTAD, it is observed that average one-
third of the port capital budget in developing countries is spent on cargo handling
equipment alone (Thomas & Roach, 1990, p. 16).
The other consequences of insufficient inventory are frequent breakdowns and
increased operating cost of old equipment, equipment unavailability, insufficient
funding and space for maintaining too much old equipment, technicians’
unwillingness to attend breakdown jobs frequently and so on. The tables 2.2 &2.3
also indicate that the equipment proposed for scrapping is not disposed of for a long
time. Similarly, much of the equipment has passed its economic life, and continues
to run with increased operating costs and risks. Table 3.2 shows that the lowest
average annual total cost of the forklift occurs after 7 years of operations – the cost
falls from year 1 to 7 and begins to rise. Beyond year 7, the actual annual operating
cost exceeds the average annual total cost; and the most economic solution would
be to replace the equipment at year 7.
Number of straddle carriers 15 20 25 30Lorries through the model 18018 23984 23981 23983Mean cycle time in minutes 544.34 16.42 16.39 16.32In - Gate queue length 1047 4 4 4
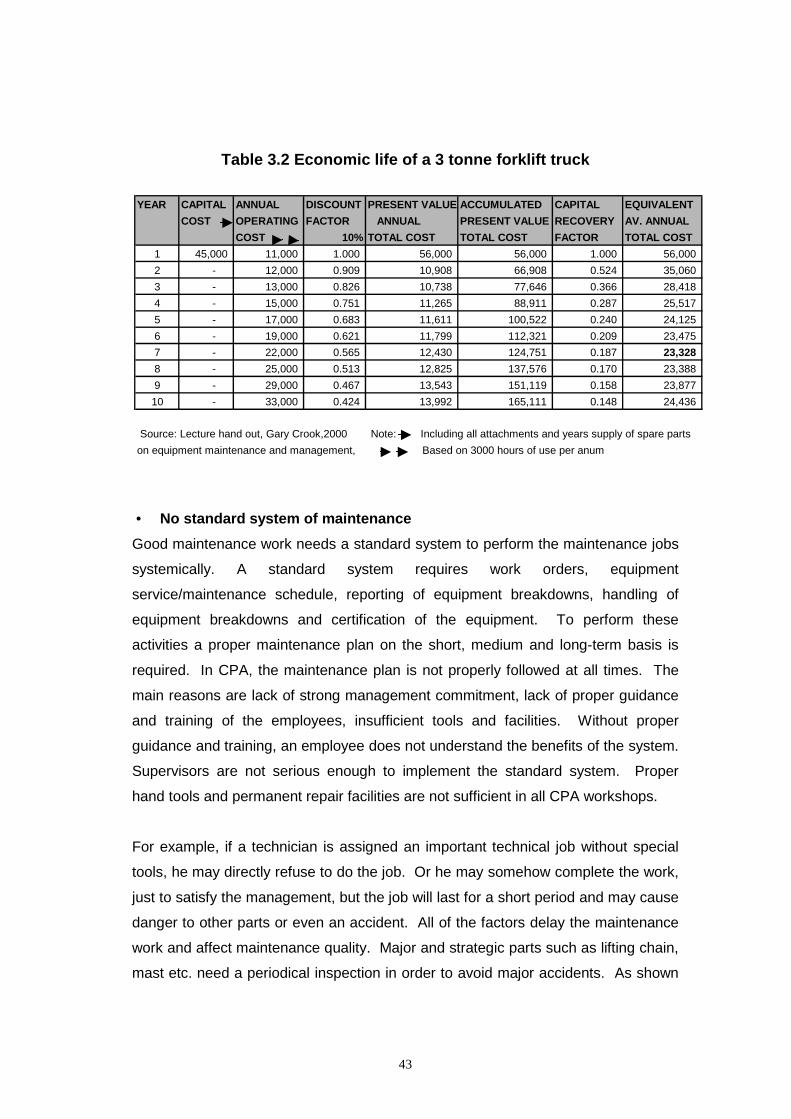
43
Table 3.2 Economic life of a 3 tonne forklift truck
• No standard system of maintenanceGood maintenance work needs a standard system to perform the maintenance jobs
systemically. A standard system requires work orders, equipment
service/maintenance schedule, reporting of equipment breakdowns, handling of
equipment breakdowns and certification of the equipment. To perform these
activities a proper maintenance plan on the short, medium and long-term basis is
required. In CPA, the maintenance plan is not properly followed at all times. The
main reasons are lack of strong management commitment, lack of proper guidance
and training of the employees, insufficient tools and facilities. Without proper
guidance and training, an employee does not understand the benefits of the system.
Supervisors are not serious enough to implement the standard system. Proper
hand tools and permanent repair facilities are not sufficient in all CPA workshops.
For example, if a technician is assigned an important technical job without special
tools, he may directly refuse to do the job. Or he may somehow complete the work,
just to satisfy the management, but the job will last for a short period and may cause
danger to other parts or even an accident. All of the factors delay the maintenance
work and affect maintenance quality. Major and strategic parts such as lifting chain,
mast etc. need a periodical inspection in order to avoid major accidents. As shown
YEAR CAPITAL ANNUAL DISCOUNT PRESENT VALUE ACCUMULATED CAPITAL EQUIVALENT COST OPERATING FACTOR ANNUAL PRESENT VALUE RECOVERY AV. ANNUAL
COST 10% TOTAL COST TOTAL COST FACTOR TOTAL COST1 45,000 11,000 1.000 56,000 56,000 1.000 56,000 2 - 12,000 0.909 10,908 66,908 0.524 35,060 3 - 13,000 0.826 10,738 77,646 0.366 28,418 4 - 15,000 0.751 11,265 88,911 0.287 25,517 5 - 17,000 0.683 11,611 100,522 0.240 24,125 6 - 19,000 0.621 11,799 112,321 0.209 23,475 7 - 22,000 0.565 12,430 124,751 0.187 23,328 8 - 25,000 0.513 12,825 137,576 0.170 23,388 9 - 29,000 0.467 13,543 151,119 0.158 23,877 10 - 33,000 0.424 13,992 165,111 0.148 24,436
Source: Lecture hand out, Gary Crook,2000 Note: Including all attachments and years supply of spare partson equipment maintenance and management, Based on 3000 hours of use per anum
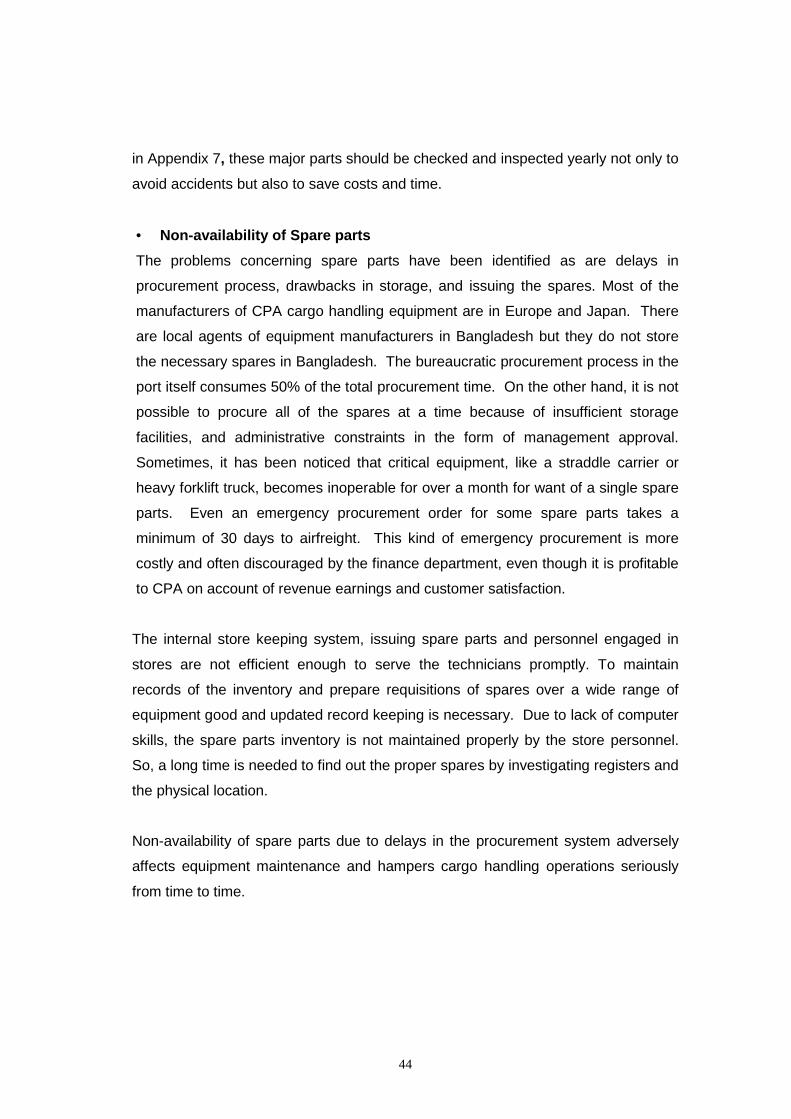
44
in Appendix 7, these major parts should be checked and inspected yearly not only to
avoid accidents but also to save costs and time.
• Non-availability of Spare partsThe problems concerning spare parts have been identified as are delays in
procurement process, drawbacks in storage, and issuing the spares. Most of the
manufacturers of CPA cargo handling equipment are in Europe and Japan. There
are local agents of equipment manufacturers in Bangladesh but they do not store
the necessary spares in Bangladesh. The bureaucratic procurement process in the
port itself consumes 50% of the total procurement time. On the other hand, it is not
possible to procure all of the spares at a time because of insufficient storage
facilities, and administrative constraints in the form of management approval.
Sometimes, it has been noticed that critical equipment, like a straddle carrier or
heavy forklift truck, becomes inoperable for over a month for want of a single spare
parts. Even an emergency procurement order for some spare parts takes a
minimum of 30 days to airfreight. This kind of emergency procurement is more
costly and often discouraged by the finance department, even though it is profitable
to CPA on account of revenue earnings and customer satisfaction.
The internal store keeping system, issuing spare parts and personnel engaged in
stores are not efficient enough to serve the technicians promptly. To maintain
records of the inventory and prepare requisitions of spares over a wide range of
equipment good and updated record keeping is necessary. Due to lack of computer
skills, the spare parts inventory is not maintained properly by the store personnel.
So, a long time is needed to find out the proper spares by investigating registers and
the physical location.
Non-availability of spare parts due to delays in the procurement system adversely
affects equipment maintenance and hampers cargo handling operations seriously
from time to time.
45
• Poor supervision and control of maintenance workThis is the most important factor that retards the maintenance work and increases
the chance of mistakes considerably. If supervisory staff do not monitor and control
the activities and do not give guidance to the workers, sometimes major mistakes
are committed leading to breakdowns and non-availability of equipment. In the
workshop maintenance organizational structure (Figure 3.1) it is found that there are
excessive supervisory levels (serial 3 to 5) between the engineers (serial 1&2)
responsible for overall management and supervision and the technicians (serial 6)
who actually do the work
Figure 3.1 Maintenance work organization in CPA workshops
Source: Author
1. EXECUTIVE ENGINEER (MECH)
2. ASSISTANTENGINEER (MECH)
3. SENIOR SUB- ASSISTANTENGINEER (MECH)
4. SUB- ASSISTANT ENGINEER
5 MISTRY
6. TECHNICIANGRADE 1,11& 111
7.SKILLED/UNSKILLED LABOUR/KHALASI
46
.As a result, the technician has to follow the orders of his immediate supervisor, but
this supervisor does not want to take all the responsibility of maintenance jobs
because there are three more supervisors on top of him. This shared responsibility
of supervision does not only result in poor maintenance but also leads to a lack of
flexibility and control over technicians.
• Poor leadershipPoor management leadership influences maintenance activities. Many managers
have little control over their staff; their commands are not honoured by the
employees in most cases. This problem is enlarged when disciplinary actions are
not handled properly because of deficiency in leadership qualities. Moreover, some
managers have a tendency of low-task/low-relationship (delegating) leadership
rather than low-task/high–relationship (participating) which increases the gap
between managers and employees (Ircha, 2000). Management and supervisory
personnel have fewer tendencies to inspect the assigned job of the employees i.e.
keeping in touch by spending time with as many as possible; known as MBWA
(Management By Wandering Around). The consequence is the increased
communication gap which reduces performance substantially.
• Lack of control and supervision of operatorsThis is the job of traffic/operation department but often it is neglected by them. They
blame that the operators do not carry out the orders of the traffic personnel.
Sometimes, this happens when traffic personnel booked for supervision or
organizing the work are in a lower grade and junior in service to the operator. The
reporting against drivers is often delayed, even up to one month from the
occurrence. The main blame against operators include not reporting at the working
point in time, rough/bad cargo handling, misbehaving with the traffic personnel,
illegal operations etc. In fact, there is a good communication system between
engineers and operation managers over the telephone and mobile wireless sets, but
these facilities are not utilized properly to solve such disciplinary problems
immediately.
47
• Bad driving practicesThis is a common phenomenon in equipment operation at the port. Most of the
operators do not follow the proper driving practices because of lack of knowledge,
training and a careless attitude. This practice includes handling overload containers,
driving too fast, violent acceleration and breaking, running over obstructions,
collision with other vehicles and structures and incorrect operating techniques. On
behalf of the British Ports Association, Production Engineering Research
Association (PERA) a report on ‘’condition monitoring and reliability of mobile plants
in British ports’’ identified 36 deadly sins, caused, mainly by operator abuse (PDI,
Dec./85-Jan./86). Similarly, most of the breakdowns in CPA are due to operator
abuse as mentioned above. Maintenance staff has to spend daily on average, 50%
of their total time to repair equipment breakdowns due to this carelessness on the
part of the operators. Equipment management is not strong enough to tackle the
situation due to interference of the trade unions.
• Lack of skilled manpower It is observed that lack of training is affecting all corners of equipment maintenance
and operation. . All technicians and operators need continuous training to maintain
and improve equipment performance. Supervisory staff badly needs training for the
application of new systems, supervision and control over staff activities.
Management personnel also have deficiencies in managing the overall maintenance
and operational activities. Training is the most influential factor to develop skill in
every aspect of maintenance and operation in CPA. For example, in computer
maintenance companies in the UK, each employee receives an average 7.5 weeks
of training every year (Thomas & Roach, 1990, p. 152).
• Poor incentives and motivation schemesIn Bangladesh, the basic salaries of the employees are poor compared to
neighbouring country India and other regional countries. In CPA, even the highly
skilled employees are not paid a good salary nor given sufficient incentives.
There are no future prospects in jobs such as timely promotions or extra increments
on salary. A skilled technician or operator only earns per month 125 to 150 USD
48
including all allowances. The existing incentive scheme provides two months of
basic salary to all employees if the profit target is achieved. There is no incentive for
excellent performance in maintenance or cargo/container handling. An unproductive
employee gets the same benefit as an efficient one. So, the efficient and skilled
employees are discouraged and find other opportunities to leave the present job or
another part time job. Both activities reduce equipment performance.
Moreover, there is no provision for subsidized or free meals or snacks in the
working place or canteen facilities. It is found that the staff leaving the office for
lunch/dinner or snacks can not return in due time. Providing food facilities at the
work place or some financial compensation in the form of cash money for meals, the
persons or groups work with more speed than normal. Colombo port, for example,
provides free lunch/dinner for all its employees (18000) which motivates the
employees to a great extent to reduce the idle time and increase productivity
(Karunadasa, 1997).
The motivation of people fluctuates in different countries. However, in CPA
motivation is mostly influenced by the financial incentives as majority of the people
do not fulfill their lowest level or most basic needs such as food, shelter, medicine
etc. by the given salaries. The Maslow’s need hierarchy theory focuses on these
needs and postulates that people have five types of needs, activated in a specific
order from the most basic, lowest level needs i.e. physiological needs to the highest
level needs i.e. self-actualization needs (Francou, 2000b).
• Shortage of technicians and operators Presently, the number of technicians and operators is not sufficient to maintain
more than 300 hundred units of cargo handling equipment. The problem is mainly
severe for the container handling equipment. It is difficult to maintain about 120
units of container handling equipment with 110 operators and 42 technicians. Most
of the time, some running equipment is not deployed for operation for want of
operators. After 8 hours duty, operators have to do overtime almost everyday. This
causes an excessive load on operators and sometimes rate of absenteeism
becomes very high.
49
The operator shortages could not be solved for a long time due to the cumbersome
recruitment process. Similarly, for maintenance of an equipment at least one
mechanic and one helper are needed. But, actually it is found that 25% of
breakdowns and scheduled maintenance are not attended to due to the shortage of
technicians. As a result, the volume of repair work increases and creates an
excessive load on existing technicians. Manpower recruitment has been a burning
problem in CPA for a long time.
• Poor working environmentThere is inadequate covered space for performing maintenance jobs. Most of the
workshop premises are slippery at all times due to hydraulic oil leakage from old
equipment. Workers do not put on proper working dress and prefer to do the work
in normal dress. First aid facilities are also lacking. A more serious threat to the
environment concerns operational incidents during cargo handling resulting in the
release of products. This may be due to the rupture of a connection hose or pipe
line, the bursting of a valve or manifold. Sometimes, ship-unloading operations near
the workshops pollute the working environment because of cargoes such as
cement, food grains etc.
The other main cause of poor working environment is labour unrest. Five registered
port labour unions, the biggest union of dock labours (which are separately
managed by a dock labour board) and many other unions of the port users often
agitate and hamper the sound environment of work.
There is a poor security system inside the port protected area which allows private
transport, mainly private trucks, to create traffic jams almost everyday during the
peak period between 11 to 18 hours. Most of the container yards in the GCB area
are weak in strength which causes a frequent breakdown of equipment and reduces
the speed of work. Very hot weather conditions and excessive rain sometimes make
the environment unfriendly thus reducing work efficiency.
50
• Employee participationParticipation of employees to give complete suggestions about the current situation
at the workshops is of great importance in the day-to-day performance of
equipment. It has been found that when the problems are discussed with the
employees and suggestions are invited, they feel happy and try to find the solution
seriously. This is not only a moral obligation for management; it is also a
motivational measure. As a result, the workers are committed to implement the
decisions taken by the port conscientiously (Prokopendo, 1987, p.214).
3.4 Traffic forecastingTraffic forecasting at the port is very significant in relation to forecasting the demand
of services and cargo handling equipment, for example. Ports inevitably require a
level of spare capacity to overcome traffic surges but perhaps more importantly,
they need to plan future capacity sufficiently to cater for gradual traffic increase
(PDI, May 2000). It is the preliminary step of the port system, especially in
developing countries where decision making involves a complex process. To
forecast demand for port services, there is a need to predict demand for imports and
supply of exports of at least groups of commodities; these in turn, depend on
domestic and foreign supply and demand. Furthermore, these demands should be
based on local and regional basis. Demand forecasting is probably the task with the
greatest uncertainty attached to it and therefore may require ranges (Jansson &
Shneerson, 1982, p.151).
Influencing factorsThere are many factors, which influence the traffic in different ways; some of them
are as follows:
• World seaborne trade and world economy
• Local and regional trade and economy
• Technological developments in maritime field
• Past trends and future influential events
• Port control statistics
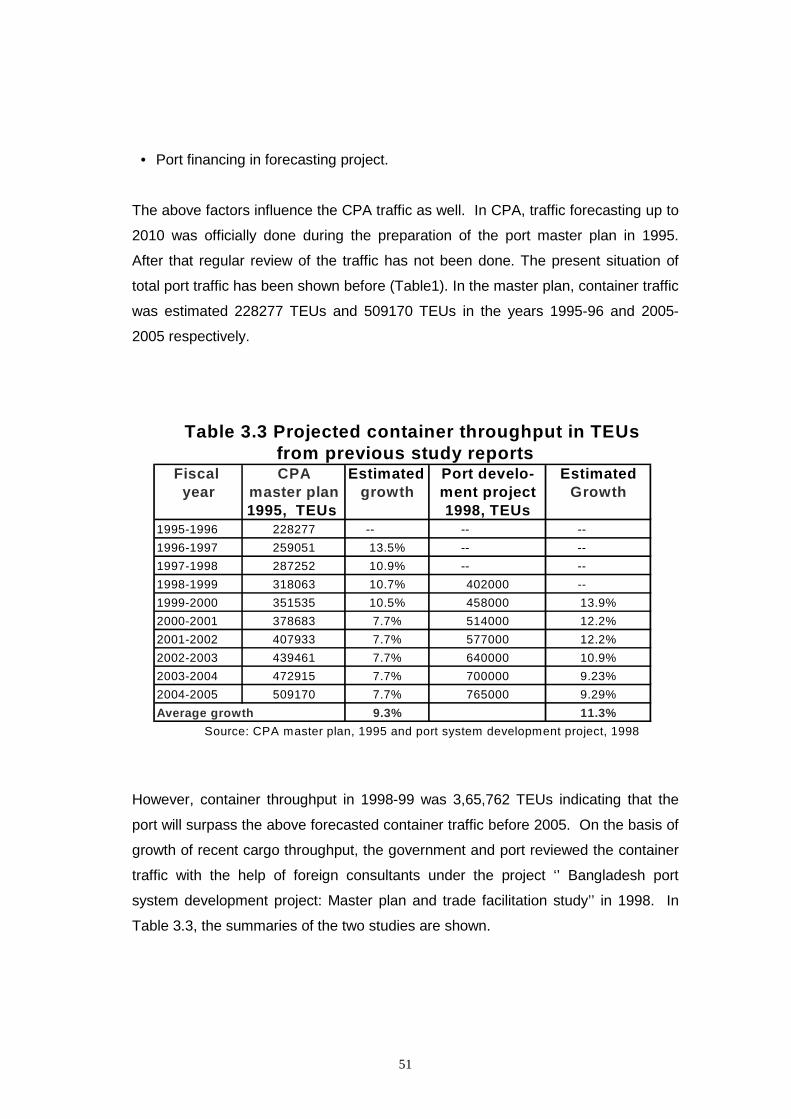
51
• Port financing in forecasting project.
The above factors influence the CPA traffic as well. In CPA, traffic forecasting up to
2010 was officially done during the preparation of the port master plan in 1995.
After that regular review of the traffic has not been done. The present situation of
total port traffic has been shown before (Table1). In the master plan, container traffic
was estimated 228277 TEUs and 509170 TEUs in the years 1995-96 and 2005-
2005 respectively.
However, container throughput in 1998-99 was 3,65,762 TEUs indicating that the
port will surpass the above forecasted container traffic before 2005. On the basis of
growth of recent cargo throughput, the government and port reviewed the container
traffic with the help of foreign consultants under the project ‘’ Bangladesh port
system development project: Master plan and trade facilitation study’’ in 1998. In
Table 3.3, the summaries of the two studies are shown.
Table 3.3 Projected container throughput in TEUs from previous study reports
Fiscal CPA Estimated Port develo- Estimatedyear master plan growth ment project Growth
1995, TEUs 1998, TEUs1995-1996 228277 -- -- --1996-1997 259051 13.5% -- --1997-1998 287252 10.9% -- --1998-1999 318063 10.7% 402000 --1999-2000 351535 10.5% 458000 13.9%2000-2001 378683 7.7% 514000 12.2%2001-2002 407933 7.7% 577000 12.2%2002-2003 439461 7.7% 640000 10.9%2003-2004 472915 7.7% 700000 9.23%2004-2005 509170 7.7% 765000 9.29%Average growth 9.3% 11.3% Source: CPA master plan, 1995 and port system development project, 1998
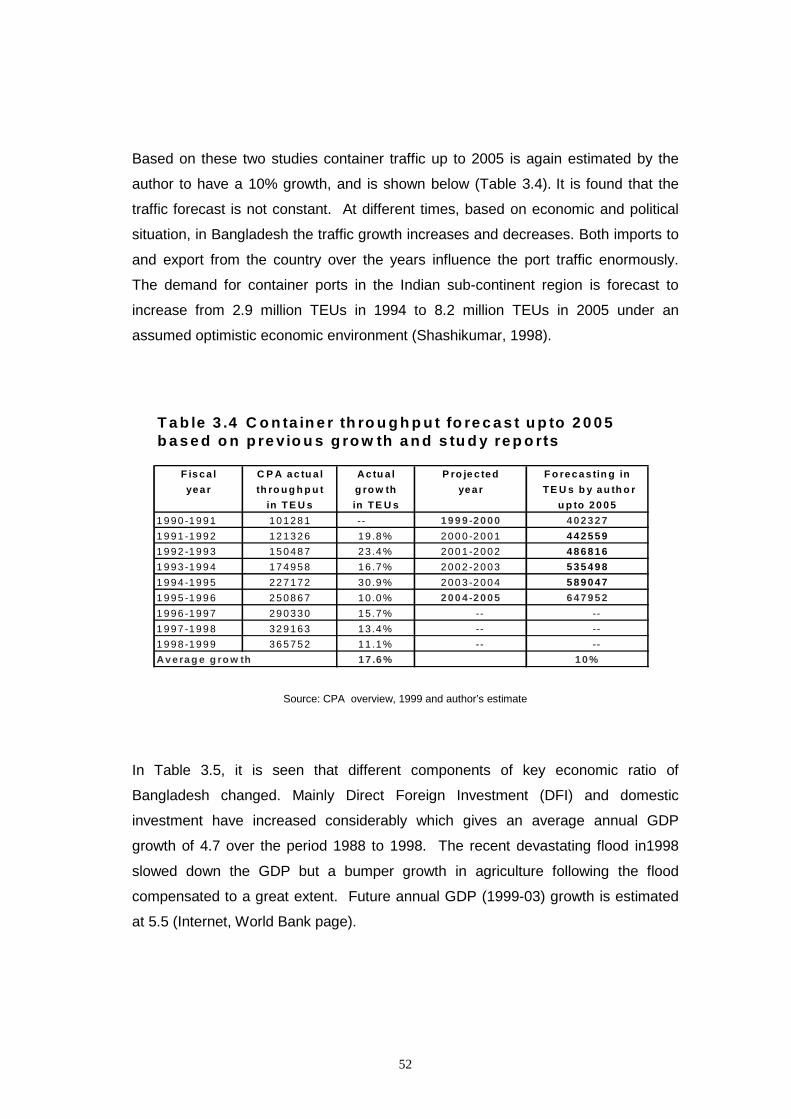
52
Based on these two studies container traffic up to 2005 is again estimated by the
author to have a 10% growth, and is shown below (Table 3.4). It is found that the
traffic forecast is not constant. At different times, based on economic and political
situation, in Bangladesh the traffic growth increases and decreases. Both imports to
and export from the country over the years influence the port traffic enormously.
The demand for container ports in the Indian sub-continent region is forecast to
increase from 2.9 million TEUs in 1994 to 8.2 million TEUs in 2005 under an
assumed optimistic economic environment (Shashikumar, 1998).
Source: CPA overview, 1999 and author’s estimate
In Table 3.5, it is seen that different components of key economic ratio of
Bangladesh changed. Mainly Direct Foreign Investment (DFI) and domestic
investment have increased considerably which gives an average annual GDP
growth of 4.7 over the period 1988 to 1998. The recent devastating flood in1998
slowed down the GDP but a bumper growth in agriculture following the flood
compensated to a great extent. Future annual GDP (1999-03) growth is estimated
at 5.5 (Internet, World Bank page).
T a b le 3 .4 C o n ta in e r th ro u g h p u t fo re c a s t u p to 2 0 0 5 b a s e d o n p re v io u s g ro w th a n d s tu d y re p o r ts
F is c a l C P A a c tu a l Ac tu a l P ro je c te d F o re c a s tin g inye a r th ro u g h p u t g ro w th ye a r TE U s b y a u th o r
in T E U s in TE U s u p to 2 0 0 51 9 9 0 -1 9 9 1 1 0 1 2 8 1 -- 1 9 9 9 -2 0 0 0 4 0 2 3 2 71 9 9 1 -1 9 9 2 1 2 1 3 2 6 1 9 .8 % 2 0 0 0 -2 0 0 1 4 4 2 5 5 91 9 9 2 -1 9 9 3 1 5 0 4 8 7 2 3 .4 % 2 0 0 1 -2 0 0 2 4 8 6 8 1 61 9 9 3 -1 9 9 4 1 7 4 9 5 8 1 6 .7 % 2 0 0 2 -2 0 0 3 5 3 5 4 9 81 9 9 4 -1 9 9 5 2 2 7 1 7 2 3 0 .9 % 2 0 0 3 -2 0 0 4 5 8 9 0 4 71 9 9 5 -1 9 9 6 2 5 0 8 6 7 1 0 .0 % 2 0 0 4 -2 0 0 5 6 4 7 9 5 21 9 9 6 -1 9 9 7 2 9 0 3 3 0 1 5 .7 % -- --1 9 9 7 -1 9 9 8 3 2 9 1 6 3 1 3 .4 % -- --1 9 9 8 -1 9 9 9 3 6 5 7 5 2 1 1 .1 % -- --Av e ra g e g ro w th 1 7 .6 % 1 0 %
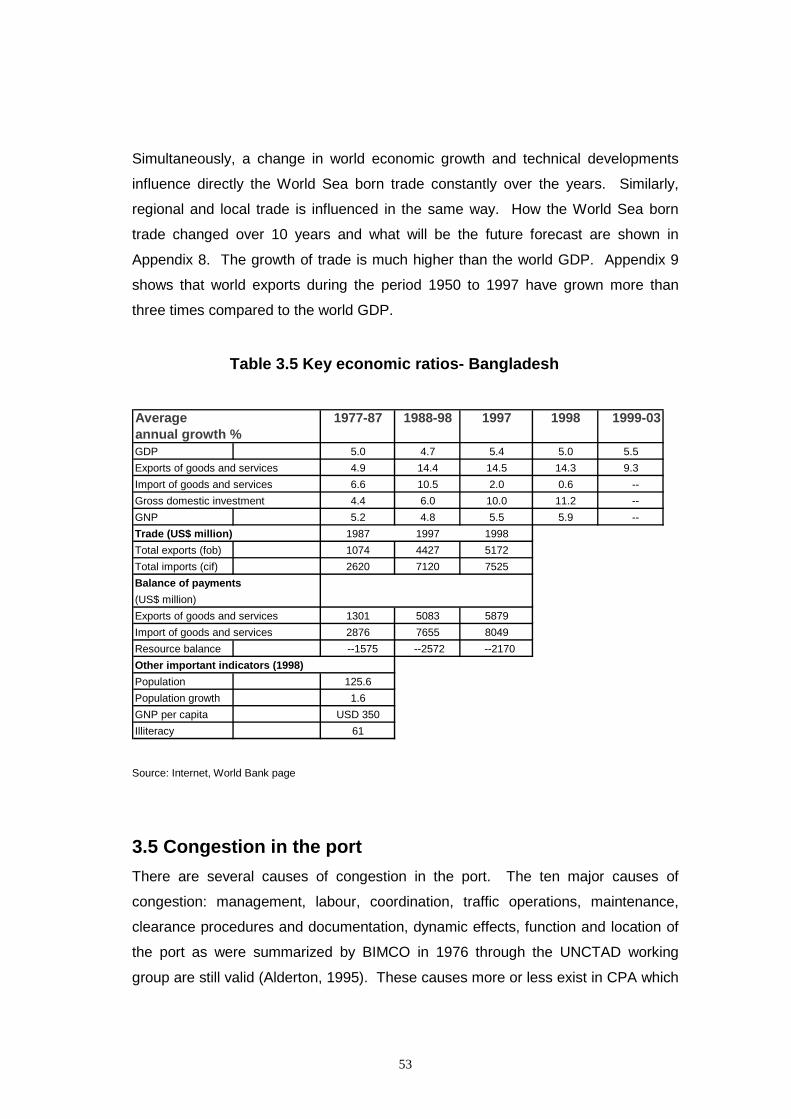
53
Simultaneously, a change in world economic growth and technical developments
influence directly the World Sea born trade constantly over the years. Similarly,
regional and local trade is influenced in the same way. How the World Sea born
trade changed over 10 years and what will be the future forecast are shown in
Appendix 8. The growth of trade is much higher than the world GDP. Appendix 9
shows that world exports during the period 1950 to 1997 have grown more than
three times compared to the world GDP.
Table 3.5 Key economic ratios- Bangladesh
Source: Internet, World Bank page
3.5 Congestion in the portThere are several causes of congestion in the port. The ten major causes of
congestion: management, labour, coordination, traffic operations, maintenance,
clearance procedures and documentation, dynamic effects, function and location of
the port as were summarized by BIMCO in 1976 through the UNCTAD working
group are still valid (Alderton, 1995). These causes more or less exist in CPA which
Average 1977-87 1988-98 1997 1998 1999-03annual growth %GDP 5.0 4.7 5.4 5.0 5.5Exports of goods and services 4.9 14.4 14.5 14.3 9.3Import of goods and services 6.6 10.5 2.0 0.6 --Gross domestic investment 4.4 6.0 10.0 11.2 --GNP 5.2 4.8 5.5 5.9 --Trade (US$ million) 1987 1997 1998Total exports (fob) 1074 4427 5172Total imports (cif) 2620 7120 7525Balance of payments (US$ million)Exports of goods and services 1301 5083 5879Import of goods and services 2876 7655 8049Resource balance --1575 --2572 --2170Other important indicators (1998)Population 125.6Population growth 1.6GNP per capita USD 350Illiteracy 61
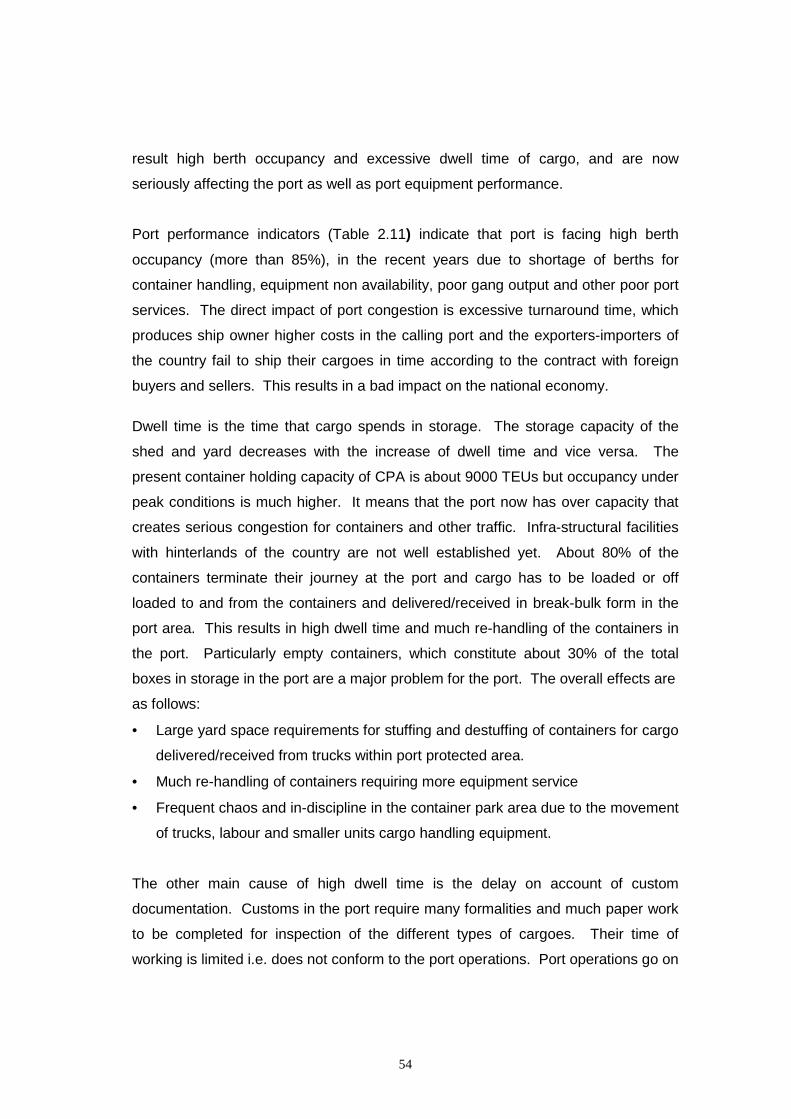
54
result high berth occupancy and excessive dwell time of cargo, and are now
seriously affecting the port as well as port equipment performance.
Port performance indicators (Table 2.11) indicate that port is facing high berth
occupancy (more than 85%), in the recent years due to shortage of berths for
container handling, equipment non availability, poor gang output and other poor port
services. The direct impact of port congestion is excessive turnaround time, which
produces ship owner higher costs in the calling port and the exporters-importers of
the country fail to ship their cargoes in time according to the contract with foreign
buyers and sellers. This results in a bad impact on the national economy.
Dwell time is the time that cargo spends in storage. The storage capacity of the
shed and yard decreases with the increase of dwell time and vice versa. The
present container holding capacity of CPA is about 9000 TEUs but occupancy under
peak conditions is much higher. It means that the port now has over capacity that
creates serious congestion for containers and other traffic. Infra-structural facilities
with hinterlands of the country are not well established yet. About 80% of the
containers terminate their journey at the port and cargo has to be loaded or off
loaded to and from the containers and delivered/received in break-bulk form in the
port area. This results in high dwell time and much re-handling of the containers in
the port. Particularly empty containers, which constitute about 30% of the total
boxes in storage in the port are a major problem for the port. The overall effects are
as follows:
• Large yard space requirements for stuffing and destuffing of containers for cargo
delivered/received from trucks within port protected area.
• Much re-handling of containers requiring more equipment service
• Frequent chaos and in-discipline in the container park area due to the movement
of trucks, labour and smaller units cargo handling equipment.
The other main cause of high dwell time is the delay on account of custom
documentation. Customs in the port require many formalities and much paper work
to be completed for inspection of the different types of cargoes. Their time of
working is limited i.e. does not conform to the port operations. Port operations go on
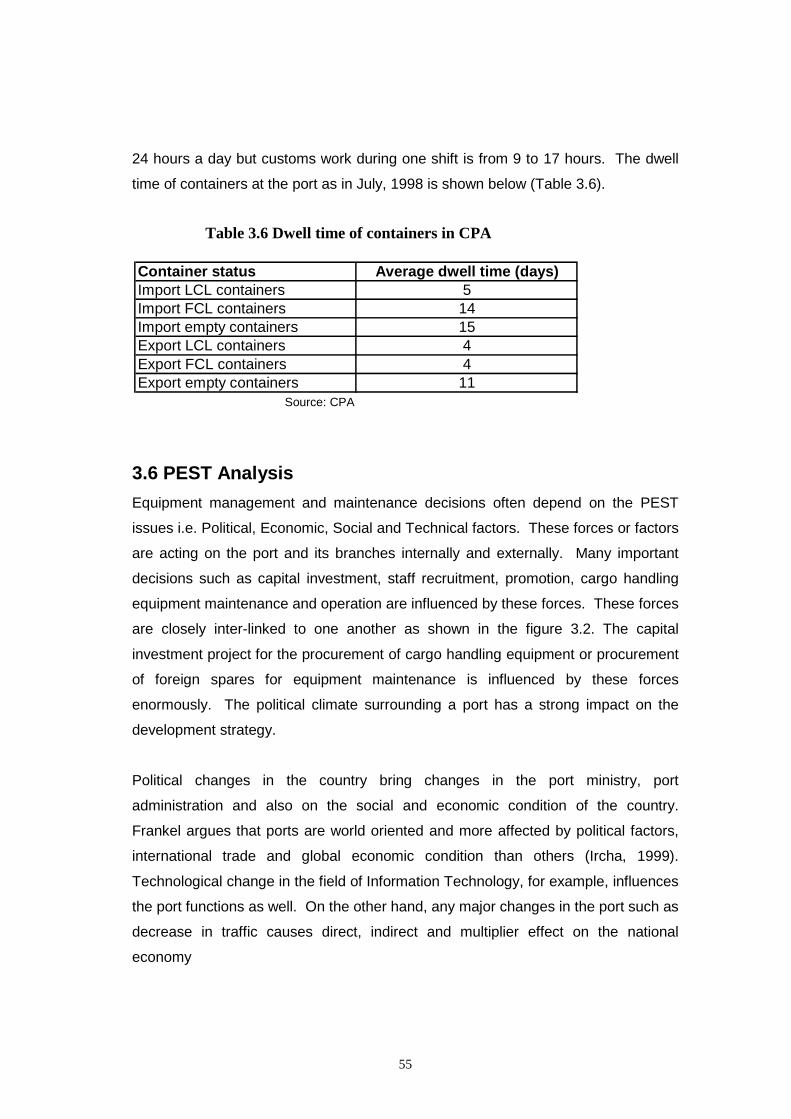
55
24 hours a day but customs work during one shift is from 9 to 17 hours. The dwell
time of containers at the port as in July, 1998 is shown below (Table 3.6).
Table 3.6 Dwell time of containers in CPA
3.6 PEST AnalysisEquipment management and maintenance decisions often depend on the PEST
issues i.e. Political, Economic, Social and Technical factors. These forces or factors
are acting on the port and its branches internally and externally. Many important
decisions such as capital investment, staff recruitment, promotion, cargo handling
equipment maintenance and operation are influenced by these forces. These forces
are closely inter-linked to one another as shown in the figure 3.2. The capital
investment project for the procurement of cargo handling equipment or procurement
of foreign spares for equipment maintenance is influenced by these forces
enormously. The political climate surrounding a port has a strong impact on the
development strategy.
Political changes in the country bring changes in the port ministry, port
administration and also on the social and economic condition of the country.
Frankel argues that ports are world oriented and more affected by political factors,
international trade and global economic condition than others (Ircha, 1999).
Technological change in the field of Information Technology, for example, influences
the port functions as well. On the other hand, any major changes in the port such as
decrease in traffic causes direct, indirect and multiplier effect on the national
economy
Container status Average dwell time (days)Import LCL containers 5Import FCL containers 14Import empty containers 15Export LCL containers 4Export FCL containers 4Export empty containers 11
Source: CPA
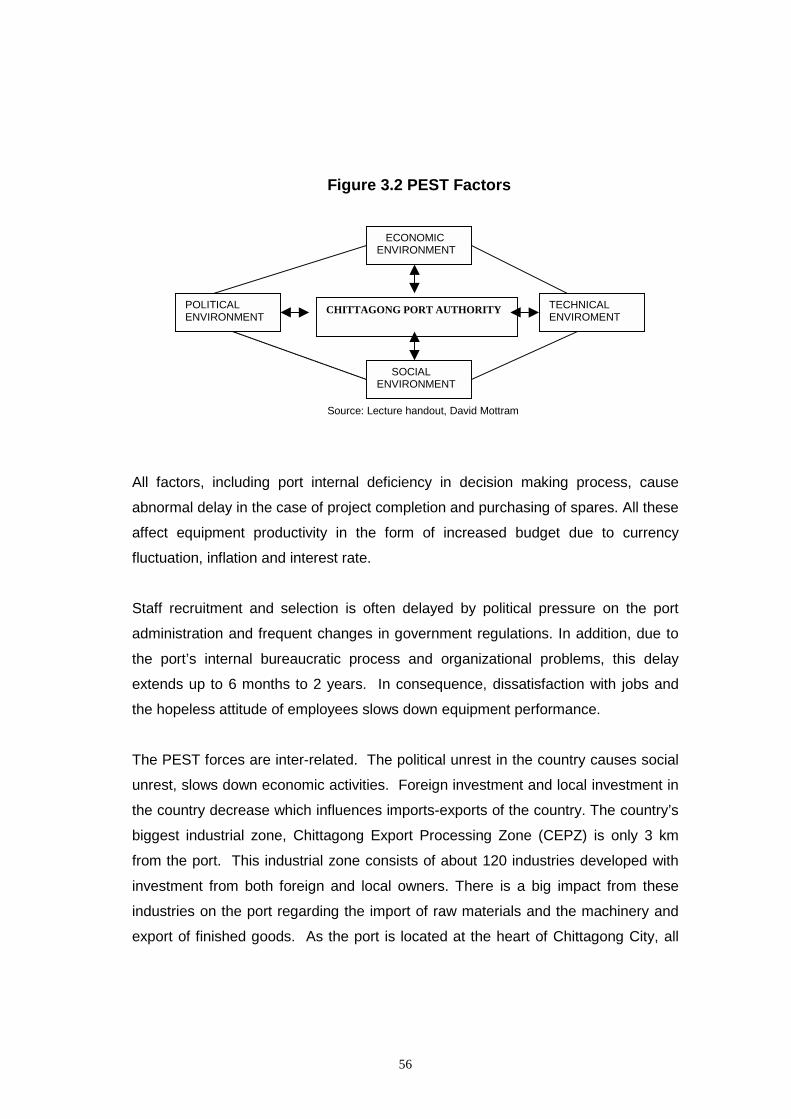
56
Figure 3.2 PEST Factors
Source: Lecture handout, David Mottram
All factors, including port internal deficiency in decision making process, cause
abnormal delay in the case of project completion and purchasing of spares. All these
affect equipment productivity in the form of increased budget due to currency
fluctuation, inflation and interest rate.
Staff recruitment and selection is often delayed by political pressure on the port
administration and frequent changes in government regulations. In addition, due to
the port’s internal bureaucratic process and organizational problems, this delay
extends up to 6 months to 2 years. In consequence, dissatisfaction with jobs and
the hopeless attitude of employees slows down equipment performance.
The PEST forces are inter-related. The political unrest in the country causes social
unrest, slows down economic activities. Foreign investment and local investment in
the country decrease which influences imports-exports of the country. The country’s
biggest industrial zone, Chittagong Export Processing Zone (CEPZ) is only 3 km
from the port. This industrial zone consists of about 120 industries developed with
investment from both foreign and local owners. There is a big impact from these
industries on the port regarding the import of raw materials and the machinery and
export of finished goods. As the port is located at the heart of Chittagong City, all
CHITTAGONG PORT AUTHORITY
ECONOMICENVIRONMENT
POLITICALENVIRONMENT
SOCIALENVIRONMENT
TECHNICALENVIROMENT
57
kinds of social, political and economic activities of the city influence the port in
different ways.
3.7 Inter-departmental co-ordination and co-operationCPA has 15 departments as shown in the organization chart (Appendix 3). Overall
port performance depends on the close co-ordination and co-operation among the
different departments. Trust along with co-ordination and co-operations are the key
words in this respect. The functions of cargo handling equipment are mainly related
with the traffic, accounts and finance and store departments. Other departments
also influence directly or indirectly equipment functions.
• Traffic/operation departmentThe traffic department is mainly responsible for cargo handling operations in the
port. The economic life of the equipment largely depends on the careful and
efficient use of equipment during cargo handling operations. During operation,
operators are instructed to perform duties under the supervision and control of the
traffic staff/officers. But, in fact, the traffic department performs this job with less
care and has blaming tendency towards the operators and equipment management.
It is true that operator performance is not completely satisfactory, not only because
of their faults but also because of lack of proper control and supervision of cargo
handling operations. Therefore, equipment management has to maintain
continuous coordination with traffic managers to solve problems quickly.
• Accounts and Finance departmentThe accounts and finance department is mainly responsible for formulating
accounting and financial policies, preparation of budget etc. Any financial
concurrence for maintenance work needs the approval of this department.
Equipment maintenance requires continuous funds for maintaining the equipment.
As mentioned before, procurement of both foreign and local spares consumes a
great deal of time and money. Most of this time is spent at the accounts and finance
department for financial concurrence. They often put up queries at the time of
58
concurrence, even for a trivial matter. For this reason, engineers have to engage in
unnecessary paper work rather than thinking about the equipment and its
performance. There is also a conflict of trust and this communication gap decreases
the work efficiency.
• Central Stores departmentThe stores department is responsible for supplying all the goods and materials
needed for various departments. It is not capable enough with the existing
manpower and experience to provide different types of goods within a specific time.
In this case a huge amount of time is lost in processing the file. Considering the
importance of cargo handling equipment, a management decision has been taken to
procure the foreign spares directly through the mechanical branch. In spite of this
many other local procurements including fuel, lubricant and oil are done by the store
department. When the stock is finished, the mechanical branch has to pursue and
chase up every time for these stores.
• Civil Engineering departmentThe civil engineering department is mainly concerned with the construction and
maintenance of container yards, container terminal and roads inside the port
protected area and maintenance of permanent facilities such as workshop building,
premises etc. In recent years, the condition of many yards has become so bad that
equipment has faced continuous breakdown. Sometimes an awkward position has
to be faced when there are repeated breakdowns due to tyre puncture and other
parts failure. For this reason, continuous monitoring is needed to upkeep the roads
and yards as far as possible to save the equipment from major breakdowns.
3.8 Port Management Information System (PMIS)Today, is the age of Information Technology. An effective MIS using IT is crucial for
CPA make quick decisions as well as give service to the port users. Port
Management and other departments are using computers individually, which does
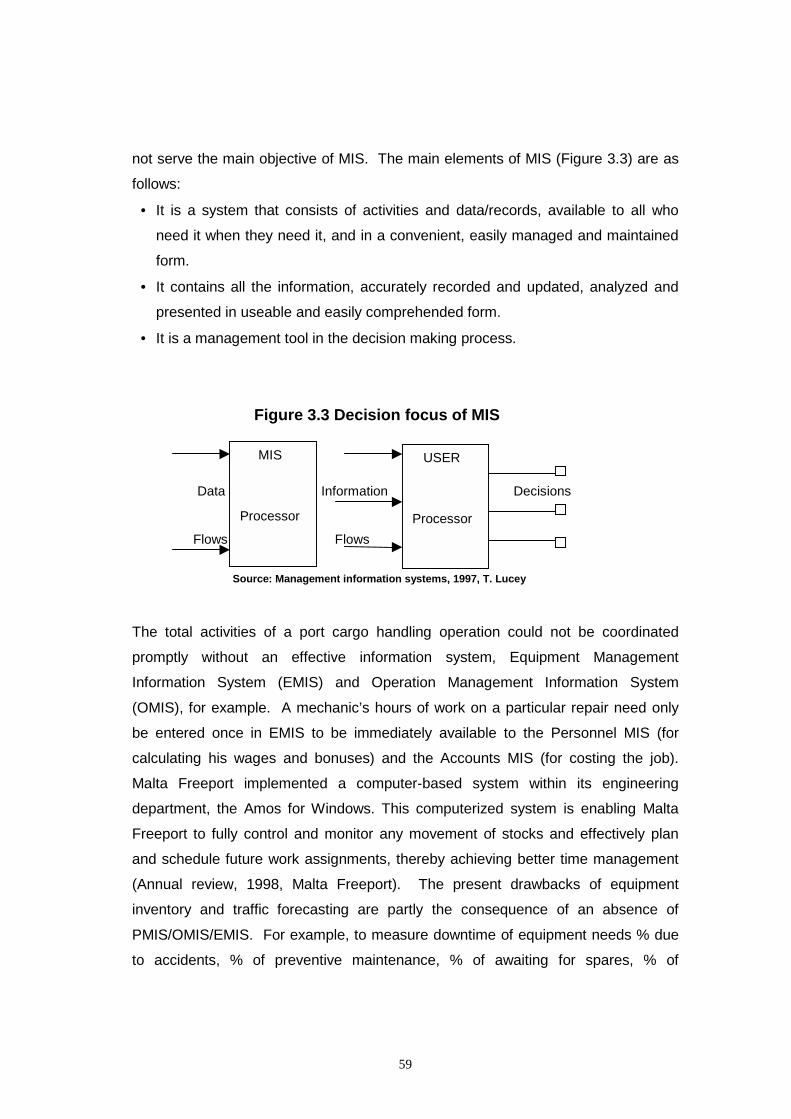
59
not serve the main objective of MIS. The main elements of MIS (Figure 3.3) are as
follows:
• It is a system that consists of activities and data/records, available to all who
need it when they need it, and in a convenient, easily managed and maintained
form.
• It contains all the information, accurately recorded and updated, analyzed and
presented in useable and easily comprehended form.
• It is a management tool in the decision making process.
Figure 3.3 Decision focus of MIS
Data Information Decisions
Flows Flows
Source: Management information systems, 1997, T. Lucey
The total activities of a port cargo handling operation could not be coordinated
promptly without an effective information system, Equipment Management
Information System (EMIS) and Operation Management Information System
(OMIS), for example. A mechanic’s hours of work on a particular repair need only
be entered once in EMIS to be immediately available to the Personnel MIS (for
calculating his wages and bonuses) and the Accounts MIS (for costing the job).
Malta Freeport implemented a computer-based system within its engineering
department, the Amos for Windows. This computerized system is enabling Malta
Freeport to fully control and monitor any movement of stocks and effectively plan
and schedule future work assignments, thereby achieving better time management
(Annual review, 1998, Malta Freeport). The present drawbacks of equipment
inventory and traffic forecasting are partly the consequence of an absence of
PMIS/OMIS/EMIS. For example, to measure downtime of equipment needs % due
to accidents, % of preventive maintenance, % of awaiting for spares, % of
MIS
Processor
USER
Processor
60
breakdowns in use, total downtime hours and % downtime of total possible machine
hours, which can not be effectively measured without EMIS.
3.9 Government interferenceAccording to port ordinance 1976, the port has limited autonomy to perform all port
functions smoothly. Moreover, this limited autonomy is hampered in different times
due to government interference in the form of imposing new rules and orders.
Various forms of government control are as follows:
*Investment control * The mechanism of investment control * Aid finance projects
*Depreciation *Port charges *Foreign exchange *Procurement * Employment *
At present, the port is being affected by all of these control factors. For example,
the two projects of CPA for the procurement of cargo handling equipment and
related facilities took more than three years for government administrative and
financial approval from different ministries and special committees. The
consequence is that the estimated budget of these two projects will increase
substantially due to inflation, currency fluctuation etc. The other form of influence
from the government is political influence. The political party, which comes to
power, uses the port for different purposes such as job recruitment, development
works and demanding financial support etc.
3.10 ConclusionPort competitiveness depends on quality of services. These services are
continuously affected by various influential factors. In this chapter, efforts are made
to highlight these factors that exist in different corners of the port relating to cargo
handling equipment. There is now a crying need for the management of the port
and equipment to take note of the real causes of poor equipment performance, to
find solutions and recommendations which will be discussed in chapters five and six.
61
CHAPTER 4
COMPARISON WITH OTHER PORTS
4.1 IntroductionToday, port comparison is an important aspect in the competitive field of the port
industry by which a port can evaluate its performance in order to improve its overall
activities. It may turn out to be a very useful, even indispensable tool in medium and
long term planning, making strategies, setting marketing objectives or management
control and evaluating port organization (Ma, 2000). According to Ma (2000), there
are seven objectives of port comparison: to sensitize people, to set objectives, to
compete in the market, to improve management/efficiency, to evaluate
performances, to undertake marketing and to make research. The needs to
compare equipment performances also follow the same objectives. If port
equipment, for example, a straddle carrier, has 85% availability in comparison with
70% of same type of equipment of another port, this indicates better performance.
Comparison is also crucial for competition between ports. Several factors affect
competition: location that gives easy access to markets, to main sea-lanes or inland
transport networks; quality, frequency and diversity of shipping service and inland
transport connections. Above all, good productivity (i.e. vessel turnaround time) and
adequate charges that highlight port competitiveness (Canamero, 2000).
The comparisons of ports with respect to equipment performance are not easy. This
is mainly due to different types and models of equipment used by the different ports
in different situations. There are a number of performance indicators that can be
used for port comparisons: physical indicators, financial indicators, and operational
62
indicators. Comparison can only be successful if it is done ‘like with like’. Above all,
this chapter attempts to try compare local ports, some regional ports and European
ports by SWOT analysis in order to find out the present position of CPA.
4.2 Local PortsThere are two national seaports in Bangladesh: Chittagong Port Authority (CPA) and
Mongla Port Authority (MPA) which are state-owned and service organizations.
CPA is located at a better position than MPA as compared on the basis of pilotage
distance from sea, the Bay of Bengal. The working environment, working hours,
labour costs, operating costs of equipment, tariff structure, labour and political
unrest and government interference in different activities is identical in both ports. In
spite of this, CPA performance is better than MPA. In the last 10 years, cargo
throughput of MPA has been fluctuating around 3.5 million tons and 30,000 TEUs
respectively (Port information, 1998-99) whereas throughput at CPA during the
same time increased almost constantly to 14 million tonnes and 365,752 TEUs in
1999. There are some distinct reasons as to why CPA is showing better
performance than MPA, which have been discussed later in the SWOT analysis.
4.3 Regional portsAs Chittagong Port Authority is located in South Asia, the comparison should be
done with the ports of this region. For this work the nearest ports of neighboring
country India: Calcutta, Mumbai, JNPT, and Chennai and Colombo port of Srilanka
have been chosen. The location of these ports is shown in the map (Appendix 10).
The other major port in this region, Karachi in Pakistan is far away from CPA.
Competition for regional traffic is not a main factor with Karachi port but its growth in
containerization is remarkable. All ports are growing as container ports and
comparison will be mainly focused on container handling equipment and other
related activities. Port comparisons by individual category are useful, dry dock
facilities, for example. But sometimes it is necessary to combine different elements
to compare the total costs. For example, if costs and transit time in two different
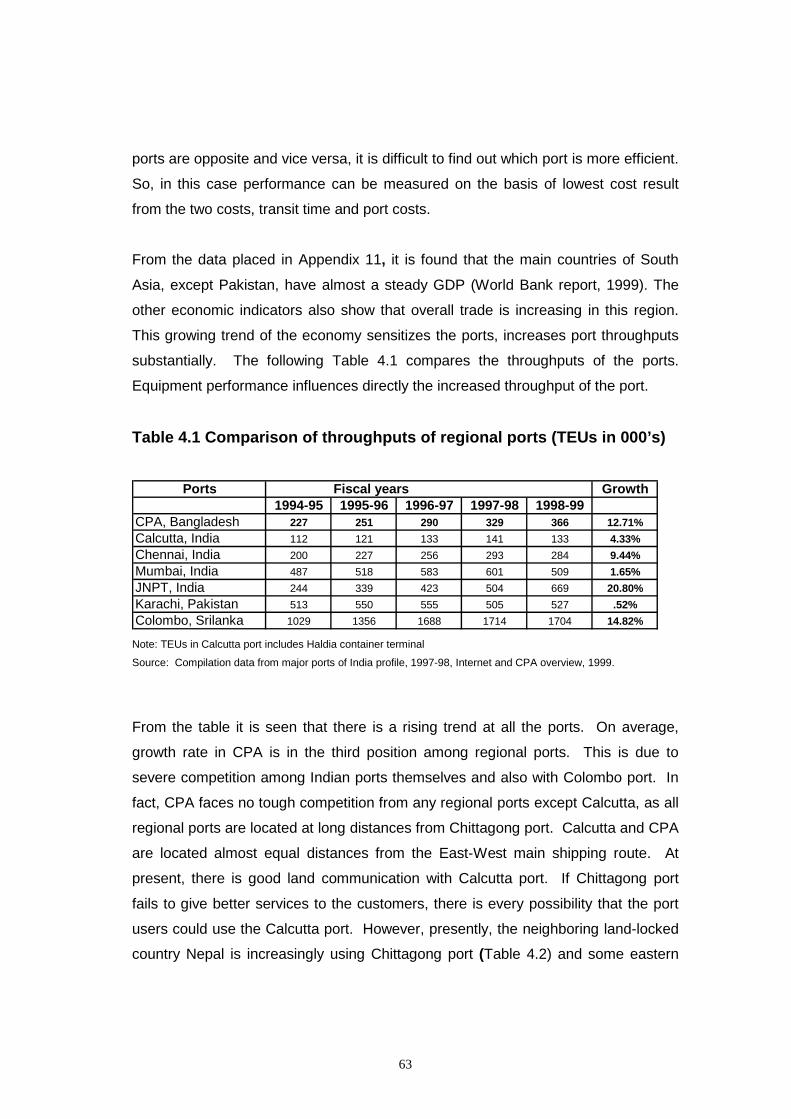
63
ports are opposite and vice versa, it is difficult to find out which port is more efficient.
So, in this case performance can be measured on the basis of lowest cost result
from the two costs, transit time and port costs.
From the data placed in Appendix 11, it is found that the main countries of South
Asia, except Pakistan, have almost a steady GDP (World Bank report, 1999). The
other economic indicators also show that overall trade is increasing in this region.
This growing trend of the economy sensitizes the ports, increases port throughputs
substantially. The following Table 4.1 compares the throughputs of the ports.
Equipment performance influences directly the increased throughput of the port.
Table 4.1 Comparison of throughputs of regional ports (TEUs in 000’s)
Ports Fiscal years Growth1994-95 1995-96 1996-97 1997-98 1998-99
CPA, Bangladesh 227 251 290 329 366 12.71%Calcutta, India 112 121 133 141 133 4.33%Chennai, India 200 227 256 293 284 9.44%Mumbai, India 487 518 583 601 509 1.65%JNPT, India 244 339 423 504 669 20.80%Karachi, Pakistan 513 550 555 505 527 .52%Colombo, Srilanka 1029 1356 1688 1714 1704 14.82%
Note: TEUs in Calcutta port includes Haldia container terminal
Source: Compilation data from major ports of India profile, 1997-98, Internet and CPA overview, 1999.
From the table it is seen that there is a rising trend at all the ports. On average,
growth rate in CPA is in the third position among regional ports. This is due to
severe competition among Indian ports themselves and also with Colombo port. In
fact, CPA faces no tough competition from any regional ports except Calcutta, as all
regional ports are located at long distances from Chittagong port. Calcutta and CPA
are located almost equal distances from the East-West main shipping route. At
present, there is good land communication with Calcutta port. If Chittagong port
fails to give better services to the customers, there is every possibility that the port
users could use the Calcutta port. However, presently, the neighboring land-locked
country Nepal is increasingly using Chittagong port (Table 4.2) and some eastern
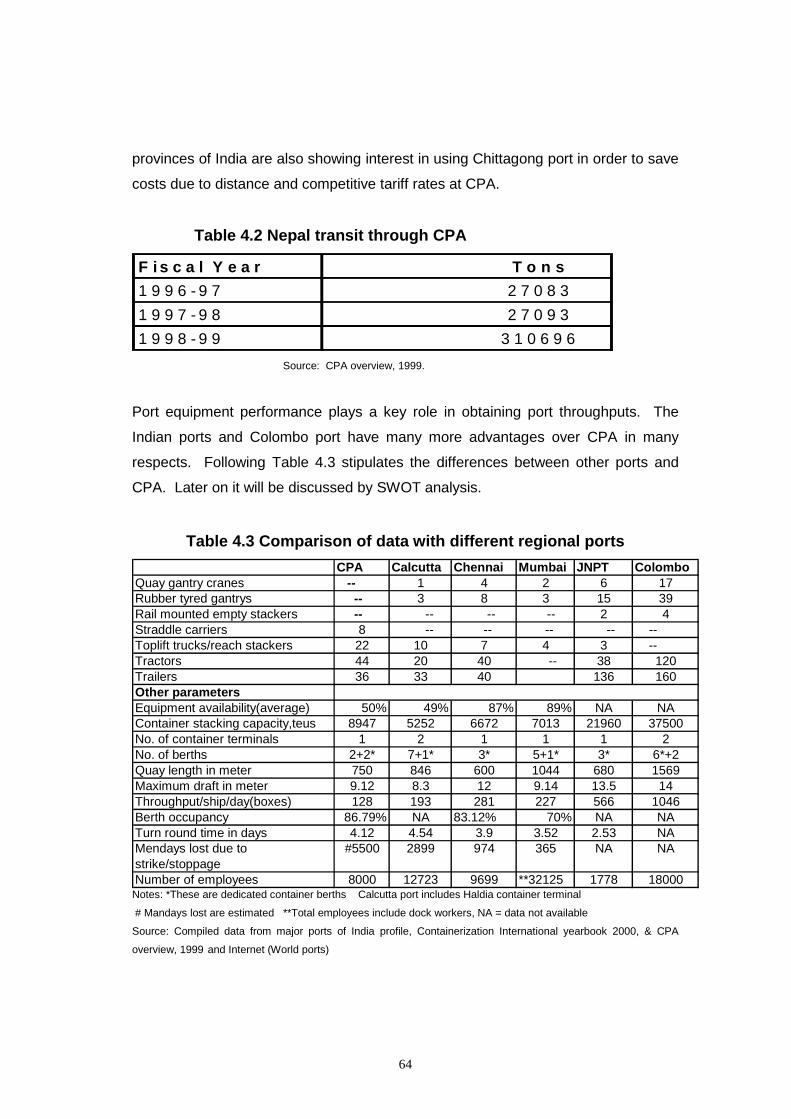
64
provinces of India are also showing interest in using Chittagong port in order to save
costs due to distance and competitive tariff rates at CPA.
Table 4.2 Nepal transit through CPA
F i s c a l Y e a r T o n s1 9 9 6 - 9 7 2 7 0 8 31 9 9 7 - 9 8 2 7 0 9 31 9 9 8 - 9 9 3 1 0 6 9 6
Source: CPA overview, 1999.
Port equipment performance plays a key role in obtaining port throughputs. The
Indian ports and Colombo port have many more advantages over CPA in many
respects. Following Table 4.3 stipulates the differences between other ports and
CPA. Later on it will be discussed by SWOT analysis.
Table 4.3 Comparison of data with different regional portsCPA Calcutta Chennai Mumbai JNPT Colombo
Quay gantry cranes -- 1 4 2 6 17Rubber tyred gantrys -- 3 8 3 15 39Rail mounted empty stackers -- -- -- -- 2 4Straddle carriers 8 -- -- -- -- -- Toplift trucks/reach stackers 22 10 7 4 3 -- Tractors 44 20 40 -- 38 120Trailers 36 33 40 136 160Other parametersEquipment availability(average) 50% 49% 87% 89% NA NAContainer stacking capacity,teus 8947 5252 6672 7013 21960 37500No. of container terminals 1 2 1 1 1 2No. of berths 2+2* 7+1* 3* 5+1* 3* 6*+2Quay length in meter 750 846 600 1044 680 1569Maximum draft in meter 9.12 8.3 12 9.14 13.5 14Throughput/ship/day(boxes) 128 193 281 227 566 1046Berth occupancy 86.79% NA 83.12% 70% NA NATurn round time in days 4.12 4.54 3.9 3.52 2.53 NAMendays lost due to #5500 2899 974 365 NA NAstrike/stoppageNumber of employees 8000 12723 9699 **32125 1778 18000
Notes: *These are dedicated container berths Calcutta port includes Haldia container terminal
# Mandays lost are estimated **Total employees include dock workers, NA = data not available
Source: Compiled data from major ports of India profile, Containerization International yearbook 2000, & CPA
overview, 1999 and Internet (World ports)
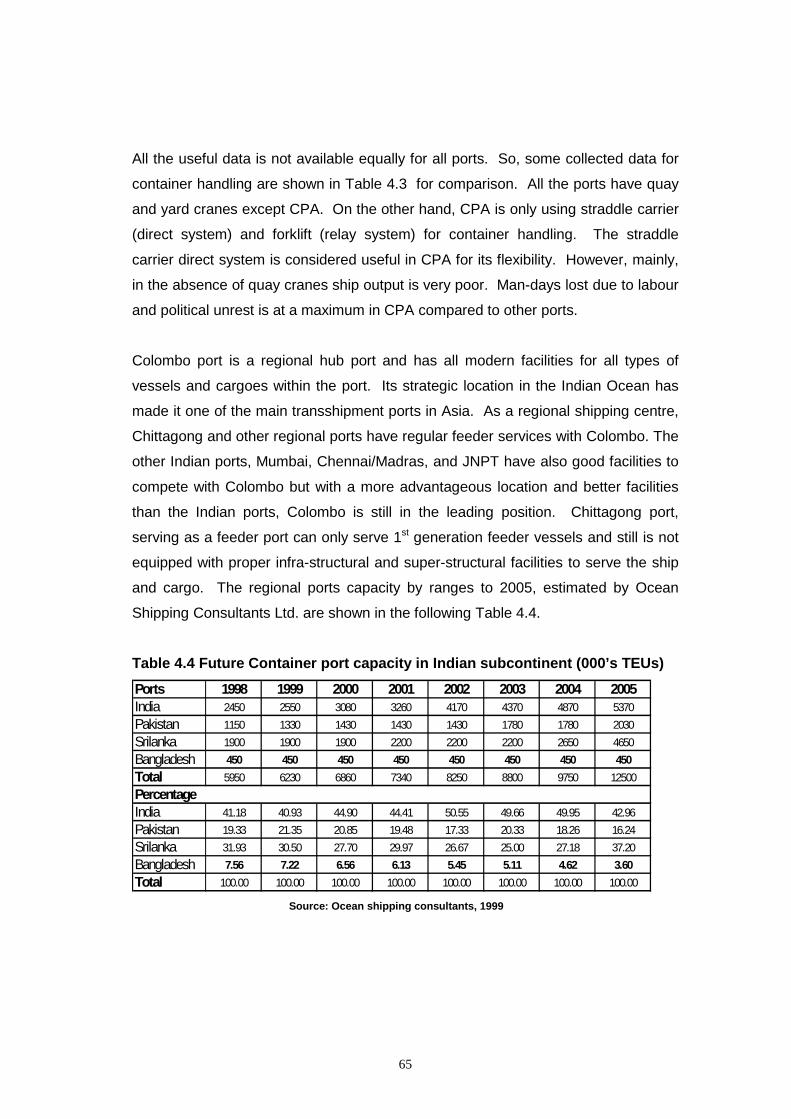
65
All the useful data is not available equally for all ports. So, some collected data for
container handling are shown in Table 4.3 for comparison. All the ports have quay
and yard cranes except CPA. On the other hand, CPA is only using straddle carrier
(direct system) and forklift (relay system) for container handling. The straddle
carrier direct system is considered useful in CPA for its flexibility. However, mainly,
in the absence of quay cranes ship output is very poor. Man-days lost due to labour
and political unrest is at a maximum in CPA compared to other ports.
Colombo port is a regional hub port and has all modern facilities for all types of
vessels and cargoes within the port. Its strategic location in the Indian Ocean has
made it one of the main transshipment ports in Asia. As a regional shipping centre,
Chittagong and other regional ports have regular feeder services with Colombo. The
other Indian ports, Mumbai, Chennai/Madras, and JNPT have also good facilities to
compete with Colombo but with a more advantageous location and better facilities
than the Indian ports, Colombo is still in the leading position. Chittagong port,
serving as a feeder port can only serve 1st generation feeder vessels and still is not
equipped with proper infra-structural and super-structural facilities to serve the ship
and cargo. The regional ports capacity by ranges to 2005, estimated by Ocean
Shipping Consultants Ltd. are shown in the following Table 4.4.
Table 4.4 Future Container port capacity in Indian subcontinent (000’s TEUs)Ports 1998 1999 2000 2001 2002 2003 2004 2005India 2450 2550 3080 3260 4170 4370 4870 5370Pakistan 1150 1330 1430 1430 1430 1780 1780 2030Srilanka 1900 1900 1900 2200 2200 2200 2650 4650Bangladesh 450 450 450 450 450 450 450 450Total 5950 6230 6860 7340 8250 8800 9750 12500PercentageIndia 41.18 40.93 44.90 44.41 50.55 49.66 49.95 42.96Pakistan 19.33 21.35 20.85 19.48 17.33 20.33 18.26 16.24Srilanka 31.93 30.50 27.70 29.97 26.67 25.00 27.18 37.20Bangladesh 7.56 7.22 6.56 6.13 5.45 5.11 4.62 3.60Total 100.00 100.00 100.00 100.00 100.00 100.00 100.00 100.00
Source: Ocean shipping consultants, 1999
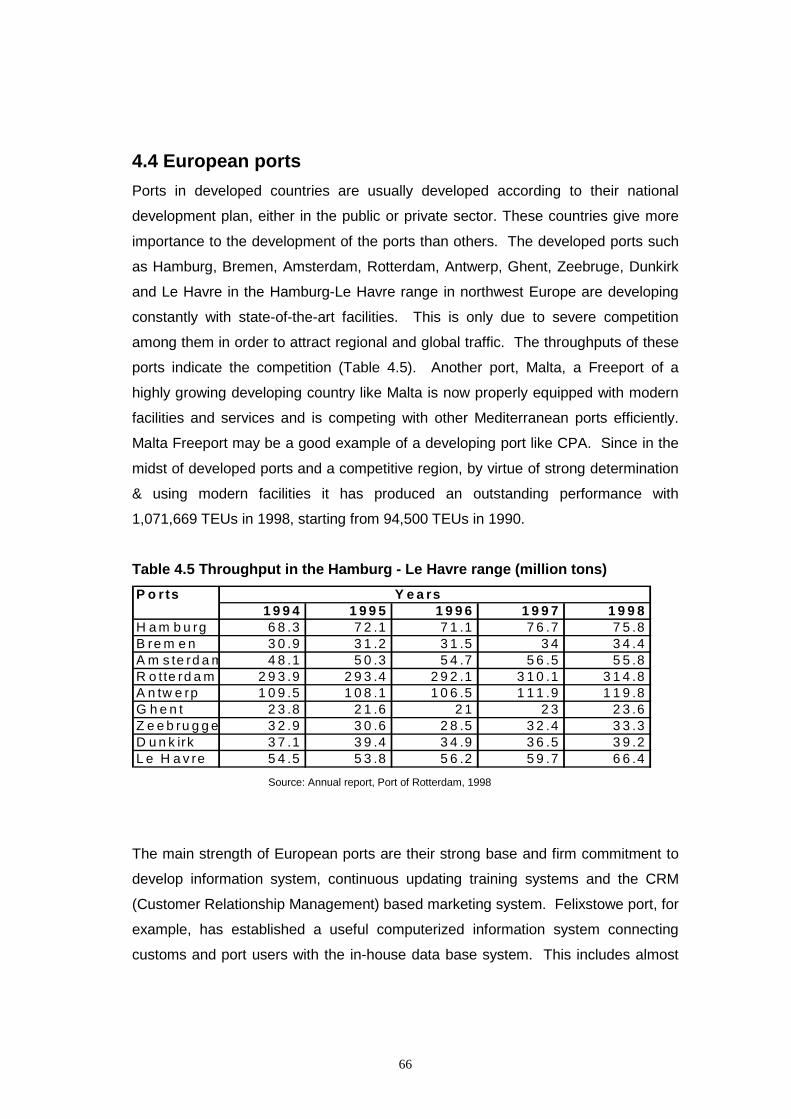
66
4.4 European portsPorts in developed countries are usually developed according to their national
development plan, either in the public or private sector. These countries give more
importance to the development of the ports than others. The developed ports such
as Hamburg, Bremen, Amsterdam, Rotterdam, Antwerp, Ghent, Zeebruge, Dunkirk
and Le Havre in the Hamburg-Le Havre range in northwest Europe are developing
constantly with state-of-the-art facilities. This is only due to severe competition
among them in order to attract regional and global traffic. The throughputs of these
ports indicate the competition (Table 4.5). Another port, Malta, a Freeport of a
highly growing developing country like Malta is now properly equipped with modern
facilities and services and is competing with other Mediterranean ports efficiently.
Malta Freeport may be a good example of a developing port like CPA. Since in the
midst of developed ports and a competitive region, by virtue of strong determination
& using modern facilities it has produced an outstanding performance with
1,071,669 TEUs in 1998, starting from 94,500 TEUs in 1990.
Table 4.5 Throughput in the Hamburg - Le Havre range (million tons)P o r ts Y e a rs
1 9 9 4 1 9 9 5 1 9 9 6 1 9 9 7 1 9 9 8H a m b u rg 6 8 .3 7 2 .1 7 1 .1 7 6 .7 7 5 .8B re m e n 3 0 .9 3 1 .2 3 1 .5 3 4 3 4 .4A m s te rd a m 4 8 .1 5 0 .3 5 4 .7 5 6 .5 5 5 .8R o tte rd a m 2 9 3 .9 2 9 3 .4 2 9 2 .1 3 1 0 .1 3 1 4 .8A n tw e rp 1 0 9 .5 1 0 8 .1 1 0 6 .5 1 1 1 .9 1 1 9 .8G h e n t 2 3 .8 2 1 .6 2 1 2 3 2 3 .6Z e e b ru g g e 3 2 .9 3 0 .6 2 8 .5 3 2 .4 3 3 .3D u n k irk 3 7 .1 3 9 .4 3 4 .9 3 6 .5 3 9 .2L e H a v re 5 4 .5 5 3 .8 5 6 .2 5 9 .7 6 6 .4
Source: Annual report, Port of Rotterdam, 1998
The main strength of European ports are their strong base and firm commitment to
develop information system, continuous updating training systems and the CRM
(Customer Relationship Management) based marketing system. Felixstowe port, for
example, has established a useful computerized information system connecting
customs and port users with the in-house data base system. This includes almost
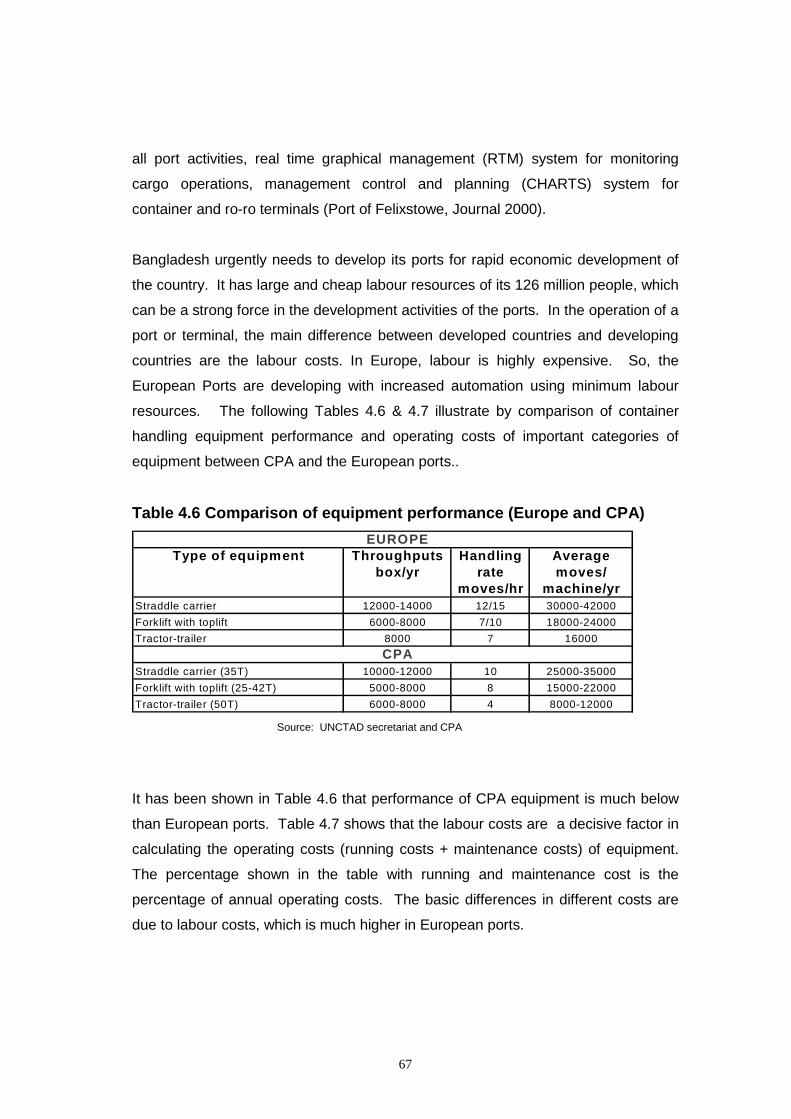
67
all port activities, real time graphical management (RTM) system for monitoring
cargo operations, management control and planning (CHARTS) system for
container and ro-ro terminals (Port of Felixstowe, Journal 2000).
Bangladesh urgently needs to develop its ports for rapid economic development of
the country. It has large and cheap labour resources of its 126 million people, which
can be a strong force in the development activities of the ports. In the operation of a
port or terminal, the main difference between developed countries and developing
countries are the labour costs. In Europe, labour is highly expensive. So, the
European Ports are developing with increased automation using minimum labour
resources. The following Tables 4.6 & 4.7 illustrate by comparison of container
handling equipment performance and operating costs of important categories of
equipment between CPA and the European ports..
Table 4.6 Comparison of equipment performance (Europe and CPA)EUROPE
Type of equipment Throughputs Handling Averagebox/yr rate moves/
moves/hr machine/yrStraddle carrier 12000-14000 12/15 30000-42000Forklift with toplift 6000-8000 7/10 18000-24000Tractor-trailer 8000 7 16000
CPAStraddle carrier (35T) 10000-12000 10 25000-35000Forklift with toplift (25-42T) 5000-8000 8 15000-22000Tractor-trailer (50T) 6000-8000 4 8000-12000
Source: UNCTAD secretariat and CPA
It has been shown in Table 4.6 that performance of CPA equipment is much below
than European ports. Table 4.7 shows that the labour costs are a decisive factor in
calculating the operating costs (running costs + maintenance costs) of equipment.
The percentage shown in the table with running and maintenance cost is the
percentage of annual operating costs. The basic differences in different costs are
due to labour costs, which is much higher in European ports.
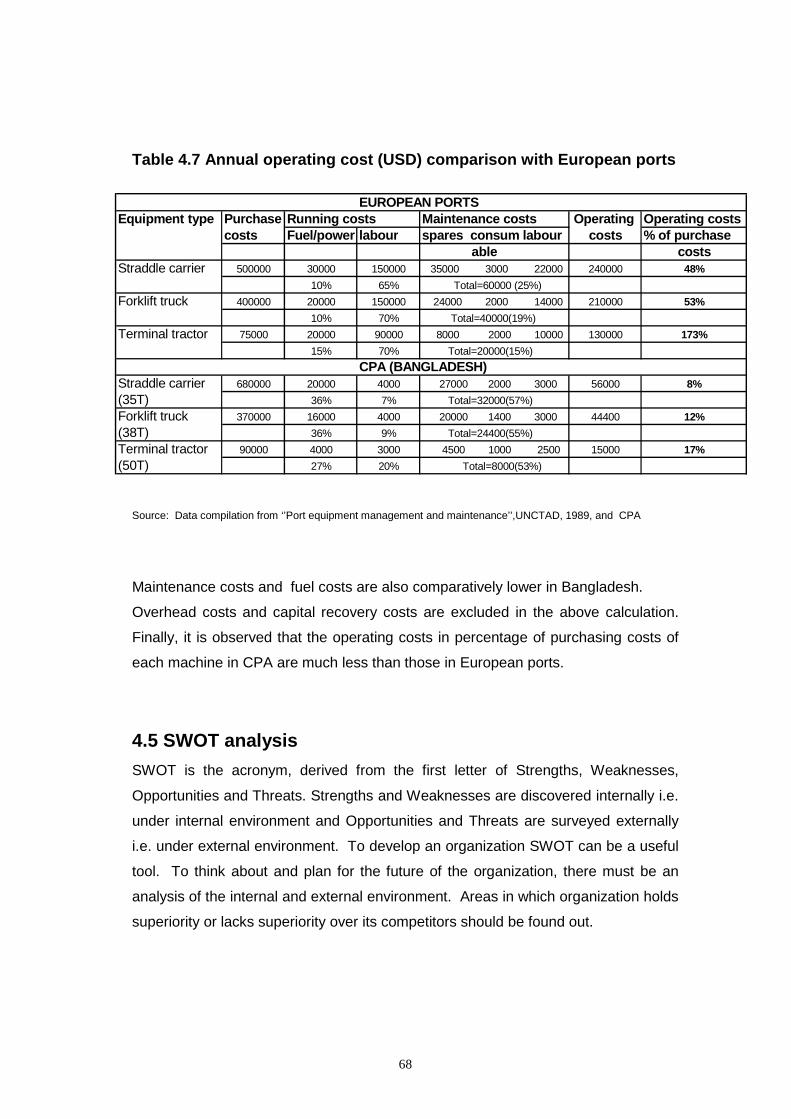
68
Table 4.7 Annual operating cost (USD) comparison with European ports
Source: Data compilation from ‘’Port equipment management and maintenance’’,UNCTAD, 1989, and CPA
Maintenance costs and fuel costs are also comparatively lower in Bangladesh.
Overhead costs and capital recovery costs are excluded in the above calculation.
Finally, it is observed that the operating costs in percentage of purchasing costs of
each machine in CPA are much less than those in European ports.
4.5 SWOT analysisSWOT is the acronym, derived from the first letter of Strengths, Weaknesses,
Opportunities and Threats. Strengths and Weaknesses are discovered internally i.e.
under internal environment and Opportunities and Threats are surveyed externally
i.e. under external environment. To develop an organization SWOT can be a useful
tool. To think about and plan for the future of the organization, there must be an
analysis of the internal and external environment. Areas in which organization holds
superiority or lacks superiority over its competitors should be found out.
EUROPEAN PORTSEquipment type Purchase Running costs Maintenance costs Operating Operating costs
costs Fuel/power labour spares consum labour costs % of purchase able costs
Straddle carrier 500000 30000 150000 35000 3000 22000 240000 48%10% 65% Total=60000 (25%)
Forklift truck 400000 20000 150000 24000 2000 14000 210000 53%10% 70% Total=40000(19%)
Terminal tractor 75000 20000 90000 8000 2000 10000 130000 173%15% 70% Total=20000(15%)
CPA (BANGLADESH)Straddle carrier 680000 20000 4000 27000 2000 3000 56000 8%(35T) 36% 7% Total=32000(57%)Forklift truck 370000 16000 4000 20000 1400 3000 44400 12%(38T) 36% 9% Total=24400(55%)Terminal tractor 90000 4000 3000 4500 1000 2500 15000 17%(50T) 27% 20% Total=8000(53%)
69
The strongest message from SWOT analysis is that, whatever course of action is
decided, decision making should contain each of the following elements: building on
Strengths, minimizing Weaknesses, seizing Opportunities and counteracting Threats
(Internet, 2000,SWOT analysis).
4.5.1 Local Port (MPA)Strengths
• Present CPA growth rate will encourage the employees to achieve a better
performance in the future.
• It has better facilities in cargo handling such as several decentralized workshops
with machinery and other facilities as described in chapter 2, and an
independent training institute for the training of employees.
• It has considerable financial reserves to support the port development activities
in need. For example, CPA presently is implementing two projects for the
procurement of cargo handling equipment and construction of a new container
terminal from its own resources amounting to US$ 200 million.
• It is located at a better position i.e. shorter distance from the common sea route.
• CPA has better hinterland links by road, rail and waterways, Capital City Dhaka
and other distant places.
• CPA provides better basic and welfare facilities such as education, health and
sports to its employees and their families.
• Information and communication system are more developed at CPA.
Weaknesses
• The large numbers of the port community often create hindrances in the work
raising different issues.
• Labour problems are more severe in CPA.
Opportunities
• A new container river terminal is expected to be commissioned by the end of
2000 near the Capital City Dhaka. This terminal will be equipped with modern
equipment and is expected to handle 116,000 containers annually (Bhuyan,
1998). CPA container movement through waterways will considerably increase.
70
• The country’s biggest industrial area, Chittagong Export Processing Zone
(CEPZ) is very near to the port.
• Many potential port users have permanent offices close to the port.
Threats
• The government has given permission to establish a container terminal to a
foreign company, Stevedores Services of America at about 10 km distance from
the port, which may create a negative influence on port performance in the
future.
• Government is thinking to develop Mongla for strategic reasons including natural
disasters (National development plan, 1995).
• CPA is situated at the heart of the city compared to MPA, which is far away from
the city. So, any disturbance and unrest at the city influences port operations.
4.5.2 Regional Ports Strengths
• CPA as the country’s main port, handles more than 80% of exported and
imported cargo, which is expected to continue in the future.
• It has recently adopted two big projects: to procure modern container handling
equipment and to construct a dedicated container terminal of 1000 m quay
length. Both projects are valued at US$ 200 million.
• CPA has a shorter pilotage distance compared to Calcutta.
• Labour costs are comparatively low in CPA.
Weaknesses
• Labour and political unrest destroys many working days compared to other
regional ports.
• Equipment availability is poor compared to many regional ports.
• Frequent breakdown of the equipment and non-availability of spare parts causes
severe pressure on maintenance performance and increases operating costs.
71
• Non-availability of shore-to-ship crane decreases the gang output and ship
output as most of the feeder vessels calling at the port have old derricks and
cranes.
• IT-based MIS and EDI system has yet to be developed.
• In CPA, training scope and facilities are not sufficient compared to Colombo,
Chennai, Mumbai and Calcutta. There is a shortage of skilled maintenance and
operational personnel.
• Absence of employee motivation scheme such as free or subsidized meals at
the working point, compared to Colombo and other ports, increases the
equipment idle time and drop in equipment performance.
• There are no motivational incentives on the basis of the daily and monthly
performance of operators and dock labourers in CPA compared to many
regional ports.
Opportunities
• As the country’s present GDP growth (5%, 1998) is expected to continue in the
near future due to increased foreign investment and subsequent development
activities, there will be a positive impact on port performance.
• Surrounding the port there are many industries including CEPZ, which are
constantly contributing to the port by generating a large share of the export-
import trade. Another Export Processing Zone by a foreign investor in the close
vicinity of the port is going into operation soon, which will further contribute to the
port performance.
Threats
• The neighboring port Calcutta has some special facilities compared to CPA such
as own modern dry dock, the most modern vessel traffic system, and good
communication and information system.
• In the absence of quay cranes and other sufficient good cargo handling
equipment, ship owners may reduce their port calls to the port or they may
impose surcharges when there is congestion in the port.
• As compared to Calcutta port, which commands a vast hinterland that comprises
almost half of Indian states (eastern and north-eastern region) and the two
72
neighboring countries - Nepal and Bhutan, CPA does not have such a cargo
back-up.
• Stevedores Services of America (SSA) during 1999 experienced a significance
global expansion with the addition of facilities in Bangladesh. A joint venture
between FRS service companies and Orient Maritime Ltd. was formed to plan,
develop and operate container terminal operations in Dhaka and Chittagong
(Cargo Systems, September 1999). This could share the port traffic
substantially.
• Political unrest in the country and government interference severely affects port
performance compared to other regional ports.
4.6 ConclusionMeaningful port comparison is difficult for want of similar data or statistics in different
ports. However, using the SWOT Analysis, decision making may be easier and
prompt by listing and ranking strengths and weaknesses and seeking how well they
match the opportunities and threats. The better they match, the better are the
chances of continuous success. The area of poor fit will identify development needs
for the organization (Ward, 1999). Comparison contributes not only to identifying
problems but also creates the opportunity to cooperate with ports of the same
country and other countries. A country does not work in a closed environment and
is open to the outside or even totally oriented towards the outside. Every country
nowadays needs other countries for its development (Francou, 1999).
The CPA compared to other regional and European ports, is facing serious
bottlenecks in maintaining a proper equipment inventory and operational
performance to cope with the increased traffic and better services demanded by the
port users. Other problems evolved from the analysis include lack of proper training
scheme, good communication system and incentive measures.
73
CHAPTER 5
SOLUTIONS
5.1 IntroductionIn the previous chapters, the present situation of the port explaining the problems
that exist in equipment maintenance and operation, the influence of external and
internal factors and the comparison with other ports through the SWOT
Analysis.have been presented. Now in this chapter the following solutions are
proposed to overcome the present problems in Chittagong port in order to improve
performance in the future.
• Maintaining a proper equipment inventory
• Improving equipment maintenance and operational performance
• Giving more autonomy to the port
5.2 First Solution: Maintaining a proper equipment inventoryTo maintain a proper inventory complete reshuffling in the equipment inventory
system is essential. The equipment is not only the biggest single structure, but in
practice it determines the operational procedure and performance of the terminal
(Constantinides, 1990, p.5). To maintain proper inventory needs a proper equipment
plan which is duly implemented.
The equipment plan and its implementationThe port management should establish procedures for preparing an equipment plan
that ensures an appropriate inventory exists at all times to meet operational and
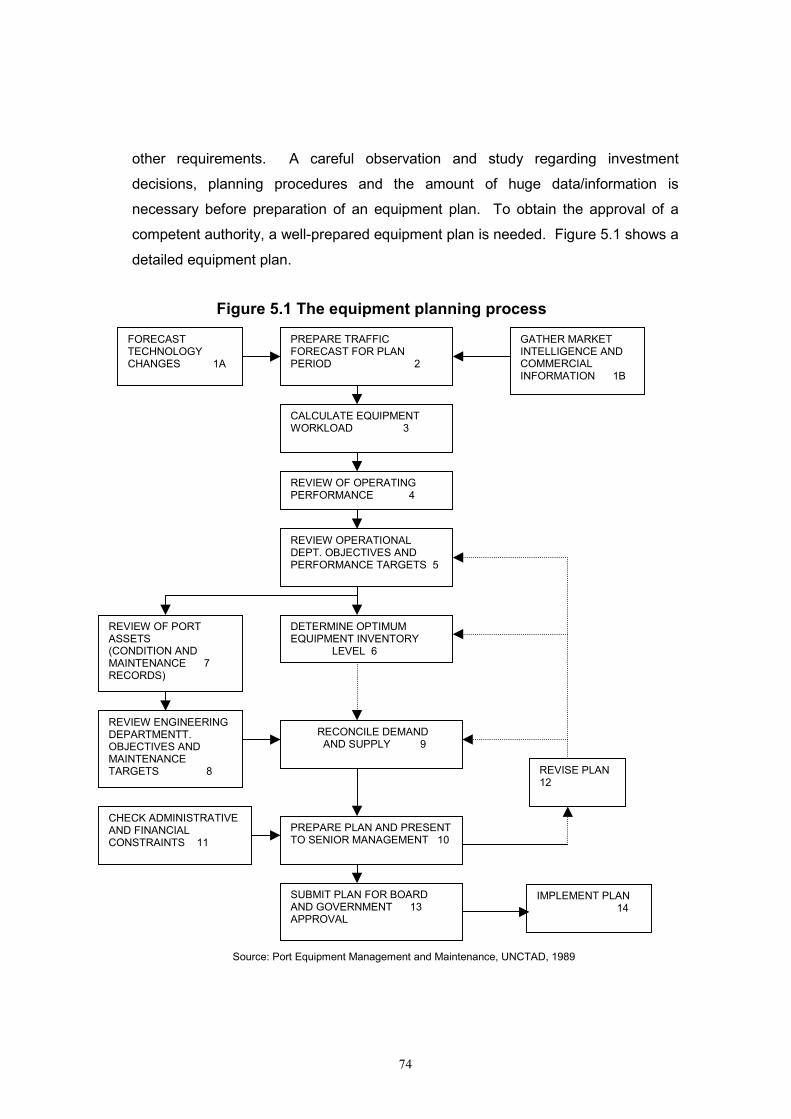
74
other requirements. A careful observation and study regarding investment
decisions, planning procedures and the amount of huge data/information is
necessary before preparation of an equipment plan. To obtain the approval of a
competent authority, a well-prepared equipment plan is needed. Figure 5.1 shows a
detailed equipment plan.
Figure 5.1 The equipment planning process
Source: Port Equipment Management and Maintenance, UNCTAD, 1989
PREPARE TRAFFICFORECAST FOR PLANPERIOD 2
GATHER MARKETINTELLIGENCE ANDCOMMERCIALINFORMATION 1B
FORECASTTECHNOLOGYCHANGES 1A
CALCULATE EQUIPMENTWORKLOAD 3
REVIEW OF OPERATINGPERFORMANCE 4
REVIEW OPERATIONALDEPT. OBJECTIVES ANDPERFORMANCE TARGETS 5
DETERMINE OPTIMUMEQUIPMENT INVENTORY LEVEL 6
RECONCILE DEMAND AND SUPPLY 9
PREPARE PLAN AND PRESENTTO SENIOR MANAGEMENT 10
SUBMIT PLAN FOR BOARDAND GOVERNMENT 13APPROVAL
REVISE PLAN12
IMPLEMENT PLAN 14
CHECK ADMINISTRATIVEAND FINANCIALCONSTRAINTS 11
REVIEW ENGINEERINGDEPARTMENTT.OBJECTIVES ANDMAINTENANCETARGETS 8
REVIEW OF PORTASSETS(CONDITION ANDMAINTENANCE 7RECORDS)
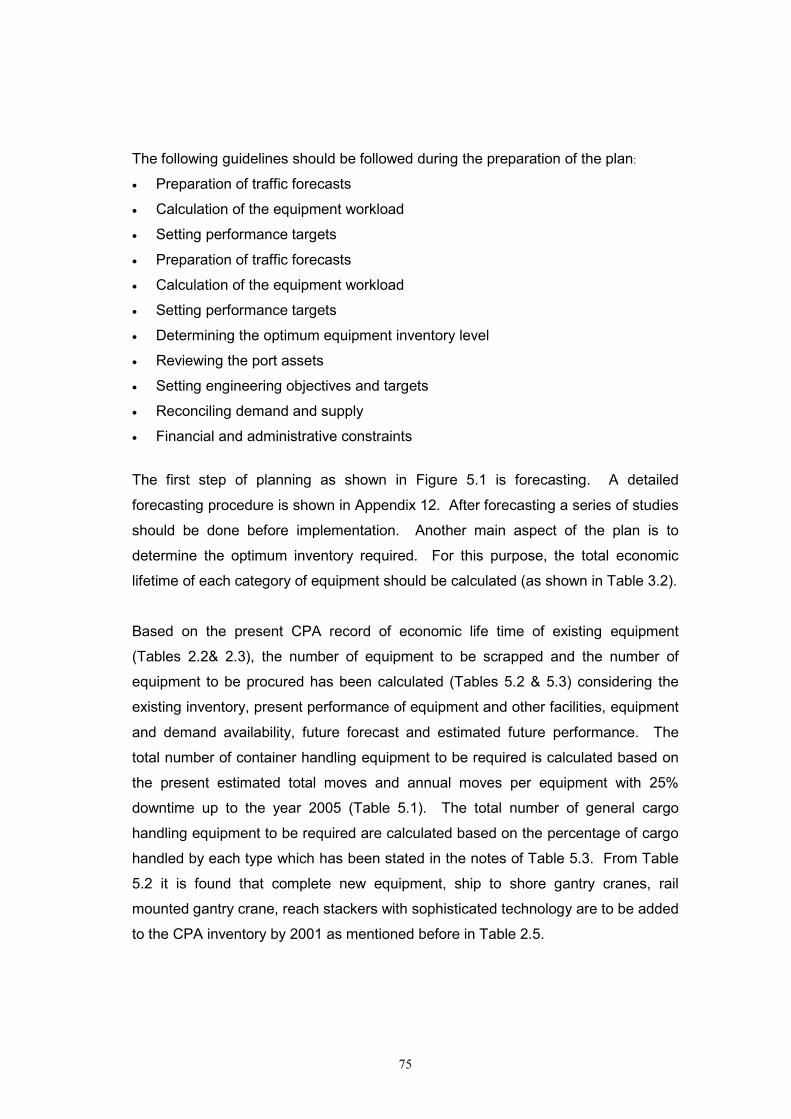
75
The following guidelines should be followed during the preparation of the plan:
• Preparation of traffic forecasts
• Calculation of the equipment workload
• Setting performance targets
• Preparation of traffic forecasts
• Calculation of the equipment workload
• Setting performance targets
• Determining the optimum equipment inventory level
• Reviewing the port assets
• Setting engineering objectives and targets
• Reconciling demand and supply
• Financial and administrative constraints
The first step of planning as shown in Figure 5.1 is forecasting. A detailed
forecasting procedure is shown in Appendix 12. After forecasting a series of studies
should be done before implementation. Another main aspect of the plan is to
determine the optimum inventory required. For this purpose, the total economic
lifetime of each category of equipment should be calculated (as shown in Table 3.2).
Based on the present CPA record of economic life time of existing equipment
(Tables 2.2& 2.3), the number of equipment to be scrapped and the number of
equipment to be procured has been calculated (Tables 5.2 & 5.3) considering the
existing inventory, present performance of equipment and other facilities, equipment
and demand availability, future forecast and estimated future performance. The
total number of container handling equipment to be required is calculated based on
the present estimated total moves and annual moves per equipment with 25%
downtime up to the year 2005 (Table 5.1). The total number of general cargo
handling equipment to be required are calculated based on the percentage of cargo
handled by each type which has been stated in the notes of Table 5.3. From Table
5.2 it is found that complete new equipment, ship to shore gantry cranes, rail
mounted gantry crane, reach stackers with sophisticated technology are to be added
to the CPA inventory by 2001 as mentioned before in Table 2.5.
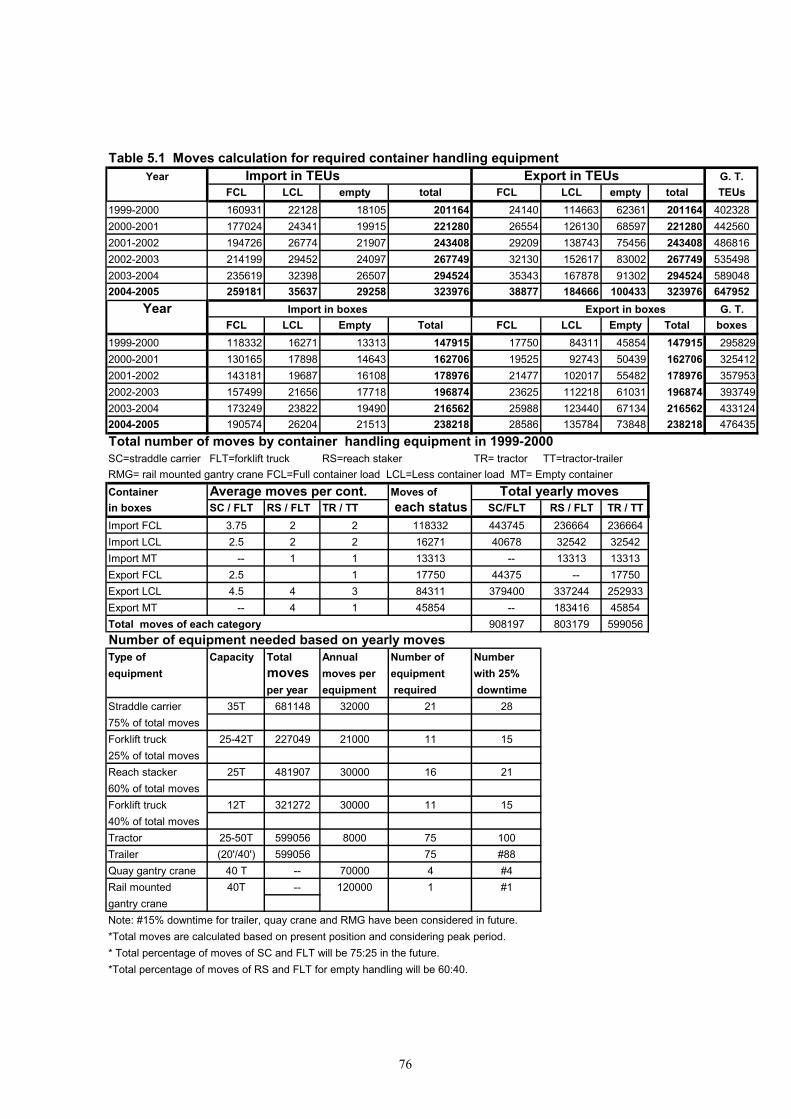
76
Table 5.1 Moves calculation for required container handling equipment Year Import in TEUs Export in TEUs G. T.
FCL LCL empty total FCL LCL empty total TEUs1999-2000 160931 22128 18105 201164 24140 114663 62361 201164 4023282000-2001 177024 24341 19915 221280 26554 126130 68597 221280 4425602001-2002 194726 26774 21907 243408 29209 138743 75456 243408 4868162002-2003 214199 29452 24097 267749 32130 152617 83002 267749 5354982003-2004 235619 32398 26507 294524 35343 167878 91302 294524 5890482004-2005 259181 35637 29258 323976 38877 184666 100433 323976 647952
Year Import in boxes Export in boxes G. T.FCL LCL Empty Total FCL LCL Empty Total boxes
1999-2000 118332 16271 13313 147915 17750 84311 45854 147915 2958292000-2001 130165 17898 14643 162706 19525 92743 50439 162706 3254122001-2002 143181 19687 16108 178976 21477 102017 55482 178976 3579532002-2003 157499 21656 17718 196874 23625 112218 61031 196874 3937492003-2004 173249 23822 19490 216562 25988 123440 67134 216562 4331242004-2005 190574 26204 21513 238218 28586 135784 73848 238218 476435Total number of moves by container handling equipment in 1999-2000SC=straddle carrier FLT=forklift truck RS=reach staker TR= tractor TT=tractor-trailerRMG= rail mounted gantry crane FCL=Full container load LCL=Less container load MT= Empty containerContainer Average moves per cont. Moves of Total yearly movesin boxes SC / FLT RS / FLT TR / TT each status SC/FLT RS / FLT TR / TTImport FCL 3.75 2 2 118332 443745 236664 236664Import LCL 2.5 2 2 16271 40678 32542 32542Import MT -- 1 1 13313 -- 13313 13313Export FCL 2.5 1 17750 44375 -- 17750Export LCL 4.5 4 3 84311 379400 337244 252933Export MT -- 4 1 45854 -- 183416 45854Total moves of each category 908197 803179 599056Number of equipment needed based on yearly movesType of Capacity Total Annual Number of Numberequipment moves moves per equipment with 25%
per year equipment required downtimeStraddle carrier 35T 681148 32000 21 2875% of total movesForklift truck 25-42T 227049 21000 11 1525% of total movesReach stacker 25T 481907 30000 16 2160% of total movesForklift truck 12T 321272 30000 11 1540% of total movesTractor 25-50T 599056 8000 75 100Trailer (20'/40') 599056 75 #88Quay gantry crane 40 T -- 70000 4 #4Rail mounted 40T -- 120000 1 #1gantry craneNote: #15% downtime for trailer, quay crane and RMG have been considered in future. *Total moves are calculated based on present position and considering peak period.* Total percentage of moves of SC and FLT will be 75:25 in the future.*Total percentage of moves of RS and FLT for empty handling will be 60:40.
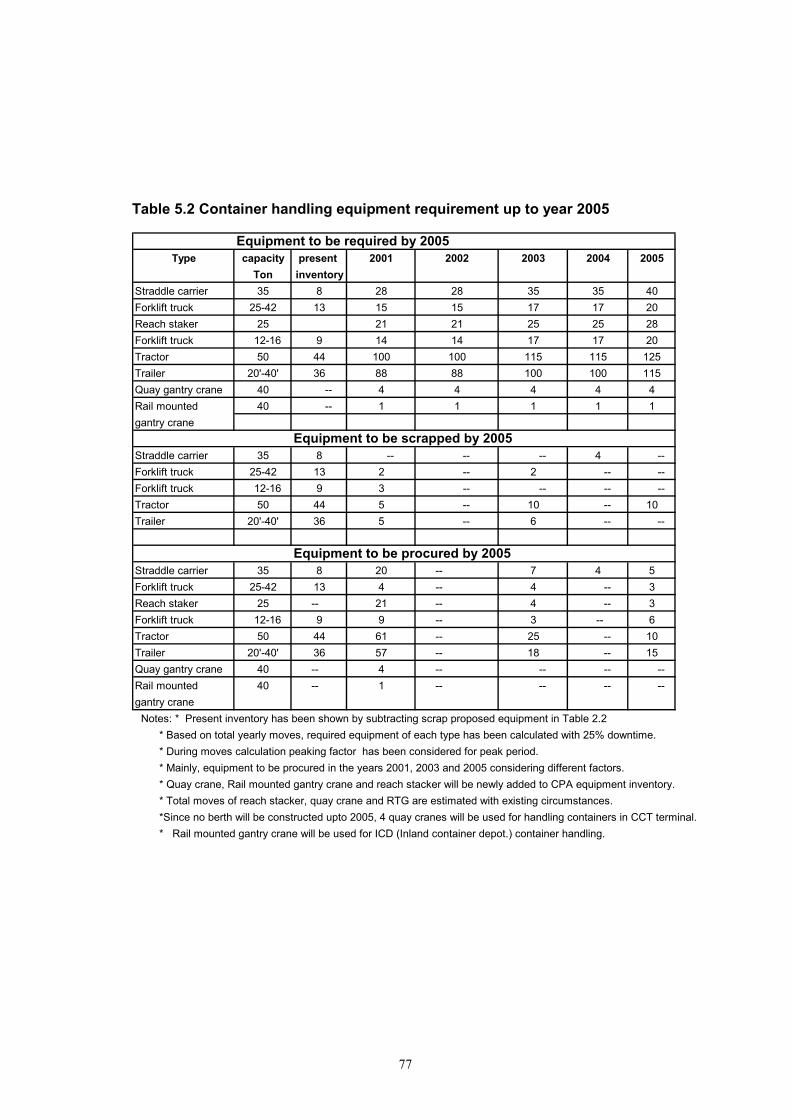
77
Table 5.2 Container handling equipment requirement up to year 2005
Equipment to be required by 2005Type capacity present 2001 2002 2003 2004 2005
Ton inventoryStraddle carrier 35 8 28 28 35 35 40Forklift truck 25-42 13 15 15 17 17 20Reach staker 25 21 21 25 25 28Forklift truck 12-16 9 14 14 17 17 20Tractor 50 44 100 100 115 115 125Trailer 20'-40' 36 88 88 100 100 115Quay gantry crane 40 -- 4 4 4 4 4Rail mounted 40 -- 1 1 1 1 1gantry crane
Equipment to be scrapped by 2005Straddle carrier 35 8 -- -- -- 4 --Forklift truck 25-42 13 2 -- 2 -- --Forklift truck 12-16 9 3 -- -- -- --Tractor 50 44 5 -- 10 -- 10Trailer 20'-40' 36 5 -- 6 -- --
Equipment to be procured by 2005Straddle carrier 35 8 20 -- 7 4 5Forklift truck 25-42 13 4 -- 4 -- 3Reach staker 25 -- 21 -- 4 -- 3Forklift truck 12-16 9 9 -- 3 -- 6Tractor 50 44 61 -- 25 -- 10Trailer 20'-40' 36 57 -- 18 -- 15Quay gantry crane 40 -- 4 -- -- -- --Rail mounted 40 -- 1 -- -- -- --gantry crane Notes: * Present inventory has been shown by subtracting scrap proposed equipment in Table 2.2 * Based on total yearly moves, required equipment of each type has been calculated with 25% downtime. * During moves calculation peaking factor has been considered for peak period. * Mainly, equipment to be procured in the years 2001, 2003 and 2005 considering different factors. * Quay crane, Rail mounted gantry crane and reach stacker will be newly added to CPA equipment inventory. * Total moves of reach stacker, quay crane and RTG are estimated with existing circumstances. *Since no berth will be constructed upto 2005, 4 quay cranes will be used for handling containers in CCT terminal. * Rail mounted gantry crane will be used for ICD (Inland container depot.) container handling.
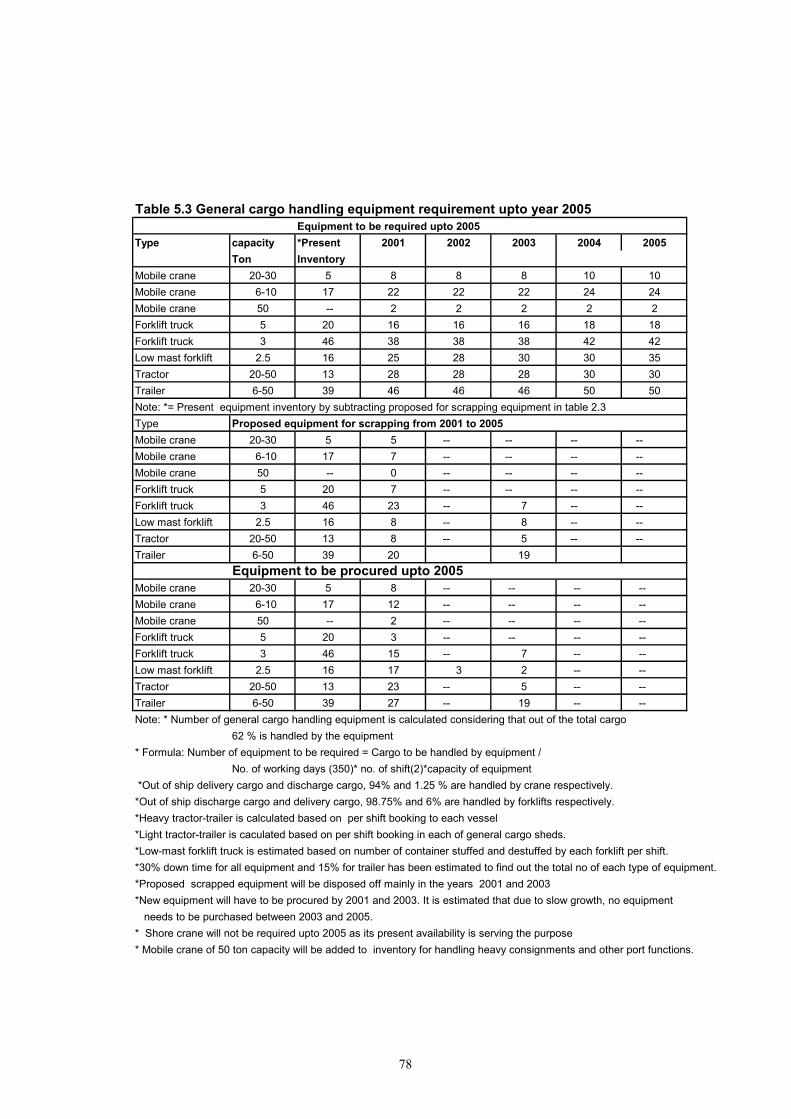
78
Table 5.3 General cargo handling equipment requirement upto year 2005Equipment to be required upto 2005
Type capacity *Present 2001 2002 2003 2004 2005Ton Inventory
Mobile crane 20-30 5 8 8 8 10 10Mobile crane 6-10 17 22 22 22 24 24Mobile crane 50 -- 2 2 2 2 2Forklift truck 5 20 16 16 16 18 18Forklift truck 3 46 38 38 38 42 42Low mast forklift 2.5 16 25 28 30 30 35Tractor 20-50 13 28 28 28 30 30Trailer 6-50 39 46 46 46 50 50Note: *= Present equipment inventory by subtracting proposed for scrapping equipment in table 2.3 Type Proposed equipment for scrapping from 2001 to 2005Mobile crane 20-30 5 5 -- -- -- --Mobile crane 6-10 17 7 -- -- -- --Mobile crane 50 -- 0 -- -- -- --Forklift truck 5 20 7 -- -- -- --Forklift truck 3 46 23 -- 7 -- --Low mast forklift 2.5 16 8 -- 8 -- --Tractor 20-50 13 8 -- 5 -- --Trailer 6-50 39 20 19
Equipment to be procured upto 2005Mobile crane 20-30 5 8 -- -- -- --Mobile crane 6-10 17 12 -- -- -- --Mobile crane 50 -- 2 -- -- -- --Forklift truck 5 20 3 -- -- -- --Forklift truck 3 46 15 -- 7 -- --Low mast forklift 2.5 16 17 3 2 -- --Tractor 20-50 13 23 -- 5 -- --Trailer 6-50 39 27 -- 19 -- --Note: * Number of general cargo handling equipment is calculated considering that out of the total cargo
62 % is handled by the equipment* Formula: Number of equipment to be required = Cargo to be handled by equipment /
No. of working days (350)* no. of shift(2)*capacity of equipment *Out of ship delivery cargo and discharge cargo, 94% and 1.25 % are handled by crane respectively.*Out of ship discharge cargo and delivery cargo, 98.75% and 6% are handled by forklifts respectively.*Heavy tractor-trailer is calculated based on per shift booking to each vessel*Light tractor-trailer is caculated based on per shift booking in each of general cargo sheds. *Low-mast forklift truck is estimated based on number of container stuffed and destuffed by each forklift per shift.*30% down time for all equipment and 15% for trailer has been estimated to find out the total no of each type of equipment.*Proposed scrapped equipment will be disposed off mainly in the years 2001 and 2003*New equipment will have to be procured by 2001 and 2003. It is estimated that due to slow growth, no equipment needs to be purchased between 2003 and 2005.* Shore crane will not be required upto 2005 as its present availability is serving the purpose* Mobile crane of 50 ton capacity will be added to inventory for handling heavy consignments and other port functions.
79
5.2.1 Advantages
• Increased port revenue by handling more traffic and more ships calling at the
port which contribute to the national economy through generating more value
added activities.
• Reduced operating costs of equipment by avoiding frequent breakdown, which
ultimately decreases cargo handling cost.
• Reduced overall costs by saving time. This means turnaround time decreases
and the potential ship owners will be encouraged more to use the port and
ultimately, the freight rates will go down. Import costs will decrease and
exporters will be able to compete in the international markets for exports,
garments for example.
• Creation of direct and indirect jobs due to increased port productivity will also
contribute to the national economy as an economic multiplier and solve
unemployment problem as well.
5.2.2 Constraints
• Uncertainty and risk of capital tied-up in investment and increase in interest rate
is a common aspect of any capital investment. If careful and efficient
management control over all related activities can not be ensured, there will be
little possibility to get the desired benefits.
• Scope of misuse of new equipment may happen if management supervision and
control are not ensured.
• Cost of inventory maintenance may be a great burden and challenge to the
management.
5.3 Second Solution: Improving performance of maintenance and operationIncreasing efficiency of a sea port is an important key to growth of more than 90%
world trade and hence without improvement ports will be a fundamental obstacle to
80
growth (Rissik, 2000). Therefore, CPA needs to improve its equipment performance
as it plays a key role in port operations. Following are the some main aspects for
improvement:
(1) Ensuring the proper role of equipment and operation management
(2) Establishing comprehensive training and incentive scheme
(3) Establishing an IT-based information system
(4) Creating infra-structural facilities
(1) Ensuring the proper role of Equipment and Operation ManagementEquipment and operation management must be well dedicated to improve the
overall performance of equipment. The following three main objectives as
mentioned in UNCTAD publication (Thomas & Roach, 1990, p.211) should be
followed by the equipment management as a guidance to achieve the required
performance:
• To provide efficient maintenance work by ensuring 85% availability of port cargo
handling equipment.
• To upgrade the knowledge and specialized skill of workshop personnel through
training and maintenance skills and the acquisition of modern cargo handling
equipment time to time.
• To ensure cost-effectiveness in the maintenance of equipment.
Based on these objectives, equipment management should perform the following
functions:
• A standard quality system should be established which ensures proper
supervision, quality control and inspection, good working environment, job
satisfaction, employee participation, good working practice and maintaining
proper records in every workshop.
• Downtime of equipment could be reduced by introducing opportunity
maintenance during non -working period. Moreover, instead of present one shift
(general shift) two shifts at day and night may be considered in the future.
• A spare parts inventory should be maintained in order to perform effective and
quick maintenance at all times. In this regard, care should be taken to
81
determine the minimum stock of strategic and non-strategic parts and to
maintain up to date records of issued items.
• An equipment Management Information System (EMIS) should be established
to monitor all information regarding maintenance and cost control and also
record all maintenance and repair costs for each piece of equipment.
Operation management should perform the following functions:
• To ensure an effective planning and control of berth operations which is the key
to improved cargo handling performance.
• To ensure specialized and integrated training of the dock labourers and other
berth employees so that flexibility to transfer men or gang for one activity to
another in response to operating conditions could be possible.
• To ensure frequent visits to the quays, sheds, yards and ships at berth by
keeping a close lookout for problems and thinking up improved methods.
• To maintain close coordination with equipment management to solve the
problems of equipment and operators quickly.
(2) Establishing comprehensive training and an incentive schemeTraining scheme
Training plays a vital role in any service organization like CPA. For example, the
Port of Singapore’s training programme has boosted productivity by 14% over ten
years aiming at training as a source of productivity, reduction of operational costs,
enhancement of the status of port workers and a source for future managers and
skilled employees (Loon, 1993). Management commitment to personnel
development is of paramount importance for the CPA.
In the light of the present situation as stated in chapter two, port management
should adopt a comprehensive training scheme that includes the following aspects:
• Training needs assessment of the employees
• Development of course and course materials
• Training must be motivation oriented
• Training must be evaluated
• Adequate funds should be ensured.
82
• Training Needs Assessment (TNA)This is an essential criterion before implementation of a training course. The CPA
training institute with the assistance of equipment management should make a
complete study to prepare the present and future needs of training of all categories
of the mechanical branch including management personnel. Moreover, a job
description of all employees should be prepared urgently so that every employee
can clearly understand and perform his duties and responsibilities.
• Development of courses and course materialsTraining courses and materials should be prepared on the basis of TNA and the
growing development in the field of cargo handling techniques and equipment. The
three courses, job related training, refresher and remedial training and common
training courses should be developed covering technical aspects such as all types of
maintenance and operational details and general aspects such as motivation, job
satisfaction, disciplinary matters, working environment, safety and security etc. for
all employees.
• Training must be motivation orientedMotivation is a management technique by which management tries to increase
productivity by using motivators such as pay, status, recognition etc. depending on
situations. The promise of training is a source of good motivation, if the
achievement of training can ensure better job prospects, recognition and promotion.
• Training must be evaluatedEvaluation must be done before and after training to determine * whether it is
accomplishing its objectives * to identify the strengths and weaknesses of the
course * to determine the cost-benefit ratio of the program * to get feedback from
trainees and trainers.
• Adequate funds should be assured
83
Allocation of adequate fund is pre-condition for adopting and implementing a
comprehensive continuous training scheme. The importance of training should be
realized from the present global competition where every port is growing mainly
based on the continuous training of the employees.
Incentive schemeAccording to the present performance and study of the problems that exist in
relation to cargo handling equipment, it is obvious that a comprehensive incentive
scheme is urgently needed to motivate the employees. A scheme has been
proposed for this purpose which includes the following:
• Free meal packet should be provided to all port employees during working
period. Moreover, subsidized canteen facilities should be established in all
workshops and other important places in the port.
• Incentives should be introduced for operators and dockworkers based on daily
and monthly performance of cargo handling.
• Incentives in the form of promotion, recognition, increment in salary should be
introduced based on maintenance and operational performance, accountability,
obedience to official discipline and other important criteria as written in yearly
evaluation sheet, maintained by CPA.
• Welfare facilities such as free education and scholarships for the children of
employees should be introduced.
(3) Establishing an IT- based information systemThe regional and European ports as described earlier are improving their system of
work successfully by introducing IT-based information systems for internal and
external communication. Every equipment planning, maintenance and operational
activity depends, for its effectiveness and efficiency, on the availability of relevant,
accurate and comprehensive information. Port and equipment management should
establish a computerized MIS system for communicating and collecting quick
information from their own and various departments. Later on, this system should
be extended to establish more advanced information system for giving services to
84
the port users, customs and others. The proposed MIS system will ensure the
following benefits:
• Equipment management will be able to achieve good maintenance and
equipment planning, control of work, control of spares and consumables,
measurement of operational performances of equipment, training and internal
communications.
• This will ultimately reduce time, save money and make management react
promptly in the decision making process.
Care must be taken by the equipment management to maintain the system with the
help of reliable personnel and to ensure regular input of maintenance data.
Otherwise, the system will ultimately collapse.
(4) Creation of infra-structural facilitiesEquipment performance is directly or indirectly influenced by port infra-structural
facilities as described in chapter 3. Among these facilities, berth and storage are
important. On the other hand, customs documentation is another important factor
which influences enormously on these facilities. Customs administration needs to
be managed and organized effectively if they are to make positive contribution to
their national prosperity and competitiveness as well as security of their respective
people ( Lozbenko, 1999). However, at this moment the port is not ready to
construct these facilities, interim arrangements are stated below to solve these up to
the year 2005.
Effective and planned use of existing container and general cargo berths
• At present, the yearly total of 1425 vessels, including 475 container vessels call
at the port. But there are only two dedicated container berths in the CPA which
are able to accommodate only two ocean-going vessels of each 180 meter
length and one inland container vessel. So, two general cargo berths out of 13
have been dedicated for containers.
• The berths as stated above are not enough for handling present and projected
throughputs as shown in the Table.5.4. The present capacity of berths at CCT
and GCB are calculated using the formula:
85
Capacity at CCT= 2 (no. of cranes per berth)* 15 (TEUs/hr.)* 350 (days)* 16
(hrs/day)* 0.50 (max. occupancy)* 2 (no. of berths) = 168000 TEUs. Similarly,
capacity at GCB is 123200 TEUs using the existing throughput 11 TEUs /hr. So,
the total throughputs, 291200 TEUs are less than the actual throughputs of
365,762 TEUs.
• The above calculation shows that there is a severe congestion in container
berths. Therefore, efforts are made to use 2 more general cargo berths, to
install quay gantry cranes at CCT, and to improve the overall cargo handling
performance in order to meet the requirement of container berths up to the year
2005.
• Based on the present and projected container and general cargo throughputs,
capacity and number of berths are calculated for general cargoes and containers
(Table 5.4).
• Actually, there should be no congestion in general cargo berths if the berths are
effectively used. But practically, congestion also happens due to other related
activities, proper monitoring and recording of arrival of vessels, for example.
• For general cargo handling, the total capacity of the 11 general cargo berths
calculated is 1872640 tons, which is sufficient to handle the existing 1573947
tonnes and projected traffic.
• Due to future plans to use two general cargo berths for containers, the capacity
of the rest of the general cargo berths should be increased by increasing gang
output and other performances. Finally, it is seen that the number of general
cargo berths is reduced to 9, which will be capable of handling the projected
traffic.
• Using the berths as proposed would effectively reduce congestion at the berths
and will help to reduce service time considerably and thus reduce overall
congestion at the port. Ultimately, total turnaround time will fall substantially and
port performance will increase.
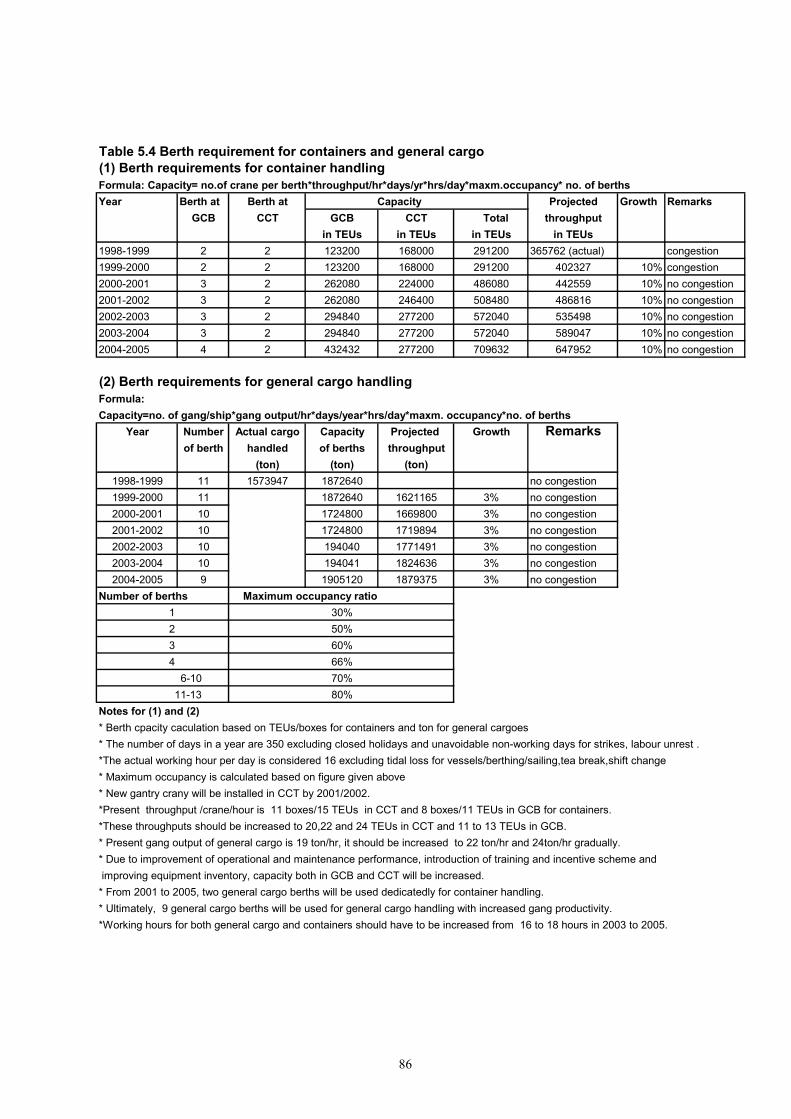
86
Table 5.4 Berth requirement for containers and general cargo(1) Berth requirements for container handlingFormula: Capacity= no.of crane per berth*throughput/hr*days/yr*hrs/day*maxm.occupancy* no. of berthsYear Berth at Berth at Capacity Projected Growth Remarks
GCB CCT GCB CCT Total throughputin TEUs in TEUs in TEUs in TEUs
1998-1999 2 2 123200 168000 291200 365762 (actual) congestion1999-2000 2 2 123200 168000 291200 402327 10% congestion2000-2001 3 2 262080 224000 486080 442559 10% no congestion2001-2002 3 2 262080 246400 508480 486816 10% no congestion2002-2003 3 2 294840 277200 572040 535498 10% no congestion2003-2004 3 2 294840 277200 572040 589047 10% no congestion2004-2005 4 2 432432 277200 709632 647952 10% no congestion
(2) Berth requirements for general cargo handlingFormula: Capacity=no. of gang/ship*gang output/hr*days/year*hrs/day*maxm. occupancy*no. of berths
Year Number Actual cargo Capacity Projected Growth Remarksof berth handled of berths throughput
(ton) (ton) (ton)1998-1999 11 1573947 1872640 no congestion1999-2000 11 1872640 1621165 3% no congestion2000-2001 10 1724800 1669800 3% no congestion2001-2002 10 1724800 1719894 3% no congestion2002-2003 10 194040 1771491 3% no congestion2003-2004 10 194041 1824636 3% no congestion2004-2005 9 1905120 1879375 3% no congestion
Number of berths Maximum occupancy ratio1 30%2 50%3 60%4 66%
6-10 70% 11-13 80%Notes for (1) and (2)* Berth cpacity caculation based on TEUs/boxes for containers and ton for general cargoes* The number of days in a year are 350 excluding closed holidays and unavoidable non-working days for strikes, labour unrest .*The actual working hour per day is considered 16 excluding tidal loss for vessels/berthing/sailing,tea break,shift change* Maximum occupancy is calculated based on figure given above* New gantry crany will be installed in CCT by 2001/2002.*Present throughput /crane/hour is 11 boxes/15 TEUs in CCT and 8 boxes/11 TEUs in GCB for containers. *These throughputs should be increased to 20,22 and 24 TEUs in CCT and 11 to 13 TEUs in GCB.* Present gang output of general cargo is 19 ton/hr, it should be increased to 22 ton/hr and 24ton/hr gradually.* Due to improvement of operational and maintenance performance, introduction of training and incentive scheme and improving equipment inventory, capacity both in GCB and CCT will be increased.* From 2001 to 2005, two general cargo berths will be used dedicatedly for container handling.* Ultimately, 9 general cargo berths will be used for general cargo handling with increased gang productivity. *Working hours for both general cargo and containers should have to be increased from 16 to 18 hours in 2003 to 2005.
87
Storage requirements for containers and general cargoBased on existing storage facilities for containers and general cargo, a computer
simulation has been done to find out the required storage capacity for the present
and future traffic.
• The existing total storage area for general cargo inside and outside protected
are nearly 400000 sq.m. To accommodate within existing storage capacity, the
present dwell time of 20 days has been decreased to 12 days.
• Present storage areas for containers in CCT and GCB is 260443 sq.m. and
container-holding capacity at both the areas is about 9000 TEUs (Table 2.4). It is
found from the calculation (Table 5.5) based on existing dwell time for FCL, LCL
and empty containers, 4, 4,11and 14,5,15 respectively for exports and imports
(Table 3.5) and different factors, the total storage required are 337795 sq.m.
This indicates that there is a significant shortage of container storage area
• This situation has been overcome by decreasing dwell time for all status of
containers and increasing the stacking height of export and import empty
containers. Then, required storage areas,197,881sq.m. have been found, which
will serve the present and future requirement. If more storage area is needed,
the existing CFS area may be used in case of emergency that might require
extra movements.
• For CFS, the existing storage areas in GCB and CCT are 86168 and 12700
sq.m. respectively, which are sufficient enough to satisfy the present and future
requirements.
• With the estimated growth rate of 10% and 3% for containers and general cargo
respectively up to 2005, the requirement of the storage area will be fulfilled with
the introduction of some steps.
• To reduce the dwelling time, mainly, the delays should be reduced in customs
on the one hand and the port tariff policy should be reviewed on the other hand.
• Adopting a realistic free storage period and punitive tariffs for overdue
cargo/containers should be considered during tariff revisions.
• Port administrative and custom procedures could be simplified using useful
computer programmes efficiently and establishing a good communication
system with customs.
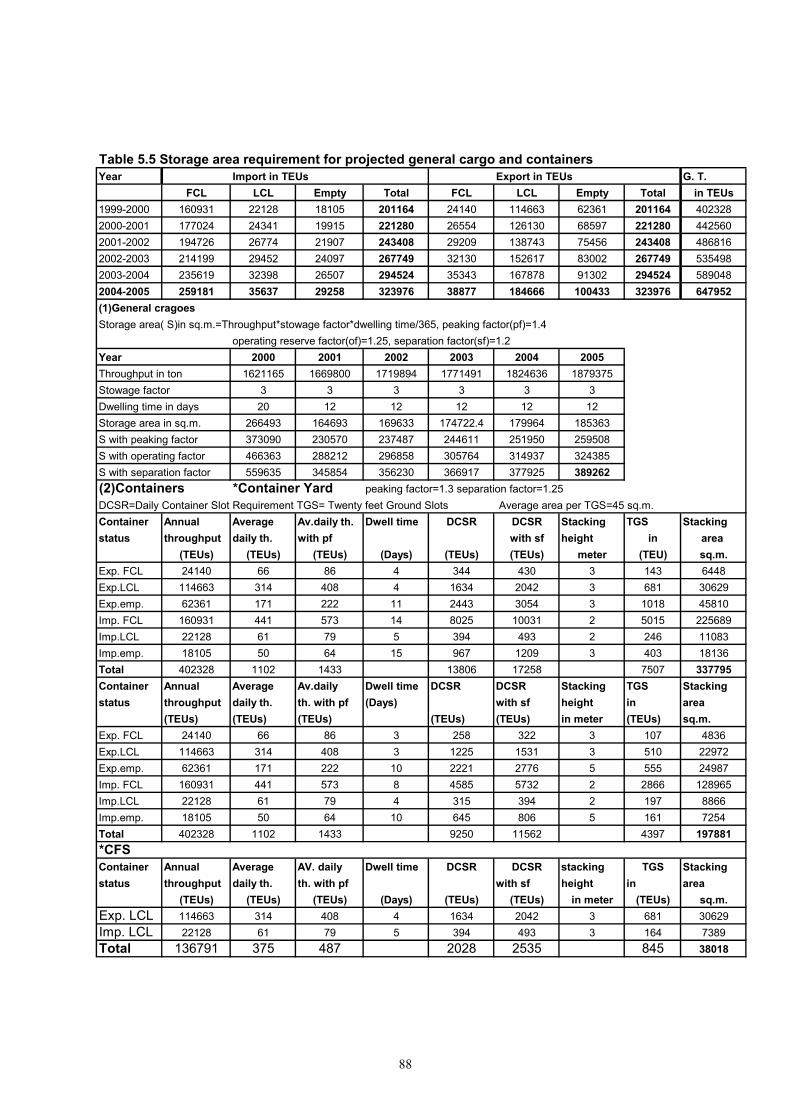
88
Table 5.5 Storage area requirement for projected general cargo and containersYear Import in TEUs Export in TEUs G. T.
FCL LCL Empty Total FCL LCL Empty Total in TEUs1999-2000 160931 22128 18105 201164 24140 114663 62361 201164 4023282000-2001 177024 24341 19915 221280 26554 126130 68597 221280 4425602001-2002 194726 26774 21907 243408 29209 138743 75456 243408 4868162002-2003 214199 29452 24097 267749 32130 152617 83002 267749 5354982003-2004 235619 32398 26507 294524 35343 167878 91302 294524 5890482004-2005 259181 35637 29258 323976 38877 184666 100433 323976 647952(1)General cragoesStorage area( S)in sq.m.=Throughput*stowage factor*dwelling time/365, peaking factor(pf)=1.4
operating reserve factor(of)=1.25, separation factor(sf)=1.2Year 2000 2001 2002 2003 2004 2005Throughput in ton 1621165 1669800 1719894 1771491 1824636 1879375Stowage factor 3 3 3 3 3 3Dwelling time in days 20 12 12 12 12 12Storage area in sq.m. 266493 164693 169633 174722.4 179964 185363S with peaking factor 373090 230570 237487 244611 251950 259508S with operating factor 466363 288212 296858 305764 314937 324385S with separation factor 559635 345854 356230 366917 377925 389262(2)Containers *Container Yard peaking factor=1.3 separation factor=1.25 DCSR=Daily Container Slot Requirement TGS= Twenty feet Ground Slots Average area per TGS=45 sq.m.Container Annual Average Av.daily th. Dwell time DCSR DCSR Stacking TGS Stacking status throughput daily th. with pf with sf height in area
(TEUs) (TEUs) (TEUs) (Days) (TEUs) (TEUs) meter (TEU) sq.m.Exp. FCL 24140 66 86 4 344 430 3 143 6448Exp.LCL 114663 314 408 4 1634 2042 3 681 30629Exp.emp. 62361 171 222 11 2443 3054 3 1018 45810Imp. FCL 160931 441 573 14 8025 10031 2 5015 225689Imp.LCL 22128 61 79 5 394 493 2 246 11083Imp.emp. 18105 50 64 15 967 1209 3 403 18136Total 402328 1102 1433 13806 17258 7507 337795Container Annual Average Av.daily Dwell time DCSR DCSR Stacking TGS Stacking status throughput daily th. th. with pf (Days) with sf height in area
(TEUs) (TEUs) (TEUs) (TEUs) (TEUs) in meter (TEUs) sq.m.Exp. FCL 24140 66 86 3 258 322 3 107 4836Exp.LCL 114663 314 408 3 1225 1531 3 510 22972Exp.emp. 62361 171 222 10 2221 2776 5 555 24987Imp. FCL 160931 441 573 8 4585 5732 2 2866 128965Imp.LCL 22128 61 79 4 315 394 2 197 8866Imp.emp. 18105 50 64 10 645 806 5 161 7254Total 402328 1102 1433 9250 11562 4397 197881*CFSContainer Annual Average AV. daily Dwell time DCSR DCSR stacking TGS Stacking status throughput daily th. th. with pf with sf height in area
(TEUs) (TEUs) (TEUs) (Days) (TEUs) (TEUs) in meter (TEUs) sq.m.Exp. LCL 114663 314 408 4 1634 2042 3 681 30629Imp. LCL 22128 61 79 5 394 493 3 164 7389Total 136791 375 487 2028 2535 845 38018
89
5.3.1 Advantages
• Improved equipment and operation performance will ensure overall port
productivity by ensuring equipment availability, reducing overall turnaround time
and thereby reducing ship waiting time costs, ship cost at berth, cargo handling
costs, and reduce overall inland transport costs.
• The economic life of the equipment will be increased; major investment costs will
be saved.
• Introduction of IT- based MIS will ensure maximum efficiency, effectiveness and
responsiveness in the management system.
• Reduced port congestion will prevent imposing surcharges by the ship owners.
• Employees will be encouraged to contribute more for the organization as they
are motivated by the improved systems.
5.3.2 Constraints
• If equipment operating costs are not controlled effectively, the costs will increase
and impact on port operating surplus and thus create pressure to increase tariffs
to compensate, which may be an economic blow for the port users.
• If the equipment misses its routine services, any minor problems may turn into
major defects, causing breakdowns and excessive repairs.
• Care should be taken that poor maintenance of roads, quays and backup areas
can severely reduce the life of the cargo handling equipment.
• Substandard operating performance and high demand for maintenance would
cause increased cargo handling costs.
5.4 Third Solution: Giving more autonomy to the portChittagong port is a state-owned service organization that governs 80% of the
country’s export-import trade. Considering its importance, more autonomy should
be given to the port to run it in a more unrestricted manner and free to adopt its own
policy for any improvement in port cargo handling operations in the future. In recent
years, there has been a clear trend everywhere to increase autonomy in the port
sector due to increased competition. In view of this, it is obvious that CPA needs
90
more autonomy to keep its existing position and to increase more market share by
competing with national ports and regional ports. However, different forms of
government controls have been acting on the port. Considering this, the following
steps should be taken to ensure more autonomy to the port.
• The port should be given greater autonomy and freedom to manage their own
affairs, by relaxation of government controls on all aspects of equipment
management, while still retaining some government control to protect the
national interest.
• Government policy to appoint top management from other public sectors should
be changed by appointing experienced personnel from the port and shipping
sector who will better serve the port.
• The government should encourage and initiate measures for financing port
capital investment through the international lending institutions and bilateral
funding from foreign governments with a flexible regulatory role.
• Since the port itself earns foreign currency directly, it should have full autonomy
to use this fund quickly in response to its development.
• The port should have full autonomy to review and determine its own tariffs
without government intervention to achieve marketing and financial objectives.
• To select and recruit manpower for a new project, ‘procurement of new
equipment project’ for example, the port should be given full autonomy to select
and recruit the right manpower within the shortest time.
• Finally, the Port Ordinance Act, 1976 should be reviewed and government
policy should be re-defined so that port can take steps to improve equipment
performance.
5.4.1 Advantages
• Increased efficiency of the port by quick response to the requirements
• Greater contribution to the national economy will be by promoting the exports-imports of the country.
• Increased trade growth and foreign exchange earnings will contribute to the
country’s GDP and import capability.
91
5.4.2 Constraints
• Risk of misuse of port fund if it is not properly utilized.
• Strong management commitment is essential otherwise performance could
ultimately slow down.
5.5 ConclusionThe given solutions could be useful if the port and equipment management as well
as all the employees involved in equipment maintenance and operation are aware
that the existing situation must be changed in order to achieve required equipment
performance. Moreover, the present global trend of containerization will never be
fully realized if an adequate stock of the right type of equipment is not provided.
Furthermore, it should be borne in mind that the country’s import will be more
expensive and export will be uncompetitive if port cargo handling productivity is low
and the resultant effects are a high unit cost and increased ship time at the port.
92
CHAPTER 6
CONCLUSION AND RECOMMENDATIONS
6.1 ConclusionThe main objective of this dissertation is to analyze the cargo handling equipment
productivity of the port of Chittagong by identifying and analyzing the factors
influencing its productivity.
The present position of the port is that its traffic is growing. But on the other hand,
port services are not being developed and well maintained to keep pace with that
growing trend. The growing trend towards containerization is remarkable. On the
basis of this trend, future forecasting has been done.
The serious problems that the port is facing now are lack of facilities and services to
cope with the growing traffic. The cargo handling equipment performance depends
on the adequacy and reliability of machines, their maintenance, operational
performance of the employees and other internal and external influencing factors.
The influencing factors identified are port internal labour unrest, political and
economic condition of the country, regional and international trends of trade,
interdepartmental coordination and co-operation, port storage and berth capacity,
traffic forecasting, government interference and cumbersome documentation
procedures.
The existing situation of equipment is not satisfactory at all. The equipment, which
is aged and proposed for scrapping, is a burden on the equipment management as
93
they increase downtime and decrease the maintenance performance. On the other
hand, employees are not motivated to dedicate themselves in order to improve the
present situation. The main reasons behind this are insufficient salary, incentives
and lack of effective training.
The factors stated above influence negatively the equipment performance. All these
factors not only have drawbacks of their own, but they are also closely inter-linked to
each other. For example, delay in custom procedures and documentation results in
high level of dwell time. This dwell time creates congestion in the port yards calling
for much shifting/re-handling of containers within the port. The outcome is an
increased requirement of container handling equipment and container parking
areas.
According to the trends and forecasts of container traffic (Table 3.3), CPA needs
modern container handling equipment and quick related development in the field of
human resources and other infra-structural facilities.
By using a SWOT Analysis, the weaknesses and threats of the port are identified
compared with local, regional and developed ports. Solutions have been suggested
mainly in three fields: maintaining a proper equipment inventory, improving
performance of equipment maintenance and operation and giving more autonomy to
the port.
Finally, it is evident that there is a great deal of interdependence between all port
activities linked with cargo handling. Equipment is an important element of these
activities. So, in order to achieve the best performance from the equipment, the
spirit of common consciousness/joint effort should be developed which could lead
the port to its desired goal.
6.2 RecommendationsAs solutions have been proposed and described in the previous chapter. So, some
specific measures for short, medium and long-term periods are recommended
94
based on these solutions. The duration for three terms will be one, two and five
years respectively. In order to maintain close coordination short and medium terms
should be applied together. Finally, a comment is presented for this work.
(1) Acquisition of new cargo handling equipmentShort and mid-term Measures
• Port management should take the immediate steps to dispose of the aged
equipment (Tables 5.2 & 5.3).
• New cargo handling equipment should be procured in 2001. In this regard, the
necessary government approval should be taken up immediately.
• Immediate action should be taken to select and recruit the required manpower
• The port should implement this investment from its own funds.
Long -term Measures
• To ensure the availability of the equipment up to 2005, another procurement
action should be taken in 2003.
• Port management should initiate actions now in order to achieve government
approval and arrange funding by government secured loans from multilateral
lending institutions (World Bank, Asian Development Bank, etc.).
(2) Improving port equipment and operational performance Short and medium-term Measures
• Port and equipment management should take actions in restructuring of
maintenance work organization, improving the working environment, executing
the maintenance plan and establishing standard procedures. Management
should introduce two shifts maintenance system instead of existing one general
shift in order to reduce the downtime of the equipment.
• Operation management should introduce an effective plan to harmonize and
control and supervise all berth operations.
• Port management should urgently adopt a policy to introduce a computerized
MIS system connecting all departments, with due importance given to the
introduction of EMIS and OMIS in equipment and operation management
95
• A comprehensive needs based training scheme should be adopted for imparting
training to all categories including supervisory and management personnel.
• The port should introduce an interim incentive scheme for the operators and
dock workers based on daily/monthly cargo handling performance. In this
regard, a fund should be arranged from the port’s own resources.
Long-term Measures
• Port Management should prepare a plan and submit it to the government to
increase the salary of port employees considering the present inflation rate (7%).
• A comprehensive permanent incentive scheme should be introduced covering
financial benefits, free meals, welfare facilities, promotions, and job recognition
to employees based on monthly and yearly performance of overall activities.
• The port should bear the expenses of all additional costs from its own fund.
(3) Reducing congestion at the port Short-Medium term Measures
• Port management should increase the actual berth working time from 16 to 18
hours to handle growing traffic.
• Management supervision and control in all corners of the cargo handling
operation must be ensured.
• Customs documentation and port internal administrative procedures should be
simplified by introducing computer systems.
• The port security system should be redesigned in order to reduce traffic
congestion at the gate and inside the port
• The port tariff policy should urgently review in order to reduce dwell time of
cargo/containers.
Long -term Measures
• The port should take necessary steps to construct new terminal and berths for
the future traffic.
• The government should come into dialogue with political parties to keep the port
free from any political unrest, strikes and pass regulations in this context
96
considering the strategic and economic importance of ports to the nation and its
economy.
•
(4) Giving more autonomy to the portShort-Medium term Measures
• The government should give complete autonomy to CPA for replace and procure
cargo handling equipment and to introduce an interim training and incentive
scheme from its own funds in order to improve the present cargo handling
operation in the port. For this purpose, the port should be allowed to retain
sufficient foreign currencies.
• The government should influence the custom authority directly to solve the
problems of delays due to customs documentation.
• The government should give full autonomy to the port to select and send its
employees to participate in port related training courses abroad.
Long -term Measures
• The government should think about a commercialization and deregulation policy
where port management is given autonomy and is accountable for its decisions
and performance.
Final CommentCargo handling equipment and its productivity may be compared with human
beings. Human beings after coming into existence need proper care,
education/training and other fundamental needs for their continuous developments.
Similarly, equipment after acquisition needs proper maintenance and operation
fulfilling its requirements such as spare parts, skilled and motivated manpower, good
environment etc. in order to achieve the best performance. So, the four main
aspects, equipment inventory, standard system, training and incentives/motivation
are highlighted in analyzing the equipment productivity.
However, there is a vast scope for detailed studies and analysis of different
categories of cargo handling equipment and other related activities. This is an
author’s little step to indicate the direction for further study and research in this field.
97
REFERENCES
Alderton, P. M. (1995). Sea transport :operation and economics (4th ed. ). London:
Thomas Reed Publications.
Alderton, P. M. (2000). An analysis of change concerning ports and shipping.
Unpublished lecture handout, World Maritime University, Malmö, Sweden.
Bhuiyan, E. A. (1999). Shipping World. Chittagong, Bangladesh: Rokeya Begum.
Branch, A. E. (1997). Elements of Port Operation and Management. London:
Chapman & Hall.
Calcutta Port Trust. (1998). Brief History of Calcutta Port Trust. Retrieved June 1,
2000 from the World Wide Web: http://www.portofcalcutta.com/history.html
Canamero, C. (2000). Port Pricing. Unpublished lecture handout. World Maritime
University, Malmö, Sweden.
Cass, S. (1999, September). Buying opportunities. Cargo Systems, 9 (26), 43-45.
Chittagong Port Authority. (1995). Master plan of Chittagong port. Chittagong,
Bangladesh: Author.
Chittagong Port Authority. (1996 -1998). Year book. Chittagong, Bangladesh:
Author.
Chittagong Port Authority. (1997-98). Administrative Report. Chittagong,
Bangladesh:Author.
Chittagong Port Authority. (1999). Chittagong Port, an overview. Chittagong,
Bangladesh: Author.
Chittagong Port Authority. (1999). Project proforma : Procurement of container
handling equipment including gantry crane. Chittagong,
Bangladesh:Author.
98
Constantinides, M. (1990). UNCTAD Monographs on Port Management (8):
Economic approach to equipment selection and replacement. New York:
United Nations.
Crook, G. (2000). Equipment maintenance and management. Unpublished lecture
handout, World Maritime University, Malmö, Sweden.
Francou, B. (1999). Macro - economics. Unpublished lecture handout, World
Maritime University, Malmö, Sweden.
Francou, B. (2000a). Port performance Indicators. Unpublished lecture handout,
World Maritime University, Malmö, Sweden.
Francou, B. (2000b). Human resources. Unpublished lecture handout, World
Maritime University, Malmö, Sweden.
Indian Ports Association .(1999). Major ports of India: A profile, 1997-98. New Delhi,
India: Author.
Informa group plc. (2000). Ports and terminals: Far East & Asia. Containerization
International Yearbook 2000 (pp.133-160). London: Author.
Institute of Shipping Economics and Logistics (ISL). (1999). Shipping Statistics
Yearbook, 1999 (pp. 113-127). Bremen: Author.
Ircha, M. C. (1999). Port strategic planning: Canadian port reform. Article prepared
for possible publication in Maritime policy and Management, July, 1999.
Karunadasa, K. D. (1997). An analytic study of cargo handling in the port of
Colombo. Unpublished master’s thesis, World Maritime University, Malmö,
Sweden.
Lipsey, R.G. & Chrystal, K. A. (1999). Principles of Economics (9th ed.). Oxford:
Oxford University Press.
99
Loon, G. K. (1993). Ports and human factor: ‘’Human research development in port
to meet the impact of gobal economic change.’’ In Proceedings of 18th
IAPH World Ports Conference (pp.79 - 83). Tokyo: The International
Association of Ports and Harbours.
Lozbenko, L. (1999). Creating an International Customs Environment that Supports
Global Trade. In Proceedings of the 21st World Ports Conference (pp. 137-
139). Tokyo: The International Association of Ports and Harbours.
Lucey, T. (1997). Management Information System (8th ed. ). London: Letts
Educational.
Ma, S. (2000). Quantitative methods for decision makings in ports. Unpublished
lecture handout, World Maritime University, Malmö, Sweden.
Malta Freeport Corporation. (1998). Annual Review: Malta Freeport Corporation.
Malta: Author.
McDonagh S. (2000, May). The art of traffic forecasting: how to do it and why. Port
Development International, 16 (4) 24-26.
Melton & Ludig. (1985-86, December/January). Plant management: The 36 deadly
sins. Port Development International, 2 (1), 14-15.
Ministry of Shipping, Ports, Rehabilitation & Reconstruction. (1997). National ports
and shipping policy of Srilanka. Colombo, Srilanka: Author.
Mongla Port Authority. (1998-99). Port information handout. Mongla, Bangladesh:
Author.
Municipal Port Management. (1998). Annual report: Rotterdam Municipal Port
Management. Rotterdam: Author.
Ocean Shipping Consultants. (1999). World container port markets to 2012.
Chertsey, Surrey: Author.
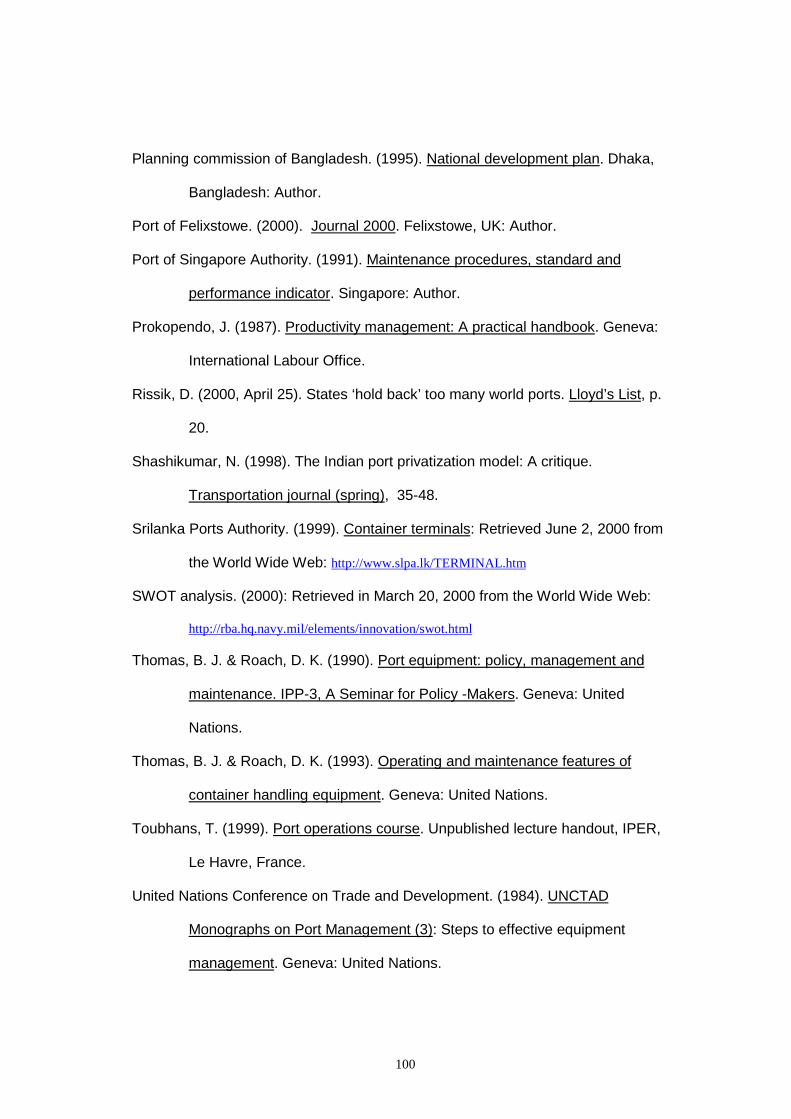
100
Planning commission of Bangladesh. (1995). National development plan. Dhaka,
Bangladesh: Author.
Port of Felixstowe. (2000). Journal 2000. Felixstowe, UK: Author.
Port of Singapore Authority. (1991). Maintenance procedures, standard and
performance indicator. Singapore: Author.
Prokopendo, J. (1987). Productivity management: A practical handbook. Geneva:
International Labour Office.
Rissik, D. (2000, April 25). States ‘hold back’ too many world ports. Lloyd’s List, p.
20.
Shashikumar, N. (1998). The Indian port privatization model: A critique.
Transportation journal (spring), 35-48.
Srilanka Ports Authority. (1999). Container terminals: Retrieved June 2, 2000 from
the World Wide Web: http://www.slpa.lk/TERMINAL.htm
SWOT analysis. (2000): Retrieved in March 20, 2000 from the World Wide Web:
http://rba.hq.navy.mil/elements/innovation/swot.html
Thomas, B. J. & Roach, D. K. (1990). Port equipment: policy, management and
maintenance. IPP-3, A Seminar for Policy -Makers. Geneva: United
Nations.
Thomas, B. J. & Roach, D. K. (1993). Operating and maintenance features of
container handling equipment. Geneva: United Nations.
Toubhans, T. (1999). Port operations course. Unpublished lecture handout, IPER,
Le Havre, France.
United Nations Conference on Trade and Development. (1984). UNCTAD
Monographs on Port Management (3): Steps to effective equipment
management. Geneva: United Nations.

101
United Nations Conference on Trade and Development. (1985). Port development:
A handbook for planners in developing countries (2nd ed.). New York:
United Nations.
United Nations Conference on Trade and Development. (1986). Container terminal
development: Improving Port Performance. Geneva: United Nations.
United Nations Conference on Trade and Development. (1989). Port equipment
management and maintenance: IPP-3, A Seminar for Policy -Makers.
Geneva: United Nations.
United Nations Conference on Trade and Development. (1997). Review of Maritime
Transport: Report by UNCTAD Secretariat. Geneva: United Nations.
United Nations Conference on Trade and Development. (1999, November). 21st
World Ports Conference of IAPH. UNCTAD Ports Newsletter,19, 3.
Ward, M. (1999). Essential Management Techniques. Aldershot, London: Gower
Publishing Ltd.
World Bank(1999). World Bank Report: Bangladesh and country brief. Retrieved
June 1, 2000 from the World Wide Web: http://wbln1018.worldbank.org./
Young, B. (2000, March). Speaking with forked tongues: Despite the dominance of
the reach stacker in the container handling sector the forklift is undergoing
renaissance. Port Development International, 16 (2), 25-28.
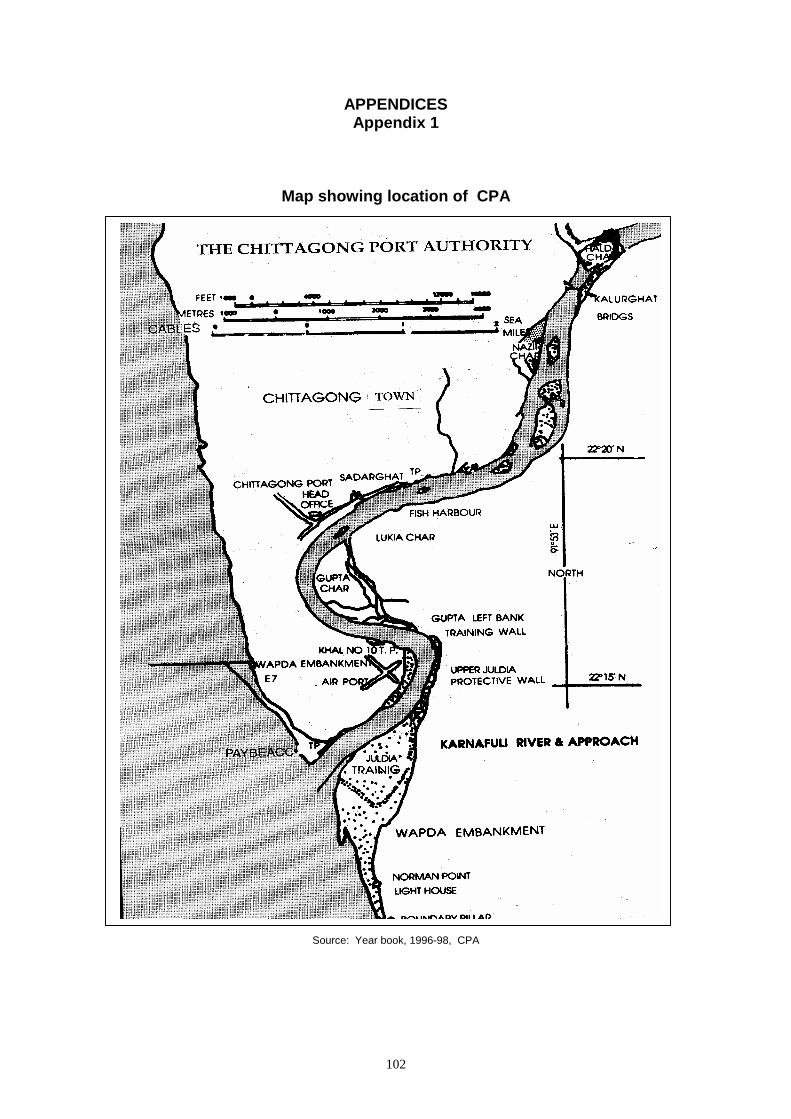
102
APPENDICESAppendix 1
Map showing location of CPA
PROCEDURE
Source: Year book, 1996-98, CPA
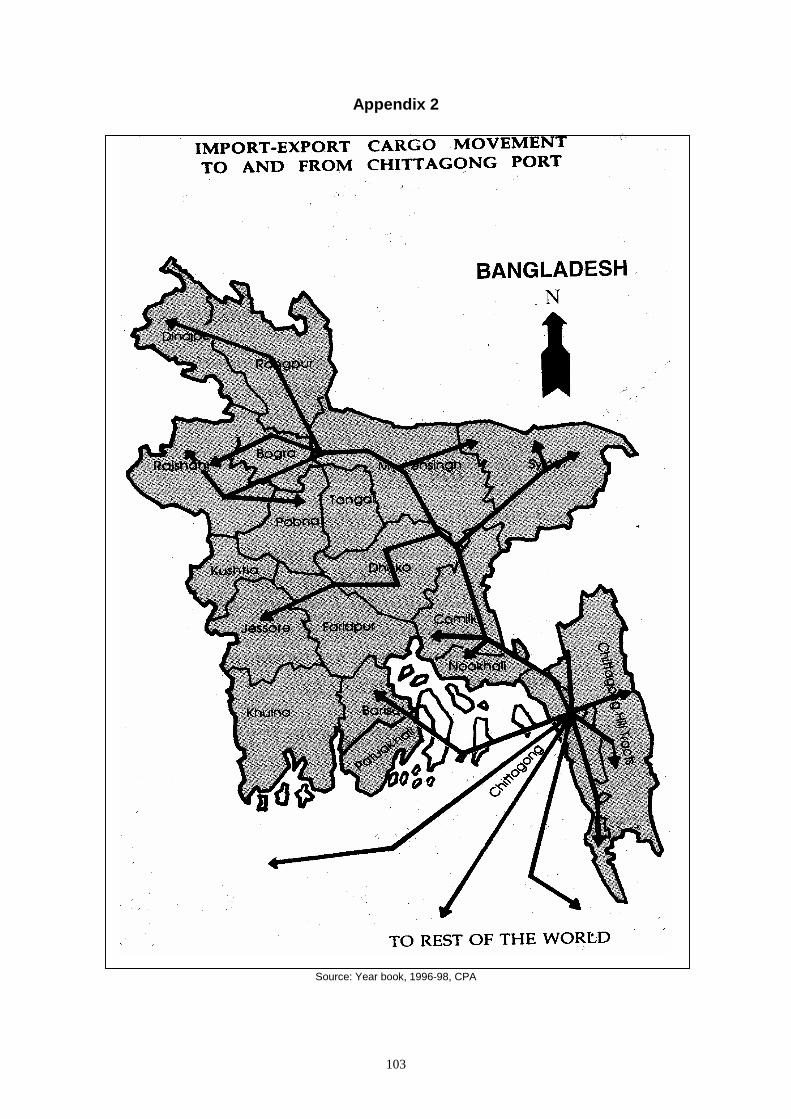
103
Appendix 2
Source: Year book, 1996-98, CPA
104
Appendix 3
Organization chart of CPA
SECRETARY DIRECTOR ADMINISTRATION
DIRECTORTRAFFIC
DIRECTORSECURITY
CHIEF PLANNING CHIEF MEDICALOFFICER
CHIEF FINANCEAND ACCOUNTS
OFFICER
CHIEF AUDITOFFICER
MEMBERFINANCE
DEPUTYCONSERVATOR
DEPUTY CHIEFENGINEER (MARINE)
CHIEFHYDROGRAPHER
MEMBEROPERATION
CHIEFENGINEER
PROJECTMANAGER
DIRECTORELECTRICAL &MECHANICAL
CONTROLLEROF
STORES
MEMBERENGINEERING
CHAIRMAN
BOARD OF MEMBERS
Source: CPA
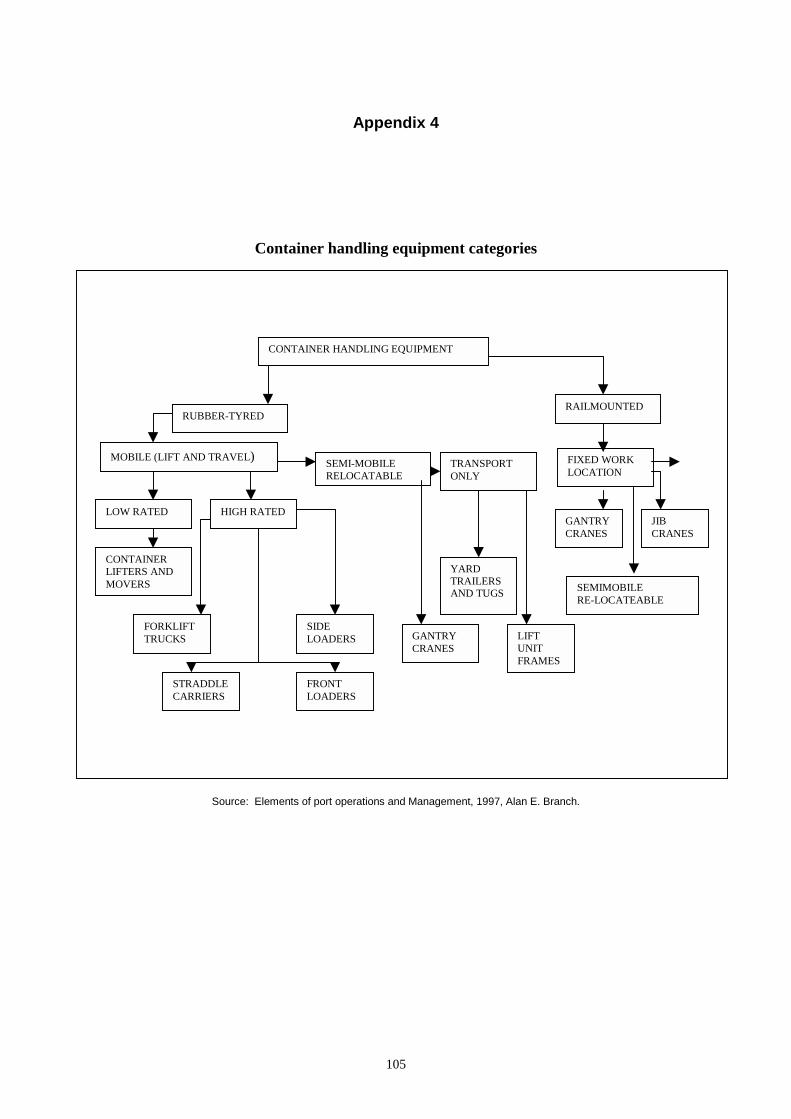
105
Appendix 4
Container handling equipment categories
Source: Elements of port operations and Management, 1997, Alan E. Branch.
CONTAINER HANDLING EQUIPMENT
RUBBER-TYREDRAILMOUNTED
MOBILE (LIFT AND TRAVEL) SEMI-MOBILERELOCATABLE
TRANSPORTONLY
FIXED WORKLOCATION
SEMIMOBILERE-LOCATEABLE
GANTRYCRANES
JIBCRANES
YARDTRAILERSAND TUGS
LIFTUNITFRAMES
GANTRYCRANES
LOW RATED HIGH RATED
CONTAINERLIFTERS ANDMOVERS
FORKLIFTTRUCKS
SIDELOADERS
STRADDLECARRIERS
FRONTLOADERS
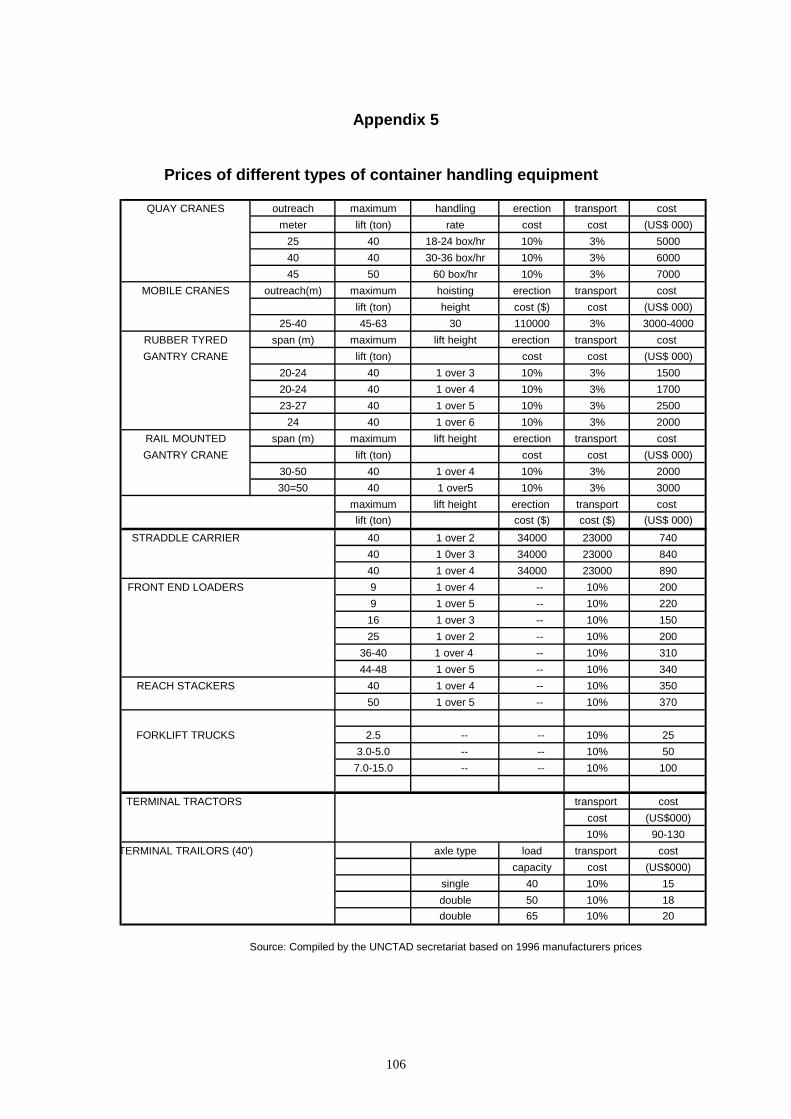
106
Appendix 5
Prices of different types of container handling equipment
Source: Compiled by the UNCTAD secretariat based on 1996 manufacturers prices
QUAY CRANES outreach maximum handling erection transport cost meter lift (ton) rate cost cost (US$ 000)
25 40 18-24 box/hr 10% 3% 500040 40 30-36 box/hr 10% 3% 600045 50 60 box/hr 10% 3% 7000
MOBILE CRANES outreach(m) maximum hoisting erection transport cost lift (ton) height cost ($) cost (US$ 000)
25-40 45-63 30 110000 3% 3000-4000RUBBER TYRED span (m) maximum lift height erection transport cost GANTRY CRANE lift (ton) cost cost (US$ 000)
20-24 40 1 over 3 10% 3% 150020-24 40 1 over 4 10% 3% 170023-27 40 1 over 5 10% 3% 2500
24 40 1 over 6 10% 3% 2000RAIL MOUNTED span (m) maximum lift height erection transport cost GANTRY CRANE lift (ton) cost cost (US$ 000)
30-50 40 1 over 4 10% 3% 200030=50 40 1 over5 10% 3% 3000
maximum lift height erection transport cost lift (ton) cost ($) cost ($) (US$ 000)
STRADDLE CARRIER 40 1 over 2 34000 23000 74040 1 0ver 3 34000 23000 84040 1 over 4 34000 23000 890
FRONT END LOADERS 9 1 over 4 -- 10% 2009 1 over 5 -- 10% 220
16 1 over 3 -- 10% 15025 1 over 2 -- 10% 200
36-40 1 over 4 -- 10% 31044-48 1 over 5 -- 10% 340
REACH STACKERS 40 1 over 4 -- 10% 35050 1 over 5 -- 10% 370
FORKLIFT TRUCKS 2.5 -- -- 10% 253.0-5.0 -- -- 10% 507.0-15.0 -- -- 10% 100
TERMINAL TRACTORS transport costcost (US$000)10% 90-130
TERMINAL TRAILORS (40') axle type load transport costcapacity cost (US$000)
single 40 10% 15double 50 10% 18double 65 10% 20
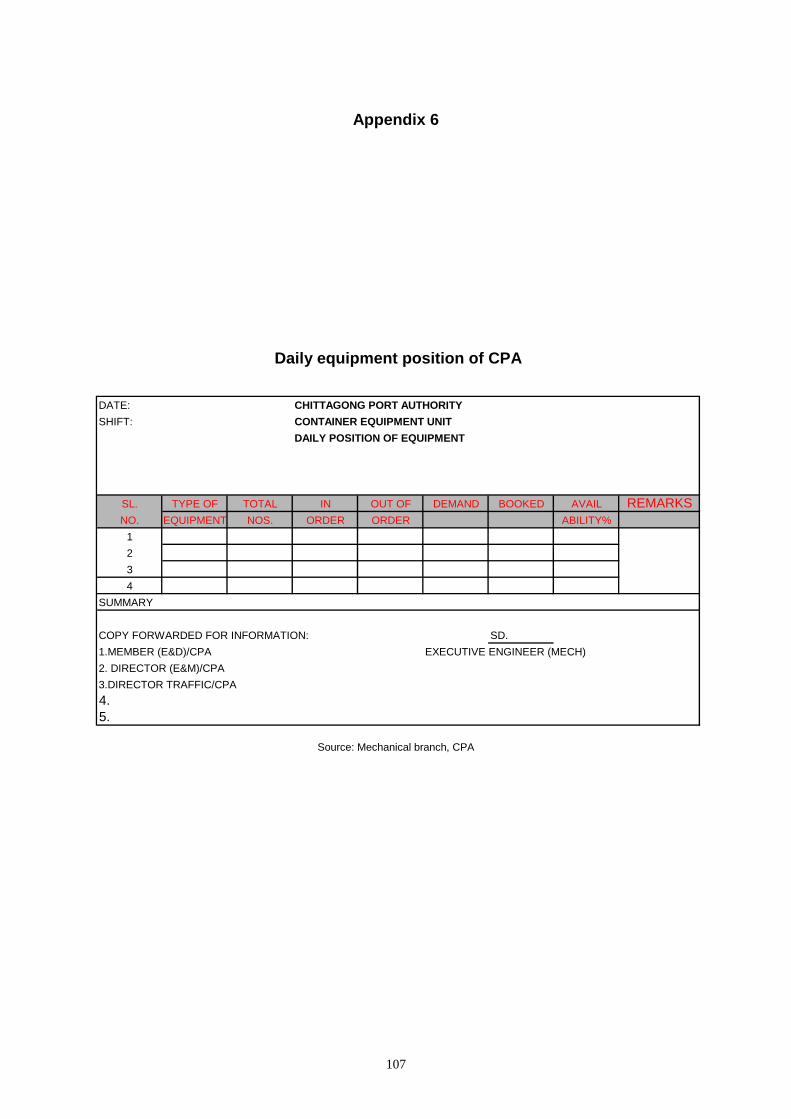
107
Appendix 6
Daily equipment position of CPA
Source: Mechanical branch, CPA
DATE: CHITTAGONG PORT AUTHORITYSHIFT: CONTAINER EQUIPMENT UNIT
DAILY POSITION OF EQUIPMENT
SL. TYPE OF TOTAL IN OUT OF DEMAND BOOKED AVAIL REMARKSNO. EQUIPMENT NOS. ORDER ORDER ABILITY%
1234
SUMMARY
COPY FORWARDED FOR INFORMATION: SD.1.MEMBER (E&D)/CPA EXECUTIVE ENGINEER (MECH)2. DIRECTOR (E&M)/CPA3.DIRECTOR TRAFFIC/CPA4.5.
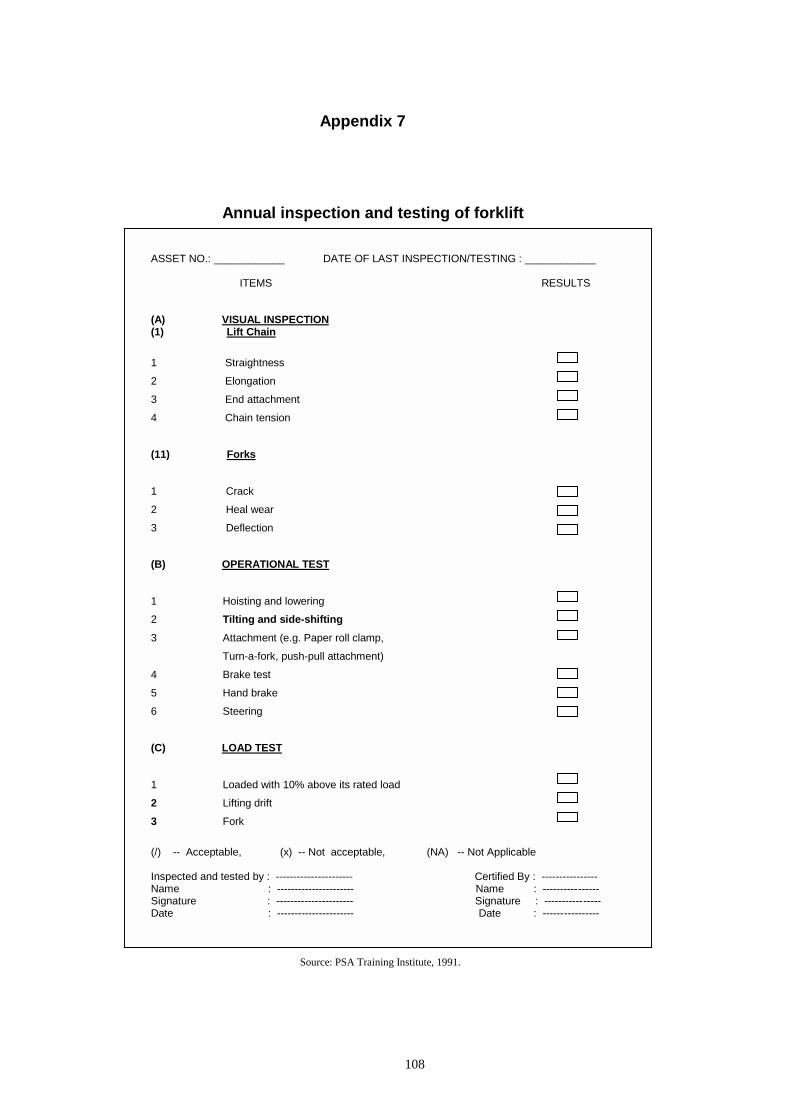
108
Appendix 7
Annual inspection and testing of forklift
ASSET NO.: ____________ DATE OF LAST INSPECTION/TESTING : ____________
ITEMS RESULTS
(A) VISUAL INSPECTION(1) Lift Chain
1 Straightness
2 Elongation
3 End attachment
4 Chain tension
(11) Forks
1 Crack
2 Heal wear
3 Deflection
(B) OPERATIONAL TEST
1 Hoisting and lowering2 Tilting and side-shifting3 Attachment (e.g. Paper roll clamp,
Turn-a-fork, push-pull attachment)
4 Brake test
5 Hand brake
6 Steering
(C) LOAD TEST
1 Loaded with 10% above its rated load
2 Lifting drift
3 Fork
(/) -- Acceptable, (x) -- Not acceptable, (NA) -- Not Applicable
Inspected and tested by : ---------------------- Certified By : ----------------Name : ---------------------- Name : ----------------Signature : ---------------------- Signature : ----------------Date : ---------------------- Date : ----------------
Source: PSA Training Institute, 1991.
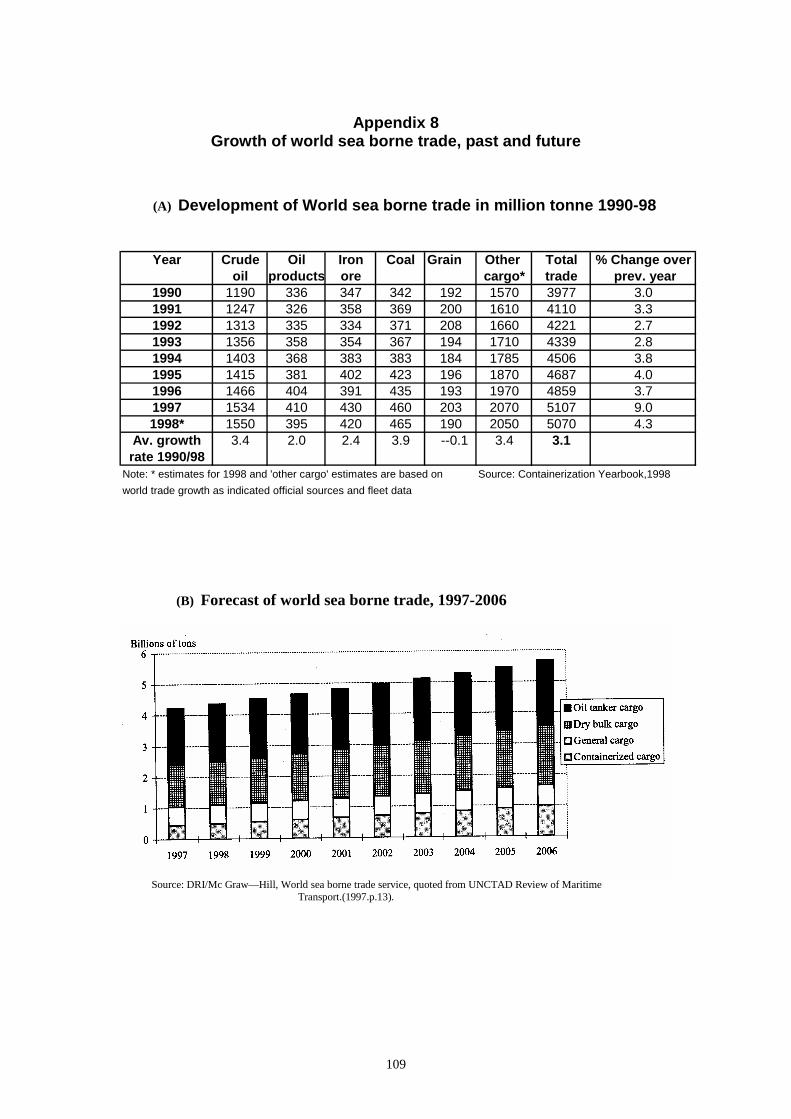
109
Appendix 8Growth of world sea borne trade, past and future
(A) Development of World sea borne trade in million tonne 1990-98
(B) Forecast of world sea borne trade, 1997-2006
Source: DRI/Mc Graw—Hill, World sea borne trade service, quoted from UNCTAD Review of Maritime Transport.(1997.p.13).
Year Crude Oil Iron Coal Grain Other Total % Change overoil products ore cargo* trade prev. year
1990 1190 336 347 342 192 1570 3977 3.01991 1247 326 358 369 200 1610 4110 3.31992 1313 335 334 371 208 1660 4221 2.71993 1356 358 354 367 194 1710 4339 2.81994 1403 368 383 383 184 1785 4506 3.81995 1415 381 402 423 196 1870 4687 4.01996 1466 404 391 435 193 1970 4859 3.71997 1534 410 430 460 203 2070 5107 9.01998* 1550 395 420 465 190 2050 5070 4.3
Av. growth 3.4 2.0 2.4 3.9 --0.1 3.4 3.1rate 1990/98
Note: * estimates for 1998 and 'other cargo' estimates are based on Source: Containerization Yearbook,1998world trade growth as indicated official sources and fleet data
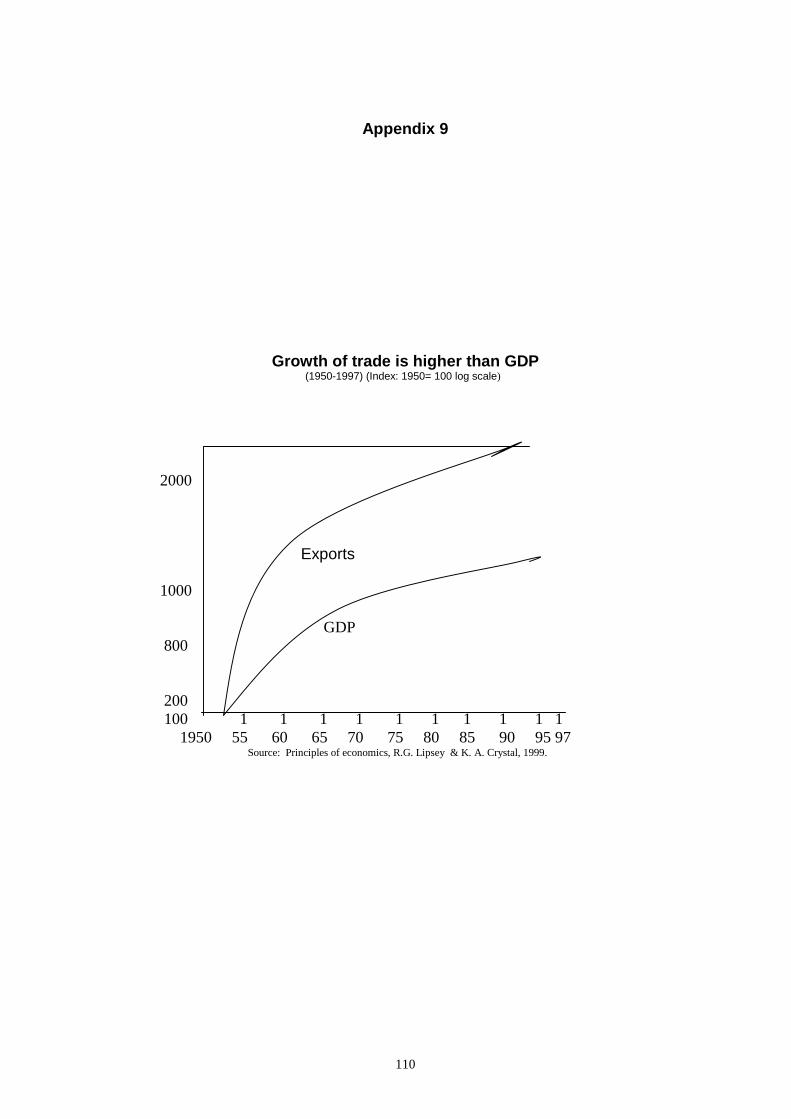
110
Appendix 9
Growth of trade is higher than GDP (1950-1997) (Index: 1950= 100 log scale)
2000
Exports
1000
GDP 800
200 100 1 1 1 1 1 1 1 1 1 1 1950 55 60 65 70 75 80 85 90 95 97 Source: Principles of economics, R.G. Lipsey & K. A. Crystal, 1999.
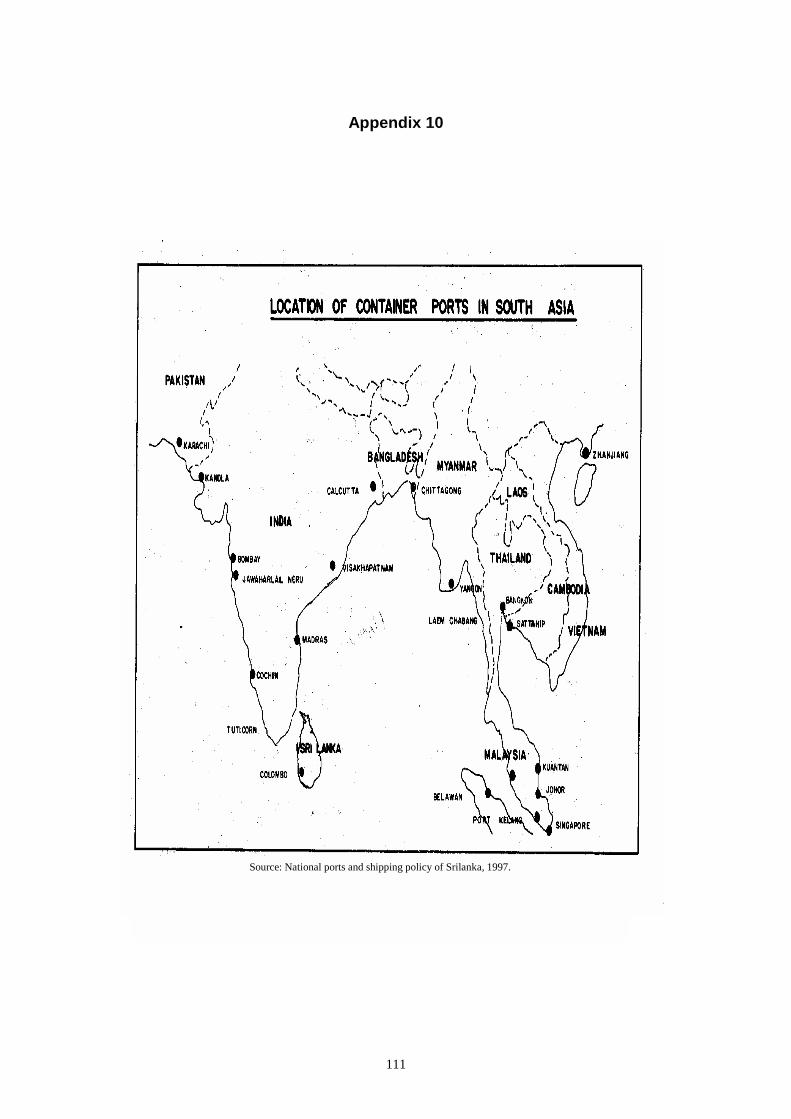
111
Appendix 10
Source: National ports and shipping policy of Srilanka, 1997.
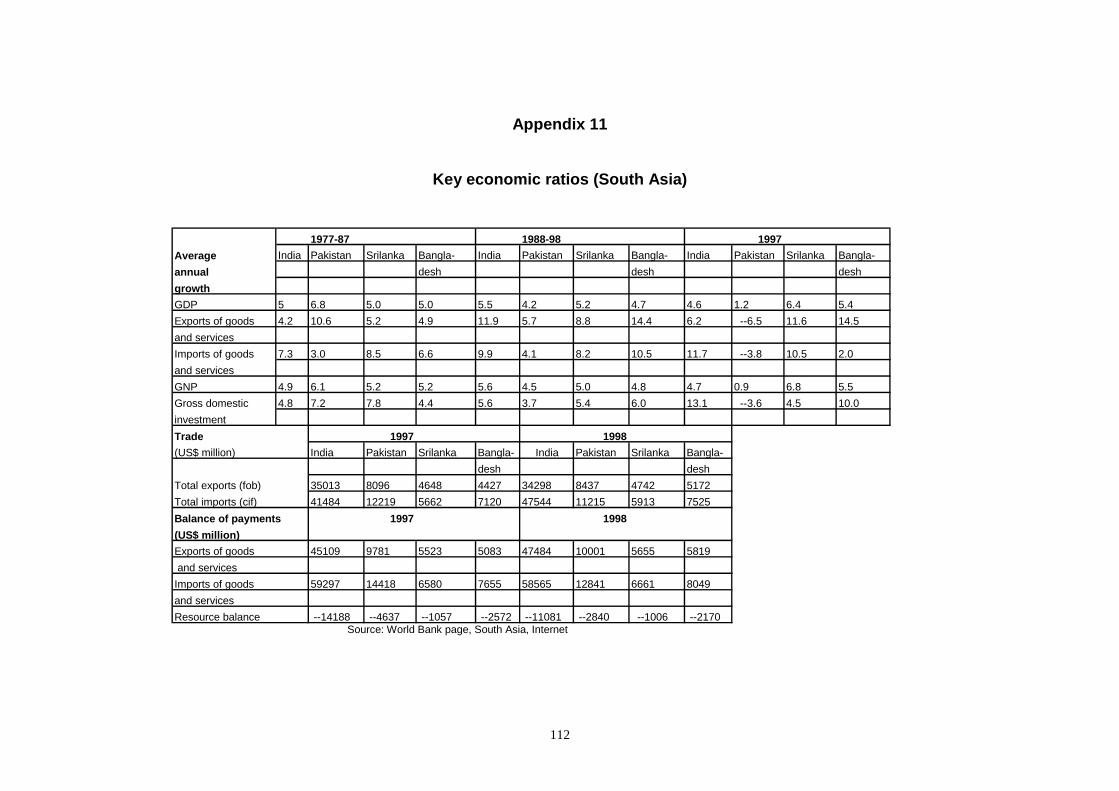
112
Appendix 11
Key economic ratios (South Asia)
Source: World Bank page, South Asia, Internet
1977-87 1988-98 1997Average India Pakistan Srilanka Bangla- India Pakistan Srilanka Bangla- India Pakistan Srilanka Bangla-annual desh desh deshgrowthGDP 5 6.8 5.0 5.0 5.5 4.2 5.2 4.7 4.6 1.2 6.4 5.4Exports of goods 4.2 10.6 5.2 4.9 11.9 5.7 8.8 14.4 6.2 --6.5 11.6 14.5and servicesImports of goods 7.3 3.0 8.5 6.6 9.9 4.1 8.2 10.5 11.7 --3.8 10.5 2.0and servicesGNP 4.9 6.1 5.2 5.2 5.6 4.5 5.0 4.8 4.7 0.9 6.8 5.5Gross domestic 4.8 7.2 7.8 4.4 5.6 3.7 5.4 6.0 13.1 --3.6 4.5 10.0investmentTrade 1997 1998(US$ million) India Pakistan Srilanka Bangla- India Pakistan Srilanka Bangla-
desh deshTotal exports (fob) 35013 8096 4648 4427 34298 8437 4742 5172Total imports (cif) 41484 12219 5662 7120 47544 11215 5913 7525Balance of payments 1997 1998(US$ million)Exports of goods 45109 9781 5523 5083 47484 10001 5655 5819 and servicesImports of goods 59297 14418 6580 7655 58565 12841 6661 8049and servicesResource balance --14188 --4637 --1057 --2572 --11081 --2840 --1006 --2170
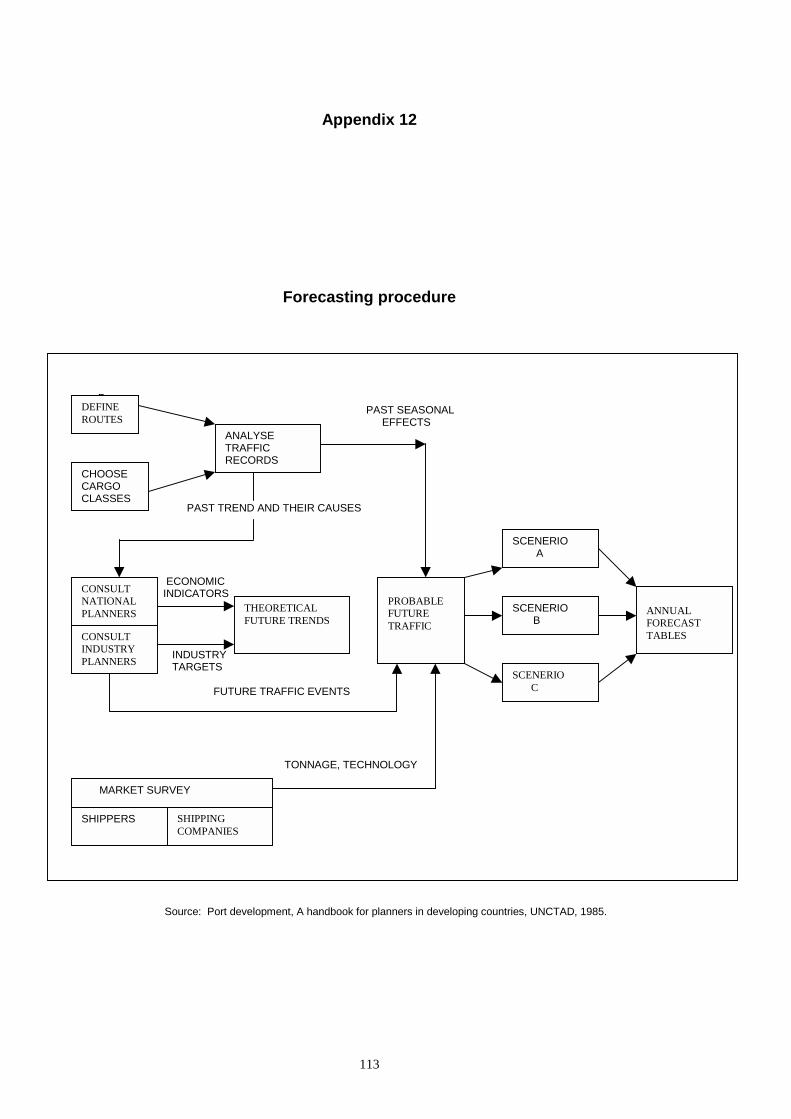
113
Appendix 12
Forecasting procedure
DH PAST SEASONAL EFFECTS
PAST TREND AND THEIR CAUSES
ECONOMIC INDICATORS
ECONOMIC
INDUSTRY TARGETS
FUTURE TRAFFIC EVENTS
TONNAGE, TECHNOLOGY
Source: Port development, A handbook for planners in developing countries, UNCTAD, 1985.
DEFINEROUTES
CHOOSECARGOCLASSES
ANALYSETRAFFICRECORDS
CONSULTNATIONALPLANNERS
CONSULTINDUSTRYPLANNERS
MARKET SURVEY
THEORETICALFUTURE TRENDS
SHIPPERS SHIPPINGCOMPANIES
PROBABLEFUTURETRAFFIC
SCENERIO A
SCENERIO B
SCENERIO C
ANNUALFORECASTTABLES