c r i systems analysis “t trilogy roger d. ray · illustrate this process i also review...
TRANSCRIPT

Behavior and Philosophy, 39/40, 203-301 (2011/2012). © 2011 Cambridge Center for Behavioral Studies
203
CYBERRAT, INTERBEHAVIORAL SYSTEMS ANALYSIS,
AND A “TURING TEST” TRILOGY
Roger D. Ray
Rollins College
ABSTRACT: This monograph introduces the functional characteristics and conceptual
significance of a simulation software system called CyberRat (Ray, 1996a, 2003a, 2012a,
2012b). CyberRat expands upon prior illustrations (Ray & Delprato, 1989; Ray, 1992) of
how such computer-based simulations can serve to formatively enhance, and eventually
validate, the descriptive research methodology upon which their development relies. To
illustrate this process I also review highlights of previous publications (cf. Ray & Brown,
1975, 1976; Ray & Delprato, 1989), detailing the unique research methodology used to
collect data that guided CyberRat’s development. This methodology integrates
interbehavioral psychology (Kantor, 1959) and general systems analysis (von Bertalanffy,
1968), and thus is referred to as interbehavioral systems analysis (IBSA). CyberRat’s
validation of IBSA methods involves a process analogous to Turing’s (1950) famous test for
simulation authenticity, in that it relies upon “phenomenological equivalence” criteria for
observers to compare experiences of real vs. simulated events. And because IBSA stresses
three convergent strategies for research, including structural analysis, functional analysis,
and operations analysis, my organizing theme addresses how closely CyberRat comes to
passing a trilogy of hypothetical Turing tests—one for each of these three analytic strategies.
Key words: Interbehavioral Systems Analysis, CyberRat, Turing test, behavior analysis,
structural analysis, functional analysis, operations analysis
AUTHOR’S NOTE: In addition to being the inventor, producer, and director, but not the
computer programmer, for CyberRat, the author is also the President/CEO and a stockholder
in the company, (AI)2, Inc., that funded, publishes, and distributes CyberRat as a commercial
product. All computer programming for CyberRat was authored by Victor Begiashvili as
either an employee of, or independent contractor to, (AI)2, Inc. and his contributions were
absolutely critical for the realization of the modeling projects that CyberRat represents. All
CyberRat videos and screenshots are copyrighted by (AI)2, Inc. and are used here by
permission. Finally, this monograph owes far more than I can express to my friend and
colleague, Dr. David A. Eckerman, for his persistent encouragement while I was writing it,
as well as his major editorial advice and contributions through the multiple drafts I produced
while struggling with it. He persevered through virtually all of the seven years I spent on the
many false starts and failed productions that preceded this final version. I am very grateful
for his efforts and support, but can lay no responsibility at his feet for its remaining
shortcomings. Please address correspondence to Roger D. Ray, Department of Psychology,
Rollins College, Winter Park, FL 32789; Email: [email protected]

RAY
204
I have multiple and overlapping goals guiding this monograph. My ultimate
goal is to articulate the conceptual and methodological validation value of a
computer-based simulation called CyberRat (Ray, 1996a, 2003a, 2012a,
http://www.cyberrat.net), which is kinetically illustrated in Video Illustration 1
(click linked text to view) and statically illustrated by the CyberRat V3.x User’s
Guide (Ray, 2012b).
Video Illustration 1. After viewing how one may access and experiment with
the many features of CyberRat offered via the default Visitor login illustrated
in the video linked above, readers may wish to download a free evaluation copy
of the CyberRat computer application to try it themselves. An Apple Mac dmg
installer is available for free using this link. Alternatively, the free Windows
Installer for CyberRat may be download using this link. After downloading,
install the application, launch it, and follow instructions illustrated in this video.
CyberRat is a successful and effective operant laboratory replacement for many
live-animal demonstrations of behavioral principles (e.g., Ray & Miraglia, 2011).
Most psychologists experiencing CyberRat for the first time are quick to see
potential educational value in the system, but few consider its conceptual value.
Likewise, few who know of CyberRat realize just how much original data were
collected to give formative guidance to the realism and capabilities of the model.
Sharing those original empirical data in the present context is another of my

CYBERRAT, INTERBEHAVIORAL SYSTEMS ANALYSIS,
AND A “TURING TEST” TRILOGY
205
overlapping goals, for those data also play an important conceptual role in evaluating
the model itself.
The conceptual value of CyberRat is based, in part, upon how well the model
reconstructs behavior from the descriptive data that guided its development. The fact
that those data were themselves both necessary and sufficiently complete to allow
the creation of such a valid model also serves, in turn, to validate the relatively
obscure research approach that guided that data collection—an approach founded
largely upon J. R. Kantor’s (1953, 1959) interbehavioral psychology and von
Bertalanffy’s (1968) General Systems Theory (GST) and its early predecessors, such
as Ashby’s (1956/1999) contributions on cybernetics. Because Kantor’s approach
stresses description, as opposed to experimentation, it shares a problem inherent in
all descriptive research: determining what descriptions are both necessary and
sufficient for a complete scientific understanding of events/fields being described. I
have previously argued (e.g., Ray, 1992; Ray & Delprato, 1989) that simulations are
an important means for addressing this adequacy issue, and I will use CyberRat’s
presently asserted success in simulating the original conditions that generated its
founding data as a new and extended case in point. But this assertion raises an
additional issue that also must be considered. If a simulation is used to validate the
adequacy of descriptive methods, what validates the adequacy of the simulation?
This last question was addressed by Turing’s (1950) famous paper proposing
his “imitation game” as a test for simulation authenticity in artificial intelligence.
Turing proposed a set of criteria for authenticating a model of machine-based
“thinking.” He argued that if outputs from a computer-based simulation of human
activity could not be discriminated from outputs generated by parallel real human
activities, the simulation would be deemed authentic.
The analogy I will presently offer is based upon an observer’s ability to
discriminate whether he or she is observing, and collecting data from, a live animal
viewed through closed-circuit television with data presented through a cumulative
response recorder or if the observations and data derive from a computer-based
simulation of such an animal. Observers will have this challenge of determining real
vs. simulated animal behavior whether they are only passively viewing, actively
collecting systematic observational data, interactively training, or otherwise
producing graphically-depicted experimental data. As such, the substantive
theoretical value in CyberRat’s production is predicated upon the authenticity of a
researcher’s experiences of the animal and the data produced.
Thus, after introducing CyberRat’s many attributes and the methodology upon
which they were established, I will consider the degree to which CyberRat generates
authentic outcomes through consideration of a specific series of proposed
hypothetical Turing tests by which the model might be evaluated. I will not claim in
this presentation that CyberRat, in its present form, will absolutely pass the Turing
tests being proposed; I will also point out several reasons it is not likely to do so in
each case. But I will suggest that it comes sufficiently close to meeting such criteria
as to validate the underlying IBSA descriptive methodology that made the model
possible. I will address each of the three strategies of analysis to be described with
a separate set of hypothetical Turing tests. In the end I will assert that CyberRat’s

RAY
206
unique visual reconstruction of highly variable and continuous behavioral streams
represent sequential behaviors-in-environmental-context that approximate all of the
structural aspects associated with real animals interacting within this environment
for extended periods of time. As such, I will also assert that CyberRat represents a
primary and unique contribution to behavioral science. Further, I will suggest that
CyberRat’s simulations of functional interbehavioral adaptations as well as its
operational time-series reproductions of data are nontrivial accomplishments and
will meet most phenomenological and/or statistical criteria for authenticity as well.
My assertion that this represents a process of descriptive methodological
validation is based on the following logic: The degree to which these tests meet
Turing’s criteria of phenomenological non-distinguishability is the degree to which
the methods used to generate the simulation must also be adequate for producing a
complete description of original events (experience one such test—a test of
“structural/behavioral” reproduction accuracy—offered in Video Illustration 2).
Video Illustration 2. This video illustrates a “structural analysis” Turing test
for behavioral reconstructions by CyberRat. Aspects that may cause CyberRat
to fail this test, thus enabling your accurate detection of the real CyberRat, will
be discussed in a subsequent section along with arguments for why this is a
“trivial failure” for the validation case being made.
I begin my presentation with a brief functional, as opposed to algorithmic,
documentation of what CyberRat is, leaving many specific details of what it does
for subsequent discussions, where CyberRat’s outputs will be compared to empirical
data as a series of Turing tests. Each Turing test considered will begin with a
summary of the related interbehavioral systems analysis (IBSA) research strategy
upon which CyberRat is based. Both the IBSA approach and its ties to Kantor’s

CYBERRAT, INTERBEHAVIORAL SYSTEMS ANALYSIS,
AND A “TURING TEST” TRILOGY
207
(1953, 1959) interbehavioral psychology have been extensively detailed in various
publications (cf. Ray & Brown, 1975, 1976; Ray & Delprato, 1989; Ray & Ray,
1976; Ray, Upson, & Henderson, 1977; Upson & Ray, 1984). Readers are thus
assumed to have sufficient familiarity with this approach to allow me to present only
a relatively brief summary. Likewise, readers are assumed to be familiar with prior
literature comparing and contrasting the experimental analysis of behavior (TEAB),
as championed especially by B. F. Skinner (1938), with Kantor’s interbehavioral
approach (e.g., Kidd & Natalicio, 1982; Morris, 1982). Morris’s review is an
especially comprehensive integration of previously published commentaries
regarding the compatibility of the two systems up to the time of his own 1982
publication (e.g., Mountjoy, 1976; Stephenson, 1953; Verplanck, 1954). Morris also
cites extant commentaries on the value of integrating the two approaches for
research and theoretical consolidation (e.g., Grossberg, 1981; Kidd & Natalicio,
1982; Krasner, 1977, Pronko, 1980; Wahler & Fox, 1981).
It should be clear to readers familiar with this literature that the IBSA approach
represented by CyberRat incorporates aspects of TEAB but also includes critical
extensions and modifications that go well beyond the traditions of that approach to
research. Formative research data used to develop CyberRat were collected using a
hybrid IBSA/TEAB approach while investigating live rats in traditional operant
experiments, as will be made apparent in latter portions of my presentation. But, as
I also hope to illustrate, TEAB methods by themselves would not provide a sufficient
basis for developing CyberRat.
From its outset, CyberRat (Ray, 1996a, 2003a) intended to dynamically
generate highly realistic digital video reproductions of the continuous stream (cf.
Schoenfeld, 1976; Schoenfeld & Farmer, 1970) of an animal’s many forms of
behavior as well as authentic cumulative response records of bar-pressing rates in
response to various operant experimental operations. In the latter portion of this
monograph I will provide evidence that those aspirations for CyberRat have been
realized, and I will reflect upon what that accomplishment implies for the methods
used to guide and evaluate CyberRat’s development.
CyberRat: A Virtual Operant Laboratory
All CyberRat (Ray, 1996a, 2003a, 2012a) simulations first and foremost
intended to generate a highly realistic and continuous visual representation of a rat
in an operant chamber. The goal was to achieve a viewing experience equivalent to
watching a live closed-circuit video of an albino rat in an operant chamber
environment for rather extended periods of time (i.e., sessions that can extend to one
or more hours in duration). These CyberRat modeling projects also provided for the
emergence of new sequential behavioral patterns and/or emergent forms and
functions of behavior (e.g., turning in tight circles or lever/bar-pressing) resulting
from reinforcement contingencies established by a human interacting with the model.
To accomplish a convincing and novel visual reproduction of such continuous
behavioral streams across lengthy experimental sessions, CyberRat incorporates a
dynamically changing sequence of behaviors using more than 1800 brief and
RAY
208
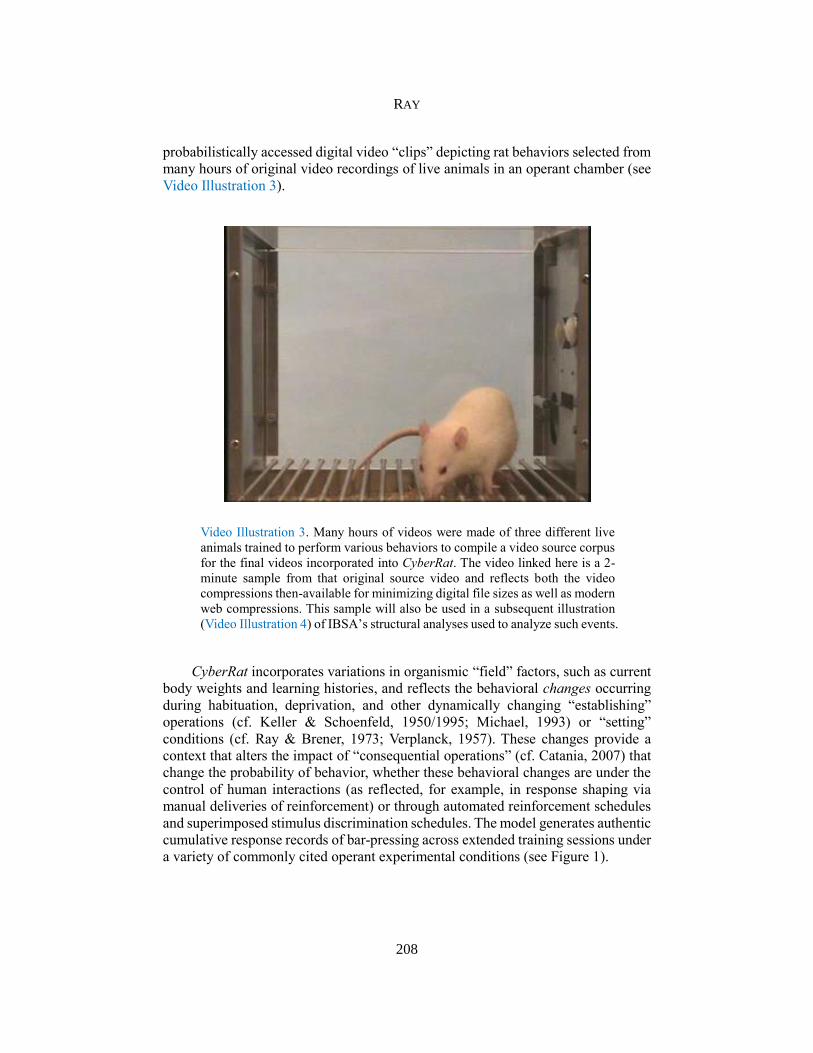
probabilistically accessed digital video “clips” depicting rat behaviors selected from
many hours of original video recordings of live animals in an operant chamber (see
Video Illustration 3).
Video Illustration 3. Many hours of videos were made of three different live
animals trained to perform various behaviors to compile a video source corpus
for the final videos incorporated into CyberRat. The video linked here is a 2-
minute sample from that original source video and reflects both the video
compressions then-available for minimizing digital file sizes as well as modern
web compressions. This sample will also be used in a subsequent illustration
(Video Illustration 4) of IBSA’s structural analyses used to analyze such events.
CyberRat incorporates variations in organismic “field” factors, such as current
body weights and learning histories, and reflects the behavioral changes occurring
during habituation, deprivation, and other dynamically changing “establishing”
operations (cf. Keller & Schoenfeld, 1950/1995; Michael, 1993) or “setting”
conditions (cf. Ray & Brener, 1973; Verplanck, 1957). These changes provide a
context that alters the impact of “consequential operations” (cf. Catania, 2007) that
change the probability of behavior, whether these behavioral changes are under the
control of human interactions (as reflected, for example, in response shaping via
manual deliveries of reinforcement) or through automated reinforcement schedules
and superimposed stimulus discrimination schedules. The model generates authentic
cumulative response records of bar-pressing across extended training sessions under
a variety of commonly cited operant experimental conditions (see Figure 1).
CYBERRAT, INTERBEHAVIORAL SYSTEMS ANALYSIS,
AND A “TURING TEST” TRILOGY
209
a)
b)

RAY
210
c)
d)
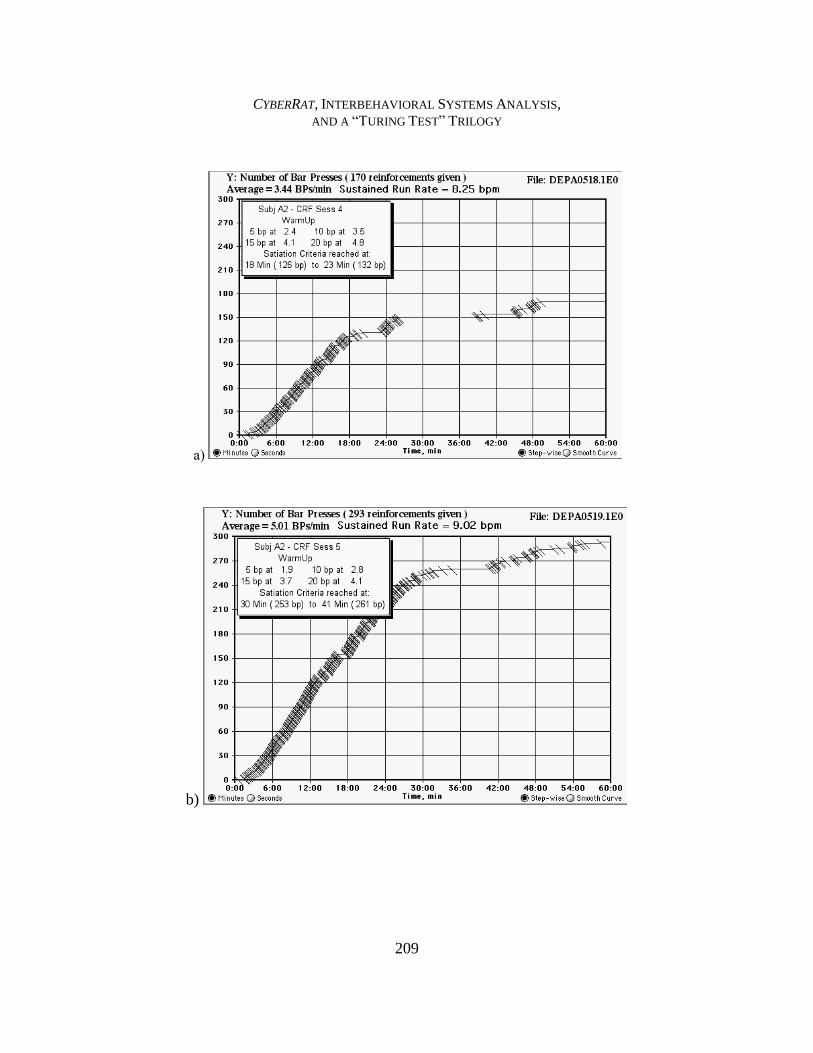
Figure 1. Cumulative response records both of a single randomly selected live
animal under continuous reinforcement (CRF) for bar-pressing across a 60-
minute session on two successive days (Figure 1a = 4th live animal [A2]
session; Figure 1b = 5th live animal [A2] session under CRF conditions) and a
CYBERRAT, INTERBEHAVIORAL SYSTEMS ANALYSIS,
AND A “TURING TEST” TRILOGY
211
randomly selected single CyberRat animal (Figures 1c and 1d) under
conditions simulating those for the live animal (Figure 1c = 4th simulation
animal “Demo” session; Figure 1d = 5th simulation session for animal “Demo”)
following first stable bar-pressing training sessions. Note the slow (warm-up)
start to bar-pressing at approximately 1–4 min and the satiety-induced drop in
rates at between approximately 10 and 30 minutes in the sessions).
Evidence of a serious scientific purpose for developing CyberRat from its
inception includes invited addresses and presentations at the Association for
Behavior Analysis meetings (Ray, 1996b, 2003a, 2003b; Miraglia & Ray, 2003) and
elsewhere (Ray & Miraglia, 2008). Those various presentations of CyberRat serve
as foundations for the present article.
What CyberRat Simulates
CyberRat currently simulates 1) processes described as habituation, 2) satiation
to water reinforcement that varies based on lengths of deprivation, 3) development
of shorter-latency responding and secondary reinforcement functions through
stimulus signaling of water presentations (i.e., respondent conditioning), 4)
emergence of various new response classes (e.g., turning in tight circles or bar-
pressing) via the method of successive approximations (shaping), and 5) the
formation of realistic operant response rate characteristics for a wide array of simple
reinforcement schedules. It also generates convincing transition dynamics when
shifting from one reinforcement schedule to another. Among the modeled transition
dynamics are processes such as extinction, ratio-strain, discriminative stimulus
control, and behavioral contrast (cf. Catania, 2007). Various CyberRat simulation
results based on Catania’s (2007) classification of alternative experimental
operations typically used by behavior analysts are illustrated graphically in Ray and
Miraglia (2011).
Empirical IBSA Data Needed for Modeling:
The CyberRat Research Project
Throughout CyberRat’s V2.0 development cycle we attempted to locate and
model research-based parametrics associated with each of the processes simulated,
including those described above. As a result, most processes in CyberRat are
simulated with highly accurate data-reproduction fidelity. To accomplish this fidelity,
each time we could not find published parametric data on the process being
simulated we conducted our own systematic investigations using live rats and the
empirical water deprivation/presentation dynamics that are equivalent to those
metaphorically incorporated into version 2.0 of CyberRat. This research was carried
out, in part, by Dr. Paul K. Brandon at Mankato State University, but in the main
through a collaborative series of experiments conducted by Kevin Miraglia (through
the auspices of a summer student/faculty collaborative undergraduate research

RAY
212
program and Kevin’s subsequent senior undergraduate research project that I
supervised) within my own laboratories at Rollins College.
After graduation, Kevin continued to serve as a laboratory teaching associate
in my academic department at Rollins College. In that role he supervised most live-
animal laboratory exercises as well as CyberRat assignments conducted by students
within the Learning course I teach each year. Selected illustrative results from this
original empirical research, hereafter referred to as the CyberRat Research Project
(CRRP), were first reported at the meetings of the Association for Behavior Analysis
(Miraglia & Ray, 2003), and all subsequent references to the CRRP or its results
reflect these original collaborative research efforts. Throughout subsequent sections
of this monograph I present salient examples from the CRRP both to illuminate the
scope and accuracy of the current CyberRat algorithmic and video modeling project
and also to present some specific comparisons of empirical vs. simulated data.
The CRRP was focused exclusively on rats because, even if prior research had
been published on the relevant operant procedures being simulated, most available
data were produced using pigeons pecking keys for grain. Such data are not
parametrically informative for modeling data generated by rats due to the timing
differences for bar-pressing vs. key-pecking and differences between drinking water
vs. pecking at grain. We were especially in need of empirical data from the following
experimental conditions with rats: 1) habituation during first-exposure to operant
chambers, including both specific-behavior and multi-behavior structural–
organizational (kinematic) dynamics and associated operating characteristics (terms
which will be defined in subsequent sections); 2) magazine training as an example
of classical/respondent conditioning processes; 3) functional response shaping as a
successive-approximation process involving differential reinforcement of
alternative response topographies; 4) bar-press warm-up dynamics as yet another
kind of habituation process; 5) water deprivation and reinforcement–satiation
dynamics; 6) extinction dynamics; and finally, 7) intermittent reinforcement
schedules and associated response rate patterning (response operating
characteristics) as reflected in cumulative records.
Conceptual Reflections on What Gets Modeled
and What is Required to Accomplish It
Even with such a cursory description of CyberRat’s functional characteristics
as given above, it seems appropriate to consider the challenges to data collection
methods that such a simulation poses. I will emphasize throughout this monograph
that simulations play a significant “feedback” role in guiding researchers toward
more and more complete descriptions of the original events being simulated. This
feedback role stems from the fact that two of the most significant reasons that
simulations fail to meet their aspirations of being highly realistic are: 1) the
simulation itself is poorly designed and executed—either from faulty engineering of
the model per se, from inadequate technologies (e.g., lack of raw computing power,
etc.), or both; or 2) the data being used to guide development of the model are
insufficient for producing an accurate model. However, if model-produced events

CYBERRAT, INTERBEHAVIORAL SYSTEMS ANALYSIS,
AND A “TURING TEST” TRILOGY
213
in the simulation cannot be distinguished from the original events being modeled,
both of these potential faults have been eliminated—and as I have noted, this was
Turing’s (1950) argument for testing the adequacy of a simulation.
Thus, one might ask whether a cumulative record of bar-pressing activities of
a rat in an operant chamber is sufficient to realistically model an operant experiment
via computer simulation. The answer depends on the desired simulation experience.
Are we asking to see a reconstruction of only the cumulative record, or to see the
animal as it produces such a record, or both? One might easily model a “black box”
experiment involving an assumed animal pressing a bar under unseen circumstances
(e.g., Shimoff & Catania, 1995). It is not all that difficult to write a computer
algorithm that produces a cumulative graph reflecting “pen steps” with the same
general rate and with a similar temporal distribution as those seen in an original
sample of many cumulative records (although constructing even these types of
algorithms is more difficult than many might anticipate when time-series
complexities such as variable instances of response-rate “scalloping” under fixed
interval reinforcement scheduling are involved). As such, cumulative records
generated by a computer programmed with a mathematical algorithm that reflects
the original statistical properties of an animal’s production of switch closures can be
convincingly similar to a record generated by a real animal.
But asking this same model to also show a corresponding video of a realistic
but purely simulated animal that is performing the corresponding bar-pressing
activity that produces our cumulative record while also showing all the behaviors
that intercede between these presses would be virtually impossible if one begins only
with the cumulative response record and/or the equations that model it. The
cumulative record simply does not afford a sufficiently complete description to
statistically recreate a continuous video display of an animal, even if one has a
sufficient corpus of original rat-in-chamber video records that are suited to the task.
Thus, the fact that a highly realistic simulation like CyberRat can be created serves
as an important confirmation of both the necessity and sufficiency of the original
descriptive methods that guided its development. To elaborate on this assertion, let
me highlight in a bit more detail the actual method that was used in this process
before going on to detail CyberRat as a case in point.
Interbehavioral Systems Analysis:
A Descriptive Research Methodology
Prior to offering a brief summary of the IBSA approach, it will be useful to note
its historical context and to provide some citations for an interested reader to explore.
As already noted, the methodology evolved from a rich history of philosophical and
practical arguments in support of a descriptive interbehavioral view of
environmental–organismic interactions (cf. Delprato, 1987; Kantor, 1953, 1959,
1970; Moore, 1984; Morris, 1982; Smith, Mountjoy, & Ruben, 1983; Verplanck,
1983a). But the approach is also steeped in traditions of a process-focused
philosophy that emphasizes event/process rather than substance ontology (i.e., that
what we consider to be things, including rocks, planets, and stars, are really

RAY
214
dynamically changing processes that evolve over time—cf. Browning & Myers,
1998; Hartshorne, 1971; Whitehead, 1925, 1948) and an incorporation of general
systems analysis concepts and methods (cf. Ackoff & Emery, 1972; Checkland,
1997; Klir, 1969; Kuhn, 1974; Laszlo, 1996; von Bertalanffy, 1968). Interested
readers wanting to know more details than can be offered here are encouraged to
begin with Ray and Delprato’s (1989) overview of a) IBSA’s compatibility with
modern trends in the philosophy of science, b) its strategic and tactical requirements
and unique empirical contributions, and c) its reliance on alternative modalities of
descriptive representation and what each of these modalities contributes that is
unique. In the present review I will briefly focus on just a few interbehavioral and
general systems contributions to IBSA. I will also review a sample of description
modalities (i.e., alternative forms of representation, including symbolic, graphic, and
models as well as linguistic representations) used in IBSA to show how CyberRat
embodies each.
As I have already suggested, while CyberRat incorporates accurate simulations
of many of Skinner’s (1938) traditional functional analyses of operant response
classes, developing CyberRat quickly convinced me that it could not have been
realized from Skinner’s preferred analyses alone. I had to supplement TEAB with
the methods inherent in IBSA’s requirement of a much more naturalistic, descriptive,
and comprehensive approach to research. Just as importantly, the work on CyberRat
demonstrated not just the inherent relevance of IBSA, but also some practical
shortcomings of the IBSA approach as we initially applied it—mostly by exposing
inadequacies in the original descriptive categories, as I will illustrate shortly. As
already noted, IBSA is a methodology for understanding behavior that was derived
from J. R. Kantor’s (1959) interbehavioral approach to psychology. Yet the work of
B. F. Skinner (1938) was also critical for certain aspects of the project.
Kantor (1970) once criticized TEAB for being so devoted to a singular and
highly specialized pattern of research. This pattern was characterized as overly
stressing conditioning as the prototypical model for understanding behavior and as
seeing the environment as independent variables that fall into only two highly
generic classes: stimulus antecedents that are functionally described as
discriminative stimuli, or SDs, and consequential stimuli, typically defined
functionally as reinforcers (Srs). This conceptualization is, of course, the basic
construction of Skinner’s “three-term contingency” of antecedent, behavior, and
consequence analysis of behavioral dynamics as illustrated in Figure 2.

CYBERRAT, INTERBEHAVIORAL SYSTEMS ANALYSIS,
AND A “TURING TEST” TRILOGY
215
Figure 2. A schematic diagram illustrating primary functional elements in
Skinner’s conception of the three participating factors (or three-term
contingency) used for the experimental analysis of behavior. The top segment
represents the antecedent (SD) and consequential-reinforcing (Sr)
environmental stimuli that serve as independent variables arranged to be a
discriminative setting (SD) of a contingent consequential (Sr) stimulus
occurring when a representative operant behavior class event (Bo) is emitted.
Skinner’s experimental approach and his focus on operant and respondent
response classes was antithetical to Kantor’s more naturalistic and all-inclusive field
approach (e.g., Kantor, 1959, 1970). Kantor (1970) also characterized Skinner as
focusing on independent–dependent variable specifications with their implied
cause–effect functionality, while Kantor himself championed a more statistical and
non-causative view that stressed the description of integrated event fields (see also
Moore, 1984; Ray & Delprato, 1989). Rather than stressing behavior, Kantor
stressed what he called the psychological field. These psychological events/fields
might be considered as momentary events within a continuous stream of evolving
fields across time, and they define a temporal sequence of reciprocal interactions, or
interbehaviors, between the organism and its environment. For Kantor, functional
relations were a two-way process of reciprocated influence, or mutual implications,
that logically rule out a distinction between independent and dependent variables.
Instead, all contributing components in the psychological field were seen as being
interdependent.
Kantor also stressed that an organism’s interbehavioral history of preceding
event/fields are among the many contributing contextual setting factors. While
Skinner stressed an organism’s reinforcement history, Kantor’s interbehavioral
biography included far more than simply conditioning concepts, especially for
humans. Kantor included circumstances that included rivalry, compliances, and
competition as well as emotional histories. His approach easily accommodates
research of ethologists, for example, that illustrates the role of past perceptions of

RAY
216
such “sign-stimuli” as body color or response pattern configurations on subsequent
hormonal states as preparatory field factors for relatively stereotypical, but
nevertheless complex, reciprocal patterns of sexual mating interactions with a
member of the opposite sex in most species.
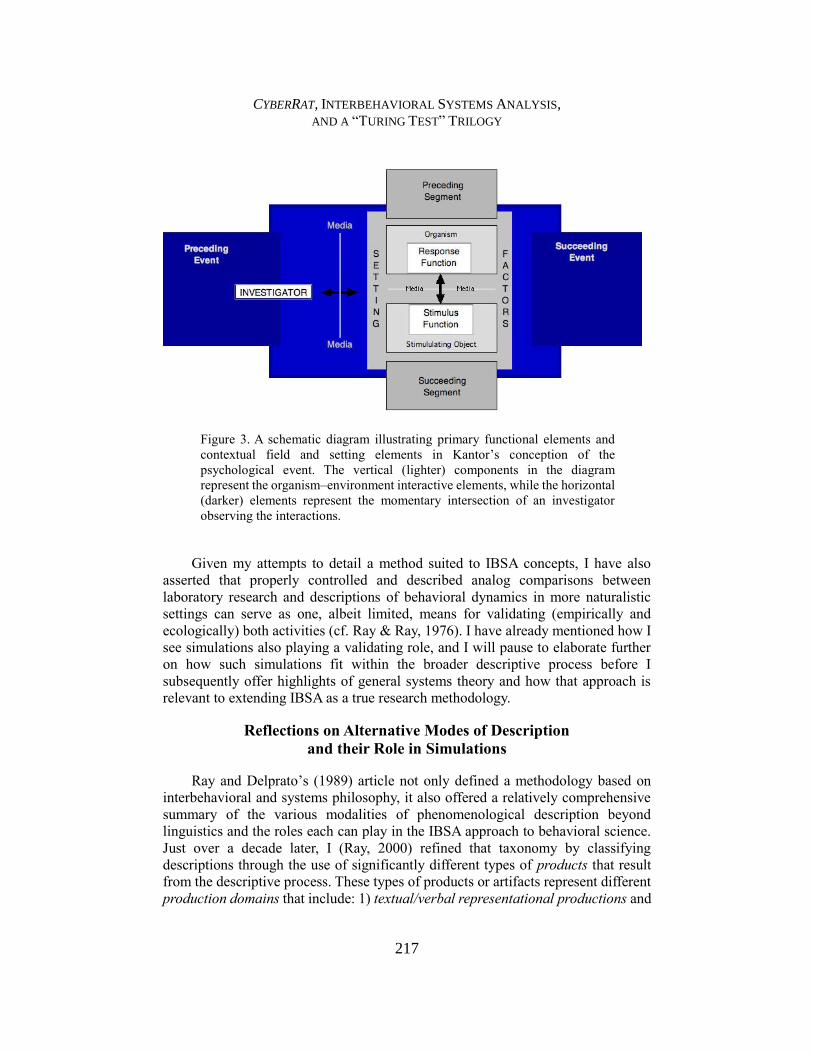
Likewise, any psychological field being described by an investigator using the
Kantorian approach must include a systematic account of that investigator as a
participating field factor. An abstraction of the participating factors defining
Kantor’s momentary psychological event/field is illustrated in Figure 3. For Kantor,
psychology has only the task of describing all forms of psychological interactions
contextually within both these historical and current field/setting conditions.
But Kantor had serious limitations as a champion of his descriptive approach
to research. While Kantor published at least 14 books,1 according to Moore (1984)
Kantor published only one empirical experimental study in his lifetime. The most
commonly heard criticism of Kantor’s work focuses on his failure to articulate a
methodology suited to his emphasis on descriptive research. Thus, a year prior to
Kantor’s death, Verplanck (1983a) noted that despite the highly significant
conceptual power of Kantor’s interbehavioral approach to psychology (Kantor,
1959), his nearly total disregard for laboratory experimentation resulted in Kantor
having little to no eventual influence on the modern science of behavior. Schoenfeld
(1969) had offered a similar argument much earlier and suggested that Kantor’s
disinclination to conduct research led to a broad disregard of Kantor’s significant
conceptual contributions. Perhaps Kantor shunned laboratories largely because he
always rejected the experimentalists’ mantra of searching for cause–effect relations
among the various participating factors defining interbehavioral events. If so, it was
unfortunate because Kantor gave little corrective guidance to those who were more
inclined to conduct actual research from his interbehavioral perspective.
Of course, Kantor was not the only voice arguing for more descriptive
approaches. Reflecting Kantor’s earlier professional influence, Verplanck (1970)
also stressed the usefulness of an interbehavioral approach and offered several
illustrations of the types of research he considered to be worthy endeavors. I
personally agree with Kantor’s and Verplanck’s championing of purely descriptive
approaches to psychological inquiry that emphasize the inclusion of complex
interactive field-defined events. But I have also consistently accepted the challenge
of creating new ways to translate the systematic propositions of interbehavioral
psychology into a more robust and validated research methodology—including a
methodology that is as well suited for experimental laboratories as it is for
naturalistic settings. Those interested in a brief tutorial on IBSA methodology as it
was applied in the CRRP may view a slide presentation of data collection, analysis,
and presentation of a small sample of rat observations in Video Illustration 4.
1 Kantor’s website has a full bibliography of titles still in print as well as online papers:
https://web.archive.org/web/20130813061915/http://web.utk.edu/~wverplan/kantor/kantor.
html
CYBERRAT, INTERBEHAVIORAL SYSTEMS ANALYSIS,
AND A “TURING TEST” TRILOGY
217
Figure 3. A schematic diagram illustrating primary functional elements and
contextual field and setting elements in Kantor’s conception of the
psychological event. The vertical (lighter) components in the diagram
represent the organism–environment interactive elements, while the horizontal
(darker) elements represent the momentary intersection of an investigator
observing the interactions.
Given my attempts to detail a method suited to IBSA concepts, I have also
asserted that properly controlled and described analog comparisons between
laboratory research and descriptions of behavioral dynamics in more naturalistic
settings can serve as one, albeit limited, means for validating (empirically and
ecologically) both activities (cf. Ray & Ray, 1976). I have already mentioned how I
see simulations also playing a validating role, and I will pause to elaborate further
on how such simulations fit within the broader descriptive process before I
subsequently offer highlights of general systems theory and how that approach is
relevant to extending IBSA as a true research methodology.
Reflections on Alternative Modes of Description
and their Role in Simulations
Ray and Delprato’s (1989) article not only defined a methodology based on
interbehavioral and systems philosophy, it also offered a relatively comprehensive
summary of the various modalities of phenomenological description beyond
linguistics and the roles each can play in the IBSA approach to behavioral science.
Just over a decade later, I (Ray, 2000) refined that taxonomy by classifying
descriptions through the use of significantly different types of products that result
from the descriptive process. These types of products or artifacts represent different
production domains that include: 1) textual/verbal representational productions and

RAY
218
their direct artifacts—such as this manuscript—that rely upon either natural or
contrived language, including more formalized and limited computer programming
languages; 2) graphical representation such as single-frame or even kinetic
sequences of drawings or pictures (including film and video), Cartesian coordinates
and other varieties of quantitative or qualitative graphing, and any other
“pictorial/graphic” representation—such as the various Figures and Videos used as
illustrations in this monograph; 3) symbolic representation systems such as logic
notation, musical notation, or mathematical variables and/or equations that describe
fundamental variable states and relationships; and 4) constructional model building,
as in architectural or other constructed models, including digital models and
visualized dynamic simulations that intend to represent proposed and/or observed
processes or entities (including CyberRat itself).
Notably, these linguistic, graphic, symbolic, and constructional model domains
do not always exist as distinct and mutually exclusive sets. Rather, the domains are
better represented by fuzzy set theory, where boundaries are not always distinct and
overlaps are rather common. Thus, computerized three-dimensional representational
“virtual reality” or “walk-through” models actually incorporate multiple descriptive
modalities. First are the mathematical algorithms that represent the dynamics of light
source and reflective surface dynamics that are used to generate the apparent
surfaces within a given conceptual/visual space. Computer programming and its
inherent logic is used not only to generate the images, but also the dynamics of the
interactive user interface that allows the model to be movement-responsive and
visually accurate. Importantly, these graphical representations of spatiotemporal
constructions may only exist in digital form and not in the real world, as when an
architect’s virtual model of a proposed building is created to convince a potential
client to actually fund the future construction of the conceptualized design.
Today’s representational technologies allow us not only to “describe”
spatiotemporal events and aggregations that do not even exist in the real world, but
they allow us to do so using convergent multiple modalities that result in highly
realistic, though thoroughly artificial, viewer experiences—a use of art to create
fictionalized science based on the use of genuine science to produce that art! While
the modern digital gaming and motion picture industries have been both quick and
highly sophisticated in their adoption of such convergent multimedia constructive
modeling projects for purposes of human entertainment, those same technologies
are only slowly being brought to bear for the advancement of science—especially
behavioral science.
Perhaps the most notable advances in utilizing multimodality descriptive
representation in science are the use of various imaging technologies in weather
forecasting, astronomy, or modern brain and neurosciences. Models forecasting how
weather fronts will emerge and develop across time, or how intersecting galaxies
might influence one another, or how star systems evolve all abound in modern
weather simulations, astronomy, and studies of the cosmos. Likewise, functional
brain imaging is being used prolifically to describe the functional and architectural
similarities and differences in brain dynamics across a very wide variety of human
individuals and situations. But behavioral sciences have lagged significantly in

CYBERRAT, INTERBEHAVIORAL SYSTEMS ANALYSIS,
AND A “TURING TEST” TRILOGY
219
taking advantage of the descriptive power of convergent multimodality descriptive
methods. CyberRat is being presented here as a notable pioneering exception, even
though it represents a highly restricted and limited first step. Further, my reliance
upon multimedia forms of description of CyberRat and its theoretical implications
in this very monograph is, itself, a demonstration of the relevance of using a
convergence of these alternative modes of description. To fully understand this
interpretation of CyberRat, and even of this monograph, let me continue with my
overview of the final convergent contribution to IBSA: General Systems Theory
(GST).
General Systems Theory and its Contributions to IBSA
General Systems Theory specifies three different analysis strategies. The first
strategy, called structural analysis, begins with a system’s definition. Once a system
is defined through this structural analysis the dynamics of that system are further
investigated using strategies called functional analysis and operations analysis (cf.
Checkland, 1997; Laszlo, 1996; Ray & Delprato, 1989). The defining process
involves a specification of the temporal and spatial organizational rules that describe
the interrelationships among constituent events that make up the system. Such events
are, themselves, considered elemental subsystems of the parent system, thus
establishing a fundamental principle of hierarchical perspective (cf. Ackoff & Emery,
1972; Checkland, 1997; Klir, 1969; Kuhn, 1974; Laszlo, 1996; von Bertalanffy,
1968). Ray and Delprato (1989) illustrated the system’s concept of an organization
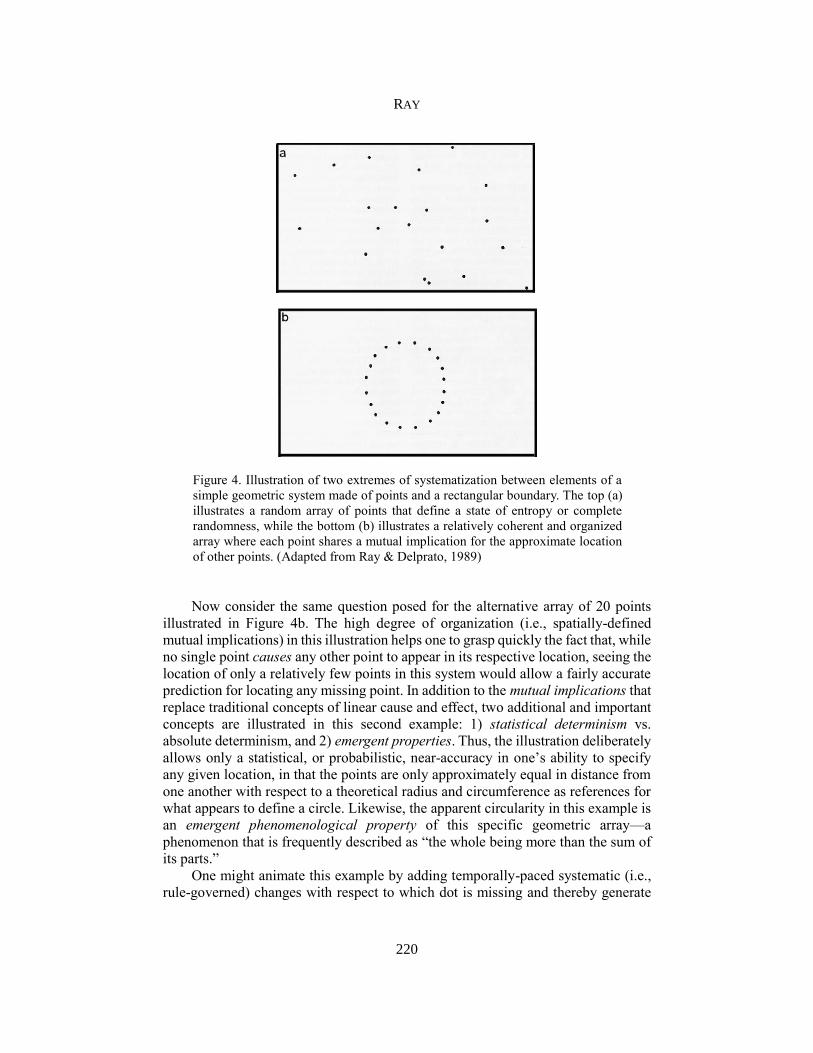
of elements using a simple geometric example that has been reproduced in Figure 4.
The system in this example is defined by a two-dimensional geometric
“boundary” (i.e., the enclosing rectangle) that encapsulates a dynamic array of 20
geometric “points.” Two alternative organizational “states” of this system are
depicted. In the first state (Figure 4a) the 20 points are mutually exclusive (i.e.,
independent) of one another, and thus represent only a random organization that is
frequently described as a systemic state of chaos or entropy (cf. Bowler, 1981). Ray
and Delprato posed the hypothetical case of one of these points being removed from
the illustrated chaotic system and asking an observer of the resulting array to predict
where the missing point should be inserted from knowledge only of the 19 remaining
points. In Figure 4a the answer of “anywhere” would not be correct, as that would
not reproduce the specific randomized 20-point system illustrated. But because there
is no descriptive or relational organizational rule defining any mutual implications
among the particular points in this example, no accurate specification would be
possible.
RAY
220
Figure 4. Illustration of two extremes of systematization between elements of a
simple geometric system made of points and a rectangular boundary. The top (a)
illustrates a random array of points that define a state of entropy or complete
randomness, while the bottom (b) illustrates a relatively coherent and organized
array where each point shares a mutual implication for the approximate location
of other points. (Adapted from Ray & Delprato, 1989)
Now consider the same question posed for the alternative array of 20 points
illustrated in Figure 4b. The high degree of organization (i.e., spatially-defined
mutual implications) in this illustration helps one to grasp quickly the fact that, while
no single point causes any other point to appear in its respective location, seeing the
location of only a relatively few points in this system would allow a fairly accurate
prediction for locating any missing point. In addition to the mutual implications that
replace traditional concepts of linear cause and effect, two additional and important
concepts are illustrated in this second example: 1) statistical determinism vs.
absolute determinism, and 2) emergent properties. Thus, the illustration deliberately
allows only a statistical, or probabilistic, near-accuracy in one’s ability to specify
any given location, in that the points are only approximately equal in distance from
one another with respect to a theoretical radius and circumference as references for
what appears to define a circle. Likewise, the apparent circularity in this example is
an emergent phenomenological property of this specific geometric array—a
phenomenon that is frequently described as “the whole being more than the sum of
its parts.”
One might animate this example by adding temporally-paced systematic (i.e.,
rule-governed) changes with respect to which dot is missing and thereby generate

CYBERRAT, INTERBEHAVIORAL SYSTEMS ANALYSIS,
AND A “TURING TEST” TRILOGY
221
another very well-known emergent property known as the Phi phenomenon. Thus,
we could put one of these points into apparent motion simply by removing one point
and then replacing it as we remove an adjacent point in a repeating, clockwise,
temporally-paced animated exchange. With sufficiently rapid successive
replacements, apparent movement becomes an emergent property, just as cartooned
animations at proper frame-change rates convince us that line-drawn animals can
move about on a screen.2
Traditional psychology describes such phenomena as these as being visual
illusions, but of course systems theorists do not treat emergent properties as illusions
because all emergent properties are a matter of relative observational and descriptive
perspective. This is a characteristic of hierarchical perspectives on organization that
allows many dynamic processes to have an apparent and relative persistence or
consistency that results in our describing them as substantive things even though
they emerge from what are actually processes of change based on a different
temporal scale than the observer’s experiences—as when a table appears to be a
solid when, in fact, it is mostly empty space between highly dynamic atoms when
viewed from an atomistic perspective.
Emergent properties typically derive from systems taking on a temporally and
spatially localized state of organizational coherence, or negentropy (cf. Bowler,
1981). As such, all systems are hierarchically composed from multiples of
subsystems, or unitized organizations of constituent elements that appear to be stable
from other levels of analysis, or relative perspectives. Thus, for example, an
automobile is composed of subsystems that offer fuel distribution, power creation,
power distribution, steering systems, lighting systems, transmissions with
alternatively sized gears to shift power distribution levels, etc. Replacement of any
subsystem that loses its functional integrity with a fully functioning alternative
allows the larger automotive system (i.e., the car itself) to long outlive its subsystems.
Likewise, engineers often work to design and create alternative structural
subsystems to impact the functional and operational characteristics of the larger
“automotive” system, as when alternative fuel systems are created to improve the
operating characteristic called fuel efficiency (i.e., miles transported per unit of
expense for fuel consumed) of automobiles.
As this automobile example suggests, systems analysis itself is a multi-
dimensional process. In this process, alternative strategies or perspectives exist
regarding not only the level of resolution one might take in describing systems vs.
subsystems, but also strategies regarding how other characteristics of a system
besides structure are presented, as I will now highlight. The structural analysis I
have been describing stresses the description of what the elements are, how these
elements are spatially–temporally arranged (i.e., their organization), and what their
statistically-defined mutual implications are for one another. From another
perspective, observers might focus on the purpose, goals, or accomplishments/
2 A brief history of the discovery of the Phi phenomenon and its related and similar Beta
phenomenon, as well as animated illustrations of each, are available for nearly universal
access at: http://en.wikipedia.org/wiki/Phi_phenomenon

RAY
222
outcomes of a dynamic and constantly changing system, and this strategic focus is
described as functional analysis. Thus, in the automobile example the primary
function of a car is transportation. But other functions might also be explored, such
as environmental impact or social status gained by having one brand of automobile
over another. A third perspective involves how a system changes states, or “operates,”
across time (i.e., a strategic focus on operations research or operations analysis).
This was the perspective taken in my fuel efficiency example described above. Other
operating characteristics might include the accelerative capabilities (i.e., how
quickly one can go from zero to 60 mph, for example) or wind resistance (i.e., drag
coefficient) when in motion. Combined, these alternative strategies for analysis
generate a balanced and comprehensive account of any system.
To illustrate how each of these three analytic strategies is translated into tactical
procedures, and what the implications are for understanding interbehavioral systems,
the remainder of this monograph will elaborate on each analytic strategy and its
associated procedural tactics. Each analysis strategy, in turn, will be used to describe
a rat’s behavior within Skinner’s traditional operant chamber. Those descriptions
will then be used to illustrate how CyberRat serves to validate the adequacy of the
analysis by applying Turing’s phenomenological “testing” criteria. However, I wish
to emphasize once more that I will not claim that CyberRat will fully satisfy the most
stringent Turing criteria—only that it comes sufficiently close to passing such tests
as to trivialize the faults that may be used to tell the difference between CyberRat
and live animals or associated experimental data. The main point thus remains that
the various simulations to be presented are sufficiently realistic as to affirm that both
necessary and sufficient descriptions have been accomplished in the application of
IBSA to validate the method. So let me presently turn to consider the first of the
three forms of IBSA—Structural Analysis—and how CyberRat serves to validate
this approach.
Structural Analysis of Interbehavioral Systems
Skinner classified behavior largely by whether or not a singular class of
antecedents (elicitors) reliably elicited behaviors (i.e., respondents) or whether
behavior functionally evolved under less specific or predetermined antecedent
stimulus control (i.e., emitted operants). In his early definitions of the class, the rate
or probability of respondents could not be modified by consequential environmental
outcomes of the behavior, and thus were more structurally defined by antecedent
elicitors and relatively fixed response topologies. As a result, it was the rate of
environmental elicitors that was reflected in the rate of respondents, so the rate of
the behaviors was a mere reflection of the rate of stimulus presentation. On the other
hand, operant behaviors were defined as being emitted by the organism, and the rate
of this emission was dynamic because of functional consequences produced by such
behaviors. Catania (2007) has distinguished between two uses of the term “operant.”
The first is the descriptive or nominal use that defines a single operant class as one
that includes all behavioral topographies that result in a common environmental
effect. Thus, lever-pressing is a nominal operant class defined by the fact that the
CYBERRAT, INTERBEHAVIORAL SYSTEMS ANALYSIS,
AND A “TURING TEST” TRILOGY
223
animal’s behavior results in a mechanical switch closure, not by the specific form of
the animal’s behavioral movements that closed the switch.
Catania also points out that operant response classes have alternatively been
defined functionally as behaviors that are changed by common consequences. In
either case, switch closures are merely intermediary events from the point of
Skinner’s analysis of behavioral ontology, as it was the fact that such closures
defined the criterion for delivery of reinforcing stimulus events that is critical.
Regardless of whether one takes a nominal or functional perspective on operant
behavior, Skinner assigned a crucial role to the reinforcing consequences of such
behavior as depicted in Figure 2. This figure also illustrates that any antecedents that
reliably signal the availability of these consequential outcomes for behavior come
to have discriminative functions for the emission of operant behaviors. As such,
Skinner’s “elements” are either eliciting–stimulus and respondent or antecedent–
operant–consequence. He focused almost exclusively on investigations of operants,
giving Pavlov and others credit for elucidating respondent principles. But critical to
the present problem, Skinner made no attempt to build any taxonomy of alternative
operant classes, thus treating any given operant response class as being
representative of any other operant response class when it came to understanding
behavioral principles.
In Kantor’s view, the interbehavioral event/field was psychology’s “element,”
or fundamental construction to represent the “psychological event.” And such
event/fields are an emergent property of the constituent structural and functional
components extant within attendant field and setting conditions, as depicted in
Figure 3. As such, Kantor’s interbehavioral events were described by reciprocating
functions and were not treated as necessarily representative of other forms of
functional interaction. But as I noted earlier, the challenge that Kantor left for
researchers was how to incorporate such interbehavioral elements and their
functional differences into a coherent research methodology. Thus, the research
reported in Ray and Brown (1975, 1976) and Ray and Ray (1976) was among the
first to explore the significance of using Skinner’s vs. Kantor’s elemental event
conceptions both in the laboratory and in human “field” research settings. These
reports translated Kantor’s interbehavioral concepts into practical and empirical
methods by emphasizing the inherent compatibility between 1) then-emerging
human applications of TEAB to modifying problematic human behaviors in real-
world settings (cf. Kazdin, 1975, 1978), 2) Skinner’s emphasis on control and
prediction vs. Kantor’s emphasis on description as the ultimate goal of psychology
as a science, and 3) conceptual developments in GST research strategies.
Those projects also reflected Verplanck’s (1958) early endorsements of
comparative ethology as being highly compatible with the interbehavioral viewpoint
and his subsequent emphasis on the need for psychology to search for a more
descriptive foundation for all of its research (Verplanck, 1970). Thus, both the
human (Ray & Ray, 1976) and animal (Ray & Brown, 1975, 1976; Ray, 1977)
research that was conducted relied substantially on the naturalistic methods of
comparative ethology (cf. Lehner, 1996). The approach was driven by GST’s
emphasis on structural analysis as the beginning point for systems analysis, with its

RAY
224
emphasis on first defining the elements and subsequently defining their mutual
implications that gave rise to organization.
As Verplanck (1958) had noted earlier, ethologists also follow this strategy
early in their research on any new species. Ethologists begin research by developing
descriptive taxonomies, called ethograms, to classify the reoccurring and relatively
fixed patterns of sequential actions that define behavioral elements for each species
they study. Many examples of ethograms are found throughout both early and
current ethological research, and an engaging illustration is McDonnell and Poulin’s
(2002) article that defines an ethogram to describe play behavior in Equids (semi-
feral Shetland-type ponies). Through the use of a taxonomic strategy, ethologists can
then compare species for behavioral patterns that are unique to the species (i.e., are
species-specific) vs. those that are more generalized in their occurrence across
species. It is the observed sequential pattern across time/space from one taxonomic
category to the next that defines element and organization in behavior for ethologists
(e.g., ethology’s well-known fixed action patterns).
Ray and Brown (1975, 1976) thus explored a unique convergence of ethological
and systems methods for observational research while stressing a strong
compatibility with Kantor’s interbehavioral fundamentals. We especially stressed
Kantor’s concept of an ongoing temporal/sequential “stream” of interbehavioral
events by continuously observing and recording observer-based descriptions of such
events using mutually exclusive and exhaustive descriptive categories, much as
ethologists typically do. The development of a suitable taxonomy of interbehavioral
event categories makes explicit the constructive and radical–phenomenological
character of recurring, relatively stable, interbehavioral elements as described from
an observer’s perspective (cf. Kvale & Grenness, 1967; Verplanck, 1971; Palmer,
2003). In our initial demonstration projects, Ray and Brown (1975, 1976) adopted
recurrent but unique interbehavioral categories for describing rat behaviors and
approached the experimental setting of the operant chamber from a naturalistic and
descriptive perspective as well as a manipulated/experimental perspective. Our
taxonomy included, in abbreviated terms, “explore,” “move,” “object manipulation,”
“groom,” “scratch,” “eat,” “lick/drink,” “bar press,” and “freeze.” Such categories
refer simultaneously to both the organism and the environment (which may include
the animal itself as an “object” or “stimulus”—as in “grooming” and “scratching”
one’s self). Thus, a specification of the elements to be systematically observed and
recorded was our first achievement in this research.
Once again, let me stress that systems theorists also emphasize that a structural
analysis should include not simply a cataloging of elements, but also a specification
of the organizational rules, or probabilistically-defined mutual implications, that
describe a system’s spatiotemporal organization. That is, the very definition of a
system typically stresses that a system is a set of elements that are organized, and
this organization reflects interdependencies or mutual implications that elements
have for one another (cf. Ackoff & Emery, 1972; von Bertalanffy, 1968). Ray and
Brown’s (1975, 1976) approach used interbehavioral categories as the elements,
and sequential organization across time/space defined the interdependencies among
these elements. These interdependencies were described by calculating the

CYBERRAT, INTERBEHAVIORAL SYSTEMS ANALYSIS,
AND A “TURING TEST” TRILOGY
225
conditional probabilities of transitioning from one observed interbehavioral element
to another. Such transitions define the continuous stream of events as a probabilistic
sequential pattern of interbehavioral elements that change across time, space, and
other various setting/field conditions. Probabilistic patterns of change in
interbehavioral events are referred to as behavioral kinematics and their associated
sequential paths are typically summarized visually via flowcharts that depict both
the elements and their sequential probabilities within various setting conditions. A
brief illustration of how continuous coding, time-stamped data summaries,
subsequent kinematic analysis, and flowchart kinematic graphing procedures may
be applied to the behavior of a rat is illustrated in Video Illustration 4. Examples of
two kinematic flowcharts depicting element organization, or interbehavioral systems,
defined by two alternative contextual discriminative setting/field conditions are
illustrated in Figure 5 (adapted from Ray & Brown, 1975).
Video Illustration 4. This video presents a brief introduction to the entire
observation, recording, analysis, and graphic representation process used in
IBSA’s structural analysis research. The video begins with a repeated presentation
of the brief sample video of original rat recordings seen in Video Illustration 3.
The remainder of the video slideshow illustrates how a behavioral taxonomy
similar to that used by Ray and Brown (1975, 1976) may be used for continuous
coding of observations and how that results in time-stamped recording to allow
subsequent kinematic analysis similar to that illustrated in Figure 5 from Ray and
Brown (1975).

RAY
226
In both Video Illustration 4 and in Figure 5 the width of each arrow connecting
interbehavioral elements is proportional to the measured conditional probability of
that specific sequence of change from one elemental event to the next.
Figure 5. Behavioral kinematic flow diagrams from Ray & Brown (1975)
illustrating the conditional probability of continuous behavioral changes in
rats under two different experimental/contextual settings. In the S+ setting
rats were reinforced with water for each bar-press (CRF schedule), while
in S- no bar-presses generated reinforcement (extinction).
Since all paths end in an interbehavioral element that has prior specification
(kinematic representation) of its implied “next elemental occurrence” and the
specific probability of each, such kinematic flowcharts/diagrams reflect a closed-
loop description of all possible transitional interbehavioral elemental states and their
associated probabilities for any given contextual field condition. As such, behavioral

CYBERRAT, INTERBEHAVIORAL SYSTEMS ANALYSIS,
AND A “TURING TEST” TRILOGY
227
kinematic analyses allow a reliable set of descriptive statistics to specify the
probability of any future interactional category from one’s knowledge of any current
interactional category. Thus, it is a sequential organization or pattern that is
described for spatiotemporally-defined interbehavioral elements, not a geometric/
architectural organization. Unique attendant setting conditions are incorporated in
the descriptive summaries by isolating separate kinematic analyses to discern the
significance of each setting/field context with respect to associated interbehavioral
element probabilities and/or their sequential organizational dynamics.
What is missing from Video Illustration 4 as well as Figure 5 is the
incorporation of any descriptive statistic summarizing durations of the categories or
even the relative amount of total time spent in each behavior across some reference
period. Time is an important dimension that was missing in the earliest reports by
Ray and Brown (1975, 1976) because of the limited technology available to those
research projects—we relied upon time-limited (5 sec) direct observation periods
followed by longer (15 sec) periods that allowed for recording those observations
(for a complete taxonomy of the many alternative procedures for collecting
systematic observational data see Ray, Ray, Eckerman, Milkosky & Gillens, 2011).
Thus, only frequency and sequence accounts were recorded. Fortunately, modern
recording technologies such as video lowered the relative cost of recordings that
allow for rather accurate time-measures for each categorical event, so later studies
incorporated specific investigation of this dimension as well (e.g., Ray, Upson, &
Henderson, 1977). This later research illustrated both time and conditional
probability measures, but never in a single graphic—instead we relied upon separate
bar graphs to represent the time dimensions for each behavioral category. But it is
quite feasible to incorporate time into kinematic diagrams by making the “nodes”
that represent the categories into circles that are proportional to each respective
category’s mean duration or total-time allocation.
As noted, Ray and Brown (1975, 1976) investigated only kinematic probability
dynamics and organization, but we did so under several alternative setting/field
conditions that were manipulated for such separate analyses. These settings included
alternating discriminative ambient lighting conditions, alternative but constant
ambient temperature conditions, and even organismic setting conditions induced by
various drug conditions. Figure 5 presents one very simple illustrative set of results
from live-animal experiments using two alternating ambient lighting conditions as
discriminative settings. These two alternative setting conditions relied upon a
relatively standard operant conditioning procedure involving presentations of two
alternating but persistent lighting conditions for the experimental chamber. A
persistent and brighter lighting of the chamber, symbolized by “S+” in Figure 5,
signals that each bar-press under this lighting condition has a 100% probability of
delivering water reinforcement. Likewise, a persistently dimmed lighting of the
chamber, symbolized by “S-“ in Figure 5, signals that there is a zero probability of
water reinforcement for bar-pressing or any other type of interaction. Each
discriminative setting alternated every few minutes across experimental sessions
lasting a quarter-hour or more, and the kinematic analyses depicted in Figure 5
RAY
228
represent an averaged set of conditional probabilities across all repetitions of each
respective setting condition and across three different animals.
But it remained for future technological advances in subsequent decades before
temporal continuity, and its implications for enabling real-time simulations, became
an integral part of IBSA research methods (cf. Ray, Upson & Henderson, 1977; Ray
& Delprato, 1989; Ray, 1992, 1996a, 2003a). These later articles describe how IBSA
can be applied to operant-chamber experimental arrangements using continuous
behavioral descriptions that focus on temporal as well as sequential assessments,
and how IBSA, in turn, can not only be reciprocally informed by such simulations,
but also how simulations can become virtual sine qua non tests for reconstructing
behavioral stream dynamics based only on original descriptive summaries. For
present purposes, let me first address the broader concepts of modeling kinematics
of animal behavior, then I will consider the most current version of CyberRat as a
specific case in point of how simulation informs and improves descriptive research.
(Readers may also find of interest Verplanck’s (1983b) account of alternative means
for, and roles of, verbal reconstructions—as opposed to the present video and data
reconstructions—as this process relates both to description and to how memory
might be redefined.)
Conceptual Foundations for Modeling Interbehavioral Systems
The original Ray and Brown (1975, 1976) experiments made it seem likely to
myself, if not others, that if one could ever create a visually accurate set of kinetic
graphic depictions, such as a series of animation “cels” (so-called because of the
transparent celluloid, and later cellulose acetate, upon which each frame of an
animation sequence was drawn using the early technology of hand-drawn
animations), then kinematic flow diagrams such as those depicted in Figure 5 might
become the source of animated reconstructions of animal behavior. As such,
kinematics would also serve as the foundation for visual simulations, based on
probabilistic reconstructions, of the original events the kinematics intended to
describe. One might easily believe that such an animation would generate a kinetic
visual reconstruction and even a more generalized and probabilistically-determined
modeling of the animal behaviors that such diagrams depict. That is, if animations
were created to represent each of the interbehavioral categories incorporated into the
kinematic summaries, then a visually-enhanced model that used conditional
probabilities as its editing-selection script would become a generalized model of that
system (i.e., an animal within the experimental conditions that gave rise to the
summarized data).
Such an animation process is, in part at least, inspired by what Walt Disney and
his colleagues accomplished through their “artistic perspective” in Disney’s
production of the film Bambi. As Finch (1983) points out:

CYBERRAT, INTERBEHAVIORAL SYSTEMS ANALYSIS,
AND A “TURING TEST” TRILOGY
229
Great emphasis was placed on naturalism in the making of Bambi. Special art
classes—an extension of the existing training program—were instituted so that
Rico LeBrun could instruct the animators in the finer points of drawing animals.
Real deer were kept on the lot as models for the artists. Books of photographic
studies and innumerable model sheets were compiled, along with analyses of
animal action and thousands of feet of live-action material to be used for reference.
(p. 257)
Finch includes several illustrative figures showing successive sketch studies
(i.e., graphic descriptions) of deer executing a “Gallop,” a “Bound,” and even a
“Banking at Bound” (p. 265). These descriptive behavioral categories are actually
used as verbal labels for the succession of (single-frame/cel) drawings that are suited
for making an animated sequence of each categorical event using multiples of cels.
From the very beginning of interbehavioral systems research I saw no reason why
such data as the Ray and Brown kinematic flow diagrams couldn’t be used to
reconstruct, setting by setting, similarly animated behavioral sequences. What
seemed to be missing was only a technology for dynamically and seamlessly
“splicing” such animations together following the probabilistic patterns depicted in
the kinematic diagrams.
I was eventually to discover that I was only partly correct in my assumptions
that such visual reconstructions would be relatively easy and straightforward to
accomplish. As digital technologies—first for digital cartoon animations and
subsequently for live-animal digital video recordings and playbacks—began to
emerge based on rapid advances in computing power in the 1980s and 1990s, I began
to actually experiment with such concepts. Following the sequence of digital
technology advances, I first focused on the highly simplified animations of a
cartooned animal (Ray, 1992) and eventually on the use of random-access digital
video clips that establish the core of all versions of CyberRat (Ray, 1996a, 2003a).
It was during these explorations that I began to appreciate more fully the theoretical
value of the feedback these simulations offered regarding the sufficiency both of the
technology being used and of the data that were guiding the modeling process.
This point about feedback regarding data sufficiency is worth illustrating with
a concrete example, as it is the foundation for my validation assertion that a
simulation that passes a Turing test is a simulation that also confirms the adequacy
of methods and data upon which the simulation was established. CyberRat simulates
structural, functional, and operational dynamics involved in the traditional operant
prototypical experiment using an animal in an operant chamber. The role of feedback
offered by simulations will be illustrated by examples from all three of these GST
strategic methodological perspectives in the remainder of this monograph. But I will
begin by elaborating first the structural models that rely upon the types of video
reconstructions just described as my primary illustration of the role of feedback from
simulations.

RAY
230
Fidelity of Real-Time Video Reconstructions: How Visual Simulations
Can Reveal Deficiencies in Structural Descriptions
I quickly discovered from my very earliest visual reconstruction efforts (Ray,
1992) that behaviorally descriptive categories such as those used in the early Ray
and Brown (1975, 1976) kinematic studies were woefully inadequate for
accomplishing graphic reconstructions if one intended for the reconstructions to
illustrate appropriately how an animal interacts with its general environment. Such
discoveries have much more conceptual significance than their associated practical
implications, as they get to the heart of “adequacy of description” issues.
Broad descriptions such as “move,” “explore,” “object manipulation,” etc. had
been used in prior literature (cf. Baenninger, 1967; Bindra & Blond, 1958; Bolles &
Woods, 1964; Grant, 1963) and were inspired by highly successful developments of
species-specific behavioral ethograms by ethologists (see also Immelmann & Beer,
1989). Thus, the Ray and Brown series, as well as various publications that followed
(e.g., Ray, 1977; Ray & Delprato, 1989; Ray & Ray, 1976; Ray, Upson & Henderson,
1977; Upson & Ray, 1984) continued to use similarly broad descriptive categories.
Nevertheless, a close reading will reveal that several studies in the series of
publications just cited did incorporate systematically coded descriptions of attendant
antecedent, concurrent, and even consequential stimulus events and setting
conditions. Two highly detailed examples may be found in Ray and Ray (1976) and
Ray (1977).
Originally I viewed these behavioral categories as being adequate for
classifying or indexing multiple graphic exemplars of the behavioral events they
described. The idea was to use such nominal classification indices for selecting, from
a sample of common-category representations, random graphic exemplars for
supporting a dynamic editing/composition process focused on reproducing a
probabilistically-constructed visual playback of kinematic flow sequences. But
when technological advances made the actual use of such exemplars possible, it
quickly became apparent that my categories of behavior were totally inadequate for
such a process to succeed. I found these categories to be incomplete for describing
the specifics of an animal’s interactions with even a highly restricted environment,
such as an operant chamber. I had to begin adding concomitant descriptors of
environmental elements, organismic spatial orientations, and several other setting
factors. Here’s why.
When one relies upon random selections from a collection of multiple video
clips representing each of the categories of behavior I had used in describing
kinematic sequences from category to category, a smooth and convincing visual
reconstruction of behavioral kinematics is simply not possible. To illustrate the
limitations inherent in this simplified approach to reconstructing kinematic flow
diagrams, such as those represented previously in Video Illustration 4, imagine that
we begin by observing a randomly selected representative video clip showing a rat
engaged in the most probable behavior of moving around the chamber using at least
one of its hind legs (i.e., the formal definition of Move), as is illustrated in the second
slide of Video Illustration 5 on the following page.

CYBERRAT, INTERBEHAVIORAL SYSTEMS ANALYSIS,
AND A “TURING TEST” TRILOGY
231
Video Illustration 5. While the MoveExplore described in the main text is a
perfectly acceptable kinematic representation in a simple kinematic flow diagram
summary, the visual experience of the described video sequence will almost
certainly include impossible “jumps,” not just from one behavior to the other, but
also from one location to another. Such a discordant sequence is graphically depicted
in this slide sequence video that corresponds to the kinematic diagram established
by the analysis described earlier in Video Illustration 4.
As illustrated by the image on the left on the following page, the first video-
illustrated kinematic representation of Move in Video Illustration 5 has, by chance,
the rat beginning its spatial movement from the rear-left corner of the operant
chamber while facing away from the video camera. The rat continues moving
locations until the animal is in the front-left corner of the chamber, now facing
toward the camera, as illustrated in the image on the right. When the hind-limb
movements stop, if at least one fore-paw is on the horizontal surface the animal
automatically shifts into the category Explore. That is, according to the operational
definition for Explore, the animal has the two hind-paws and at least one forepaw
in a fixed location, and thus the category allows for an animal to move its head about,
possibly rearing up slightly, but with only one forepaw, if any, off the floor. The

RAY
232
animal may even crawl forward a bit by stretching out the body with only the
forepaws in movement, thus keeping the hind paws in a fixed location.
The first behavioral sequence illustrated by Video Illustration 5 results from
randomly selecting a clip from a pool of video exemplars of Explore to depict this
behavior as the subsequent event to follow the initial Move example cited in the
previous paragraph. The graphic below immediately illustrates the problem under
consideration. As illustrated, the selected clip for Move ends with a depiction of the
animal on the left forward corner of the chamber. But the randomly selected clip
representing Explore depicts the animal beginning its Explore with all four paws
on the floor and positioned at the front right-corner of the chamber! Even a quick
reading of these two descriptions would have illustrated the problem, but it becomes
even more obvious when one sees the described clips in animation, as is the
experience of viewing all of Video Illustration 5. Thus, while the kinematic analysis
of the sample of behaviors presented earlier in Video Illustration 4 may first appear
to be an adequate descriptive analysis, graphic illustrations of that same kinematic
now make it abundantly clear that robust descriptive categories of behavior that are
not reduced to being one-of-a-kind must include quite a variety of structural details
beyond those provided by the original Ray and Brown (1975, 1976) definitions.
CYBERRAT, INTERBEHAVIORAL SYSTEMS ANALYSIS,
AND A “TURING TEST” TRILOGY
233
As noted, a perceptive reader might have grasped this disparity without having
to actually view the examples illustrated by the graphic forms of representation, but
the more subtle such disparities become the more difficult they are to discriminate
from a mere linguistic narrative or by logical reasoning alone. But such disparities
are often easily and quickly detected visually. A similar illustration based on
referential inconsistencies during textual reconstructions of verbal content analyses
that relied upon categorical codings was described in Ray and Delprato (1989), so
linguistic/grammatical reconstructive simulations may also serve a similar function
of detecting inconsistent, illogical, or incomplete descriptions, just as Turing (1950)
proposed in his original “thinking” test of the authenticity of artificial intelligence.
In the video examples above, as the clips are dynamically spliced together to
depict the described behavior changes, it immediately becomes apparent to
observers that a rather drastic video edit has occurred because the behavioral
transition depicted is far from including behavioral continuity. Thus, the difference
between any two spliced clips being used as a behavioral reconstruction would easily
be discriminated from a closed-circuit video display of a live animal making a
similar transition to that described by the kinematics. As such, the described video
reconstruction will miserably fail a visual Turing test as a believable simulation, as
was likely the case in the first example asking the reader to detect non-edited from
composited video in Video Illustration 2 and as constructed in Video Illustration 5
in the ending composited video. So the question becomes, is the whole simulation
concept wrong-headed? Or is the original description simply insufficient in its
details? Might a more comprehensive classification of interbehavioral events allow
a phenomenologically realistic reconstruction without resorting to a full video replay
of the entire original event sequence?
As an aside, an astute reader may note that the above narrative account was
generally sufficient to establish an understanding of the spatial and topological
discrepancies in the faulty video sequence that was described. Even though the
graphics may have helped significantly in visualizing the narrative, they may have
been a bit redundant. So why are most readers able to follow that verbal account and
fully understand the resulting failure to model a realistic video reconstruction
sequence? Obviously, the added narrative offers significant elaborations of the
simple categories (which is also the role of operational definitions) that helped
readers understand the spatial-topographical discrepancies between the example
clips being described. So more descriptive wording (i.e., more concise and inclusive
operational definitions) can solve much of the problem of insufficient description.
But how much description is enough? The answer to that question can be determined
by further refinements of descriptively guided simulations, for, as I have already
suggested, the eye is an even better discriminator of such discrepancies than
language—as visual comparisons of videos “a” (a sample from CyberRat’s
compositing) vs. “b” (a non-edited original video from which CyberRat was created)
vs. “c” (the video created based on the kinematic analysis illustrated in Video
Illustration 4 and composited using randomly selected exemplars of categories in
Video Illustration 5) in the detection tests of Video Illustration 2 should attest.

RAY
234
Clearly, the above examples suggest that as many contextual/field elements as
possible, as well as movement and orientation qualifiers, must be included as an
integral part of the original descriptive categories if the obvious faults illustrated are
going to be eliminated. Without such qualifiers virtually all reconstructed transitions
will result in visual reproductions of an animal that randomly appears in any location,
with any directional orientation, and with drastically changing topographical body
configurations—somewhat analogous to Disney’s (1951) depictions of Alice’s
experiences with the Cheshire cat while in Wonderland (cf. Carroll, 1865/2009)! It
is worth noting at this juncture how closely this generic specification comes to
having Kantor’s interbehavioral element depicted in Figure 3 as its guide for
adequate description. It is also clear that the contextual and organismic field
configurations must also be an integral part of what is descriptively categorizing
each clip, not simply categories reflecting the animal’s behavior with environmental
references at the level on which my early research had focused, and most certainly
not the pen movements typically recorded as operant performance measures in
cumulative records, as TEAB would typically guide us to collect.
To make this latter assertion even more evident, let me consider the use of a
cumulative response record to guide a sequential assemblage of video clips of rats
pressing a bar. Assume that several bar-presses follow one another in rapid
succession, as typically occurs in most variable intermittent schedules. Now assume
that each bar-press is depicted by a randomly selected video clip of the same animal
bar-pressing at different times. In one clip the animal may be pressing while standing
with three paws on the floor and its head nearly inside the water dispenser. This
press is more like pulling the lever down toward the animal by using the free paw—
very much a “least effort” way of getting water reinforcements as is seen frequently
in highly trained animals. Now assume a second (and immediately subsequent)
press is illustrated with a sampled clip that shows the animal standing upright over
the bar and pressing downward with both paws. How did the animal get from one
position to the other? Body orientations and topographies make a difference in such
visual reconstructions, even though they play no role whatsoever in creating
successive pen-steps across a cumulative recorder. And, of course, we would have
no way of even attempting a visual reconstruction of the zero-slope (no bar-pressing)
portions of the cumulative record. Such “not-bar-pressing” behaviors would clearly
return us to our starting examples of MoveExplore, etc., even if we had observed
and recorded during those periods—which, of course, TEAB does not typically do.
The above discussion is focused mostly on a single kind of inadequacy in
commonly used direct observation research strategies—that is, their likelihood of
passing a visual reconstruction test for how complete the respective categories are
for describing and thus representing the original observed events. It is mainly
because of its visually enhanced simulated reconstructions that CyberRat reveals
such descriptive research shortcomings. However, CyberRat also actually affirms
several of the underlying methodological strategies and tactics reviewed by Ray and
Delprato (1989), if not their specific choice of categories. Thus, the next step is to
consider what aspects of IBSA CyberRat currently incorporates to make it finally
CYBERRAT, INTERBEHAVIORAL SYSTEMS ANALYSIS,
AND A “TURING TEST” TRILOGY
235
succeed as well as it does as a visual reconstruction of structural interbehavioral
analyses.
So let me turn to what else I learned from the new research that had to be
conducted in the CRRP that was critical to the successful development of CyberRat.
And, of course, I must also consider along the way how closely CyberRat comes to
passing at least the hypothetical Turing-type tests I will propose for it, as passing
these tests has now been established as the sine qua non for demonstrating that the
methods used were necessary and sufficient for the simulation task, and thus for
fully representing the original events as well—a representation that was Kantor’s
goal. So let me detail how we achieved CyberRat’s qualitative (i.e.,
phenomenological) and quantitative (i.e., descriptive statistical data) reproductions
as they relate to the GST strategy of conducting a structural analysis of this
particular interbehavioral system as a case study.
The First Series of Turing Tests: Interbehavioral Setting
and Field Elements Simulated in CyberRat
Let me stress once more that simulations of interbehavioral system dynamics
must model all aspects of those interbehavioral events illustrated in Figure 3. This
includes modeling the realism of organismic and environmental setting conditions
and field factors as well as an animal’s movements and functional interactions in
specific spaces across time. Thus, as Video Illustration 1 has already shown,
CyberRat simulations begin with animal selection from the “colony room,” where
CyberRat’s animals “live,” and with experimenters being required to set parameters
for the experimental conditions. CyberRat offers various selection options involving
animals with various pre-established experimental histories, including naïve animals
as well as those with only prior magazine training or even prior bar-press shaping
history. But the typical selection is of a naïve animal (i.e., with no individual
experience of the operant chamber or any similar apparatus).
Next, experimenters must make choices regarding almost all the variables and
options they would set in a real operant laboratory. Further, the animal(s) an
experimenter selects and retains will actually vary within a normal but restricted
range of randomized weight and age, with each being 90–120 days of age. In
addition to age and weight, another random variation is the level of “intelligence”
of individual animals, which operationally translates into an individual animal’s rate
of change in behavior probabilities when reinforced, and therefore its rate of learning
new behaviors. Experimenters may obtain and keep as many animals as desired and
each new subject will reflect individual differences in these organismic setting
factors.
I will describe in subsequent sections various Turing tests for evaluating
outcomes of experimental manipulations, thus keeping the present discussion
focused primarily on observation-based descriptive research with minimal
experimental manipulation involved. But I should point out that, as the screenshot
from Video Illustration 1 on the following page illustrates, experimenters may set
many experimental parameters, including various reinforcement rules and schedules,

RAY
236
the temporal duration of water deprivation (thus adjusting the effectiveness of the
metaphorical “reinforcing stimulus” in CyberRat), and the size of water drops to be
used as reinforcers. Selection of a naïve animal may be followed by choosing to
conduct pre-conditioning “habituation” sessions (the last item in the “Reinforcement
Rules” panel) that expose an animal to the operant chamber with no water available
under any conditions. This also establishes an opportunity to conduct simple
“naturalistic” observation of the animal under minimally manipulated conditions.
There are two “Manual Reinforcement” settings, one that includes the bar as an
additional means for the animal to obtain reinforcement and one that excludes the
bar. Through the use of manual (i.e., experimenter-administered) reinforcement,
experimenters may demonstrate their own skills both in magazine training and in
conditioning an animal to bar-press (or to increase the frequency of any other
behavior). Perhaps the most artificial aspect of CyberRat lies with the fact that naïve
animals will never press the lever, as real naïve animals will actually do occasionally
in their random explorations and manipulations. This artificiality is included by
design, thus assuring instructors that any animal that bar-presses has been shaped to
do so through student shaping skills, not by random processes. But because real

CYBERRAT, INTERBEHAVIORAL SYSTEMS ANALYSIS,
AND A “TURING TEST” TRILOGY
237
animals have such a low probability of bar-pressing, the impact of this artificial
setting on other behavior probabilities is really quite minimal.
Following successful bar-press shaping, experimenters may further investigate
the development of stimulus discrimination by using simulated alternating
discriminative illumination conditions. They may also investigate a wide variety of
intermittent reinforcement schedules based on temporal, interval, or ratio
contingency rules. As noted earlier, I will detail such experimental simulations in
subsequent sections where they are contextually appropriate and where applicable
Turing tests will be considered. But prior to those discussions let me offer details
regarding the use of CyberRat for simple observational research simulations.
As already discussed, observational research relies upon systematically
observing and recording what animals do in contexts where the experimenter is not
changing the environment, which is represented in CyberRat by selecting
Habituation as the desired “Reinforcement Rule.” Students will find it useful to use
behavioral categories to describe the rat’s behavior—categories that derive from
prior reports like those of Ray and Brown (1975, 1976). However, my previous
discussion of problems inherent in using such macro-level descriptions for video
reconstruction should make it clear that the actual simulations in CyberRat rely upon
a more complex array of descriptive categories. Those categories meet criteria for
an adequate incorporation of the many contextual spatiotemporal elements involved
in interbehavioral events. So let me now present a case for an assertion that the
current version of CyberRat sufficiently meets all relevant criteria as to readily
qualify as an authentic and believable simulation of an animal experiencing the
operant environment for the first time. In other words, CyberRat will pass a Turing
test for its authenticity in modeling structural elements and their kinematics during
a habituation session.
Turing Test 1.1: Visual Fidelity and Structural Modeling in CyberRat
Given the difficulties in achieving a phenomenological fidelity from multi-
clipped video reconstructions, any reader who has not seen CyberRat first-hand will
likely question the success of its dynamic “on-the-fly” compositions while using
only its clip library. This disbelief is perhaps the first and most critical hurdle to
overcome in claiming that such a visually-based model might meet criteria for a
Turing-type test of its authenticity. On this point I must elaborate on my earlier
comment that CyberRat doesn’t meet all standards a human visual detection-of-
reality test is likely to require. But it is important also to note that I feel it certainly
could meet or exceed the demands of such a test, and could do so fairly easily. It is
true that CyberRat in its present form does not create absolutely “seamless” video
action as one video clip transitions into another. However, most video clips are
“close enough” to providing smooth body topography transitions at the point of clip
sequencing as to allow the human eye to “bridge the gaps”—especially given the
fact that rats often change positions naturally with very rapid shifts. And with
modern digital techniques of “morphing,” CyberRat could achieve a virtually

RAY
238
flawless set of transitions. Let me elaborate on these points with concrete
illustrations.
Figure 6 and Figure 7 illustrate two examples of a “last-frame-to-first-frame”
visual comparison using selected behavioral clips spliced “on-the-fly” in real-time
to create transitions that CyberRat’s constructed-editing algorithms created during
a single simulation session. Close inspection of these two Figures reveals a much
closer match between the a) and b) components in Figure 6 than between alternative
pre/post components illustrated in Figure 7. Thus, Figure 6 is a “preferred match”
transition, while Figure 7 is only an “acceptable match” transition. But all frames in
CyberRat change at the rate of 15 frames per second, which is sufficiently close to
the commonly accepted rate of human flicker-fusion that even the relatively large
discrepancy between the endstart positions illustrated in Figure 7 are hardly
noticeable when actually viewed in real-time video play.
a)

CYBERRAT, INTERBEHAVIORAL SYSTEMS ANALYSIS,
AND A “TURING TEST” TRILOGY
239
b)
Figure 6. Illustration of a clip-sequence recorded during a CyberRat
experimental session. Figure 6a illustrates the last video frame of a preceding
clip and 6b is the first video frame of the subsequent clip. This sequence will
be much less likely to be detected by an observer than the sequence illustrated
in Figure 7. The dynamic “splicing” of such clips is achieved by statistically
loading and playing each subsequent clip based on current conditional
probabilities of a given “set of clips” aggregated as a “field-inclusive
interaction class” following the preceding “set of clips,” represented by a
currently playing selection from that set. Note especially the relatively small
difference in the placement of both hind legs with respect to which floor-bars
are contacted (a frame-to-frame difference that would easily be interpreted as
a simple “step” adjustment), as well as the small differences in tail placement.
The likelihood of detecting that a dynamic “editing” has occurred when these
two clips are programmatically “spliced” in real time depends largely on
minimizing differences in body configurations and locations/orientations
within the chamber, and this clip sequence is relatively successful in recreating
a realistic, non-detectable splicing of the two clips in real-time.
Nevertheless, even untrained observers will detect most of CyberRat’s clip
transitions if they attend to the animal closely, although few observers find these
transitions distracting from their overall experience. In part this acceptance is due to
the fact that CyberRat’s selection of “next behavior” clips are randomly chosen from
a finite collection of clip options that were defined by criteria that more heavily favor
“best matches” for pre-to-post transition “head-positions” and “fore-paw-positions”
over “hind-leg-positions” or “tail-positions.” These “matching” priorities were
established because, under training conditions, most trainers will focus more closely

RAY
240
on the animal’s head and forepaws than on other parts of its body, thus making for
smoother transitions at the visual focal point.
a)
b)

CYBERRAT, INTERBEHAVIORAL SYSTEMS ANALYSIS,
AND A “TURING TEST” TRILOGY
241
Figure 7. Illustration of another clip-sequence recorded during a CyberRat
experimental session. Figure 7a illustrates the last video frame of a preceding
clip and 7b illustrates the first video frame of a subsequent clip. This sequence
will be much more likely to be detected by an observer than the sequence
illustrated in Figure 6. As with Figure 6, the dynamic “splicing” of such clips
is achieved by statistically loading and playing each subsequent clip based on
current conditional probabilities of a given “set of clips” aggregated as a “field-
inclusive interaction class” following the preceding “set of clips,” represented
by a currently playing selection from that set. Note especially the more
substantial difference in the placement of both hind legs with respect to which
floor-bars are contacted, as well as the noticeable differences in tail placement
and curvature. The likelihood of detecting that a dynamic “editing” has taken
place when these two clips are programmatically “spliced” in real time depends
largely on minimizing the differences in body configurations and their
locations/orientations within the chamber, and despite its inclusion in
CyberRat, this clip sequence is marginally successful in recreating a realistic,
non-detectable splicing of the two clips in real-time.
However, given the modern state of graphic “morphing” technologies, little of
the above discussion is problematic for my proposed hypothetical Turing test.
Morphing typically relies upon algorithms that 1) begin with event a vs. event b
differences in target features, 2) use specified desired numbers of interpolated
frames to time the transition, then 3) generate successive approximations in feature
changes to result in a visual reconstruction that the human eye responds to as
seamless transitions. Such morphing technologies are, themselves, based on
mathematical descriptions of differences between first/last graphics and are
commonly used in generating highly realistic visual effects within the movie
industry. For example, morphing makes humans seem to turn into animals or robots
within seconds, with no apparent missteps in transition along the way.
Importantly, every behavioral clip transition possibility within CyberRat is a
known entity and the algorithm selects a given “subsequent behavior clip” based on
the associated conditional probability determined from real behavioral kinematics
research. But the algorithm could just as easily select with the same established
conditional probability a pre-recorded “morphing transition” as a precursor to the
subsequent clip and then follow the morphing component with the subsequent
behavior clip itself. This would be a relatively straightforward process given that all
of CyberRat’s transitions involve relatively minor morphing requirements to bridge
their spatial gaps. So why wasn’t morphing included in CyberRat? Because creating
a morphing library would require far too much time and labor expense for the
relatively small increased quality in perceptual experience.
Fortunately, as already noted, almost all observers’ perceptual processes
naturally morph or ignore most of CyberRat’s clip transitions, and thus viewers tend
to overlook minor dislocations in the transitions—even those involving larger
differences in transitional body configurations. In other words, I am arguing that
CyberRat is good enough for most observers to become sufficiently immersed in

RAY
242
their interactions with the simulation to believe they are interacting with a real
animal without requiring further development and any use of extraordinary and
costly means to make CyberRat perfect. So the fact that CyberRat isn’t perfect
should not be considered a critical failure in its meeting a Turing test’s standards of
non-discriminated differences—especially with respect to CyberRat’s role in
affirming the completeness of original live-animal descriptions underlying the
model.
So, unlike my original discussions of how descriptive categories used in Ray
and Brown’s (1975, 1976) research were insufficient for visual reconstruction, in the
present case we know how to address observer-detected differences without going
back to the original descriptive methods for a solution. The original classification
scheme for clustering clips into common interbehavioral categories seems to be both
necessary and sufficient to the demands of visual constructive composition that, if
morphed only a bit, the model would most likely not be discriminated from closed-
circuit video feeds.
There’s More to the Test than Transitions. In addition to transition jumps,
two remaining foundations for discriminating between digital reconstruction vs.
closed-circuit live video feeds in CyberRat might involve: 1) how limited the
variations in the video-clip library are, and 2) whether there are any noticeable
differences in clarity of the video due to digital file compression algorithms. Let me
consider each point in turn.
If only one exemplar of each behavior-in-context existed, anyone watching a
video reconstruction based on such a small sample would quickly detect artificial
repetitions in the patterns of behavioral sequencing. It would appear as if a relatively
short video was playing “in a loop” that results in obvious stereotypical behavior
replays. The first version of CyberRat incorporated approximately 850 video clips,
while the second version more than doubled the size of this sample. This assures that
most viewers will have to watch a very extended length of time to note any single
clip’s repetition, and even then a single clip is likely to appear within a different
preceding/succeeding clip sequence. Thus, the potential for stereotyped playback
was addressed from the very beginning of CyberRat development and was only
improved—especially with respect to bar-press variations—in the revised version.
Video clarity (which is degraded by file compressions) is also not really a
critical dimension of the test for discriminating differences between live-feed vs.
constructed video, given ever-improved compression algorithms for digital video
(CyberRat uses circa 2002–2003 technologies, and technologies have since
improved significantly). Such visual display quality is also reliant upon camera
resolution and focus, and it certainly would be simple enough with today’s
technologies to either videotape in high definition or simply degrade a closed-circuit
feed to match the resolution qualities extant in CyberRat. So again I assert that, while
in its present state CyberRat doesn’t completely meet the strictest requirements of
my suggested Turing test for detecting simulation animals from closed-circuit
viewings of live animals, it easily could without changing original descriptive
methodologies. This leaves all detected differences being essentially trivial with

CYBERRAT, INTERBEHAVIORAL SYSTEMS ANALYSIS,
AND A “TURING TEST” TRILOGY
243
respect to the feedback the model offers for improving original research methods
used for this structural analysis.
Based on the phenomenological similarities of viewing the simulation vs. live
closed-circuit video, I propose that CyberRat validates the descriptive methods and
analyses that guided its development. To be more specific, given that our
classification of interbehavioral event elements was found to be sufficient for
believable visual reconstructions of appropriately probabilistic variations in these
elemental events, I conclude that CyberRat validates the descriptive categorization,
observation, and coding methods used for defining element classes. And from a GST
perspective, defining elements of a system is the starting point for any structural
analyses.
It might be easy to undervalue this fact, especially if you are a traditional
operant theorist. Let me stress that, in my view, it is not a trivial contribution to
account for every behavioral event that is not graphed on a cumulative bar-press
record, and to do so in a manner that, if appropriate methods of observational data
collection were applied to any CyberRat session, those data would match closely
any data collected from live-animal experiments under equivalent conditions. But
this is an assertion of a different kind of structural authenticity. It poses the question:
“How realistic are the numeric data generated by CyberRat vis-à-vis kinematic
dynamics?” I will turn to a consideration of this aspect next. But first, a reflective
comment on numeric data comparisons in the broader sense.
Any test of “comparable data” could be based either upon statistical detections
of difference or upon a simple phenomenological (visual) evaluation of apparent
differences. Unfortunately, attempting a statistical test implies proving the null
hypothesis, which is not at all consistent with the usual statistical testing for sample
differences. Even if one ignores this caveat, statistical testing implies far more
empirical sampling than the purpose of the present monograph warrants. As such, I
will not suggest actual comparative statistical testing as a criterion for passing
further proposed Turing tests that are based upon numeric data. However, that lack
of comparison leaves an interesting challenge for the properly motivated and
interested reader! So let me now consider a phenomenological evaluation of the
kinematic patterns and conditional probabilities generated by CyberRat simulations.
Other numeric comparisons will be considered in later sections.
Turing Test 1.2: Kinematics Fidelity and Structural Modeling in CyberRat
When placed into the operant chamber for the very first time, CyberRat’s naïve
animals begin with a kinematic “data seeding” that reflects a truly representative
matrix of conditional probabilities for determining behavioral (clip) sequences to be
composited in real-time playback. This, of course, also implies that any observer
conducting systematic observations and recordings would generate a representative
“behavioral hierarchy” (cf. Catania, 2007) summary of unequal unconditional
probabilities for all response classes that have video representations within the video
clip collection. But more importantly, this also implies that clip sequences will
always reflect real kinematic data averages and standard errors that model those

RAY
244
determined from our CRRP empirical research project. The CRRP generated
statistical averages and standard deviations across several live animals observed in
each of the various conditions simulated by CyberRat, including first-exposure
habituation sessions in an operant chamber (Miraglia & Ray, 2003).
Unfortunately, the complex “field” categories eventually used to realize
CyberRat itself are complex descriptions that are not well suited to simple
illustrations of the kinematic fundamentals for users. Thus, to assist users of
CyberRat in understanding kinematics, the system includes a “Multi-Behavior
Analysis” feature whereby any session may be automatically translated from the
video composition script generated statistically during any session into a more
simplified and understandable behavioral coding representation of that session using
behavior categories essentially equivalent to those originally used by Ray and
Brown (1975, 1976). To make the stages of data analysis more clear to users,
CyberRat includes a “continuous coding” file that highlights each behavior’s
descriptive “coding” simultaneously with video playback as illustrated in Figure 8.
Thus, any selected experimental CyberRat session may be used to generate not only
the source-sequence file illustrated in Figure 8, but also associated summaries of
each such file accessed via the various tabs, including both numeric and graphical
summaries of absolute frequencies and relative frequencies (probabilities) of
unconditional behavioral occurrences for each behavior, relative durations, and
total-time summaries for each behavior.

CYBERRAT, INTERBEHAVIORAL SYSTEMS ANALYSIS,
AND A “TURING TEST” TRILOGY
245
Figure 8. Illustration of the Multiple-Behavior Analysis screen in CyberRat
showing the “continuous coding” of an experimental session that translates the
interbehavioral clip categories into a taxonomy more similar to the one used
by Ray and Brown (1975, 1976). This feature highlights each behavior’s
descriptive “coding” of start/stop frame time and behavioral category
simultaneously with real-time video playback to assist users in identifying
traditionally categorized behavioral events and how they are coded by
investigators. Stop-frame analysis is made possible simply by using the space
bar to pause/continue video play.
All summaries are separately available for each contextual/discriminative
setting if discrimination training was a part of the experimental session, as is
illustrated in Figure 9 where transitional probabilities between these “derived
descriptions” for CyberRat’s behavior in S+ and in S- are summarized for the
illustrated session. I have already noted the logical difficulty of proving these are
representative of actual experimental data, but they model the averages and standard
deviations across many replications in CyberRat that closely match those obtained
in our empirical CRRP research. This modeling fidelity means, of course, that no
observer is going to see a CyberRat animal make unexpected or illogical transitions
from one behavior to another. I am also confident that the range of possible
presentations of original data summaries could not be visually discriminated from a
similar range of data summaries generated by CyberRat simulations. As such, I am

RAY
246
also asserting that these structural/kinematic simulations would also pass the
appropriate visual and/or data-oriented Turing test.
Having thus specified the attendant interbehavioral environmental/contextual
and organismic setting factors, as well as the primary interbehavioral elements and
how these elements are mutually implicated through conditional probabilities in
transitions across time, our structural analysis of the traditional operant experiment
from the IBSA perspective is complete. Let me now address a functional analysis of
this system from the IBSA perspective.
a)

CYBERRAT, INTERBEHAVIORAL SYSTEMS ANALYSIS,
AND A “TURING TEST” TRILOGY
247
b)
Figure 9. Illustrations of screen selections in the Multiple-Behavior Analysis
section of CyberRat. In Figure 9a the Tab and menu combination that is
selected is the Kinematics (i.e., conditional probabilities) matrix for all
behavioral sequences during all combined S+ setting conditions across a given
simulation session involving an experimental animal with an extensive training
history involving light discrimination (i.e., bar-pressing was reinforced during
S+ but not during S-). Figure 9b depicts the same data during all combined S-
setting conditions across the same session. Comparing data in these two
matrices reveals a major contrast in behavioral kinematics, and thus related
video compositions, between the two settings. For example, in Figure 9a the
most prominent behaviors are BARC (.33) and DIPR (.24) with high degrees
of sequential integration between the two, while in Figure 9b the most
prominent behaviors are EXP (.35) and Move (.29), also with high transitional
connectivity between them. These two illustrations are highly similar to the
results reported by Ray and Brown (1975) and illustrated previously in Figure
5. Codes used in the Figures are as follows: BARC=bar contact, BITE=bite-
groom self, DIPR=nose inserted into water dispenser, EXPL=head and/or fore-
limb movement while not rearing up, GRMN=lick-groom self with paws over
face/nose, MOVE=hindlimb movement resulting in animal changing locations,
OBJM=object bite, lick, manipulation, REAR=both forepaws off the floor with
body upright, RUBF=rubbing face against objects, including the bars making
up the floor of the cage, SCRT=scratch self with hind-legs as a form of
grooming, and STRT=animal being placed into the chamber for the start of a
new experimental session.

RAY
248
Functional Analysis of Interbehavioral Systems
I have already described how some contextual setting conditions (e.g., house
lights on/off) can impact kinematic organization patterns if such settings serve
discriminative functions like those depicted in Figure 5. Researchers using TEAB
methodology typically incorporate such contextual settings as the antecedent stimuli
that serve discriminative functions, thus having different implications for behavioral
events that occur in their presence vs. absence. But a typical TEAB analysis of the
Ray and Brown (1975) experiment represented by Figure 5 would evaluate only the
rate of bar-pressing (i.e., electrical switch closures) through the use of a cumulative
response record under alternating discriminative stimulus conditions, instead of the
full pattern of kinematic organization and change dynamics illustrated by this Figure.
Such a cumulative record might well depict each corresponding S+/S- condition
across time during the session, thus allowing one to view the specific impact of
discriminative setting conditions vis-à-vis bar-press rates, but only bar-press rates.
And while such an analysis contributes a great deal to a systemic understanding of
important dynamics in this situation, Kantor surely would have asserted that it does
not afford a complete description.
Focusing on one singular response class that systematically results in an
outcome like the delivery of reinforcing consequences accomplishes what both
traditional behavior analysts as well as systems theorists would describe as a
functional analysis. The three-term contingency conceptualization representing
TEAB includes two stimuli, each with quite different functions with respect to
behavior. The antecedent has a “signaling/discriminative” function in that it sets the
occasion for responding to have some probability of being followed by
consequences. The consequence has either a reinforcing or a punishing function,
with that function being defined by whether the subsequent rate of the behavior
generating such consequential events increases (reinforcing function) or decreases
(punishment function) in probabilities or rates. As noted, TEAB views these
functions as primarily impacting the specific response class of bar-pressing and is
silent about the effect on other supportive or competing behaviors that may interact
with that response class across changes in time and space.
Functional analysis in systems theory derives mostly from engineering models
and thus focuses on the goal or purpose (i.e., impact or outcome) of a system. This
is an easy conceptualization, given that engineered systems typically are designed
to address specific purposes from the outset. And such impacts may be assessed
either with respect to the system itself, with respect to the system’s environment, or,
more typically, both. Self-impacting functions take quite a variety of different forms,
typically described by ultimate outcomes such as self-degradation, homeostatic self-
maintenance, or even adaptive functions, which include self-adjusting of goals (as
when an adaptive thermostat in an air-conditioning system adjusts its settings for
different temperature maintenance during daytime vs. night-time hours), functions,
structures, or even operating characteristics. Systems that are studied for their
external functions are typically described by some reference to what they
accomplish, such as transporting, temperature exchanging, chemical extracting, etc.

CYBERRAT, INTERBEHAVIORAL SYSTEMS ANALYSIS,
AND A “TURING TEST” TRILOGY
249
(cf. Ackoff & Emery, 1972). A concrete engineered example may help to clarify
these abstractions while also giving us some useful comparisons and contrasts
between structural analysis and functional analysis.
Consider a common engineered system such as an automobile. From the
structural analysis perspective, an automobile is a good illustration of the difference
that organization makes in a system. Taking all of the necessary and sufficient
elements (parts) required for building any given automobile, think of alternative
ways we might arrange these parts. For example, we might arrange them
alphabetically using each part’s name. Placing these parts adjacent to one another
on shelves in a building gives them a functional purpose that might be described as
an auto-parts store. From a functional perspective, such a store serves as a one-stop
depot for purchasing and/or disseminating replacement parts for the associated
make/model of automobile that includes such a part in its composition. This is, of
course, only one function of such a system called an auto-parts store. Another is to
make money for the store’s owner/operator. As a side note, my own father-in-law
sent four children through universities from such a parts store located in a small
southern agricultural town. So for him, the money itself was not his store’s primary
function, but rather that money served as a “means” to many ends (functions),
including feeding and educating his family.
But what if all of those different automotive parts were organized in the manner
the original automotive engineers intended when they designed the parts? That is,
what if the parts came in the form of a new and fully functioning automobile? Note
that we have a different name for this organization than for the previous—we have
gone from parts store to auto dealership as the primary place for buying the object
of interest. In part, that is because the spatial configurations of parts (i.e.,
organizations) are so drastically different between the parts store and a car in a
dealership. It is also because we have named them from their functional perspectives
rather than their structural perspective. Automobiles function primarily as
transportation devices. Some automobiles also function as status symbols,
collectibles, and even recyclable “junk” materials. Others accidentally function as a
means for killing or maiming people. It all depends upon the criteria one applies for
what the “outcome” is that has priority in a human-use-of-system context. Those
“human uses” are all external functions of automobiles.
On the other hand, the internal functions of an automobile are mostly defined
by separate functions of its subsystems and their role in enabling or maintaining the
collective external function of transportation. Thus the starter or ignition system
functions to enable an operator to change the state of the automobile’s engine from
an “off” state to a “running” state. Likewise, a fuel pump distributes fuel from
storage (gas tank) to the engine, thus initializing and maintaining the engine’s
running state. The accelerator allows an operator to change the rate of revolutions in
the engine, and the drive-train and transmission transfer the engine’s energy
production to enable the car to move. Of course, the car does not function well
without a human operator, so a driver serves as the truly adaptive intelligence in this
transportation system by using the steering wheel to guide the car. Staying within
the assigned road lanes involves maintaining a homeostatic “balance” in the car’s

RAY
250
direction (thus avoiding head-on collisions and probable death to the driver), and
sharp turns allow for dramatic changes in direction, thus giving a maximal adaptivity
to the car as a “general” transportation system. It is, in part, this adaptivity that gives
automobiles advantages over, say, trains or airplanes, in that automobiles as transport
systems can take us to our front doors while trains and airplanes can leave us miles
from our final destination.
Of course, prolonged use of the car for transportation will begin to have internal
functional implications as well, and eventually various parts of the system will be
degraded, depleted, or totally transformed into alternative states (called “broken”).
Thus, fuel is transformed into alternative emissions as well as energy transfer and
will have to be replaced relatively quickly, the tires get worn down and will have to
be replaced over a much longer-term perspective, and the exterior metals will only
very gradually lose paint and other protective coatings and begin to rust away.
Astute and informed readers (or aspiring engineers) will already be finding
alternative “parts” to make this narrative different. Thus, changing to electricity from
gasoline will cause the emissions (external functions) to change. Substitute or add
new materials, such as steel radial belting, to the tires and their life is extended; and
build the body with plastics instead of steel and one avoids the rust. Note how these
examples include different parts or elements (i.e., structure) to address certain
functional problems in the engineering or use of the automobile, but the
transportation function remains. Verplanck included an interesting entry in his
Glossary and Thesaurus of Behavioral Terms that illustrates this change in parts vs.
constancy in function in very human terms. That entry concerns the term/concept
“Grandfather’s knife” and it illustrates psychological functions that can be quite
unique, as he states:
Definition: the pocket knife that belonged to grandfather, who got it from his
grandfather: They both always carried it with them and used it so much, that its
blade had to be replaced five times, and its handle seven times.
Commentary: An illuminating example of the distinction between the languages
of the physical scientist and of the psychologist: Is it the same knife? For the
physicist, obviously no. For the psychologist, as for grandfather, and grandfather's
grandfather, emphatically yes. If it gets lost and a stranger finds it, it is no longer
grandfather's knife, in the present tense. In a small-town museum in Illinois (or is
it in Kentucky?), “Lincoln’s axe” is on display. The axe displayed no longer has
the same handle or the head as used by Lincoln, both have been replaced at least
once. Despite this, the museum’s curators insist that the axe on display is Abraham
Lincoln’s axe. . . . Communities maintain their identity; so too, do individuals, in
spite of what some analyses in the biological sciences tell us, when they show that
every molecule will be replaced during the lifetime of the individual. Identities
are maintained primarily, if not solely, by continuing interactions with a set of
other individuals, whose members change with time. See identity. (Verplanck,
http://www.ai2inc.com/Products/GT.html)

CYBERRAT, INTERBEHAVIORAL SYSTEMS ANALYSIS,
AND A “TURING TEST” TRILOGY
251
I will return to my car example in the next section as well, when I illustrate the
concept of operations analysis. In that context I will consider, among other features,
how a car handles from the perspective of the person driving it, as well as what kind
of total fuel efficiencies (cost per mile) is involved in the automobile’s daily
operations.
Ray and Delprato (1989) described and illustrated in detail the complementarity
between structure and function. Most interbehavioral systems are highly adaptive
while also being fundamentally homeostatic when that process is possible. It is
typically when a dynamic stability cannot be maintained that adaptivity occurs.
What this means from a practical perspective is that smaller interbehavioral elements
frequently combine into specific, and frequently quite probabilistic, alternative
patterns of organization that may be subsequently defined by their change in
functions, much as micro-patterns of actions become “bathing” or “eating” episodes
involving a series of complex micro-level interactions. Thus, in behavioral systems
micro-interactions become elements that organize into hierarchical behavioral
patterns that become, themselves, newly defined macro-structures that are
established and aggregated by commonly shared functional outcomes. Without
reflection on the behavioral steps that define exactly how we bathe ourselves
differently in showers vs. bathtubs filled with water, we go about the task of
cleansing our bodies of the daily dirt and oils that accumulate. That variation is
highly adaptive, of course. Likewise, we give little thought to appropriate uses of
knife, fork, spoon, or even combinations to “eat our meal.” Thus, our interbehavioral
elements becomes larger and larger elements that define even higher-level functional
purposes such as work, recreation, entertainment, etc.
Ray and Delprato (1989) offered many concrete data-based illustrations of this
process and its implications based on research with rats, with dogs, and even with
killer whales. Other TEAB-oriented researchers have recognized this phenomenon,
and the term “meta-contingency” has been coined to describe the larger functional
aggregates of behavioral units at the cultural level of analysis (cf. Glenn, 1988;
Malott & Glenn, 2006). It should be sufficient in the present context to simply
illustrate how functional analysis impacts CyberRat design and simulation, as
various functional simulations are made available within the model.
The Second Series of Turing Tests: Some
Functions Simulated in CyberRat
First, of course, CyberRat models the complex behavioral pattern changes that
occur as adaptive processes that result in new functionalities when water access is
controlled by highly specific behavioral reinforcement contingencies. That is, when
water becomes available through only one selective class of behavior, CyberRat will
adapt to those contingencies either by rearranging existing response patterns and/or
through the development of new behavior(s) that include high probabilities of that
response class. Stated simply, you can operantly condition CyberRat. And through
proper shaping procedures, you can even generate a new form of functional behavior
(e.g., tight circling or bar-pressing for water reinforcement) as one form of

RAY
252
interbehavioral adaptation. Of course, you may also simply increase the operant rate
of any pre-existing behavior by making it the contingent response for water delivery.
This is how CyberRat models adaptive/functional processes. But other adaptive-in-
function processes are also modeled. This includes, for example, respondent
conditioning as a means for developing conditioned reinforcement functions
attending previously neutral events. Of course, discriminative setting functions may
also be established if lighting conditions signal that reinforcement contingency rules
are presently in effect. So let me turn now to consider how realistic these processes
might seem to someone training CyberRat animals through the management of
reinforcement delivery. I will also reflect on how well the data produced during this
process match empirical data from live animals.
Turing Test 2.1: Magazine Training and the Development of Secondary
Reinforcement Functions as Respondent/Classical Conditioning
Pavlov (1927) is perhaps the best known of those researchers who
systematically explored the dynamics of presenting stimuli that were reliably
followed by a biologically significant stimulus, which Pavlov called an
unconditional stimulus because there were no conditional restrictions or necessities
for such stimuli to elicit behaviors. Of course, because Pavlov was a physiologist,
the types of behaviors he tended to study were largely autonomic activities, and thus
those that were considered to be “reflexive” reactions to such unconditional
stimulation. But following Pavlov’s early investigations, it became more and more
clear that the unique aspect of his procedure was his presentation of some preceding
stimulus as the signal for his subsequent presentation of an unconditional stimulus.
This procedure has carried numerous labels including Pavlovian Conditioning,
Classical Conditioning, and Respondent Conditioning. Catania (2007) has described
the use of these stimulus relations in detail, and points out their unique operational
characteristics as follows:
Respondent conditioning is an instance of stimulus control applied to stimulus-
presentation operations rather than to the contingencies of consequential
operations. In other words, instead of signaling the consequences of responding,
a stimulus simply signals the presentation of some other stimulus. Pavlov’s
conditioned salivary reflexes are the prototype example. (p. 198)
Ray and Brown (1976) demonstrated that the entire pattern of behavioral
kinematics is reorganized as dramatically under such stimulus1–signaling–stimulus2
conditions as they are under consequential operations. But another important
outcome of such stimulus–stimulus contingencies is the development of functional
conditioned reinforcement properties for the signaling stimulus. Such conditional,
or secondary, reinforcing properties have long been recognized and used in the
successful shaping of operant behavior both in the laboratory and in more
naturalistic settings.
In TEAB this process of generating a conditional reinforcement function is
often called magazine training. Magazine training as a term harks back to food-

CYBERRAT, INTERBEHAVIORAL SYSTEMS ANALYSIS,
AND A “TURING TEST” TRILOGY
253
delivery mechanisms that worked much like everyday bubblegum machines. In such
machines, a rotating disc with holes (the “magazine”) rotates underneath a container
of gum-balls (or food pellets), allowing only one ball to drop into the hole, which is
plugged underneath until it rotates into an open location that allows the ball to drop
into a dispenser, thus completing a delivery. Guns, including those called revolvers,
also use magazines to deliver bullets into place for firing.
Food magazines typically make a distinctive noise as they rotate (historically
this sound was from a solenoid closing), thus making a clicking sound that
immediately precedes food delivery. Of course, dippers or solenoids used to deliver
drops of liquid also make similar delivery noises. This noisefood presentation,
noisewater presentation, or any other stimulus1stimulus2 contingency
represents a respondent conditioning trial each time such a temporally-close pairing
between two stimuli occurs. If presented over a sufficient number of
stimulus1stimulus2 presentations, no matter where an animal is in the operant
chamber or what behavior is occurring there, the animal comes to have a very high
probability of quickly responding to the occurrence of stimulus1 (in our case, sound
associated with water delivery) by running to the dispenser location and consuming
the second stimulus—e.g., the food or water signaled by that stimulus. When this
rapid response to the sound of delivery becomes a highly reliable reaction, the
animal may be reinforced for a behavior occurring within hearing range of the sound
because the sound has become a conditioned reinforcer.
CyberRat was designed to simulate this adaptive process whereby previously
non-eliciting (typically referred to as neutral) stimuli evolve new functional
implications for various behaviors, and thus CyberRat incorporates the full modeling
of this respondent/classical conditioning process—including the development both
of a more probable and shorter-latency “go to dipper” response and of the sound’s
secondary reinforcement functions. This is illustrated in Figure 10 adapted from Ray
and Miraglia (2011) where pre-training latencies of going to the dipper following
water delivery may be compared to post-training “go to dipper” latencies after
magazine training.
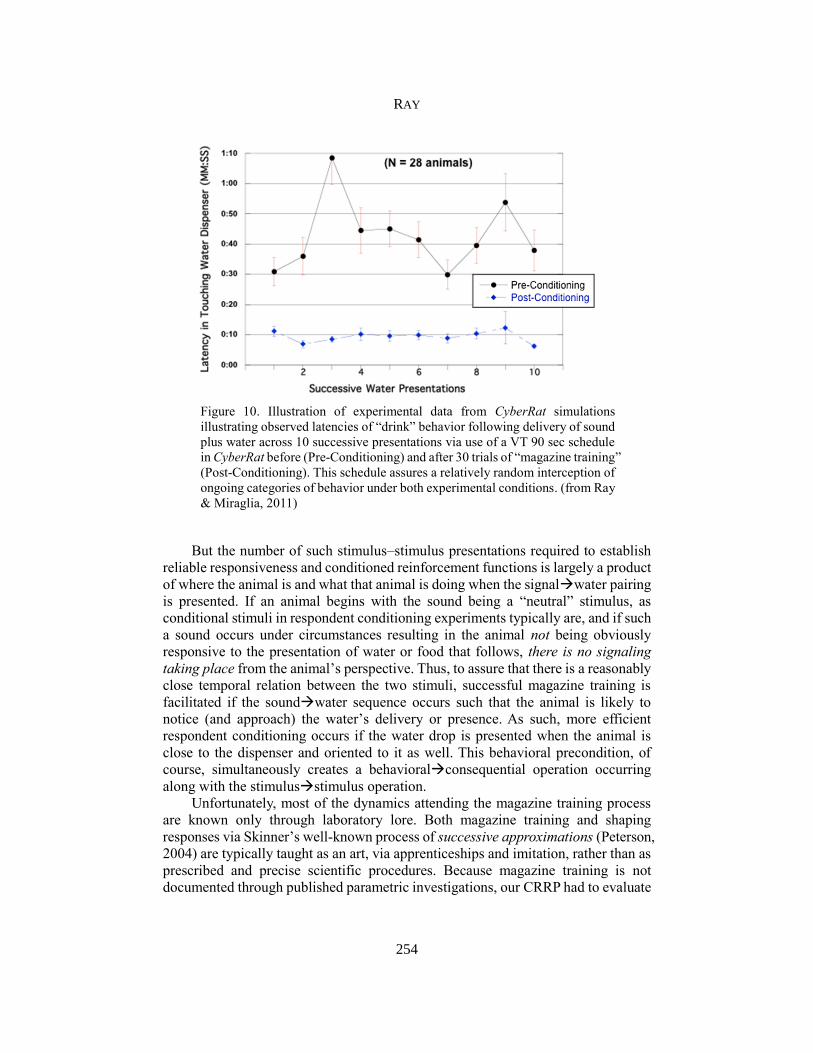
RAY
254
Figure 10. Illustration of experimental data from CyberRat simulations
illustrating observed latencies of “drink” behavior following delivery of sound
plus water across 10 successive presentations via use of a VT 90 sec schedule
in CyberRat before (Pre-Conditioning) and after 30 trials of “magazine training”
(Post-Conditioning). This schedule assures a relatively random interception of
ongoing categories of behavior under both experimental conditions. (from Ray
& Miraglia, 2011)
But the number of such stimulus–stimulus presentations required to establish
reliable responsiveness and conditioned reinforcement functions is largely a product
of where the animal is and what that animal is doing when the signalwater pairing
is presented. If an animal begins with the sound being a “neutral” stimulus, as
conditional stimuli in respondent conditioning experiments typically are, and if such
a sound occurs under circumstances resulting in the animal not being obviously
responsive to the presentation of water or food that follows, there is no signaling
taking place from the animal’s perspective. Thus, to assure that there is a reasonably
close temporal relation between the two stimuli, successful magazine training is
facilitated if the soundwater sequence occurs such that the animal is likely to
notice (and approach) the water’s delivery or presence. As such, more efficient
respondent conditioning occurs if the water drop is presented when the animal is
close to the dispenser and oriented to it as well. This behavioral precondition, of
course, simultaneously creates a behavioralconsequential operation occurring
along with the stimulusstimulus operation.
Unfortunately, most of the dynamics attending the magazine training process
are known only through laboratory lore. Both magazine training and shaping
responses via Skinner’s well-known process of successive approximations (Peterson,
2004) are typically taught as an art, via apprenticeships and imitation, rather than as
prescribed and precise scientific procedures. Because magazine training is not
documented through published parametric investigations, our CRRP had to evaluate

CYBERRAT, INTERBEHAVIORAL SYSTEMS ANALYSIS,
AND A “TURING TEST” TRILOGY
255
the typical number of signaling presentations required for responsive reactions to
appear in live animals.
CyberRat models the data from these experiments, and thus offers most users
with prior experience with the magazine training process a realistic feeling that they
are managing an authentic adaptive process with respect to rate of success in its
development of both animal responsiveness and the development of conditional
reinforcement properties. That being said, perhaps one of the most unnatural and
unrealistic of CyberRat’s characteristics is revealed in the slowness of an animal’s
response to “test probes” that involve delivery of sound/water combinations to
assess latencies in “going to the dipper.” This is true despite the observed relative
declines in response latencies following magazine training, as reflected in Figure 10.
Such probes are typically given in order to evaluate magazine training progress, and
anyone using such a probe typically anticipates finding a very short latency between
soundgo-to-drink reactions by the animal—shorter than those achieved in Figure
10, in fact. The reason for this discrepancy is relevant to consider.
CyberRat uses video clips that vary from 1–2 sec up to 10–15 sec in duration
before a currently depicted behavior will sequence into a subsequent behavior. Thus,
if a water-delivery signaling sound (in CyberRat this is a simulated “drip” sound) is
presented just as a relatively long clip has begun play, it is not possible for CyberRat
to “abort” that clip immediately and have the animal run to the water dispenser to
drink, as most real animals will do. Thus, trainers in CyberRat must be satisfied with
only a very high probability that the animal will return to the dipper after the current
clip has completed play, and with the imposed 9–12 second latencies required to
allow video clip completions rather than seeing the animal respond with the very
quick reactions one expects of live animals. So on this feature, CyberRat passes a
Turing test for functional adaptation based on how it models the process of
respondent/classical conditioning and its associated implications based on response-
probability changes, and with some of the expected decreases in latency (illustrated
in Figure 10) as well as the acquired conditional reinforcement functions, but it
admittedly falls a bit short on the criterion of nearly instantaneous response latencies
following administration of a conditional stimulus (sound of delivery).
Turing Test 2.2: Successive Approximations and Response
Class Generalization Dynamics
There is a very famous film segment depicting B. F. Skinner giving a
demonstration of how to shape a pigeon to turn in a circle as a result of successive
changes in the targeted response that is reinforced. He begins by reinforcing only
those random movements that result in the animal turning its head a bit counter-
clockwise. When this head movement increases sufficiently in rate, Skinner shifts
from reinforcing head turns to reinforcing when he sees the animal’s body turn
slightly in that same direction. This soon turns into reinforcing only quarter-turns,
then half-circle turns, and eventually full-circle turns. CyberRat offers
experimenters similar opportunities for training a rat to make tight circles in either
direction using much the same successive approximation, or response shaping,

RAY
256
process. CyberRat animals will respond to the same process in much the same way,
thus learning to turn either clockwise or counter-clockwise tight circles if shaped
properly.
In its generalized form, Skinner’s technique for response shaping (Peterson,
2004, Skinner 1951) relies upon a process of reinforcing a series of successive
approximations toward the target behavior that one wishes to teach. The process is
usually based upon reinforcing each of a series of steps in a response’s topography
by selectively reinforcing each topography in turn as it more closely approximates
the desired final behavior topography. A substantial discussion of this process is
given in Catania (2007) for those who may not be familiar with the process or its
use of differential reinforcement of successive approximations to the goal response
class. As another example, shaping real animals to bar-press for water reinforcement
typically will begin (after successful magazine training) by reinforcing when the
animal simply removes its head from the water dispenser after drinking. But it is
even better if that head-removal results in the animal turning toward the
manipulandum (lever or bar). Turning its nose in the direction of the bar while
exploring, sniffing the bar, touching it with one paw, and then two paws—all define
a succession of more stringent criteria that gradually come progressively closer to
having the animal actual pressing the bar down sufficiently to close an
electromechanical switch to create automatic delivery of reinforcement.
Each of these described interbehavioral event stages has multiple
representations within CyberRat, and as one class of similar events increases in
probability through reinforcement, other, and slightly different classes of events that
are, themselves, closely related in form and orientation also increase, though not as
much as the reinforced class. Thus, a genuine response and reinforcement
“generalization process” for several different but similar response patterns is
modeled in CyberRat, and this modeling generates a very realistic training
experience for those familiar with the nuances of response shaping through
successive approximations.
CyberRat is ultimately designed as a teaching tool for developing student skills
in shaping behavior and in conducting various experiments. Thus, a CyberRat
feature that is important for evaluating students is included in the simulation.
Untrained animals in CyberRat all begin with a zero probability of pressing the bar
(but not of turning a full circle—that behavior has an only a slightly greater than
zero probability). This is the one distortion incorporated by design into CyberRat. A
zero bar-press probability is not reflective of real animals, but it is extremely useful
for determining that it is the student’s shaping skill that results in successful bar
training in CyberRat. We felt that this was a more important feature, given
CyberRat’s intended educational use, than giving the model a higher fidelity that, in
real-world situations, allows for trial-and-error explorations that may result in some
animals learning to bar-press by random processes alone. Of course, it would have
taken but a simple change in the initial conditional probability matrix for naïve or
habituated animals to incorporate a small but positive “chance” possibility of an
animal pressing the lever. As such, I would argue that this variation of the proposed
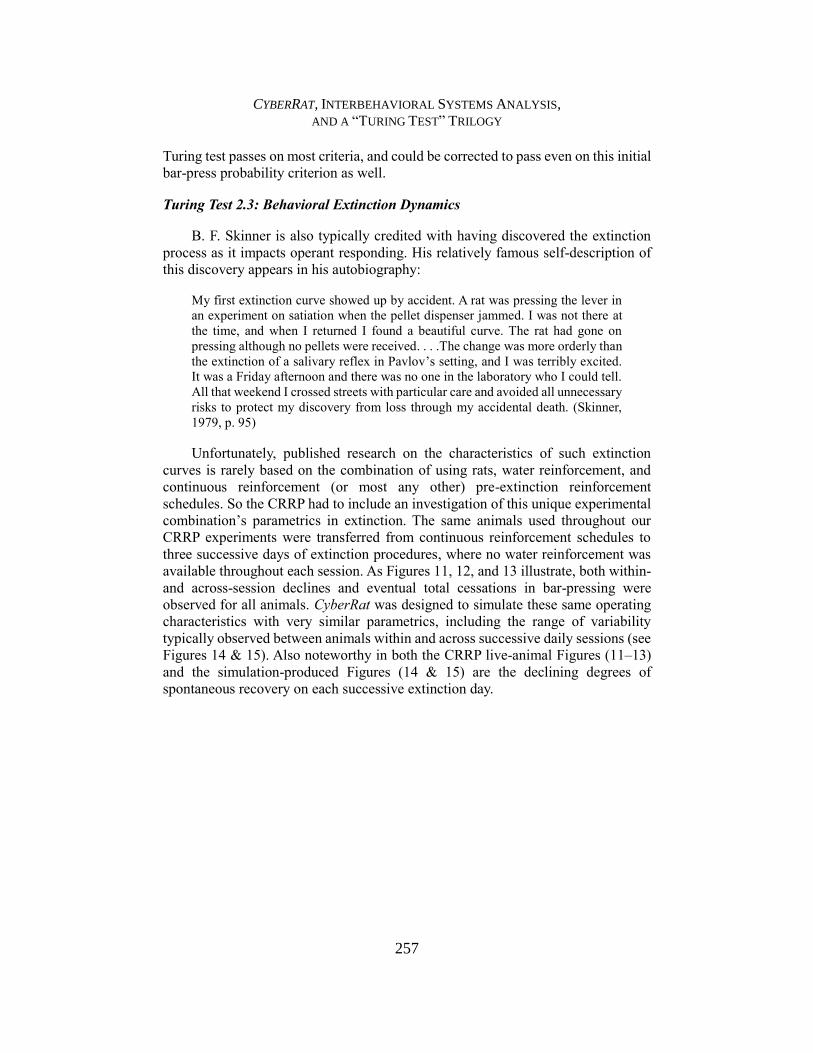
CYBERRAT, INTERBEHAVIORAL SYSTEMS ANALYSIS,
AND A “TURING TEST” TRILOGY
257
Turing test passes on most criteria, and could be corrected to pass even on this initial
bar-press probability criterion as well.
Turing Test 2.3: Behavioral Extinction Dynamics
B. F. Skinner is also typically credited with having discovered the extinction
process as it impacts operant responding. His relatively famous self-description of
this discovery appears in his autobiography:
My first extinction curve showed up by accident. A rat was pressing the lever in
an experiment on satiation when the pellet dispenser jammed. I was not there at
the time, and when I returned I found a beautiful curve. The rat had gone on
pressing although no pellets were received. . . .The change was more orderly than
the extinction of a salivary reflex in Pavlov’s setting, and I was terribly excited.
It was a Friday afternoon and there was no one in the laboratory who I could tell.
All that weekend I crossed streets with particular care and avoided all unnecessary
risks to protect my discovery from loss through my accidental death. (Skinner,
1979, p. 95)
Unfortunately, published research on the characteristics of such extinction
curves is rarely based on the combination of using rats, water reinforcement, and
continuous reinforcement (or most any other) pre-extinction reinforcement
schedules. So the CRRP had to include an investigation of this unique experimental
combination’s parametrics in extinction. The same animals used throughout our
CRRP experiments were transferred from continuous reinforcement schedules to
three successive days of extinction procedures, where no water reinforcement was
available throughout each session. As Figures 11, 12, and 13 illustrate, both within-
and across-session declines and eventual total cessations in bar-pressing were
observed for all animals. CyberRat was designed to simulate these same operating
characteristics with very similar parametrics, including the range of variability
typically observed between animals within and across successive daily sessions (see
Figures 14 & 15). Also noteworthy in both the CRRP live-animal Figures (11–13)
and the simulation-produced Figures (14 & 15) are the declining degrees of
spontaneous recovery on each successive extinction day.

RAY
258
11-1)
11-2)

CYBERRAT, INTERBEHAVIORAL SYSTEMS ANALYSIS,
AND A “TURING TEST” TRILOGY
259
11-3)
Figure 11. Animal A2’s rate of bar-press responding during three successive days
of CRRP exposure to 60-minute sessions of extinction conditions (no water
available for bar-pressing or any other activity). Figure 11-1) illustrates the first
day, 11-2) the second, and 11-3) the third successive day of extinction.
Comparisons of this Figure to Figures 12 and 13 reflect live-animal between-
subject variability in the parametrics of the extinction process.

RAY
260
12-1)
12-2)

CYBERRAT, INTERBEHAVIORAL SYSTEMS ANALYSIS,
AND A “TURING TEST” TRILOGY
261
12-3)
Figure 12. Animal A3’s rate of bar-press responding during three successive
days of CRRP exposure to 60-minute sessions of extinction conditions (no
water available for bar-pressing or any other activity). Figure 12-1) illustrates
the first day, 12-2) the second, and 12-3) the third successive day of extinction.
Comparisons of this Figure to Figures 11 and 13 reflect live-animal between-
subject variability in the parametrics of the extinction process.
13-1)

RAY
262
13-2)
13-3)
Figure 13. Animal A4’s rate of bar-press responding during three successive
days of CRRP exposure to 60 minute sessions of extinction conditions (no
water available for bar-pressing or any other activity). Figure 13-1) illustrates
the first day, 13-2) the second, and 13-3) the third successive day of extinction.
Comparisons of this Figure to Figures 11 and 12 reflect live-animal between-
subject variability in the parametrics of the extinction process.
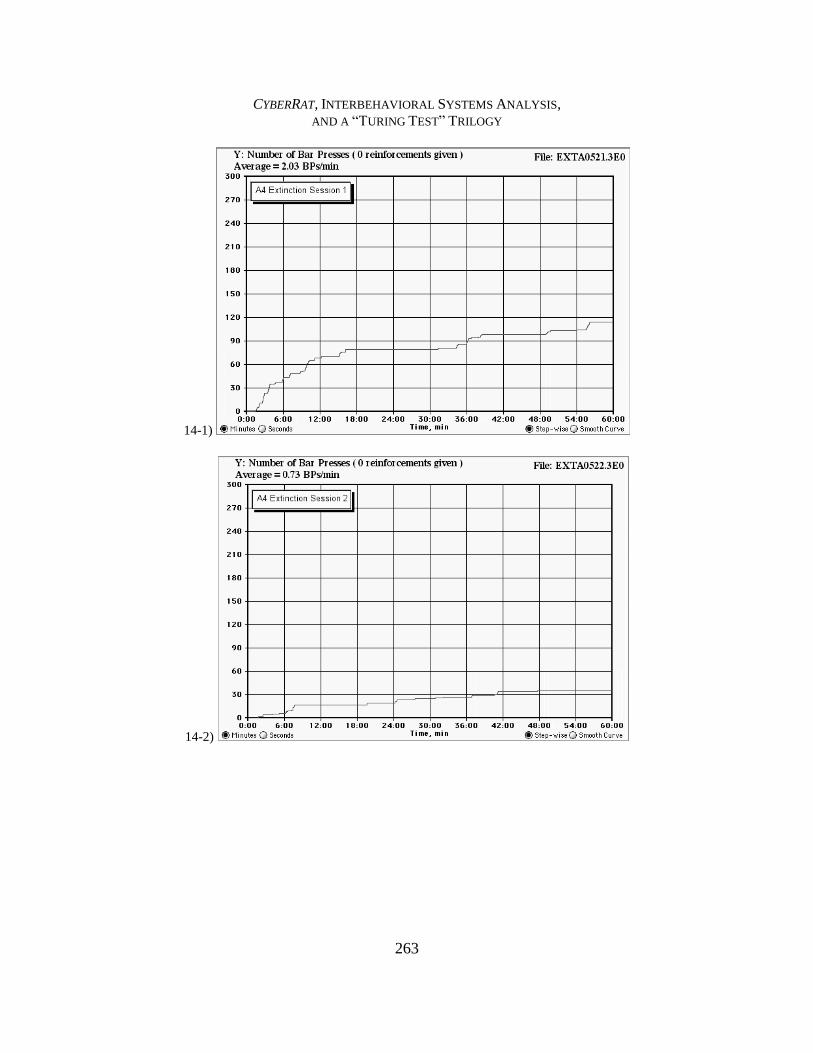
CYBERRAT, INTERBEHAVIORAL SYSTEMS ANALYSIS,
AND A “TURING TEST” TRILOGY
263
14-1)
14-2)

RAY
264
14-3)
Figure 14. Illustration of first CyberRat animal Demo324’s rate of bar-press
responding during three successive 60-minute sessions (equivalents of days)
of extinction Reinforcement-Rule settings (no water available for bar-pressing
or any other activity). Figure 14-1) illustrates the first day, 14-2) the second,
and 14-3) the third successive day of simulated extinction. Comparisons to
Figures 11, 12, and 13 reflect how CyberRat simulations compare to live-
animal data, while comparison to Figure 15 reflects a sample of between-
subject variability in CyberRat simulations.

CYBERRAT, INTERBEHAVIORAL SYSTEMS ANALYSIS,
AND A “TURING TEST” TRILOGY
265
15-1)
15-2)
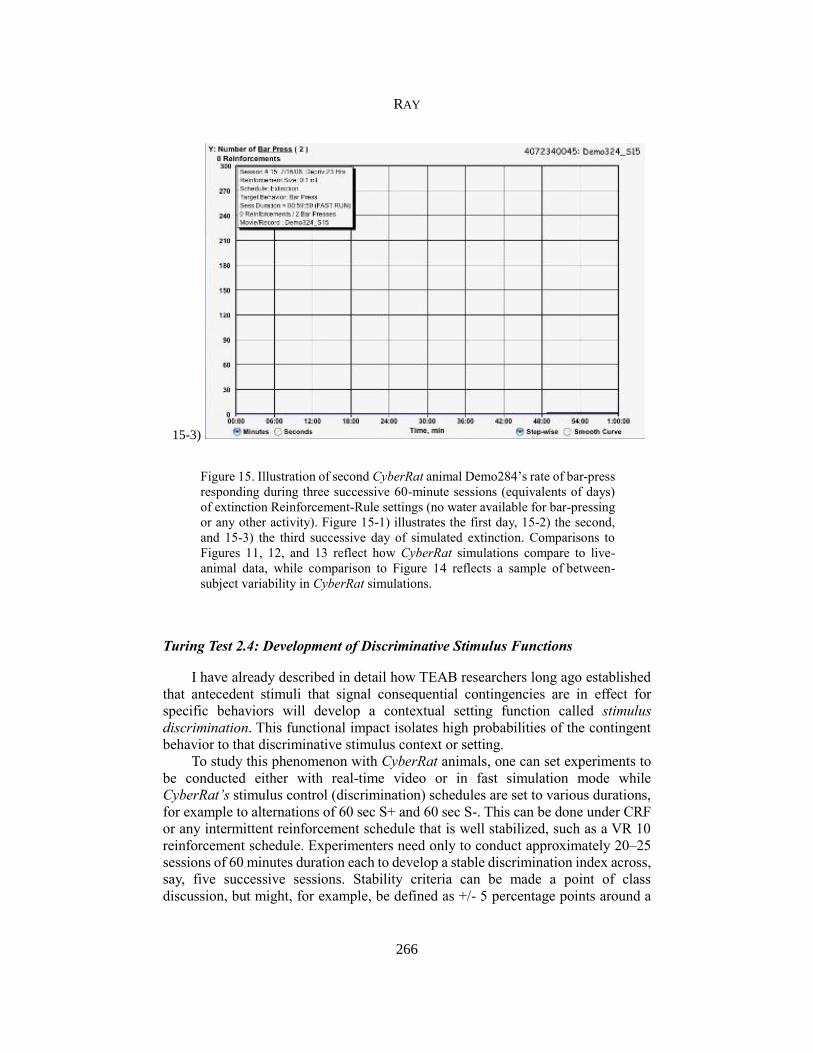
RAY
266
15-3)
Figure 15. Illustration of second CyberRat animal Demo284’s rate of bar-press
responding during three successive 60-minute sessions (equivalents of days)
of extinction Reinforcement-Rule settings (no water available for bar-pressing
or any other activity). Figure 15-1) illustrates the first day, 15-2) the second,
and 15-3) the third successive day of simulated extinction. Comparisons to
Figures 11, 12, and 13 reflect how CyberRat simulations compare to live-
animal data, while comparison to Figure 14 reflects a sample of between-
subject variability in CyberRat simulations.
Turing Test 2.4: Development of Discriminative Stimulus Functions
I have already described in detail how TEAB researchers long ago established
that antecedent stimuli that signal consequential contingencies are in effect for
specific behaviors will develop a contextual setting function called stimulus
discrimination. This functional impact isolates high probabilities of the contingent
behavior to that discriminative stimulus context or setting.
To study this phenomenon with CyberRat animals, one can set experiments to
be conducted either with real-time video or in fast simulation mode while
CyberRat’s stimulus control (discrimination) schedules are set to various durations,
for example to alternations of 60 sec S+ and 60 sec S-. This can be done under CRF
or any intermittent reinforcement schedule that is well stabilized, such as a VR 10
reinforcement schedule. Experimenters need only to conduct approximately 20–25
sessions of 60 minutes duration each to develop a stable discrimination index across,
say, five successive sessions. Stability criteria can be made a point of class
discussion, but might, for example, be defined as +/- 5 percentage points around a

CYBERRAT, INTERBEHAVIORAL SYSTEMS ANALYSIS,
AND A “TURING TEST” TRILOGY
267
90% discrimination index value. Assigning such an experimental series was reported
in Ray and Miraglia (2011), where students were requested to plot each successive
session’s discrimination index (a ratio of total bar-presses during S+ vs. total bar-
presses for the entire session, which includes all S+ and S- periods) in a spreadsheet
and then to graph the process’s development curve. A typical outcome is illustrated
in a figure reproduced from Ray and Miraglia’s report (see Figure 16).
Figure 16. Discrimination Index plotted across a series of 25 successive
sessions under an alternative 60 sec S+/S- stimulus discrimination schedule
setting in CyberRat. (from Ray & Miraglia, 2011)
The development of this discriminative control function illustrated in Figure 16
will vary depending upon reinforcement schedules and individual animals. However,
I have found that a graph of this index from CyberRat vs. a similar graph from live
animals given this experience are likely to be quite difficult to distinguish from one
another. As such, I propose that another Turing test is reasonably satisfied either on
the phenomenological basis of directly observing the animal’s full range of
behaviors during a late discrimination session or on the basis of quantitative data
plot comparisons. And this latter point holds regardless of whether the quantitative
data are traditional session-based cumulative response records or graphs of derived
measures, such as successive plots of discrimination indices. Likewise, a
comparison of kinematic behavioral organizations within the S+ vs. S- will closely
align with those depicted in Figure 5 if respective reinforcement conditions match
those used by Ray and Brown (1975) to generate these results.

RAY
268
Operations Analysis of Interbehavioral Systems
In the previous section I used the automobile as an example to illustrate the
marked difference between structural and functional analysis from the systems
perspective. I also mentioned briefly that operational characteristics, such as how a
car handles or what kind of total fuel efficiencies it accomplishes, would be further
detailed in my subsequent section. This is that subsequent section. Operating
characteristics of a system are best described as patterns of change or consistencies
in a system’s state across time. Thus, an automobile has quite different fuel
efficiencies that can change from moment to moment depending upon how and
where it is driven (e.g., city-based stop-and-go driving with many accelerations/
decelerations and associated frequent changes in gear ratios vs. highway driving at
relative constant speed and in an “overdrive” transmission state).
If you add a relatively small amount of water to your car’s gas tank you are
likely to experience a lot of lurching or misfiring in the engine, which may also result
in momentary “stalls.” The normally smooth sequencing of piston-cylinder firing as
an operating characteristic is being changed by these intermittent misfires on various
cylinders, and you phenomenologically detect this change in operating
characteristics. Of course, your mechanic has a machine that can monitor and
diagnose such misfires by identifying both specific location and timing of each
misfiring cylinder.
Add even a relatively small weight to a single wheel of your automobile to put
that wheel somewhat out of balance and the normally smooth driving characteristics
associated with well-balanced wheels will quickly change to a shaky or vibrating
driving experience (plus a quick and uneven wearing of the tread on the tire that is
out of balance). The high-speed rotational balancing machine often used for
adjusting the balance of a wheel is actually a special-purpose monitor of a wheel’s
rotational operating characteristics. All of these examples illustrate a phenomenon
that GST refers to as specific operating characteristics of your car. The
phenomenological detections of these irregular or abnormal operating
characteristics serve as important prompts for you to take your car to a garage for
more formal diagnosis and repair before is stops operating altogether.
“Operations analysis” is a broad term in GST that encompasses several related,
formalized disciplines that coalesced in the mid-twentieth century, including
operations research (cf. Churchman, Ackoff, & Arnoff, 1957; Taha, 2011) and
dynamical systems analysis (cf. Abraham & Shaw, 1992; Alligood, Sauer, & Yorke,
2000; Katok & Hasselblatt, 1996). Both of these fields use applications of time-
sensitive mathematics. What distinguishes them is whether their time-series analyses
are applied primarily (although not exclusively) to complex human decision making
and management science (operations research) or trajectory predictions and chaos
theory (dynamical systems). The one common element of all operations analysis is
an emphasis on momentary states of a “controlled system” that subsequently change
(or not) across time in somewhat predictable ways. Frequently, such changes occur
because of built-in feedback or other self-influencing mechanisms (hence the
description as a “controlled” system) incorporated into the system itself. Feedback

CYBERRAT, INTERBEHAVIORAL SYSTEMS ANALYSIS,
AND A “TURING TEST” TRILOGY
269
and other internal control mechanisms typically generate some relatively coherent
pattern in a time-series of successive measurements of that system’s state. Several
mathematical techniques for describing such patterns or their components are used
by systems analysts, including power-spectral analysis and dynamical equation
modeling (cf. Jagacinski & Flach, 2003; Powers, 1973).
At a very rudimentary level, Skinner was unwittingly one of the pioneers in the
use of time-series measurement in the study of animal behavioral dynamics. Thus,
one of Skinner’s primary contributions to behavioral science was his strong reliance
on a visual form of time-series measurement—the cumulative record (cf. Lejeune,
Richelle, & Wearden, 2006). This contribution supported Skinner’s emphasis on
measuring response rates rather than accuracies (e.g., Skinner, 1950). Cumulative
records track how a functional class of operant behavior (e.g., bar-pressing
transformed into electrical switch closures) changes in rate of occurrence under
various establishing and experimental circumstances such as intermittent schedules
of reinforcement (e.g., Ferster & Skinner, 1957) or the discriminative settings
already described. Of course, Skinner was not the first, nor the only, person to
emphasize the use of rate measures of behavior (cf. Morris & Smith, 2004).
Nevertheless, his insistence on the functionality of cumulative records and the
emphasis they placed on rate of response is one of his major contributions to early
psychological research (cf. Skinner, 1950).
Unfortunately, Skinner tended to emphasize only visual inspection of
cumulative response records (cf. Ferster & Skinner, 1957). Thus, rate-change
characteristics associated with various intermittent schedules of reinforcement, such
as scalloping under fixed-interval schedules and break-run patterns observed under
fixed ratio schedules, are widely cited time-series characteristics associated with
Skinner’s research. Skinner never formalized the mathematical analysis of changes
in the rates depicted in his cumulative records (i.e., equations describing patterns of
accelerations/decelerations), but more specialized areas of research on the time-
series characteristics of responding using the TEAB methodology have been
developed in research subsequent to Skinner’s work. Notable examples exist mainly
in the sub-field of TEAB called the Quantitative Analysis of Behavior (QAB), with
some examples being Schneider’s analysis of fixed-interval response characteristics
(cf. Schneider, 1969), Strand’s (2001) analysis of momentum and matching, as well
as Nevins’s work on behavioral momentum (cf. Nevin & Grace, 2000; Nevin,
Mandell, & Atak, 1983). Historically, textbooks on TEAB rarely included such
research in any significant detail, but recent publications suggest that this may
eventually change (cf. Fisher, Piazza, & Roane, 2011).
As noted, from the GST point of view both TEAB’s and QAB’s emphases on
cumulative records and single response classes to describe bar-pressing rate changes
illustrate interests in the operating characteristics of an animal’s bar-pressing. To
investigate the consistency or changes of response rates under alternative
experimental conditions (e.g., intermittent reinforcement schedules or the
discriminative S+ and S- conditions cited earlier) is clearly an example of an
experimenter’s interest in operating characteristics as a function of external
variations in attendant experimental conditions. Unfortunately, the history of TEAB

RAY
270
has typically limited its focus on only a single functional response class—especially
one defined by mechanically punctate events such as electro-mechanical switch
closures. This focus fails to capture the broader organizational dynamics between
various functional response classes and other behaviors attendant to those functional
events, thus typically ignoring the operating characteristics of the larger organismic–
environmental system as defined by the IBSA perspective.
An analysis of any system’s operating characteristics emphasizes dynamic
processes and state changes. As noted earlier, such an emphasis is grounded in a
fundamental break from entity/substance philosophy in favor of process-focused
philosophy (c.f., Browning & Myers, 1998; Hartshorne, 1971; Whitehead, 1925,
1948). Ray & Delprato (1989) offer some details of how this change from substance
theory to process theory relates to Kantor’s interbehavioral view of organism–
environment interaction. Through many concrete and empirical examples, Ray and
Delprato illustrate unique operations-oriented concepts such as behavioral velocity,
pattern complexity/coherence, and circadian and ultradian rhythms in behavior. It is
not my purpose to review these examples in the present context, but a few highlights
relevant to CyberRat modeling need to be described to better understand what has
been included in that model specifically.
Some Operations Analysis Experiments and CyberRat’s Modeling
As I have noted previously, the Ray and Brown (1975, 1976) publications were
among the first of which I am aware that investigated behavioral patterning and
organization associated with rats habituating to their first exposure to an operant
chamber. Unfortunately, the limited technologies available in the early 1970s
required the use of behavioral sampling techniques that allowed only approximate
calculations for behavioral sequences and associated unconditional/conditional
behavioral probabilities. Durations for each successive behavior were not possible
to calculate because behavioral occurrence and sequence within the “5-second
observation/15-second recording” sampling windows that were used were the only
parameters recorded. However, decreasing prices of video recording equipment in
the latter part of the 1970s began to make continuous recording more accessible and
affordable for researchers. Thus, Ray, Upson, and Henderson (1977) were able to
study the temporal dynamics inherent in behavioral systemics with much higher
degrees of temporal precision than earlier studies. The continuous recording
techniques in this later study allowed us to focus on temporal operating
characteristics in general behavioral kinematics. Thus, a new dimension was added
to our research tactics that relied upon time-series data collection and analysis. Using
this tactic revealed highly reliable and interdependent temporal patterns in various
behavioral dynamics within various alternative setting conditions and across
multiple 24-hour periods. Unfortunately, that series investigated highly trained rats
under different schedules of discriminative stimulus control, but it did not
investigate simple chamber habituation at all. Other data that Ray, Upson, and
Henderson report were largely derived from observations of killer whales (Orcinus
orca) living and working in captive oceanaria. As such, this publication provided no

CYBERRAT, INTERBEHAVIORAL SYSTEMS ANALYSIS,
AND A “TURING TEST” TRILOGY
271
parametrics on time-series measures relevant to CyberRat’s modeling of habituation
behavior in operant chambers.
Thus, one of the first systematic observations we made during the CRRP
focused on describing operating characteristics of changes in interbehavioral
structure during pre-conditioning exposure of rats to an operant chamber—a process
typically referred to as contextual habituation (cf. Churchill, Remington, & Siddle,
1987; Mitchell, Yin, & Nakamatsu, 1980). This portion of the CRRP research
allowed us not only to establish parametric variations applicable to modeling
CyberRat’s general kinematics during habituation, it also allowed us to incorporate
other important operating characteristics that were unique to any specific behavioral
category as well, as will be illustrated below. In this stage of the CRRP we recorded
behavioral observations using a relatively mid-grained behavioral category system
similar to my previous studies (see Table 1).
Table 1. Behavioral coding taxonomy used in the CyberRat Research
Project (CRRP) conducted to establish parametrics of behavioral
kinematics during pre-experimental habituation sessions.
Behavior Definition
bar press Subject depresses the lever operandum sufficiently to trigger
a monitoring light diode.
bar touch Subject touches the lever operandum with nose or paw(s).
dipper entry Subject breaks the plain of the dipper/wall barrier with nose.
object touch Subject touches lights, top latch, or wall screws with nose or
paw(s).
rest Subject shows no movement, other than fibrissa, for
sustained period (>3 seconds).
freeze Subject shows no movement, including fibrissa, for sustained
period (>3 seconds).
groom self Subject licks self or paws, including movement of paws over
nose.
bite self Subject divides fur and bites at self during grooming.
scratch self Subject uses hind foot to scratch self during grooming.
move Subject moves at least one hind paw, thus changing locations
and/or orientations in the chamber.
explore Subject moves upper body, but not hind feet, thus changing
orientations and/or levels in the chamber. One forepaw may
be raised from the floor in this activity, but not both at the
same time.
rear Subject raises both forepaws off the floor in upright
exploration, but remains fixed in the placement of both
hindfeet.

RAY
272
The more dynamic tracking using time-series operations analyses tactics
focused on more subtle kinematic changes across the session in this same habituation
context. This analysis relied upon measurements of various behavioral kinematic
parameters within each successive 5-minute window across each session for
individual animals. Structural/organizational (i.e., kinematic) analysis of the last 5
minutes of behaving in the chamber was used to reflect the final adaptation that
occurs when referenced against a similar analysis of the first 5 minutes of behaving
in the chamber, while the interceding kinematics reflect the transitional dynamics of
this adaptive process. This implies, of course, an assertion that habituation is one
form of functional adaptation as systems theorists view the adaptive process. And
the first operating characteristics modeled by CyberRat that will be detailed are
those time-series dynamics we found to be associated with this adaptive habituation
process.
The Third Series of Turing Tests: Operating Characteristics
and Time Series Dynamics Simulated in CyberRat
The kinematic flowchart resulting from a structural/kinematic analysis
determined from behaviors occurring across the entire habituation period (i.e., each
of the complete 30-min sessions combined with one another) assessed during the
CRRP is depicted in Figure 17. For simplification, this Figure includes only the
higher probability paths of behavioral organization and thus leaves out all
conditional probabilities with less than .05 values.
Figure 17. Kinematic flow diagram depicting a composite average of three
separate live animals from the CyberRat Research Project (CRRP) across their
first “habituation” session in an operant chamber. Habituation involves no
external stimulus manipulations by the experimenter other than the setting change.
No water is available to the animal during such sessions. In this flow diagram,
arrow widths are proportional to the conditional probabilities for each type of

CYBERRAT, INTERBEHAVIORAL SYSTEMS ANALYSIS,
AND A “TURING TEST” TRILOGY
273
sequence. To make the diagram simpler, all types of behavior sequences with less
than .05 probability have been removed. These data were used to determine
approximate “seed” values for CyberRat’s original kinematic matrix, but each
first had to be adapted to the more complex coding categories used to classify
clips comprising the simulation.
The most frequently occurring behavior illustrated in this Figure is Exploring,
which accounts for 40% of all initiated behaviors for the entire 30-minute session.
From Exploring behaviors, subjects subsequently engage in Move with a .43
probability, followed by Rearing and Dipper Entry each at approximately .10
probability. From Move and Rear, the animals are most likely to return to Exploring,
with a .94 probability of MoveExplore and approximately .40 probability of
RearExplore. Approximately 90% of all sequences involve these three behaviors.
As noted previously, these data were used to seed the initial behavioral kinematics
in our modeling of habituation and all pre-training video reconstructions in
CyberRat V2.0. But we also incorporated dynamic characteristics not yet
described—dynamics reflected in specific behavioral unconditional probabilities as
those probabilities change across habituation sessions for each category of behavior.
So let me now consider how realistically CyberRat models the dynamics of those
category-specific behavioral operating characteristics we found from the CRRP
project.
Turing Test 3.1: Kinematic Dynamics Across the Process of Habituation
To explore the operating characteristics of specific categories of behavior and
how each of their associated probabilities may change across the habituation session
in the CRRP, we combined selected behavior categories to create a more “macro-
level” of description (cf. Ray, Upson, & Henderson, 1977). We collapsed the initial
coding categories described in Table 1 into new macro-behavioral categories
comprised of functionally related groupings as follows:
Inactive Behavior (rest and freeze)
Object-Oriented Behaviors (bar press, bar touch, dipper entry,
and object touch)
Self-Oriented Behaviors (groom self, bite self, scratch self)
Spatially-Oriented Behaviors (move, explore, and rear)
Figure 18 illustrates temporal changes in the unconditional probability for each
of these four macro-categories across each successive 5-minute window of a 30-
minute habituation session for three subjects combined. These unconditional
probability graphs illustrate that subtle but systematic temporal changes occur in
some behavioral probabilities across the duration of a single habituation session. For
example, the graphs reveal relatively high probabilities of object-directed behavior

RAY
274
early in the habituation session, and these probabilities increase up to approximately
mid-session. At this time self-directed behaviors, having gradually increased until
minutes 16–20, become more probable, then afterwards decline. At the same time,
spatially-directed behavior is maintained at a high probability throughout most of
the session, but with a noted increase at the end of the session. Inactive behavior
increases in probability gradually during only the latter half of the habituation
session.
a)

CYBERRAT, INTERBEHAVIORAL SYSTEMS ANALYSIS,
AND A “TURING TEST” TRILOGY
275
b)
c)

RAY
276
d)
Figure 18. Time-series plots from the CyberRat Research Project (CRRP)
across successive 5-minute windows depicting unconditional probabilities for
18-a) Inactive Behaviors, 18-b) Object-Oriented Behaviors, 18-c) Self-
Directed Behaviors, and 18-d) Spatial-Orientation Behaviors for all three live
animals combined during pre-training Habituation exposure to the operant
chamber.
If an experimenter conducts a single 60-minute habituation session in CyberRat
and uses a coding scheme comparable to the macro codings that were applied in the
CRRP, a very similar graph will be obtained. But CyberRat allows one to generate
graphs even without direct observational coding for a few micro-level categories of
behavior. The behaviors that are auto-tracked in CyberRat are based upon their
special focal interest (e.g., visits to the water dipper or self-grooming) or their
potential as shaping objectives (e.g., turning in tight circles). As noted, these
categories may be graphed as cumulative records without requiring the labor and
time associated with systematic observation-based coding of each category.
One example of the realistic modeling of a single category’s operating
characteristics is CyberRat’s reliable reproduction of the mid-session concentration
of grooming as documented in the CRRP and illustrated in Figure 19, which is a
different animal but a near-perfect reproduction of an equivalent CyberRat
experiment reported in Ray and Miraglia (2011). CyberRat reproduces the
systematic time-series variations in this behavior category’s dynamics with
sufficient fidelity to warrant the assertion that CyberRat would likely pass a Turing
test for this particular operating characteristic, as it is likely to do for other specific

CYBERRAT, INTERBEHAVIORAL SYSTEMS ANALYSIS,
AND A “TURING TEST” TRILOGY
277
behaviors as well. However, there is one associated interbehavioral dynamic
associated with habituation that is not reproduced by CyberRat and thus deserves
explanatory comment. That dynamic is the general rate of change from behavior-to-
behavior throughout entire sessions—a time-series measure best described as
behavioral velocity.
Figure 19. Sample of CyberRat data illustrating typical second-quarter-of-
session concentrations of occurrences for Grooming events across a 60-minute
Habituation session graphed as a traditional cumulative record but with the Y
axis set to 100 events maximum to amplify lower-frequency events.
Behavioral Velocity during Habituation. Ray and Brown (1975) first
introduced the idea of measuring the rate at which all behaviors change from
category to category throughout the kinematic flow and regardless of which specific
behaviors are involved in each successive change in behavior. Over the years I have
referred to this measure as either “behavioral flow rate” (Ray & Brown, 1975) or
“behavioral velocity” (Ray & Delprato, 1989). In essence, the measure is an inverse
reflection of the generalized durations of all behaviors considered collectively.
When behavioral velocity is high, most behaviors are relatively short in duration.
When behavioral velocity is low, many, if not most, behaviors tend to be longer in

RAY
278
duration. Selective behaviors can impact this general measure, of course. For
example, grooming tends to be much longer in duration than movements from place
to place. As each category of behavior changes in relative frequency and duration,
general behavioral velocity will reflect such changes as a more global and integrated
measure than will each specific behavior category’s measures (Ray, Upson, &
Henderson, 1977).
The general behavioral velocity averaged across all three subjects in the CRRP
was calculated for each successive 5-minute window across the entire habituation
session. Results of this analysis are depicted in Figure 20, where one can see a
gradual and systematic decline of nearly 50% in the rate of change from behavior to
behavior up until the last 5-minute period, at which time behavioral velocity begins
to increase again. As noted in the previous section, this is due largely to the fact that
the animals are increasing spatial exploration during this last windowed period, and
such behaviors are typically of shorter duration than self-directed behaviors such as
grooming and resting.
Figure 20. Data from the CyberRat Research Project (CRRP) plotted as a time-
series across successive 5-minute windows depicting average behavioral
velocity across three live animals during 30 minutes of a pre-training
Habituation exposure to the operant chamber.
Unfortunately, the generalized behavioral velocity just described is one
parameter that could not be incorporated into CyberRat. This is largely because
CyberRat uses a random selection from any given sample of video clips representing

CYBERRAT, INTERBEHAVIORAL SYSTEMS ANALYSIS,
AND A “TURING TEST” TRILOGY
279
each behavioral category in the CyberRat corpus. CyberRat includes various
numbers of video illustrations for its different categorical events, even though such
behaviors must include similar context and orientation. For example, there is a very
large variety of bar-pressing clips to allow the topography of bar-pressing to vary
and/or to become stereotyped across reinforcement patterns. This gives the
constructed video play a sufficient variety of selections to make repeated clips hardly
noticeable even when kinematic patterns are, themselves, relatively stereotyped. But
most clips representing any given category, whether bar-pressing or any other
behavior, are of relatively similar durations. But even if such clips were dramatically
different in duration, random selection from each categorical sample means that
rhythmic variations in duration within a given category or in general velocity across
windows of time are not likely to occur in CyberRat simulation-generated data. As
such, behavioral patterns in CyberRat do not typically reflect systematic changes in
generalized behavioral velocity.
Nevertheless, where possible CyberRat does use some event self-repetitions to
artificially extend durations of some behavior categories at appropriate times during
a session, especially for creating multiple and/or rapid-rate bar-press “bouts” and for
extending “resting” periods involving little to no movement. It is from this latter
case that late-session increases in probabilities of inactivity (see Figure 18a) are
possible in CyberRat. But resting does not occur as reliably and systematically as in
many real-animal observations.
From research on real animals (Ray, Upson, & Henderson, 1977) we know that,
especially in settings that do not incorporate reinforcement dynamics (such as S-
conditions, where no reinforcement contingencies exist in discrimination
experiments), general behavioral velocity is largely a function of the rate of
alternating setting conditions (i.e., rates of changing from one contextual stimulus
state to another, e.g., S+ / S- changes). Rapid changes in environment can result in
dramatic perturbations in moment-to-moment behavioral velocity when S- first
begins, but these perturbations are typically followed by damped oscillations in that
velocity (see Figure 21). As with my previous example of limitations in simulating
behavioral velocity, both the random sampling and the homogeneity of durations of
clips that represent the same behaviors make it nearly impossible to accurately
model transitional perturbation/decay dynamics of behavioral velocity resulting
from changes in the durations of alternating discriminative settings. Thus, no effort
was made to incorporate such dynamics into CyberRat’s simulations.
This is an instance where the interbehavioral systems descriptive methodology
clearly outpaces CyberRat’s ability to incorporate real data into its video-driven
modeling of complex behavioral dynamics. But one could, with sufficient
investments of time and effort, overcome this shortcoming by using a much larger
sample of clips depicting each behavioral category and by sorting clips into sub-
classifications based on varying durations. This would allow algorithms to then
specify whether long, medium, or shorter durations for a given category is to be
selected dependent upon the current algorithm-driven velocity requirements. So this
issue is more of a practical limitation rather than a shortcoming of IBSA
methodology per se.

RAY
280
Figure 21. Figure from Ray, Upson, and Henderson (1977) depicting mean
changes in behavioral velocity during each successive 5-second window
following S- (house-light “off”) onsets and continuing until the mean S+
(house-lights “on”) onset. Data are from a response-contingent group of
animals highly trained for stimulus discrimination and depicted changes are
for the combined final two sessions of rapid S+/S- alternation pacing vs. slow
S+/S- alternation pacing.
Other Operating Characteristics Modeled in CyberRat. The coding system
used in the CRRP was also used for our initial identification of CyberRat’s potential
video clips. As noted previously, in CyberRat the animal’s directional orientation
and physical location within the chamber were also taken into account for eventual
clip edit-selection and sequential integration. Thus, after our initial identification of
potential clips, a more micro-level coding system using relatively fine-grained,
field-specific criteria was used to select clips in the new and improved digital video
corpus for CyberRat V2.0. Of course, such micro-level accounts must coincide with
reconstructions of macro-categories with respect to the previously described
operating characteristics in macro-behavioral parametrics and patterns. This is made
possible by the fact that within CyberRat micro-level categories are all related by
higher-order macro-level categories like those used in the CRRP.
This ability to translate from lower-level categories to more globally-focused
higher-level categories is one of the explicit properties of hierarchically-defined
subsystems within systems theory, and the phenomenon was illustrated in detail by

CYBERRAT, INTERBEHAVIORAL SYSTEMS ANALYSIS,
AND A “TURING TEST” TRILOGY
281
Ray and Delprato (1989). As such, CyberRat’s Multi-Behavior Analysis component
introduced earlier (see p. 245) incorporates algorithms that can, with reasonable
approximations, translate any video transcript archive of any session into relatively
accurate macro-codings similar to the macro system used in our CRRP project. This
is also the mechanism for a feature in CyberRat that allows users to graph cumulative
records for several specific macro categories of behavior across the duration of any
session—as was illustrated for grooming in Figure 19. This allows users to explore
each incorporated macro-category’s operating characteristics across any given
session.
But in addition to the “structural” hierarchical translations described above,
unique to CyberRat’s modeling is its incorporation of macro-category-specific
“rhythms” in the changing probabilities of individual macro categories of behaviors
(thereby impacting the probability of use for each associated micro-level clip within
the corpus). These rhythms were generally designed to model temporal patterns of
specific temporal behavior probability dynamics depicted in Figure 18. Thus, early
in a session each animal in CyberRat is more likely to consistently explore and move
about the chamber than it is to self-groom/scratch. And as I reported in a previous
section, grooming categories are much more likely to occur during the mid to latter
portions of a typical 30-minute session than in early or the very last portions of such
a session (Figure 18c). Of course, the interplay between such independent rhythms
results in a complex and varying reproduction, which reflects normal variances in
mean probability values of any given macro-behavior family. Thus, the temporal
dynamics revealed in such behaviorally-specific cumulative response records as the
one discussed earlier depicting how grooming occurrences were distributed
throughout a session of habituation are also reproduced in CyberRat’s modeling. But
CyberRat was also designed especially for student learning where live-animal
laboratories are no longer available (cf. Ray & Miraglia, 2011). Because most of the
courses that would rely upon such laboratories are teaching TEAB principles, the
primary behavior CyberRat uses to reflect such temporal behavioral operating
dynamics as they are impacted by intermittent reinforcement dynamics is the
category of bar-pressing.
Thus, in CyberRat’s modeling we focused especially, but certainly not
exclusively, on the singular-response class of bar-pressing and its associated
cumulative response dynamics. In sections that follow I will review parametric data
produced especially during the CRRP and its focus on bar-press operating
characteristics under various intermittent schedules of bar-press reinforcement. In
addition to our own CRRP research, Dr. Paul K. Brandon at Mankato State
University in Minnesota also graciously conducted many experimental sessions with
rats to generate cumulative response data comparisons and guidance in our
development of simulations that matched real-animal data. These data were crucial
in achieving CyberRat’s realistic modeling of associated temporal operating
characteristics in bar-press rates. As such, traditionally defined operant/respondent
conditioning dynamics will be the main focus of the remainder of my presentation.
Most of these dynamics required new parametric investigations via the CRRP and
Dr. Brandon’s efforts to allow detailed modeling, as many phenomena described in

RAY
282
typical behavioral analytic publications rely upon pigeons and rats under food
deprivation.
As noted earlier, few extant publications used the specific combination of rats
bar-pressing and the use of water deprivation and water reinforcement. Further,
many well-known phenomena we included in our model are only described as a sort
of laboratory folklore or art, such as magazine training and response-shaping
dynamics. Some of our required investigations were simple to carry out, while others
required many sessions and complex manipulations. But readers should not lose
sight of the fact that when CyberRat models bar-pressing, the video reconstructions
in CyberRat also require a faithful reproduction of all non-bar-pressing behaviors
that fill the temporal and spatial gaps between each bar-press. I will begin reviewing
some challenges of this reproduction process by detailing our research on a singular
dynamic involving short-term operating characteristics of behaviors that precede
bar-pressing at the very beginning of any new experimental session—a specific
habituation-to-setting-change phenomenon we refer to as “warm-up” dynamics.
Turing Test 3.2: Setting Changes and Bar-Press “Warm-up” Dynamics
With perhaps the exception of studies reported by Ray, Upson, and Henderson
(1977), there appears to be little systematic research available on complex
behavioral dynamics associated with individuals—whether human or non-human—
habituating to a change in contextual settings. As our 1977 paper reported, when
organisms experience a change from one setting to another there is a “perturbation
and settling” period typically involved that precedes the organism’s engaging
directly in behavior patterns more common or appropriate for the new setting. Even
without prior study of the process, readers will likely recognize the phenomenon.
Think back to the last time you entered a room where people were in the process of
being seated in anticipation of the start of a class, a presentation/lecture, or a meeting.
How quickly and with what difficulty is everyone’s attention focused on starting the
meeting? A relative few appear to be ready at once, while others continue
conversations and/or are taking out notepads, laptop computers, etc. This process
persists for quite some time, even after the teacher, speaker, or moderator has begun
to start “calling the class/meeting to order.”
It is much the same with rats—including individual rats being moved from
home cages to previously-experienced operant chambers for new experimental
sessions. Thus, well after a rat has been trained to bar-press reliably and consistently,
any new session that involves moving that rat or changing the discriminative
ambient lighting conditions imposes a contextual setting change on the animal. As
with most such setting changes, the act of moving even a deprived animal from home
cage to the operant chamber will result in an immediate period of exploration,
movement, rearing, and other “settling” behaviors—including an isolated
press/drink now and then, that precedes the animal becoming focused more
exclusively on bar-pressing at a relatively steady rate. To differentiate this form of
habituation from the pre-training or full-session habituation, I will refer to this much
more brief habituation period as a pre-bar-press “warm-up” period and, as with most

CYBERRAT, INTERBEHAVIORAL SYSTEMS ANALYSIS,
AND A “TURING TEST” TRILOGY
283
real-world parametrics modeled in CyberRat, no publications on the phenomenon
were found that were suitable for informing our simulations of the process.
So in the CRRP we subsequently trained the same three animals we had used
for the pre-training habituation research reported earlier to press a lever for
continuous reinforcement. After they were trained, we especially focused on the
dynamics leading up to reliable and consistent rates of bar-pressing within and
across successive sessions for each animal. Descriptive statistics for these data are
depicted in Table 2.
This table reveals a collective across-animal mean of 2.5 minutes for the
animals to press the bar 5 times, a mean of 3.7 minutes to press 10 times, a mean of
4.5 minutes to press 15 times, and finally a mean of 5.3 minutes (standard deviation
of 4.3 minutes) to reach their 20th press. Inspection of individual plots revealed two
or three “outliers” at the 20th press that tend to inflate the “average time to reach 20
presses.” Thus, we deemed the median to be a better representative of the true 20-
press warm-up time (3.65 minutes), and CyberRat animals reflect similar warm-up
habituation dynamics that realistically vary from session to session.
Table 2. Descriptive statistics for the number of minutes elapsed after animals
were placed into the operant chamber and prior to 5th, 10th, 15th, and 20th bar-
press. Values are composited across three animals investigated in the
CyberRat Research Project (CRRP) and establish the mean and median
values for typical “warm-up” habituation prior to sustained bar-pressing.

RAY
284
Turing Test 3.3: Water Deprivation, Satiation, and Bar-Pressing Dynamics
Skinner (1938) was one of the first to report that animals repeatedly exposed to
the pairing of primary reinforcement such as food or water (in Skinner’s case food),
with the sound of a mechanical delivery device (the delivery magazine described
earlier) was sufficient to train rats to press levers under conditions of only the
magazine sound as reinforcement. Whether this was a demonstration of conditioned
reinforcement or something else, it raises the question as to whether some amount
of bar-pressing in trained animals might persist even though the animals were not
deprived of the primary reinforcement stimulus (e.g., water) used in their training or
testing. We found no published parametric data regarding the rate at which rats
would press levers if they had not been deprived of water prior to the experimental
session where water continued to be available as a consequential stimulus. Likewise,
there were no studies we discovered on how quickly rats might reach any
reasonably-defined satiety level when pressing under continuous or intermittent
water reinforcement after they had been fully deprived of water prior to the
experimental session.
The CRRP project thus set out to determine parametrics both for pressing rates
during sessions involving pre-session ad-libitum water availability (no deprivation)
and dynamics for the development of satiation under continuous reinforcement
(CRF) when animals were pre-session deprived for 22.5 hours. One post-training
test session of 60 minutes’ duration established a benchmark post-satiety bar-press
rate for comparing same-animal press rates in sessions where no pre-session water
deprivation had been imposed. For this evaluation series, the same three animals that
by now had experienced prior sessions involving CRF and variable ratio (VR)
schedules were removed from their normal deprivation schedules for several weeks
before conducting a pre-session satiation bar-pressing test session. For one entire
test day each subject remained on ad-libitum water availability in the home cage but
was subsequently placed in an operant chamber with continuous water
reinforcement (CRF) available for bar-pressing across a 1-hour evaluation session.
As illustrated in Figure 22, despite being maintained on an ad-libitum schedule
of water access, all three animals pressed the bar approximately 60 to 90 times across
their respective 1-hour session. They also typically consumed the water that was
delivered for each press. Each of the three subjects’ average bar-press rates, plus the
time elapsed until the 5th, 10th, 15th, and 20th bar-press (warm-up period) are also
reflected in the insert-notes included in each graph. These graphs were generated by
specially-written software that analyzed and reported these parameters as we
continued to probe various unknown factors in the CRRP.
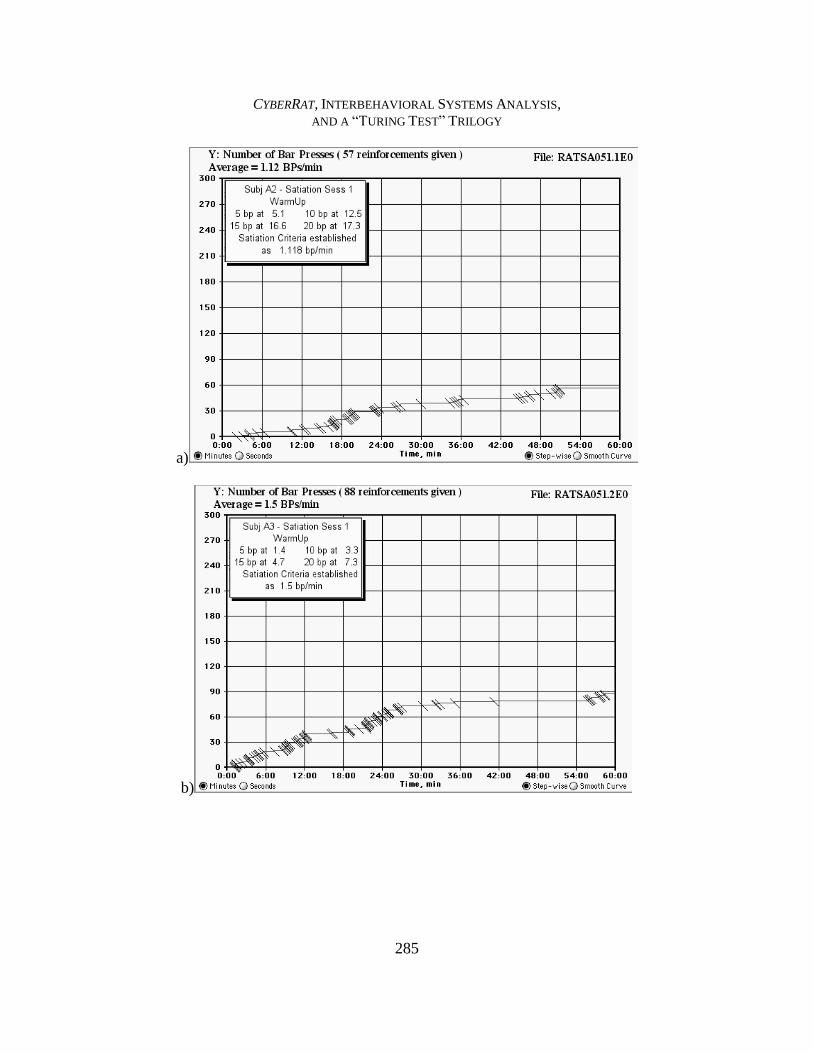
CYBERRAT, INTERBEHAVIORAL SYSTEMS ANALYSIS,
AND A “TURING TEST” TRILOGY
285
a)
b)

RAY
286
c)
Figure 22. Number of bar-presses for a) Subject A2, b) Subject A3, and c)
Subject A4 during their first experimental session following removal from
deprivation schedules in the CyberRat Research Project (CRRP). Water was
available ad-libitum in home cages across multiple days prior to these first
sessions, thus representing typical bar-press rates under pre-experimental
satiety conditions. Reinforcement was water delivered on a continuous
schedule (CRF) throughout each session.
Following the session under no deprivation conditions we re-established a
standard 22.5-hour deprivation schedule as an establishing operation and
subsequently conducted another series of CRF evaluation sessions to assess the
overall rates and rate stability for these same animals. Individual bar-press rates
during the no-deprivation evaluation session were subsequently used to establish a
satiety condition criterion bar-press rate for each well-trained animal bar-pressing
under pre-session deprivation conditions. Thus, we applied the following criterion:
satiation was defined as the first running 5-minute period wherein the average bar-
press rate for that 5-minute window was at or below the average bar-press rate for
that same subject during the no-deprivation test session. The time of onset for this
5-minute period was then used as the time at which satiety had been reached for that
animal, regardless of subsequently observed bar-press rates.
Detailed analyses of the results from these sessions are summarized in Table 3.
In the first “bar-pressing for continuous reinforcement” session under deprivation
conditions (i.e., after the 22.5-hour deprivation schedule was first initiated),
response rates were considerably elevated above the previous day’s no-deprivation
test session, where average bar-press rates for the entire session ranged from 1.1 to

CYBERRAT, INTERBEHAVIORAL SYSTEMS ANALYSIS,
AND A “TURING TEST” TRILOGY
287
1.5 bar-presses per minute (bpm). In contrast, during the first sessions under the re-
imposed deprivation conditions, bar-press rates range from 6.9 (A2) to 9.6 (A4) bpm.
By the fifth day of CRF testing, rates were even higher. As Table 3 illustrates, rates
of bar-pressing for animal A2 went from approximately 7 bpm to 9 bpm between
sessions 1 and 5; animal A3 went from 8.8 to 11.4 bpm; and animal A4 went from
9.56 to nearly 17 bpm. This suggests an accumulating effect of deprivation
scheduling even though all animals were given ad-libitum access to water for 30
minutes following experimental sessions in which they pressed to satiety.
Table 3. Bar-presses per minute (BPM), minutes to satiation criterion (Min to
Sat), and bar-presses to satiation criterion (BP to Sat) for each rat (A2, A3, A4)
across five successive sessions conducted during the CyberRat Research Project
(CRRP). Each session was conducted on consecutive days following the first
reinstatement of a 22.5-hour water deprivation establishing operation.
Likewise, the total minutes of bar-pressing until the animal met criteria for
within-session satiety increased for two of the three subjects: A2 went from 17
minutes (session 1) to 30 minutes of bar-pressing (session 5), A3 went from 15 to
34, but A4 remained about the same (10 and 9). However, the actual number of bar-
presses accumulated during these periods seems to reflect an increasing effect of the
newly-imposed deprivation schedule. Thus A2 went from 69 bar-presses to satiation
criteria in session 1 to 253 bar-presses to reach the same criteria in session 5; A3
went from 128 (session 1) to 380 (session 5); and A4 went from 67 to 134 bar-presses
between session 1 and 5 before reaching satiation criteria. CyberRat’s modeling does
not account for such a successive increase in deprivation setting effects. Rather, the
model assumes a stabilized deprivation process that, nevertheless, varies in its
associated range of presses and time to reach satiety within sessions—at least if
sessions are conducted with sufficient duration to allow the process to manifest itself.
Thus, if one compares CyberRat animal satiation dynamics to the parametrics
associated with the fifth sessions of the CRRP, a very similar pattern of number of
bar-presses to satiation, as well as time of reaching satiation, are observed.

RAY
288
Turing Test 3.4: Reinforcement Schedules and Temporal Response Rate Patterns
Ferster and Skinner (1957) dedicated an entire book to the topic of response
rate patterning under different intermittent schedules of reinforcement. As such,
there is a rich history in TEAB concerning specific operant class (bar-pressing or
key-pecking) operating characteristics and how these rate characteristics are
impacted by various rules for contingent but intermittent delivery of reinforcement.
Certainly, the topic is far too broad and complex to elaborate here. Suffice to say
that the CRRP also explored various selected intermittent schedule effects to
determine typical variability between rats where water is the reinforcer, as well as
the temporal transition dynamics involved in stabilizing a response rate pattern after
shifting from one intermittent schedule to another—a phenomenon known as
schedule transitioning. That work served to guide our simulations of similar
dynamics to generate as realistic a transitional and terminal pattern stabilization as
possible by CyberRat animals. Thus, once transitions are complete, relatively stable
patterns of responding appropriate to the schedule are produced, as illustrated in
Figure 23a, which illustrates CyberRat’s production of the well-known scalloping
effects of fixed interval schedules, and Figure 23b, which illustrates break-run
patterns associated with fixed ratio schedules in CyberRat animals.
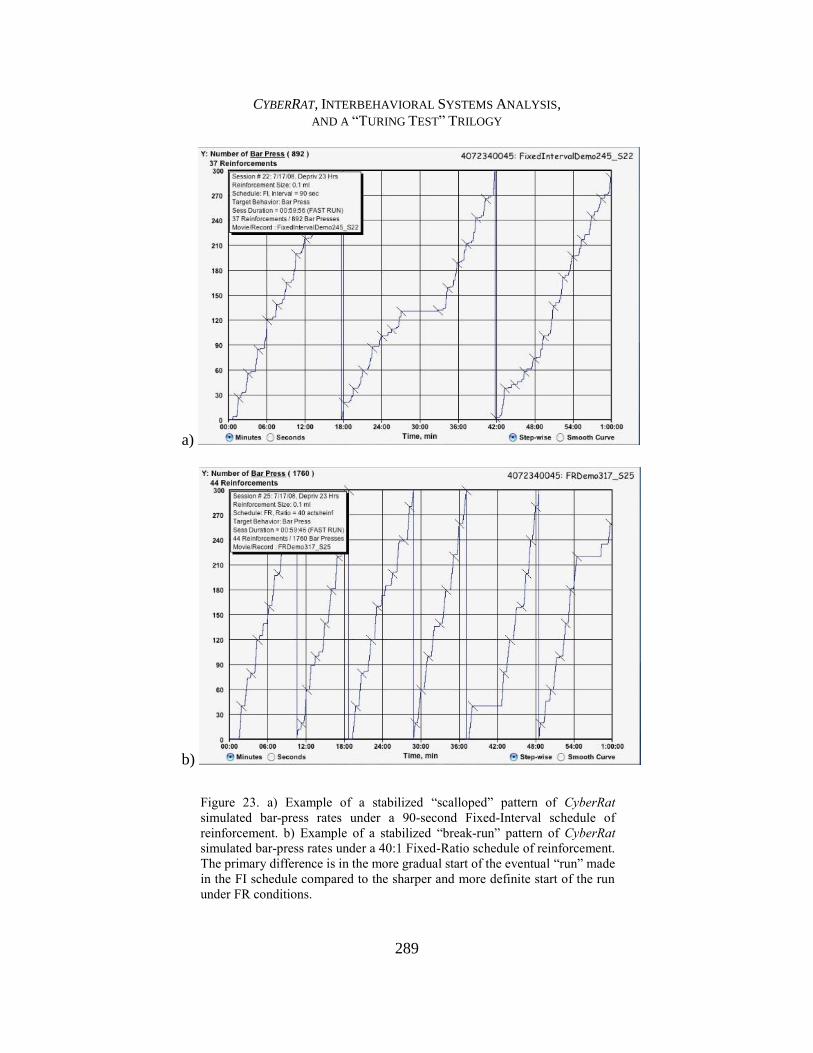
CYBERRAT, INTERBEHAVIORAL SYSTEMS ANALYSIS,
AND A “TURING TEST” TRILOGY
289
a)
b)
Figure 23. a) Example of a stabilized “scalloped” pattern of CyberRat
simulated bar-press rates under a 90-second Fixed-Interval schedule of
reinforcement. b) Example of a stabilized “break-run” pattern of CyberRat
simulated bar-press rates under a 40:1 Fixed-Ratio schedule of reinforcement.
The primary difference is in the more gradual start of the eventual “run” made
in the FI schedule compared to the sharper and more definite start of the run
under FR conditions.

RAY
290
Efforts to simulate transitional effects when shifting schedules also include
what I assert to be relatively high-fidelity replications of the well-known
phenomenon of ratio strain. Ratio strain results when experimenters shift too
quickly from rich (high-density) response-to-reinforcement ratio schedules to very
lean (low-density) reinforcement ratio schedules. In such cases the now-lean
schedules may deliver reinforcement so rarely as to result in extinction before a
successful schedule transition is fully accomplished. In many such circumstances it
may first appear that an animal is making a perfectly acceptable, if slow, transition
from the more-rich to the more-lean schedule, but quite suddenly responding rates
may drop and eventually responding stops altogether. CyberRat animals, like real
rats, need to have schedules leaned gradually to avoid such ratio strains. Such
leaning is another type of successive approximation, with this type focused on staged
manipulations of consequences rather than stages of operant response class
formation.
Finally, after CyberRat had circulated for several years, interested researchers
began to probe whether other schedule-related phenomena might be replicated by
CyberRat simulations, even though the application had not consciously attempted to
model these phenomena. One such experiment was described in Ray and Miraglia
(2011). The experiment was initially suggested by Professor David Eckerman at the
University of North Carolina–Chapel Hill, and it tests for an expected interaction
effect from using a common density of reinforcement but using different schedule
rules (interval vs. ratio) for reinforcement delivery. For example, one known effect
of fixed ratio schedules is the production of higher rates of responding, and thus a
larger total number of responses in equal duration sessions, in relation to rates and
totals produced by fixed interval schedules. So Eckerman had students conduct
experiments where highly stable patterns of responding in CyberRat animals were
achieved using a fixed ratio of 30:1 (FR30) schedule using proper schedule
transitions. A series of six 1-hour sessions (using the Fast-Simulation mode) under
these conditions was used to determine the average time that resulted between
successive reinforcements. This was determined to be a rounded value of 73 seconds
across all six sessions combined.

CYBERRAT, INTERBEHAVIORAL SYSTEMS ANALYSIS,
AND A “TURING TEST” TRILOGY
291
Figure 24. A series of successive sessions applying two equal-density
reinforcement schedules is illustrated in this figure adapted from Ray &
Miraglia (2011). A series of stable FR30 sessions were conducted for 60 min
each to determine the average time between reinforcements. This time of 73
sec was used as the defining criteria for a shift to a subsequent series of FI73
sec scheduled sessions. This illustrates different response rates under
alternative conditions of equal densities of intermittent reinforcement.
Subsequently, the CyberRat animals were shifted to fixed interval schedules
where the animal would receive reinforcement for the first bar-press made after the
73-second interval had elapsed following a previous reinforcement delivery. Given
that animals press at very high rates when such intervals are about to end, this results
in reinforcements being separated by 73 seconds, just as they had been in the FR30
sessions. Figure 24, adapted from Ray and Miraglia (2011), illustrates that the
number of bar-presses under these two comparative conditions of equal
reinforcement density are a bit less than half the total during FI73 compared to the
number of bar-presses during FR30, just as one would expect. While CyberRat is
only intended to be a descriptive model rather than a predictive model, it seems
nonetheless capable of passing at least some tests for simulation fidelity that were
never even anticipated for it!
RAY
292
Operant Processes Modeled and Not Modeled by CyberRat
Thus far I have presented a case for CyberRat’s faithful reproduction of a very
large number of structural and functional processes as well as numerous operating
characteristics historically defined both by IBSA and by the more traditional TEAB
approach. I feel compelled to emphasize one more time that it is the convergence of
the IBSA and TEAB approaches that is being validated by the model that is
CyberRat. To meet demands of being both sufficient and necessary one must conduct
and simulate structural, functional, and operations analyses. Nothing else is likely
to accomplish the feat of showing, at all times and under all incorporated conditions,
a realistic video portrayal of what an animal will do in this array of circumstances.
I have already stressed the emphasis that was placed on accurate structural
reproductions of multi-behavioral hierarchies based on unconditional probabilities,
as well as response interdependencies as reflected in kinematics and their associated
conditional probabilities. Thus, a close inspection of a kinematic matrix associated
with any continuous reinforcement session in CyberRat is very likely to reveal the
relatively fixated bar-pressdrinkbar-press probability pattern. But that same
close inspection, when focused on the difference between the conditional probability
of bar-pressdrink vs. the conditional probability of drinkbar-press will reveal
the fact that movement, exploration, or grooming is much more likely to occur
following drinking than it is to occur following bar-pressing. That is a replication of
consistent empirical data from live animals as well.
Thus, there are numerous conditions under which CyberRat is likely to pass the
hypothetical Turing tests proposed. Besides the fully-described tests for structural
analysis replication, both in terms of data and visual phenomenological
reproductions, other tests for realism that are likely to generate convincing results
include tests for functional interbehavioral adaptation processes including
respondent conditioning, conditional reinforcement, operant response shaping,
extinction, and discriminative antecedent stimulus control, as well as tests for
realistic transitional or sustained operating characteristics including rhythmic
fluctuations in various behavioral parameters during habituation, warm-up prior to
bar-pressing, dynamic response patterns under deprivation/satiation, intermittent
schedule transitions and ratio strains, and the dynamic stabilities under CRF as well
as various other intermittent schedules of water reinforcement.
But I would be remiss if I did not acknowledge that CyberRat’s portrayed
circumstances are limited. Thus, there are numerous processes one might investigate
using rats in operant chambers that are not included in CyberRat. For example, one
quite well-known interdependency phenomenon, known as adjunctive behavior, is
not simulated in CyberRat. This is because most studies of adjunctive behavior have
included food in the chamber when water is the reinforcer, or vice versa (cf. Falk,
1977). Alternatively, running wheels have also been used to demonstrate that
running can follow eating as much as drinking does (Levitsky & Collier, 1968).
Because the filming of CyberRat was conducted with no other manipulanda, objects,
or consumables, there is no opportunity, nor any effort, to model the typical
adjunctive behaviors known to be schedule-induced by reinforcement consumption.
CYBERRAT, INTERBEHAVIORAL SYSTEMS ANALYSIS,
AND A “TURING TEST” TRILOGY
293
Likewise, for the same reason (no other manipulanda or complex stimuli
available) CyberRat does not simulate choice behaviors and associated response
distributions across multiple manipulanda. The model also does not attempt to
simulate tandem, mixed, chained, or other complex schedules or schedule
combinations. Neither does the model attempt to simulate differential reinforcement
of response rates (i.e., DRH or DRL schedules attempting to generate higher or lower
rates of responding, respectively). This, of course, also implies that no effort was
made to simulate behavioral contrast effects, which is typically based on complex
scheduling. However, once again David Eckerman (personal communication,
December, 2008) has reported generating convincing evidence of behavioral
contrast effects using discriminative stimulus control training while making shifts
from a VI schedule of reinforcement with no discriminative stimulus conditions to
discrimination training using the same VI schedule (i.e., multiple S+ = VI / S- =
extinction exposures). This finding is especially interesting given that, in our
development of CyberRat as a descriptive model, we did not attempt to model such
contrast phenomena. Further, Eckerman (personal communication, January, 2012)
has shown the greater persistence of responding for richer reinforcement schedules
expected by behavioral momentum theory (cf. Nevin & Grace, 2000; Nevin,
Mandell, & Atak, 1983) following transition from VI schedules of reinforcement
(which are response-dependent for delivery of reinforcers) to Variable Temporal
schedules (which involve only response-independent reinforcer delivery). Again,
there was no effort made to actually design such simulated results into CyberRat—
they, like other non-intended reproductions I have described, seem to be an emergent
property of descriptive algorithms designed to reproduce other effects!
CyberRat does not allow for exporting inter-response time (IRT) data, and thus
no IRT distribution analyses or other temporally-focused analyses are supported. Of
course, this does not prevent those using CyberRat from doing their own timing and
plotting to evaluate temporal parametrics. I have already illustrated, however, that
pressing in CyberRat comes under discriminative stimulus control gradually across
sessions, and successive session results such as the discrimination ratio may be
externally accumulated and plotted across sessions to reveal an emerging
discriminative control of bar-pressing as a functional development curve. But it is
not possible in CyberRat—at least not in any automated way—to auto-generate a
within-session analysis that isolates behavioral patterning during S+ vs. patterning
during S-, as reflected in Figure 5 from the Ray and Brown (1975) study discussed
earlier. But again, anyone desiring to test such data could observe and record multi-
behavioral dynamics using CyberRat’s “Replay Session” feature to review the video
record from such sessions, and thus could replicate the original methods of the Ray,
Upson, and Henderson (1977) study from which Figure 21 is reproduced. Yet, as
detailed earlier, the use of relatively consistent clip lengths and random selections
make perturbations like those reflected in Figure 21 highly unlikely to be generated
by simulations using video-enhanced (or better, perhaps, to say in this context,
video-restricted) modeling.
None of the above limitations are critical, of course, to the major point of my
argument for reasonable Turing test results across a wide variety of functional and

RAY
294
operational characteristics that were intended in CyberRat’s simulations. Nor do any
seem impossible to incorporate into a model like CyberRat—only highly impractical.
As such, I assert that there is little to be gained from such exercises for testing non-
intended authenticities. Focusing on what CyberRat does not simulate is clearly a
neverending and pointless endeavor. I point out the ignored elements above only to
address some of the many obviously related, and research-documented, events
typically studied with organisms in operant chambers.
What are CyberRat’s Contributions?
As I conclude this monograph, it is crucial that I attempt to assure that readers
understand my primary intents in writing it. Thus, I reiterate my aspirations for this
endeavor—and, in fact, for CyberRat itself. As I stated in my opening paragraph, my
ultimate goal was to articulate the conceptual and methodological validation value
of CyberRat as a computer-based simulation. While I also wanted to share the
CRRP’s original empirical data in the context of CyberRat’s development, I
primarily set out to demonstrate how the conceptual value of CyberRat is based, in
part, upon how well the model reconstructs those descriptive CRRP data that guided
its development—that is, how well it holds up to the various Turing-type tests I
present. The fact that those CRRP data were, themselves, both necessary and
sufficiently complete to allow the creation of such a realistic model also serves, in
turn, to validate the IBSA research approach.
But some readers may question whether CyberRat has generated any new
research beyond those unintended reconstructions I have already reported—
reconstructions such as behavioral contrast and behavioral momentum. From the
perspective I have asserted in this manuscript, that is the wrong question to ask. To
raise the question of new research shifts the focal intent of CyberRat’s development
from that of generating a descriptive model that validates methodology to that of
generating a predictive model that intends to function much like a theory. Let me
reiterate that my ultimate goal in CyberRat’s development was its formative
guidance and feedback regarding whether the descriptive methods I had used to
analyze animal behavior in operant situations were sufficiently complete to allow
statistical (vs. literal event-by-event) reconstructions of all of the structural,
functional, and operating dynamics I had described in prior research. I have
attempted to illustrate how informative CyberRat’s development processes were,
especially those relating to the Ray and Brown (1975, 1976) behavioral taxonomy
probes, and how that taxonomy itself relates to the ultimate discoveries offered by
CyberRat. While structural/visual reconstruction of all behaviors-in-context
required significant expansion of descriptive contextual elements and definitions
required to fully reconstruct interbehavioral events, nevertheless those expansions
may “contract” into the original, simpler Ray and Brown taxonomy with relative
ease—as the Multi-Behavior feature in CyberRat reveals. The Ray and Brown
taxonomy cannot generate CyberRat, but CyberRat can generate data that are
meaningful from the perspective of that taxonomy. As such, CyberRat serves to
affirm many of those dynamics described by Ray and Delprato (1989)—dynamics

CYBERRAT, INTERBEHAVIORAL SYSTEMS ANALYSIS,
AND A “TURING TEST” TRILOGY
295
that, for almost a century now, have been ignored by researchers relying exclusively
upon TEAB methodology. From my perspective, CyberRat affirms a sufficiently
complete description of behavior as to validate prior descriptions of hierarchy
change dynamics and kinematic dynamics. On the other hand, while CyberRat has
been shown to reconstruct most of the operating characteristics of interest to Skinner,
existing video sample limitations leave CyberRat less confirming of behavioral
velocity as a function of setting change velocity, natural biological rhythms in
behavioral organization dynamics, and a variety of other phenomena summarized
by Ray and Delprato (1989). But I have attempted to demonstrate that I believe that
my primary goal has been realized, and that is the ultimate contribution of CyberRat
as a descriptive model.
But the fact that CyberRat also offers potential value for students represents a
wonderful heuristic of the end product. Students around the world have
progressively lost access to live-animal research training. That student users may
test their skills at shaping new behaviors and may investigate a wide variety of
experimental manipulations of attendant variables critical in behavioral organization
dynamics, adaptation, and operating characteristics is a definite added value in the
development of CyberRat. I would thus conclude by pointing out that CyberRat
demonstrates yet another dimension of a comprehensive descriptive accounting of
behavioral interactions, both within and between organisms. Beyond that, I am
asserting that multimedia simulations such as CyberRat serve as confirmations of a
researcher’s adequacy in describing his or her interactions with their subject matter
to the fullest extent possible. Kantor (1953) and Verplanck (1970, 1995) alike always
championed the importance of describing actions of the researcher as clearly as one
should describe the events being directly observed and described for intended
research by that researcher. That, after all, was the foundation of Verplanck’s (1957)
glossary of behavioral terminology—he attempted to match the operations
performed by experimenters to the language they used to communicate those
operations. I like to think that both scientists, each a staunch and vocal
interbehaviorist, would likely approve of the achievements, and even the yet-
unrealized potentials, of the visual and data reconstructive models of interbehavioral
systems dynamics reflected in CyberRat.

RAY
296
References
Abraham, R. H., & Shaw, C. D. (1992). Dynamics—the geometry of behavior (2nd ed).
Addison-Wesley.
Ackoff, R. L., & Emery, F. E. (1972). On purposeful systems. Chicago: Aldine-Atherton.
Alligood, K. T., Sauer, T. D., & Yorke, J. A. (2000). Chaos: An introduction to dynamical
systems. Heidelberg: Springer-Verlag.
Ashby, W. R. (1956). An introduction to cybernetics. London: Chapman & Hall. PDF
(1999) retrieved from: http://pcp.vub.ac.be/books/IntroCyb.pdf.
Baenninger, I. P. (1967). Comparisons of behavioural development in socially isolated and
grouped rats. Animal Behaviour, 15, 312-323.
Bindra, D., & Blond, J. (1958). A time-sample method for measuring general activity and
its components. Canadian Journal of Psychology, 12, 74-76.
Bolles, R. C., & Woods, P. J. (1964). The ontogency of behavior in the albino rat. Animal
Behavior, 12, 427-441.
Bowler, T. D. (1981). General systems thinking: Its scope and applications. New York:
North Holland. Browning, D., & Myers, W. T. (Eds.). (1998). Philosophy of process. New York: Fordham.
Catania, A. C. (2007). Learning (Interim 4th ed). New York: Sloan Publishing.
Carroll, L. (2009). Adventures in wonderland and through the looking-glass and what Alice
found there. Oxford: Oxford University Press. (Original work published 1865).
Checkland, P. (1997). Systems thinking, systems practice. Chichester: John Wiley & Sons,
Ltd.
Churchill, M., Remington, B., & Siddle, D. A. T. (1987). The effects of context change on
long-term habituation of the orienting response in humans. The Quarterly Journal of
Experimental Psychology Section B, 39, 315-338.
Churchman, C. W., Ackoff, R. L., & Arnoff, E. L. (1957). Introduction to operations
research. New York: J. Wiley and Sons.
Delprato, D. J. (1987). J. R. Kantor’s contributions to scientific psychology. The
Interbehaviorist, 15(2&4), 18.
Walt Disney Productions. (1951). Alice in Wonderland. RKO Radio Pictures, Distributor.
Falk, J. L. (1977). The origin and functions of adjunctive behavior. Animal Learning and
Behavior, 5, 325-335.
Ferster, C. B., & Skinner, B. F. (1957). Schedules of reinforcement. New York: Appleton-
Century-Crofts.
Finch, C. (1983). The art of Walt Disney: From Mickey Mouse to the Magic Kingdoms.
New York: Harry N. Abrams, Inc.
Fisher, W. W., Piazza, C. C., & Roane, H. S. (Eds.) (2011). Handbook of applied behavior
analysis. New York, NY: The Guilford Press.
Glenn, S. S. (1988). Contingencies and metacontingencies. Toward a synthesis of behavior
analysis and cultural materialism. The Behavior Analyst, 11, 161-179.
Grant, E. C. (1963). An analysis of the social behaviour of the male laboratory rat.
Behaviour, 21, 260-281.
Grossberg, J. M. (1981). Comments about cognitive therapy and behavior therapy. Journal
of Behavior Therapy and Experimental Psychiatry, 7, 25-33.
Hartshorne, C. (1971). The development of process philosophy. In E. H. Cousins (Ed.),
Process theology (pp. 47-61). New York: Newman Press.
Immelmann, K., & Beer, C. (1989). A dictionary of ethology. Cambridge, MA: Harvard
University Press.

CYBERRAT, INTERBEHAVIORAL SYSTEMS ANALYSIS,
AND A “TURING TEST” TRILOGY
297
Jagacinski, R. J., & Flach, J. M. (2003). Control theory for humans: Quantitative
approaches to modeling performance. Mahwah, NJ: Lawrence Erlbaum Associates,
Publishers.
Kantor, J. R. (1953). The logic of modern science. Granville, OH: Principia Press.
Kantor, J. R. (1959). Interbehavioral psychology (2nd ed). Granville, OH: Principia Press.
Kantor, J. R. (1970). An analysis of the experimental analysis of behavior (TEAB). Journal
of the Experimental Analysis of Behavior, 13, 101-108.
Katok, A., & Hasselblatt. B. (1996). Introduction to the modern theory of dynamical
systems. Cambridge, UK: Cambridge University Press.
Kazdin, A. E. (1975). Characteristics and trends in applied behavior analysis. Journal of
Applied Behavior Analysis, 8, 332.
Kazdin, A. E. (1978). History of behavior modification: Experimental foundations of
contemporary research. Baltimore: University Park Press.
Keller, F. S., & Schoenfeld, W. N. (1995). Principles of psychology: A systematic text in the
science of behavior. Acton, MA: B. F. Skinner Foundation, Copley Publishing Group.
(Original work published 1950).
Kidd, R. V., & Natalicio, L. (1982). An interbehavioral approach to operant analysis. The
Psychological Record, 30, 131-190.
Klir, G. J. (1969). An approach to general systems theory. New York: Van Nostrand
Reinhold Company.
Krasner, L. (1977). An interview with Sidney W. Bijou. In B. C. Etzel, J. M. LeBlanc, & D.
M. Baer (Eds.), New developments in behavioral research: Theory, methods, and
application. Hillsdale, NJ: Lawrence Erlbaum Associates.
Kuhn, A. (1974). The logic of social systems: A unified deductive system based approach to
social science. San Francisco: Jossey-Bass, Inc.
Kvale, S., & Grenness, C. E. (1967). Skinner and Sartre: Towards a radical phenomenology
of behavior. Review of Existential Psychology, 7, 128-149.
Laszlo, E. (1996). The systems view of the world. New York: Hampton Press.
Lehner, P. N. (1996). Handbook of ethological methods. Cambridge: Cambridge University
Press.
Lejeune, H., Richelle, M., & Wearden, J. H. (2006). About Skinner and time: Behavior-
analytic contributions to research on animal timing. Journal of the Experimental
Analysis of Behavior, 85, 125-142.
Levitsky, D., & Collier, G. (1968). Schedule-induced wheel running. Physiology and
Behavior, 3, 571-573.
Malott, M. E., & Glenn, S. S. (2006). Targets of intervention in cultural and behavioral
change. Behavior and Social Issues, 15, 31-56.
McDonnell, S. M., & Poulin, A. (2002). Equid play ethogram. Applied Animal Behavior
Science, 78, 263-290.
Michael, J. L. (1993). Establishing operations. The Behavior Analyst, 16, 191-206.
Miraglia, K., & Ray, R. D. (2003). Finding parametrics to model CyberRat: What we don't
really know about habituation, ratio strains, or much of anything else. Paper
presented at the Meetings of the Association for Behavior Analysis, May, San
Francisco, CA.
Mitchell, D., Yin, M., & Nakamatsu, K. (1980). Context habituation and taste neophobia:
Evidence for a cross-modality contrast effect. Behavioral and Neural Biology, 29,
117-122.
Moore, J. (1984). Conceptual contributions of Kantor’s Interbehavioral Psychology. The
Behavior Analyst, 7, 183-187.

RAY
298
Morris, E. K. (1982). Some relationships between interbehavioral psychology and radical
behaviorism. Behaviorism, 10, 187-216.
Morris, E. K., & Smith, N. G. (2004). On the origin and preservation of Cumulative Record
in its struggle for life as a favored term. Journal of the Experimental Analysis of
Behavior, 82, 357-373.
Mountjoy, P. T. (1976). Science in psychology: J. R. Kantor’s field theory. Mexican
Journal of Behavior Analysis, 2, 3-21.
Nevin, J. A., Mandell, C., & Atak, J. R. (1983). The analysis of behavioral momentum.
Journal of the Experimental Analysis of Behavior, 39, 49-59.
Nevin, J. A., & Grace, R. C. (2000). Behavioral momentum and the Law of Effect.
Behavioral and Brain Sciences, 23, 73-130.
Palmer, D. K. (2003). Specifying psychology’s observable units: Toward an integration of
Kantor’s behavior segment, Skinner’s operant, and Lee’s Deed. Behavior and
Philosophy, 31, 81-110.
Pavlov, I. P. (1927). Conditioned reflexes: An investigation of the physiological activity of
the cerebral cortex [G. V. Anrep, Trans.]. London: Oxford University Press.
Peterson, G. B. (2004). A day of great illumination: B. F. Skinner’s discovery of shaping.
Journal of the Experimental Analysis of Behavior, 82, 317-328.
Powers, W. T. (1973). Behavior: The control of perception. New York: Aldine DeGruyter.
Pronko, N. J. (1980). Psychology from the standpoint of an interbehaviorist. Monterey,
CA: Brooks/Cole.
Ray, R. D. (1977). Psychology experiments as interbehavioral systems: A case study from
the Soviet Union. Psychological Record, 2, 279-306.
Ray, R. D. (1992). Interbehavioral methodology: Lessons from simulation. In T. Sharpe &
A. Hawkins (Monograph Eds.), Field systems analysis: An alternative strategy for the
study of teacher expertise. Special monograph of the Journal of Teaching in Physical
Education.
Ray, R. D. (1996a). CyberRat (Version 1.0). Madison, WI: Brown & Benchmark
Publishers.
Ray, R. D. (1996b). CyberRat: Methodological lessons learned from designing an
interactive digital video laboratory simulation for operant conditioning. Invited
Address, Association for Behavior Analysis, San Francisco.
Ray, R. D. (2000). Multimodality concept maps and video documentary reconstructions:
New uses for adaptive multimedia in learning. In L. Lloyd (Ed.), Teaching with
technology: Rethinking tradition. Medford, NJ: Information Today, Inc.
Ray, R. D. (2003a). CyberRat (Version 2.0). Winter Park, FL: (AI)2, Inc.
Ray, R. D. (2003b). CyberRat as interbehavioral psychology: Doing Kantor proud or
doing him in? Paper presented at the Meetings of the Association for Behavior
Analysis, May, San Francisco, CA.
Ray, R. D. (2012a). CyberRat (Version 3.0). Winter Park, FL: (AI)2, Inc.
Ray, R. D. (2012b). CyberRat User’s Manual V3.0. Winter Park, FL: (AI)2, Inc. Retrieved
from: http://www.ai2inc.com/Downloads/CyberRat_User's_Guide_V3.pdf
Ray, R. D., & Brener, J. (1973). Classical heart-rate conditioning in the rat: The influence
of curare and various setting operations. Conditional Reflex, 8, 224-235.
Ray, R. D., & Brown, D. A. (1975). A systems approach to behavior. The Psychological
Record, 25, 459-478.
Ray, R. D., & Brown, D. A. (1976). The behavioral specificity of stimulation: A systems
approach to procedural distinctions of classical and instrumental conditioning.
Pavlovian Journal of Biological Sciences, 11, 3-23.

CYBERRAT, INTERBEHAVIORAL SYSTEMS ANALYSIS,
AND A “TURING TEST” TRILOGY
299
Ray, R. D., & Delprato, D. J. (1989). Behavioral systems analysis: Methodological
strategies and tactics. Behavioral Science, 34, 81-27.
Ray, R. D., & Miraglia, K. M. (2008). Simulation-based affirmations of descriptive
behavioral analyses: CyberRat as a “Turing Test.” Paper presented at the meeting of
the Society for Computers in Psychology, November, Chicago, IL.
Ray, R. D., & Miraglia, K. M. (2011). A sample of CyberRat and other experiments: Their
pedagogical functions in a learning course. Journal of Behavioral and Neuroscience
Research, 9, 44-61.
Ray, R. D., & Ray, M. R. (1976). A systems approach to behavior II: The ecological
description and analysis of human behavior dynamics. The Psychological Record, 26,
147-180.
Ray, R. D., Ray, J. M., Eckerman, D. A., Milkosky, L. M., & Gillens, L. J. (2011).
Operations analysis of behavioral observation procedures: A taxonomy for modeling
in an expert training system. Behavior Research Methods, 43, 616-634.
Ray, R. D., Upson, J. D., & Henderson, B. J. (1977). A systems approach to behavior III:
Organismic pace and complexity in time-space fields. The Psychological Record, 27,
649-682.
Schneider, B. A. (1969). A two-state analysis of fixed-interval responding in the pigeon.
Journal of the Experimental Analysis of Behavior, 12, 677-687.
Schoenfeld, W. N. (1969). J. R. Kantor’s Objective Psychology of Grammar and
Psychology and Logic: A retrospective appreciation. Journal of the Experimental
Analysis of Behavior, 12, 329-347.
Schoenfeld, W. N. (1976). The “response” in behavior theory. Pavlovian Journal of
Biological Science, 11, 129-149.
Schoenfeld, W. N., & Farmer, J. (1970). Reinforcement schedules and the “behavior
stream.” In W. N. Schoenfeld (Ed.), The theory of reinforcement schedules (pp. 215-
245). New York: Appleton-Century-Crofts.
Shimoff, E., & Catania, A. C. (1995). Using computers to teach behavior analysis. The
Behavior Analyst, 18, 307-316.
Skinner, B. F. (1938). The behavior of organisms. New York: Appleton-Century-Crofts.
Skinner, B. F. (1950). Are theories of learning necessary? Psychological Review, 57, 193-
216.
Skinner, B. F. (1951). How to teach animals. Scientific American, 185, 26-29.
Skinner, B. F. (1979). The shaping of a behaviorist: Part two of an autobiography. New
York: New York University Press.
Smith, N. W., Mountjoy, P. T., & Ruben, D. H. (Eds). (1983). Reassessment in psychology:
The interbehavioral alternative. Washington, DC: University Press.
Stephenson, W. (1953). Postulates of behaviorism. Philosophy of Science, 20, 110-120.
Strand, P. S. (2001) Momentum, matching, and meaning: Toward a fuller exploitation of
operant principles. The Behavior Analyst Today, 2, 170-184.
Taha, H. A. (2011). Operations research: An introduction (9th ed). Upper Saddle River, NJ:
Prentice Hall.
Turing, A. M. (1950). Computing machinery and intelligence. Mind, 59, 433-460.
Upson, J. D., & Ray, R. D. (1984). An interbehavioral systems model for empirical
investigation in psychology. The Psychological Record, 34, 497-524.
Verplanck, W. S. (1954). Burrhus F. Skinner. In W. K. Estes, S. Koch, K. MacCorquodale,
P. O. Meehl, C. G. Mueller, W. N. Schoenfeld, & W. S. Verplanck (Eds.), Modern
learning theory: A critical analysis of five examples (pp. 267-316). New York:
Appleton-Century-Crofts.

RAY
300
Verplanck, W. S. (1957). A glossary of terms. Psychological Review, (supp.), i, 42, 64.
Verplanck, W. S. (1958). Comparative psychology. Annual Review of Psychology, 9, 99-
118.
Verplanck, W. S. (1970). An “overstatement” on psychological research: What is a
dissertation? The Psychological Record, 20, 119-122.
Verplanck, W. S. (1971). Further overstatements of a phenomenological behaviorist.
Psychological Record, 21, 481-486.
Verplanck, W. S. (1983a). Preface. In N. W. Smith, P. Mountjoy, & D. H. Ruben (Eds.),
Reassessment in psychology: The interbehavioral alternative (pp. xi-
xxv).Washington, DC: University Press of America.
Verplanck, W. S. (1983b). Remembering: Reflections upon reading a dissertation.
Psychological Record, 33, 421-425.
Verplanck, W. S. (1995). Some reflections on Kantor, Kantorians, and Kantor’s career. The
Interbehaviorist, 23, 6-12.
von Bertalanffy, L. (1968). General System Theory: Foundations, development,
applications. New York: George Braziller.
Wahler, R. G., & Fox, J. J. (1981). Setting events in applied behavior analysis: Toward a
conceptual and methodological expansion. Journal of Applied Behavior Analysis, 14,
327-338.
Whitehead, A. N. (1925). Science and the modern world. New York: The Free Press.
Whitehead, A. N. (1948). Essays in science and philosophy. New York: Philosophical
Library.

CYBERRAT, INTERBEHAVIORAL SYSTEMS ANALYSIS,
AND A “TURING TEST” TRILOGY
301