by jonathan walter saunders -...
TRANSCRIPT

MOLECULAR PHYLOGENETICS OF THE RIODINIDAE (LEPIDOPTERA)
By
JONATHAN WALTER SAUNDERS
A THESIS PRESENTED TO THE GRADUATE SCHOOL OF THE UNIVERSITY OF FLORIDA IN PARTIAL FULFILLMENT
OF THE REQUIREMENTS FOR THE DEGREE OF MASTER OF SCIENCE
UNIVERSITY OF FLORIDA
2010
1

© 2010 Jonathan Walter Saunders
2

To my Mom and Dad who fostered my love of the natural world and taught me the importance of education
3

ACKNOWLEDGMENTS
I thank the members of my committee for their encouragement and mentoring.
And specifically I thank Dr. Tom Emmel for his multifaceted support and positive,
uplifting spirit towards me, Dr. Charlie Baer for his generosity and forthrightness, and
Dr. Mike Miyamoto for his patience, jokes, and ability to put my mind at ease about
graduate school. I thank Mike Perry for all of his help getting me started on this project
and Dr. J.D. Turner for sharing with me both his butterflies and his love and knowledge
of them. I also thank Dr. Rebecca Kimball for allowing me to use her facilities and
answering my questions as well as Dr. Ed Braun, Dr. David Reed, and Julie Allen for
being so willing to help me with my many questions. I thank my wife for her loving
patience and for her support which allowed me to finish my study. And, I thank God for
the ability to study his world full of wonders.
4

TABLE OF CONTENTS page
ACKNOWLEDGMENTS.................................................................................................. 4
LIST OF TABLES............................................................................................................ 7
LIST OF FIGURES.......................................................................................................... 8
LIST OF OBJECTS ......................................................................................................... 9
LIST OF ABBREVIATIONS........................................................................................... 10
ABSTRACT ................................................................................................................... 11
CHAPTER
1 INTRODUCTION .................................................................................................... 12
2 MATERIALS AND METHODS ................................................................................ 29
Sequence Data Preparation.................................................................................... 29 Phylogenetic Analyses............................................................................................ 30
3 RESULTS ............................................................................................................... 39
Phylogenetics ......................................................................................................... 39 Myrmecophily.......................................................................................................... 40
4 DISCUSSION ......................................................................................................... 52
Taxonomy ............................................................................................................... 52 Phylogenetics and Gene Trees............................................................................... 56 Myrmecophily.......................................................................................................... 58
3G<2G<1G....................................................................................................... 59 The Hypotheses Are Not Independent ............................................................. 60 The Indirect Method ......................................................................................... 60
Conclusion .............................................................................................................. 62
APPENDIX
A COMPARISON OF 3 PARTITIONING SCHEMES FOR THE TOTAL EVIDENCE ANALYSES.......................................................................................... 69
B BAYESIAN TREES WITH POSTERIOR PROBABILITIES..................................... 70
C RANDOM TREES USED TO GENERATE A NULL DISTRIBUTION FOR THE MYRMECOPHILY HYPOTHESES ......................................................................... 74
5

D PROCEDURE FOR SCORING RANDOM TREES WITH A WORKED EXAMPLE............................................................................................................... 75
Procedure ............................................................................................................... 75 Worked Example .................................................................................................... 78
E SCORED RANDOM TREES................................................................................... 89
F RANDOM TREE NULL DISTRIBUTION RESULTS ............................................... 90
REFERENCE LIST........................................................................................................ 92
BIOGRAPHICAL SKETCH............................................................................................ 97
6

LIST OF TABLES
Table page 1-1 Taxonomy of riodinid specimens for this study with their respective
identification numbers......................................................................................... 22
2-2 Adapted PCR reaction components from (Niklas Wahlberg’s website: http://nymphalidae.utu.fi/Nymphalidae/Molecular.htm). ...................................... 35
2-3 Primers of genes sequenced and their respective sources ................................ 36
2-5 Sequences and accession numbers for three outgroups (denoted by *) and seven riodinids obtained from GenBank (Benson et al. 2006)............................ 38
3-1 Characteristics of the DNA sequence data. ........................................................ 42
3-2 Likelihood values and AIC values from RAxML likelihood analyses.. ................. 43
3-3 Parsimony score statistics for 1G, 2G, and 3G when mapped onto 100 random trees. ..................................................................................................... 51
4-1 Parsimony scores from mapping gains and losses of myrmecophily onto the Myrmecophily Tree (Figure 4-2). ........................................................................ 65
4-2 Results from comparison of the hypotheses mapped on the Myrmecophily Tree next to the averages and 95% confidence intervals taken from random trees ................................................................................................................... 67
7

LIST OF FIGURES
Figure page 1-1 Phylogeny depicting evolutionary relationships of butterfly families adapted
from Wahlberg et al. 2005. ................................................................................. 21
1-2 Diagram of caterpillar bodies comparing the auditory, feeding, and chemo-sensory emitting ant organs in three butterfly clades: Nymphidiini/Lemoniini, Eurybini, and Lycaenidae ................................................................................... 25
1-3 Subfamily and tribal relationships inferred from parsimony analysis on morphological data. This phylogeny is adapted from Harvey 1987. ................... 26
1-4 A parsimony phylogeny from Campbell et al. (2000) based on the wingless gene excluding third-position transitions with bootstrap support values less than 50% collapsed into a polytomy. .................................................................. 27
1-5 Two taxon sampling schema represented by A) and B) with the same number of taxa (and in this case, even the same topology). .............................. 28
3-1 RAxML most likely tree for the 3 genes combined and partitioned by gene and by codon position, higher taxa indicated by colored branches..................... 44
3-2 RAxML most likely trees for individual genes, higher taxa indicated by colored branches. ............................................................................................... 45
3-3 Consensuses of bootstrapped combined and individual RAxML trees (bootstraps indicated at nodes) .......................................................................... 46
3-4 50% majority rule consensus tree of the three most likely gene trees. ............... 50
4-1 Morphological phylogenetic hypothesis after Harvey 1987 including his subfamilies and tribes compared to my molecular phylogenetic hypothesis....... 64
4-2 The Myrmecophily Tree..................................................................................... 67
4-4 Adaptation of Campbell’s (1998) molecular phylogeny with myrmecophilous character state indicated by square next to genus. ............................................ 68
D-1 Example of how to mark a phylogeny as in step................................................. 75
D-3 Two interpretations of the evolution of myrmecophily based on the same tree. . .......................................................................................................................... 76
D-4 Figure D-4. Further explanation for step 6) and 7).............................................. 77
D-5 Step by step method for scoring a random tree (here it is random tree number 94 which is the most complex................................................................ 78
8

LIST OF OBJECTS Object page C-1 Random Trees.................................................................................................... 74
E-1 Scans of 100 scored random trees..................................................................... 89
9

LIST OF ABBREVIATIONS
Myrmecophily Tree The tree depicted in Figure 4-2, that is, the most likely tree based on the best partitioning scheme from AIC comparison mapped with the myrmecophilous/amyrmecophilous character states and gains/losses of said trait.
1G The evolutionary hypothesis stating that myrmecophily evolved exactly one time in butterflies.
2G The evolutionary hypothesis stating that myrmecophily evolved exactly two times in butterflies.
3G The evolutionary hypothesis stating that myrmecophily evolved exactly three times in butterflies.
10

Abstract of Thesis Presented to the Graduate School of the University of Florida in Partial Fulfillment of the Requirements for the Degree of Master of Science
MOLECULAR PHYLOGENETICS OF THE RIODINIDAE (LEPIDOPTERA)
By
Jonathan Walter Saunders
May 2010
Chair: Charles Baer Cochair: Thomas Emmel Major: Zoology
The butterfly family Riodinidae has many species that exhibit diverse traits, but the
taxonomy of the family is still unclear and a robust phylogeny derived from molecular
data is lacking. In this study I generate a phylogeny of 68 novel riodinid taxa. I use two
nuclear and one mitochondrial gene to investigate the evolutionary relationships of the
Riodinidae in likelihood and Bayesian analyses. The resulting phylogenies provide
greater taxonomic resolution for the Riodinidae, especially in the deeper level
relationships. They support many but bring into question a few of the previously
described taxonomic relationships. The phylogenies are also used to address
hypotheses about the evolution of myrmecophily in butterflies. The hypothesis of three
independent gains of myrmecophily in the butterflies is supported over the two gains
hypothesis and the one gain hypothesis. The results are also consistent with a lack of
losses in the evolution of myrmecophily.
11
12
CHAPTER 1 INTRODUCTION
The metalmark butterflies of the family Riodinidae are known for their small size,
their brilliant metallic colors, and the shortened forelegs of the males (Borror et al.,
1989, DeVries, 1997). Riodinid species exhibit substantial phenotypic diversity. Various
riodinid species resemble members of all other butterfly families. The metalmarks utilize
a wide array of host plant families. The adults display complex mating behaviors. In
some species the larvae engage in ant-caterpillar symbioses which are usually
mutualistic, and are striking examples of myrmecophily (Devries 1997, Pierce et al.
2002). The position of the family Riodinidae in the larger phylogeny of Lepidopterans is
well-resolved (see Figure 1-1), but the relationships of genera within the family are
much more poorly understood (Ackery et al. 1999, de Jong et al. 1996, Kristensen
1976, Wahlberg et al. 2005). Therefore, a well-resolved phylogeny of the family is
needed to contribute to our understanding of phenotypic evolution. Unfortunately,
phylogenetic resolution has been impeded by the considerable phenotypic diversity
exhibited by the riodinids, including the intra-family and inter-family mimicry mentioned
earlier. There has been little progress in the understanding of phylogenetic
relationships within the family over the 150 years of published major systematic
treatments on the group (Bates 1868, Stichel 1928, 1930-31, Harvey 1987, and
Callaghan and Lamas 2001). The taxonomic relationships based on Harvey’s treatment
of the Riodinidae are outlined in Table 1-1 as well as in the keys of the phylogenies in
the results section. The subfamilies and tribes correspond to the phylogeny in Figure 1-
3.

Although a phylogeny of Riodinids is challenging to establish using morphological
characters, its usefulness to the study of evolution of metalmarks is obvious. The wing
design diversity in the riodinids includes copying or mimicking species of at least eight
other lepidopteran families. Riodinid genera also often contain aposomatic and cryptic
species (see D’abrera 1994).
Riodinid larvae also exhibit great diversity in body morphologies and patterns.
Their survival strategies in dealing with other insects vary from repelling insects with
long bristles, to hiding inside or under leaves, to feeding ants in exchange for protection
(DeVries 1997). The phenotypic diversity and plasticity found in this group are reasons
why a molecular phylogeny is needed to understand the evolution of the Riodinidae.
One of the phenotypic traits of particular interest is myrmecophily, where
caterpillars feed ants in exchange for protection by the ants from potential predators,
including other ant species. Among butterflies myrmecophily is unique to the Riodinidae
and their sister family the Lycaenidae. As discussed by DeVries (DeVries 1990, DeVries
1997), Non-myrmecophilous riodinids tend to have thicker cuticles and long setae that
keep the ants at a distance, whereas myrmecophilous riodinids feed and communicate
with ants in exchange for the ants’ active protection from predators and parasitoids and
do not have long, thick setae. Myrmecophily in these butterfly larvae is associated with
three functional larval organs: an organ to feed ants, an organ to communicate
acoustically with ants, and tentacle organs that appear to release chemicals which
induce the ants to take a defensive posture and protect the caterpillar. Members of the
Eurybiini tribe are an exception and lack tentacle organs. These organs are illustrated in
Figure 1-2.
13

The ant-feeding organ for all myrmecophilous riodinids, called the tentacle nectary
organ, is found on abdominal segment 8 (A8). The ant-feeding organ in lycaenids, the
dorsal nectary organ, is on abdominal segment 7 (A7) (DeVries 1991b), as denoted in
Figure 1-2. When ants tap near the orifices of these organs with their antennae, the
caterpillars secrete a nutritious, sugar- or amino-acid containing fluid through the
nectary organs (DeVries 1990, 1997). Drops of this sweet fluid attract the ants and they
widely drink it.
Other studies have shown that acoustic communication is important for regulating
ant behavior towards caterpillars (Devries 1990, Travassos and Pierce 2000). There are
three ways in which the butterfly caterpillars produce stridulations to communicate with
ants. These organs are shown in Figure 1-2: (1) Vibratory papillae (Ross 1966, DeVries
1997), (2) cuticle on a cuticle file system (Hill 1993), and (3) a cuticle/cranium spine
system (DeVries and Penz 2002). These stridulation mechanisms are found in the
following clades respectively: (1) Riodinidae: tribes Lemoniini and Nymphidiini, (2)
Lycaenidae, and (3) Riodinidae: tribe Eurybiini.
As depicted in Figure 1-2, the tentacle organs, which appear to release signaling
chemicals, are found on thoracic segment 3 in one riodinid clade, absent in the Eurybiini
(Riodinidae), and found on A8 in lycaenids (Kitching 1983, Devries 1997).
DeVries (1991a, 1997) described three potential hypotheses regarding the
evolution of myrmecophily in butterflies, but it is not yet known which hypothesis is
correct.
• 1G: Myrmecophily was gained once in the ancestor of the riodinid and lycaenid families and subsequently lost in the Lycaenidae and Riodinidae.
14

• 2G: Myrmecophily was gained once in Riodinidae and once in Lycaenidae and also subsequently lost in the Riodinidae.
• 3G: Myrmecophily was gained on three independent occasions in the lycaenids and in the two riodinid clades (Eurybiini and Lemoniini/Nymphidiini).
Please note that the phylogeny is currently unresolved to the degree that the
frequency with which myrmecophily was lost in the different hypotheses is not entirely
known for the multiple gains hypotheses.
The weight of current evidence suggests that there were three independent gains
of myrmecophily. Two differences are best explained by the 3G; the homoplasious
nature of the three different acoustic organs and the three different semiochemical
organs, as indicated in Campbell’s thesis (1998). However, there are similarities
between the ant organs which leave the possibility for either 1G or 2G to be correct, as
supported by Harvey (1987). All three clades have retractable, glandular, secretory
organs and communicate with glandular tissue via ducts and setae (DeVries 1997,
DeVries 1988). Additionally, all three clades have a paired ant organ on abdominal
segment eight (A8) (see Figure 1-2). Also, at first glance, there appears to be an
underlying developmental mechanism responsible for organs in A8 because they all
arise from the same segment. Also, Stichel (1924) describes a Mesosemia moesia
larvae as having a paired gland on A8 which corresponds to the location of the tentacle
nectary organs of the other riodinids and the tentacle organs of the lycaenids (as in
Figure 1-2), but he does not refer to myrmecophily (Harvey 1987). Thus, it is still
undetermined how myrmecophily developed in butterflies.
In this study I will use a molecular phylogeny to test these hypotheses
independently of the morphological characters being examined. This would allow for
15

the presence or absence of myrmecophily to be mapped onto the phylogeny and thus
allow for inference regarding evolutionary gains and losses of this trait.
16

17
The previously published phylogenies of the Riodinidae are useful but by no
means complete. Previous phylogenetic analyses were performed by Stichel, Harvey,
Callaghan, Lamas, and Campbell (see Figures 1-3 and 1-4). The published molecular
results on the Riodinidae are limited by taxon sampling, extent of molecular loci used,
and are also limited to parsimony methods (Campbell et al. 2000). All other published
phylogenies are based on morphological characters.
The taxon sampling scheme is important to break up long branches and to
mitigate the effects of long branch attraction (Wheeler 1992, Graybeal 1998, Poe and
Swofford 1999, Bergsten 2005). To better understand familial relationships through
phylogenetics, sampling more genera from different tribes would be better than having
numerous species from just a few genera that do not cover all of the tribes in the family.
This is because the evolutionary distances between the tribes in the first schema are
greater than the evolutionary distances within the tribes in the first schema as compared
to the second (see Figure 1-4). This is not only seen in theory but it is also exemplified
in computer-simulated gene phylogenies and in molecular phylogenies from organisms.
The second, less uniformly sampled schema described above (corresponding to tree B)
in Figure 1-5) has been shown to be worse in that it provides lower support for the
correct trees (correct trees are assumed to be those used by the computer to make the
simulated sequences in the computer-simulated cases and the trees recovered using
more genes, more taxa, and morphological data for the real-life data sets) and even
higher support for incorrect trees in evolutionary analyses (Pollock et al. 2002, Zwickl
and Hillis 2002). More sequence data also provide greater phylogenetic signal in terms
of accuracy and resolution due to more information for the analyses (Zwickl and Hillis
2002, Hillis et al. 2003). Not only do more sequence data provide the opportunity to find
more informative substitutions to infer relationships between genes, but the sequences
themselves are used to determine the appropriate models of evolution and their
parameters for the analyses. Therefore more sequence data would allow for more
informed parameters and, therefore, a better analysis.
Similarly, phylogenetic maximum likelihood as well as Bayesian methods have
generally provided better molecular phylogenetic trees than parsimony. They recover
trees with topology that is closer to that of the true tree for both simulated and real-life
data (under the assumption above that true tree is the one used by the computer to
make the simulated sequence in the computer-simulated cases and the trees recovered
using more genes, more taxa, and morphology for the real-life data sets) as found by
Huelsenbeck 1998, Alfaro et al. 2003, and Felsenstein 2004, and many more. This is
because in true parsimony methodology the assumption is that all substitutions are
equally likely and the probability of back substitutions or the possibility that different
sites mutate at different rates are not taken into account while in maximum likelihood
and Bayesian methods parameters are inferred to weight each substitution type, to
model bias due to different base frequencies of each nucleotide, to account for rate
heterogeneity between different sites, and to account for homoplasy. In maximum
likelihood analyses these parameters are inferred from a preliminary tree while in
Bayesian analyses they are calculated many times as the analysis progresses.
Rate heterogeneity is mainly due to different selection pressures on different
codon positions and differences in the coded amino acids. Differing selection pressures
on the different codon positions are seen because, generally speaking, there are more
18

third position substitutions that will not alter the amino acid than there are in the third or
second positions and similarly there are more first position substitutions that will not
alter the amino acid than there are second position substitutions. This rate
heterogeneity can be further accounted for in a phylogenetic analysis by partitioning the
matrix by codon position.
An unpublished phylogeny of the Riodinidae exists (Campbell 1998) but the
sequences therein are inaccessible. To better understand evolution within the
Riodinidae, a phylogeny with a larger taxon sampling and more loci is dearly needed. I
undertook the present project in order to provide broader molecular coverage of this
family and then create a sequence based phylogeny for the family. I then used the
phylogeny to test the evolutionary theories of myrmecophily in the Riodinidae and its
sister family, Lycaenidae.
In this study I present a phylogenetic analysis based on the combined sequences
of two nuclear genes and one mitochondrial gene using maximum likelihood. Wingless
(wg), Elongation factor 1-alpha (Ef 1-a), and Cytochrome oxidase subunit I (CO1) were
chosen for this study based on their phylogenetic signal and the ability to combine these
sequences with other lepidopteran molecular data sets for a much larger analysis.
Nuclear genes were chosen because of their efficacy in recovering deep phylogenetic
relationships as seen in previous analyses (Hoelzer 1997, Springer et al. 2001, Lin and
Danforth 2004). Wingless and Ef 1-a were previously shown to be useful for recovering
deep lepidopteran evolutionary relationships (Brower and DeSalle 1998, Campbell
1998, Wahlberg and Zimmerman 2000) and CO1 has been valuable in recovering
shallower evolutionary relationships (Wahlberg and Zimmerman 2000). In addition to
19

being housed in the mitochondria, which means it comes from a haploid genome and
has a different cellular environment than the nuclear genes, Cytochrome oxidase
subunit I is also likely to differ from the two nuclear genes in evolutionary history due to
its maternal inheritance and lack of recombination. The three genes are used here to
strengthen congruence of independent data sets. These three genes were also
selected, in part, because they have been previously used in lepidopteran molecular
systematic work (Brower and DeSalle 1998, Wahlberg and Zimmerman 2000, Monteiro
and Pierce 2001) and sequences herein derived will allow for a broader scale molecular
phylogenetic study of all lepidopterans when combined with the sequences from these
other studies.
20

Figure 1-1. Phylogeny depicting evolutionary relationships of butterfly families adapted from Wahlberg et al. 2005.
21

22
Table 1-1. Taxonomy of riodinid specimens for this study with their respective identification numbers. These numbers were used to keep track of voucher specimens and corresponding tissues (sample #) and to keep track of a specific isolation of DNA (Rio#). Note: accession numbers for 6 specimens taken from genbank can be found in Table 2-5 here they are marked with “NA.”
Subfamily Tribe Subtribe Genus Species Sample # Rio #Riodininae Mesosemiini Mesosemiina Leucochimona aequitoralis 7617 87Riodininae Mesosemiini Mesosemiina Leucochimona lagora 9302 33Riodininae Mesosemiini Mesosemiina Leucochimona lagora 9306 27Riodininae Mesosemiini Mesosemiina Mesophthalma idotea 6327 88Riodininae Mesosemiini Mesosemiina Mesosemia latizonata 6516 85Riodininae Mesosemiini Mesosemiina Mesosemia judicialis 8822 2Riodininae Mesosemiini Mesosemiina Perophthalma lasus 9330 24Riodininae Mesosemiini Mesosemiina Semomesia campanea 5223 52Riodininae Mesosemiini Napaiena Cremna actoris 5260 53Riodininae Mesosemiini Napaiena Hyphilaria nicia 5239 91Riodininae Mesosemiini Napaiena Ithomiola callixena 5924 82Riodininae Mesosemiini Napaiena Napaea eucharilla m17 89Riodininae Helicopini Anteros allectus 7097 50Riodininae Helicopini Helicopis endymaena 5318 54Riodininae Helicopini Ourocnemis archytas 4621 90Riodininae Helicopini Sarota acantus 9358 21Riodininae Lemoniini Juditha caucana 9315 26Riodininae Lemoniini Lemonias zygia 3950 55Riodininae Lemoniini Synargis orestes 7605 29Riodininae Lemoniini Thisbe fenestrella 6766 43Riodininae Lemoniini Thysanota galena 5241 81Riodininae Lemoniini Uraneis hyalina NA NARiodininae Nymphidiini Nymphidiina Adelotypa balista 7807 37Riodininae Nymphidiini Nymphidiina Calospila emylius 8532 96Riodininae Nymphidiini Nymphidiina Menander coruscans 7339 49Riodininae Nymphidiini Nymphidiina Pandemos pasiphae 8572 97Riodininae Nymphidiini Nymphidiina Setabis gelasine 6330 38

Table 1-1. Continued Riodininae Nymphidiini Nymphidiina Zelotaea phasma 4057 79Riodininae Nymphidiini Theopina Protonymphidia senta 3948 59Riodininae Nymphidiini Theopina Theope aureonitens 7789 65Riodininae Nymphidiini Theopina Theope eudocia 9026 5Riodininae Stalachtini Stalachtis calliope 6422 39Riodininae Stalachtini Stalachtis phaedusa 7773 35Riodininae Riodinini Caria castalia 7625 31Riodininae Riodinini Cariomothis erythromelas 6518 41Riodininae Riodinini Chamaelimnas iaeris 3942 57Riodininae Riodinini Crocozona caecias 3995 62Riodininae Riodinini Exoplisia cadmeis 6433 40Riodininae Riodinini Lepricornis incerta 5041 80Riodininae Riodinini Metacharis victrix 9347 23Riodininae Riodinini Parcella amarynthina 4012 64Riodininae Riodinini Riodina lysippus NA NARiodininae Riodinini Ancyluris section Amarynthis meneria 5220 51Riodininae Riodinini Ancyluris section Ancyluris eudaemon 6834 45Riodininae Riodinini Ancyluris section Ithomeis satellites 3956 58Riodininae Riodinini Ancyluris section Cyrenia martia 3992 63Riodininae Riodinini Ancyluris section Isapis agyrtus 6815 44Riodininae Riodinini Ancyluris section Melanis marathon 7612 30Riodininae Riodinini Ancyluris section Monethe albertus 3977 61Riodininae Riodinini Ancyluris section Necyria juturna 5966 93Riodininae Riodinini Ancyluris section Panara pheraclus 3932 56Riodininae Riodinini Ancyluris section Rhetus periander 3973 60Riodininae Riodinini Ancyluris section Themone pais 7643 34Riodininae Riodinini charis group Calephelis costaricicola 9356 22Riodininae Riodinini charis group Charis anius 9365 19Riodininae Riodinini charis group Detritivora barnesi 9327 25Riodininae Eurybiini Alesa amesis 8380 84Riodininae Eurybiini Eurybia unxia 9363 20
23

Table 1-1. Continued Riodininae Symmachiini Esthemopsis lithosina 7813 32Riodininae Symmachiini Mesene xanthe 7450 28Riodininae Symmachiini Phaenochitonia pyrsodes 6926 47Riodininae Symmachiini Symmachia falcistriga 8849 8Riodininae Incertae Sedis Apodemia mormo NA NARiodininae Incertae Sedis Argyrogrammana trochilia 6709 42Riodininae Incertae Sedis Emesis temesa 6837 46Riodininae Incertae Sedis Emesis sp. NA NARiodininae Incertae Sedis Emesis mandana NA NARiodininae Incertae Sedis Roeberella leneates 7457 36Riodininae Incertae Sedis Calydna catana 6346 83Riodininae Incertae Sedis Echenais thelephus 7168 48Riodininae Incertae Sedis Pachythone lateritia 9050 18Euselasiinae Euselasiini Euselasia serapis 8816 1Euselasiinae Euselasiini Euselasia orfita NA NAEuselasiinae Euselasiini Euselasia sp. NA NAEuselasiinae Euselasiini Methone cecilia 8523 95Styginae Stygini Styx infernalis NA NANemeobiinae Hamearis lucina NA NA
.
24

25
Figure 1-2. Diagram of caterpillar bodies comparing the auditory, feeding, and chemo-
sensory emitting ant organs in three butterfly clades: Nymphidiini/Lemoniini, Eurybini, and Lycaenidae. (Adapted from DeVries 1997)

Figure 1-3. Subfamily and tribal relationships inferred from parsimony analysis on
morphological data. This phylogeny is adapted from Harvey 1987.
26

Figure 1-4. A parsimony phylogeny from Campbell et al. (2000) based on the wingless
gene excluding third-position transitions with bootstrap support values less than 50% collapsed into a polytomy.
27
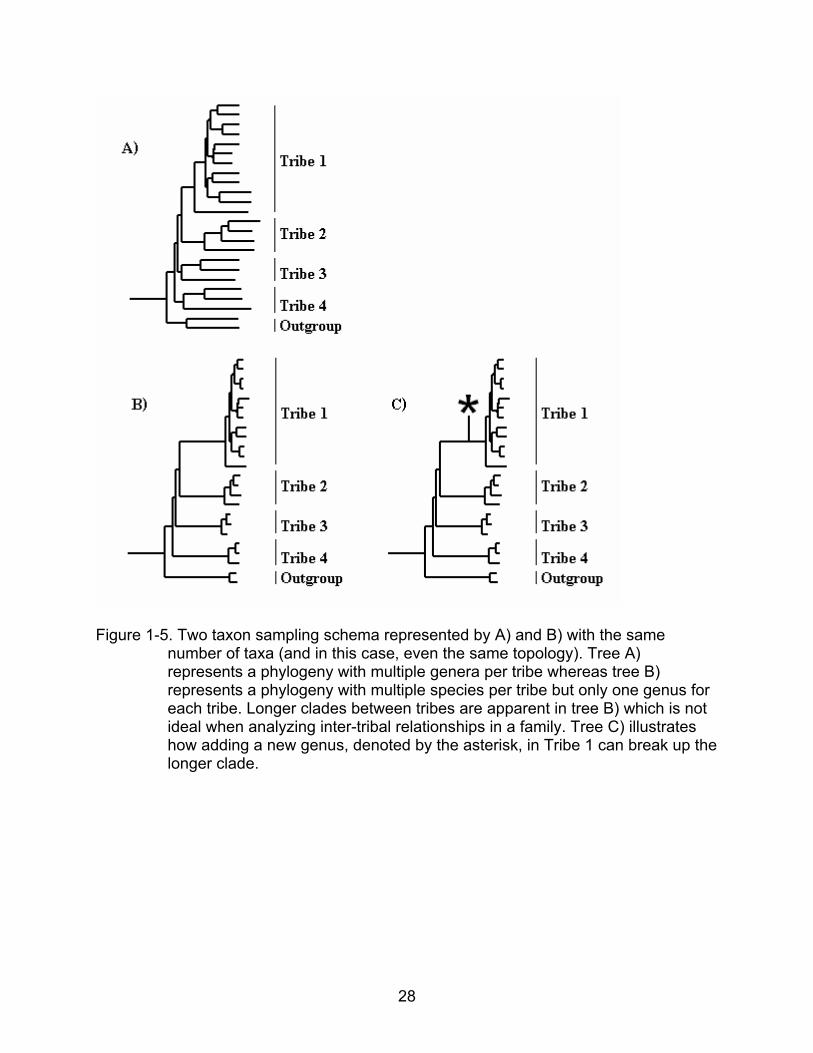
Figure 1-5. Two taxon sampling schema represented by A) and B) with the same
number of taxa (and in this case, even the same topology). Tree A) represents a phylogeny with multiple genera per tribe whereas tree B) represents a phylogeny with multiple species per tribe but only one genus for each tribe. Longer clades between tribes are apparent in tree B) which is not ideal when analyzing inter-tribal relationships in a family. Tree C) illustrates how adding a new genus, denoted by the asterisk, in Tribe 1 can break up the longer clade.
28
CHAPTER 2 MATERIALS AND METHODS
Sequence Data Preparation
For my analysis I sampled 3 of the 4 subfamilies, all 11 tribes, and 69 of the 150
genera of Riodinidae described in Harvey (1987), along with 3 lycaenid outgroups, and I
sampled six of the 69 genera twice (duplicate genera) for a total of 78 specimens. Of
these, I sequenced genes from a total of 68 new specimens (noted in Table 2-1).
Samples of live specimens were stored in 100% EtOH. Using Qiagen DNeasy kits, the
DNA was extracted at the University of Florida in the Baer genetics laboratory or the
McGuire center genetics laboratory from abdominal tissue when possible, and from legs
where abdomens were not available.
I amplified three intronless coding fragments: cytochrome oxidase subunit I (COI),
a mitochondrial gene, and wingless (Wg) and Elongation Factor 1-alpha (EF-1 α), two
nuclear genes. This was done in 0.2ml PCR tube strips. The PCR mixture formula is
found in Table 2-2.
I amplified EF1a in 3 parts, CO1 in 2 parts, and wingless in one part (Table 2-3) on
an Eppendorf Mastercycler thermocycler using 3 different protocols for the 6 fragments
(see Table 2-4).
I stored the amplified products in a 4˚ C refrigerator. I checked to see if
amplification occurred by running 5 μl PCR product and 1 μl 5x DNA loading dye in
agarose gel at 100V for 20 minutes in a 0.5xTBE buffer with a 100bp ladder.
I organized 96 PCR products to be sequenced at a time and submitted three 96-
well plates (of PCR product and corresponding forward and reverse primers ) to the
Interdisciplinary Center for Biotechnology Research custom sequencing laboratory at
29

the University of Florida where they purified and sequenced the PCR products using
Sanger Sequencing and generated ABI 3130 sequences.
Phylogenetic Analyses
I assembled these generated sequences into contiguous sequences, edited the
sequences for quality, deleting ambiguous bases and a portion of the single stranded
regions, and cut off the primers using the program SEQUENCHER 4.8 (Gene Codes
Corp., Inc., 1994). I exported the sequences in NEXUS format and aligned them and
riodinid sequences taken from genbank (see Table 2-5) by eye into a matrix using
MacClade 4.0 (Maddison and Maddison, 1992). I constructed and bootstrapped
maximum likelihood trees using RAxML 7.0.4 (Stamatakis 2006) for the three genes
individually and also for the 3 genes combined using seven different matrices: an
unpartitioned matrix, a matrix partitioned by gene, a matrix partitioned by codon
position, a matrix partitioned by codon position and further partitioned by gene, and
three matrices where one of the three genes was partitioned from the other two and
used PAUP 4.0 (Swofford 2003) to compute consensus trees from the bootstrapped
trees. More specifically I used the GTRMIX model of evolution in this analysis. GTRMIX
incorporates a general time reversible (GTR) model that assumes a symmetric
substitution matrix while allowing for different base frequencies and different substitution
rates for each base. The MIX means that to account for rate heterogeneity among sites,
it starts by categorizing each site into one of 25 rate categories, optimizes branch
lengths and topology, and then replaces the categories with a gamma distribution and
then further optimizes the tree using the gamma distribution for different rate categories.
Thusly, I constructed seven different total evidence phylogenies (all three genes
were used) based on seven different partitioning schemes and compared them using
30

AIC in order to determine the best scheme, that is, the most likely model and tree after
accounting for over parameterization. These schemes are as follows: an unpartitioned
matrix, a matrix partitioned by gene, a matrix partitioned by codon position, a matrix
partitioned by gene and by codon position, and three matrices where one gene is
partitioned from the other two genes and found that the matrix partitioned by gene and
codon position is the best (see Table 3-2). This and the individual phylogenies are the
trees presented here. For a comparison of the most likely trees from the analyses based
on three of the partitioning schemes see Appendix A.
I also constructed multiple phylogenies using bayesian inference analysis
(MrBayes, Huelsenbeck and Ronquist, 2001; Ronquist and Huelsenbeck 2003) using
the GTR+I+G for the same partitioning schemes; I ran each for 10 million generations
with a burnin of 1 million generations. The results of the Bayesian analysis did not differ
significantly from those of the likelihood analysis and are presented in Appendix B.
To assess the relative probabilities of different numbers of independent origins of
myrmecophily I scored the best maximum likelihood tree for presence of absence of
myrmecophily, leaving blank the genera of which no data on myrmecophily was found.
This best tree was the most likely tree that RAxML generated based on the best (from
AIC comparison) partitioning scheme for the 3 genes combined. Hereafter this scored,
most likely tree will be referred to as the Myrmecophily Tree. I also scored 100 random
trees, generated using PAUP 4.0 (Swofford 2003) using the same taxa with a
constrained, myrmecophilous outgroup as in the likelihood analysis, in the same
manner to generate a null distribution. Lack of myrmecophily, and with it possible loss of
the trait, was either recorded based on an indication of amyrmecophilous larvae or
31

inferred from notes on presence of long ant-repelling setae in riodinid larvae. These
data were found in Harvey 1987, Horvitz et al. 1987, Devries 1997, and Kaminski 2008.
2G and 3G were tested by finding the most parsimonious evolutionary reconstruction for
both 2G and 3G. I assigned gains according to 2G and 3G and counted the minimum
number of losses needed per tree and then tallied the losses and gains for both
hypotheses for each tree. I found the minimum number of losses needed per tree in a
similar fashion for the 1G. For more on how the phylogenies were scored, a worked
example, and scanned copies of all 100 hand-scored random trees see Appendix C,
Appendix D, and Appendix E respectively.
32

Table 2-1. Novel specimen names, sample numbers assigned in the field and Rio numbers assigned after isolations. Genus Species Sample # Rio # Panara pheraclus 3932 56 Chamaelimnas iaeris 3942 57 Protonymphidia senta 3948 59 Lemonias zygia 3950 55 Ithomeis satellites 3956 58 Rhetus periander 3973 60 Monethe albertus 3977 61 Cyrenia martia 3992 63 Crocozona caecias 3995 62 Parcella amarynthina 4012 64 Zelotaea phasma 4057 79 Ourocnemis archytas 4621 90 Lepricornis incerta 5041 80 Amarynthis meneria 5220 51 Semomesia campanea 5223 52 Hyphilaria nicia 5239 91 Thysanota galena 5241 81 Cremna actoris 5260 53 Helicopis endymaena 5318 54 Ithomiola callixena 5924 82 Necyria juturna 5966 93 Mesophthalma idotea 6327 88 Setabis gelasine 6330 38 Calydna catana 6346 83 Stalachtis calliope 6422 39 Exoplisia cadmeis 6433 40 Mesosemia latizonata 6516 85 Cariomothis erythromelas 6518 41 Argyrogrammana trochilia 6709 42 Thisbe fenestrella 6766 43 Isapis agyrtus 6815 44 Ancyluris eudaemon 6834 45 Emesis temesa 6837 46 Phaenochitonia pyrsodes 6926 47 Anteros allectus 7097 50 Echenais thelephus 7168 48 Menander coruscans 7339 49 Mesene xanthe 7450 28 Roeberella leneates 7457 36 Synargis orestes 7605 29 Melanis marathon 7612 30 Leucochimona aequitoralis 7617 87 Caria castalia 7625 31
33

Table 2-1. Continued Genus Species Sample # Rio # Themone pais 7643 34 Stalachtis phaedusa 7773 35 Theope aureonitens 7789 65 Adelotypa balista 7807 37 Esthemopsis lithosina 7813 32 Alesa amesis 8380 84 Methone cecilia 8523 95 Calospila emylius 8532 96 Pandemos pasiphae 8572 97 Euselasia serapis 8816 1 Mesosemia judicialis 8822 2 Symmachia falcistriga 8849 8 Theope eudocia 9026 5 Pachythone lateritia 9050 18 Leucochimona lagora 9302 33 Leucochimona lagora 9306 27 Juditha caucana 9315 26 Detritivora barnesi 9327 25 Perophthalma lasus 9330 24 Metacharis victrix 9347 23 Calephelis costaricicola 9356 22 Sarota acantus 9358 21 Eurybia unxia 9363 20 Charis anius 9365 19 Napaea eucharilla m17 89
34

35
Table 2-2. Adapted PCR reaction components from (http://nymphalidae.utu.fi/Nymphalidae/Molecular.htm).
Reagent Volume deionized H2O 12.5 µl 10x buffer 2.0 µl MgCl2 2.0 µl F Primer (1mM) 1.0 µl R Primer (1mM) 1.0 µl dNTP (1.25 mM) 0.4 µl AmpliTaq polymerase 0.1 µl specimen DNA 1.0 µl

36
Table 2-3. Primers of genes sequenced and their respective sources Gene
Bp in Gene
Forward primer
Reverse primer
Publication
Bp in Fragment
Sequence (5’-3’)
EF-1 α 1240 bp Starsky Monteiro and Pierce (2001) 541 bp
CAC ATY AAC ATT GTC GTS ATY GG
Luke Monteiro and Pierce (2001) CAT RTT GTC KCC GTG CCA KCC
Cho Monteiro and Pierce (2001) 517 bp GTC ACC ATC ATY GAC GC
Verdi Monteiro and Pierce (2001) GAC ACC AGT TTC IAC TCT GCC
EF51.9 Monteiro and Pierce (2001) 511 bp CAR GAC GTA TAC AAA ATC GG
EFrcM4 Monteiro and Pierce (2001) ACA GCV ACK GTY TGY CTC ATR TC
CO1 1498 bp LCO
Wahlberg and Zimmerman (2000) 658 bp
GGT CAA CAA TTC ATA AAG ATA TTG G
HCO Wahlberg and Zimmerman (2000)
TAA ACT TCA GGG TGA CCA AAA AAT CA
Jerry Wahlberg and Zimmerman (2000) 829 bp
CAA CAY TTA TTT TGA TTT TTT GG
Pat Wahlberg and Zimmerman (2000)
ATC CAT TAC ATA TAA TCT GCC ATA
Wingless 403 bp LepWG1 Brower and DeSalle (1998) 403 bp
ACT ICG CAR CAC GAR TGG AAT GTR CA
LepWG2 Brower and DeSalle (1998) GAR TGY AAR TGY CAY GGY ATG TCT GG

37
Table 2-4. Gene fragments and their respective thermocycler profiles adapted from Niklas Wahlberg’s website (online Wahlberg accessed 1 March, 2008). CO1 95° C 5 min (both primer pairs) 94° C 30 sec
47° C 30 sec
72° C 1 min 30 sec
repeat previous 3 steps 35 times 72° C 10 min 4° C hold
wingless 95° C 7 min and ef51.9/EFrcM4 95° C 1 min 50° C 1 min 72° C 2 min
repeat previous 3 steps 35 times
72° C 10 min 4° C hold Cho/Verdi 94° C 5 min and Starsky/Luke 94° C 30 sec 55° C 30 sec 72° C 1 min
repeat previous 3 steps 35 times
72° C 5 min 4° C hold

Table 2-5. Sequences and accession numbers for three outgroups (denoted by *) and seven riodinids obtained from GenBank (Benson et al. 2006)
Genus Species (COI) (WG) (EF1a) Publication
Euselasia orfita DQ018951 DQ018889 DQ018918 Wahlberg et al. 2005
Styx infernalis DQ018949 DQ018887 DQ018916 Wahlberg et al. 2005
Riodina lysippus DQ018952 DQ018919 Wahlberg et al. (2005)
Riodina lysippus AF233540 Campbell, Brower, Pierce (2000)
Apodemia mormo AF170863 AF173403 Caterino, et al. (2001)
Emesis mandana DQ018950 DQ018888 DQ018917 Wahlberg et al. (2005)
Uraneis hyalina AY954563 AY954593 AY954623 Braby, Vila, Pierce (2006)
Hamearis lucina DQ018953 DQ018890 DQ018920 Wahlberg et al. (2005)
Miletus* ancon DQ018941 DQ018908 Wahlberg et al. (2005)
Miletus* ancon AF233550 Campbell, Brower, Pierce (2000)
Poritia* erycinoides DQ018939 DQ018880 DQ018906 Wahlberg et al. (2005)
Curetis* bulis DQ018942 DQ018909 Wahlberg et al. (2005)
Curetis* bulis AF233549 Campbell, Brower, Pierce (2000)
38

CHAPTER 3 RESULTS
From the 68 novel organisms, a total of 68 new cytochrome oxidase subunit 1
sequences, 66 new wingless sequences, and 66 new Elongation Factor 1- α sequences
were generated. A total of 3,141 nucleotide sites were sampled in the phylogenetic
analysis. Primers did not overlap for cytochrome oxidase subunit 1 and therefore this
gene had a central gap of 11 bp for every sequence obtained. These were scored as
missing data. No alignments required indels. Wingless (nuc) had a higher percentage of
parsimony informative sites than did COI (mt) or EF 1-α (nuc), which had the lowest
percentage of parsimony informative sites (see Table 3-1). Based on an AIC
comparison, the matrix that is partitioned by gene and codon position is better than the
others (see Table 3-2).
Phylogenetics
The results of phylogenetic analyses imply monophyly of the Lemoniini (sensu
Harvey 1987), Mesosemiini (sensu Harvey 1987), Incertae Sedis (sensu Harvey 1987
or Napeina sensu Hall 2003), Riodinini (sensu Harvey 1987), all save one of the
Helicopini (sensu Reuter 1897), and all of the Symmachiini (sensu Harvey 1987) save
one (see colored clades in Figure 1). The Helicopini and Symmachiini both have one
genus that is not in the tribe in the current analysis but previously described as
contained in the tribe. Nymphidiini (sensu Harvey 1987) and Emesini (sensu Harvey
1987) are polyphyletic tribes (support indicated in Figure 3-3).
Similar, poorly resolved topologies were obtained for each gene when analyzed
separately (see Figures 3-2 and 3-3, and for a consensus of the trees in Figure 3-2 see
39
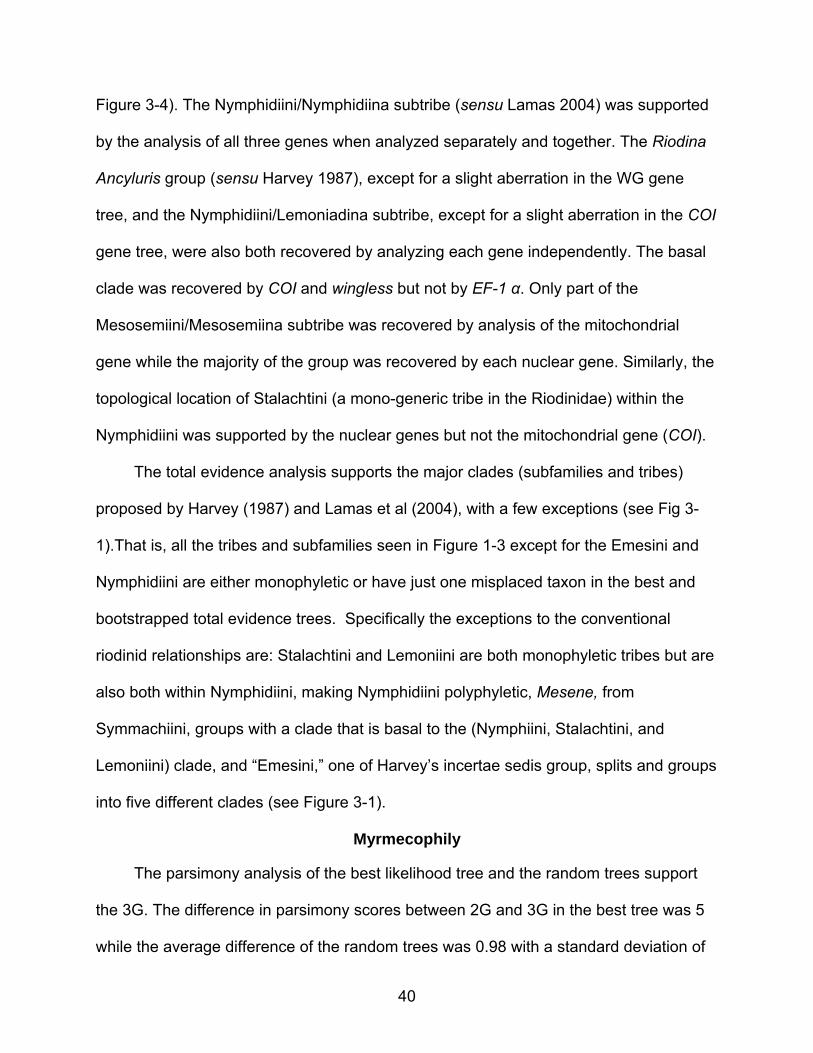
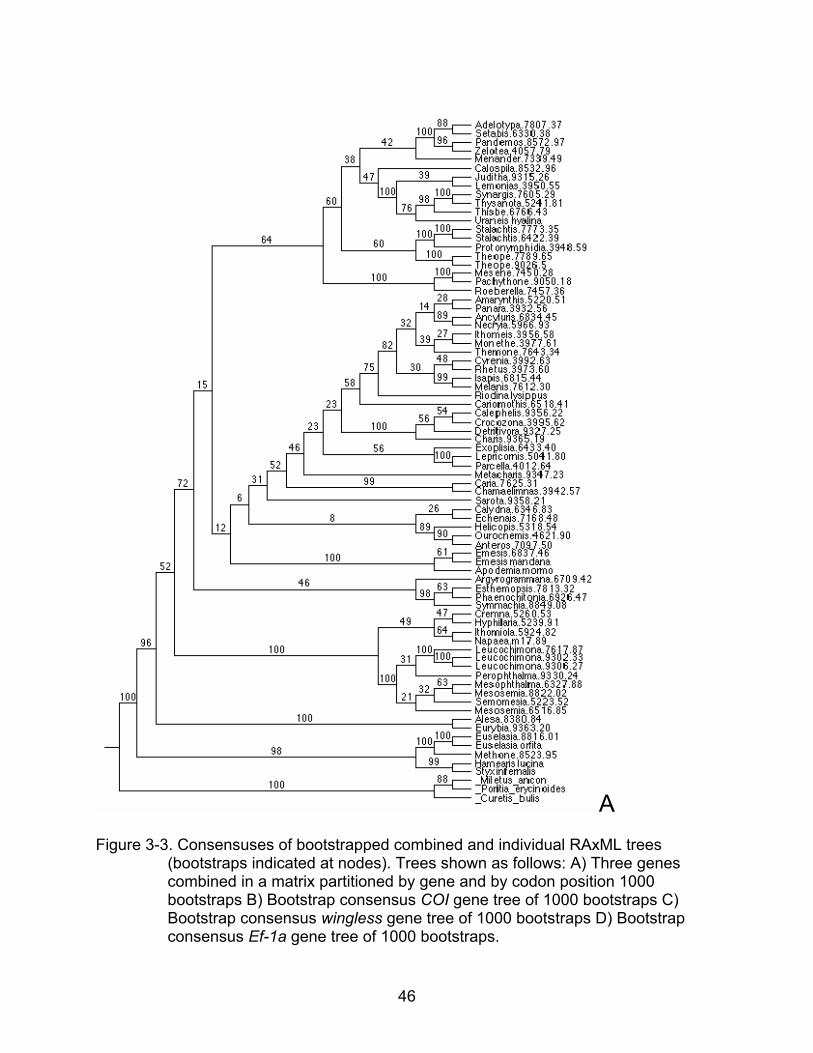
Figure 3-4). The Nymphidiini/Nymphidiina subtribe (sensu Lamas 2004) was supported
by the analysis of all three genes when analyzed separately and together. The Riodina
Ancyluris group (sensu Harvey 1987), except for a slight aberration in the WG gene
tree, and the Nymphidiini/Lemoniadina subtribe, except for a slight aberration in the COI
gene tree, were also both recovered by analyzing each gene independently. The basal
clade was recovered by COI and wingless but not by EF-1 α. Only part of the
Mesosemiini/Mesosemiina subtribe was recovered by analysis of the mitochondrial
gene while the majority of the group was recovered by each nuclear gene. Similarly, the
topological location of Stalachtini (a mono-generic tribe in the Riodinidae) within the
Nymphidiini was supported by the nuclear genes but not the mitochondrial gene (COI).
The total evidence analysis supports the major clades (subfamilies and tribes)
proposed by Harvey (1987) and Lamas et al (2004), with a few exceptions (see Fig 3-
1).That is, all the tribes and subfamilies seen in Figure 1-3 except for the Emesini and
Nymphidiini are either monophyletic or have just one misplaced taxon in the best and
bootstrapped total evidence trees. Specifically the exceptions to the conventional
riodinid relationships are: Stalachtini and Lemoniini are both monophyletic tribes but are
also both within Nymphidiini, making Nymphidiini polyphyletic, Mesene, from
Symmachiini, groups with a clade that is basal to the (Nymphiini, Stalachtini, and
Lemoniini) clade, and “Emesini,” one of Harvey’s incertae sedis group, splits and groups
into five different clades (see Figure 3-1).
Myrmecophily
The parsimony analysis of the best likelihood tree and the random trees support
the 3G. The difference in parsimony scores between 2G and 3G in the best tree was 5
while the average difference of the random trees was 0.98 with a standard deviation of
40

0.876. Therefore, even though the 3G is expected to have a lower parsimony score than
the 2G by random chance, the 3G, when mapped onto the Myrmecophily Tree, is better
than the 2G by a significantly higher difference than expected by random chance (Table
3-3). Also noteworthy, when scored with the 3G, the Myrmecophily Tree (Figure 4-2)
had no explicit losses whereas the average number of losses on the random trees was
12.16 (standard deviation: 2.13) and the 2G had 6 losses whereas the random trees
had an average of 14.12 losses with a standard deviation of 2.13 losses, and the 1G
had an average of 16.94 losses with standard deviation of 2.32 losses (see Table 3-5).
The fact that the Myrmecophily Tree requires no explicit losses means that a novel
hypothesis with four or more gains would be less parsimonious than a hypothesis with
three gains when mapped onto the Myrmecophily Tree so I did not test any hypothesis
with more than 3 gains.
41

Table 3-1. Characteristics of the DNA sequence data. Invariant Autapomorphic Cladistically Informative Total Sites wg 142 (35.2%) 29 (7.2%) 232 (57.6%) 403 COI 839 (56.0%) 103 (6.9%) 556 (37.1%) 1498 EF 1-a 810 (65.3%) 59 (4.8%) 371 (29.9%) 1240
42

43
Table 3-2. Likelihood values and AIC values from RAxML likelihood analyses. The data partitions are indicated by parentheses and “x CODON” indicates that the matrix was partitioned by codon position. The AIC comparisons section portrays the difference of the AIC values, that is, it subtracts the AIC value for the partition scheme (1-7) depicted on the column from the AIC value of the scheme depicted at the left of each row. E.G. 2111.4 comes from the the difference of the AIC values: 101410.3-99298.9.
Partition scheme Log likeli-
Relative # of Para-
Relative AIC=2k-
AIC pairwise comparisons
hood (ln(L)) meters (k) 2ln(L) 1 2 3 4 5 6 71 (CO1 wg Ef 1-a) -50705.15 0 101410.3 - 2111.4 2014.8 693.2 780.26 3348.3 6799.02 (CO1) (wg) (Ef 1-a) -49637.46 12 99298.9 ‐96.6 ‐1418.2 ‐1331.1 1236.9 4687.63 (CO1) ( wg Ef 1-a) -49691.75 6 99395.5 ‐1321.6 ‐1234.5 1333.5 4784.24 (CO1 wg) (Ef 1-a) -50352.55 6 100717.1 87.1 2655.1 6105.85 (CO1 Ef 1-a) (wg) -50309.02 6 100630.0 2568.0 6018.86 (CO1 wg Ef 1-a) x CODON -49019.02 12 98062.0 3450.87 (CO1) (wg) (Ef 1-a) x CODON -47257.64 48 94611.3 -
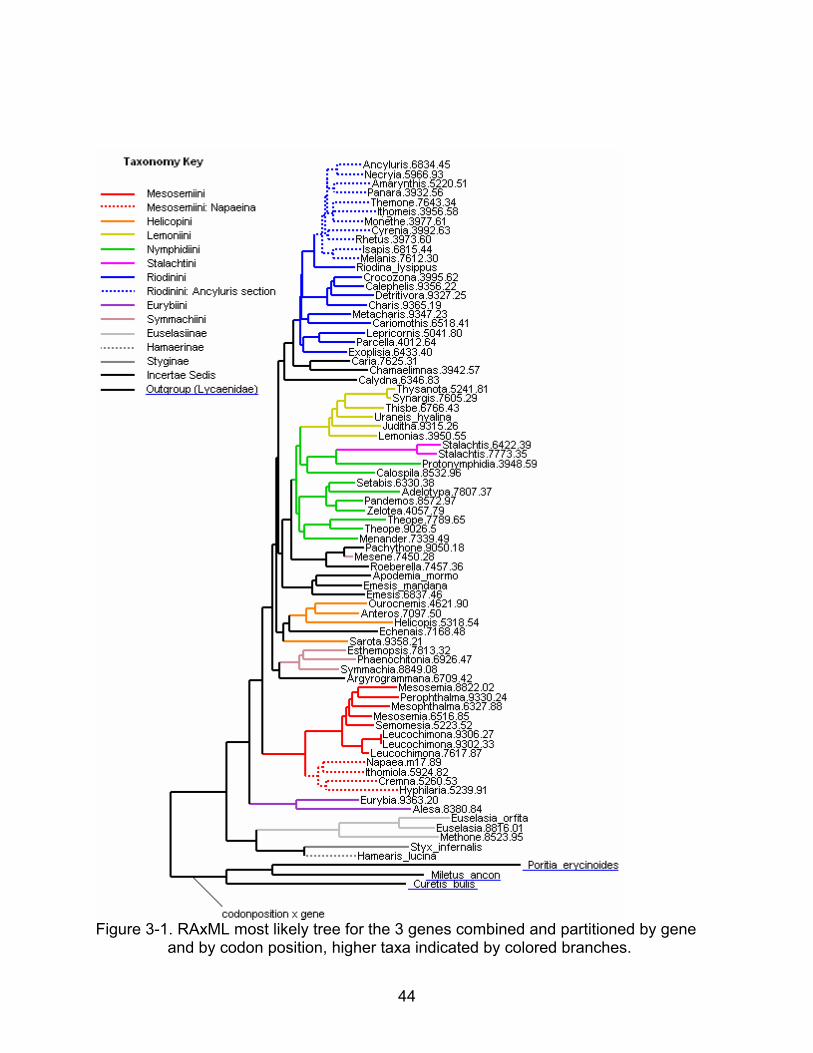
Figure 3-1. RAxML most likely tree for the 3 genes combined and partitioned by gene
and by codon position, higher taxa indicated by colored branches.
44

Figure 3-2. RAxML most likely trees for individual genes, higher taxa indicated by colored branches.
45
46
A Figure 3-3. Consensuses of bootstrapped combined and individual RAxML trees
(bootstraps indicated at nodes). Trees shown as follows: A) Three genes combined in a matrix partitioned by gene and by codon position 1000 bootstraps B) Bootstrap consensus COI gene tree of 1000 bootstraps C) Bootstrap consensus wingless gene tree of 1000 bootstraps D) Bootstrap consensus Ef-1a gene tree of 1000 bootstraps.

B
Figure 3-3. Continued
47

C
Figure 3-3. Continued
48

D
Figure 3-3. Continued
49
Figure 3-4. 50% majority rule consensus tree of the three most likely gene trees.
50

Table 3-3. Parsimony score statistics for 1G, 2G, and 3G when mapped onto 100
random trees. 3G 2G 1G 2G-3G 1G-3G 1G-2G avg. 15.16 16.14 17.94 0.98 2.78 1.80 stdev. 2.13 2.15 2.32 0.88 1.80 1.26 range 10-21 12-22 12-24 0-4 0-9 0-6
51

CHAPTER 4 DISCUSSION
Taxonomy
As seen in Figure 4-1 the results of the phylogenetic analyses corraborate the
results of earlier morphologically-based studies on the Riodinidae and illuminate
previously unresolved evolutionary relationships within the Riodinidae (Hall 2002, Hall
and Harvey 2002a, Hall and Harvey 2002b, Lamas 2004, Harvey 1987).
There are seven major Riodinidae clades found in this study. These are: the
Nymphidiini clade (which includes Nymphidiini sensu Harvey 1987, Lemoniini,
Stalachtini, some Incertae Sedis “Emesini,” and the genus Mesene from Symachiini);
the Riodinini clade (including the Riodinini sensu Harvey 1987); the Helicopini clade
(including Charitini sensu Harvey 1987, Helicopini sensu Harvey 1987, and some
Incertae Sedis “Emesini” sensu Harvey 1987); the Mesosemiini clade (including
Mesosemiini sensu Harvey 1987 and Napaeina sensu Hall 2003); the Eurybiini clade
(including Eurybiini); the Euselasiinae clade (including Euselasiini sensu Lamas 2004);
and the Nemeobiinae clade including Hamearis and Styx infernalis which makes up a
monotypic tribe, Stygini, sensu Ehrlich 1958 (see Figure 3-1).
I will address the taxonomic implications of my phylogenetic results starting with
the basal clade of Riodinidae and working my way up the phylogeny shown in Figure 3-
1.
The basal clade is composed of Euselasiinae (Kirby 1871), Nemeobiinae (Bates
1868), and Stygini (Ehrlich 1958). Styginae, a monotypic subfamily comprised of the
Andean Styx infernalis, was not included in Riodinidae according to Ehrlich (1958), but
was considered a subfamily along with Lycaeninae and Riodininae, based, in part, on
52

the absence of a process of the trochanter. Stichel (1910-1911) also excluded Styx from
Riodinidae due to the lack of the projection of the coxa on the male forelegs.
However, according to the genetic results reported herein, Styx and the Old World
subfamily Nemeobiinae together comprise the sister clade to Euselasinae, even though
Lamas 2004 included Styx with Euselasinae separate from the Nemeobiinae. These
results provide strong support for the placement of the controversial genus/subfamily
Styx/Styginae within the Riodinidae most closely related to the old world subfamily
Nemeobiinae (Figures 3-1, 3-2, and 3-3).
Mesosemiini (tribe) is the basal group of the Riodininae (subfamily). The Incertae
Sedis group, sensu Harvey 1987 (or Napaeina) belongs with the Mesosemiini, as
previously found by Hall (2003) who named it Napaeina, giving it subtribe status within
the Mesosemiini and reducing the previous Mesosemiini (sensu Harvey 1987) to a
subtribe (Mesosemiina). Hereafter, Harvey’s Incertae Sedis is referred to as Napaeina.
The other Incertae Sedis group sensu Harvey 1987 (Incertae Sedis “Emesini” hereafter
referred to as Emesini), however, is polyphyletic.
Mesosemia (genus) is polyphyletic, as Harvey predicted, with moderate bootstrap
support (the highest bootstrap value indicating polyphyly is 64). And, as predicted by
Hall (2003) Mesosemiina comes out as a sister group of the Napaeina. Both Napaeina
and Mesosemiina have 5 radial forewing veins, with the exception of two genera,
Mesophthalma and Perophthalma, in the Mesosemiini (Harvey 1987).
Along with Nymphidiini, Helicopini is also polyphyletic. Also, Helicopini sensu
Lamas (2004) and Symmachiini sensu Harvey (1987) both contain one genus belonging
to another tribe. These genera are Sarota and Mesene respectively (see Figure 3-1).
53

Charitini is named after a misidentified type genus by Stichel. The existence of
Helicopini makes Charitini paraphyletic, so Reuter’s Helicopini is used (Lamas 2004).
Reuter (1897) also excluded Sarota (Sarotini) from his Helicopini tribe. This exclusion is
supported by the mitochondrial gene tree but not by the nuclear gene trees or the total
evidence tree (see Figures 3-1 and 3-2). Therefore, we need more data and analyses
regarding Sarota to find its location in the Riodinidae.
Based on the most likely tree, if Riodinini included Sarota then it would be
monophyletic but, as the gene trees illuminate, Sarota probably belongs with the rest of
the Helicopini. Harvey (1987) broke the Riodinini into two groups, the Ancyluris section
and the Riodina section, based on the placement of a forewing vein (see Harvey 1987)
and named after the genus Riodina. The Ancyluris section is monophyletic, sharing an
apparently derived placement of this vein (which Harvey hypothesized to be fused),
while the Riodina section is paraphyletic (it is the rest of the Riodinini not sharing the
synapomorphy). Another group in the Riodinini proposed by Hall and Harvey (2002b),
the Charis group, also appears to be monophyletic with high support in my trees as well
(bootstrap scores and corresponding datasets: 93 in CO1, 93 in wingless, 98 in EF1a,
and 100 in the combined analysis), though it also includes Crocozona which was not
indicated by Hall and Harvey (see Figures 3-1, 3-2, and 3-3).
Symmachiini does include Argyrogrammana as Stichel originally had it, even
though Argyrogrammana lacks concealed abdominal scent organs, a trait shared by all
other symmachiinids (Harvey 1987). This trait may not give good phylogenetic signal,
because it was also found in Menander and Periplacis by Harvey.
54

The Emesini, Harvey’s true Incertae Sedis clade, are all included within the
Riodininae, occurring mainly in sister clades of the Nymphidiini/Lemoniini clade.
However, a genus from Emesini also occurs in each of three tribes: Riodinini, Helicopini,
and Symmachiini. Apodemia and Emesis group together as Harvey predicted, based on
a characteristic of the pupal silk girdle (Harvey 1987).
Lemoniini is monophyletic but Harvey’s Lemonias and Synargis sections are
paraphyletic. Lemoniini splits the Nymphidiini tribe and the genus Calospila from
Nymphidiini appears to belong within the Lemoniini. Stalachtini, a mono-generic tribe
comprised of Stalachtis, also appears to be nested within the Nymphidiini.
Based on these results, outgroup selection for higher level systematics of the
Riodinidae is now possible. More intensive taxon sampling would better resolve many
evolutionary relationships in the Riodinidae. The basal relationships in Riodinini and
Helicopini are examples of said relationships as well as the Mesosemiini, whose
evolutionary relationships are also poorly resolved and would benefit from a greater
taxon sampling. When looking at the phylograms (Figures 3-1 and 3-2) Stalachtis and
Protonymphidium appear to have accelerated substitution rates relative to the taxa
surrounding them: sampling additional taxa closely related to them would likely provide
support or refute their grouping together.
Though more research is still needed, this study provides a molecular phylogeny
that was used to test the theories on the evolution of myrmecophily and will serve as a
foundation for future studies on the Riodinidae including insights into the evolution of
host plant usage, mimicry, and the co-evolution of myrmecophiles and their symbionts.
55

It also provides novel gene sequences for 68 new taxa within the Riodinidae that can be
used in a larger scale analysis of butterflies or insects.
Phylogenetics and Gene Trees
A noteworthy outcome of the phylogenetic analyses is the fact that the likelihood
analysis of the matrix partitioned by codon position and gene is far better than any other
likelihood analysis, including that of the matrix partitioned by codon position alone and
that of the matrix partitioned by gene alone (see Table 3-2 for comparison). Greater
congruence between this molecular tree and previous hypotheses based on
morphology (e.g. Harvey 1987 and Lamas 2004) When looking at the topology of trees
Sarota, which was putatively misplaced in the trees from the analyses of both the codon
position partitioned matrix and the gene partitioned matrix grouped with the other
Helicopini in the tree from the analysis of the matrix partitioned by gene and codon
position (see Appendix A).
Although there are some minor differences between genes, all three genes
individually support most of the tribes described by Harvey (1987), albeit with less
support than in the total evidence tree (see Figures 3-2 and 3-3). Each of the three
genes support the basal group (Euselasinae, Styginae, and Hamaerinae together), the
Nymphidiini, most of the Mesosemiini, and the Riodinini (including the Charis group and
Ancyluris group within it) although they do so with less support than when they are
analyzed together. In other words, there are more polytomies when the genes are
analyzed separately than in the combined analysis (see the consensus tree of all three
individual gene trees in Figure 3-4). Although all three gene trees have similarities, there
are differences as well. These differences provide insight about some of the surprising
results of this study. Wingless and elongation factor 1-alpha, the two nuclear genes,
56

provide better resolution (less polytomies) and higher support regarding the deeper
relationships within the phylogeny of the Riodinidae than does the mitochondrial gene.
Two of the surprising relationships uncovered in this analysis are supported by all three
gene trees: Stalachtis is within the Nymphidiini and Mesene is closely related to two
Incertae Sedis yet never near the other Symmachini. Also, the genus Mesosemia is
polyphyletic in all three gene trees.
As previously found (Hoelzer 1997, Springer et al 2001, Lin and Danforth 2004)
there appear to be differences between the mitochondrial and nuclear genes. The
reason that Sarota groups in Helicopini with such low support may be elucidated when
looking at the different gene trees. Sarota is grouped near the other Helicopini genera
but with low support in both the nuclear gene trees, however, it is grouped with
Metacharis with high support (bootstrap value of 99) in the mitochondrial gene tree.
Presumably, this is due to model based error, sampling error, or the different genes may
truly have different coalescent histories; data from more genes are needed to resolve
the position of Sarota within the Riodinidae. Additional notable differences between the
mitochondrial and nuclear genes include a lycaenid (different family) outgroup, eurybinid
(Alesa), and a member of the Mesosemiini (Perophthalma) grouping together, albeit
with low support, in the mitochondrial gene tree but not in the nuclear gene trees. This
may be due to long branch attraction (note the relative long branches of Alesa and
Curetis bulis which group as sister taxa in comparison to the surrounding branch
lengths on the mitochondrial gene tree). The deeper relationships, between tribes, differ
on each gene tree in the maximum likelihood trees, but these relationships break down
57

into one polytomy in the 50% majority rule tree. The genera in the Incertae Sedis do not
associate to the tribes with high support in many cases (see Figures 3-1 and 3-3).
Myrmecophily
As previously shown (DeVries 1991b, Campbell 1998, DeVries 1997),
myrmecophily appears to have been gained and/or lost multiple times in the Riodinidae
+ Lycaenidae clade. In the most likely total evidence tree the basal clades of the
Riodinidae reportedly do not contain myrmecophily (DeVries 1997) and the two riodinid
groups that do contain myrmecophily are topologically separated by multiple other
clades (see Figure 4-2). With a robust molecular phylogeny, the evolutionary dynamics
of myrmecophily becomes testable. The inferred phylogeny allows us to test the three
competing evolutionary hypotheses as to the origin of myrmecophily using parsimony
following Campbell 1998, Nepokroeff et al. 2003, and Weiblen 2004. The three
competing hypotheses (one, two, or three gains) presented by Devries (1991a, 1997)
were mapped onto the total evidence tree (Figure 4-2). The known and inferred
character states were also mapped on the tree. These character states (presence or
absence of myrmecophily) were taken or inferred from Harvey 1987, Horvitz et al. 1987,
Devries 1997, DeVries et al. 2004, and Kaminski 2008, using presence of long, thick
setae as an indication of amyrmecophily. In addition, one hundred random trees were
generated in PAUP 4.0 (Swofford 2003) using the same taxa and outgroup as in the
above likelihood analysis.
The three hypotheses must be compared using an indirect method for two
reasons. The first reason is, given our tree we would expect the number of evolutionary
changes (= “parsimony scores”) per hypothesis to follow a trend from 3G<2G<1G by
chance alone (here “3G<2G” means the parsimony score for 3G is less than that for 2G,
58

that is 3G is more parsimonious, when mapped onto the tree) . The second reason is,
we cannot simply compare 3G mapped on the Myrmecophily Tree to 3G mapped onto a
random tree due to the fact that if any of our hypotheses (1G, 2G, or 3G) is correct for
the Myrmecophily Tree, then we will see a reduction in total number of changes for each
of the three hypotheses when mapped onto the Myrmecophily Tree (as compared to a
random tree).
3G<2G<1G
The first reason is due to the fact that in a relatively complex phylogeny
(complexity defined here as the binomial variance of the evolutionary trait under
consideration (myrmecophily or lack thereof) and because there are16 taxa with
myrmecophily present and 22 taxa with the trait absent the variance would be given by
the equation: 38*16/38(1-16/38) = 9.26), a tree constrained to exactly two gains would
expectedly be more parsimonious than a tree constrained to have exactly one gain due
to the expected additional losses required for 1G. This is because each additional gain
may be used to account for multiple losses (compare B) and C) in Figure D-2) and a
gain followed by a back-mutation loss is unlikely to occur, and likewise for 3G versus
2G. This is seen in the Myrmecophily Tree and in the random trees. When 2G and 3G
are mapped onto the Myrmecophily Tree 3G is more parsimonious than 2G, but in this
case, 2G is equally parsimonious to 1G which is quite possibly due to the fact that there
are few outgroup taxa and only one character state is known in the outgroup (Table 4-1
and Figure 4-2). Furthermore, it is also confirmed when looking at the results from the
random trees (see Appendix F).
59

The Hypotheses Are Not Independent
We cannot simply compare 3G on the Myrmecophily Tree to 3G on the random
tree (and likewise for 1G and 2G) if any of the three hypotheses are true because we
expect the 3G on the Myrmecophily Tree to be more parsimonious than 3G on a
random tree (and likewise for 2G and 1G, that is 2G on the Myrmecophily Tree is
expected to be more parsimonious than 2G on a random tree if any of the three
hypotheses is true, etc.). This is because, given a phylogeny where 1G, 2G, or 3G is
true, the complexity of the tree will be reduced compared to a random tree. Take the
case where 3G is known to be true and there are no losses. The complexity of the tree
will be reduced because there are now only three clades with myrmecophily, and
effectively only three myrmecophilous taxa to take into account, so instead of a variance
found in the following equation: 38*(16/38)(1-16/38) = 9.26, the variance will be 2.64
found in the in this way: 25*(3/25)(1-3/25)=2.64. So 1G (a simpler case), when mapped
on this tree, will also be more parsimonious than 1G mapped on a random tree
(compare the three hypotheses mapped onto the Myrmecophily Tree against the three
hypotheses mapped onto the random trees in Figure 4-2, Table 4-1, and Appendix F).
The Indirect Method
The difference between hypotheses must be used here. That is, we will test
whether the difference in parsimony scores between the opposing hypotheses for the
Myrmecophily Tree is larger than would be expected by chance. To exemplify this, take
the above case (the tree where 3G is given to be true) and the expected result will be
3G is more parsimonious than 1G on this tree to a greater extent than on a random tree
and likewise for 3G compared to 2G. However, 1G as compared to 2G will not show this
trend, in fact we might expect the differences to be similar between the true and random
60

tree. In order to account for the expected difference between the hypotheses due to
random chance I compared the parsimony scores from the myrmecophily tree to the
parsimony scores for 3G, 2G, and 1G when mapped onto 100 randomly generated
trees. Given one of the hypotheses (1G, 2G, or 3G) is correct, the expected trends in
the differences of parsimony scores when the hypotheses are mapped onto the trees
are expressed in Table 4-2.
Based on morphology (DeVries 1988, 1991a, 1997, and Travassos et al 2008),
myrmecophily appears to have evolved three times (3G). In support of the
aforementioned previous work, the three apparently non-homologous ant-associated
stridulation organs group with the three myrmecophilous clades in this study. Vibratory
papillae are found in “clade 1,” cuticular spines and cranial setae are found in “clade 2,”
and a file and plate system is found in “clade 3” (see Figures 1-2 and 4-2). Each of the
three clades also has a distinct strategy for chemical communication (DeVries 1997).
In support of this evidence for 3G, inference after mapping the different
hypotheses onto the total evidence tree indicates that the difference between 3G and
2G is greater than expected due to chance, the difference between 3G and 1G is
greater than expected due to chance, and the difference between 2G and 1G is less
than expected due to chance. This conclusion assumes that a gain is just as likely as a
loss (see Table 4-1). When comparing the differences in parsimony scores for the
Myrmecophily Tree versus the random trees we see the expected trends as predicted
for 3G but the parsimony difference between 1G and 3G shows the expected trend,
however it is not significant. Conversely, the difference between 2G and 3G is outside
the 95% confidence interval as expected and the difference between the 1G and 2G is
61

well within the 95% confidence interval as expected (see Tables 4-2 and 4-3 and
Appendix F) . The lower than expected difference between the 1G and 3G may be due
to the fact that no taxa with known character states were sampled in the outgroup (see
Figure 4-2).
The results are also consistent with the interpretation that there have been no
losses of myrmecophily within Riodinidae (the taxa within the nymphidine clade, which
is “clade 1” in Figure 4-2, have either been observed as myrmecophilous or there is no
record as to their association with ants) which is different the findings of Campbell
(1998). Note: in Figure 4-5 for a three gains hypothesis to occur there would have to be
a loss of myrmecophily in the ancestor of the amyrmecophilous Helicopis (Campbell
1998).
While the most likely total evidence tree presented here is in need of more data to
improve resolution, there is however compelling evidence that myrmecophily evolved
three times and has not been lost in the Riodinidae. This analysis illustrates how a
robust phylogeny enhances our understanding of interesting evolutionary phenomena.
The three independent gains associate with the three different types of sound producing
apparatus, giving us further insight to their evolution. Further study regarding juvenile
riodinids and additional sequence data are needed to better understand this interesting
phenomenon.
Conclusion
This study generated many new butterfly gene sequences, provides greater
taxonomic resolution, supports the case for a three gain hypothesis regarding
myrmecophily in the Lycaenidae + Riodinidae clade, and is a basis for future studies on
the evolution found in the Riodinidae and related taxa. Sequences were generated from
62
68 novel riodinid specimens for a total of 200 new gene sequences from these taxa that
will be made available for future studies, especially those that use the three genes
employed in this study.
The findings based on the analysis of these genes support and clarify relationships
found in previous studies while raising questions to a few established taxonomic
relationships. Based on the analysis of these gene sequences we now have a better
understanding of the deeper level evolutionary relationships in the Riodinidae such as
the placement of the subfamilies and tribes as well as an affirmation of most of the
shallow level relationships within these tribes. There are some interesting phylogenetic
results that raise questions to be analyzed in future studies. Finding more taxa and
morphological or genetic markers will help clarify such questions that arise from, for
example, the extreme polyphyly found in the “Emesini,” the Mesosemia that looks like a
super genus in need of splitting, and Stalachtini’s position within the Nymphidiini.
Also based on this analysis, there appears to have been three gains of
myrmecophily in the riodinid and lycaenid clade and, more surprisingly, no losses. If this
is true then individuals within Stalachtini as well as the other individuals within the
nymphidine clade (“clade 1” in Figure 4-2) will be myrmecophilous upon further
examination. Greater taxon sampling as well as juvenile records are needed within the
Riodinidae and Lycaenidae to more fully understand the evolution of myrmecophily.
This analysis is just one way in which this hypothesis can be used to more fully
understand the mysteries found in this interesting family. The phylogeny herein provided
can now be used to further explore host plant-butterfly co-evolution, ant-myrmecophile
co-evolution, and the evolution of mimicry so vastly present in the Riodinidae.
63

Figure 4-1. Morphological phylogenetic hypothesis after Harvey 1987 including his subfamilies and tribes compared to my molecular phylogenetic hypothesis.
64

Table 4-1. Parsimony scores from mapping gains and losses of myrmecophily onto the Myrmecophily Tree (Figure 4-2).
Hypothesis Gains Losses Total 1G 1 7 82G 2 6 83G 3 0 3
65

Figure 4-2. The Myrmecophily Tree. Evolutionary gains and losses of myrmecophily
mapped onto the best tree from the total evidence RAxML analysis with character states denoted. The hypothesis corresponding with each gain is indicated near the gain. Character states were inferred for Charis, Metacharis, Caria, Emesis, Anteros, Symmachia, Napaea, and Helicopis (Helicopis from information regarding absence of known ant organs and the rest from presence of long, thick setae often used to repel insects).
66

Table 4-2. Expected trends in differences of parsimony scores of the myrmecophily hypotheses when mapped onto the Myrmecophily Tree (Figure 4-2) versus those mapped onto the random trees if the true myrmecophily hypotheses were known. The expected trend in parsimony scores in a tree as complex as ours is 1G>2G>3G meaning that 3G is expected to be the most parsimonious (“1G>2G” means that 1G is less parsimonious than 2G i.e. that the number of changes is greater for 1G compared to 2G).
True hypothesis Expected trends Myrm. Tree Rand. Tree1 gain 1G-3G < 1G-3G 1G-2G < 1G-2G 2G-3G ~ 2G-3G 2 gains 1G-3G ~ 1G-3G 1G-2G > 1G-2G 2G-3G < 2G-3G 3 gains 1G-3G > 1G-3G 1G-2G ~ 1G-2G 2G-3G > 2G-3G Table 4-3. Results from comparison of the hypotheses mapped on the Myrmecophily
Tree next to the averages and 95% confidence intervals taken from random trees. Hypothesis indicates difference of hypotheses and notation follows that described in Table 4-2.
Parsimony Scores Hypo-thesis 95% CI Avg.
Myrm. TTree
1G-3G 0-6 2.78 5 1G-2G 0-4 1.80 0 2G-3G 0-2 0.98 5
67

Figure 4-3. Adaptation of Campbell’s (1998) molecular phylogeny with myrmecophilous character state indicated by square next to genus. In this study if there was no myrmecophily indicated it was assumed to be amyrmecophilous.
68

69
APPENDIX A COMPARISON OF 3 PARTITIONING SCHEMES FOR THE TOTAL EVIDENCE
ANALYSES

APPENDIX B BAYESIAN TREES WITH POSTERIOR PROBABILITIES
70

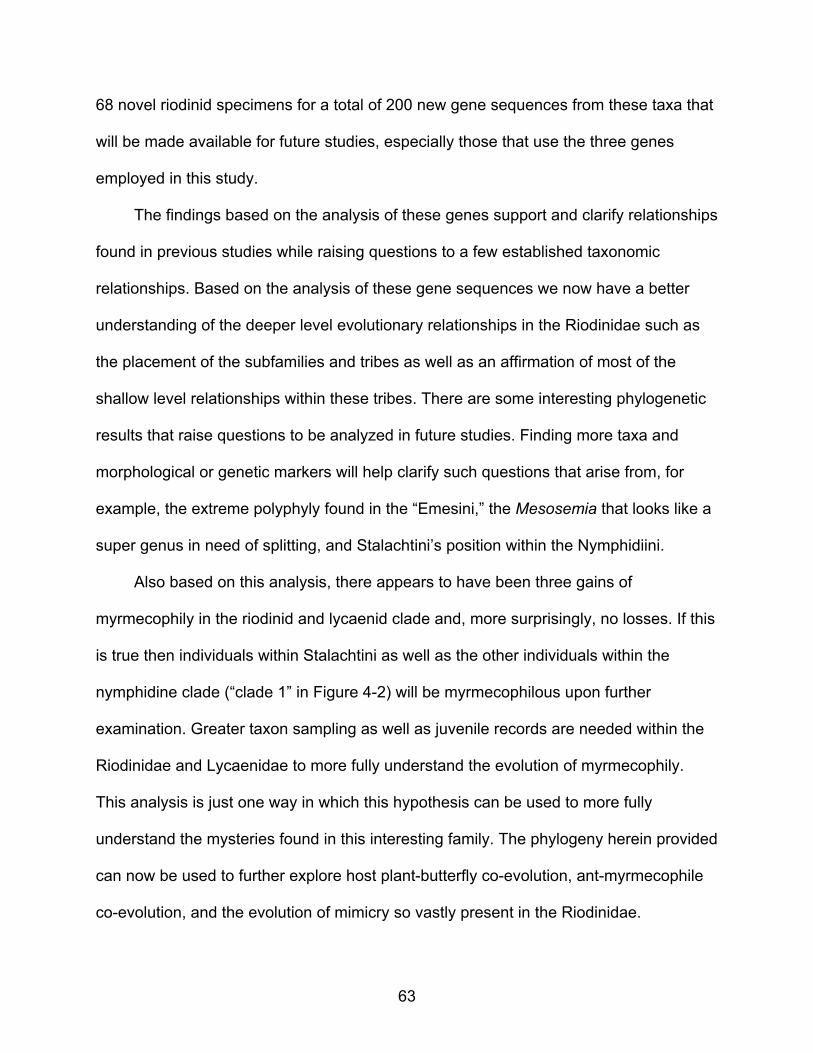
71
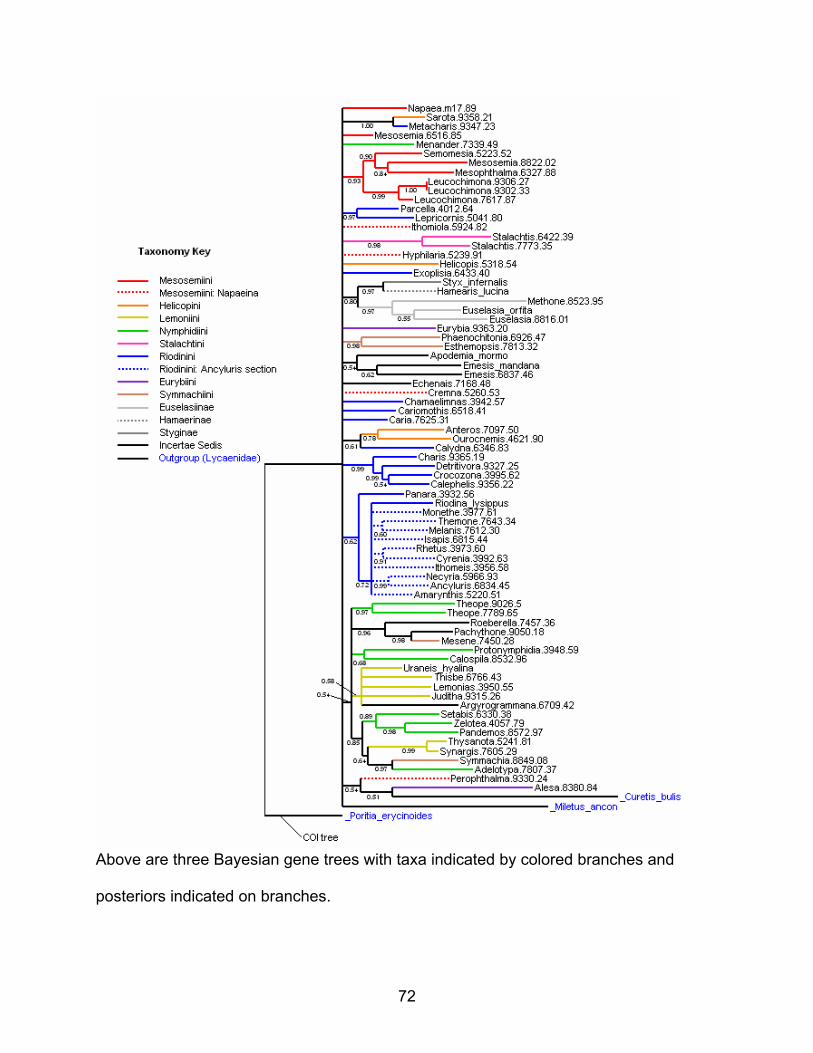
Above are three Bayesian gene trees with taxa indicated by colored branches and
posteriors indicated on branches.
72

73
Appendix B Continued.
Total evidence Bayesian phylogeny with taxa indicated by colored branches and
posteriors indicated on branches.

APPENDIX C
RANDOM TREES USED TO GENERATE A NULL DISTRIBUTION FOR THE MYRMECOPHILY HYPOTHESES
Object C-1. Random Trees
74

75
APPENDIX D PROCEDURE FOR SCORING RANDOM TREES WITH A WORKED EXAMPLE
Procedure
1) Score character states on phylogeny (myrmecophilous or amyrmecophilous) and check to make sure you have correct number of each state. Note: in this case the outgroup is constrained to be myrmecophilous. And mark phylogeny branches as ancestral as possible for presence or absence of trait without requiring a gain (assuming parsimony is the standard) to simplify every step after step 1) (see Fig D-1)
Figure D-1. Example of how to mark a phylogeny as in step 1). A) depicts a phylogeny
whose taxa have known character states B) depicts the marking of the individual taxa and C) depicts how to simplify the tree based on parsimony.
2) Under the assumption of a myrmecophilous ancestral character state, find all clades where a character loss followed by a single more recent gain (one nearer the tips of the tree) will result in a more parsimonious character state evolution score than if the ancestral loss had not occurred (see Figure D-2 A and B). Make sure the loss is as ancestral as possible while only requiring one gain. (Compare A to B in Figure D-2: the loss depicted in B is more ancestral and more parsimonious than the loss in A so B is the chosen option.)
Figure D-2. Three interpretations of the evolution of myrmecophily taken from the same phylogenetic tree. 3) Denote these changes and the total number of losses saved for each clade found
in step 2) throughout the tree. E.G. in Figure D-2 for B. I would write “12 -> 3-1 losses” implying that, respectively, the loss “1” and gain “2,” seen on the tree, will save our score three losses (those depicted in C.) but cost one additional ancestral loss (at “1”) to the parsimony score.

4) Check to see if any two of these clades can be combined to create a more
parsimonious scenario than the two clades would create separately by placing an ancestral loss more basally than either of the two losses could have been placed separately (see Figure D-3).
Figure D-3. Two interpretations of the evolution of myrmecophily based on the same
tree. In this figure, A. denotes a tree with two clades (described in step 2) and a total of four losses that can be replaced with a single loss at “5” in B. to reduce the number of changes from six to three. The numbers on the right follow the format introduced in step 3).
5) In order to compare schemes in the next step record all possible combinations of
two clades from step 2) that are found in the previous step and any other combinations left (e.g. in Figure D-3 I listed the “524” scheme from B. and the “1234” scheme from A. but in more complex trees there will be even more possibilities) along with their parsimony scores. Note: because there are at most three gains and the outgroup is constrained to be myrmecophilous there can be at the most two clades combined in this way.
6) Check the assumption in step 2), that is, check whether a gain in the outgroup with a subsequent gain more recent on the tree (A-C in Figure D-4) or a gain in the ancestor of all taxa (D-F in Figure D-4) is more parsimonious or equally parsimonious. Number the gain that is equally or more parsimonious to be included for comparison.
76

Figure D-4. Further explanation for step 6) and 7). In this case for A) a gain in the
outgroup followed by a subsequent gain is more parsimonious than a gain in the ancestor, for B) a gain in the outgroup followed by a subsequent gain is equally parsimonious to a gain in the ancestor followed by a loss and another gain and in C) a gain in the ancestor is more parsimonious than a gain in the outgroup followed by a loss and another gain.
7) If a gain in the outgroup followed by a subsequent gain (e.g., A-C in Figure D-4) is equally or more parsimonious than the gain in the ancestor (e.g., D-F in Figure D-4) then check to see if the gain in the outgroup can be combined with a clade from step 2) in a similar fashion to that described in step 4) to result in fewer changes (i.e. a more parsimonious result) than if the two were not combined.
8) Record the gains (two or three, depending on the hypothesis) and losses and total number of losses (e.g. as in step 3)) saved for all possible combinations for both hypotheses.
9) Choose the most parsimonious option recorded for both 2G and 3G. (For 2G it will either be one clade from step 2 and a gain in the ancestor of the group or the gain in the outgroup and a subsequent gain. For 3G it will either be two clades combined and a gain in the ancestor of the group, the gain in the outgroup and a subsequent gain with a clade from step 2), or the gain in the outgroup combined with two subsequent gains).
10) Mark trees with gains and losses accordingly and record the gains and losses for each hypothesis.
11) To find the parsimony score for 1G take the clade that was used in step 9) and add the number saved on that clade to the parsimony score for the two steps hypothesis and subtract one (due to one less gain). (E.g. in Figure D-3 the clade used in step 9) would be “1 2 -> 3-1” because the parsimony score is bettered by a total of two (“3-1”) changes due to the clade, clade “1 2,” found in step 2), but this clade is not possible with only one hypothesis so we add the total changes saved and subtract one due to one less gain).
77

Worked Example
A Figure D-5. Step by step method for scoring a random tree (here it is random tree
number 94 which is the most complex.
A. is the random tree. B. shows step 1) from above the taxa with known
evolutionary states are scored and then parsimony is invoked to group any of like states
together and infer the character state of any branch unless there is a conflict with
another taxon. C. shows step 2) where all gains followed by losses that result in a more
parsimonious score are mapped. D. shows step 3) where the gains and losses are
numbered. E. shows steps 4) and 5) where the losses and gains followed by the total
78

number of changes they save are recorded as well as combined and then recorded for
3G. Loss “1” and gain “2” save a total of three losses but cost one additional loss (the
one labeled “1”) so “12->3-1” is recorded. Loss “3” and gain “4” save a total of four
losses but cost one additional loss so “34->4-1” is recorded. The rest save a total of 1
(2-1) changes and are not recorded. Both “1234” and “564” are equally parsimonious for
3G. F. shows step 6) and because “9 10 11” is worse than other hypotheses we predict
that there must be a gain in the ancestor for 2G and 3G based on parsimony. Also there
must be a gain in the ancestor of the tree for 1G because the outgroup is
myrmecophilous. Therefore step 7) is skipped. G. shows step 9) where the most
parsimonious scheme is chosen for 2G and 3G (chosen schemes are indicated by
stars). H. shows step 10) where the tree is mapped with gains and losses accordingly
and tallied for 2G and, because the trees are already complicated, I deleted all the gains
and losses from the previous steps except for the chosen options whereas on paper I
would use a different color pen (see the scans in Appendix E). I. shows step 10) for 3G.
And J. shows step 11) where the parsimony score for 1G is calculated just off of the
numbers used for 2G. In this case the extra gain (going from the one to 2G) saved the
tree 4-1 changes but also cost an additional gain so I added 2 (4-1-1) to the total score
of 2G. (Similarly, if in another tree, the extra gain saved the tree 7-1 changes I would
add 5 to the parsimony score of 2G). Therefore the parsimony scores for 1G, 2G, and
3G are 24,22, and 21 respectively.
79

B Figure D-5. Continued
80

C Figure D-5. Continued
81

D Figure D-5. Continued
82
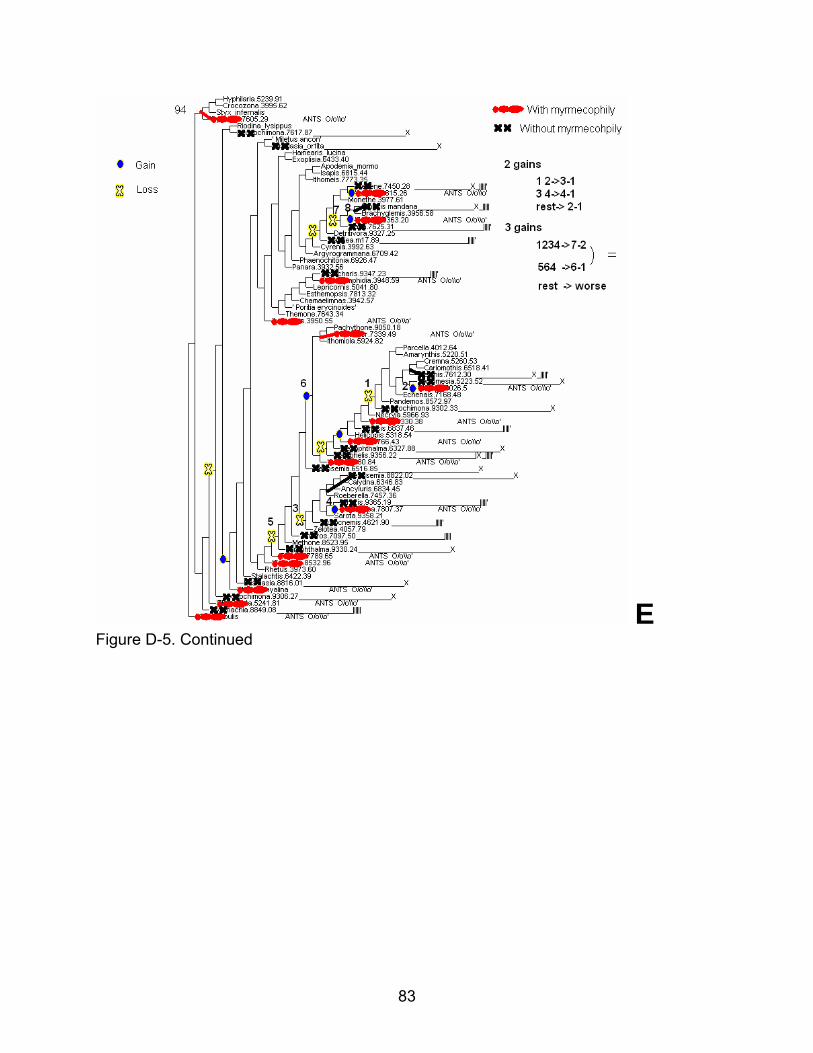
E Figure D-5. Continued
83

F Figure D-5. Continued
84

G Figure D-5. Continued
85

H Figure D-5. Continued
86

I Figure D-5. Continued
87

J Figure D-5. Continued
88

APPENDIX E SCORED RANDOM TREES
Object E-1. Scans of 100 scored random trees
89

90
APPENDIX F
RANDOM TREE NULL DISTRIBUTION RESULTS
Parsimony scores for 1G, 2G, and 3G and differences in parsimony scores for 100 random trees generated using PAUP 4.0 (Swofford 2003).The tree number corresponds to the random trees in Appendix C and Appendix E.
random tree #
3G p-score
2G p-score
1G p-score
p-score (2G-3G)
p-score (1G-3G)
p-score (1G-2G)
1 15 17 20 2 5 3 2 16 17 19 1 3 2 3 17 18 20 1 3 2 4 14 15 15 1 1 0 5 16 18 21 2 5 3 6 13 14 16 1 3 2 7 19 20 22 1 3 2 8 10 13 19 3 9 6 9 12 12 14 0 2 2
10 14 14 14 0 0 0 11 15 15 17 0 2 2 12 14 15 15 1 1 0 13 17 18 21 1 4 3 14 16 17 18 1 2 1 15 14 16 17 2 3 1 16 13 15 16 2 3 1 17 17 18 19 1 2 1 18 17 18 20 1 3 2 19 15 16 17 1 2 1 20 16 16 17 0 1 1 21 12 12 15 0 3 3 22 14 15 18 1 4 3 23 18 19 20 1 2 1 24 19 20 22 1 3 2 25 20 20 22 0 2 2 26 17 17 19 0 2 2 27 13 15 18 2 5 3 28 14 14 14 0 0 0 29 16 16 16 0 0 0 30 15 15 17 0 2 2 31 15 17 19 2 4 2 32 17 19 21 2 4 2 33 15 17 21 2 6 4 34 13 15 17 2 4 2 35 17 18 19 1 2 1 36 12 13 15 1 3 2 37 14 15 16 1 2 1 38 17 18 19 1 2 1 39 14 15 17 1 3 2 40 19 19 19 0 0 0 41 15 19 21 4 6 2 42 15 16 17 1 2 1 43 13 13 15 0 2 2 44 12 12 15 0 3 3 45 15 15 16 0 1 1 46 12 14 17 2 5 3 47 16 16 17 0 1 1 48 11 12 12 1 1 0 49 13 14 16 1 3 2 50 14 14 14 0 0 0

Parsimony scores for 1G, 2G, and 3G and differences in parsimony scores for 100 random trees generated using PAUP 4.0 (Swofford 2003) continued.
random tree #
3G p-score
2G p-score
1G p-score
p-score (2G-3G)
p-score (1G-3G)
p-score (1G-2G)
51 15 16 18 1 3 2 52 16 17 18 1 2 1 53 13 14 16 1 3 2 54 15 15 17 0 2 2 55 14 15 17 1 3 2 56 14 14 14 0 0 0 57 10 13 16 3 6 3 58 17 18 20 1 3 2 59 17 17 18 0 1 1 60 16 16 18 0 2 2 61 16 17 19 1 3 2 62 18 19 21 1 3 2 63 15 16 17 1 2 1 64 13 13 13 0 0 0 65 19 19 20 0 1 1 66 16 16 17 0 1 1 67 16 16 16 0 0 0 68 15 15 15 0 0 0 69 13 14 19 1 6 5 70 14 14 17 0 3 3 71 18 18 18 0 0 0 72 14 16 21 2 7 5 73 13 14 18 1 5 4 74 16 16 16 0 0 0 75 19 21 21 2 2 0 76 16 18 20 2 4 2 77 17 18 19 1 2 1 78 15 17 19 2 4 2 79 14 16 21 2 7 5 80 18 18 19 0 1 1 81 17 18 19 1 2 1 82 16 18 20 2 4 2 83 14 16 19 2 5 3 84 14 15 17 1 3 2 85 16 18 21 2 5 3 86 17 17 19 0 2 2 87 16 17 20 1 4 3 88 14 14 19 0 5 5 89 15 16 18 1 3 2 90 13 14 16 1 3 2 91 16 18 19 2 3 1 92 13 14 16 1 3 2 93 15 15 17 0 2 2 94 21 22 24 1 3 2 95 16 17 19 1 3 2 96 15 18 20 3 5 2 97 18 19 19 1 1 0 98 11 12 15 1 4 3 99 14 15 16 1 2 1
100 16 19 22 3 6 3 Average: 15.16 16.14 17.94 0.98 2.78 1.80
91

LIST OF REFERENCES
Ackery, P. R., R. de Jong, and R. I. Vane-Wright. 1999. The butterflies: Hedyloidea, Hesperioidea, and Papilionoidea. Pages 264-300 in: Lepidoptera: Moths and Butterflies. 1. Evolution, Systematics, and Biogeography. Handbook of Zoology Vol. IV, Part 35. N. P. Kristensen, ed. De Gruyter, Berlin and New York.
Alfaro ME, Zoller S, Lutzoni F. 2003. Bayes or bootstrap? A simulation study comparing the performance of Bayesian Markov chain Monte Carlo sampling and bootstrapping in assessing phylogenetic confidence. Mol. Biol. Evol. 20:255–66
Bates, H.W. 1868. A catalogue of Erycinidae, a family of diurnal Lepidoptera. Journal of the Linnean Society London, 9: 373-459.
Benson, D.A., Karsch-Mizrachi, I., Lipman, D.J., Ostell, J., Wheeler, D.L. 2006. GenBank Nucleic Acids Res. 34, D16–D20
Bergsten, J. 2005. A review of long-clade attraction. Cladistics 21: 163-193
Borror, D.J., C. A. Tripplehorn, and N.F. Johnson. 1989. Introduction to the Study of Insects. Harcourt-Brace-Jovanovich College Publishers, Orlando, Florida.
Brower, A.V.Z. & R. DeSalle (1998). Patterns of mitochondrial versus nuclear DNA sequence divergence among nymphalid butterflies: the utility of wingless as a source of characters for phylogenetic inference. Insect. Mol. Biol. 7:73-82.
Braby, M. F., Vila, R., and Pierce, N.E. 2006. Molecular phylogeny and systematics of the Pieridae (Lepidoptera: Papilionoidea): higher classification and biogeography. Zoological Journal of the Linnean Society 147: 239–275.
Campbell D.L. 1998. Higher-level phylogeny and molecular evolution of the Riodinidae (Lepidoptera). PhD thesis. Harvard Univ.
Campbell, D. L., Brower, A. V. Z. and Pierce, N. E. 2000. Molecular evolution of the wingless gene and its implications for the phylogenetic placement of the butterfly family Riodinidae (Lepidoptera: Papilionoidea). Mol. Biol. Evol. 17: 684-696.
Caterino,M.S., Reed,R.D., Kuo,M.M. and Sperling,F.A. 2001. A partitioned likelihood analysis of swallowtail butterfly phylogeny (Lepidoptera:Papilionidae) Syst. Biol. 50: 106-127.
D’Abrera B. 1994. Butterflies of the Neotropical Region, Part VI Riodinidae. Victoria, Australia: Hill House.
de Jong, R., R. I. Vane-Wright, and P. R. Ackery. 1996. The higher classification of butterflies (Lepidoptera): problems and prospects. Entomologica Scandinavica 27:65-101.
92

DeVries, P. J. 1997. The Butterflies of Costa Rica and their Natural History. II: Riodinidae. Princeton University Press, New Jersey.
DeVries, P. J. 1988. The larval ant-organs of Thisbe irenea (Riodinidae) and their effects upon attending ants. Zoological Journal of the Linnean Society 94: 379-393.
DeVries, P. J. 1990. Enhancement of symbioses between butterfly caterpillars and ants by vibrational communication. Science 248: 1104 -1106.
DeVries, P. J. 1991a. Call production by myrmecophilous riodinid and lycaenid butterfly caterpillars (Lepidoptera): morphological, acoustical, functional, and evolutionary patterns. American Museum Novitates 3025: 1-23.
DeVries, P. J. 1991b. Ecological and evolutionary patterns in riodinid butterflies. IN: Ant-Plant Interactions. C. Huxley and D. F. Cutler (eds.) Oxford Univ Press.
DeVries, P. J., B. Cabral and C. M. Penz. 2004. The early stages of Apodemia paucipuncta (Riodinidae): myrmecophily, a new caterpillar ant-organ and consequences for classification. Milwaukee Public Museum Contributions to Biology and Geology 102: 1-13.
DeVries, P. J. and C. M. Penz. 2002. Early stages of the entomophagous metalmark butterfly Alesa amesis (Riodinidae: Eurybiini). Journal of the Lepidopterists' Society 56: 265-271.
Ehrlich, P.R. 1958. The comparative morphology, phylogeny and higher classification of the butterflies (Lepidoptera: Papilionoidea). Univ. Kans. Sci. Bull. 39:305-370.
Felsenstein, J. (2004): Inferring Phylogenies. Sinauer Associates, Sunderland, MA.
Graybeal, A. 1998. Is it better to add taxa or characters to a difficult phylogenetic problem? Syst. Biol. 47:9–17.
Hall, J. P. W., Harvey DJ. 2002a. Basal subtribes of the Nymphidiini (Lepidoptera: Riodinidae): phylogeny and myrmecophily. Cladistics 18: 539–569.
Hall, J. P., and Harvey, D. J. 2002b. A phylogenetic review of Charis and Calephelis (Lepidoptera: Riodinidae). Ann. Ent. Soc. Amer. 95: 407-421.
Hall, J. P. W. 2003. Phylogenetic reassessment of the five forewing radial-veined tribes of Riodininae (Lepidoptera: Riodininae. The Royal Entomological Society 28: 23-37.
Hall, J. P. W. 2002. Phylogeny of the riodinid butterfly subtribe Theopeina (Lepidoptera: Riodinidae: Nymphidiini). Syst. Ent. 27: 139-167.
93

Harvey, D.J., 1987. The higher classification of the Riodinidae (Lepidoptera). Ph.D. Dissertation, University of Texas, Austin
Hill C. J. 1993. The myrmecophilous organs of Arhopala madytus. Fruhstorfer (Lepidoptera: Lycaenidae). J. Aust. Ent. Soc. 32: 283–8.
Hillis, D. M., Pollock, D. D., McGuire, J. A. and Zwickl, D. J. 2003. Is sparse taxon sampling a problem for phylogenetic inference? Syst. Biol. 52: 124–126.
Hoelzer GA. 1997. Inferring phylogenies from mtDNA variation: mitochondrial-gene trees versus nuclear-gene trees revisited. Evolution 51: 622–26
Horvitz, C., Turnbull, C.and Harvey, D.J. 1987. The biology of immature Eurybia elvina (Lepidoptera: Riodinidae), a myrmecophilous metalmark butterfly. Ann. Ent. Soc. Amer. 80: 513-519.
Huelsenbeck, J. P. 1998. Systematic bias in phylogenetic analysis: is the Strepsiptera problem solved? Syst. Biol. 47: 519−537.
Huelsenbeck, J. P., and F. Ronquist. 2001. MrBayes: Bayesian inference of phylogeny. Bioinformatics 17:754-755.
Kaminski, L.A. 2008. Immature stages of Caria plutargus (Lepidoptera: Riodinidae), with discussion on the behavioral and morphological defensive traits in nonmyrmecophilous riodinid butterflies. Ann. Ent. Soc. Amer. 101: 906-914.
Kirby, W.F. 1871. A Synonymic Catalogue of Diurnal Lepidoptera. John Van Voorst, London.
Kitching, L. 1983. Myrmecophilous organs of the larvae and pupa of the lycaenid butterfly Jalmenus evagoras (Donovan). J. Nat. Hist. 17: 471-481.
Kristensen N. P. 1976. Remarks on the family-level phylogeny of butterflies (Insecta, Lepidoptera, Rhopalocera). Zeit. Zool. Syst. Evol. 14: 25-33.
Lamas, G. 2004. Atlas of Neotropical Lepidoptera. Checklist: Part 4A Hesperioidea - Papiionoidea. Gainesville: Scientific Publishers/Association of Tropical Lepidoptera.
Lin, C. P., and Danforth, B. N. 2004. How do insect nuclear and mitochondrial gene substitution patterns differ? Insights from Bayesian analyses of combined datasets. Mol. Phylogenet. Evol. 30:686–702
Maddison, W. P. and Maddison, D. R. 1992. ‘MacClade: Analysis of phylogeny and character evolution’, Sinauer Associates, Sunderland, MA.
94

Monteiro A, Pierce NE. 2001. Phylogeny of Bicyclus (Lepidoptera: Nymphalidae) inferred from COI, COII, and EF- 1alpha gene sequences. Molecular Phylogenetics and Evolution 18: 264–281.
Nepokroeff, M., Sytsma, K.J., Wagner, W.L. and Zimmer, E.A. (2003) Reconstructing ancestral patterns of colonization and dispersal in the Hawaiian understorey tree genus Psychotria (Rubiaceae): a comparison of parsimony and likelihood approaches. Systematic Biology 52: 820–838.
Pierce, N.E., Braby, M.F., Heath, A., Lohman, D.J., Mathew, J., Rand, D.B., and M.A. Travassos. 2002. The ecology and evolution of ant association in the Lycaenidae (Lepidoptera). Annual Review of Entomology 47: 733-771
Poe, S. and Swofford, D. L. 1999. Taxon sampling revisited. Nature 398: 299–300.
Pollock, D. D., D. J. Zwickl, J. A. McGuire, and D. M. Hillis. 2002. Increased taxon sampling is advantageous for phylogenetic inference. Syst. Biol. 51:664–671.
Reuter, E. 1897. Uber die palpen der Rhopaloceren. Acta Soc. Sci. Fennicae 22:1-557.
Ross, G. N., 1966. Life-history studies on Mexican butterflies. IV. The ecology and ethology of
Anatole rossi, a myrmecophilous metalmark (Lepidoptera: Riodinidae), Annals of the entomological Society of America 59: 985-1004.
Ronquist, F., and J. P. Huelsenbeck. 2003. MrBayes version 3.0: Bayesian phylogenetic inference under mixed models. Bioinformatics 19:1572-1574.
Springer M.S., DeBry R.W., Douady C., Amrine H.M., Madsen O., de Jong W.W., and M.J. Stanhope. 2001 Mitochondrial versus nuclear gene sequences in deep-level mammalian phylogeny reconstruction. Mol Biol Evol. 18:132-43.
Stamatakis, A. 2006. “RAxML-VI-HPC: Maximum Likelihood-based Phylogenetic Analyses with Thousands of Taxa and Mixed Models”, Bioinformatics 22:2688–2690.
Stamatakis, A., Ludwig T., H. Meier. 2005. RAxML III: A fast program for maximum likelihood-based inference of large phylogenetic trees. Bioinformatics 21:456–463.
Stichel, H., 1910-11. Lepidoptera Rhopalocera, fam. Riodinidae Lep. (in) J. Wytsman (ed.) Genera Insectorum, 112A: 1-238.
Stichel, H. 1924. Zur Systematik der Riodinidae (Lep., Roph.). Neue Beitrage Systematischen Insektenkunde 3:1-3
Stichel, H., 1928. Nacharbeiten zur revision der Riodinidae (Lep.) (III). Zeit. Wiss. Insektenbiol. 23: 35-46.
95

Stichel, H., 1930-31.- Gattung Mesosemia Hbn., 1816 -Terathopthalma Stich., 1909 (in) Lepidopterorum Catalogus, Riodinidae. Das Tierreich: 253-254, 289-292.
Swofford, D. L. 2003. PAUP*. Phylogenetic Analysis Using Parsimony (*and Other Methods). Version 4. Sinauer Associates, Sunderland, Massachusetts.
Travassos, M.A., Devries, P.J., and N.E. Pierce. 2008. A novel organ and mechanism for larval sound production in butterfly caterpillars: Eurybia elvina (Lepidoptera: Riodinidae). Tropical Lepidoptera Research 18: 20-23
Travassos M.A. and N.E. Pierce. 2000. Acoustics, context and function of vibrational signalling in a lycaenid butterfly–ant mutualism. Animal Behaviour 60 1: 13-26
Wahlberg, N. M. F. Nymphalidae Systematics Group, (http://nymphalidae.utu.fi/Nymphalidae.htm), 1 March, 2008.
Wahlberg, N., M. F. Braby, A. V. Z. Brower, R. de Jong, M.-M. Lee, S. Nylin, N. E. Pierce, F. A. H. Sperling, R. Vila, A. D. Warren, and E. Zakharov. 2005. Synergistic effects of combining morphological and molecular data in resolving the phylogeny of butterflies and skippers. Proceedings of the Royal Society Series B 272:1577-1586.
Wheeler, W. 1992. Extinction, sampling, and molecular phylogenetics. Pages 205–215 in Extinction and phylogeny (M. J. Novacek and Q. D. Wheeler, eds.). Columbia University Press, New York.
Wahlberg, N., M. Zimmermann. 2000. Pattern of phylogenetic relationships among members of the tribe Melitaeini (Lepidoptera: Nymphalidae) inferred from mtDNA sequences. Cladistics 16: 347–363.
Wahlberg, N., M. F. Braby, A. V. Z. Brower, R. de Jong, M.-M. Lee, S. Nylin, N. Pierce, F. A. Sperling, R. Vila, A. D. Warren, & E. Zakharov. 2005: Synergistic effects of combining morphological and molecular data in resolving the phylogeny of butterflies and skippers. Proceedings of the Royal Society of London Series B Biological Sciences 272:1577-1586.
Weiblen G.D. 2004. Correlated evolution in fig pollination. Syst. Biol. 53: 1–12.
Zwickl, D.J., and D.M. Hillis. 2002. Increased taxon sampling greatly reduces phylogenetic error. Syst. Biol. 51: 588–598.
96

97
BIOGRAPHICAL SKETCH
Jonathan was born in Miami, FL, U.S.A. in 1984, the son of James Saunders and
Shirley Saunders. In 2003 he was admitted to the University of Florida, majored in
Wildlife Ecology and Conservation and minored in mathematics and received a
Bachelor of Science degree from the College of Agricultural and Life Sciences in 2007.