business and retail strategy final report - caring for …archive.lithgow.nsw.gov.au/documents/sgs...
TRANSCRIPT

Business and Retail Strategy Final Report
Lithgow City Council
April 2010

This Report has been prepared for:
Lithgow City Council
Adoption of Business and Retail Strategy The Lithgow City Council Business and Retail Strategy was adopted by Council at its Ordinary Meeting held on 21 June 2010 (Minute No. 10-256)
This report has been prepared by: SGS Economics and Planning Pty Ltd
ACN 007 437 729
12/50 Reservoir Street
Surry Hills NSW 2010
P: + 61 2 8307 0121
F: + 61 2 8307 0126
W: www.sgsep.com.au
Offices in Brisbane, Canberra, Hobart, Melbourne, Perth, Sydney

Table of Contents
Executive Summary ................................................................... 1
1 Introduction ....................................................................... 6
1.1 Purpose and approach................................................................................................8 1.2 Remainder of this Report ............................................................................................8
2 Context .............................................................................. 9
2.1 Trends and Drivers ....................................................................................................9 2.2 Policy Framework .................................................................................................... 12 2.3 Demographic Context............................................................................................... 14 2.4 Population Forecasts ................................................................................................ 19 2.5 Employment Profile.................................................................................................. 20 2.6 Location Quotient Analysis ........................................................................................ 24 2.7 Tourism in Lithgow and the Blue Mountains ................................................................. 30
3 Lithgow’s Centre Hierarchy .................................................32
3.1 Lithgow: Subregional Centre ..................................................................................... 32 3.1.1 Lithgow Main Street .................................................................................... 38 3.1.2 Lithgow Valley Plaza and Pottery Plaza........................................................... 44
3.2 Wallerawang: Local Centre........................................................................................ 49 3.3 Portland: Local Centre.............................................................................................. 54
4 Modelling Retail Demand .....................................................59
4.1 SGS Retail Modelling Approach .................................................................................. 59 4.2 Testing Future Scenarios .......................................................................................... 63 4.3 Understanding Bulky Goods Retailing.......................................................................... 66 4.4 The relationship between office-based employment and retailing .................................... 68 4.5 Implications............................................................................................................ 69
5 Council’s Role in Planning for Business and Retail .................71
5.1 Planning Controls .................................................................................................... 71 5.2 Economic Development ............................................................................................ 74 5.3 Creating a Competitive Place..................................................................................... 76
6 Lithgow Business & Retail Strategy ......................................80
6.1 Future Centre Hierarchy ........................................................................................... 80 6.2 Economic Development Objectives and Actions ............................................................ 93
Appendix A: Demographic Analysis for Lithgow City LGA...............98
Appendix B: Policy Review....................................................... 103
April 2010 SGS Final Business and Retail Strategy.doc
April 2010 SGS Final Draft Business and Retail Strategy.doc
Table of Contents
Appendix C: Shopper Survey .................................................... 112
Appendix D: Extract from Insite (2009) Supply and Demand Analysis...................................................................................... 129
Appendix E: Business Survey Summary ..................................... 138

Business and Retail Strategy / Lithgow City Council
April 2010 SGS Final Business and Retail Strategy.doc P. 1
Executive Summary
Lithgow, Wallerawang and Portland are the centres of the Lithgow LGA (Local Government Area)
community. The scope of work for this study is to:
• Complete a business and retail economic analysis, considering the current retailing within
Lithgow and its location, demographic characteristics of the local population, current retail
leakage, future retail floorspace demand and opportunities
• Identify the current and future retail hierarchy
• Recommend actions to encourage business development, while strengthening existing
businesses
In terms of planning for business and retail, Council faces significant challenges:
• Population decline has been forecast.
• Some vacancies exist within the existing centres. Additional retail floorspace has been
approved at Lithgow Valley Plaza which, without intervention, will impact adversely on the
Main Street.
• Retail modelling suggests that it is unlikely that population growth, increased visitation,
increased affluence, or greater market capture will create sufficient retail demand to
support this increased supply.
Without significant intervention, these factors suggest a very poor outlook for retailing within the
LGA. However, it is not all ‘doom and gloom’. Lithgow’s strengths include affordable property
prices, a relaxed lifestyle and proximity to Sydney. This strategy seeks to leverage these existing
strengths.
A range of alternative uses need to be nurtured within Lithgow to retain and enhance the vibrancy
of Main Street. This strategy focuses on reinforcing Lithgow’s strengths and making Main Street an
attractive destination. Shifting the focus of the cultural precinct towards the Main Street will allow
use of existing vacant space, minimise capital investment and promote activity within the town
centre. Residential uses within the centre should be encouraged, while ensuring that adaptability
for a variety of uses is maintained.
The focus of growth should be on Lithgow town centre, with expansion of business uses on the
Highway to be restricted. A precinct parking plan is required.
Lithgow’s Centre Hierarchy
Lithgow’s Current Role - Lithgow Centre acts as a subregional centre. For residents living within
walking distance, or a short drive, Lithgow LGA also provides a local shopping destination, for
groceries, bread and milk. While some shoppers travel from locations such as Blackheath, Mt
Victoria and Katoomba, as well as Bathurst, Oberon and Mudgee. Aldi, within the Pottery Plaza,

Business and Retail Strategy / Lithgow City Council
April 2010 SGS Final Business and Retail Strategy.doc P. 2
has been identified as one key attractor for people visiting Lithgow to shop. However this may
change with the opening of an Aldi store opening in Katoomba in March 2010.
The Lithgow Main Street runs in an east-west direction, parallel to the rail line. Businesses located
along the main street are diverse, including pubs, cafes, restaurants, banks, charity stores, clothes
retailers, a newsagent, chemist, community cinema, hairdressers and dry cleaners. There is a
mixture of heritage, and more modern buildings.
The character of the centre changes towards the western end. Uses in this area are more in line
with bulky goods/ enterprise corridor type uses, including motorcycles sales, lighting retail, car
sales, hardware, chainsaw and mowing supplies, and glass retailers. It is estimated that there is
over 39,000 sqm of ground floor floorspace within the town centre1, vacancy is estimated to be
7.5% within the centre.
Lithgow Valley Plaza is located to the south west of Main Street shopping precinct. The centre is
anchored by Coles and Target, located at either end of the centre. The Lithgow Valley Plaza
contains approximately 12,000 sqm of retail floorspace with an approval for approximately 5,000
sqm of additional floorspace. In September 2009, there were three vacant stores within the
centre. The Pottery Plaza, located to the south of Lithgow Valley Plaza contains Aldi, Dominos
Pizza, Repco, Sams Warehouse, a car wash, Aussie Superpets and three vacant shops, accounting
for more than 15% vacancy.
Lithgow’s Future Role - Lithgow will continue to function as a subregional centre, as a focal
point for government and community activity within the LGA. This is reliant on Council ensuring
that future retail floorspace, commercial floorspace and community facilities are focussed within
the centre. It is essential to concentrate retail activities within the existing centre and consider
potential to develop new activities within the centre.
Additional retail floorspace has been approved at Lithgow Valley Plaza. This will impact adversely
on retailers within Main Street. At present there are a number of vacant shop fronts. Population is
likely to remain static or grow modestly meaning that demand for retailing is unlikely to grow
significantly. If Council is to preserve or enhance the character of Main Street a concerted effort is
required to nurture a range of uses within existing shop fronts. Council should consider
opportunities to differentiate between Main Street and Lithgow Valley Plaza, improve the
attractiveness of Main Street and explore avenues to support cultural uses within existing vacant
shop fronts.
Wallerawang’s Current Role - Wallerawang centre has primarily a role as a local centre, with an
additional role serving the nearby working population. Wallerawang is located 15 km north west of
Lithgow, and is accessed from both the Great Western Highway and Castlereagh Highway. It is on
the rail line, however, no longer has a passenger service. A bus service connects Wallerawang with
Lithgow and Bathurst.
1 Ground floor premises which offer higher visibility to pedestrians are more ideal for retailing. Second floor premises are likely to be office based, or service providers such as doctors or dentists. This figure does not include Woolworths, or other retailing within Lithgow, outside the Main Street.

Business and Retail Strategy / Lithgow City Council
April 2010 SGS Final Business and Retail Strategy.doc P. 3
Businesses here include pubs, a newsagent/small supermarket, hair dresser, Chinese restaurant,
antique store, doctor’s surgery, post office, butchers and bakery. There is a branch library in the
centre of Wallerawang, which has been recently refurbished. The old Wallerawang railway station
has been redeveloped to include a café, lolly shop, florist and giftware/arts and crafts store.
Premises within Wallerawang centre are spread out and interspersed with residential properties.
Overall, there is approximately 7,900 sqm of commercial floorspace within the centre, of which it is
estimated that 19% is vacant.
Wallerawang’s Future Role - Wallerawang will continue its role as a local centre. Council
should continue to encourage convenience retailing, take away food and local services in this
location. Council should also continue to offer services, through the Wallerawang Library. Though
the centre is unlikely to change significantly, over time the broader Lithgow area may attract a
higher number of day trippers, which may have flow on effects to Wallerawang, particularly
following the adaptive reuse of the former Railway Station. Opportunities for alternative uses
within the centre should be considered within the principal LEP, with design guidelines for
alternative uses.
Portland’s Current Role - Portland centre has a role primarily as a local centre. The small village
accommodates a range of businesses: Foodworks, a bakery, pharmacy, take away, pub,
hairdresser, post office, bank, St Vincent de Paul, butcher, RSL Club, aromatherapy store, real
estate agent and youth centre. In September 2009 there were 10 vacant shop fronts. While the
majority of businesses are located around the intersection of Wolgan and Williwa Streets, the post
office is located a short walk away, on the corner of Lett and Williwa Streets.
The Boral site, located adjacent to the town centre has been disused since the 1990s. This site
presents a key opportunity for renewal within the town centre. Discussion with the landowner
suggests that in future the site could be used for a mixture of residential and light industrial land
uses.
Portland’s Future Role - Portland centre presents a distinct opportunity for Lithgow LGA, a
heritage tourism destination promoted in conjunction with Hartley historic village. The local role
of Portland should also be preserved. Careful consideration should be given to how the Boral site
can rejuvenate the town centre and facilitating a tourism role for the centre. Council should
explore avenues to promote tourism, for example through events, within Portland, in parallel with
other initiatives, such as encouraging businesses to extend trading hours.
Modelling Retail Demand
Retail modelling was used to assess the amount of retail floorspace that could be supported within
Lithgow LGA. This is based on ABS 2008 Estimate Resident Population2, redistributed to reflect the
2006 population distribution. In order to understand potential future demand, a number of
scenarios have been tested.
2 ABS (2009) Regional Population Growth, Australia, 2007-08, Catalogue No.: 3218.0

Business and Retail Strategy / Lithgow City Council
April 2010 SGS Final Business and Retail Strategy.doc P. 4
Scenario 1: Reduced expenditure ‘leakage’. Compared with the base case (if escape
expenditure was reduced) approximately an additional 6,000 sqm of floorspace could be supported
within Lithgow centre. No change would be experienced within Portland and Wallerawang, as these
centres do not offer higher order retailing.
Scenario 2: Higher proportion of people travelling to Lithgow to shop. If the number of
shoppers in Lithgow, travelling from outside the LGA increased from 10% to 20%, it is estimated
that an additional 6,000 sqm of retail floorspace could be supported within the Lithgow centre
(Table 15). This is a similar result to Scenario 1: reduced expenditure leakage.
Scenario 3: Increasing affluence of Lithgow LGA residents. If Lithgow LGA residents were to
become more affluent, in line with the Australian average income profile, it is estimated that an
additional 7,000 sqm of retail floorspace could be supported within the Lithgow LGA, when
compared to the base case.
Scenario 4: Population growth to 25,000. Assuming Lithgow LGA’s population were to grow to
25,000 people as Council aims, it is estimated that an additional 11,000 sqm of retail floorspace
could be supported between the centres of Lithgow, Wallerawang and Portland. This assumes that
the distribution of population remains constant. In this case, there may be a small under supply of
floorspace with Lithgow, however, excess floorspace would remain within Wallerawang and
Portland.
As such Council faces significant planning challenges and must strive to:
Capture a greater share of residents spend locally.
Attract a greater number of tourists and visitors.
Increase the affluence of the resident population.
Increase the population.
Given the competitive offer at Bathurst and Penrith, relatively small population within Lithgow’s
catchment and modest population growth, it is unlikely that Lithgow will sustainably support a
significant volume of bulky goods retailing within the foreseeable future.
Council’s Role in Planning for Business and Retail
Lithgow City Council, in conjunction with its local and regional partners, can play an important role
in identifying and addressing the challenges, as well as promoting and facilitating opportunities for
the economic development of the local area. Key challenges for Council as identified by this study
include promoting business excellence, encouraging residents to shop locally and retaining young
people.
Local government must continue to take a pro-active role to stimulate and encourage local /
regional economic development. There is a range of economic development activities that councils
can engage in to encourage and support economic development in their communities of interest.
This may be through:
Supporting an Attractive Business (and People) Environment

Business and Retail Strategy / Lithgow City Council
April 2010 SGS Final Business and Retail Strategy.doc P. 5
Facilitating Local Investment, Business and Employment Growth
Attracting / Facilitating New Investment
Creating a Competitive place
Actions for each of the centres are detailed in Section 6.

Business and Retail Strategy / Lithgow City Council
April 2010 SGS Final Business and Retail Strategy.doc P. 6
1 Introduction
Lithgow, Wallerawang and Portland are the centres of the Lithgow LGA (Local Government Area)
community. Lithgow consists of main street retailing within an enclosed retail centre. A variety of
retailing and services are available. Wallerawang and Portland are smaller local centres, located to
the west of Lithgow, with primarily a local role, providing services and convenience retailing.
Wallerawang is a popular lunch spot for local workers. Council has commissioned this study to
investigate the current and future role of these centres.
Council’s Strategic Plan sets in place a vision for Lithgow for the coming decades. Council’s
aspirations are for Lithgow to be:
‘A centre of Regional excellence that:
Encourages community growth and development
Contributes to the efficient and effective management of the environment, community and
economy for present and future generations.’
With respect to employment, Council is focused on ‘developing and embracing diverse job
opportunities for all ages and abilities’.
Lithgow LGA covers approximately 4,551 square kilometres, located between Bathurst and the Blue
Mountains. Lithgow town centre is approximately 140 km from Sydney’s CBD. The LGA’s position
within the broader region is shown in Figure 1. In 2008, the Lithgow LGA was home to 20,620
people (ABS, 2008), and over the previous five years the LGA experienced very low growth of 0.1
per cent per annum.
In 2006, Lithgow LGA accommodated approximately 6,850 jobs. The largest industry sector, a key
driver of the economy, was ‘Mining’, with 12 per cent of jobs. Power generation is also a key
employer within Lithgow. The ‘retail trade’ sector accounted for 12 per cent of jobs in 2006, with
‘accommodation and food services’ making up 9 per cent of employment. This strategy will seek to
support and further develop businesses within these industries and other emerging sectors of
opportunity. It will ensure planning controls allow for appropriate premises and economic
development initiatives support local businesses.

Business and Retail Strategy / Lithgow City Council
April 2010 SGS Final Business and Retail Strategy.doc P. 7
Figure 1. Li thgow and Surrounds
Source: SGS, 2009

Business and Retail Strategy / Lithgow City Council
April 2010 SGS Final Business and Retail Strategy.doc P. 8
1.1 Purpose and approach
The scope of work for this study is to:
• Complete a business and retail economic analysis, considering the current retailing within
Lithgow and its location, demographic characteristics of the local population, current retail
leakage, future retail floorspace demand and opportunities
• Identify the current and future retail hierarchy
• Recommend actions to encourage business development, while strengthening existing
businesses
This study will feed into Council’s preparation of a comprehensive LEP and Economic Development
Strategy.
Our approach to the study brief has consisted of a number of phases:
• Baseline assessment – based on site visits, a review of the policy framework and relevant
documents which had been previously prepared by Council
• Identifying the current retail hierarchy – retail trends were identified and their implications
for Lithgow considered. Business representatives and the community were consulted with.
Retail surveys provided an understanding of current spending patterns and retail demand was
modelled
• Considering a future retail hierarchy – future retail demand was modelled. An
understanding of trends and directions informed the consideration of a future retail hierarchy
• Strategy development –Objectives and actions have been recommended.
1.2 Remainder of this Report
The remainder of this report is structured as follows:
Section 2 – considers the context of this business and retail strategy
Section 3 – presents Lithgow’s existing centres hierarchy
Section 4 – discusses the results of retail modelling
Section 5 – highlights Council’s role in planning for business and retail
Section 6 – details objectives and actions for implementation of the centre strategy

Business and Retail Strategy / Lithgow City Council
April 2010 SGS Final Business and Retail Strategy.doc P. 9
2 Context
2.1 Trends and Drivers
Communities value their local retail and business centres. Activity centres are not just dispensers
of retail goods and services. They are also community meeting places, centres of community and
government services, locations for education and employment as well as settings for recreation,
leisure and entertainment. Clearly, business development is about more than the size of the retail
market which is related directly to the size and relative affluence of the population in the retail
‘catchment’.
By providing identifiable locations for social, cultural and economic interaction and exchange, well
planned centres display a strong ‘sense of place’ and provide a focus for community life and
association. Ensuring a diverse range of uses is one way in which Council can strengthen local
centres. While a mix of activities often occurs within centres, retailing is often the primary
attractor which can be harnessed to provide a focus for other activities, including residential.
Understanding Retail Centre Forms
Centre retailing generally consists of two main types; the traditional strip centre and larger
enclosed shopping centres, both of which are present in Lithgow. The latter is mostly anchored by
a mix of supermarkets, department stores and discount department stores (DDSs) and also usually
house a wide range of specialty shops which are often dominated by various retail franchises.
Large, enclosed shopping centres are typified by single ownership. They have continued to
expand and grow in recent years with many of the large centres getting even larger. Enclosed
shopping centres have some competitive advantages over main street retailing. Being within single
ownership, they are able to carefully manage the tenancy mix. Additionally an enclosed shopping
centre is insulated from the weather. Discussions with the management of Lithgow Valley Plaza
indicated that older people came to the centre quite often, to relax in the air-conditioning.
More generally, shopping centres are diversifying their offer whether it be in retail mix and the
provision of entertainment and lifestyle services, or by way of the type of retail setting (for
example, some planned centres now have internal ‘main streets’ which attempt to replicate the
traditional strip centre).
Newer planned regional shopping centres often significantly impact on the welfare of the
traditional strip-type centres, both in the capital cities and in regional centres. Anecdotal
evidence suggests that this was also the case when Lithgow Valley Plaza first opened. However,
one of the advantages that traditional strip centres can offer over the large planned centres is a
much greater range of rents and a lower rental base generally, as well as providing for a
component of office floorspace, and the potential for other uses, including education and
residential.

Business and Retail Strategy / Lithgow City Council
April 2010 SGS Final Business and Retail Strategy.doc P. 10
Changing Retail Patterns
The form of retail centres is influenced by retail trends. Recent work by SGS has highlighted
emerging trends and drivers of retail and commercial activity. These include:
Deregulation of shopping hours
Development of larger supermarkets
Introduction of discount supermarkets
Demand for out-of-centre retailing premises, particularly for bulky goods
Increased diversification and stand alone centres
Discount department stores
Increasing demand for convenience shopping
Increased popularity of electronic retailing
Supermarkets have captured a large share of the growth in retail expenditure in recent times.
They have broadened the range of goods on offer and are taking on a ‘mini-centre’ role within
shopping centres. They have included specialist activity nodes within their floorspace – butcher,
baker, greengrocer, delicatessen and are now including banking and post office activities.
Consumers are also showing a greater demand for convenience shopping, demonstrating less
loyalty to a particular centre, such as the corner store. The time-conscious convenience shopper
will frequent stores that can meet their expectations for convenience and familiarity. However, this
phenomenon is likely to be more pronounced in metropolitan areas where population density is
higher and there is the critical mass to support a greater number of stores, with longer trading
hours, and so on.
Bulky good retailing has experienced rapid growth in recent years. In July 2008, Knight Frank
reported that this sector had doubled in the 6 years previous3. Bulky goods retailers may be
warehouse or factory outlets or the general bulky goods stores (e.g. furniture and white goods).
These outlets are typically located in low cost buildings in low rent areas. They seek high profile
locations away from the main centres which are easily accessible by car. Sites with exposure to
high traffic volumes are desired by bulky goods retailers because they enable business promotion.
Locations on major arterial roads are therefore preferred.
Additionally, online shopping is increasing, as consumers have increasing confidence in the
security of on-line payment. Research by AC Nielsen indicates that on average, consumers spend
$1,900 per annum on online4. This is primarily made up of airline tickets, accommodation and
concert/event tickets.
Business Trends: A Rise in Service Sector Activity
• Considering business trends more broadly, domestic and international trade in services have
been growing rapidly. This includes financial and business services, and community and
3 Knight Frank(2008) NSW Retail Market Overview – July 2008 4 AC Nielson (2006) News Release: Aussies’ online spending tops $11 billion, 18 September 2006.

Business and Retail Strategy / Lithgow City Council
April 2010 SGS Final Business and Retail Strategy.doc P. 11
personal services including education, recreation, leisure and entertainment and tourism.
According to the Department of Foreign Affairs and Trade (DFAT), Australia’s external trade in
services (exports and imports) has increased substantially as a proportion of total trade in
goods and services. In recent years, the greatest increase in Australia’s service exports has
been in travel services. However, discretionary spending such as travel, has been adversely
impacted upon by recent global financial conditions.
Urban Quality as an Business Investment Attractor
The amenity of a city, suburban or regional centre is important for economic prosperity as it
represents one means of attracting new business investment and activity. Investing in
beautification of the public realm can encourage an enhanced range of business and community
service sector activities. Land use planning, which encourages a well planned, appropriately
sequenced retail and commercial development is a critical factor of urban amenity. It is important
in improving the attractiveness of a location for businesses. Urban quality is more than
beautification and street furniture, and although maintenance and civic pride is important, these
are as much results as they are a means of achieving a place that is valued by the community.
Urban quality and a sense of place relies on there being a diversity of activities with many
participants and businesses; diversity in ownership, age, style, height and forms of buildings; and
a sense of continuity with history and past activities.
The Emergence of the ‘Lifestyle’ Region: Attracting a Skil led Workforce
As noted above, in recent years, lifestyle and liveability have emerged as primary elements of
investment location decision making criteria. This is particularly relevant to the so-called
‘knowledge workers’ who place a premium on an area’s lifestyle attributes, including its recreation,
leisure and entertainment, community and cultural infrastructure. However, this notion also
applies to the population at large.
Regions like Lithgow City LGA must continue to present a good ‘people climate’ as well as a good
business climate if they are to successfully compete for investment. This includes a strong cultural
economy, urban quality and social cohesion. Areas that offer a high level of amenity may see
growth in home-based business and small businesses in general, as people seek to live and work in
a location which offers lifestyle benefits.
Growth in Home-Based Business
There has been a recent growth in home-based businesses in Australia. Corporate downsizing, the
greater premium placed on skills and knowledge, the ability of businesses to readily source inputs
from remote suppliers and enhanced communications and information technology have provided
opportunities for new and more flexible modes of working. This has given rise to ‘home-based
businesses’. Micro and small businesses, especially new start-ups, are establishing in home offices
as well as low rent offices and shop fronts in the suburbs and in regional centres. People that
establish companies in fields such as design, marketing, software development, health and
consultancy advice drive this activity.

Business and Retail Strategy / Lithgow City Council
April 2010 SGS Final Business and Retail Strategy.doc P. 12
As home-based business activity grows, there will be implications for commercial land
requirements that will require creative responses from local Councils. For example, as home-based
businesses grow, and staff numbers increase, many firms will seek to move from the home office
to a conventional office in their local area. Their move into the commercial office market may be a
cautious step to relatively cheap accommodation until the business can sustain higher rents. Their
target is therefore low-grade office space and residual shopfronts. In an area such as Lithgow
which offer a high level of amenity, a country lifestyle, and is reasonably close to Sydney, the
further development of home-based and small start-up businesses is a distinct opportunity.
2.2 Policy Framework
The existing policy framework provides important context for the current study and highlights
existing priorities and directions.
State Plans
The 2009 NSW State Plan is the NSW Government’s long term
plan for service provision. The plan consists of priorities and
actions which address:
Better Government
Supporting Business and Jobs
Better Transport
Clever State
Healthy Communities
Green State
Urban Environment & Lifestyle
Strengthening Communities
Keeping People Safe
Delivering for Priority Groups
Actions underway to promote employment growth in regional areas include the Regional NSW
Employment Fund. The State Infrastructure Strategy notes that some upgrades will occur to
transmission and sewerage treatment infrastructure within Lithgow LGA.
Local Policies and Strategies
The Strategic Plan is the first long term plan to be developed by Lithgow City Council. It aims to
achieve economic, environmental and social sustainability in the local government area, which will
be driven by the community’s vision. It is hoped that Lithgow will becomes ‘a centre of Regional
excellence that:
• encourages community growth and development, and

Business and Retail Strategy / Lithgow City Council
April 2010 SGS Final Business and Retail Strategy.doc P. 13
• contributes to the efficient and effective management of the environment, community and
economy for present and future generations.’
The Strategic Plan is divided into three parts:
• A local profile including baseline information,
• A series of issues papers which explore the key issues in the LGA, and
• Draft and final Strategic Plan with actions and strategies on how to manage growth and
development over the next 20 years.
Council, in conjunction with the community, has developed ten vision statements relating to the
areas of community, transport, employment, heritage, education, health, environment, arts and
culture, youth, and growth.
The employment vision statement, “developing and embracing diverse job opportunities for all ages
and abilities”, outlines six strategies, each with their own actions, to implement the vision
statement. These strategies include:
• Planning for a diversified economy which supports local employment
• Encouraging local employment opportunities for the community
• Protecting the economic assets
• Providing employment generation lands
• Promoting retailing opportunities in the LGA
• Developing the natural and cultural assets for the tourism market
Some of the actions identified to implement these strategies include:
• The preparation of an economic development strategy which will inform the Lithgow LEP
• Partner with business, industry and government, including the Lithgow Business Association
• Support the Bells Line and M2 Expansion
• Identify skills shortages and align employment opportunities with skills required
• Encourage establishment of post secondary school training facilities in the LGA
• Continue participation in government taskforces relating to economic development
• The preparation of a retail strategy which will inform the Lithgow LEP
• Provision of adequate buffer zones and identification of natural resources
• Fostering of partnerships between service providers, community and government, and
• Continue development of cross LGA boundary tourism opportunities and brand identity
The main issues identified with employment in Lithgow LGA include:
• the need to diversify the economic base within the LGA
• the absence of an economic development strategy
• the need to strengthen Lithgow CBD as the primary centre and reinvigorating Wallerawang and
Portland CBDs as secondary centres
• the need to attract clean green industries to the LGA
• the need to protect agricultural land from conflicting and competing land uses.

Business and Retail Strategy / Lithgow City Council
April 2010 SGS Final Business and Retail Strategy.doc P. 14
Lithgow CBD is the focus of retailing activity within the LGA, and the strategic plan notes that the
centres of Portland, Wallerawang and Lithgow Valley and Pottery Plazas should not place any
pressure on the viability of Lithgow CBD. The strategic plan states that the amount of shop
vacancies would indicate a current oversupply of retail floorspace. The need for improvements to
public domain, parking and traffic was identified through community consultation.
Of particular relevance to the current study is the Marrangaroo Local Environmental Study and
Draft Structure Plan. These documents propose ‘Highway/Business Services’ along the highway
at Marrangaroo, as part of a broader concept of land uses for the area. The document notes that
this will include uses such as office, retail and light industrial uses, and will include uniform lot
sizes, with a mix of businesses and dwellings. Potentially, businesses could include:
Hardware and building supplies
Hotel accommodation
Landscape and garden supplies
Light industries
Passenger transport facilities
Warehouse or distribution centres
The draft Land Use Issues Paper states that there is a substantial oversupply currently zoned
residential and rural residential land. Further future urban use lands and the Marrangaroo site
compounds this oversupply.
The Lithgow Cultural Plan aims to provide economic stability and growth through cultural
development in the region. The Plan includes a feasibility study into the development of a cultural
precinct in Lithgow CBD. A range of actions were identified: the provision of cultural employment
positions; a youth job network to help youth at risk gain education and job skills; new business
incentives programs; ensuring Lithgow is connected to the Bells Line of Road Motorway; provision
of support works for Indigenous and Disabled communities; and further promoting cultural
development.
The new business incentives program, as identified within the Cultural Plan, would be aimed at
attracting new businesses to the area. The Cultural Plan notes that this will include identification of
industrial lands, the development of a strategy and the promotion of potential developers. To
attract new businesses to Portland a rental subsidy could be offered, along with the development of
a strategy to encourage creative/cottage industries and promote Portland as a cultural heritage
tourism destination.
Council’s Social Plan, Marrangaroo Local Environmental Study and Draft Structure Plan, draft Land
Use Issues Paper, Local Profile, Cultural Plan and Main Street Study are considered further in
Appendix B.
2.3 Demographic Context

Business and Retail Strategy / Lithgow City Council
April 2010 SGS Final Business and Retail Strategy.doc P. 15
Understanding the demographics of Lithgow LGA is an important component in the preparation of a
business and retail strategy. Retail and business centres will be shaped by the size of the local
population, its distribution, relative affluence, age structure and available workforce.
The amount of supportable retail floorspace within an area is linked to the amount of potential
retail expenditure, which depends on a range of factors, primarily the size of the population and
the local income profile. In turn, the income profile of an area is influenced by the age of residents,
their labour force status, industry of employment and occupation. The size and distribution of
population dictates the volume of retail floorspace that can be supported in different locations.
Further, the industry of employment, occupation and educational attainment will influence the
types of businesses likely to relocate to Lithgow. For example, technology related businesses
generally seek to locate in areas close to highly skilled workers. In Lithgow’s case, the local skills
profile suggests that the area would be more attractive to employers in labour intensive industries.
Population
Population, both current and future, is one key input to modelling demand for retail floorspace. In
2008, the Lithgow LGA was home to 20,620 people (ABS, 2008).
Estimated Resident Population (ERP) figures, as published by the ABS, provide an indication of
population between the Census years. In each Census year, ERPs are higher than the population as
recorded by the Census, as these take into account people who were not counted as part of the
Census. For example, people who did not complete the Census form for various reasons. Between
2001 and 2008, the ABS Estimated Resident Population suggest that the population has fluctuated
between 20,500 and 20,650 people (Figure 2).
Figure 2. Estimated Resident Populat ion, L i thgow LGA, 2001 to 2008
2001 2002 2003 2004 2005 2006 2007 2008
Lithgow LGA 20,568 20,532 20,535 20,538 20,502 20,553 20,645 20,620
20,400
20,450
20,500
20,550
20,600
20,650
20,700
Source: ABS, 2008

Business and Retail Strategy / Lithgow City Council
April 2010 SGS Final Business and Retail Strategy.doc P. 16
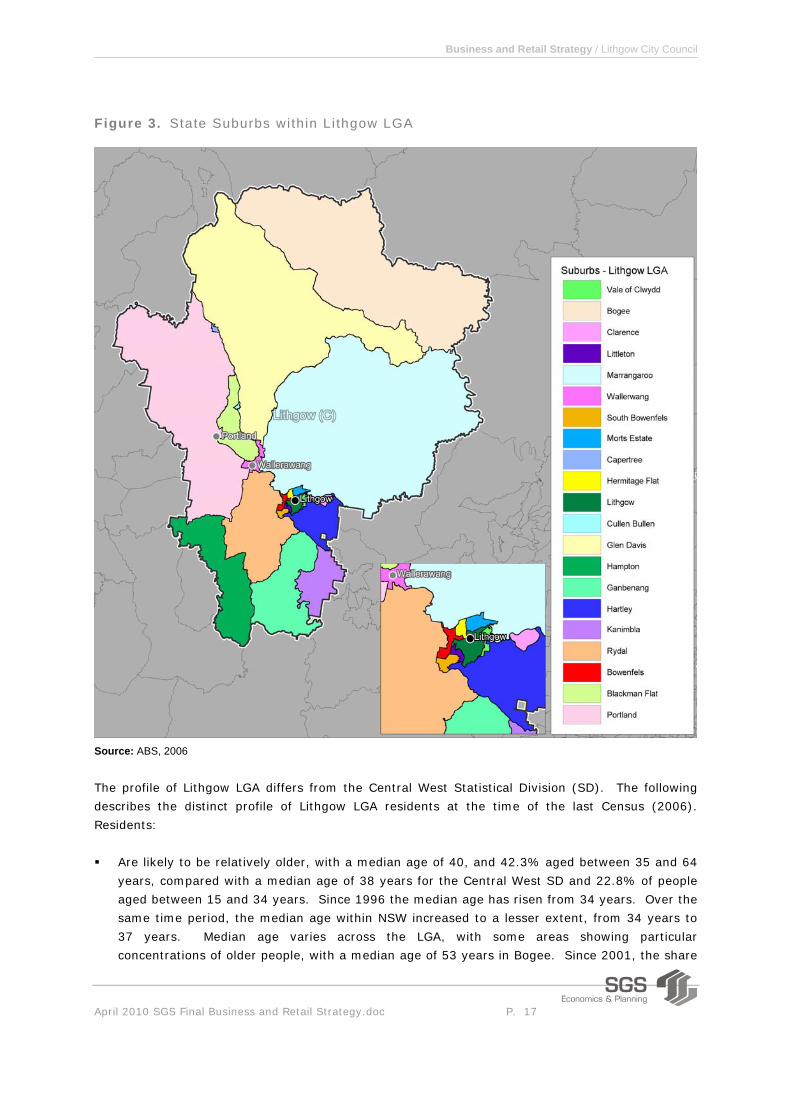
Previously demographic profiling, prepared by Insite indicated that in 2006, the majority of the
population was concentrated within the following suburbs as defined by ABS (Figure 3):
Lithgow (5,577 persons) (It is important to note that Lithgow State Suburb only accounts for
part of the Lithgow urban area, which is also made up by Bowenfels, South Bowenfels,
Littleton, Vale of Clwydd, Hermitage Flat and Morts Estate)
Portland (2,797 persons)
Bowenfels (1,945 persons)
Wallerawang (1,904 persons)
These most populous suburbs – Lithgow, Portland, Bowenfels and Wallerawang - accounted for
over 60% of the population within the LGA.
Business and Retail Strategy / Lithgow City Council
April 2010 SGS Final Business and Retail Strategy.doc P. 17
Figure 3. State Suburbs wi th in L i thgow LGA
Source: ABS, 2006
The profile of Lithgow LGA differs from the Central West Statistical Division (SD). The following
describes the distinct profile of Lithgow LGA residents at the time of the last Census (2006).
Residents:
Are likely to be relatively older, with a median age of 40, and 42.3% aged between 35 and 64
years, compared with a median age of 38 years for the Central West SD and 22.8% of people
aged between 15 and 34 years. Since 1996 the median age has risen from 34 years. Over the
same time period, the median age within NSW increased to a lesser extent, from 34 years to
37 years. Median age varies across the LGA, with some areas showing particular
concentrations of older people, with a median age of 53 years in Bogee. Since 2001, the share

Business and Retail Strategy / Lithgow City Council
April 2010 SGS Final Business and Retail Strategy.doc P. 18
of population aged 25 years to 54 years has decreased. Households consisting of older people,
particularly those of retirement age, generally have lower disposable incomes, thus leading to a
lesser demand for retailing.
Are less likely to be participating in the labour force, with a participation rate of 53.0%,
compared to 58.2% for Central West SD. Lithgow LGA also had a higher rate of unemployment
with 8.5% of the population unemployed in 2006, compared to 3.5% in NSW as a whole.
Households incomes are strongly related to labour force participation rates, thus lower rates of
labour force participation are often associated with lower incomes and relatively less demand
for retailing.
Are less likely to be employed in full-time and part-time work, (30.3% and 15.1% of the
population respectively). This is compared to the Central West SD, which has 34.8% of the
population employed in full-time work, and 16.1% in part-time work. This reflects the older
population and has also implications for household income.
Have a lower median individual income of $353 per week, compared to $389 per week in the
Central West SD. Lithgow LGA also has a lower median household income of $738 per week,
compared to $808 per week in the Central West SD. Generally, Marrangaroo, Hartley,
Kanimbla and Rydal suburbs are more affluent, with relatively higher median individual and
household incomes in 2006.Houshold income has significant implications for local retail in terms
of the total expenditure available locally.
Are less likely to have a non-school qualification, with only 0.7% of the population having
completed a postgraduate degree and 4.9% having a bachelor degree. In the Central West SD
1.2% of the population have completed a postgraduate degree, and 7.2% have a bachelor
degree. As noted above, post school qualifications influence the occupation profile, which in
turn influence income, and available expenditure.
Are most likely to have been born in Australia (9.3% of the population born overseas, which is
slightly higher than 6.9% for the Central West SD). Ethnicity within an area may be indicative
of the type of mix of businesses, particularly in relation to food and dining out.
Are more likely to own their own home, with 42.8% owning their own homes, and a further
28.7% purchasing their homes. Approximately a quarter of the population (24.9%) is renting.
In the Central West SD, 39.9% and 30.1% own their own home and are purchasing their own
home respectively. In Lithgow LGA, a high proportion of households owning their own home is
likely to reflect a range of factors, including relatively affordable property prices and an older
population. A relatively high proportion of households owning their home outright may, in
turn, mean that households have higher disposable incomes.
Are slightly less likely to own a vehicle, with 12.3% of households having no car, compared to
9.4% of households across the Central West SD. This highlights the need to support
alternative means of transport, for example through provision of bicycle parking or community
transport for older people.
In 2006, 11.2% of Lithgow’s resident workforce was employed in the retail trade. In terms of
occupations, 8.9% of Lithgow LGA’s resident workforce were sales workers, in line with the West
Central SD. Since 2001, the occupation characteristics have remained relatively similar however
Business and Retail Strategy / Lithgow City Council
April 2010 SGS Final Business and Retail Strategy.doc P. 19
there has been an increase in people working as labourers. Coal Mining was the most common
occupation in Lithgow LGA in 2006.
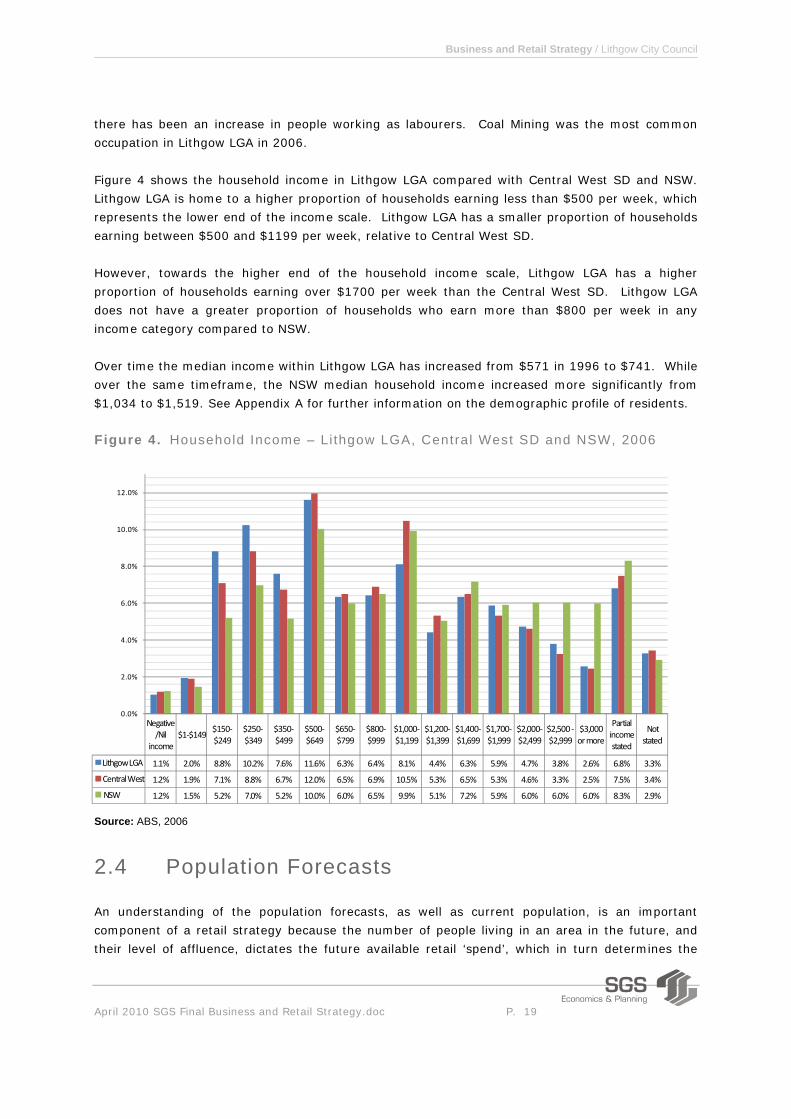
Figure 4 shows the household income in Lithgow LGA compared with Central West SD and NSW.
Lithgow LGA is home to a higher proportion of households earning less than $500 per week, which
represents the lower end of the income scale. Lithgow LGA has a smaller proportion of households
earning between $500 and $1199 per week, relative to Central West SD.
However, towards the higher end of the household income scale, Lithgow LGA has a higher
proportion of households earning over $1700 per week than the Central West SD. Lithgow LGA
does not have a greater proportion of households who earn more than $800 per week in any
income category compared to NSW.
Over time the median income within Lithgow LGA has increased from $571 in 1996 to $741. While
over the same timeframe, the NSW median household income increased more significantly from
$1,034 to $1,519. See Appendix A for further information on the demographic profile of residents.
Figure 4. Household Income – Li thgow LGA, Central West SD and NSW, 2006
Negative/Nil
income$1‐$149
$150‐$249
$250‐$349
$350‐$499
$500‐$649
$650‐$799
$800‐$999
$1,000‐$1,199
$1,200‐$1,399
$1,400‐$1,699
$1,700‐$1,999
$2,000‐$2,499
$2,500 ‐$2,999
$3,000 or more
Partial income stated
Not stated
Lithgow LGA 1.1% 2.0% 8.8% 10.2% 7.6% 11.6% 6.3% 6.4% 8.1% 4.4% 6.3% 5.9% 4.7% 3.8% 2.6% 6.8% 3.3%
Central West 1.2% 1.9% 7.1% 8.8% 6.7% 12.0% 6.5% 6.9% 10.5% 5.3% 6.5% 5.3% 4.6% 3.3% 2.5% 7.5% 3.4%
NSW 1.2% 1.5% 5.2% 7.0% 5.2% 10.0% 6.0% 6.5% 9.9% 5.1% 7.2% 5.9% 6.0% 6.0% 6.0% 8.3% 2.9%
0.0%
2.0%
4.0%
6.0%
8.0%
10.0%
12.0%
Source: ABS, 2006
2.4 Population Forecasts
An understanding of the population forecasts, as well as current population, is an important
component of a retail strategy because the number of people living in an area in the future, and
their level of affluence, dictates the future available retail ‘spend’, which in turn determines the

Business and Retail Strategy / Lithgow City Council
April 2010 SGS Final Business and Retail Strategy.doc P. 20
amount of retail floorspace which can be successfully supported. Strong population growth is most
often correlated with growth in employment, particularly in retailing, services, education and health
care. Static or declining population is often a predictor of static employment or contraction.
A range of population forecasts have been prepared for the Lithgow LGA. NSW Health forecasts
suggest that the population will increase marginally to 2016 then decline5. The 2010 Department
of Planning forecasts indicate population decline to 19,500 in 2036. Further, the Department of
Planning forecasts suggest that the proportion of people aged 65 years and older will increase from
15% in 2006 to 32% in 2036.
In contrast, Lithgow City Council aims to achieve a 1% to 2% growth rate to 2025. This will result
in a population of between 25,000 and 30,000 in 2026. However, historic population trends
indicate that such significant growth is unlikely without considerable intervention or investment
within the region.
Table 1. Populat ion Forecasts
Forecast 2006 2011 2016 2021 2026 2031 2036 Health NSW 20,616 20,689 20,714 20,654 20,485 20,194 19,766
Department of Planning 20,600 20,600 20,600 20,500 20,300 19,900 19,500
1% growth to 2026 20,553 21,601 22,703 23,861 25,079 - -
2% growth to 2026 20,553 22,692 25,054 27,662 30,541 - -
Source: Health NSW, 2009, Department of Planning, 2010, and Lithgow City Council.
2.5 Employment Profile
Employment by industry is one indicator of the economic profile of an area. Current industry
strengths form a base to build upon and are likely to influence future investment. Within Lithgow,
key industries of employment are mining (834 employees), followed by the retail trade (795
employees) and health care and social assistance (675 employees). While mining is an export
industry, both the retail trade and health care and social assistance are driven by local population.
Analysis of occupations indicates a large number of technicians and trades people employed within
the LGA (Table 2). In terms of the retail industry, employees are most likely to be managers or
sales workers. In terms of ‘creative’ employment, at the time of the last Census, only 26 people
were reported as working in creative and performing arts activities, heritage or arts and recreation
services.
The 2006 Census recorded that 85% of people who work in Lithgow LGA also live within the area
(Table 3). When considering retail employees or accommodation and food services employees, the
proportions are even higher (91% and 94% respectively). Within the retail trade, 8% of
employees commute to Lithgow LGA from other locations.
5 http://www.health.nsw.gov.au/reports/population_projections.asp

Business and Retail Strategy / Lithgow City Council
April 2010 SGS Final Business and Retail Strategy.doc P. 21
Table 2. Employment by Industry by Occupat ion wi th in Li thgow LGA
Industry Man
ager
s
Prof
essi
onal
s
Tech
nici
ans
and
Trad
es
Wor
kers
Com
mun
ity a
nd P
erso
nal
Serv
ice
Wor
kers
Cle
rical
and
A
dmin
istr
ativ
e W
orke
rs
Sale
s W
orke
rs
Mac
hine
ry O
pera
tors
A
nd D
river
s
Labo
urer
s
Inad
equa
tely
des
crib
ed
Not
sta
ted
Tota
l
Accommodation and Food Services 89 0 68 152 20 103 7 145 3 4 591 Administrative and Support Services 7 13 13 7 98 0 3 51 0 0 192 Agriculture, Forestry and Fishing 142 0 11 0 3 0 0 34 0 0 190 Arts and Recreation Services 10 14 3 21 0 0 0 5 0 0 53 Construction 31 8 125 3 38 5 58 45 0 0 313 Education and Training 35 307 4 66 43 0 3 19 0 0 477 Electricity, Gas, Water and Waste Services 36 55 183 3 44 0 28 39 6 0 394 Financial and Insurance Services 19 22 3 3 90 4 0 3 0 0 144 Health Care and Social Assistance 23 243 26 252 86 0 0 40 5 0 675 Inadequately described 0 0 14 4 7 0 5 12 0 0 42 Information Media and Telecommunications 3 12 14 0 10 4 0 3 4 0 50 Manufacturing 55 24 158 4 50 20 86 108 8 0 513 Mining 43 40 257 3 29 0 444 15 3 0 834 Other Services 8 13 99 28 26 6 3 37 0 0 220 Professional, Scientific and Technical Services 11 75 23 0 67 0 3 14 0 0 193 Public Administration and Safety 41 68 61 177 197 3 46 31 7 3 634 Rental, Hiring and Real Estate Services 8 3 10 3 14 36 5 3 3 0 85 Retail Trade 140 15 63 13 42 409 16 91 3 3 795 Transport, Postal and Warehousing 28 3 20 0 68 13 173 25 3 0 333 Wholesale Trade 21 6 19 0 12 20 27 11 0 0 116 Not stated 0 0 5 0 0 0 0 3 0 0 8 Total 750 921 1,179 739 944 623 907 734 45 10 6,852
Source: ABS, 2006
Three quarters of Lithgow residents work locally, with the remainder commuting to the Blue
Mountains LGA (6%) Bathurst – Part A Statistical Local Area (4%), Sydney Statistical Division (3%)
or other locations (Table 4). Approximately 16% of Lithgow LGA residents employed in the retail
trade commute outside of the LGA. On the day of the 2006 Census, 4.7% of Lithgow people
employed in Lithgow worked from home, in line with the NSW average of 4.9%.

Business and Retail Strategy / Lithgow City Council
April 2010 SGS Final Business and Retail Strategy.doc P. 22
Table 3. Origin of L i thgow Employees, 2006
Origin Total Retail Trade Accommodation and Food Services
Lithgow (C) 85% 91% 94%
Bathurst Regional (A) - Pt A 3% 2% 1%
Bathurst Regional (A) - Pt B 1% 1% 1%
Blue Mountains (C) 6% 4% 3%
Mid-Western Regional (A) - Pt B 0% 1% 0%
Oberon (A) 0% 0% 1%
Other Statistical Local Areas 1% 1% 1%
Remainder of Central West Statistical Division 0% 0% 0%
Remainder of Sydney Statistical Division 2% 2% 1%
Total 100% 100% 100%
Source: ABS, 2006
Table 4. Dest inat ion of Li thgow Residents, 2006
Destination Total Retail Trade
Accommodation and
Food Services
Lithgow (C) 75% 84% 82%
Bathurst Regional (A) - Pt A 4% 3% 1%
Blue Mountains (C) 6% 6% 9%
Mid-Western Regional (A) - Pt B 1% 0% 0%
Oberon (A) 1% 0% 1%
Penrith (C) - West 0% 1% 0%
Sydney (C) - Inner 0% 0% 0%
Remainder of Central West Statistical Division 0% 1% 0%
Remainder of Sydney Statistical Division 3% 2% 2%
Other Statistical Local Areas 1% 0% 1%
NSW Undefined 1% 0% 0%
No fixed address 3% 0% 0%
Not stated 4% 2% 3%
Total 100% 100% 100%
Source: ABS, 2006
Within Lithgow LGA there a higher number of employed residents than there are jobs. As such
some residents are obliged to commute outside the LGA for work. Table 5 shows the net result
when resident employment, by industry and occupation, is compared with the profile of local jobs.
Overall Lithgow LGA ‘exports’ 865 workers. The area ‘imports’ workers for the mining industry,
and ‘exports’ construction employees. The LGA has an over-supply of labourers and trades
workers and an under-supply of professionals.

Business and Retail Strategy / Lithgow City Council
April 2010 SGS Final Business and Retail Strategy.doc P. 23
Table 5. Dest inat ion of Li thgow Residents, 2006
Industry Man
ager
s
Prof
essi
onal
s
Tech
nici
ans
and
Trad
es W
orke
rs
Com
mun
ity a
nd
Pers
onal
Ser
vice
W
orke
rs
Cle
rical
and
A
dmin
istr
ativ
e W
orke
rs
Sale
s W
orke
rs
Mac
hine
ry O
pera
tors
A
nd D
river
s
Labo
urer
s
Inad
equa
tely
de
scrib
ed
Not
sta
ted
Tota
l
Accommodation and Food Services 12 0 14 23 5 0 2 24 0 2 82 Administrative and Support Services 1 5 5 4 -3 0 3 37 0 0 52 Agriculture, Forestry and Fishing 46 6 6 0 0 3 3 5 0 3 72 Arts and Recreation Services 0 6 3 1 6 0 3 1 0 0 20 Construction 17 -2 79 3 0 4 15 47 0 0 163 Education and Training -2 -31 5 4 5 0 6 0 0 0 -13 Electricity, Gas, Water and Waste Services -6 -15 4 1 1 0 -1 10 1 0 -5 Financial and Insurance Services -2 -5 1 0 2 -1 0 5 0 0 0 Health Care and Social Assistance -2 1 -2 71 14 0 0 7 0 0 89 Inadequately described 0 4 -1 2 5 0 3 13 3 0 29 Information Media and Telecommunications 3 -2 4 0 3 2 0 0 -1 0 9 Manufacturing -4 -5 45 2 7 2 27 41 1 0 116 Mining -11 -14 -22 0 -1 0 -11 -4 0 0 -63 Not stated 4 7 3 3 0 0 3 4 7 44 75 Other Services 0 4 29 0 1 0 4 2 0 0 40 Professional, Scientific and Technical Services -1 11 3 0 10 0 4 -2 0 0 25 Public Administration and Safety -4 2 7 -8 -17 3 12 11 -1 0 5 Rental, Hiring and Real Estate Services 6 1 -3 0 2 -6 0 3 -3 0 0 Retail Trade 4 -3 4 3 9 43 2 2 3 1 68 Transport, Postal and Warehousing 2 0 -1 6 10 4 37 12 -3 3 70 Wholesale Trade 8 -3 6 0 3 10 -2 2 3 4 31 Total 71 -33 189 115 62 64 110 220 10 57 865
Source: ABS, 2006
ABS data on business size and turnover is available for businesses registered in Lithgow. This data
indicates that half of the businesses in Lithgow record an annual turnover of less than $100,000.
However 72% of retail businesses have turnovers greater than $100,000 p.a. Within Lithgow LGA,
174 businesses were recorded within the retail trade, of which the majority employ less than five
people (Table 6). It is important to note that for large companies it is possible that business
located in Lithgow LGA may be registered in another location, such as where the company’s head
office is located. Never the less, this data does provide a good indication of the mix and size of
local businesses.

Business and Retail Strategy / Lithgow City Council
April 2010 SGS Final Business and Retail Strategy.doc P. 24
Table 6. Li thgow LGA Business Counts by Industry and Employees, 2007
Industry Non employing 1-4 5-19 20-49 50-99 100-199 200+ Total A Agriculture Forestry And Fishing 213 27 3 243 B Mining 6 3 0 0 0 0 9 C Manufacturing 36 18 18 6 0 78 E Construction 138 60 15 0 213 F Wholesale Trade 6 3 3 3 15 G Retail Trade 69 63 33 9 0 0 174 H Accommodation Cafes And Restaurants 18 27 21 6 3 75 I Transport And Storage 48 24 0 6 0 78 J Communication Services 6 12 0 18 K Finance And Insurance 24 6 9 39 L Property And Business Services 99 60 18 9 0 0 186 N Education 0 0 3 3 O Health And Community Services 21 18 6 3 0 0 48 P Cultural And Recreational Services 24 3 3 30 Q Personal And Other Services 15 9 3 27 Total 723 333 135 36 6 3 0 1,236
Source: ABS, 2007
2.6 Location Quotient Analysis
The relative strengths of different industries within the LGA can be reviewed using a Location
Quotient (LQ) industry analysis. Understanding existing industry strengths is an important
consideration in assessing future opportunities for the area. Journey to Work data, at a one digit
level has been used to examine the relative strengths of Lithgow LGA (Table 7).
A location quotient is calculated by dividing the proportion of local jobs within a particular industry
by the proportion of jobs within that industry across NSW. If the proportion of jobs in a local
industry is higher than the average, the industry will show a location quotient of greater than 1.
This indicates that the local industry is relatively strong with a local specialisation, and suggests
that the industry is ‘export focused’, serving markets beyond the local area.
The location quotient analysis serves as a filter to identify industries of comparative strength for
additional consideration and analysis. For the purposes of comparison, Cessnock, Kiama and
Singleton have also been considered. While Kiama and Singleton are a similar distance from
Sydney and have similar populations (20,258 and 23,458 respectively), Cessnock is considered by
Council to have similar characteristics to Lithgow.
Within Lithgow LGA, the stand out industry is Mining which, within Lithgow, accounts for 33.5 times
the NSW average share of jobs. Other strengths include Agriculture, Forestry and Fishing and
Electricity, Gas, Water and Waste Services with LQs of 5.3 and 6.4 respectively. In terms of
retailing, Lithgow accommodates a slightly higher share of retail jobs than the NSW average, but
less than Cessnock and Kiama LGAs.

Business and Retail Strategy / Lithgow City Council
April 2010 SGS Final Business and Retail Strategy.doc P. 25
Financial and Insurance Services, Professional, Scientific and Technical Services and Administrative
and Support Services (traditional commercial floorspace users) are all under-represented in
Lithgow, Cessnock, Kiama and Singleton.
Table 7. Locat ion Quotient Analys is, 1 dig i t , 2006
Industry Lithgow Cessnock Kiama Singleton
A Agriculture, Forestry and Fishing 5.3 5.6 6.8 8.2
B Mining 33.5 6.2 0.0 84.9
C Manufacturing 0.8 1.6 0.3 0.7
D Electricity, Gas, Water and Waste Services 6.4 0.4 0.3 2.1
E Construction 0.6 0.8 1.2 0.7
F Wholesale Trade 0.3 0.4 0.3 0.6
G Retail Trade 1.1 1.4 1.3 0.8
H Accommodation and Food Services 1.4 2.3 2.7 0.8
I Transport, Postal and Warehousing 0.9 0.6 0.7 0.6
J Information Media and Telecommunications 0.3 0.2 0.3 0.2
K Financial and Insurance Services 0.4 0.2 0.4 0.2
L Rental, Hiring and Real Estate Services 0.7 0.7 1.5 0.9
M Professional, Scientific and Technical Services 0.3 0.4 0.7 0.4
N Administrative and Support Services 0.8 0.8 0.7 0.8
O Public Administration and Safety 1.6 0.9 1.2 1.1
P Education and Training 1.0 1.1 1.2 0.6
Q Health Care and Social Assistance 1.0 1.0 1.1 0.4
R Arts and Recreation Services 0.6 0.8 1.5 0.3
S Other Services 0.9 1.3 1.1 1.4
T Inadequately Described 0.5 0.8 0.6 0.9
X Not Stated 0.1 0.1 0.1 0.1
Source: TDC, 2006
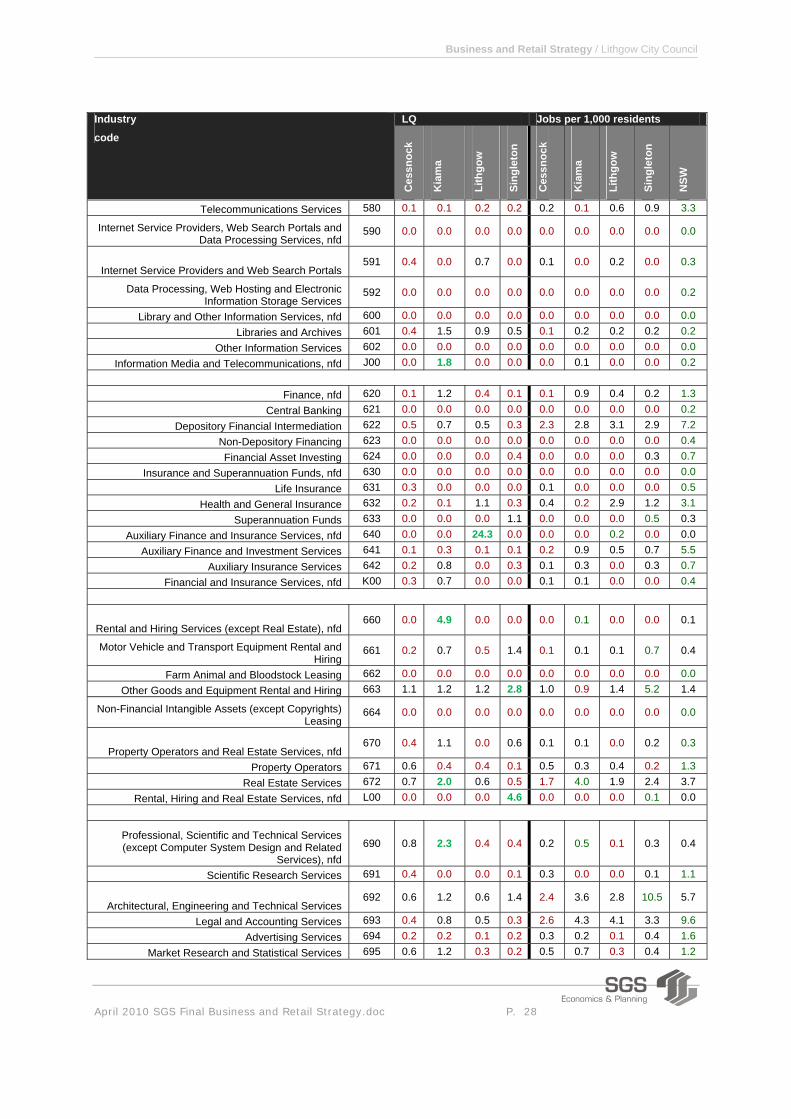
Table 8 provides an in-depth location quotient analysis, at a 3 digit industry level, for retailing and
industry groups most likely to use commercial floorspace. In terms of retailing, when compared to
NSW, Lithgow has a relatively high representation of people employed in fuel retailing and other
store based retailing (not further defined).
At face value, it would appear that retail employment within the following industries is under-
represented, with LQs less than 1 within Lithgow LGA:
• Furniture, Floor Coverings, Houseware and Textile Goods Retailing
• Electrical and Electronic Goods Retailing
• Clothing, Footwear and Personal Accessory Retailing

Business and Retail Strategy / Lithgow City Council
April 2010 SGS Final Business and Retail Strategy.doc P. 26
However, these industries account for a similar share of employment in Cessnock, Kiama and
Singleton LGAs.

Business and Retail Strategy / Lithgow City Council
April 2010 SGS Final Business and Retail Strategy.doc P. 27
Table 8. Locat ion Quotient Analys is, 3 dig i t , 2006
LQ Jobs per 1,000 residents Industry
code
Ces
snoc
k
Kia
ma
Lith
gow
Sing
leto
n
Ces
snoc
k
Kia
ma
Lith
gow
Sing
leto
n
NSW
Motor Vehicle and Motor Vehicle Parts Retailing, nfd 390 4.7 0.0 0.0 0.0 0.1 0.0 0.0 0.0 0.0
Motor Vehicle Retailing 391 1.5 0.5 1.4 1.2 2.4 0.7 2.9 4.0 2.4 Motor Vehicle Parts and Tyre Retailing 392 2.0 0.3 1.2 1.7 1.1 0.1 0.8 1.9 0.8
Fuel Retailing 400 2.1 1.4 1.7 1.3 1.7 0.9 1.8 2.2 1.3 Food Retailing, nfd 410 0.4 0.7 0.4 0.2 0.1 0.1 0.1 0.1 0.4
Supermarket and Grocery Stores 411 1.5 1.8 1.3 0.9 8.5 8.3 9.7 10.8 8.7 Specialised Food Retailing 412 2.6 1.7 1.0 0.7 7.4 3.9 3.8 4.3 4.3
Other Store-Based Retailing, nfd 420 1.5 1.3 1.7 1.0 0.3 0.2 0.4 0.4 0.3
Furniture, Floor Coverings, Houseware and Textile Goods Retailing
421 0.7 0.6 0.5 0.5 0.8 0.6 0.7 1.2 1.9
Electrical and Electronic Goods Retailing 422 0.4 0.4 0.5 0.5 0.7 0.5 1.2 2.0 2.8
Hardware, Building and Garden Supplies Retailing 423 1.1 1.6 1.2 0.7 1.6 2.0 2.3 2.1 2.3
Recreational Goods Retailing 424 1.0 2.5 1.0 0.3 1.6 3.4 2.2 1.2 2.5
Clothing, Footwear and Personal Accessory Retailing
425 0.7 1.1 0.7 0.5 2.6 3.2 3.0 3.7 5.5
Department Stores 426 1.4 0.0 0.9 1.1 3.0 0.0 2.5 4.9 3.4
Pharmaceutical and Other Store-Based Retailing 427 1.4 1.7 1.3 0.7 4.8 4.8 5.8 5.0 5.3
Non-Store Retailing and Retail Commission-Based Buying and/or Selling, nfd
430 0.0 0.0 0.0 0.0 0.0 0.0 0.0 0.0 0.0
Non-Store Retailing 431 0.6 0.8 0.6 0.3 0.1 0.1 0.2 0.1 0.4 Retail Commission-Based Buying and/or Selling 432 0.0 0.0 0.0 0.0 0.0 0.0 0.0 0.0 0.0
Retail Trade, nfd G00 1.0 1.1 0.9 0.5 1.5 1.3 1.7 1.7 2.3
Accommodation 440 4.5 3.8 1.1 0.9 14.3 10.0 4.6 5.7 4.9 Food and Beverage Services, nfd 450 0.9 1.8 0.9 0.7 0.3 0.4 0.3 0.4 0.5
Cafes, Restaurants and Takeaway Food Services 451 1.5 2.3 1.3 0.7 13.9 17.8 15.6 13.7 14.2
Pubs, Taverns and Bars 452 2.4 1.5 1.3 0.9 4.8 2.5 3.4 3.8 3.0 Clubs (Hospitality) 453 1.3 2.8 1.5 0.5 2.9 5.0 4.3 2.0 3.3
Accommodation and Food Services, nfd H00 4.5 0.0 0.0 0.0 0.1 0.0 0.0 0.0 0.0
Publishing (except Internet and Music Publishing), nfd
540 0.0 0.0 0.0 0.0 0.0 0.0 0.0 0.0 0.1
Newspaper, Periodical, Book and Directory Publishing
541 0.3 0.9 0.5 0.2 0.6 1.3 1.1 0.6 2.6
Software Publishing 542 0.0 0.0 0.0 0.0 0.0 0.0 0.0 0.0 0.0
Motion Picture and Sound Recording Activities, nfd 550 0.0 0.0 0.0 0.0 0.0 0.0 0.0 0.0 0.0
Motion Picture and Video Activities 551 0.2 0.3 0.3 0.6 0.2 0.2 0.3 0.9 1.1 Sound Recording and Music Publishing 552 0.0 4.1 0.0 0.0 0.0 0.1 0.0 0.0 0.1
Broadcasting (except Internet), nfd 560 0.0 0.0 0.0 0.0 0.0 0.0 0.0 0.0 0.0 Radio Broadcasting 561 0.0 0.0 1.1 0.0 0.0 0.0 0.2 0.0 0.3
Television Broadcasting 562 0.0 0.3 0.0 0.0 0.0 0.1 0.0 0.0 1.1 Internet Publishing and Broadcasting 570 0.0 0.0 0.0 0.0 0.0 0.0 0.0 0.0 0.1
Business and Retail Strategy / Lithgow City Council
April 2010 SGS Final Business and Retail Strategy.doc P. 28
LQ Jobs per 1,000 residents Industry
code
Ces
snoc
k
Kia
ma
Lith
gow
Sing
leto
n
Ces
snoc
k
Kia
ma
Lith
gow
Sing
leto
n
NSW
Telecommunications Services 580 0.1 0.1 0.2 0.2 0.2 0.1 0.6 0.9 3.3
Internet Service Providers, Web Search Portals and Data Processing Services, nfd
590 0.0 0.0 0.0 0.0 0.0 0.0 0.0 0.0 0.0
Internet Service Providers and Web Search Portals 591 0.4 0.0 0.7 0.0 0.1 0.0 0.2 0.0 0.3
Data Processing, Web Hosting and Electronic Information Storage Services
592 0.0 0.0 0.0 0.0 0.0 0.0 0.0 0.0 0.2
Library and Other Information Services, nfd 600 0.0 0.0 0.0 0.0 0.0 0.0 0.0 0.0 0.0 Libraries and Archives 601 0.4 1.5 0.9 0.5 0.1 0.2 0.2 0.2 0.2
Other Information Services 602 0.0 0.0 0.0 0.0 0.0 0.0 0.0 0.0 0.0 Information Media and Telecommunications, nfd J00 0.0 1.8 0.0 0.0 0.0 0.1 0.0 0.0 0.2
Finance, nfd 620 0.1 1.2 0.4 0.1 0.1 0.9 0.4 0.2 1.3
Central Banking 621 0.0 0.0 0.0 0.0 0.0 0.0 0.0 0.0 0.2 Depository Financial Intermediation 622 0.5 0.7 0.5 0.3 2.3 2.8 3.1 2.9 7.2
Non-Depository Financing 623 0.0 0.0 0.0 0.0 0.0 0.0 0.0 0.0 0.4 Financial Asset Investing 624 0.0 0.0 0.0 0.4 0.0 0.0 0.0 0.3 0.7
Insurance and Superannuation Funds, nfd 630 0.0 0.0 0.0 0.0 0.0 0.0 0.0 0.0 0.0 Life Insurance 631 0.3 0.0 0.0 0.0 0.1 0.0 0.0 0.0 0.5
Health and General Insurance 632 0.2 0.1 1.1 0.3 0.4 0.2 2.9 1.2 3.1 Superannuation Funds 633 0.0 0.0 0.0 1.1 0.0 0.0 0.0 0.5 0.3
Auxiliary Finance and Insurance Services, nfd 640 0.0 0.0 24.3 0.0 0.0 0.0 0.2 0.0 0.0 Auxiliary Finance and Investment Services 641 0.1 0.3 0.1 0.1 0.2 0.9 0.5 0.7 5.5
Auxiliary Insurance Services 642 0.2 0.8 0.0 0.3 0.1 0.3 0.0 0.3 0.7 Financial and Insurance Services, nfd K00 0.3 0.7 0.0 0.0 0.1 0.1 0.0 0.0 0.4
Rental and Hiring Services (except Real Estate), nfd 660 0.0 4.9 0.0 0.0 0.0 0.1 0.0 0.0 0.1
Motor Vehicle and Transport Equipment Rental and Hiring
661 0.2 0.7 0.5 1.4 0.1 0.1 0.1 0.7 0.4
Farm Animal and Bloodstock Leasing 662 0.0 0.0 0.0 0.0 0.0 0.0 0.0 0.0 0.0 Other Goods and Equipment Rental and Hiring 663 1.1 1.2 1.2 2.8 1.0 0.9 1.4 5.2 1.4
Non-Financial Intangible Assets (except Copyrights) Leasing
664 0.0 0.0 0.0 0.0 0.0 0.0 0.0 0.0 0.0
Property Operators and Real Estate Services, nfd 670 0.4 1.1 0.0 0.6 0.1 0.1 0.0 0.2 0.3
Property Operators 671 0.6 0.4 0.4 0.1 0.5 0.3 0.4 0.2 1.3 Real Estate Services 672 0.7 2.0 0.6 0.5 1.7 4.0 1.9 2.4 3.7
Rental, Hiring and Real Estate Services, nfd L00 0.0 0.0 0.0 4.6 0.0 0.0 0.0 0.1 0.0
Professional, Scientific and Technical Services (except Computer System Design and Related
Services), nfd 690 0.8 2.3 0.4 0.4 0.2 0.5 0.1 0.3 0.4
Scientific Research Services 691 0.4 0.0 0.0 0.1 0.3 0.0 0.0 0.1 1.1
Architectural, Engineering and Technical Services 692 0.6 1.2 0.6 1.4 2.4 3.6 2.8 10.5 5.7
Legal and Accounting Services 693 0.4 0.8 0.5 0.3 2.6 4.3 4.1 3.3 9.6 Advertising Services 694 0.2 0.2 0.1 0.2 0.3 0.2 0.1 0.4 1.6
Market Research and Statistical Services 695 0.6 1.2 0.3 0.2 0.5 0.7 0.3 0.4 1.2

Business and Retail Strategy / Lithgow City Council
April 2010 SGS Final Business and Retail Strategy.doc P. 29
LQ Jobs per 1,000 residents Industry
code
Ces
snoc
k
Kia
ma
Lith
gow
Sing
leto
n
Ces
snoc
k
Kia
ma
Lith
gow
Sing
leto
n
NSW
Management and Related Consulting Services 696 0.3 0.9 0.2 0.6 0.6 1.4 0.5 2.1 2.8 Veterinary Services 697 1.2 2.2 1.2 1.0 0.5 0.7 0.6 0.8 0.6
Other Professional, Scientific and Technical Services
699 0.4 0.7 0.6 0.6 0.2 0.2 0.3 0.5 0.6
Computer System Design and Related Services 700 0.2 0.4 0.1 0.2 0.6 1.4 0.5 1.4 5.9
Professional, Scientific and Technical Services, nfd M00 0.0 0.0 0.0 1.7 0.0 0.0 0.0 0.2 0.1
Administrative Services, nfd 720 0.0 0.0 0.0 0.0 0.0 0.0 0.0 0.0 0.0
Employment Services 721 0.7 0.5 0.4 1.2 1.5 0.8 1.1 5.6 3.4 Travel Agency and Tour Arrangement Services 722 0.7 0.7 0.3 0.2 0.7 0.6 0.3 0.5 1.6
Other Administrative Services 729 0.5 1.1 2.9 0.4 0.7 1.2 4.8 1.1 2.0
Building Cleaning, Pest Control and Other Support Services, nfd
730 0.0 0.0 0.0 0.0 0.0 0.0 0.0 0.0 0.0
Building Cleaning, Pest Control and Gardening Services
731 1.0 0.9 0.8 1.0 3.1 2.4 3.3 6.4 4.9
Packaging Services 732 2.6 0.0 0.0 1.9 0.4 0.0 0.0 0.6 0.3 Administrative and Support Services, nfd N00 0.0 0.0 0.0 0.0 0.0 0.0 0.0 0.0 0.0
Public Administration, nfd 750 0.3 0.0 0.8 0.4 0.1 0.0 0.2 0.2 0.4
Central Government Administration 751 0.4 0.0 0.5 0.2 0.8 0.0 1.4 0.8 3.1 State Government Administration 752 0.3 0.3 1.5 0.4 1.0 0.9 6.6 2.5 5.1 Local Government Administration 753 1.4 4.2 1.7 1.0 4.9 12.4 7.8 7.3 5.4
Justice 754 0.2 0.0 0.3 0.0 0.1 0.0 0.2 0.0 0.8 Government Representation 755 0.0 0.0 0.0 0.0 0.0 0.0 0.0 0.0 0.0
Defence 760 0.0 0.0 0.3 5.2 0.0 0.0 0.6 18.0 2.6
Public Order, Safety and Regulatory Services, nfd 770 0.0 0.0 0.0 0.0 0.0 0.0 0.0 0.0 0.0
Public Order and Safety Services 771 1.5 0.2 2.8 0.5 5.9 0.7 13.7 3.6 5.9 Regulatory Services 772 0.0 0.0 0.0 0.0 0.0 0.0 0.0 0.0 0.2
Public Administration and Safety, nfd O00 0.0 0.0 0.0 0.0 0.0 0.0 0.0 0.0 0.1
Source: TDC, 2006, ABS, 2008
In terms of accommodation and food services, Cessnock and Kiama have a greater concentration
of employment, compared to Lithgow. This is driven by the wine industry within Cessnock, and the
coast, an attraction for tourists within the Kiama LGA. However, Lithgow does have a relative
concentration of employment in Clubs (hospitality). Over the longer term accommodation and food
services may be an industry of opportunity for Lithgow, capitalising on local heritage, existing
attractions and proximity to much of the Blue Mountains.
Across the industry categories of ‘Information Media and Telecommunications’, ‘Financial and
Insurance Services’ and ‘Professional, Scientific and Technical Services’, Lithgow, like Cessnock,
Kiama and Singleton, has low a concentration of employment. The exception is Auxiliary Finance
and Insurance Services, nfd within Lithgow, which has an LQ of 24.3, but only accounts for 11
jobs. Similarly Lithgow has an LQ of 2.9 for Other Administrative Services, accounting for 100 jobs.

Business and Retail Strategy / Lithgow City Council
April 2010 SGS Final Business and Retail Strategy.doc P. 30
While Lithgow LGA is not a strong performer in the industries considered above, aside from
accommodation and food services there are no clear areas where Lithgow lags behind Cessnock,
Singleton or Kiama, and hence no clear opportunities to ‘catch up’ have been identified.
2.7 Tourism in Lithgow and the Blue Mountains
From 2004 to 2005 across Australia, domestic visitors generated 76% of the tourism industry’s
gross domestic product. However, a decline in nights, expenditure and the number of trips are the
biggest changes occurring to domestic tourism6. This is evident by tourism’s declining proportion
of household consumption: 14.3% in 2005, down from 16.3% in 19987.
More recently, domestic tourism has also been declining within the Blue Mountains. From July
2008 to June 2009 the Blue Mountains Tourism Region (TR) (consisting of Blue Mountains, Lithgow
and Oberon LGAs) received 605,000 domestic overnight visitors, which was down from the
previous 12 months by 7.4%8. Holiday or leisure were both the main reasons for visitors (61.3%)
and nights stayed (60.6%) in the region. In terms of domestic overnight travel, the region
received 84.5% of visitors from intrastate, and 15.5% from interstate. For nights stayed, 78.9%
were from interstate, and 21.1% from interstate9.
The Blue Mountains TR received 76,000 international overnight visitors from July 2008 to June
2009. This was a 5.1% increase from the previous 12 month period. The Blue Mountains TR also
received nearly 1.9 million domestic daytrip visitors for the same period10.
On average, Lithgow LGA received 123,000 domestic overnight visitors per year for the three years
up to 2007, with each domestic overnight visitor, on average, spending $217 per trip and staying
2.4 nights11. This is compared to the Blue Mountains Tourism Region which received 654,000
domestic overnight visitors, each spending $322 per trip and staying two nights12.
Lithgow LGA received less than one tenth of the total Blue Mountains domestic day visitors.
Lithgow LGA received 181,000 day visitors per year on average spending $6813, compared to
1,898,000 for the Blue Mountains TR, with day visitors on average spending $75 per trip14.
6 Tourism Research Australia (2006) An Assessment of the Australian Domestic Tourism Market, Tourism Australia, p.1. 7 Tourism Research Australia (2006) An Assessment of the Australian Domestic Tourism Market, Tourism Australia, p.3. 8 Tourism New South Wales (2009) Travel to Blue Mountains year ending June 2009 from Tourism Research Australia (2009) National Visitor Survey, Tourism Research Australia. 9 ibid. 10 ibid. 11 Tourism Research Australia (2008)Tourism Profiles for Local Government Areas in Regional Australia New South Wales-City of Lithgow, Tourism Australia. 12 Tourism Research Australia (2008) Regional Tourism Profiles 2007 New South Wales-Blue Mountains region, Tourism Australia. 13 Tourism Research Australia (2008)Tourism Profiles for Local Government Areas in Regional Australia New South Wales-City of Lithgow, Tourism Australia.

Business and Retail Strategy / Lithgow City Council
April 2010 SGS Final Business and Retail Strategy.doc P. 31
For domestic overnight visitors travelling to Lithgow LGA, 105,000 travelled by private car, with the
remaining 18,000 travelling by other means. The main purpose for people visiting Lithgow was
holiday or leisure (42.7%), followed by visiting friends or relatives (33.9%), and 23.4% for other
reasons15. For people visiting the Blue Mountains TR the main purpose was holiday or leisure
(52.5%), followed by visiting friends or relatives (40.1%), and 7.3% for other reasons16.
Table 1 shows that 16.4% of Lithgow LGA’s visitors were from interstate, compared to 10.9% for
the Blue Mountain TR. In Lithgow 83.6% of travellers were from intrastate compared to 89.1% for
the Blue Mountains. In September 2009 Tourism Research Australia published a summary of the
Greater Blue Mountains Natural Attractions Project Destination Visitor Survey. It showed the main
reasons that people chose to visit the Blue Mountains is to experience nature (34%), because there
is a variety of things to see and do (33%), and to visit specific attractions (33%). Overall, the
average stay in the Blue Mountains is for two nights.
The secondary strengths of the Blue Mountains are its cultural and historical aspects. These
attractions were appreciated mostly by repeat Sydney-based visitors, with many other intrastate
and interstate visitors unaware of the cultural and historical offers of the Blue Mountains17.
Average annual growth for culture and heritage tourism, across Australia, has been between 1%
and 3% per annum in recent years. The increasing importance of heritage tourism is one trend on
which Lithgow can capitalise. Table 9. Tour ism Stat is t ics, 2007
Lithgow LGA Blue Mountain Tourism Region
Domestic Overnight Visitors 123,000 654,000
Average Expenditure per trip $217 $322
Average Stay (nights) 2.4 2.0
Domestic Day Visitors 181,000 1,898,000
Average Spend per trip $68 $75
Domestic Overnight Visitors - Method of Travel Private Car 85.4% 88.8%
Other 14.6% 11.2%
Domestic Overnight Visitors - Purpose of Visit Holiday/leisure 42.7% 52.5%
Visiting friends/relatives 33.9% 40.1%
Other 23.4% 7.3%
Domestic Overnight Visitors - Origin of Visitors
14 Tourism Research Australia (2008) Regional Tourism Profiles 2007 New South Wales-Blue Mountains region, Tourism Australia. 15 Tourism Research Australia (2008)Tourism Profiles for Local Government Areas in Regional Australia New South Wales-City of Lithgow, Tourism Australia. 16 Tourism Research Australia (2008) Regional Tourism Profiles 2007 New South Wales-Blue Mountains region, Tourism Australia. 17 Tourism Research Australia (2009) Destination Visitor Survey-Greater Blue Mountains Natural Attractions Project: Summary of Results, Tourism Australia.

Business and Retail Strategy / Lithgow City Council
April 2010 SGS Final Business and Retail Strategy.doc P. 32
Interstate 16.4% 10.9%
Intrastate 83.6% 89.1%
Source: Tourism Research Australia, 2007
3 Lithgow’s Centre Hierarchy
Lithgow, Wallerawang and Portland are business and service centres, as well as being places for
residents to meet and socialise.
This section of the document details the current function of the centres within Lithgow LGA: their
location; character; mix of business; supply of retail floorspace; and, catchment size. Strengths,
weaknesses, opportunities and threats for each of these centres are considered. Strengths and
weaknesses define the character and condition of the subject area and are inherently internal
factors. External opportunities and threats are factors or forces that operate beyond the local
supply side and influence how the subject can change over time.
3.1 Lithgow: Subregional Centre
Location
Lithgow Centre is located along the train line, just off the Great Western Highway. People
travelling west from Sydney, via the Bells Line Road, travel through Lithgow Centre. Located
within a valley, there are natural boundaries for growth in this centre.
Character
Lithgow is the principal centre within Lithgow LGA, accommodating local government and some
state government agencies. The Lithgow Centre consists of two separate precincts, Lithgow Main
Street and Lithgow Valley Plaza/Pottery Estate. Figure 5 illustrates the relative location of these
two precincts and Figure 6 illustrates the distance between them. The main street and plaza are
separated by land uses that are not likely to ever be converted to retail (a church, school and
residences). The separation distance of 400m (as well as the change in grade) means that the
plazas will always provide a distinct and different retail experience to the main street. The plazas
should be restricted to retail uses including bulky goods, within the currently approved floorspace.
Retail survey results conducted in November 2009 indicated that shoppers in Lithgow appreciated
the convenience and familiarity of shopping there. They enjoy the friendliness and ease of parking,
as well as relatively cheaper prices and the availability of most products. On the other hand, some
shoppers stated that there was ‘nothing’ or ‘not much’ that they liked about Lithgow. Shoppers
had a range of suggestions on how Lithgow could be improved:
Providing for more large scale retailers such as Big W or Bunnings (these were reasons why
shoppers travelled to Bathurst)
More things for children and teenagers to do

Business and Retail Strategy / Lithgow City Council
April 2010 SGS Final Business and Retail Strategy.doc P. 33
Longer trading hours on the weekend, including a broader range of eateries, and more footpath
cafes
Improving baby change facilities
Preserving heritage buildings
Encouraging business start-ups
Finding alternative uses for vacant shops
Encouraging more people to shop locally
Improving the appearance of Main Street
Industry development
Attract a department store, more women’s clothes, shoes and furniture retailers
Advertising local services
Consider making Main Street one way to allow for additional parking.
In September 2009, a business survey was carried out. Some respondents suggested that there
was a lack of appropriately sized floorspace within Lithgow Main Street, with many of the vacant
properties considered too small. Business survey respondents also noted that further cafes,
clothing retailers and variety stores were needed within Lithgow town centre. Similarly, 37% of
respondents identified having a cinema, and 36% an indoor pool, as being important entertainment
facilities for Lithgow. It is unlikely that a commercial cinema will reopen, as these often require a
catchment of 70,000 people to remain viable.
Discussions with a local real estate agent suggest that rents are in the order of $150/sqm p.a. for
retail floorspace, while commercial floorspace is leased for approximately $120 - $130 sqm p.a.
Public transport includes a bus connecting Lithgow with Bathurst, and the rail line.
Release areas in proximity to Lithgow Centre include South Bowenfels, located primarily on the
western side of the Great Western Highway. This land will contain housing to be developed with
traditional suburban densities. Further, potential land development is also identified in the West
Bowenfels area. The need for neighbourhood retailing to support these centres is considered in
Section 4.1.
Industrial land is dispersed throughout the town of Lithgow, with no defined industrial precinct.
Land use conflicts have been reported between existing industrial areas and surrounding residential
development.
Previous analysis prepared by Insite considered that current vacancies indicated a lack of demand
within the CBD and Pottery Estate, but an undersupply at Lithgow Valley Plaza (Appendix E).
However, SGS recommends that in terms of supply and demand, these areas should be considered
as a whole. In which case, an oversupply within Lithgow centre can be demonstrated. Demand for
retailing is considered in Section 4.

Business and Retail Strategy / Lithgow City Council
April 2010 SGS Final Business and Retail Strategy.doc P. 34
Centre Catchment
Lithgow Centre acts as a sub regional centre. In its role as a sub regional centre Lithgow attracts
shoppers from across the LGA and further afield. Residents of the suburb of Lithgow accounted for
59% of shoppers within Lithgow Centre. Of the total SGS’s retail survey respondents, 9% had
travelled from outside the LGA to shop within Lithgow LGA. However, it is important to note that
residents were more likely to complete the survey when approached.
In terms of acting as a sub regional centre, data provided by Lithgow Valley Plaza indicates that
some shoppers travel from locations such as Blackheath, Mt Victoria and Katoomba, as well as
Bathurst, Oberon and Mudgee, with up to 14% of shoppers coming from outside the LGA. Aldi,
within the Pottery Plaza, has been identified as one key attractor for people visiting Lithgow to shop
(however, this may change with the opening of an Aldi in Katoomba in March 2010). For the
purpose of retail modelling, it has been assumed that 10% of retailing originates from outside of
the LGA (Section 4).
As well as a sub regional role, the centre also acts as a local centre for residents living within
walking distance, or a short drive, Lithgow LGA. It is a destination for local shopping, that is, where
residents would purchase things such as milk and bread, the newspaper, or go to the post office.
SGS estimates that there are around 13,400 shoppers within Lithgow’s local catchment, consisting
of the State Suburbs (see Figure 3) of Bowenfels, Clarence, Ganbenang, Hartley, Hermitage Flat,
Lithgow, Littleton, Morts Estate, Rydal, South Bowenfels and Vale of Clywdd.

Business and Retail Strategy / Lithgow City Council
April 2010 SGS Final Business and Retail Strategy.doc P. 35
Figure 5. Li thgow Main Street and Li thgow Val ley Plaza: Zoning and Aer ia l Photo

Business and Retail Strategy / Lithgow City Council
April 2010 SGS Final Business and Retail Strategy.doc P. 36
Figure 6. Li thgow: Dist inct retai l and business
Figure 7. Topographic and landscape context

Business and Retail Strategy / Lithgow City Council
April 2010 SGS Final Business and Retail Strategy.doc P. 37

Business and Retail Strategy / Lithgow City Council
April 2010 SGS Final Business and Retail Strategy.doc P. 38
Figure 8. Relat ionship of main precincts to potent ia l green network
3.1.1 Lithgow Main Street
The Lithgow Main Street runs in an east-west direction, parallel to the rail line (Figure 13).
Businesses located along the main street are diverse, including pubs, cafes, restaurants, banks,
charity stores, clothes retailers, a newsagent, chemist, community cinema, hairdressers and dry
cleaners. There is a mixture of heritage, and more modern buildings
The character of the centre towards the western end changes. Uses in this area are more in line
with bulky goods/ enterprise corridor type uses, including motorcycles sales, lighting retail, car
sales, hardware, chainsaw and mowing supplies, carpet and glass retailers.

Business and Retail Strategy / Lithgow City Council
April 2010 SGS Final Business and Retail Strategy.doc P. 39
Figure 9. Li thgow main street; bui ld ing footpr ints and green network
It is estimated that there is over 39,000 sqm of ground floor floorspace within the town centre18.
Of this, it is estimated that around 28,500 sqm of floorspace is currently used for retailing or
hospitality, with the remainder being vacant or used as office floorspace. Approximately 30
premises within Main Street were vacant in September 2009. While the floorspace of vacant
premises is unknown, this is likely to account for approximately 7.5% of the floorspace within the
centre. There appears to be a greater number of shop front vacancies towards the eastern end of
Main Street, and along Railway Parade.
At the eastern end of the centre, a potential cultural precinct is being investigated. The precinct
includes the following sites:
Hoskins Church
The Lithgow Court House
The Hoskins Memorial Institute (old Library)
Lloyd Copperworks Building
Union Theatre
The Tin Shed
The central business district (including Mort Street & Railway Parade)
The Eskbank Station
Eskbank House
Blast Furnace Park
Lake Pillans Wetlands
Farmers Creek
18 Ground floor premises which offer higher visibility to pedestrians are more ideal for retailing. Second floor premises are likely to be office based, or service providers such as doctors or dentists. This figure does not include Woolworths, or other retailing within Lithgow, outside the Main Street.

Business and Retail Strategy / Lithgow City Council
April 2010 SGS Final Business and Retail Strategy.doc P. 40
It is likely that uses within the cultural precinct will be focussed on cultural production (such as
workshops), as opposed to cultural consumptions.
Mort Street to the south and Bridge, Eskbank and Sandford streets running north-south provide
peripheral circulation which allows Main Street to have relatively low speed and low volume traffic
(Figure 10). The liveability of the main street is further enhanced by the role of Railway Street to
the north as the principal public transport interchange, freeing up Main Street for short stay
shopper parking.
Figure 10. Li thgow main street; per ipheral t raf f ic and transport interchange
The town centre also has a number of peripheral parking areas (Figure 11) in both public and
private ownership. The existing areas could be improved with better lighting and surfacing and
shade planting; however even in their current state they provide ample parking for the amount of
activity in the main street at present.
Parking is plentiful within Lithgow Centre, but despite this, the retail survey responses suggested
that residents would like to see more parking within the centre. There are a number of sites that
could accommodate an increase in the amount of car parking.
With the exception of a few scattered sites that have been amalgamated, the precinct retains its
fine grain subdivision pattern. This fine grain ownership pattern should be recognised as the
greatest asset of the town centre compared to the environment that exists in and around the
Lithgow Valley Plaza and the Pottery Plaza, and in relation to other town centres. Although there
are a number of vacant premises at present, the mix of building types and conditions and lot sizes
provide a very good basis for the town to adapt and change and accommodate different activities
(Figure 12).

Business and Retail Strategy / Lithgow City Council
April 2010 SGS Final Business and Retail Strategy.doc P. 41
Figure 11. Li thgow Main Street; per ipheral park ing
Figure 12. Li thgow Main Street : inf i l l potent ia l and bui ld ing footpr ints

Business and Retail Strategy / Lithgow City Council
April 2010 SGS Final Business and Retail Strategy.doc P. 42
Figure 12 shows a possible staging plan for intensification of the town centre, and strategic sites
that could facilitate the intensification. Most of these are in council ownership and others in private
control.
As noted above, one of the greatest strengths of the Lithgow Main Street is the mix of lot sizes,
building styles and ages. There is also the potential to intensify the back lanes by allowing
development along the lanes. Conventional development approaches generally rely on the
consolidation of sites in order to accommodate underground parking in a relatively efficient
manner.
This has a number of implications, particularly in Lithgow where redevelopment is a marginal
financial proposition at best.
If council requires additional parking to be provided on a site by site basis, rather than planning for
the whole precinct, this will have a number of consequences:
• it is likely to slow redevelopment and renewal due to the very high cost of constructing
underground car parking
• site consolidation will create large gaps in the retail frontage during the construction period
• the disruption will be prolonged by the requirement for underground parking which can add
months to the construction program
• the excavation and additional truck movements will have an impact on the amenity of the
street, or if undertaken out of hours incur further costs
• attaching a car parking to the title of an apartment adds considerably to the cost, which
erodes affordability
For these reasons, the large sites where consolidated car parking can be provided are very
strategically important. This does not mean that other activities cannot occur on these sites. It
would be essential for the ground levels to be activated by retail and office uses. It may be possible
to have residential uses on upper levels. There are many examples of attractive above ground,
multi level car parks. Apart for the much lower construction costs, above ground car parks have
lower running costs, and if there are appropriate floor to floor dimensions, can even be converted
to other uses.
For all of these reasons it is highly recommended that a comprehensive traffic and parking plan be
prepared for the centre.

Business and Retail Strategy / Lithgow City Council
April 2010 SGS Final Business and Retail Strategy.doc P. 43
Figure 13. Li thgow Main Street : Zoning and Aer ia l Photo

Business and Retail Strategy / Lithgow City Council
April 2010 SGS Final Business and Retail Strategy.doc P. 44
3.1.2 Lithgow Valley Plaza and Pottery Plaza
Lithgow Valley Plaza is located to the south west of Main Street shopping precinct. The centre is
anchored by Coles and Target, located at either end of the centre. Lithgow Valley Plaza contains a
range of other food retailers: a bakery, patisserie, butcher and deli. Other retailing includes
women’s fashion, shoes, giftware, music and a discount shop. Services within the centre include
Medicare, NRMA, the RTA, a credit union, hairdresser, chemist and a travel agent. The Lithgow
Valley Plaza contains approximately 12,000 sqm of retail floorspace with an approval for
approximately 5,000 sqm of additional floorspace. In September 2009, there were three vacant
stores within the centre.
Managed shopping centres differ from main street retailing, as often tenants are ‘chain stores’.
Centre management may pursue a specific leasing strategy to achieve a desired mix of tenants.
Alternatively, within a main street environment there are opportunities for a broader range of
businesses, including business start-ups, low-value retailers, such as opportunity shops or more
niche retailing.
The Pottery Plaza, located to the south of Lithgow Valley Plaza contains Aldi, Dominos Pizza, Repco,
Sams Warehouse, a car wash, Aussie Superpets and three vacant shops, accounting for more than
15% vacancy.

Business and Retail Strategy / Lithgow City Council
April 2010 SGS Final Business and Retail Strategy.doc P. 45
Overall, the role of this precinct is as a retail destination for grocery and comparison goods
shopping. Over the longer term, the precinct may evolve to have a role as a bulky good retail
destination. Land, whether located along Silcock Street (as currently zoned for business) or along
Valley Drive (as has been proposed) should be preserved for this purpose.

Business and Retail Strategy / Lithgow City Council
April 2010 SGS Final Business and Retail Strategy.doc P. 46
Figure 14. Li thgow Val ley Plaza: Zoning and Aer ia l Photo

Business and Retail Strategy / Lithgow City Council
April 2010 SGS Final Business and Retail Strategy.doc P. 47
Strengths
• Primary centre of LGA – main location for administrative
offices, medical specialists and comparison good retailing
• Rail line – last station within the Sydney passenger rail
network
• Located between Sydney and the Central West – allowing
for easy 2 hour vehicular travelling times to Sydney
• Low commercial rents and cheap housing – a relatively
affordable location
• Country style main street – the community spirit and
country atmosphere is highly valued by residents
• Plenty of parking – allowing for ease of access
Weaknesses
• Static population – limited population growth within the
retail catchment means limited growth in the market for
retailing
• Ageing population – older people are less likely to
participate in the labour force and less likely to have high
disposable incomes
• Relatively low income profile of residents
• Business trading hours – residents noted that there is
nowhere to have a coffee on Sunday afternoons. This
also limits tourism potential if the Main Street and gives the
appearance of being a ghost town on weekends
• Few night time activities in the centre in terms or dining,
entertainment, etc
• Activities for Young People – some people applauded the
new skate park but thought additional entertainment, such
as a cinema, is required. However, cinemas generally
require a catchment of 70,000 people. An alternative
approach is required, such as further developing the
existing community cinema.
• Some vacancies present a negative image
• Poor links between Main Street and Lithgow Valley Plaza

Business and Retail Strategy / Lithgow City Council
April 2010 SGS Final Business and Retail Strategy.doc P. 48
• Western tail of CBD – some business types which could be
located within the town centre are stretched along the
western end of Main Street
Opportunities
• Attraction of labour intensive industries to locate
preferably in the town centre area
• Attraction of tertiary education providers to locate close to
the town centre (eg University use of Hoskins building)
• Adaptive reuse of existing buildings or renewal if
appropriate
• Cultural Precinct – currently being explored. This may
add to the vibrancy and liveability of the Lithgow town
centre.
• Ways of consolidating cultural uses within the existing
Main St should be considered a priority
• Broaden the range of retail opportunities in Main Street,
eg Clothing – many residents reported travelling outside
the LGA to shop for men’s and women’s clothes.
However given the limited catchment for Lithgow it is
unlikely that a broad range of clothes will be available
locally
Opportunities (continued)
• Alternative uses – vacant shops could be considered for
alternative uses. A program such as ‘Renew Newcastle’
could provide the means to achieve this
• Tourism – develop strategies to direct visitors and
travellers into shopping precincts.
• Develop a Tourism Strategy to encourage day trippers as
well as longer stays and thus increasing tourism spend.
Threats
• Heavy reliance on the mining and power generation
industries – the fate of retailing in turn is tied to the general
affluence of Lithgow LGA residents
• Approved floorspace for Lithgow Valley Plaza – this will
impact adversely upon the Main Street, as such a broader
role, beyond retailing, needs to be considered for Main
Street
• Further population decline – potential decline in the market
for retailing
• Continued ‘brain-drain’ – young people continue to leave
the area for education and training or employment
• The ageing of the population should there be no jobs
growth stimulus
• Bypass – a reduction in people travelling through Lithgow
is likely to reduce the number of visitors
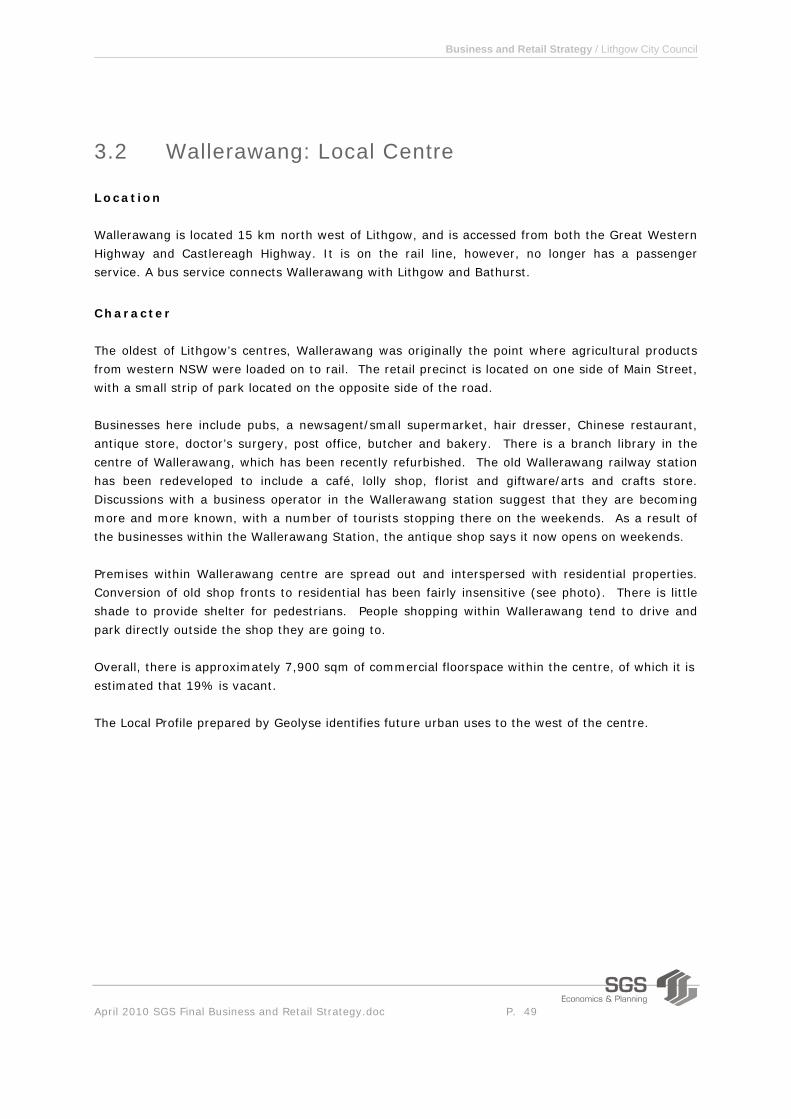
Business and Retail Strategy / Lithgow City Council
April 2010 SGS Final Business and Retail Strategy.doc P. 49
3.2 Wallerawang: Local Centre
Location
Wallerawang is located 15 km north west of Lithgow, and is accessed from both the Great Western
Highway and Castlereagh Highway. It is on the rail line, however, no longer has a passenger
service. A bus service connects Wallerawang with Lithgow and Bathurst.
Character
The oldest of Lithgow’s centres, Wallerawang was originally the point where agricultural products
from western NSW were loaded on to rail. The retail precinct is located on one side of Main Street,
with a small strip of park located on the opposite side of the road.
Businesses here include pubs, a newsagent/small supermarket, hair dresser, Chinese restaurant,
antique store, doctor’s surgery, post office, butcher and bakery. There is a branch library in the
centre of Wallerawang, which has been recently refurbished. The old Wallerawang railway station
has been redeveloped to include a café, lolly shop, florist and giftware/arts and crafts store.
Discussions with a business operator in the Wallerawang station suggest that they are becoming
more and more known, with a number of tourists stopping there on the weekends. As a result of
the businesses within the Wallerawang Station, the antique shop says it now opens on weekends.
Premises within Wallerawang centre are spread out and interspersed with residential properties.
Conversion of old shop fronts to residential has been fairly insensitive (see photo). There is little
shade to provide shelter for pedestrians. People shopping within Wallerawang tend to drive and
park directly outside the shop they are going to.
Overall, there is approximately 7,900 sqm of commercial floorspace within the centre, of which it is
estimated that 19% is vacant.
The Local Profile prepared by Geolyse identifies future urban uses to the west of the centre.

Business and Retail Strategy / Lithgow City Council
April 2010 SGS Final Business and Retail Strategy.doc P. 50
Figure 15. Wallerawang: Zoning and Aer ia l Photo

Business and Retail Strategy / Lithgow City Council
April 2010 SGS Final Business and Retail Strategy.doc P. 51

Business and Retail Strategy / Lithgow City Council
April 2010 SGS Final Business and Retail Strategy.doc P. 52
The most valued characteristics of Wallerawang are the close knit community, quietness,
convenience and ease of parking. Retail survey respondents suggested ways in which Wallerawang
could be improved: through providing more things for children such as a swimming pool, improved
signage, repairing potholes, limiting residents removing trees, improving buildings and reducing
vacancies.
Centre Catchment
Wallerawang centre has primarily a role as a local centre, with an additional role serving the nearby
working population. SGS estimates that there are around 3,300 shoppers within Wallerawang’s
local catchment, consisting of the Australian Bureau of Statistics State suburbs of Wallerawang,
Glen Davis and Marrangaroo (see Figure 3).
SGS’s retail survey indicates that 62% of shoppers in Wallerawang are from Wallerawang, with a
further 28% from Lithgow, Portland, Lidsdale or Pipers Flat.
Strengths
• Range of large employers within easy travelling – Delta
powerstation and mines
• Breakfast, lunch and dinner location for local workers –
providing business for the bakery, take away shop and
Chinese restaurant. Bowling Club and Hotels also have
some dinning facilities.
• Existing services and facilities – the post office, doctor and
library encourage people to visit the centre
• Railway Station renewal – this redevelopment may attract
tourists on weekends and provides an example of
successful adaptive reuse of heritage buildings
• Rail heritage
• Businesses are increasingly open on weekends
• Open space located opposite the shops
• Sporting oval at rear of Main Street used for training
during the week and on weekends.
• Accommodation providers at hotels, and Black and Gold
Cabins.
• Within 2.5 hours driving distance from Sydney
Weaknesses
• Centre structure – the spacing between businesses and
lack of shade does not create a pleasant pedestrian
environment.
• Small centres are often more successful when they
consist of retailing on both sides of the street, while
Wallerawang consist of only one side of shops, opposite a
park and railway land.
• Vacancies – create a poor image within the centre
• Car based
• Close to Lithgow – which means residents may be likely to
shop in Lithgow, rather than Wallerawang
Opportunities
• Heritage wool sheds on State Rail land may have
potential for adaptive reuse
• Incentives for users of Lake Wallace, Sports Stadium and
Bowling Club to travel to shopping centre.
• Direct tourists and locals through Wallerawang to Portland
Threats
• Heavy reliance on the mining and power generation
industries – the state of retailing in turn is tied to the
general affluence of Lithgow LGA residents
• Further population decline – potential decline in the
market for retailing

Business and Retail Strategy / Lithgow City Council
April 2010 SGS Final Business and Retail Strategy.doc P. 53
as scenic and heritage drive.
• Improve amenity – shade, seating, restoration of buildings
and shop fronts
• Continued ‘brain-drain’ – young people continue to leave
the area for education and training or employment.
• The ageing of the population should there be no jobs
growth stimulus

Business and Retail Strategy / Lithgow City Council
April 2010 SGS Final Business and Retail Strategy.doc P. 54
3.3 Portland: Local Centre
Location
Portland is located 25 km north west of Lithgow and 50 km east of Bathurst.
Character
Portland is a small local centre with a strong sense of community. The small village accommodates
a range of businesses: Foodworks, a bakery, pharmacy, take away, pub, hairdresser, post office,
bank, St Vincent de Paul, butcher, RSL Club, aromatherapy store, real estate agent and youth
centre. In September 2009 there were 10 vacant shop fronts. While the majority of businesses
are located around the intersection of Wolgan and Williewa Streets, the post office is located a
short walk away, on the corner of Lett and Williewa Streets.
There is timed, on-street parking, with additional off street parking, located off
Wallerawang/Portland and Portland to Cullen Bullen Road. The centre also contains a small park.
Portland offers a high amenity pedestrian environment, with the footpath having been upgraded,
and shrubbery along Wolgan Street. There is a small country village atmosphere, and a number of
heritage buildings have been retained within the centre. Overall, there is approximately 10,900
sqm of commercial floorspace within the centre, of which it is estimated that 22% is vacant.
Shoppers expressed a strong desire to ‘shop locally’ to support local businesses. The retail survey
indicated that people valued the friendliness and community spirit within Portland, as well as the
convenience. Local residents appear to wander through Portland; just to chat to people they may
run in to. Comments recorded by the retail survey in relation to improving Portland included: the
need to redevelop the Boral site; a desire for more retail competition particularly another grocery

Business and Retail Strategy / Lithgow City Council
April 2010 SGS Final Business and Retail Strategy.doc P. 55
store; requests for pot holes to be repaired; the need for a taxi service; and a cinema, as well as
improved appearance of vacant shops.
Figure 16. Port land: Zoning and Aer ia l Photo

Business and Retail Strategy / Lithgow City Council
April 2010 SGS Final Business and Retail Strategy.doc P. 56
The Boral site, located adjacent to the town centre has been disused since the 1990’s. This site
presents a key opportunity for renewal within the town centre. Discussion with the landowner
suggests that in future the site could be used for a mixture of residential and light industrial land
uses. The following excerpt from the Lithgow Cultural Plan clearly expresses the local community’s
expectations of the redevelopment of the Boral site:
Portland Cultural Precinct

Business and Retail Strategy / Lithgow City Council
April 2010 SGS Final Business and Retail Strategy.doc P. 57
‘As part of the proposed development of a Cultural Precinct for Portland, it has been
identified that there is a need to investigate options for providing workshop, exhibition and
marketing space suitable for collaborative work or skill- sharing activities which will
contribute to the education focus of the Learning City’ (Community Submission 2009).
Figure 17. Port land: exist ing precincts and uses
The Local Profile prepared by Geolyse identifies future urban uses in proximity to the centre.
Centre Catchment
Portland centre has a role primarily as a local centre. SGS estimates that there are around 3,400
shoppers within Portland’s local catchment, consisting of the ABS State suburbs of Portland, Cullen
Bullen, Blackman’s Flat and Capertee.
SGS’s retail survey indicates that 68% of shoppers in Portland are from Portland, with an additional
16% from Cullen Bullen, East Portland, Wallerawang or Lithgow.
Strengths
• Strong community spirit and support of local residents for
local businesses
• Heritage buildings – create an attractive environment and
present an opportunity for heritage based tourism
• Attractive centre with high level of amenity for pedestrians
• Within 2.5 hours driving distance of Sydney
• Power and mining industries
Weaknesses
• Business trading hours – limited number of retailers are
open on the weekend, thus limiting potential for capturing
tourist spend
• Limited tourist accommodation

Business and Retail Strategy / Lithgow City Council
April 2010 SGS Final Business and Retail Strategy.doc P. 58
Opportunities
• Boral site – this site occupies a prominent position within
the town centre and contains a number of heritage
buildings, currently in disrepair
• Heritage tourism – linked to other locations within the LGA
such as Hartley
• Temporary uses in vacant shop fronts
• Direct tourists and visitors through both Wallerawang and
Portland by creating tourist trail.
Threats
• Heavy reliance on the mining and power generation
industries – the health of retailing in turn is tied to the
general affluence of Lithgow LGA residents
• Further population decline – potential decline in the
market for retailing
• Continued ‘brain-drain’ – young people continue to leave
the area for education and training or employment.
• The ageing of the population should there be no jobs
growth stimulus

Business and Retail Strategy / Lithgow City Council
April 2010 SGS Final Business and Retail Strategy.doc P. 59
4 Modelling Retail Demand
4.1 SGS Retail Modelling Approach
Retail modelling was used to assess the amount of retail floorspace that could be supported within
Lithgow LGA. This is based on ABS 2008 Estimate Resident Population19, redistributed to reflect
the 2006 population distribution (Table 10).
Table 10. Populat ion wi th in Local Catchments
Centre Catchment 2006 Census Population 2008 Estimated Resident Population (redistributed)
Percentage of Total Population
Lithgow Local Catchment 12,818 13,434 65% Wallerawang Local Catchment 3,127 3,277 16% Portland Local Catchment 3,242 3,398 16% Other 488 511 2% Total 19,675 20,620 100%
Source: ABS, 2006, ABS, 2008 and SGS, 2009
This retail model uses information from the ABS 2003-04 Household Expenditure Survey to
calculate likely ‘spend’ per capita. The Australian average expenditure per person was adjusted
from $12,500 to $10,976 to reflect the local income profile, and then used to calculate the
available expenditure within a catchment. While survey results indicated that expenditure was
lower ($8,388 when grocery expenditure was divided by the average number of people per
household and all other identified expenditure was added), the survey did not accurately reflect the
demographic profile, and it is possible that younger people, who were underrepresented in the
survey, have different spending habits.
The retail model then breaks down residents’ retail ‘spend’ by within and outside the LGA, and by
centre levels within the hierarchy (Table 11). The share of typical spending by centre type, as well
as escape expenditure, is based on SGS estimates and the findings of the retail survey. This
provides an indication of the distribution of expenditure (Table 12). Expenditure coming to Lithgow
from outside the LGA is estimated at 10%, based on the proportion of shoppers recorded in
Lithgow from outside the local area.
Table 11. Resident Expendi ture by Level in Centre Hierarchy
Centre Type Percent Share of Total
Expenditure* Expenditure Capture Local Centres 15% $33,947,496 Sub regional Centre 65% $147,105,817 Outside Region eg. Sydney or Bathurst 20% $45,263,328 Total 100% $226,316,642
19 ABS (2009) Regional Population Growth, Australia, 2007-08, Catalogue No.: 3218.0

Business and Retail Strategy / Lithgow City Council
April 2010 SGS Final Business and Retail Strategy.doc P. 60
Source: SGS, 2009
By applying average retail turnover densities (annual turnover per square metre) for different
centre types, the amount of supportable floorspace by centre can be estimated (Table 12). Table 12. Retai l Model Results for Li thgow, Wal lerawang and Port land
Expenditure Capture from within the LGA
Expenditure capture from outside of the LGA Floorspace demand by Centre
Centre
Sha
re o
f Loc
al S
hopp
ing
Sha
re o
f sub
regi
onal
sh
oppi
ng
Hig
her l
evel
sho
ppin
g
Dol
lar V
alue
Exp
endi
ture
from
out
side
LG
A
Tota
l Exp
endi
ture
with
in
the
cent
re
Ret
ail T
urno
ver D
ensi
ty
(RTD
)($/s
qm)
Sup
porta
ble
Floo
rspa
ce
(sqm
)
Exi
stin
g Fl
oors
pace
(sqm
)
Floo
rspa
ce D
eman
d (s
qm)
Lithgow 65% 100% 0% $169,222,158 10% of total expenditure $188,024,620 $4,000 47,006 55,445 -8,439
Wallerawang 16% 0% 0% $5,395,366 Negligible $5,395,366 $2,000 2,698 8,000 -5,302 Portland 16% 0% 0% $5,593,788 Negligible $5,593,788 $2,000 2,797 11,000 -8,203 Other - Outside of LGA 2% 0% 100% $46,105,330 n/a $46,105,330 $6,000 7,684 n/a n/a
Source: SGS, 2009
Information on the existing supply of commercial floorspace is based on information provided by
Council, collected as part of the Business Survey. Where necessary (such as in Portland and
Wallerawang, and for Woolworths within Lithgow) this information has been supplemented by
floorspace estimations from aerial photos. The supply data, while not purporting to be definitive,
provides a good indication of existing supply. By comparing the estimated demand for floorspace
with the volume of existing floorspace, the supply gap can be determined.
Lithgow
Assuming Lithgow captures 65% of the LGA’s resident’s ‘local’ shopping and all of locally generated
expenditure at a sub regional level, Lithgow centre could profitably support around 47,000 sqm of
retail floorspace, assuming a retail turnover density of $4,000/sqm p.a. was achieved20. This is in
line with the current retail floorspace. At present there is around 46,000 sqm of occupied
floorspace within Lithgow Centre, including the Main Street, Woolworths, Lithgow Valley Plaza and
Pottery Plaza.
In reality, retail turnover densities in struggling businesses, or low value businesses, may be lower
than this rate (meaning that a larger volume of floorspace exists than anticipated), or higher for
more successful businesses (which in theory would mean that a lower amount of floorspace could
20 This assumption of retail turnover density is based on a review of turnovers for comparable centres within the Property Council’s Shopping Centre Database.

Business and Retail Strategy / Lithgow City Council
April 2010 SGS Final Business and Retail Strategy.doc P. 61
be supported by the same catchment). Discussions with Lithgow Valley Plaza’s management
indicate that stores such as Coles and Target are currently performing strongly.
The potential supply (that is existing built stock which could be used for the purposes of retail) is
significantly higher than estimated demand for retailing, with a potential oversupply of more than
13,000 sqm. While some of this stock is vacant, some is used for commercial purposes. An
addition to floorspace supply within Lithgow is likely, with additional floorspace having been
approved at Lithgow Valley Plaza, as such, alternative uses (to absorb potential vacancies) need to
be nurtured.
Wallerawang
A relatively modest retail turnover density (RTD), of $2,000/sqm has been applied in the modelling
approach for this centre, to reflect lower rents in this location. Assuming Wallerawang captures
16% of the LGA’s resident’s ‘local’ shopping (that is 16% of Lithgow LGA residents that live within
Wallerawang’s local catchment) Wallerawang is likely to support between 2,000 and 3,000sqm of
retail floorspace. Existing floorspace far exceeds demand.
Portland
To Portland, like Wallerawang, a modest RTD has been applied. It is estimated that 16% of
Lithgow residents live within Portland’s local catchment. As such, between 2,000 and 3,000 sqm of
floorspace could be supported within the centre. Like Wallerawang, existing supply far exceeds
demand.
South Bowenfels
In considering the demand for retail floorspace within the LGA, it is important to consider future
population and its likely distribution. The supply and demand analysis which has been prepared for
Lithgow Council indicates that there is potential for 569 lots at South Bowenfels.
In recent years there has been on average 30 additional dwellings approved per year within the
2(a) zone. Assuming this rate of take up continues and South Bowenfels accommodates all future
demand, it will take approximately 19 years before the precinct is ‘built out’. For the purposes of
analysis, it has been assumed that these new dwellings will accommodate 2.4 people per dwelling
in line with the Lithgow average.
On this basis, it is estimated that 750 sqm of local retailing could be supported by the full
development of South Bowenfels (Table 13). However, given the forecast static or declining
population, it may be unlikely that this area will be fully developed. Household growth without
population growth (that is a declining number of people per dwelling) need not result in an
increased demand for retailing.
The appropriate location for neighbourhood shops would ideally be determined through a precinct
planning process. However, the future residential zoning of this precinct may also influence the

Business and Retail Strategy / Lithgow City Council
April 2010 SGS Final Business and Retail Strategy.doc P. 62
potential location of neighbourhood retailing as Zone R1 General Residential and Zone R3 Medium
Density Residential both mandate Neighbourhood shops as ‘Permitted with consent’. Despite this,
the site located on the highway, currently zoned business should be retained, such that there is an
opportunity to accommodate local retailing in the longer term.

Business and Retail Strategy / Lithgow City Council
April 2010 SGS Final Business and Retail Strategy.doc P. 63
Table 13. Resident Expendi ture by Level in Centre Hierarchy: South Bowenfels
Centre Type
Percent Share of Total
Expenditure* Expenditure
Capture RTD Local Centres 15% $33,947,496 $3,000 749 Sub regional Centre 65% $147,105,817 $4,000 2,436 Outside Region eg. Sydney or Bathurst 20% $45,263,328 $6,000 500 Total 100% $226,316,642 3,685
Source: SGS, 2009
4.2 Testing Future Scenarios
In order to understand potential future demand, a number of scenarios have been tested.
Scenario 1: Reduced expenditure ‘leakage’. In this case the amount of escape expenditure
was reduced from 20% to 10%, assuming that Lithgow Centre would capture this additional
expenditure. The results are shown in Table 14. Compared with the base case (if escape
expenditure was reduced) approximately an additional 6,000 sqm of floorspace could be supported
within Lithgow centre. No change would be experienced within Portland and Wallerawang, as these
centres do not offer higher order retailing.
Scenario 2: Higher proportion of people travelling to Lithgow to shop. If the number of
shoppers in Lithgow, travelling from outside the LGA increased from 10% to 20%, it is estimated
that an additional 6,000 sqm of retail floorspace could be supported within the Lithgow centre
(Table 15). This is a similar result to Scenario 1: reduced expenditure leakage.
Scenario 3: Increasing affluence of Lithgow LGA residents. At present the income profile of
Lithgow LGA residents is lower than the Australian average. A higher income profile would most
likely mean a greater available retail ‘spend’ within the catchment. If Lithgow LGA residents were
to become more affluent, in line with the Australian average income profile, it is estimated that an
additional 7,000 sqm of retail floorspace could be supported within the Lithgow LGA (Table 16),
when compared to the base case (Table 12).
Scenario 4: Population growth to 25,000. Assuming Lithgow LGA’s population were to grow to
25,000 people as Council aims, it is estimated that an additional 11,000 sqm of retail floorspace
could be supported between the centres of Lithgow, Wallerawang and Portland (Table 17). This
assumes that the distribution of population remains constant. In this case, there may be a small
under supply of floorspace within Lithgow, however, excess floorspace would remain within
Wallerawang and Portland.

Business and Retail Strategy / Lithgow City Council
April 2010 SGS Final Business and Retail Strategy.doc P. 64
Table 14. Scenar io 1: Reduced expenditure ‘ leakage’
Expenditure Capture from within the LGA
Expenditure capture from outside of the LGA Floorspace demand by Centre
Centre
Sha
re o
f Loc
al S
hopp
ing
Sha
re o
f sub
regi
onal
sh
oppi
ng
Hig
her l
evel
sho
ppin
g
Dol
lar V
alue
Exp
endi
ture
from
out
side
LG
A
Tota
l Exp
endi
ture
with
in
the
cent
re
Ret
ail T
urno
ver D
ensi
ty
($/s
qm)
Sup
porta
ble
Floo
rspa
ce
(sqm
)
Exi
stin
g Fl
oors
pace
(sqm
)
Floo
rspa
ce D
eman
d (s
qm)
Lithgow 65% 100% 0% $191,853,823
10% of total
expenditure $213,170,914 $4,000 53,293 55,445 -2,152
Wallerawang 16% 0% 0% $5,395,366 Negligible $5,395,366 $2,000 2,698 8,000 -5,302
Portland 16% 0% 0% $5,593,788 Negligible $5,593,788 $2,000 2,797 11,000 -8,203 Other - Outside of LGA 2% 0% 100% $23,473,666 n/a $23,473,666 6000 3,912
Source: SGS, 2009
Table 15. Scenar io 2: Higher proport ion of people travel l ing in the Li thgow
Expenditure Capture from within the LGA
Expenditure capture from outside of the LGA Floorspace demand by Centre
Centre
Sha
re o
f Loc
al S
hopp
ing
Sha
re o
f sub
regi
onal
sh
oppi
ng
Hig
her l
evel
sho
ppin
g
Dol
lar V
alue
Exp
endi
ture
from
out
side
LG
A
Tota
l Exp
endi
ture
with
in
the
cent
re
Ret
ail T
urno
ver D
ensi
ty
($/s
qm)
Sup
porta
ble
Floo
rspa
ce
(sqm
)
Exi
stin
g Fl
oors
pace
(sqm
)
Floo
rspa
ce D
eman
d (s
qm)
Lithgow 65% 100% 0% $169,222,158
20% of total
expenditure $211,527,698 $4,000 52,882 55,445 -2,563
Wallerawang 16% 0% 0% $5,395,366 Negligible $5,395,366 $2,000 2,698 8,000 -5,302
Portland 16% 0% 0% $5,593,788 Negligible $5,593,788 $2,000 2,797 11,000 -8,203 Other - Outside of LGA 2% 0% 100% $46,105,330 n/a $46,105,330 6000 7,684
Source: SGS, 2009

Business and Retail Strategy / Lithgow City Council
April 2010 SGS Final Business and Retail Strategy.doc P. 65
Table 16. Scenar io 3: Increasing af f luence
Expenditure Capture from within the LGA
Expenditure capture from outside of the LGA Floorspace demand by Centre
Centre
Sha
re o
f Loc
al S
hopp
ing
Sha
re o
f sub
regi
onal
sh
oppi
ng
Hig
her l
evel
sho
ppin
g
Dol
lar V
alue
Exp
endi
ture
from
out
side
LG
A
Tota
l Exp
endi
ture
with
in
the
cent
re
Ret
ail T
urno
ver D
ensi
ty
($/s
qm)
Sup
porta
ble
Floo
rspa
ce
(sqm
)
Exi
stin
g Fl
oors
pace
(sqm
)
Floo
rspa
ce D
eman
d (s
qm)
Lithgow 65% 100% 0% $192,725,603
10% of total
expenditure $214,139,559 $4,000 53,535 55,445 -1,910
Wallerawang 16% 0% 0% $6,144,734 Negligible $6,144,734 $2,000 3,072 8,000 -4,928
Portland 16% 0% 0% $6,370,715 Negligible $6,370,715 $2,000 3,185 11,000 -7,815 Other - Outside of LGA 2% 0% 100% $52,508,948 n/a $52,508,948 6000 8,751
Source: SGS, 2009
Table 17. Scenar io 4: Populat ion Growth to 25,000
Expenditure Capture from within the LGA
Expenditure capture from outside of the LGA Floorspace demand by Centre
Centre
Sha
re o
f Loc
al S
hopp
ing
Sha
re o
f sub
regi
onal
sh
oppi
ng
Hig
her l
evel
sho
ppin
g
Dol
lar V
alue
Exp
endi
ture
from
out
side
LG
A
Tota
l Exp
endi
ture
with
in
the
cent
re
Ret
ail T
urno
ver D
ensi
ty
($/s
qm)
Sup
porta
ble
Floo
rspa
ce
(sqm
)
Exi
stin
g Fl
oors
pace
(sqm
)
Floo
rspa
ce D
eman
d (s
qm)
Lithgow 65% 100% 0% $205,167,505
10% of total
expenditure $227,963,895 $4,000 56,991 55,445 1,546
Wallerawang 16% 0% 0% $6,541,423 Negligible $6,541,423 $2,000 3,271 8,000 -4,729
Portland 16% 0% 0% $6,781,993 Negligible $6,781,993 $2,000 3,391 11,000 -7,609 Other - Outside of LGA 2% 0% 100% $55,898,800 n/a $55,898,800 6000 9,316
Source: SGS, 2009

Business and Retail Strategy / Lithgow City Council
April 2010 SGS Final Business and Retail Strategy.doc P. 66
4.3 Understanding Bulky Goods Retailing
According to the Bulky Goods Retail Association, bulky goods retailing includes:
• Home entertainment goods
• Furniture, furnishings, floor coverings & electric light fittings
• Household appliances & electrical goods
• Hardware & landscaping supplies
• Bedding, manchester & window coverings
• Automotive parts & accessories
• Other (office equipment, camping, swimming pools, pet supplies, baby goods)
In 2008 there were 1.78 million sqm of bulky goods retail space in NSW with an average centre
size of 12,400 sqm21. Approximately 60% of bulky goods floorspace is located in Sydney, with the
remainder in non-metropolitan locations. Bulky goods retail floorspace is tied to the housing
market and consumer confidence. CBRE (2009) notes that during 2009 low consumer confidence
meant that growth in bulky goods retail floorspace was subdued.
Bulky goods retail outlets are typically located in low cost buildings in low rent areas. The Bulky
Goods Retail Association estimates that retail turnover densities are $3,250 per sqm on average.
Bulky goods retailers seek high profile locations away from the main centres which are easily
accessible by car. Sites with exposure to high traffic volumes are desired by bulky goods retailers
because they enable business promotion. Locations on major arterial roads are therefore
preferred.
The delivery of stock by large commercial vehicles and the loading and collection of bulky goods by
customers requires sites with ease of access. However, the need for car access for loading bulky
goods is not an adequate basis for justifying out-of-centre locations. Ideally, bulky goods retailing
premises should also be located near public transport. This reduces car dependency, encourages
multipurpose trips and provides equitable access.
Where possible, bulky goods retailers should be located adjacent to or within centres to support the
existing retail hierarchy and minimise trip generation. The Right Place for Business and Service
Policy document clearly prescribes that when it is not realistic for bulky goods outlets to be in
centres, they should be located in one or two regional clusters and existing clusters should be
reinforced. Clustering adds to customer choice and catchment pulling power. Having clear ‘go to’
nodes benefits both businesses and customers. Clustering also helps deliver the most efficient
transport and infrastructure outcomes.
Bulky goods retailing requires a very large catchment in order to achieve economies of scale and
often requires substantial parcels of (more affordable) land offering plenty of parking, usually in
21 Knight Frank (2008) NSW Retail Market Overview – July 2008

Business and Retail Strategy / Lithgow City Council
April 2010 SGS Final Business and Retail Strategy.doc P. 67
greenfield areas in ‘out-of-centre’ locations. Existing retail floorspace within the Lithgow town
centre is relatively affordable, so this should not be considered a reasonable driver within the study
area.
Bulky goods retailing should be located in places capable of serving a broad catchment. The Bulky
Goods Retailers Association considers that suitably located premises should serve a catchment of
over 100,000 residents, with some of the larger stores requiring catchments of 150,000 plus.
Figure 18 shows population densities and the location of Lithgow in relation to bulky goods retail
centres. West of the Blue Mountains, population densities are relatively low compared within
Sydney and bulky good retailers are generally located in larger town such as Bathurst or Dubbo.
Figure 18. Li thgow in Context: Bulky Goods Retai l ing and Populat ion Density
Source: SGS, 2009, PCA Property database and Bunnings locations
The distance a consumer is willing to travel is inversely correlated within the frequency that
something is purchased. That is, people travel a short distance for a loaf of bread, but are more
willing to travel longer distances to purchase one-off items such as furniture or white goods.
Lithgow is located midway between Bathurst and Penrith, both of which are within an acceptable
travelling distance for bulky goods retailing. As noted above, catchments for bulky goods retailers

Business and Retail Strategy / Lithgow City Council
April 2010 SGS Final Business and Retail Strategy.doc P. 68
are large and residents from Lithgow are likely to travel to these locations when shopping for
items, such as furniture.
Given the competitive offer, relatively low population numbers within Lithgow’s catchment and
modest population growth, it is unlikely that Lithgow will sustainably support a significant volume
of bulky goods retailing in the foreseeable future. While Council has recorded some interest for
bulky goods development, from a policy perspective it is desirable to strongly discourage any out of
centre retailing. This is two-fold in that out of centre retailing generally impacts adversely on
centres, and by avoiding sprawling bulky goods retail outlets on the main roads, Lithgow is able to
maintain attractive entrances to the town centre.
4.4 The relationship between office-based employment and retailing
There is a strong relationship between retailing and commercial activity within a centre. Retail
businesses can drive demand for professional services, while a large local employment base can
increase demand for retailing.
The primary focus of the analysis completed as part of this study has been retailing: the supply of
floorspace and likely future demand. Lithgow does not have existing strengths in office based
employment. Section 2.6 presented the findings of location quotient to illustrate Lithgow’s areas of
specialisation. Lithgow’s location quotients for the following, generally office-based, industries were
relatively low: Information Media and Telecommunications (0.3), Financial and Insurance Services
(0.4), Rental, Hiring and Real Estate Services (0.7), Professional, Scientific and Technical Services
(0.3) and Administrative and Support Services (0.8).
The population of Lithgow is ageing and this trend is expected to continue (see Section 2.4). This
means a decreasing share of population will be working aged. While in 2006, 66% of the population
was working aged, in 2036 it is expected that 53% of the population will be made up by working
aged people. In absolute terms, population decline combined with an ageing population means that
in 2036 there is likely to be approximately 3,260 fewer working aged people living in Lithgow LGA
than in 2006.
Within Lithgow, Wallerawang and Portland, a substantial share of existing floorspace is used for
retailing. Within these centres, there is no significant differentiation between retail and commercial
floorspace in terms of built form (with some exceptions such as the NSW State Government
offices). There is no definable office precinct. Where in most places the rental costs are much
higher for retail floorspace than commercial, rents for both commercial and retail floorspace in
Lithgow are relatively low. Given that retail rental costs are relatively low, commercial floorspace
users are not precluded from using shop fronts as office floorspace.
The biggest difference between retail and commercial is that retail activity tends to respond to local
(population) drivers whereas commercial activity is driven by a much broader forces. Commercial
employment is strongly tied to the broader economy and employment is often driven by the
competitive position of a location in terms of: transport connections, proximity to similar

Business and Retail Strategy / Lithgow City Council
April 2010 SGS Final Business and Retail Strategy.doc P. 69
businesses (e.g. clustering of finance and insurance within Sydney’s CBD), the availability of an
appropriately skilled workforce (e.g. North Sydney is accessible to the highly skilled workforce of
Sydney’s lower north shore), appropriate commercial or business park floorspace (e.g. significant
growth in business park style development at Macquarie Park), and proximity to high quality
housing (e.g. Norwest which is located close to new housing development in the north west of
Sydney). Lithgow, like many other regional areas does not have a strong competitive offer in this
regard. As such, in regional areas there are often closer ties between commercial employment and
population.
Considering all these factors, it is reasonable to use future retail demand as an indicator of total
future floorspace demand within Lithgow centre.
4.5 Implications
Retail spending per person is limited by an individual’s means and influenced by their stage in life.
The distribution of retail spend is a key influence on the prosperity of centres. Within this context,
retail spending within a certain area, and hence business prosperity, can be increased by:
Capturing a greater share of residents spend locally. Based on the findings of the retail
survey, it is estimated that 20% of retail spending by residents occurs outside the LGA,
primarily in Bathurst or Penrith, as well as online. Spending outside of the LGA is due to a
range of factors. People seeking a certain product or people who travel outside the LGA for a
specific reason may also take the opportunity to go shopping. Alternatively escape of retail
spend occurs for those day tripping outside the local area. For Lithgow LGA, this means there
may be opportunities to capture a greater share of residents’ spend locally. Potential actions to
increasing spending locally include promoting local events and activities which encourage
people to stay (and spend) locally. See Objective 1: Encourage residents to shop locally and
Objective 2: Encourage local businesses to strive for excellence, Section 6.2.
Attracting a greater number of tourists and visitors. By attracting tourists and visitors to
the local area, Council can increase the potential spend within the local area. However, this is
dependent on a range of factors including appropriate accommodation, business trading hours
and improved attractions. For Lithgow LGA, this means ensuring that the centre strategy
addresses these issues to improve the appearance and amenity of the town centre. Potential
actions to achieve this include improved signage to capture ‘passing trade’ and promotion of
local assets such Portland, a small heritage village. See Objective 3: Develop tourism industry,
Section 6.2.
Increasing affluence of the resident population. This is likely to result in a higher
disposable income. As such, any business and retail strategy should be part of broader
economic development initiatives. For Lithgow Council, this means ensuring that this centre
strategy is integrated with Council’s economic development strategy. Council should seek to
fully support economic development initiatives as the retention and attraction of employment is
the foundation of local economic prosperity. Potential actions to improve local prosperity
include supporting local education providers or providing incentives for business start-ups. See

Business and Retail Strategy / Lithgow City Council
April 2010 SGS Final Business and Retail Strategy.doc P. 70
Objective 6: Support growth in centres as part of a broader economic development objective,
Section 6.2.
Increasing the population. The greater the population within a centre catchment, the
greater potential ‘spend’ that can be captured by the centre, hence the greater potential for a
prosperous centre. Retail modelling indicates that population growth to 25,000 in line with
Council’s vision would have the greatest impact on demand for retailing within the Lithgow
LGA. At present the working population within the Lithgow LGA is larger than the number of
local jobs. If Lithgow is to experience significant population growth (particularly growth in the
working aged population), it is likely that this growth would need to be driven by job growth.
This reinforces the point above. Local economic development is essential. See Objective 5:
Promote Lithgow to new residents, Section 6.2.
Providing an appropriate forward land supply strategy is important to enable development and
stimulate competition. This includes providing supply in multiple ownerships so that restrictive
leases and anti-competitive behaviour is avoided as much as possible. A degree of vacancy is
required to allow for growth and change. However, excess retail floorspace can have two
outcomes:
• High vacancies. This is currently evidenced within Lithgow Main Street, Pottery Plaza,
Wallerawang and Portland.
• Low retail turnover densities (RTDs, that is, the value of turnover per sqm of floorspace). This
means businesses may not be performing as effectively as they otherwise may.
High vacancies rates affect the appearance of area, reducing foot traffic which in turn makes areas
less desirable, thus potentially increasing the vacancy rate. When considering the supply of retail
floorspace, the type and distribution of floorspace needs to be taken into account. For Lithgow this
means any excess business lands should be rezoned to allow for alternative uses such as
residential. See Objective 4: Consolidate Lithgow’s Centres, Section 6.2.
Lithgow LGA does not have sufficient population with a reasonable catchment in order to be able to
support bulky goods retailing.

Business and Retail Strategy / Lithgow City Council
April 2010 SGS Final Business and Retail Strategy.doc P. 71
5 Council’s Role in Planning for Business and Retail
Before developing a strategy for business and retail within Lithgow, it is important to consider what
is within Council’s sphere of influence. While private enterprise is the primary driver of economic
growth, local government can make an important contribution as a promoter, facilitator and
coordinator of local and regional economic development activities. Effective local government
participation is vital to the success of economic development initiatives.
There are a number of avenues through which Council can implement a business and retail
strategy. Primarily, planning controls allow Council to provide sufficient space for growth and
development. Economic development initiatives are more diverse and may include actions which
improve hard and soft infrastructure. This section considers Council scope for implementing
planning and economic development initiatives.
5.1 Planning Controls
Land uses within Lithgow LGA are governed by the Lithgow City Local Environmental Plan 1994 and
Rylstone Local Environmental Plan 1996, reflecting the amalgamation of Lithgow Shire with parts of
Evans and Rylstone LGAs, which occurred in 2004. Council is currently reviewing planning controls
in preparation of a Comprehensive Local Environmental Plan in accordance with the Standard
Instrument.
The Standard Instrument (Local Environmental Plans) Order 2006 prescribes the form and content
of a Principal Local Environmental Plan (LEP) for an area. A schedule to this Order, the Standard
Instrument Principal Local Environmental Plan is being applied by all councils in NSW as a template
for the preparation of new Standard LEPs for each LGA. The Standard Instrument establishes
standard zones (including standard zone objectives and mandated permitted and prohibited uses),
definitions, clauses and format for all LEPs.
Table 18 presents zones, as specified within the Standard Instrument, and the locations to which
they should or may be applied. Zones B1 Neighbourhood Centre, B2 Local Centre and B4 Mixed
Use are the most applicable to the Lithgow, Wallerawang and Portland given the current mix of
uses including retail, services and shop top housing. Table 19 presents the objectives and uses, as
specified by the Standard Instrument, for these zones. Council may choose to add objectives,
permissible or prohibited uses.
Any alterations to zone, such as uses which are added as ‘Permitted without consent’, ‘Permitted
with consent’ or ‘Prohibited’, will apply to that zone across the whole of the LGA. As such it is useful
for Councils to have the flexibility offered by applying different zones to different centres within the
LGA. While Council’s LEP currently allows for bulky goods retailing to be located within industrial
zoned land, planning best practice would suggest that these uses should be encourage to locate

Business and Retail Strategy / Lithgow City Council
April 2010 SGS Final Business and Retail Strategy.doc P. 72
within or on the fringe of centres. Allowing any form of retailing within industrial zones places
upwards pressure on land values, potentially ‘pricing out’ legitimate industrial land uses.
Table 18. Possible appl icat ions of LEP Template zones
LEP TEMPLATE ZONES CENTRE TYPE likely to be used may be used unlikely to be used
B3 Commercial Core B6 Enterprise Corridor B7 Business Park B4 Mixed Use SP1 Special Activities IN1 General Industrial B5 Business Development SP2 Infrastructure IN2 Light Industrial RE1 Public Recreation SP3 Tourist IN3 Heavy Industrial
Regional City e.g Sydney, Wollongong, Newcastle
R4 High Density Residential RE2 Private Recreation R2 Low Density Residential R1 General Residential R3 Medium Density Res.
B3 Commercial Core B6 Enterprise Corridor B7 Business Park B4 Mixed Use SP1 Special Activities IN1 General Industrial B5 Business Development SP2 Infrastructure IN2 Light Industrial RE1 Public Recreation SP3 Tourist IN3 Heavy Industrial
Major Centre e.g Penrith
R4 High Density Residential RE2 Private Recreation R2 Low Density Residential R1 General Residential R3 Medium Density Res.
B2 Local Centre B3 Commercial Core B7 Business Park B4 Mixed Use B5 Business Development IN1 General Industrial RE1 Public Recreation B6 Enterprise Corridor IN2 Light Industrial R3 Medium Density Res. SP1 Special Activities IN3 Heavy Industrial
Town Centre Subregional Centre e.g Lithgow
R4 High Density Residential SP2 Infrastructure R2 Low Density Residential RE2 Private Recreation R1 General Residential
B1 Neighbourhood Centre SP1 Special Activities B3 Commercial Core B2 Local Centre SP2 Infrastructure B5 Business Development B4 Mixed Use RE2 Private Recreation B7 Business Park RE1 Public Recreation R1 General Residential IN1 General Industrial
Local Centre e.g Portland
R3 Medium Density Res. R4 High Density Residential IN2 Light Industrial IN3 Heavy Industrial
IN1 General Industrial B1 Neighbourhood Centre IN3 Heavy Industrial IN2 Light Industrial B4 Mixed Use R3 Medium Density Res. B5 Business Development R4 High Density Residential B6 Enterprise Corridor RE1 Public Recreation RE2 Private Recreation R1 General Residential
Light Industry Precinct
R2 Low Density Residential
IN3 Heavy Industrial B5 Business Development B4 Mixed Use
IN1 General Industrial IN1 General Industrial
IN2 Light Industrial RE1 Public Recreation
RE2 Private Recreation R1 General Residential
R2 Low Density Residential
R3 Medium Density Res.
Heavy Industry Precinct
R4 High Density Residential

Business and Retail Strategy / Lithgow City Council
April 2010 SGS Final Business and Retail Strategy.doc P. 73
Table 19. Zone Object ives and Uses
Zone Details
B1
Neighbourhood
Centre
1 Objectives of zone
• To provide a range of small-scale retail, business and community uses that serve the needs of
people who live or work in the surrounding neighbourhood.
2 Permitted without consent
3 Permitted with consent
Boarding houses; Business premises; Child care centres; Community facilities; Neighbourhood shops; Shop
top housing
4 Prohibited
B2
Local Centre
1 Objectives of zone
• To provide a range of retail, business, entertainment and community uses that serve the needs of
people who live in, work in and visit the local area.
• To encourage employment opportunities in accessible locations.
• To maximise public transport patronage and encourage walking and cycling.
2 Permitted without consent
3 Permitted with consent
Boarding houses; Business premises; Child care centres; Community facilities; Educational establishments;
Entertainment facilities; Function centres; Information and education facilities; Office premises; Passenger
transport facilities; Recreation facilities (indoor); Registered clubs; Retail premises; Service stations; Shop
top housing; Tourist and visitor accommodation
4 Prohibited
B4
Mixed Use
1 Objectives of zone
• To provide a mixture of compatible land uses.
• To integrate suitable business, office, residential, retail and other development in accessible
locations so as to maximise public transport patronage and encourage walking and cycling.
2 Permitted without consent
3 Permitted with consent
Boarding houses; Business premises; Child care centres; Community facilities; Educational establishments;
Entertainment facilities; Function centres; Hotel or motel accommodation; Information and education
facilities; Office premises; Passenger transport facilities; Recreation facilities (indoor); Registered clubs;
Retail premises; Seniors housing; Shop top housing
4 Prohibited

Business and Retail Strategy / Lithgow City Council
April 2010 SGS Final Business and Retail Strategy.doc P. 74
In considering appropriate zones for Lithgow, it is noted that Zone B3 Commercial Core is not
considered necessary within Lithgow LGA. Generally this zone is applied in business-oriented
locations with high land values, where Council seeks to exclude residential land uses, as residential
development is generally more profitable than the development of commercial floorspace. (This
zone is the only business zone which does not have residential land uses as a mandatory use listed
as ‘Permitted with consent’). Given the strategic context, it is suggested that Council promotes a
wide range of uses within each centre, including residential development in the form of shop top
housing.
Recommended zoning and density controls, as recommended for the three centres, are discussed
in Section 6.1.
5.2 Economic Development
Lithgow City Council, in conjunction with its local and regional partners, can play an important role
in identifying and addressing the challenges, as well as promoting and facilitating opportunities for
the economic development of the local area. Key challenges for Council as identified by this study
include promoting business excellence, encouraging residents to shop locally and retaining young
people.
Local government must continue to take a pro-active role to stimulate and encourage local /
regional economic development. There is a range of economic development activities that councils
can engage in to encourage and support economic development in their communities of interest.
Council’s Business survey has identified a range of opportunities to improve the business operating
environment. The actions identified in response to the survey included developing business
awards, co-ordinating marketing and working with landlords to ensure business premises were
appropriately maintained.
Supporting an Attractive Business (and People) Environment
Creating and maintaining an environment conducive to business investment, and an attractive
‘people environment’, are fundamental prerequisites for sustainable economic prosperity. Overall
responsibility for achieving this goal rests with the three tiers of government, the private sector,
development and business organisations, and the general community.
Lithgow Council faces considerable challenges in this regard as higher education opportunities are
limited. Young people often leave the area in seeking better education and employment
opportunities. On the other hand, Lithgow LGA has much to offer in terms of a strong community
spirit, affordable housing and a relaxed lifestyle.
Strategic land use planning (a key responsibility of local government) can have a major influence
on the investment appeal of an area. As well as ensuring that adequate land is available for
business, land use planning can reinforce existing or emerging industry clusters. This study has
identified an excess supply of business and retail floorspace and will seek to consolidate Lithgow’s

Business and Retail Strategy / Lithgow City Council
April 2010 SGS Final Business and Retail Strategy.doc P. 75
centres, by recommending limitations to the distribution of future floorspace and rezoning some
areas to allow for conversion to residential. While high vacancies have been identified as an issue,
relatively affordable rents may present opportunities for creative enterprise.
It is critical that Lithgow City Council understands and continues to monitor the nature and
workings of the local economy, so that Council can determine the most effective way to support
economic development. It is essential for Council to continue to monitor floorspace, development
potential and employment growth across the LGA. Growth in floorspace may be monitored through
a database of development applications. The Census, completed every five years, provides an
information base for employment. An update of the business audit on a yearly basis will inform
Council as to the changes in land use and vacancy rates which have occurred.
As well as assisting Council officers in the strategic planning of the area, ‘information provision’ is a
key tool for providing business assistance. In this way, Council can act as a facilitator, directing
business to the most relevant organisations or information sources.
By possessing up-to-date information on the local and regional economy, Council will be better
informed and better placed to respond to investment enquiries quickly and effectively when they
arise.
Facilitating Local Investment, Business and Employment Growth
The injection of new capital is a key driver of economic expansion and job growth. However, a
strategy, which aims to enhance the level of investment in a particular area, must be framed to
look beyond mere industry attraction. This Business and Retail Strategy will seek to support and
encourage existing businesses, as well as attracting new business to the Lithgow area through a
range of economic development actions, identified in Section 6.
A successful investment enhancement strategy will be one that encourages additional investment
from business and industry already located in the region or locale. This is critical if potential
market opportunities are to be fully capitalised on. It is generally accepted that around 70% of
investment in a region or locale is made by existing firms (that is, established businesses founded
in the region plus newly established firms or ‘start-ups’). Hence, local enterprise often presents
the greatest potential to take advantage of new opportunities.
Lithgow City Council should have lead responsibility for a number of activities that are geared to
facilitating new local investment from within. They include:
Facilitating business networks and clusters, such as the Lithgow Business Association, or
networks within home-based businesses, creative/cultural industries, tourism businesses, or
energy related businesses.
Working with existing businesses to assist their growth, for example providing timely
assessment of development applications
Promoting existing businesses, SGS recommends the Council can play a role in coordinating
marketing

Business and Retail Strategy / Lithgow City Council
April 2010 SGS Final Business and Retail Strategy.doc P. 76
Promoting easy access, this is particularly important for resident’s of outlying centres, such as
Portland
Attracting / Facilitating New Investment
The potential to attract new capital from outside the local area should not be discounted.
Investment attraction remains an important component of any attempt to enhance the local
economic and employment base. Strategically targeted new businesses whose needs match
Lithgow’s strengths can contribute substantially to local economic growth and development.
Lithgow City Council should take a lead responsibility for a number of activities that are geared to
attracting external investment such as promoting the area to visitors (tourists) and attracting new
business investment. Opportunities may exist to attract organisations such as tertiary education
providers; who could be located in (or adjacent to) CBD areas. These may be related to the cultural
precinct. Additionally, opportunities to further promote heritage tourism in Portland have been
identified.
Investment opportunities may also exist in the energy sector with new ‘green’ technologies,
building on the area’s existing strengths in power generation. On 3 March 2010 concept plan
approval has been given for an additional base load power station project in the vicinity of the
existing Mount Piper facility north-west of Lithgow. Up to 950 jobs will be created during
construction with 50 ongoing jobs. This will provide a valuable spike in retail spending in the area
throughout the construction period.
5.3 Creating a Competitive Place
Council’s actions can work towards improving Lithgow as a location in which to work and live.
Competitive places need a combination of supporting infrastructure, available skills, lifestyle and
cultural assets, connectivity, and an environment that fosters innovation and good governance
(Figure 19).
Infrastructure
Efficient, effective and well maintained infrastructure underpins economic activity and is
fundamental to a prosperous local economy. It includes ‘physical’ infrastructure (like roads, rail,
seaports and airports, information technology and telecommunications, power and water) and
quality ‘community’ infrastructure (such as recreation and leisure facilities, cultural services and
facilities and community services and facilities). Together these elements should offer good
physical and functional links that support social, cultural and economic interaction and exchange.
Lithgow is well connected in terms of road, rail and communications. It is located two and a half
hours drive from Sydney and is situated on the edge of the Central West. Passenger rail connects
Lithgow with Sydney.
Business and Retail Strategy / Lithgow City Council
April 2010 SGS Final Business and Retail Strategy.doc P. 77
Lithgow City Council, in its role as a co-ordinator of local economic development activities, has a
key responsibility to ensure that such fundamentals for investment and economic development are
addressed. This includes directly providing those infrastructure items that fall under Council’s
control. It also means actively lobbying the other spheres of government and private providers on
infrastructure matters of regional significance, for example lobbying TAFE to provide a wider range
of courses within Lithgow.
Skills
A skilled and flexible workforce can be supported by responsive education and training programs.
This must be paired with access to meaningful employment that can adapt to changing economic
circumstances or new opportunities as they arise.
At present Lithgow LGA accommodates a TAFE campus, however many young people travel outside
the local area for further education. The occupational profile of Lithgow LGA residents is skewed
towards lower order occupations, with an under-representation of managers and professionals.
Further tertiary education opportunities within the LGA may lift the educational profile of residents.
Local government can play an important role in helping to match the local economy’s skills flow
with industry needs by providing the necessary networking forums. This includes activities such as
liaising with local business and industry (perhaps via formal industry networks or cluster groups) to
identify any apparent labour shortages or skill gaps, auditing local education and training providers
to identify local capacity for training provision that addresses critical gaps and then proactively
encouraging education and training provision that meets local industry requirements. Importantly,
local education and training providers themselves need to be engaged in this process.

Business and Retail Strategy / Lithgow City Council
April 2010 SGS Final Business and Retail Strategy.doc P. 78
Figure 19. A Conceptual Model of Local Economic Prosperi ty
Lifestyle, Culture and Social Cohesion
As knowledge is embodied in individuals, it is vitally important for regions to be able to attract and
retain skilled workers. Achieving this ultimately relies on more than just employment
opportunities, business subsidies or other initiatives to attract businesses. Quality of life and
personal development opportunities need to be afforded to these sophisticated ‘knowledge
workers’. The emergence of the knowledge worker has reaffirmed ‘place’ as a driver of local and
regional competitiveness. Knowledge workers need to be in an environment that is appealing to
them, and which nurtures their growth and development. For many, their chosen occupation does
not tie them down to any one particular area.
Knowledge workers rely on those elements of an economy that support and encourage their
creativity and the diffusion of ideas. This includes the area’s lifestyle attributes including both its
built form and its natural environmental attributes. The appeal of a region’s ‘lifestyle’ will be
strongly influenced by the quality of and accessibility to local recreation, leisure and entertainment
facilities and the depth and strength of the cultural infrastructure.
Anecdotal evidence suggests that Lithgow has a growing cultural/creative industry sector with
many artisans, artists, film makers, designers, etc, living in the LGA. While Lithgow LGA does not
offer any large-scale cultural or recreational facilities, it does have a good range of local sporting

Business and Retail Strategy / Lithgow City Council
April 2010 SGS Final Business and Retail Strategy.doc P. 79
and playing facilities, along with local theatres and community halls. Lithgow has a number of
events and festivals, some of which attract national and international audiences (such as the World
Masters Games, Australian 4-day Enduro motorcycle championships and Ironfest). Lithgow has
lifestyle advantages, particularly a country lifestyle, access to World Heritage National Parks and a
location within easy driving distance of both Sydney, Canberra, Bathurst and the Central West.
The retail survey recorded that residents valued the strong sense of local community.
Innovation
Australian economies can no longer rely on cost competitiveness to drive economic development.
As we proceed into the 21st century, continual innovation will become the essential determinant of
long-term economic performance in Australia and other developed countries.
Encouraging local businesses to innovate lies at the heart of the ability of businesses to value-add
in the long-term. Innovation and the commercialisation of new ideas can be nurtured by
establishing and developing strong links between local businesses, government and research and
learning institutions. Recent work by Professor John West identified some essential environmental
conditions for effective innovation as:
access to science and technology,
access to financial resources, and
access to high-quality information and knowledge infrastructure.
For Lithgow, this means ensuring clear lines of communication with local businesses and
encouraging businesses to work with education providers such as TAFE, Charles Sturt University or
the University of Western Sydney.
Good Governance
Activities designed to nurture and support an attractive business (and people) environment are
critical to any economic development strategy. One of the most effective ways for Councils to effect
positive change is through good strategic planning. A supportive governance structure can be
provided through the establishment of a ‘business ready’ regulatory environment, low cost
business structures, open lines of communication between business and government, and ready
access to business support, information and advisory services. Council has demonstrated its
commitment to improving governance through the implementation of the Economic Development
Advisory Committee.
Business and Retail Strategy / Lithgow City Council
April 2010 SGS Final Business and Retail Strategy.doc P. 80
6 Lithgow Business & Retail Strategy
This section presents desirable future roles for the centres, supported by place specific actions,
within a broader economic development framework. Section 6.1 details objectives and actions for
each of the centres. Section 6.2 discusses broader economic development objectives and actions
for Council.
6.1 Future Centre Hierarchy
Lithgow - Subregional Centre
Lithgow will continue to function as a subregional centre, as a focal point for government and
community activity within the LGA. This is reliant on Council ensuring that future retail floorspace,
commercial floorspace and community facilities are focussed within the centre. It is essential to
concentrate retail activities within the existing centre and consider potential to promote new
activities within the centre.
Additional retail floorspace has been approved at Lithgow Valley Plaza. This will impact adversely
on retailers within Main Street. At present there are a number of vacant shop fronts. Population is
likely to remain static or grow modestly meaning that demand for retailing is unlikely to grow
significantly. If Council is to preserve or enhance the character of Main Street a concerted effort is
required to nurture a range of uses within existing shop fronts. Council should consider
opportunities to differentiate between Main Street and Lithgow Valley Plaza.
Council should plan for improvements to the physical environment, while implementing business
support initiatives. Traditional retail uses should be concentrated between Lithgow Street and
Esbank Street. In planning for a cultural precinct, Council should consider opportunities to
concentrate creative industries within existing premises, such as along the eastern end of Main
Street, as part of a broader civic-cultural precinct (Figure 20).
While consultation suggests that residents desire additional bulky goods retailing within Lithgow, it
is unlikely that the catchment could support a significant bulky goods retailing precinct. These uses
may be directed towards the Pottery Plaza, as this location is already zoned for the purposes of
business. The area is located on the periphery of the Lithgow centre, thus minimising car trips and
avoiding retail development ‘out of centre’. This location would also avoid marring the approaches
to the town from the Great Western Highway or Bells Line of Road.
Action L1 Limit the expansion of areas zoned for Business purposes and consider rezoning
business areas to appropriate alternative uses such as residential, particularly west
of Calero Street, and along the northern side of the railway line.
Time frame: Short.
Resource requirements: Minimal

Business and Retail Strategy / Lithgow City Council
April 2010 SGS Final Business and Retail Strategy.doc P. 81
Rationale: An oversupply of business zoned land has been demonstrated. This
strategy seeks to achieve consolidation, focussing activity, particularly retailing,
along the main street. One step in work towards a more compact and coherent
centre is consolidation of business zoned land.
Action L2 Retain the rural, open character of Marrangaroo, with no bulky goods retailing
allowed in this location. Similarly, limit development along the highway and redirect
‘passing trade’ in to town.
Time frame: Short.
Resource requirements: Minimal.
Rationale: Any additions to the supply of business zoned land would be likely to
exacerbate existing issues such as high vacancies. Council should consolidate all
retailing, including bulky goods within the Lithgow town centre.
Action L3 Allow for development along Burns Lane, without any requirements for onsite
parking (Figure 20). This will provide opportunities for new activities to be
accommodated within the existing centre and help to create a rich and diverse
retail offer. Over the longer term, if demand can be demonstrated, Council may
choose to explore other development opportunities between Lithgow Street and
Bridge Street, and between Main Street and Mort Street.
Time frame: Short to long.
Resource requirements: Minimal.
Rationale: At present there has been no demand for additional commercial
floorspace identified. Allowing for development along Burns Lane will allow some
opportunities for new business to be accommodated, while diversifying and
enriching the western end of the town centre. Opportunities to accommodate
growth and change over the longer term should be investigated further in future if
demand can be demonstrated.
Action L4 Allow for residential uses within the town centre. However, the opportunity to reuse
this space for retailing should be maintained. Shop-fronts should ideally be
retained for display, for example shop fronts could serve as a tourist
orientation/heritage display - "an open air museum" acting as display cabinets.
Time frame: Short.
Resource requirements: Minimal.
Rationale: Planning controls should allow for efficient use of land and existing
buildings. However, it is important to maintain flexibility, such that if demand for
retail floorspace increases there is scope for uses to change.
Action L5 Ensure opportunities for cultural activities are provided for in Main Street and
strongly link to the Cultural Precinct in Bridge Street. Existing buildings within the
town centre should be included as part of a broader concentration of civic and
cultural land uses in the eastern end of the centre (Figure 20), with the eastern end
of the centre being focused on retailing.

Business and Retail Strategy / Lithgow City Council
April 2010 SGS Final Business and Retail Strategy.doc P. 82
Time frame: Short.
Resource requirements: Moderate.
Rationale: An oversupply of commercial and retail floorspace has been
demonstrated. Concentrating activities within the main street should be a priority
before considering expansion of the centre.
Figure 20. Li thgow main street: potent ia l for retai l concentrat ion and di f ferent iat ion
Action L6 Develop an overall parking plan for the Lithgow centre. As part of this plan, retain
short term parking in Main Street and two way traffic flows. Plan to improve
existing peripheral parking and improving accessibility, attractiveness and
convenience (Figure 21 and Figure 22). This may through improvements to access,
quality, lighting, linking pathways, tree planting and shade etc. Plan for conversion
of existing car parks to structured (multi-storey) car parking in the longer term.
Time frame: Medium.
Resource requirements: Moderate.

Business and Retail Strategy / Lithgow City Council
April 2010 SGS Final Business and Retail Strategy.doc P. 83
Rationale: The availability of safe and convenient parking is one factor which
contributes to the effective functioning of a centre. Parking requirements, as
specified within planning controls, may stymie development if a significant amount
of parking is required onsite. A coordinated approach is required to plan to meet
the parking needs of visitors to the centre.
Figure 21. Li thgow Main Street; per ipheral park ing
Figure 22. Li thgow Main Street: potent ia l pedestr ian network and shared zones

Business and Retail Strategy / Lithgow City Council
April 2010 SGS Final Business and Retail Strategy.doc P. 84
Action L7 Improve signage at the entry of town by erecting signs which direct drivers to Main
Street.
Time frame: Short.
Resource requirements: Minimal.
Rationale: Existing signage is poor. Current signage directs residents to Lithgow
Valley Plaza. Tourists and people travelling through would benefit from improved
signage. This is a relatively easy and achievable improvement, within minimal cost
to Council.
Action L8 Provide cycle parking within Lithgow town centre.
Time frame: Short.
Resource requirements: Moderate.
Rationale: Encouraging cycling is one means to reduce demand for motorised
transport and carparking. Council should seek to encourage environmentally
sustainable behaviour. This is one means to do so with limited outlay required.
Zoning Recommendation: Zone B2 Local Centre to be applied to the town centre. The
objectives of this zone are: ‘to provide a range of retail, business, entertainment
and community uses that serve the needs of people who live in, work in and visit
the local area; to encourage employment opportunities in accessible locations; and
to maximise public transport patronage and encourage walking and cycling.’
Add objective to the B2 - Local Centre zone:
• to support the development of cultural and tourist facilities in Lithgow town
centre and Portland Village
Apply an FSR of 1.5:1 within the Lithgow Town Centre.
Zone B4 Mixed Use to be applied to Lithgow Valley Plaza and Pottery Plaza. This
zone allows for a mix of uses and by differentiating zoning between these two
precincts, Council differentiate between prohibited uses in each location. A modest
FSR of 0.5:1 should be applied to this precinct, reflecting the current use of land in
this area.
Council should carefully consider rezoning Business Zoned lands located along Main
Street between Calero Street and Musket Parade to residential.
Council should rezone business zoned land north of the Railway line to R3 Medium
Density Residential and rezone land west of Bridge St to either R1 General
Residential or R3 Medium Residential with an FSR of 1.5:1 in these locations.
Existing use rights will allow for a continuation of current activities in the

Business and Retail Strategy / Lithgow City Council
April 2010 SGS Final Business and Retail Strategy.doc P. 85
foreseeable future. This is in line with the strategy direction to consolidate the
centre.

Business and Retail Strategy / Lithgow City Council
April 2010 SGS Final Business and Retail Strategy.doc P. 86
Wallerawang – Local Centre
Wallerawang will continue its role as a local
centre. Council should continue to encourage
convenience retailing, take away food and local
services in this location. Council should also
continue to offer services, through the
Wallerawang Library. Analysis indicates that
there are limited opportunities for growth and
change within Wallerawang. There is unlikely to
be significant population growth in this area,
which is the most significant driver of change.
Wallerawang does not offer the village
atmosphere of Portland and as such does not
have the same opportunities to attract tourists.
Though the centre is unlikely to change significantly, over time the broader Lithgow area may
attract a higher number of day trippers, which may have flow on effects to Wallerawang,
particularly following the adaptive reuse of the station.
Currently, there is not an opportunity to consolidate the centre, by reducing the business zoned
area. At the northern end of the main street there are the two pubs, and at the southern end there
are successful businesses, the butcher and bakery. However, expansion of the business zone, or
allowing for active uses along Blackberry Lane should be avoided in order to concentrate activity
along Main Street as much as possible. Opportunities for alternative uses, namely residential,
within the centre should be considered within the principal LEP, with design guidelines for
alternative uses.
Action W1 Extend ‘Celebrate Lithgow’ events to incorporate events in Portland and
Wallerawang.
Time frame: Medium.
Resource requirements: Moderate.
Rationale: Celebrate Lithgow is an important event for the local community and it
is well established. This is one action that Council can implement, to raise the
profile of the town, with little or no cost to Council.
Action W2 Replace signage to town centre. Consider using alternative language i.e. ‘Town
Centre’ or ‘Main Street’ instead of ‘Shopping Centre’.
Time frame: Short.
Resource requirements: Minimal.

Business and Retail Strategy / Lithgow City Council
April 2010 SGS Final Business and Retail Strategy.doc P. 87
Rationale: Existing signage is poor. Tourists and people travelling through would
benefit from improved signage. This is a relatively easy and achievable
improvement, within minimal cost to Council.
Action W3 Plant street trees to provide shade along Main Street.
Time frame: Short - Medium.
Resource requirements: Moderate.
Rationale: Main Street is wide and
provides more than ample parking.
Use of some of this space for
plantings will improve the amenity
and attractiveness of the centre,
improving the prospects to attract
tourists and visitors.
Action W4 Adopt design guidelines for the
conversion of old shop fronts for
alternative uses, namely residential.
This can be incorporated within a
development control plan,
supporting the principal LEP.
Time frame: Short.
Resource requirements: Minimal.
Rationale: Over the long term it is unlikely that existing shop fronts will continue
to be used for the purposes of retailing. Alternative uses such as residential need to
be considered. Conversion needs to be carried out in a way that is sensitive to the
existing streetscape and does not impact on the appearance of the town or
opportunities to attract tourists. Flexibility should be maintained to allow for
potential reuse for retail in future if the demand arises.
Action W5 Provide a community transport service to allow residents in Wallerawang to access
the town centre, or to travel to Lithgow.
Time frame: Short and ongoing.
Resource requirements: Moderate.
Rationale: Wallerawang is home to an ageing population. Public transport
connections with Lithgow are poor. It is unrealistic to expect that all services and a
wide range of retailing will be available in Wallerawang. As such, community
transport offers an effective means to ensure access to services for all members of
the community, particularly older people.
Zoning Recommendation: Zone B1 Neighbourhood Centre to be applied to the Town Centre.
The objective of this zone is ‘to provide a range of small-scale retail, business and
community uses that serve the needs of people who live or work in the surrounding

Business and Retail Strategy / Lithgow City Council
April 2010 SGS Final Business and Retail Strategy.doc P. 88
neighbourhood’. Applying a zone which differs from other locations allows for the
zoning to be tailored and objectives to be added for specific locations.
Add objective to the B1 Neighbourhood Centre zone:
• to provide for a mix of uses, including residential, which maintain the
village atmosphere of Wallerawang
Apply an FSR limit of 1:1. This may be reviewed over the longer-term.

Business and Retail Strategy / Lithgow City Council
April 2010 SGS Final Business and Retail Strategy.doc P. 89
Portland – Local Centre (Heritage Tourism Precinct)
Portland centre presents a distinct opportunity for Lithgow LGA, a heritage tourism destination
promoted in conjunction with other heritage attractions within the local area. The local role of
Portland should also be preserved. Careful consideration should be given to how the Boral site can
rejuvenate the town centre and facilitating a tourism role for the centre. Council should explore
avenues to promote tourism, for example through events, within Portland, in parallel with other
initiatives, such as encouraging businesses to extend trading hours.
Action P1 Council’s economic development officer to work with landowners to support and
facilitate the rezoning and redevelopment of the cement works site.
Time frame: Medium.
Resource requirements: Minimal.
Rationale: The cement site accounts for a large amount of land adjacent to the
town centre. Currently has a poor appearance, and is visible from the main street.
Redevelopment may act as a catalyst for renewal within the town centre.
Action P2 Plan for the renewal of the Boral site, such that it is integrated within the town
centre, allowing for additional open space, housing and residential development
(see Text Box below). It is important that clear urban design and planning
principles, and guidance in relation to the adaptive reuse of buildings and retention
of as much of the built fabric as possible is provided for the redevelopment of the
Boral site to ensure that the public and community benefits are maximised.
Time frame: Short.
Resource requirements: Minimal.
Rationale: Given the large amount of land and its location adjacent to the town
centre, it is important to plan for development which is integrated, rather than
forming a separate enclave. Heritage buildings within the site contribute to the
character of Portland and as such, should be retained. It is desirable to maximise
public benefits arising from the renewal of this site.
Action P3 Extend Celebrate Lithgow events to incorporate events in Portland and
Wallerawang.
Time frame: Medium.
Resource requirements: Moderate.
Rationale: Celebrate Lithgow is an important event for the local community and it
is well established. This is one action that Council can implement, to raise the
profile of the town, with little or no cost to Council.
Action P4 Promote Portland in conjunction with other heritage attractions, online and through
improved signage. For example there could be improved signage on the Great
Western Highway directing tourists to ‘Historic Portland’.
Business and Retail Strategy / Lithgow City Council
April 2010 SGS Final Business and Retail Strategy.doc P. 90
Time frame: Short.
Resource requirements: Minimal.
Rationale: Portland is an attractive historic village. It is unknown to many of the
people travelling to (or through) the area. Increased tourism will support existing
businesses and may encourage some to extend weekend trading hours.
Action P5 Provide a community transport service to allow residents in Portland to access the
town centre, or to travel to Lithgow.
Time frame: Short and ongoing.
Resource requirements: Moderate.
Rationale: Portland is home to an ageing population. Public transport connections
with Lithgow are poor. It is unrealistic to expect that all services and a wide range
of retailing will be available in Portland. As such, community transport offers an
effective means to ensure access to services for all members of the community,
particularly older people.
Action P6 Adopt design guidelines for the conversion of old shop fronts to alternative uses.
This can be incorporated within a development control plan, supporting the
principle LEP.
Time frame: Short.
Resource requirements: Minimal.
Rationale: Over the long term it is unlikely that existing shop fronts will continue
to be used for the purposes of retailing. Alternative uses such as residential need to
be considered. Conversion needs to be carried out in a way that is sensitive to the
existing streetscape and does not impact on the appearance of the town or
opportunities to attract tourists. Flexibility should be maintained to allow for
potential reuse for retail in future if the demand arises.
Zoning Recommendation: Zone B2 - Local Centre to be applied to the town centre. This zone,
as opposed to B1, seeks also to accommodate uses which meet the needs of
visitors as well as local residents.
Add objective to the B2 - Local Centre zone:
• to support the development of cultural and tourist facilities in Lithgow town
centre and Portland Village
Apply an FSR limit of 1:1. This may be reviewed over the longer-term if sufficient
demand can be demonstrated.

Business and Retail Strategy / Lithgow City Council
April 2010 SGS Final Business and Retail Strategy.doc P. 91
Principles for Portland
It is beyond the scope of this study to provide detailed and comprehensive urban design guidance.
However some of the most important principles are shown on the following diagrams, including:
• Locating some new housing on the opposite side of the street at the western end of Williwa
Street
• Provide a public street edge to all public open space (as opposed to rear and side fences)
• Continuation of street alignments to provide visual continuity and extension of public access
into the Boral site (as opposed to the creation of disconnected ‘enclaves’)
• Clearly defined public domain that is continuous and extends through the site.
• New residential confined to lower areas and not abutting existing residential in order to
maximise the potential for a landscaped setting and to preserve the amenity of existing
dwellings
• Extend public street system to provide address points for adapted existing buildings
• Provide some ‘normal’ light industrial unit potential but screen these from the heritage building
with ‘higher quality’ or finer grain ‘incubator’ premises and workshops as suggested in the
community submission.
Figure 23. Port land possib le future urban form

Business and Retail Strategy / Lithgow City Council
April 2010 SGS Final Business and Retail Strategy.doc P. 92
Figure 24. Port land urban design pr inc ip les

Business and Retail Strategy / Lithgow City Council
April 2010 SGS Final Business and Retail Strategy.doc P. 93
6.2 Economic Development Objectives and Actions
The following strategic directions will guide the retail and business strategy for Lithgow LGA.
Actions for implementation have been identified.
Objective 1: Encourage residents to shop locally
To reduce escape expenditure Lithgow City Council will strive to encourage residents to continue to
shop locally, building on the existing desire of residents to support local businesses. There are
many ways in which residents can be encouraged to shop locally. This includes improving the
appearance of centres, ensuring appropriate planning controls are in place to accommodate (and
not constrain) new business and further promotion of local businesses. Place specific actions are
included in Section 6.1.
Action ED 1 Coordinate joint marketing to support businesses which extend their trading hours,
particularly cafes in the evening and on Sunday. This may be trialled over a short
period, for example in the lead up to Celebrate Lithgow, or in January in association
with some type of summer festival. Time frame: Short. Resource
requirements: Minimal.
Action ED 2 Provide funding to Lithgow Business Association to develop branding for local
products, or locally owned businesses. Time frame: Short. Resource
requirements: Moderate.
Action ED 3 Request Expressions of Interest from potential stall holders to assess demand for
local markets. For example, these could be held on the pedestrian mall near the
post office, or be incorporated within the Cultural Precinct, located at the eastern
end of Lithgow. Monthly markets could have a particular focus, for example food or
arts and crafts. Time frame: Short. Resource requirements: Moderate.
Action ED 4 Work with the local paper or radio to profile a new or interesting business each
week. This may be prepared by Council’s Economic Development Officer and
published by the paper. Time frame: Short. Resource requirements: Minimal.
Action ED 5 Better promote existing events through Council’s website, the local newspaper and
signage within Lithgow Centre. In the weeks prior to Celebrate Lithgow, there
appeared to be only minimal advertising within the centre. Visitors or new
residents may be unaware of the event. Time frame: Ongoing. Resource
requirements: Minimal to Moderate.
Action ED 6 Investigate funding opportunities to upgrade community facilities to ensure that
they meet the needs of the broader community (Eg Lithgow swimming pool,
cultural facilities, public amenities). Time frame: Ongoing. Resource
requirements: Significant.

Business and Retail Strategy / Lithgow City Council
April 2010 SGS Final Business and Retail Strategy.doc P. 94
Objective 2: Encourage local businesses to strive for excellence
Local businesses can be encouraged to achieve excellent standards of customer service and
presentation. Consultation indicated that some businesses were happy operating the same way
that they always had, with some businesses happy to accept mediocrity. Motivation for change is
required.
Action ED 7 Encourage BEC to offer short-course or seminars within Lithgow on ways to
improve existing businesses, for example in merchandising. Organisational or in
kind support may be provided by Council. Time frame: Short. Resource
requirements: Minimal.
Action ED 8 Continue to support the staging of Lithgow LGA Business Awards, to promote
business excellence and inspire local businesses to improve the quality of
presentation and service. This may be achieved in partnership with other
organisations such as the Lithgow Business Association, or a sponsor, such as the
local newspaper. Time frame: Short. Resource requirements: Moderate.
Objective 3: Develop tourism industry
While there is limited tourism within the Lithgow area at present, there are opportunities to attract
people seeking a short-break from Sydney or day-trippers. Attractions such as the Zig Zag Railway
and Hartley Village already attract visitors to the area. However, some obstacles must be
overcome. At present accommodation within Lithgow LGA is limited. Businesses only trade limited
hours on the weekend, with many residents noting that it is difficult to get a cup of coffee on
Sunday afternoon, as most businesses are closed (see Action ED 1).
Action ED 9 Improve the promotion of Lithgow and surrounds, by developing further reciprocal
arrangements with other tourist information offices. Time frame: Ongoing.
Resource requirements: Minimal to Moderate.
Action ED 10 Prepare a business case for tourist accommodation. By illustrating a shortage of
accommodation within the area Council may be able to attract additional
accommodation providers. Time frame: Medium. Resource requirements:
Moderate.
Action ED 11 Implement a grants program which provides matched funding for the painting and
preservation of heritage shop fronts in Lithgow, Wallerawang and Portland. Time
frame: Medium. Resource requirements: Moderate.
Objective 4: Consolidate Lithgow’s Centres
At present, there is an oversupply of retail and business floorspace within Lithgow LGA. Additional
floorspace has been approved within Lithgow Valley Plaza and businesses uses, such as bulky
goods retailing and light industrial are being considered at Marrangaroo. Council should pursue
opportunities to consolidate commercial and business floorspace within existing centres, and
consider opportunities for alternative uses (see Section 6.1). At issue at Marrangaroo is not simply

Business and Retail Strategy / Lithgow City Council
April 2010 SGS Final Business and Retail Strategy.doc P. 95
the potential for over-supply, but also the visual and aesthetic impact of strip development along
one of the main approach roads to Lithgow. Design criteria may be required to ensure sympathetic
conversion to alternative uses for underutilized space in the town centre.
Action ED 12 Avoid rezoning to allow for business uses, such as bulky goods retailing, in out of
centre locations until demand can be demonstrated and when the out of centre
operation would not jeopardise the economic viability of the centre. It is unlikely
that a large scale bulky goods precinct could be supported by the current retail
catchment unless significant population growth occurred, and the visual impact
could undermine the attractiveness of the approaches to town. Time frame:
Short and ongoing. Resource requirements: None.
Action ED 13 Promote temporary uses for vacant shop fronts by subsidising rent over a short
time period or implementing a scheme in line with Renew Newcastle (see text
box). Consultations have indicated that previous attempts at temporary uses
such as art installations were unsuccessful. However, this avenue should continue
to be explored. Potentially ‘pop- up’ shops, restaurants and bars or exhibitions
are temporary uses which may add to the vibrancy of an area. Time frame:
Short. Resource requirements: Moderate.
Case Study: Renew Newcastle
Vacant buildings have been identified as a problem within the New castle CBD, many are vandalised or poorly maintained. To
combat this issue, Renew Newcastle was established ‘to find artists, cultural projects and community groups to use and
maintain these buildings until they become commercially viable or are redeveloped’.
This not for profit organisation aims to match appropriate spaces with appropriate uses. Property owners licence their
properties to Renew Newcastle, for a nominal sum and Renew Newcastle manages any short-term uses, including basic
maintenance and insurance. Building ‘custodians’ (that is the cultural or community users), pay a fee of $20 per week, with the
expectation that this amount will increase to the level of market rent if the enterprise becomes commercially successful. While
costs are reported to be low, a high degree of support from the creative community is necessary.
Temporary uses which are part of Renew Newcastle include an organic food co-op, galleries, artists, studios, milliners and other
artisans.
Objective 5: Promote Lithgow to new residents
Lithgow’s strengths as a residential location should be promoted. Lithgow offers a strong
community spirit, country lifestyle and affordable housing, all within a short distance of Sydney. As
the relative affordability of housing within Sydney declines, the Lithgow area may appear more
attractive to those, such as consultants and small business owners, who are not tied to a specific
location. They will be attracted by affordable property in a lifestyle area. To some extent Lithgow
may be attractive to artists and creative industry, driven by these factors.

Business and Retail Strategy / Lithgow City Council
April 2010 SGS Final Business and Retail Strategy.doc P. 96
Action ED 14 Promote Lithgow as an attractive place to live. Firstly, unique selling points of
Lithgow need to be identified for example highlighting relatively affordable
housing prices. Then Lithgow should be actively promoted through Council’s
website. This could be complemented by joint advertising by real estate agents in
Sydney newspapers, coordinated by Council. Time frame: Ongoing. Resource
requirements: Moderate.
Action ED 15 Target promotion of Lithgow to industries where skill shortages have been
demonstrated, for example professionals, or people employed in the mining
industry. Time frame: Ongoing. Resource requirements: Minimal.
Objective 6: Support growth in centres as part of a broader economic development objective
Planning for business and retail must be considered as part of a broader economic development
initiative. Retailing is in essence tied to the local population and workforce. Opportunities for
industry development, promoting employment and population growth within the region, should be
explored.
Action ED 16 Implement the recommendations of the Wallerawang Industrial Study. Time
frame: Long. Resource requirements: Significant.
Action ED 17 Maintain communication with the local business community through the
Economic Development Advisory Committee and the Lithgow Business
Association. Additional communication channels could be explored, including a
bi-annual business newsletter highlighting any new Council initiatives. Time
frame: Ongoing. Resource requirements: Minimal.
Action ED 18 In line with the strategic plan, lobby education providers to provide some
courses locally, for example through a regional campus and advocate for the
local TAFE to provide a broader range of courses locally. Time frame: Short to
Medium. Resource requirements: Minimal.
Action ED 19 Consider incentives for business start-ups such as a one year rate holiday for
new businesses or businesses which have moved to the LGA. Time frame:
Short. Resource requirements: Moderate (forgone income)
Action ED 20 Support business start-ups by using Council owned premises as incubator space.
An audit of Council owned buildings may identify opportunities for adaptive
reuse of heritage buildings or another ideal location for a council operated
business incubator. Alternatively the old small arms complex may provide an
opportunity to accommodate start-up businesses. This may be located within
the cultural precinct. Demand for a business incubator should be assessed,
followed by preparation of a full feasibility study and business plan. Time
frame: Short to Medium. Resource requirements: Moderate.
Action ED 21 Encourage local restaurants and cafes to showcase local products. Consider
opportunities to promote concepts such as slow foods, and promote food

Business and Retail Strategy / Lithgow City Council
April 2010 SGS Final Business and Retail Strategy.doc P. 97
security. This could be achieved in partnership with the Lithgow Business
Association. Time frame: Short. Resource requirements: Minimal.
Action ED 22 Disseminate information on available grants and funding sources for example
the Regional Business Employment Fund. This may be through Council’s website
or through the BEC. Time frame: Short. Resource requirements: Minimal.
Objective 6: Monitor and Re-evaluate
Planning for business and retail is an ongoing process. Council needs to monitor the supply and
demand for retail and business floorspace at reasonable intervals.
Action ED 23 Council to review this retail and businesses strategy in five years to take into
account population and employment growth and change. Triggers for change
include less than 5% vacancy in retail and commercial floorspace. Time frame:
Medium. Resource requirements: Moderate.
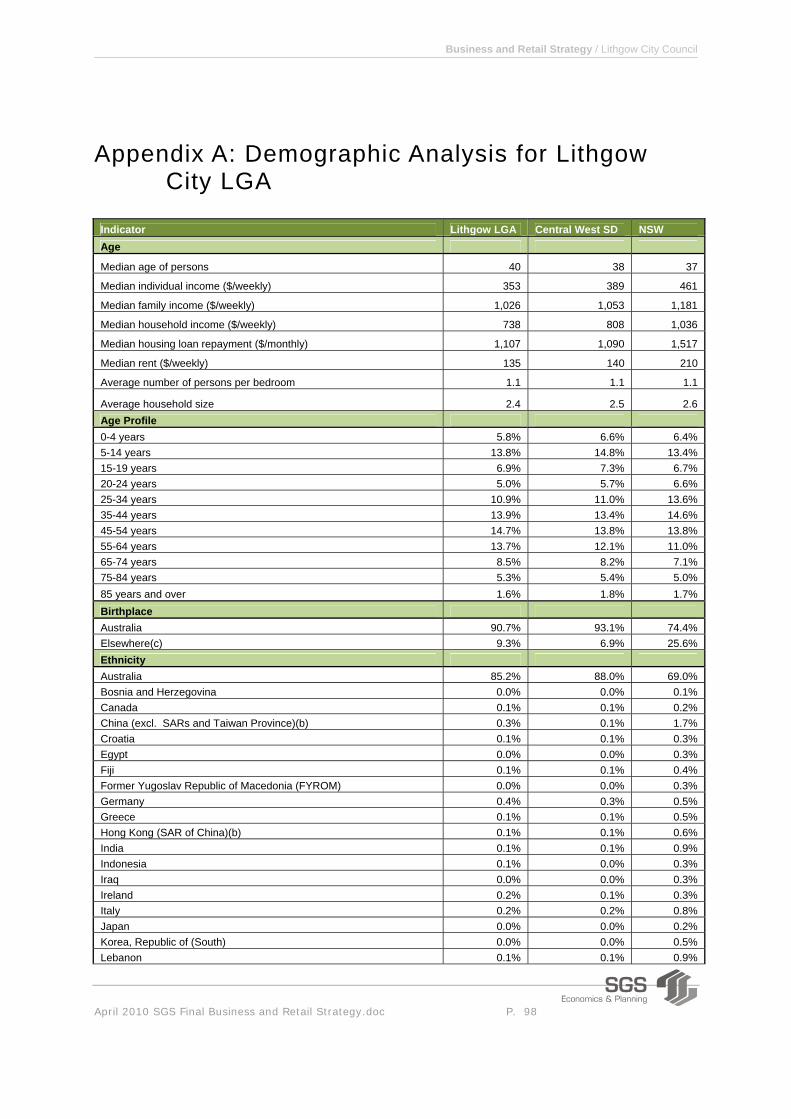
Business and Retail Strategy / Lithgow City Council
April 2010 SGS Final Business and Retail Strategy.doc P. 98
Appendix A: Demographic Analysis for Lithgow
City LGA
Indicator Lithgow LGA Central West SD NSW Age
Median age of persons 40 38 37
Median individual income ($/weekly) 353 389 461
Median family income ($/weekly) 1,026 1,053 1,181
Median household income ($/weekly) 738 808 1,036
Median housing loan repayment ($/monthly) 1,107 1,090 1,517
Median rent ($/weekly) 135 140 210
Average number of persons per bedroom 1.1 1.1 1.1
Average household size 2.4 2.5 2.6 Age Profile 0-4 years 5.8% 6.6% 6.4% 5-14 years 13.8% 14.8% 13.4% 15-19 years 6.9% 7.3% 6.7% 20-24 years 5.0% 5.7% 6.6% 25-34 years 10.9% 11.0% 13.6% 35-44 years 13.9% 13.4% 14.6% 45-54 years 14.7% 13.8% 13.8% 55-64 years 13.7% 12.1% 11.0% 65-74 years 8.5% 8.2% 7.1% 75-84 years 5.3% 5.4% 5.0% 85 years and over 1.6% 1.8% 1.7% Birthplace Australia 90.7% 93.1% 74.4% Elsewhere(c) 9.3% 6.9% 25.6% Ethnicity Australia 85.2% 88.0% 69.0% Bosnia and Herzegovina 0.0% 0.0% 0.1% Canada 0.1% 0.1% 0.2% China (excl. SARs and Taiwan Province)(b) 0.3% 0.1% 1.7% Croatia 0.1% 0.1% 0.3% Egypt 0.0% 0.0% 0.3% Fiji 0.1% 0.1% 0.4% Former Yugoslav Republic of Macedonia (FYROM) 0.0% 0.0% 0.3% Germany 0.4% 0.3% 0.5% Greece 0.1% 0.1% 0.5% Hong Kong (SAR of China)(b) 0.1% 0.1% 0.6% India 0.1% 0.1% 0.9% Indonesia 0.1% 0.0% 0.3% Iraq 0.0% 0.0% 0.3% Ireland 0.2% 0.1% 0.3% Italy 0.2% 0.2% 0.8% Japan 0.0% 0.0% 0.2% Korea, Republic of (South) 0.0% 0.0% 0.5% Lebanon 0.1% 0.1% 0.9%

Business and Retail Strategy / Lithgow City Council
April 2010 SGS Final Business and Retail Strategy.doc P. 99
Indicator Lithgow LGA Central West SD NSW Malaysia 0.1% 0.1% 0.4% Malta 0.1% 0.1% 0.3% Netherlands 0.3% 0.3% 0.3% New Zealand 1.0% 0.8% 1.6% Papua New Guinea 0.1% 0.0% 0.1% Philippines 0.3% 0.2% 0.9% Poland 0.1% 0.1% 0.2% Singapore 0.0% 0.0% 0.1% South Africa 0.1% 0.2% 0.5% South Eastern Europe, nfd(c) 0.1% 0.0% 0.2% Sri Lanka 0.1% 0.0% 0.3% Thailand 0.0% 0.0% 0.2% Turkey 0.0% 0.0% 0.2% United Kingdom(d) 3.4% 2.3% 4.1% United States of America 0.2% 0.1% 0.3% Viet Nam 0.0% 0.0% 1.0% Born elsewhere(e) 0.9% 0.8% 4.2% Country of birth not stated 6.1% 5.5% 7.2% Family type Couple family with no children 39.8% 40.1% 36.0% Couple family with: children under 15 and: dependent students and non-dependent children 0.8% 0.9% 0.9% dependent students and no non-dependent children 4.3% 4.8% 4.6% no dependent students and non-dependent children 2.0% 1.7% 1.6% no dependent students and no non-dependent children 22.0% 23.7% 24.2% Total 29.1% 31.1% 31.4% no children under 15 and: dependent students and non-dependent children 1.7% 1.6% 2.4% dependent students and no non-dependent children 2.7% 3.1% 3.5% no dependent students and non-dependent children 8.2% 7.0% 8.9% Total 12.5% 11.8% 14.8% Total 41.6% 42.8% 46.2% One parent family with: children under 15 and: dependent students and non-dependent children 0.2% 0.2% 0.2% dependent students and no non-dependent children 1.1% 1.0% 1.1% no dependent students and non-dependent children 0.7% 0.6% 0.7% no dependent students and no non-dependent children 7.7% 7.5% 6.7% Total 9.7% 9.4% 8.7% no children under 15 and: dependent students and non-dependent children 0.4% 0.4% 0.6% dependent students and no non-dependent children 1.1% 1.2% 1.4% no dependent students and non-dependent children 5.8% 4.7% 5.4% Total 7.3% 6.3% 7.4% Total 17.0% 15.7% 16.1% Other family 1.6% 1.4% 1.7% Total 100.0% 100.0% 100.0% Household Type Family Household 66.3% 68.0% 67.9% Lone person Household 27.7% 25.7% 22.8% Group 2.0% 2.7% 3.5% Other 4.0% 3.6% 5.8%

Business and Retail Strategy / Lithgow City Council
April 2010 SGS Final Business and Retail Strategy.doc P. 100
Indicator Lithgow LGA Central West SD NSW Total 100.0% 100.0% 100.0% Household Income Negative/Nil income 1.1% 1.2% 1.2% $1-$149 2.0% 1.9% 1.5% $150-$249 8.8% 7.1% 5.2% $250-$349 10.2% 8.8% 7.0% $350-$499 7.6% 6.7% 5.2% $500-$649 11.6% 12.0% 10.0% $650-$799 6.3% 6.5% 6.0% $800-$999 6.4% 6.9% 6.5% $1,000-$1,199 8.1% 10.5% 9.9% $1,200-$1,399 4.4% 5.3% 5.1% $1,400-$1,699 6.3% 6.5% 7.2% $1,700-$1,999 5.9% 5.3% 5.9% $2,000-$2,499 4.7% 4.6% 6.0% $2,500 -$2,999 3.8% 3.3% 6.0% $3,000 or more 2.6% 2.5% 6.0% Partial income stated(c) 6.8% 7.5% 8.3% All incomes not stated(d) 3.3% 3.4% 2.9% Total 100.0% 100.0% 100.0% Dwelling Structure Separate house 91.3% 90.0% 71.4% Semi-detached, row or terrace house, townhouse etc. with: One storey 4.0% 3.0% 5.0% Two or more storeys 0.8% 0.5% 4.7% Total 4.8% 3.5% 9.7% Flat, unit or apartment: In a one or two storey block 2.7% 4.9% 6.4% In a three storey block 0.2% 0.2% 5.6% In a four or more storey block 0.0% 0.1% 5.5% Attached to a house 0.1% 0.1% 0.2% Total 3.0% 5.3% 17.7% Other dwelling: Caravan, cabin, houseboat 0.3% 0.6% 0.7% Improvised home, tent, sleepers out 0.1% 0.1% 0.1% House or flat attached to a shop, office, etc. 0.4% 0.5% 0.3% Total 0.8% 1.1% 1.1% Dwelling structure not stated 0.1% 0.1% 0.1% Total 100.0% 100.0% 100.0% Migration
Lived at same address 1 year ago(g)
15,968
135,719
5,139,826 Lived at different address 1 year ago(g) 2319 24965 927019 Lived at different address 1 year ago(g) 12.7% 15.5% 15.3%
Lived at same address 5 years ago(h)
11,147
89,308
3,369,030
Lived at different address 5 years ago(h)
6,124
61,048
2,322,153 Lived at different address 5 years ago(h) 35.5% 40.6% 40.8% Tenure type 2006 Fully owned 42.8% 39.9% 34.8% Being purchased(b) 28.7% 30.1% 31.9% Rented:

Business and Retail Strategy / Lithgow City Council
April 2010 SGS Final Business and Retail Strategy.doc P. 101
Indicator Lithgow LGA Central West SD NSW Real estate agent 10.9% 12.1% 16.7% State or territory housing authority 5.8% 4.8% 4.7% Person not in same household(c) 6.1% 5.9% 5.6% Housing co-operative/community/church group 0.4% 0.7% 0.6% Other landlord type(d) 0.8% 1.7% 1.1% Landlord type not stated 0.8% 1.3% 0.8% Total 24.9% 26.5% 29.5% Other tenure type(e) 0.9% 0.8% 0.8% Tenure type not stated 2.6% 2.7% 2.9% Total 100.0% 100.0% 100.0% Non-school qualifications(a): Postgraduate Degree 0.7% 1.2% 3.1% Graduate Diploma and Graduate Certificate 0.8% 1.0% 1.3% Bachelor Degree 4.9% 7.2% 12.1% Advanced Diploma and Diploma 4.7% 5.5% 7.4% Certificate Level 21.3% 19.6% 16.8% Labour Force Summary Labour force status(a): Employed, worked full-time(b) 30.3% 34.8% 35.8% Employed, worked part-time 15.1% 16.1% 16.1% Employed, away from work(c) 3.1% 3.6% 3.6% Unemployed, looking for work 4.5% 3.6% 3.5% Total labour force 53.0% 58.2% 58.9% Non-school qualifications(a): Postgraduate Degree 0.7% 1.2% 3.1% Graduate Diploma and Graduate Certificate 0.8% 1.0% 1.3% Bachelor Degree 4.9% 7.2% 12.1% Advanced Diploma and Diploma 4.7% 5.5% 7.4% Certificate Level 21.3% 19.6% 16.8% Employment by Industry % Agriculture, forestry & fishing 3.4% 11.9% 2.7% Mining 10.0% 3.4% 0.7% Manufacturing 8.2% 9.7% 9.6% Electricity, gas, water & waste services 5.1% 1.6% 1.0% Construction 6.2% 6.1% 7.3% Wholesale trade 1.8% 2.8% 4.7% Retail trade 11.2% 11.2% 11.1% Accommodation & food services 8.8% 6.5% 6.5% Transport, postal & warehousing 5.3% 4.5% 5.0% Information media & telecommunications 0.7% 1.1% 2.4% Financial & insurance services 1.8% 1.7% 5.0% Rental, hiring & real estate services 1.1% 1.1% 1.7% Professional, scientific & technical services 2.8% 3.3% 7.3% Administrative & support services 3.1% 2.0% 3.1% Public administration & safety 8.3% 7.1% 6.0% Education & training 6.0% 8.4% 7.6% Health care & social assistance 9.9% 10.9% 10.5% Arts & recreation services 1.0% 0.8% 1.4% Other services 3.4% 3.6% 3.8% Inadequately described/Not stated 2.0% 2.1% 2.7% Total 100.0% 100.0% 100.0% Employment by Occupation %

Business and Retail Strategy / Lithgow City Council
April 2010 SGS Final Business and Retail Strategy.doc P. 102
Indicator Lithgow LGA Central West SD NSW Managers 10.6% 17.9% 13.6% Professionals 11.5% 14.6% 21.2% Technicians & trades workers 17.6% 14.6% 13.6% Community & personal service workers 11.1% 9.1% 8.6% Clerical & administrative workers 13.0% 12.1% 15.4% Sales workers 8.9% 9.0% 9.7% Machinery operators and drivers 13.2% 8.2% 6.4% Labourers 12.3% 13.0% 9.5% Inadequately described / Not stated 1.7% 1.6% 1.9% Total 100.0% 100.0% 100.0% Number of vehicles per dwelling None 12.3% 9.4% 11.6% 1 motor vehicle 35.3% 34.8% 38.3% 2 motor vehicles 33.6% 35.5% 33.1% 3 motor vehicles 10.0% 11.3% 9.1% 4 or more motor vehicles 4.7% 5.3% 3.9% Total 96.0% 96.2% 96.1% Number of motor vehicles not stated 4.0% 3.8% 3.9% Total 100.0% 100.0% 100.0%
Business and Retail Strategy / Lithgow City Council
April 2010 SGS Final Business and Retail Strategy.doc P. 103
Appendix B: Policy Review
Social Plan 2006-2011 (December 2008)
Lithgow’s Social Plan identifies the community’s strengths, weaknesses and opportunities, and
hopes to enhance the social well-being of the LGA’s population.
In Lithgow LGA it identifies ‘Young People’, (people aged between 15 and 24 years), as
representing 14% of the total labour force. In 2006, a significant proportion of ‘Young People’
were employed in Accommodation, Cafes and Restaurants sector (23.4%). This was followed by
22.7% employed in Retail and Trade, 7.8% in Construction and 7.8% in Manufacturing. In the
category ‘Young People’, two thirds of the people employed in the Retail industry are female.
Males indicated the need for economic development activities, specifically relating to employment,
retail and other industry. Council has stated this will be addressed further in their Strategic Plan.
Marrangaroo Local Environmental Study 2006
Prepared by Geolyse for Lithgow City Council in June 2006, the Marrangaroo Local Environmental
Study provides a local environmental study and structure plan to identify the ‘highest and best use’
of the land for sustainability, capability, community needs and expectations, environmental impact
and economic allocation of resources purposes.
Marrangaroo is located five minutes north of Lithgow and covers an area of 1,100 ha which is split
by the Great Western Highway and the Main Western Rail Line. The eastern side of the site is
zoned 2(a) Residential, while the remainder of the land is zoned 1(a) Rural (General).
Lithgow’s economy is centred on mining and power generation. This will continue, though both
sectors have been impacted by the removal of trade barriers, the privatisation of state utilities and
efficiency goals of competition policy.
Between 1991 and 2001 the retailing sector in Lithgow experienced workforce growth. It is
estimated that $150 million is spent per year by residents in the trade area (Baker, 2006). Bulky
goods retailing is also expected to be centralised in a retail park, which will further bolster
employment.
The majority of commercial development is located on Main Street in Lithgow, in the Village Plaza
Shopping Centre and the Pottery Estate. Currently, the area lacks any big retailers, such as Big W
or Kmart. However, Target is extending into a full-line store. Leyshon (2002) noted there is a
significant level of escape expenditure from the Lithgow trade area in general retail and bulky
goods to areas such as Penrith and to a lesser extent Bathurst.

Business and Retail Strategy / Lithgow City Council
April 2010 SGS Final Business and Retail Strategy.doc P. 104
There is the capacity for further business development along Main Street and in nearby industrial
zones for bulky goods or outlet retailing. A proposed rezoning at Pottery Estate will release further
land in this area.
Development at Marrangaroo would support Lithgow as the primary centre. Potential commercial
and industrial development would need to be carefully considered so as not to detract from Lithgow
CBD.
Marrangaroo Draft Structure Plan 2006
In 2005, to meet future growth, Lithgow Council identified the need for additional residential,
commercial and industrial land in close proximity to Lithgow centre in 2005 to meet future growth.
Marrangaroo was identified as a suitable site. The Structure Plan adopts Land Use Option 3 (as
shown in the map below) from the Local Environmental Study and provides:
• The preferred land uses and their location,
• Areas to be conserved and protected from future development,
• Key infrastructure needs and preliminary costs, and
• A staging plan.

Business and Retail Strategy / Lithgow City Council
April 2010 SGS Final Business and Retail Strategy.doc P. 105
Lithgow’s economy is centred on mining and power generation. The Bells Line of Road is also
expected to provide Lithgow with long term economic prospects. Lithgow also has a small light
manufacturing and engineering sector. ADI employed 110 people (in 2005), with other businesses
also expanding. This highlights the potential for growth in this sector.
Ferrero Australia has a confectionary plant which employed 85 full time staff and 45 casual staff (in
2005). Government enterprises also have a major economic base in the LGA, with Lithgow
Correctional Centre employing 167 people, Police Assistance Line employing 84 people and State
Debt Recovery Office employing 180 people (in 2005).
Some of the new employment opportunities include:
• Three extended coal mines at Pinedale, Clarence and Lamberts Gully with potential of 135 new
jobs.
• Emirates Hotels’ (Australia) luxury eco-tourism resort in Wolgan Valley, situated 35km north of
Lithgow. This will have direct and flow-on impacts for region, as it is expected to generate 110
full-time equivalent jobs in its first year.
• Three major project applications under consideration by Department of Planning for Angus
Place extension, Ivanhoe North rehabilitation project and Invincible open cut. This is estimated
to generate 240 jobs.
• Approval for new motel, conference room and ancillary restaurant.
• Approval for 74 single storey two and three bedroom units in six stages off Hoskins Avenue and
Hayley Street in Lithgow.
• New Woolworths service station under construction.
Table 20. Exist ing Business and Industr ia l Supply in Li thgow
Zone Location Zoned Land (area or
lots)
Status
3 Business (Lithgow) Pottery Estate 52,000m2 Proposal for a centre to include four cinema
complex, restaurants and large retail stores
4 Industrial (Lithgow) ADI Site 1,500m2 minimum lot
size
Partial development of site approved and
under construction
4 Industrial (Lithgow) Mort Street (old
gasworks)
two lots (possibly more
with remediation)
Vacant and ready for development
4 Industrial (Lithgow) O’Connor Street (Rail
Infrastructure Corp)
3.114ha over two sites Unsubdivided and adjoins the railway line
Table 21. Five land uses are proposed under the Structure Plan for Marrangaroo
Land Use Category Uses include: Land Use Precincts
Land Use 1 Highway/Business
Services
Establishment of businesses along
highway such as office, retail and light
industrial uses
Will include uniform lot sizes, with
a mix of businesses and dwellings
Land Use 2 Employment Industrial, warehousing, freight and Compatible with surrounding

Business and Retail Strategy / Lithgow City Council
April 2010 SGS Final Business and Retail Strategy.doc P. 106
Land Use Category Uses include: Land Use Precincts
Generation logistics uses, sensitive to environment
and water catchments
Land Use 3 Large Lot Residential Three different types of densities Provide one large area for urban
living with a range of housing
options
Land Use 4 Urban Wide range of housing types, community
facilities and services, open space,
neighbourhood centres
Provide one large area for urban
living with a range of housing
options
Land Use 5 Private Open
Space/commercial
recreation
Community facilities, indoor and outdoor
recreational space and facilities
Sensitive to environment and
landscape features
Table 21 lists the five land uses proposed under the Structure plan for Marrangaroo. In relation to
Land Use 1 (Highway/Business Services) the document states this could include such as:
Hardware and building supplies
Hotel accommodation
Landscape and garden supplies
Light industries
Passenger transport facilities
Warehouse or distribution centres
Draft Land Use Issues Paper 2009
The purpose of the Lithgow Land Use Issues Paper is to update data contained in the Lithgow Local
Profile, analyse trends presented in the Lithgow Local Profile, and explore key strategic land use
planning issues in the LGA.
Between 2001 and 2006, Lithgow LGA experienced a 3% population growth rate. This population
is forecast to remain static or slow for the next 25 years. The median age within the LGA has also
increased from 37 to 40 years of age. There is a substantial oversupply currently zoned residential
and rural residential land. Further future urban use lands and the Marrangaroo site compounds
this oversupply.
Cultural Plan 2008-2013
The Lithgow Cultural Plan aims to provide economic stability and growth through cultural
development in the region. The Cultural Plan along with the Lithgow Jobs Summit Report and
other planning instruments. The Plan identifies what individual towns, villages and localities in the
LGA require in terms of cultural development.
The Plan follows the same ten vision statements outlined in the Lithgow Strategic Plan, and was
prepared by Lithgow Council in conjunction with Lithgow Arts Council. A SWOT analysis concluded
that the strengths and opportunities in Lithgow include:

Business and Retail Strategy / Lithgow City Council
April 2010 SGS Final Business and Retail Strategy.doc P. 107
• Range and depth of cultural activities,
• Unique built and cultural heritage of area,
• Intangible cultural heritage,
• Opportunities for adaptive reuse and preservation of built heritage assets,
• Develop opportunities for further skills development outside of school activities,
• Promotion of community halls and community achievements.
The identified threats and weaknesses include:
• Perception that ‘things are better in other places’
• Conservatism
• Domination of sport and pub culture
• Lack of meeting/exhibition/workshop centre
• Small population base
• Lack of cultural perspective on the part of Council and internal culture of discouragement, and
• Lack of momentum and resources
The Plan will include a feasibility study into the development of a cultural precinct in Lithgow CBD.
This would include the development of a venue with a focus on the community which would
incorporate an Arts Precinct, Gallery, Theatre, Entertainment Centre and Research Archive.
Investigation of cultural precincts in Wallerawang and Portland should also be considered.
Economic development funding and opportunities need to be identified and prioritised. This will be
achieved through the provision of cultural employment positions, a youth job network to help
youths at risk gain education and job skills, new business incentives programs, ensure Lithgow is
connected to the Bells Line of Road Motorway, provision of support works for Indigenous and
Disabled communities, and further promote cultural development.
The new business incentives program would be aimed at attracting new businesses to the area.
This will include identification of industrial lands, the development of a strategy and the promotion
of potential developers. In Portland to attract new businesses a rental subsidy could be offered,
along with the development of a strategy to encourage creative/cottage industries and promote
Portland as a cultural heritage tourism destination.
Main Street Programs were developed in 1997, and will be reviewed to see if the recommendations
are still relevant. Any new considerations should regard the identification and implementation of
cultural precincts. There should also be a greater emphasis on marketing local products. This
could include a growers/organic market, foreign food events, development of a cooperative
concept, and a Made in Lithgow Enterprises (MILE).
Local Profile – Strategic Plan 2007
The Strategic Plan incorporates a Local Profile providing background information on Lithgow LGA.
The Local Profile provides a spatial and character analysis of each area within the LGA. While the

Business and Retail Strategy / Lithgow City Council
April 2010 SGS Final Business and Retail Strategy.doc P. 108
LGA does contain urban centres, many parts are evidently grazing land or of high environmental
significance.
Lithgow LGA covers an area of approximately 4,551sqm, and has a hierarchy of settlements.
Lithgow is identified as the major centre within the LGA, with a population of 11,033 (in 2001).
Portland and Wallerawang are secondary centres, with populations of 1,817 and 1,935 respectively
(in 2001).
Lithgow
Lithgow is the ‘dominant urban and administrative centre within the LGA’. The centre contains
greatest amount of services and facilities which support the local and surrounding populations.
Lithgow, Portland and Wallerawang centres all have an agricultural/scenic edge which has
functioned as a buffer to further development.
Rural-residential settlements are emerging as a transitionary development on the fringe of centres.
Many areas surrounding the centres also contain environmentally sensitive assets. It is thought in
the future development will progressively occur in some of these areas.
Urban settlement mainly occurred in Lithgow due to the construction of the Great Western Highway
from Sydney (in the early 1800s), and the completion of the railway line between Sydney and
Bathurst (in the late 1860s). The area underwent rapid industrialisation after the 1860s, with coal
mining, ironworks, meatworks, and pottery and brickworks all major industries contributing to the
character of the region.
During the 1900s, Lithgow was a series of villages connected by the retail and commercial services
along Main Street. The key services available in Lithgow centre include: community facilities such
as medical services, childcare services, educational services and recreational amenities; and retail
and commercial facilities and services such as supermarkets, department stores, local businesses,
restaurants and cafes, and professional and government offices.
Main Street is the core of Lithgow CBD, with Eskbank Street acting as the next primary street.
There is also a commercial area along Railway Parade. Lithgow CBD is characterised by heritage
buildings interspersed with modern buildings. Valley Plaza and Pottery Plaza is located to the south
of Main Street. It provides an alternative shopping location, and has impacted on the viability of
Main Street.
There is a current focus on the South Bowenfels Release Area, located primarily on the western
side of the Great Western Highway. This land will contain housing to be developed with traditional
suburban densities than that of established areas. Further land development is also identified in
the West Bowenfels zone.
Industrial land is dispersed throughout the town of Lithgow, with no defined industrial precinct.
The ADI site has land use conflicts between the industrial activities on site and the surrounding
residential development.

Business and Retail Strategy / Lithgow City Council
April 2010 SGS Final Business and Retail Strategy.doc P. 109
Portland
Portland was established as a town in 1906, and developed mainly around the limestone quarries
and cement works. The cement works became the major industry in the town, with Portland’s
population peaking in 1948 with 3,125 people. The cement works closed in 1991 leaving the town
with no major active industry.
The key services located within Portland include community facilities such as a district hospital,
aged care housing and recreational facilities; and retail and commercial facilities and services such
as a supermarket, post office, local businesses, and restaurants and cafes.
Portland town centre is concentrated around Williwa and Wolgan Streets, and contains many
historic buildings. The town centre has a ‘village’ atmosphere consisting of heritage buildings, arts
and crafts stores, bookshops and cafes. The disused cement works buildings on the northern side
of Williwa Street provide a physical industrial edge to the town centre, and provide an opportunity
to link the two areas.
Wallerawang
The railway line played an important role in the development of Wallerawang. The major industries
within the area are coal mining and power station activities. Wallerawang services include
community facilities such as council library and depot, medical and community health facilities, and
recreational facilities; and retail and commercial facilities and services such as a supermarket, post
office, local businesses, and hotels.
The settlement pattern of Wallerawang grew during the 1960s and 1970s with the development of
the Wallerawang Power Station, and is constrained by the railway lines which pass through Main
Street. Residential development is concentrated to the eastern side of the railway line, while the
town centre is located on the western side.
Wallerawang town centre contains both retail and commercial premises on the western side of Main
Street. The railway line and public space prevent development on the eastern side of the street.
Residential development also faces many natural boundaries including Lake Wallace, Wallerawang
Power Station, Lidsdale State Forest and flood prone land.
Lithgow LGA is bounded by six other LGAs, however, it main competition is Bathurst Regional LGA
to the west, and the City of the Blue Mountains in the east. 49% of the LGA is national park,
reserves or state forest. From 1991 to 1996 the LGA experienced a 4.96% population decrease.
However, between 1996 and 2001 only a 0.003% decrease occurred. This could have been largely
due to the restructuring of the coal and energy industries.
Lithgow City Local Environmental Plan 1994
The objective of relevant zones are listed below.

Business and Retail Strategy / Lithgow City Council
April 2010 SGS Final Business and Retail Strategy.doc P. 110
Zone No 2 (v) Village
The objectives of the zone are:
(a) to promote development which is compatible with an urban function within a rural area,
(b) to maintain the rural atmosphere of the village,
(c) to safeguard residential amenity within the village, and
(d) to prevent pollution of water supply catchments and water quality in major water storages.
Zone No 3 Business
The objectives of the zone are:
(a) to encourage a range of retail and commercial uses within the central business district,
(b) to encourage high density residential development in conjunction with business development,
and
(c) to accommodate retail, commercial and allied services within the City.
Zone No 4 Industrial
The objectives of the zone are:
(a) to designate sufficient land for industrial uses,
(b) to allow a wide range of industrial activities which by the nature of their operation may require
a large portion of the activities to be comprised of commercial, office or shop purposes in
conjunction with industry, and
(c) to allow appropriate bulky goods retailing.
Lithgow Main Street Study
The Lithgow Main Street Study aimed to ‘provide advice, information and guidance to building
owners, lessees and Council to enable adequate and effective consideration to be given to the
development of Main Street involving design and heritage conservation’. The Main Street Study
consisted of two stages, the first stage including:
• Preparation of a design concept of Main Street which establish design guidelines for the street
as a whole, and
• Provide a written report explaining the concept of the plan and general design and conservation
philosophy.
The study area examines Main Street, which is bounded by Bridge and Lithgow Streets. This area
comprises the majority of the CBD and Cook Street Plaza area. The Main Street Study provides
guidelines for:
• Landscape design,
• Conservation philosophy,
• Building height and alignment,

Business and Retail Strategy / Lithgow City Council
April 2010 SGS Final Business and Retail Strategy.doc P. 111
• Design controls for building signage,
• Building forms, facades and views, and
• Colour schemes.

Business and Retail Strategy / Lithgow City Council
April 2010 SGS Final Business and Retail Strategy.doc P. 112
Appendix C: Shopper Survey
A shopper survey was carried out to investigate the nature and distribution of resident spending
within the centres. This was completed in:
• Portland (18th November 2009)
• Wallerawang (19th November 2009)
• Lithgow (19th, 20th and 21st November 2009)
The following table show the distribution of responses received in terms of location, and
characteristics of respondents. Respondents were fairly evenly distributed across the centres.
However, compared to the local population, respondents were older and more likely to be female.
Time and Location – number of responses Place 18 19 20 21 Total Lithgow 72 12 84 Lithgow Valley Plaza 15 56 71 Portland 68 68 Wallerawang 58 58 Total 68 73 72 68 281 Time and Location - share Place 18 19 20 21 Total Lithgow 0% 0% 26% 4% 30% Lithgow Valley Plaza 0% 5% 0% 20% 25% Portland 24% 0% 0% 0% 24% Wallerawang 0% 21% 0% 0% 21% Total 24% 26% 26% 24% 100%
Survey – Respondents and Characteristics Gender Under 18 years 18 to 25 years 25 to 45 years 45 to 65 years Over 65 years Total Female 1 8 58 68 39 174 Male 7 26 40 30 103 Total 1 15 84 108 69 277 Survey – Respondent Characteristics (%) Gender Under 18 years 18 to 25 years 25 to 45 years 45 to 65 years Over 65 years Total Female 0% 3% 21% 25% 14% 63% Male 0% 3% 9% 14% 11% 37% Total 0% 5% 30% 39% 25% 100% Characteristics of the Lithgow LGA population Gender Under 18 years 18 to 25 years 25 to 45 years 45 to 65 years Over 65 years Female 12% 4% 13% 13% 8% 49% Male 12% 4% 13% 14% 6% 51% Total 24% 8% 26% 28% 14% 100%
Survey respondents were most likely to live in Lithgow, followed by Portland and Wallerawang.

Business and Retail Strategy / Lithgow City Council
April 2010 SGS Final Business and Retail Strategy.doc P. 113
Survey Location
Address Lithgow Lithgow Valley Plaza Portland Wallerawang Total Lithgow 47 41 2 6 96 Portland 3 1 46 4 54 Wallerawang 4 5 2 36 47 Cullen Bullen 2 1 4 7 Lidsdale 1 1 3 5 Marrangaroo 3 2 5 South Bowenfels 2 2 4 Bathurst 1 1 1 3 Ben Bullen 1 1 1 3 Bowenfels 1 2 3 East Portland 3 3 Hartley 3 3 Lithgow 2 1 3 Little Hartley 1 2 3 Littleton 3 3 Morts Estate 2 1 3 Pipers Flat 3 3 Blackheath 2 2 Clarence 1 1 2 Hartley Vale 2 2 Blacktown 1 1 Candos 1 1 Capertree 1 1 Dargan 1 1 Harpers Flat 1 1 Katoomba 1 1 Katoomba/Lithgow 1 1 Limekilns 1 1 Lydal 1 1 Maryborough Qld 1 1 Medow Flat 1 1 Mount Victoria 1 1 Mudgee 1 1 Oberon 1 1 Perth 1 1 Portland 1 1 Robina 1 1 Sodwalls 1 1 South Brownfield 1 1 Southport 1 1 Tasmania 1 1 Wentworth Falls 1 1 Not Stated 4 1 5 Grand Total 84 71 68 58 281
Survey questions are shown in red tables, with responses in green.

Business and Retail Strategy / Lithgow City Council
April 2010 SGS Final Business and Retail Strategy.doc P. 114
Question 1
1a. Where do you shop most often? 1. Lithgow 2. Wallerawang 3. Portland 4. Bathurst 5. Mudgee/Orange 6. Katoomba 7. Penrith 8. Sydney
1b. How frequently do you shop there? Several times a week Weekly Fortnightly Monthly
The majority of respondents shopped mainly at Lithgow (78%). In general, people surveyed are likely to shop weekly (37%) or several times a week (46%).
How frequently do you shop there Place Several times Weekly Fortnightly Monthly Not stated Total Lithgow 96 94 20 3 6 219 Portland 19 3 2 3 27 Wallerawang 10 1 1 12 Bathurst 2 3 2 7 Katoomba 1 1 1 1 4 Sydney 1 1 1 3 Bathurst/Penrith 1 1 2 Mudgee/Orange 2 2 Penrith 1 1 Perth 1 1 Queensland 1 1 Southport Qld 1 1 Wentworth Falls 1 1 Total 129 105 29 5 13 281 How frequently do you shop there (%) Place Several times Weekly Fortnighly Monthly Not stated Total Lithgow 34% 33% 7% 1% 2% 78% Portland 7% 1% 1% 0% 1% 10% Wallerawang 4% 0% 0% 0% 0% 4% Bathurst 1% 1% 1% 0% 0% 2% Katoomba 0% 0% 0% 0% 0% 1% Sydney 0% 0% 0% 0% 0% 1% Bathurst/Penrith 0% 0% 0% 0% 0% 1% Mudgee/Orange 0% 0% 1% 0% 0% 1% Penrith 0% 0% 0% 0% 0% 0% Perth 0% 0% 0% 0% 0% 0% Queensland 0% 0% 0% 0% 0% 0% Southport Qld 0% 0% 0% 0% 0% 0% Wentworth Falls 0% 0% 0% 0% 0% 0% Total 46% 37% 10% 2% 5% 100%

Business and Retail Strategy / Lithgow City Council
April 2010 SGS Final Business and Retail Strategy.doc P. 115
1.c What shopping do you mainly do there? 1d. Average spend per W/F/M? 1 Food/Grocery shopping 2 Take away food 3 Clothing or footwear shopping 4 Newspaper, Confectionary shopping 5 Household goods shopping, electrical goods shopping 6 Using service: bank, post office, hairdresser 7 Eating/drinking out; Having a drink in a pub or bar
8 Having a coffee/visiting a cafe 9 Other social/leisure 10 Window shopping 11 Personal business
Main shopping location by type of shopping done is shown in the table below, with the total value
recorded, by location and type shown overleaf. Lithgow accounted for the majority of the ‘spend’
recorded by the survey.
What shopping do you mainly do there?
Location Food
/Gro
cery
sh
oppi
ng
Take
aw
ay fo
od
Clo
thin
g or
fo
otw
ear
shop
ping
New
spap
er,
Con
fect
iona
ry
shop
ping
Hou
seho
ld
good
s sh
oppi
ng,
elec
trica
l goo
ds
Usi
ng s
ervi
ce:
bank
, pos
t offi
ce,
haird
ress
er
Eat
ing/
drin
king
ou
t;
Hav
ing
a co
ffee/
visi
ting
a ca
fe
Oth
er
soci
al/le
isur
e (c
inem
a/in
door
po
ol/s
how
)
Bul
ky g
oods
su
ch a
s fu
rnitu
re,
whi
te g
oods
,
Med
ical
S
peci
alis
t
Oth
er:
Bathurst 6 1 3 0 2 2 2 1 1 1 1 0 Bathurst/Penrith 1 0 2 0 1 1 1 1 0 0 0 0 Katoomba 3 0 0 1 1 1 0 0 0 0 0 0 Lithgow 216 56 129 77 104 112 80 60 10 7 16 0 Mudgee/Orange 2 1 2 0 1 1 1 0 0 0 0 0 Penrith 0 0 0 0 0 0 0 0 0 0 1 0 Perth 1 0 0 0 0 0 0 0 0 0 0 0 Portland 24 7 2 10 2 8 5 3 2 3 2 2 Queensland 0 0 0 0 0 0 0 0 0 0 0 0 Southport Qld 1 0 0 0 0 0 0 0 0 0 0 0 Sydney 1 0 2 0 0 0 1 0 0 0 0 0 Wallerawang 12 2 0 3 1 2 3 0 0 0 0 0 Wentworth Falls 0 0 0 0 0 0 0 0 0 0 0 0 Grand Total 267 67 140 91 112 127 93 65 13 11 20 2

Business and Retail Strategy / Lithgow City Council
April 2010 SGS Final Business and Retail Strategy.doc P. 116
Total Spending by Type and Location
Location
Food
/Gro
cery
sh
oppi
ng
Take
aw
ay fo
od
Clo
thin
g or
foot
wea
r sh
oppi
ng
New
spap
er,
Con
fect
iona
ry
shop
ping
Hou
seho
ld g
oods
sh
oppi
ng, e
lect
rical
go
ods
Usi
ng s
ervi
ce: b
ank,
po
st o
ffice
, ha
irdre
sser
Eat
ing/
drin
king
out
;
Hav
ing
a co
ffee/
visi
ting
a ca
fe
Oth
er s
ocia
l/lei
sure
(c
inem
a/in
door
po
ol/s
how
)
Bul
ky g
oods
suc
h as
fu
rnitu
re, w
hite
goo
ds,
Med
ical
Spe
cial
ist
Oth
er:
Tota
l (of
spe
ndin
g by
ty
pes)
Tota
l (in
clud
ing
thos
e no
t bro
ken
dow
n by
ty
pe)
Bathurst $37,050 $0 $3,780 $0 $3,000 $0 $3,320 $1,300 $0 $0 $0 $0 $48,450 $48,450
Bathurst/Penrith $10,400 $0 $4,000 $0 $2,400 $1,000 $100 $50 $0 $0 $0 $0 $17,950 $17,950
Katoomba $6,480 $0 $0 $2,600 $600 $0 $0 $0 $0 $0 $0 $0 $9,680 $9,680
Lithgow $1,822,290 $78,944 $220,920 $36,480 $102,780 $6,654 $138,050 $44,644 $12,900 $0 $4,000 $49,020 $2,516,682 $2,551,082
Mudgee/Orange $9,600 $2,880 $2,700 $0 $600 $0 $2,080 $0 $0 $0 $0 $0 $17,860 $17,860
Penrith $0 $0 $0 $0 $0 $0 $0 $0 $0 $0 $1,200 $0 $1,200 $1,200
Perth $2,080 $0 $0 $0 $0 $0 $0 $0 $0 $0 $0 $0 $2,080 $2,080
Portland $124,340 $1,560 $0 $5,216 $0 $0 $0 $0 $0 $1,300 $0 $2,600 $135,016 $142,816
Queensland $0 $0 $0 $0 $0 $0 $0 $0 $0 $0 $0 $0 $0 $0
Southport Qld $5,200 $0 $0 $0 $0 $0 $0 $0 $0 $0 $0 $0 $5,200 $5,200
Sydney $7,800 $0 $1,800 $0 $0 $0 $2,400 $0 $0 $0 $0 $0 $12,000 $12,000
Wallerawang $72,280 $2,600 $0 $1,740 $1,800 $0 $4,840 $0 $0 $0 $0 $1,560 $84,820 $84,820
Wentworth Falls $0 $0 $0 $0 $0 $0 $0 $0 $0 $0 $0 $0 $0 $0
Grand Total $2,097,520 $85,984 $233,200 $46,036 $111,180 $7,654 $150,790 $45,994 $12,900 $1,300 $5,200 $53,180 $2,850,938 $2,893,138
Average spend by location usually shopped, and type of shopping, indicates that people who usually grocery shop in Lithgow spend $8719 per year on average. Respondents who shopped primarily in Portland or Wallerawang spent less per year on average, on grocery shopping.
Average spend per year per place per type for usual shopping
Place Food
/Gro
cery
sho
ppin
g
Take
aw
ay fo
od
Clo
thin
g or
foot
wea
r sho
ppin
g
New
spap
er, C
onfe
ctio
nary
sh
oppi
ng
Hou
seho
ld g
oods
sho
ppin
g,
elec
trica
l goo
ds
Usi
ng s
ervi
ce: b
ank,
pos
t of
fice,
hai
rdre
sser
Eat
ing/
drin
king
out
;
Hav
ing
a co
ffee/
visi
ting
a ca
fe
Oth
er s
ocia
l/lei
sure
(c
inem
a/in
door
poo
l/sho
w)
Bul
ky g
oods
suc
h as
furn
iture
, w
hite
goo
ds,
Med
ical
Spe
cial
ist
Oth
er:
Bathurst $5,293 $0 $540 $0 $429 $0 $474 $186 $0 $0 $0 $0 Bathurst/Penrith $5,200 $0 $2,000 $0 $1,200 $500 $50 $25 $0 $0 $0 $0 Katoomba $1,620 $0 $0 $650 $150 $0 $0 $0 $0 $0 $0 $0 Lithgow $8,719 $369 $1,116 $173 $538 $56 $648 $210 $61 $0 $19 $225 Mudgee/Orange $4,800 $1,440 $1,350 $0 $300 $0 $1,040 $0 $0 $0 $0 $0 Penrith $0 $0 $0 $0 $0 $0 $0 $0 $0 $0 $1,200 $0 Perth $2,080 $0 $0 $0 $0 $0 $0 $0 $0 $0 $0 $0 Portland $4,974 $71 $0 $237 $0 $0 $0 $0 $0 $52 $0 $104 Queensland $0 $0 $0 $0 $0 $0 $0 $0 $0 $0 $0 $0 Southport Qld $5,200 $0 $0 $0 $0 $0 $0 $0 $0 $0 $0 $0 Sydney $3,900 $0 $1,800 $0 $0 $0 $1,200 $0 $0 $0 $0 $0 Wallerawang $6,023 $236 $0 $158 $150 $0 $403 $0 $0 $0 $0 $130 Wentworth Falls $0 $0 $0 $0 $0 $0 $0 $0 $0 $0 $0 $0 Total $7,856 $915 $174 $447 $46 $565 $170 $48 $5 $20 $193

Business and Retail Strategy / Lithgow City Council
April 2010 SGS Final Business and Retail Strategy.doc P. 117

Business and Retail Strategy / Lithgow City Council
April 2010 SGS Final Business and Retail Strategy.doc P. 118
Question 2
2a. Do you shop in other places? Yes No
2.b If yes, how often do you shop in these other listed
locations? (number of visits)
Per week Per
fortnight
Per month Per year
1 Lithgow
2 Wallerawang
3 Portland
4 Bathurst
5 Mudgee/Orange
6 Katoomba
7 Penrith
8 Sydney
The majority of people surveyed shop in more than one location, 256 of 281 people surveyed. People who shopped outside on Lithgow were most likely to travel to Bathurst (9.7 times per year on average), Penrith (2.5 times per year on average) and Sydney (1.6 times per year on average).
Do you shop in other places Place Surveyed No Yes Total Lithgow 9 75 84 Lithgow Valley Plaza 7 64 71 Portland 8 60 68 Wallerawang 1 57 58 Total 25 256 281
Shopping Outside the LGA Average times per year Bathurst 9.7 Mudgee/Orange 0.4 Katoomba 1.4 Penrith 2.5 Sydney 1.6
2c. What do you travel outside of the Lithgow area for? What types of retailing are not available locally? Where from? (Bathurst, Mudgee/Orange, Katoomba, Penrith,
Sydney) $/month
1 Food/Grocery shopping 2 Take away food 3 Clothing or footwear shopping 4 Newspaper, Confectionary shopping 5 Household goods shopping, electrical
goods
6 Using service: bank, post office, hairdresser
7 Eating/drinking out;
8 Having a coffee/visiting a cafe 9 Other social/leisure (cinema/indoor
pool/show)

Business and Retail Strategy / Lithgow City Council
April 2010 SGS Final Business and Retail Strategy.doc P. 119
10 Bulky goods such as furniture, white goods,
11 Medical Specialist 12 Other:
The table below provides a breakdown of survey respondent spend, inside and outside of Lithgow
LGA, by type. People were most likely to shop outside the LGA for clothes and household items.
The destinations of spending for these items are shown in the following tables.
Other Shopping Destination
Food
/Gro
cery
sho
ppin
g
Take
aw
ay fo
od
Clo
thin
g or
foot
wea
r sho
ppin
g
New
spap
er, C
onfe
ctio
nary
sho
ppin
g
Hou
seho
ld g
oods
sho
ppin
g, e
lect
rical
go
ods
Usi
ng s
ervi
ce: b
ank,
pos
t offi
ce,
haird
ress
er
Eat
ing/
drin
king
out
;
Hav
ing
a co
ffee/
visi
ting
a ca
fe
Oth
er s
ocia
l/lei
sure
(cin
ema/
indo
or
pool
/sho
w)
Bul
ky g
oods
suc
h as
furn
iture
, whi
te
good
s,
Med
ical
Spe
cial
ist
Oth
er:
Tota
l (of
spe
ndin
g by
type
s)
Tota
l (in
clud
ing
thos
e no
t bro
ken
dow
n by
type
)
Total $51,053 $4,372 $161,810 $1,394 $70,706 $100 $28,414 $24,244 $39,634 $39,625 $6,050 $74,706 $502,108 $515,608
Outside of Lithgow LGA $40,753 $3,644 $161,010 $514 $68,706 $100 $28,414 $24,244 $39,634 $39,625 $6,050 $63,606 $476,300 $489,800
In Lithgow LGA $10,300 $728 $800 $880 $2,000 $0 $0 $0 $0 $0 $0 $11,100 $25,808 $25,808
Clothing or footwear shopping Place Respondents Total $ per year
0 133 $0 Bathurst 78 $64,536 Bathurst/Katoomba 1 $0 Bathurst/Mudgee 2 $4,950 Bathurst/Penrith 28 $48,230 Bathurst/Penrith/Sydney 3 $3,900 Bathurst/Sydney 2 $2,000 Katoomba/Parramatta/Penrith 1 $100 Lithgow 3 $800 Mudgee 1 $900 Orange 1 $1,800 Penrith 14 $16,930 Penrith/Sydney 1 $2,000 Sydney 11 $15,664 Katoomba/Penrith/Sydney 1 $0 Katoomba 1 $0 Total 281 $161,810 Total Outside Lithgow LGA 145 $161,010
Household goods shopping, electrical goods Place Respondents Total $ per year
0 204 $0 Bathurst 43 $21,806 Bathurst/Lithgow 1 $0 Bathurst/Penrith 11 $30,480 Bathurst/Penrith/Katoomba 1 $500

Business and Retail Strategy / Lithgow City Council
April 2010 SGS Final Business and Retail Strategy.doc P. 120
Bathurst/Penrith/Sydney 3 $2,300 Katoomba 1 $0 Katoomba/Penrith/Sydney 1 $0 Lithgow 2 $2,000 Orange 1 $600 Penrith 12 $12,720 Sydney 1 $300 Total 281 $70,706 Total Outside Lithgow LGA 75 $68,706
2d. Do you ever shop online? Yes No
2e. If yes, for what reason?
2f. How frequently?
2g. How much do you spend online (W/F/M/Y)?
Overall, 25% of people surveyed shopped online. On average people shop online 10 times per
person per year, spending $394 per person per year on average (including people who do not shop
online). The list of items for which people shop outside the LGA is shown overleaf.
Do you ever shop online? No 211 75% Yes 70 25% Grand Total 281 100%
How often do you shop online Times per year number of responses
0 210 2 3 3 2
4 2 5 3
5.5 1 6 3 7 1
12 21 15 1 24 3 26 3 28 1 36 2 52 12
365 4 Not Stated 9 Grand Total 281

Business and Retail Strategy / Lithgow City Council
April 2010 SGS Final Business and Retail Strategy.doc P. 121
For what reason do you shop online
0 209 Airline tickets, clothes, theatre tickets 1 all kinds of things 1 art supplies/chemist 1 bills 1 books 1 Business related things 1 cds 1 Cheaper 1 clothes, fishing 1 Clothes, jewellery, shoes, electrical goods 1 clothes, toys, ebay 1 clothing, DVD 1 clothing, ebay 1 clothing, jewellery gifts 1 Computer goods. 1 Convenience. 1 cooking utensils, pillows 1 Different things 1 Dvd purchases 1 dvds, books, software 1 ebay 19 Ebay - jewellery 1 Ebay - plants, music 1 Ebay - toys 1 ebay - watches games 1 ebay, amazon 1 Ebay, bills 1 ebay, commercial kitchen equipment 1 Ebay, discount vet supplies 1 Ebay, gifts, toys 1 ebay; deals direct 1 electrical 1 electronic equipment 3 Electronics, handbags 1 embroidery designs, fishing tackle 1 everything 1 for my business, clothing 1 games, electrical products 1 itunes, applications for iphone 1 Kids clothes 1 kids games 1 mixture 1 Motorbike Parts 1 motorcycle parts/ebay 1 Organic fruit and vegetables, clothes. 1 phones 1 specific sporting goods 1 tools; fabric 1 travel; solar hot water system; dancing gear 1 Web addresses for particular retailers 1 Grand Total 280

Business and Retail Strategy / Lithgow City Council
April 2010 SGS Final Business and Retail Strategy.doc P. 122
Question 3
3. What is the purpose of your visit here today? 1 Take away food 10 Delivering goods
2 Food/Grocery shopping 11 Window shopping
3 Clothing or footwear shopping 12 Personal business 4 Newspaper, Confectionary shopping 13 Travelling through the area 5 Household goods shopping, electrical goods shopping 14 Visiting friends and relative 6 Using service: bank, post office, hairdresser 15 Dropping off/picking up friend or relative 7 Eating/drinking out; Having a drink in a pub or bar 16 Visiting Medical Specialist
8 Having a coffee/visiting a cafe 17 Looking for work
9 Other social/leisure 18 Other:
Multiple responses were provided for this question. The reasons for people’s visit were diverse.
Food/grocery shopping accounted for 34%.
What is the purpose of your visit? Not stated 8 3% Take away food 22 7% Food/Grocery shopping 105 34% Clothing or footwear shopping 15 5% Newspaper, Confectionary shopping 19 6% Household goods shopping, electrical goods shopping 7 2% Using service: bank, post office, hairdresser 28 9% Eating/drinking out; Having a drink in a pub or bar 9 3% Having a coffee/visiting a cafe 6 2% Other social/leisure 2 1% Window shopping 1 0% Personal business 21 7% Visiting friends and relative 2 1% Dropping off/picking up friend or relative 1 0% Visiting Medical Specialist 4 1% Work 16 5% Other: 43 14% 309 100%
Question 4
4. Why did you choose to shop in this location, as opposed to another location? 1 Close to home 2 Easy to drive to 3 Easy to walk to 4 Close to work 5 For a particular product/service - Please specify 6 Easy to park 7 Other - Please specify
‘Close to home’ was the primary reason why people chose to shop in Lithgow, Portland or
Wallerawang.

Business and Retail Strategy / Lithgow City Council
April 2010 SGS Final Business and Retail Strategy.doc P. 123
Why this location was chosen Number Percentage Not Stated 17 6% Close to home 138 49% Easy to drive to 7 2% Easy to walk to 11 4% Close to work 27 10% For a particular product/service - Please specify 21 7% Other - Please specify 53 19% Close to home and easy to drive to 3 1% Close to home and other 2 1% Close to home, easy to drive to and easy to walk to 1 0% For a particular product/service and Other 1 0% Total 281 100%
Question 5: What do you like best about this shopping location?
For the purposes of analysis, responses to this question were grouped into the following categories.
Friendliness and a sense of community were valued highly by survey respondents.
What do you like best about this shopping location Not stated 31 Home town/close to home 40 Convenient 39 Range of shops 26 Friendliness/community 43 Quiet, peaceful, small town, beauty, cleanliness 30 Cheap prices 3 Familiarity 8 Parking/access 8 Nothing/not much 25 Everything 1 Other 27 Total 281
Question 6
6. If there was anything you could change/improve about this shopping location what would it be.
1 More shops 12 More public spaces and places for pedestrians
(public domain)
2 Better range of shops 13 Cleaner streets
3 Improved shops/better quality outlets 14 Reduced pollution
4 Less traffic 15 Reduced anti-social behaviour
5 More/easier parking 16 More policing
6 More parking 17 More events, festivities, markets
7 Better bus services 18 More toilets, baby change areas
8 Better train services 19 Don’t Know
9 Longer shopping hours 20 Nothing
10 More night life activity (ie. Bars, café, restaurants) 21 Other:

Business and Retail Strategy / Lithgow City Council
April 2010 SGS Final Business and Retail Strategy.doc P. 124
11 More pleasant/greener environment
Multiple responses were provided for this question.
In terms of improving Lithgow, Wallerawang and Portland, the most responses were ‘better range
of shops’ (10%), ‘nothing’ (10%) and ‘more shops’ (9%).
Is there was anything you could change/improve about this shopping location what would it be More shops 41 9% Better range of shops 47 10% Improved shops/better quality outlets 14 3% Less traffic 2 0% More/easier parking 3 1% More parking 20 4% Better bus services 13 3% Better train services 6 1% Longer shopping hours 3 1% More night life activity (ie. Bars, café, restaurants) 9 2% More pleasant/greener environment 9 2% More public spaces and places for pedestrians (public domain) 3 1% Cleaner streets 15 3% Reduced pollution 0 0% Reduced anti-social behaviour 12 3% More policing 9 2% More events, festivities, markets 12 3% More toilets, baby change areas 12 3% Don't Know 13 3% Nothing 44 10% Other: 168 37%
Other responses received are shown in the table below.
Other responses Number of Responses
0 113 Aldi would be good. Food works is expensive, especially fruit, more competition to bring down prices 1 Allow more competition 1 Another supermarket with competitive prices. 1 Attract different types of eateries 1 Baby change facilities pathetic 1 Bank/credit union 1 Beautify cement works, remove derelict houses. 1 Better Gluten free range 1 Better maintain heritage buildings 1 Better roads 1 Better shopping centre, movies, more things for kids 1 Big W 4 Bigger chain shops 1 Bigger retailers - Big W, Kmart, cinemas. 1 Bigger shopping centre 1 BigW; Kmart 1 Brickworks needs to become a museum 1 Brighten up streets; try to attract BigW/big business; need a cinema 1

Business and Retail Strategy / Lithgow City Council
April 2010 SGS Final Business and Retail Strategy.doc P. 125
Bring back bracies 1 Bring into 21st Century, More $2 shops, another takeaway shop 1 Bring more business in - encourage business - cinema 1 Bunnings, Big W, good nursery 1 Centralise shopping, is too spread out. 1 Cinema and an indoor pool, more kids activities 1 Clean the shopping centre. Has become rundown. 1 Clean up cement works. 1 Clean up empty shops 1 Clean up the outside of the complex 1 Cleanliness of shops, better service, cafe tables on footpath 1 Clothing outlet 1 Competition for supermarket 1 Control cutting down trees, more things for kids 1 Council needs to get on board with needs and services. Need formal meeting with Council in Portland. Street greenery needs revamp for safety and hygiene. 1 Council should put an activated carbon filter on water works, do not put fluoride in the water 1 Create a nicer public domain. Fix up shops. 1 Dress shop, taxi service, discount store 1 Encourage more business; repair roads around parks quota park 1 Encourage more businesses to start up shops 1 Encourage people to shop locally 1 Encourage people to stay close to home 1 Encourage businesses by rental subsidies 1 Few more chain clothing stores; need a bigger shopping plaza 1 Fill the empty shops, create a good reputation/image; fix up shopfronts 1 Fill vacancies 1 Fix appearance and presentation of shops and facades. More landscaping. 1 Fix Boral site 1 Fix Boral Site, remove horrible houses. 1 Fix potholes and roads 1 Fix potholes in road and footpaths 1 Fix roads 7 Fix up Main St. Fill empty shops. Lower rents so businesses move in. 1 Force people who own businesses to clean up shops 1 Further develop shopping centre. Need more variety stores. 1 Get rid of skatepark 1 Get some variety shops 1 Hardware store 1 Have the Boral site developed for retail, it would snowball 1 Heaps; letting more things come into town 1 Heated swimming pool 1 Higher quality clothes and shoes, better quality restaurants 1 Hungry Jacks - more takeaway shops 1 Improve appearance of Main St/plaza 1 Improve buildings 1 Improve complex carpark - dangerous. Need an indoor swimming pool. Need a cinema. Need a bowling. Need a Dan Murphys. 1 Knock down old house factory 1 Less specialist parking 1 Lower petrol prices 1 Lower rates 1 Lower rent of shops and generate businesses in Main St. Fill empty shops. 1 Maintain some of the older buildings better. Build on industrial heritage. 1 Make complex more attractive. Complex needs staff room and remove smokers from entrances 1

Business and Retail Strategy / Lithgow City Council
April 2010 SGS Final Business and Retail Strategy.doc P. 126
Make Main St one-way. Would create more parking and be more pedestrian friendly. 1 Make sure pool opens. 1 More activities for kids 1 More activities for the kids 1 More bus stop streets. No smoking in front of library. 1 More cafes 1 More clothes shops 1 More competition - more variety stores. Is not good that shopping centre is detached from Main St. 1 More dept stores; Main St needs more shops; need a cinema 1 More entertainment facilities. 1 More for kids - expensive to catch bus to Bathurst. 1 More for kids, bowling alley, movies 1 More for teenagers, need a big retail chain like Big W 1 More for the kids 3 More fundraising near school 1 More furniture shops. Fix up shops on Main St. 1 More good quality restaurants; more fair trade shops 1 More grocery shops and more competition 1 More industry, something to employ 300-400 people. Good swimming pool. 1 More Signage for Wallerawang, better advertising 1 More supportive of business 1 More supportive of new ideas 1 More variety. Need a Big W. 1 More variety/department stores. 1 More weekend business 1 Movies/Tenpin bowling 1 Need a Bunnings 1 Need a cinema 2 Need a Dan Murphy's. 1 Need a decent shopping centre; need a variety store - Big W; Bigger shopping centre 1 Need a department store, cinema, heated pool 1 Need a good hardware shop 1 Need a pool 1 Need a variety store - Big W, Kmart 1 Need a variety store - Big W, Kmart; need a hardware store 1 Need a variety store – Big W, Kmart; fill the vacant shops 1 Need a variety store – Big W; bus at LVP is not safe, should stop somewhere else to reduce potholes; 1 Need an indoor pool 1 Need another variety store, more facilities - shopping centre and main street, need a bigger food court 1 Need Big W or Kmart 1 Need Big W or Kmart or Best and Less 1 Need improvement; young people don't seem to be satisfied 1 Need mid-range shoe/clothes shoes; potholes 1 Need more competition for supermarkets; need a variety store - BigW; fill empty shops 1 Need more kids activities - bowling, swimming pool. 1 Need more kids/teenager activities. Need a cinema. 1 Need more signage 1 Need Myer or discount department store; limited clothes shopping 1 Need non-slip pavement on footpath. 1 Need other places for young people to go, nothing keeping them in Lithgow. 1 Need swimming pool 1 Need to encourage business and industry, need to support business, need to advertise/market industry both retail and industrial 1 Need a cinema 1 Needs s/thing else (like Target) for competition 1

Business and Retail Strategy / Lithgow City Council
April 2010 SGS Final Business and Retail Strategy.doc P. 127
Needs to be updated, especially the complex. Improve carpark - dangerous. Need another gents. Target,blooms chemist is good - have most things. 1 Not enough to do for kids, need a cinema/bowling alley 1 Not much for kids; theatre 1 Nothing 1 Nowhere open for coffee out of hours; need things other than maccas on Saturday afternoon 1 People could be more polite. 1 Playground, Elizabeth Pk more fun for kids, community garden 1 Price isn't always competitive 1 Provision of general facilities. Streetscaping. 1 Reduce graffiti on closed shops 1 Retail mix needs to be improved; presentation needs to be improved; sporting, community facilities 1 Roads - potholes; ore for kids; cinemas 1 Roads; clean up grass 1 Security cameras 1 Shopping centre impacting on Main St 1 Slippery footpath; painted cement is better 1 Start again 1 Strange distribution of shops, need a roundabout at T junction on Main Street 1 Swimming pool 6 Tidy up Railway 1 Update shopping centre, cinema 1 Upgrade plaza 1 Vacant shops need to be cleaned 1 Water 1 Why is Lithgow falling behind Bathurst? 1 Would like a variety store - Big W. 1 Grand Total 281
Question 7: Other comments
Additional comments received are listed below.
Other Comments 0 80% of shopping should be able to occur in Portland. More action taken by Council for people who want to open new businesses - less paperwork.Advertise local services which are available. Foster more community participation and interaction. Need more youth activities and programs. More Already neat and tidy. Beautiful architecture Better road/street conditions Change the council Cheap real estate. Clean and quiet Council needs to listen to people. Need to bring area up-to-date Council should not have shop owners as Councillors - they stop new development. Better bus routes needed Don't need to leave Wang, has everything. Friendly, can get what you want, made to feel welcome. Expensive supermarket. Fix the roads between Wallerawang and Portland. Fix the roads in Lithgow. Fix the roads. Get community to back local shops Get it's own identity

Business and Retail Strategy / Lithgow City Council
April 2010 SGS Final Business and Retail Strategy.doc P. 128
Get rid, neutralise cement works. Get rid of vacancies. Good that they have minimised competition; would kill small business Good town. Good people Great village. Have improved safety. Have some good boutique shops, is not all chain shops especially on Main St. Like Lithgow, why I live here Like supermarket being here Lithgow has been left behind, about time Council did something and look to future. Miss the Bracies. Bulldozer Lithgow and start again. Lithgow needs more variety with clothes and shoes Lithgow shopping is good and easy to get to. Friendly people Locals should support local business Lot more houses built but no new shops Love being here Love Christmas atmosphere - chocolate wheel. Has good meals - cake shop, RSL, chiros. Love living in Lithgow Lovely little place Lovely weather More competitive pricing would generate higher turnover More encouragement/promotion by Council in businesses More than just Target Need a cinema. Need a cinema. Need more children's activities. Need a taxi Need a taxi rank Need an indoor pool. Better signage in and around town both directional and promotional. Need to fix the road conditions Need to fix waterways and fill Lake Wallace immediately Need to keep people in the area. Lithgow is stagnated. Not enough change. Needs a cinema and kids activities. New Council, need a new mayor. Nice clean town, but like all country towns it is dying Nice community; Lithgow is growing and needs to be upgraded Nice, clean and pretty Nice, little town, love it Not a bad place to live Open a nice restaurant, Thai and Italian restaurants are nice. Padley St parking makes it difficult to get in/out of driveway. Plan more for young people. Need more activities. Portland is progressing quickly Pot holes and road shoulder of road Potholes in the road Pretty good place to live and shop. Provide decent drinking water Queen Elizabeth Park need to be better maintained Reasonable Council Smoking at bus stops is a problem. Subsidising rent - variability. More for children - skate park and scout hall maintained more often. More gardens. There are a lot of things that you can't get locally Trains should stop in Wallerawang, will improve business Use local houses for shops Uses, such as medical, take people out of the area and then they end up shopping their too Very friendly town Wallerawang is nice how it is

Business and Retail Strategy / Lithgow City Council
April 2010 SGS Final Business and Retail Strategy.doc P. 129
Would be good to have more industry. Would shop here more if there was more available X needs to be improved; community and sporting facilities Grand Total
Appendix D: Extract from Insite (2009) Supply and Demand Analysis
4.2 Retail and Commercial – Supply and Demand
4.2.1 Introduction
The analysis of the supply and demand for retail and commercial lands has been undertaken by
reviewing available land zoned 3 Business, land use surveys of the business types and uses, review
and assessment of the current retail hierarchy and analysis of supply and demand as it relates to
vacancy/occupancy rates.
In considering the supply of business lands for retail and commercial lands Council has a defined
business zoning – Zone No 3 – Business. The objectives of the zone are:
a) to encourage a range of retail and commercial uses within the central business district,
b) to encourage high density residential development in conjunction with business development,
and
c) to accommodate retail, commercial and allied services within the City.
4.2.2 Current Supply
In terms of retail and commercial development, the larger urban areas of Lithgow, Wallerawang
and Portland each have an identified commercial area. The smaller towns and villages have a small
number of shops (or general store) servicing the local community or passing trade. The purpose of
the retail and commercial areas (in areas other than Lithgow) clearly services the day to day needs
of residents. The commercial areas within Wallerawang and Portland do not have a business
zoning however the majority of the retail and commercial areas are well defined, are accessible and
located on main thoroughfares. On review of the various retail and commercial precincts, it
appears that there is a clear ‘role’ or hierarchy that each town and urban area is playing. The
zoning for the CBD and business areas is Zone 3 Business. This zone is highlighted in Figure 25
below.
Business and Retail Strategy / Lithgow City Council
April 2010 SGS Final Business and Retail Strategy.doc P. 130
Figure 25. Zone 3 - Business

Business and Retail Strategy / Lithgow City Council
April 2010 SGS Final Business and Retail Strategy.doc P. 131

Business and Retail Strategy / Lithgow City Council
April 2010 SGS Final Business and Retail Strategy.doc P. 132
Based on a land use survey, the township of Lithgow has two (2) identified retail and commercial
precincts. These precincts are identified below and illustrated in Figure 26.
• The CBD precinct located along Main Street and extending through to Mort Street.
• The shopping precincts at Valley Plaza and Pottery Estate
A land use survey of the identified CBD precinct has been undertaken to determine its
characteristics. The CBD precinct is defined as the shopping precinct between Hassans Walls Road
and Bridge Street, extending south to the adjacent Mort Street. Retail outlets include a range of
specialty shops; support services; food outlets; hotels, financial institutions; etc. The extension
into Mort Street is included as it contains a major supermarket, a main parking area for the CBD as
well as a number of support businesses usually close to a main CBD area (police, courthouse,
council administration, physiotherapy etc). This area covers 19.21 ha. The Zone 3 Business area
along Railway Parade is fragmented from the core identified CBD extending along Railway Parade
from Bridge Street to Sanford Avenue. The fragmentation is primarily due to the railway line and
given this characteristic (from a retail pedestrian perspective) it does not substantially contribute to
the identified core CBD area.
The precinct between Hassans Walls Road and the Great Western Highway contains a range of
commercial and retail outlets. This area is approximately 6 ha and extends from the CBD and is
part of the business zone however its characteristics are different from the adjacent CBD precinct.
These include a vacant depot; motor cycle retailer; power equipment; service station; tyre repairs;
hardware; radio station. There are also numerous food outlets as well as primary school and
public open space. Given the difference in retail characteristics the area is not included in the
primary CBD trade area.
Furthermore, there is a small area of Zone 3 Business on the Great Western Highway (Ninda
Place). This site contains a fast food premises and also a vacant developed (former restaurant)
parcel of land. Due to its location the site is suitable to a fast food (or similar) type of development
and could also be developed as a neighbourhood business area servicing the western residential
portion of the Highway. This could be considered given the growth potential of the South
Bowenfels area.
A means of assessing retail health can be defined by vacancy rates, with the following industry
criteria being applied as a guide (adapted from Wakefield Planning Report on Retail Impacts in
Newcastle CBD):
• Rates below 4% generally indicate an undersupply of floor space and very good trading
conditions.
• Rates between 4 – 6% represent typical vacancies.
• Rates of 10% or more generally indicate at risk centres.

Business and Retail Strategy / Lithgow City Council
April 2010 SGS Final Business and Retail Strategy.doc P. 133
Figure 26. Li thgow Retai l / Commercia l Precinct

Business and Retail Strategy / Lithgow City Council
April 2010 SGS Final Business and Retail Strategy.doc P. 134

Business and Retail Strategy / Lithgow City Council
April 2010 SGS Final Business and Retail Strategy.doc P. 135
While it is recognised that this is a simple analysis of retail health it provides a snapshot and is
used as a guide in the absence of the complete retail study. The CBD plays a traditional role in its
retail / commercial role and provides such outlets and services such as banks, hotels, real estate
agencies, allied health, clothing, beauty etc. The vacancy rate at July 2009, in the CBD area, is
approximately 16% and based on the above criteria, indicates an oversupply of retail space. The
majority of vacancies occur in the area between Bridge Street and Eskbank Street (approximately
11%). The vacancy rate between Eskbank Street and Hassans Walls Road is approximately 5%.
North of the rail line and parallel to Main Street, is Railway Parade. The eastern portion has a
number of commercial outlets and also has a high vacancy rate. Impacting on this is the division
of the retail area by the rail line. Although there is a high vacancy rate the majority of these
vacancies are for smaller sized premises. The overall vacant floor space is estimated at less than
10%.
Pottery Estate and Valley Plaza precinct covers an area of 8.09 ha. Valley Plaza is the only
specialty shopping centre in Lithgow and is described as a mid-size regional shopping centre. The
total area of Valley Plaza is 14,660 m2, with 12,120 m2 available as retail floor space. In June
2009, there were three (3) vacancies representing a vacancy rate of less than 3% indicating an
under supply of retail space in this area. In 2009, Council has approved an extension of the Valley
Plaza which will add a further 4,055 m2 of retail floor space.
The neighbouring Pottery Estate has differing characteristics and has a higher proportion of
vacancies (approx 40%). Retail outlets in this area include an ALDI supermarket; motor vehicle
supplies; pet and produce outlet; discount ware house. However given its layout the precinct does
not have a visual aspect from the main access point being Lithgow Street. It is reported that some
of the shops in this precinct have never been tenanted. There are 5.2 ha available in the adjacent
land that could be developed for retail or commercial purposes however the site is constrained due
to contamination.
A number of variables affect the vacancy rates including but not limited to the quality of the
premises, rent levels, access to carparking, accessibility to major traffic or pedestrian
thoroughfares and overall retail mix. In the case of Lithgow the retail and commercial state
indicates the following:
• A traditional CBD who’s role and function has shifted over the past years. It should be stressed
however that the western portion of the CBD extending along Main Street between Eskbank
Street and Hassans Walls Road appears to be well-utilised whilst the balance of the CBD is
characterised by high vacancies. The overall standard of the premises appears to be of a high
to reasonable standard and would have a limited impact on the vacancy rates whilst the limited
size of many of the premises may be a more contributing factor.
• The shift towards shopping centres that are anchored by supermarkets and/ or discount
department stores. This is clearly the case with the apparent success of the Valley Plaza
compared to the traditional CBD and Pottery Estate.
• The stagnant to declining population over the past decade is expected to have had a major
impact on the retail centres. Whilst population growth has been limited the amount of retail
space has increased at a higher rate creating an over-supply of retail space.

Business and Retail Strategy / Lithgow City Council
April 2010 SGS Final Business and Retail Strategy.doc P. 136
Concern is raised with the extension of the Valley Plaza. Although the extension by 4,055m2 may
continue to improve the success and viability of the centre its impact on the balance of the retail
and commercial space within the township may exacerbate the high vacancy rates.
Table 22. Retai l Precinct Summary Li thgow
Precinct Land Area Available retail space Constraints
CBD 19.21 ha Less than 10% The vacancy rate is highest in the area between
Eskbank Street and Bridge Street.
Pottery Estate and
Valley Plaza
8.09 ha 4% in Valley Plaza and 40%
in Pottery Estate
An additional 4,055 m2 of
retail floorspace at Valley
Plaza has been approved.
Vacant land adjacent to Pottery estate is zoned
residential. Draft LEP considered by Council in
2006 that is pending due to contamination issues
of land involved. Subdivision has been approved
for commercial purposes.
Railway Parade
Precinct
Approx 6ha Greater than 10% Fragmented from the CBD by the rail line.
Western Main Road
Extension (Hassans
Walls Road to the
great Western
Highway
Approx 6ha Limited Characteristics are different from the adjacent
CBD precinct. These include a vacant depot;
motor cycle retailer; power equipment; service
station; tyre repairs; hardware; radio station and a
range of food outlets.
Both Portland and Wallerawang have typical retail and commercial centres on their respective main
thoroughfares. Portland’s CBD extends along Wolgan Street to Williwa Street. It contains a mix of
retail and commercial outlets which include a theatre, small supermarket, pub, newsagency etc
that would meet day to day needs. Wallerawang’s CBD extends along the western side of Main
Street to the Pipers Flat Road intersection. It contains a general mix of retail. Commercial, hotels,
post office, library etc which, like Portland would meet the day to day needs of residents. The
commercial centres are well-defined in both villages however have significant vacancy levels.
4.2.3 Demand
Council does not have a retail (or similar) strategy and there is little demand data available. Retail
space is market driven and the analysis of retail health can be used as a means of determining
demand. As identified in the supply analysis the different retail areas have differing trade
characteristics. The CBD has a current vacancy rate of 16% meaning an over-supply of retail
space, or, conversely this means there is less demand for retail space in the CBD area, in particular
the area east of Eskbank Street. Valley Plaza has stronger demand indicated by the low vacancy
rate and Pottery Estate has a low demand.
The Lithgow Strategic Plan and recent land use surveys identified that Portland also suffered
significant vacancy rates (38%) and Wallerawang had 23.5% vacancies. This obviously indicates

Business and Retail Strategy / Lithgow City Council
April 2010 SGS Final Business and Retail Strategy.doc P. 137
low demand and the capacity and accessibility of the township of Lithgow to provide higher order
needs.
Through the analysis of demand, it appears that Lithgow has a fragmented commercial area. The
fragmented development has taken trade away from the eastern end of the CBD. The further
expansion of the Valley Plaza could threaten this portion of the CBD and could potentially impact on
specialty retail trade in particular.
The capacity to develop retail and commercial areas also needs to consider population growth,
infrastructure and servicing. In addition the role and function of the retail and commercial lands is
important. At present, it appears that there is no clear retail hierarchy and targeted precinct plans
to address local needs. In order to achieve some degree of viability, a strategic retail strategy and
hierarchy is required to identify the roles of each of the urban centres (eg Lithgow, Wallerawang,
and Portland) as well as each town and village. The retail hierarchy will allow for future planning of
the type and amount of retail space that is required as well as reinforcing their individual roles.
4.2.4 Conclusions
The supply and demand for retail and commercial space is determined by the retail health of the
trade area. Through this analysis it is apparent that there is:
• An over supply of retail and commercial space in the CBD precinct.
• An under supply of retail and commercial space at Valley Plaza.
• An over supply of retail and commercial space in the Pottery Estate.
• An over supply of retail and commercial space in the Portland and Wallerawang.
Impacting on the supply and demand is the fragmentation of the retail and commercial trade area
across the Lithgow urban area. The development of the Valley Plaza has resulted in a fragmented
retail trade area in the urban area, however this area represents a precinct with the greatest
demand. The redevelopment of the Valley Plaza is meeting an identified demand, determined by
the undersupply of retail space. However, the fragmentation of trade across the CBD could be
exacerbated and threaten the viability of the CBD.

Business and Retail Strategy / Lithgow City Council
April 2010 SGS Final Business and Retail Strategy.doc P. 138
Appendix E: Business Survey Summary
The Business Retention and Expansion survey – Business Support Services and Retailers was
developed to provide input into the Lithgow City Council Economic Development Strategy. The
survey questions were developed by the Economic Development Officer with input from the
Tourism Advisory Committee and other Council staff. In total 122 surveys were completed by
business support services and retailers in the activity centres of Lithgow, Portland and
Wallerawang. Key points arising from the survey were:
• 52% of respondents had operated their business for up to five years only, indicating a good
level of business start-up and entrepreneurial activity in Lithgow.
• Some 44% of businesses surveyed were established over 20 years ago, suggesting a degree of
business stability.
• Over 60% of respondents established the business themselves.
• Just over half businesses did not have a business plan when they started, just over half do
have one now.
• 46% of respondents had relocated to their current business premises. Of the businesses based
in Lithgow’s CBD who had relocated, 69% had moved from somewhere else in Main Street,
Lithgow. Main Street is perceived to be a good location to run a business in the Lithgow LGA.
• Location, size and affordability are the three most important factors in selecting a site
• 86% of respondents were satisfied with their current business location. Of those who wished
to be located elsewhere, 35% cited ‘foot traffic’ as a specific business requirement.
• 60% of respondents indicated that their business had increased over the past year, with 74%
of businesses having increased over the past 2 years.
• Less than half (44%) of respondents indicated that they had felt the effects of the down turn.
Those who had noticed a negative effect were predominantly from the retail sector.
• 26% of those surveyed were looking to expand their business with most wanting greater floor
space and a lack of suitably sized floor space was cited as a hindrance particularly within
Lithgow Main Street.
• 56% of respondents believed that there were enough suitable sites available for businesses.
• 71% of those surveyed advised that their customers were from the local area. Most other
clients were from the Blue Mountains and Bathurst or were tourists.
• 92% of respondents agreed that a business incubator would be beneficial to the area.
• 46% of respondents stated that Internet services needed improving followed by telecoms.
• 36% of respondents stated that all tourist attractions needed improving in some manner. 26%
specifically identified Hassans Walls and 21% the Glow Worm tunnel as requiring
improvements. 17% identified connecting the Zig Zag railway to Lithgow as an opportunity.
• 53% of respondents stated that more Cafes were needed in Lithgow’s CBD whilst 27%
specifically cited more clothing retailers. 20% stated that all sorts of businesses were needed
without specifying the type. 37% of respondents stated that more variety stores like BigW
were needed.
• 37% of respondents identified having a Cinema and 36% an Indoor Pool as being important
entertainment facilities that the Lithgow area needed.

Business and Retail Strategy / Lithgow City Council
April 2010 SGS Final Business and Retail Strategy.doc P. 139
• The top three actions identified by respondents that could be done to improve business
prospects were: Council to be more proactive helping and attracting businesses; promotion of
the area and beautification of Main Street in Lithgow.