bulgaria power-sector-rapid-assessment may27-final
TRANSCRIPT

Republic of Bulgaria
Power Sector Rapid Assessment
May 27, 2013
The World Bank
Europe and Central Asia Region

This note has been prepared by the World Bank in response to a request by the
Government of Bulgaria in March 2013 to conduct an assessment of the issues and
challenges in the Bulgarian power sector in the wake of the crisis in January 2013.
This note is intended to help inform the Government's deliberations on how to
improve public confidence and trust in the governance of the power sector, enhance
the sector’s financial standing, and provide adequate support to poor households so
that they can afford environmentally sustainable and reliable electricity service.
This assessment has been undertaken by the World Bank within a very short period
of time based on data provided by the Ministry of Economy, Energy and Tourism
(MEET), the State Water and Energy Regulatory Commission (SWERC), the National
Statistical Institute (NSI), and the Ministry of Labor and Social Policy (MLSP). This
rapid assessment is not a substitute for more detailed analysis that will inform and
guide specific implementation steps and sector reforms.
The World Bank will be available to continue the policy discussion on the findings of
this assessment and the suggested package of reforms with the Government to
develop and support a viable program of reforms that will help achieve reliable,
efficient, and affordable electricity and heating services for the citizens of Bulgaria.
Foreword
2

3
Public has lost confidence and trust in the management of energy companies and the
Government’s oversight of the electricity sector. Common believe that some State officials and
enterprise managers have investments in the energy sector has compromised public trust.
Bulgarian Energy Holding (BEH) is an unnecessary level of State oversight.
Sector has large financial deficits that are increasing contingent liabilities on the State. High
cost structure stemming from flat energy demand, poorly regulated growth in renewables, misuse of
incentives for cogeneration, long-term contracts, and inefficient trade/export incentives.
Declining level and coverage of social assistance benefits have made energy unaffordable
for the poor. Budget contribution for targeted social safety net programs is a third of levels in 2003.
Comprehensive package of actions needed to improve public confidence, financial viability
and affordability:
Enhance credibility, independence, and capacity of energy regulator.
Eliminate incentives that lead to inefficient investments and rent-seeking behaviour.
Address financial liabilities that arise from the off-take of renewable energy, co-generation,
long-term power purchase agreements, and failed investments in an equitable manner.
Increase budgetary funding to expand level and scope of targeted social assistance benefits
for vulnerable consumers.
Eliminate conflicts of interest of state officials and senior managers in having personal/family
financial interests in the power sector.
Synopsis of Diagnosis and Recommendations

4
I. Public distrust
II. Unsustainable cost structure
III. Affordability
IV. Future directions
Note Structure

I. Public distrust
5

Serious structural issues in the sector contributed to a political crisis
Public Distrust
Governance
Perception of deep
rooted corruption
Governance of State
Owned Enterprises
Undermined regulatory
framework
Unsustainable
cost structure
High cost generation mix
Inefficient operation of the
system
Poorly regulated growth in
renewables
Affordability
Inadequate social
protection
High and inefficient
electricity consumption
Unless these issues are comprehensively addressed, service delivery will
worsen and threaten economic stability 6

7
Consumers are frustrated by tariff hikes and the lack of
transparency in the sector
Electricity market performance (MPI): second lowest scoring country in the EU
The Market Performance Indicator (MPI) is a composite index based on the results of survey which information on consumer markets in terms
of comparability, trust, consumer problems and complaints, expectations, choice and switching.
Source: European Commission
Lowest scores for “trusting the provider” (to respect laws and regulations
protecting consumers) and “live up to what you wanted” (the service consumers
want is actually being delivered)

8
Overall, high perception of corruption
Bulgaria is the lowest scoring country in the EU area after Greece in terms of the
Corruption Perception Index (CPI) for 2012
A country or territory’s score indicates the perceived level of public sector corruption on a scale of 0 - 100,
where 0 means that a country is perceived as highly corrupt and 100 means it is CPI (2012) perceived as
very clean.
Source: Transparency International
0
10
20
30
40
50
60
70
80
90
100
CP
I sco
re

9
Consumers upset over billing practices
Consumers are not sure what they
are being charged for
Bills do not make essential
information understandable
Past consumption is not explained
Billing cycles are irregular

State Ownership through Holding Company BEH compromises transparent
and professional management of the energy enterprises
State assets are being priced inefficiently. For example, some
hydroelectricity priced artificially low to accommodate high priced renewables
Growing Government liabilities hidden making it difficult to assess impact on
the State Budget
State governance of the sector is convoluted
10
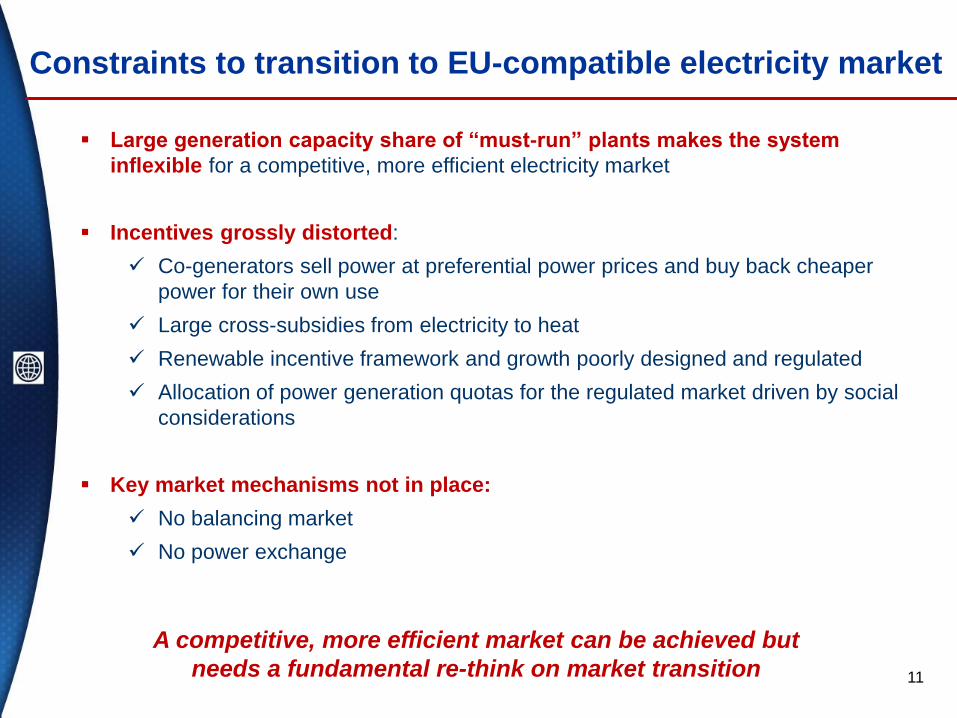
Constraints to transition to EU-compatible electricity market
Large generation capacity share of “must-run” plants makes the system
inflexible for a competitive, more efficient electricity market
Incentives grossly distorted:
Co-generators sell power at preferential power prices and buy back cheaper
power for their own use
Large cross-subsidies from electricity to heat
Renewable incentive framework and growth poorly designed and regulated
Allocation of power generation quotas for the regulated market driven by social
considerations
Key market mechanisms not in place:
No balancing market
No power exchange
A competitive, more efficient market can be achieved but
needs a fundamental re-think on market transition 11

Current market structure a good platform to facilitate
market transition
12
Well disaggregated sector - although transmission separation to be completed
The single buyer NEK can transition to a balancing market and power exchange
Active cross-border trade with neighbouring countries will help the transition
NEK(Single Buyer, Aggregator, Hydropower Generator, Supplier of Last Resort & Transmission Company)
State-owned Energy Suppliers (nuclear, coal,
gas)
CEZ
EVN
Energo Pro
System Operator
(owned by NEK; organizes the
balancing Market)
Coal Independent Power Producers
Cogeneration Suppliers
Renewable Energy Power Plants (under Feed in Tariffs)
Generation Transmission Distribution
Purchased and Paid for by NEK under Law
Purchased and Paid for by NEK under Energy Law
Purchased and Paid for by NEK under PPAs
Purchased and Paid for by NEK under Energy Law
Distribution Entities collect on behalf of NEK
Regu
late
d Pr
ices
thr
ough
Ann
ual T
ariff
O
rder
s
Subsidiaries of BEH
Renewable and Efficient
~58%
15%
~12% of Energy
15%
~1%
High-Voltage Customers

13
Energy Regulator: lack of independence and capacity
Regulatory independence is insufficient
In the last 6 months there have been two changes of the Chairman of the Regulator
(SWERC)
Decision to decrease prices was pre-announced by the State officials and followed a
change in the Energy Law allowing price decreases
Regulator is blamed but unable to make the necessary political decisions to correct
problems in the electricity sector
Some regulatory decisions are unpredictable and not fully explained or supported by
transparent information
SEWRC has insufficient technical, financial capability to fulfil its
duties
Number of staff (128) is small considering scope of activities covering electricity, gas and
water
There are about 15 experts covering the electricity sector
The budget is insufficient and 2nd lowest per employee in Europe; it is part of the central
budget and not ring-fenced
Lack of key regulatory building blocks
No accounting standards framework for regulated utilities
No cost benchmarking of regulated utilities e.g. generation, transmission, and distribution
Allocation of quotas for the regulated market not based on efficiency principles

II. Unsustainable cost structure
14

Factors contributing to financial unsustainability
1. Adequate power capacity for domestic use, but administrative
constraints to exporting surplus power
2. Inefficient allocation of power generation quotas for the regulated
market and distortions in operational dispatch of power plants
3. Rapid build-up of renewable energy at high feed-in tariffs
4. High preferential tariffs paid to “cogeneration” plants imposed by law
5. Cost of long-term Power Purchase Agreements (PPAs)
6. Mismanagement of contingent liabilities in the sector
15

Adequate supply for exports
Even with rising demand for electricity, Bulgaria will continue to have a
supply surplus to maintain energy security and facilitate exports
Source: Generation mix projections MEET, alternative demand scenarios calculated by ECA 16
0
10
20
30
40
50
60
70
TW
h
Generation mix (2013-2030) Solar
Wind
Hydro
Factory Power Plants
CoGen
Thermal
Nuclear
Domestic Demand:25% price increase
Exports fall by 5%
Exports fall by 10%

17
Export- historic volumes (quarterly data)
Exports declined but not dramatically
0
0.5
1
1.5
2
2.5
3
3.5
4
1 2 3 4 1 2 3 4 1 2 3 4 1 2 3 4 1 2 3 4 1 2 3 4 1 2 3 4 1
2006 2007 2008 2009 2010 2011 2012 2013
GW
h
TR
RS
RO
MK
GR
Exports to Western Balkans and Greece have fallen over the past two years
due to economic downturn. Turkey is now an important off-take market, but its
increase has not fully offset fall in other countries
Additional constraints to exports include:
Access to electricity priced at competitive
levels for the regional market
High transmission fees
Limited grid capacity for export
“Power costs from Bulgaria are
too high. I’m better off selling
power from Hungary to Turkey”
… Power trader

System not dispatched at least cost due to “must-run” plants
18
Supply curve* (least–average cost) Supply curve (with must-run plants)
Simplified supply curve on the left stacks generation options by least average cost order.
Without “must-run” plant constraints, average load could be covered mainly by the
operation of Kozloduy, Maritza 2, HPP, Varna, Bodov Dol and Maritza 3.
The curve on the right shows must-run plants (RES, PPAs and DH) stacked first in order
from the left. Lower cost plants (nuclear, thermal and hydro) are hardly dispatched.
This illustrates the impact of the must-run constraints; it is expensive for the system and
consumers.
* Nuclear do not include costs for decommissioning of existing plants, long-term fuel storage, nor externality costs

19
Long Term Power Purchase Agreements, Cogeneration
and Renewables are a large share of the electricity output
Generation Structure in 2012 (TWh)
Long term power
purchase agreements,
15%
Nuclear power plant,
35% Thermal
plants, 23%
Cogeneration and factory plants, 12%
Renewable energy
sources, 15%

20
Rapid build-up of Renewable Energy (RE) and more
expected
Renewable Generation Capacity as of March 2013
682
980
2183
29
1596
753
214
93
0
500
1000
1500
2000
2500
3000
Wind Power Photovoltaics Hydro Power Bio Power
MW
In operation (as of March 2013) Contracted new capacitySource: MEET
Bulgaria has gone a long way in improving the sector’s environmental sustainability and is
in good track to meet its obligations specified in the EU 20/20 package.
Renewable capacity additions slowed down in 2013 given reductions in feed-in-tariffs. It is
unlikely that a significant amount of the contracted new capacity becomes on-stream.

Development of Renewables driven by high Feed-in-Tariffs
0
50
100
150
200
250
300
350
400
450F
ee
d-i
n-T
ari
ffs
\
EU
RO
/MW
h
Levelized cost per KWh*
FIT PV in Turkey:
104 EURO/MWh
FIT Wind in Turkey:
59 EURO/MWh
* Lower and upper level of the levelized cost of RES calculated assuming weighted average cost of
capital of 7% and 10%, respectively
Source: FIT from MEET and levelized costs calculated by Bank staff
Solar PV (capacity <
5MW)
Solar PV (capacity >
5MW) Onshore Wind
Installed capacity: 980 MW
Installed capacity: 682 MW
21

Worsening generation cost trend – putting pressure on
electricity prices
22
There has been an upward trend in generation costs (fixed+ variable costs) over the
past five years.
The cost of long term agreements and renewables is well above the generation cost of
the rest of State-owned power plants
This will puts pressure on electricity prices.
0
50
100
150
200
250
300
350
200
7
201
0
201
1
201
2
200
7
201
0
201
1
201
2
200
7
201
0
201
1
201
2
200
7
201
0
201
1
201
2
201
2
201
2
201
1
201
2
NPP Kozloduy Maritza East 2 Bobov Dol TPP Varna ME 1 ME 3 RES
BG
N /
MW
h
Evolution of Generation Costs
Variable costs Fixed costs Power Purchase Agreements Average FITs for RES
* Nuclear and do not include costs for decommissioning of existing plants, long-term fuel storage, nor externality
costs. Coal-fired plants do not include externality costs

2.27 1.67
2.26 2.04
8.42
5.34
1.16
0.81
-0.2
0.0
0.2
0.4
0.6
0.8
1.0
1.2
0
2
4
6
8
10
12
14
1 2
Fin
an
cia
l ga
p a
s %
of G
DP
Net P
rese
nt V
alu
e o
f fina
ncia
l ga
p B
GN
Bill
ion
Renewable Energy FITsHigh Efficiency CogenerationLong Term Power Purchase Agreements
23
NEK prices remain
constant
NEK prices increase by
5% once
Estimated net present value of financial gap until 2030 assuming that only 10 % of RES new contracted
capacity will go on stream and assuming a 5% discount rate.
Growing financial gaps threaten fiscal stability
Total financial gaps til 2030
projected to range from 5 to 20
Billion BGN
Financial deficit in the next 12
months is projected to be
between 800-1,200 Million BGN
Several measures will be
needed to address this gap --
increasing prices is not the only
solution.
% of GDP
% of GDP
Estimated financial gaps resulting from long-term agreements, high efficiency cogeneration, and
renewable energy Feed-in-tariffs (FTIs), net present value 2013-2030

24
Large debt accumulation if no action is taken
Estimated the level of financial gap until 2030 assuming that only 10 % of RES new contracted
capacity will go on stream
3.16
8.47
13.72
20.34
0
1
2
3
4
5
6
7
8
9
10
11
12
13
14
15
16
17
18
19
20
21
2013 2014 2015 2016 2017 2018 2019 2020 2021 2022 2023 2024 2025 2026 2027 2028 2029 2030
Billi
on
s B
GN
Total financial gap in nominal termsLong-term Power Purchase AgreementsRenewable energy FITsHigh Efficient Cogeneration
Financial gaps per year resulting from long-term agreements, high efficiency cogeneration, and
renewable energy Feed-in-tariffs (FTIs) in nominal terms

Mismanagement of contingent liabilities
25
• NEK's precarious financial situation is the result of many state actions:
• Generous payments for service delivery for some technologies set by law
• Lack of planning of renewable additions
• Public investments in the power sector handled off budget
• Delays in introducing market reforms (e.g., balancing power market, export)
• No government entity monitoring arrears build-up to assess the consequences on
government finances and the economy.
• Bulgaria lacks a system to properly manage contingent liabilities (e.g. a recording
system in the Ministry of Finance and established legal principles for approving
sub-sovereign liabilities and their provisioning).
• Contingent liabilities that have materialized could be managed more efficiently by
the Ministry of Finance rather than BEH.
25

III. Affordability
26
27
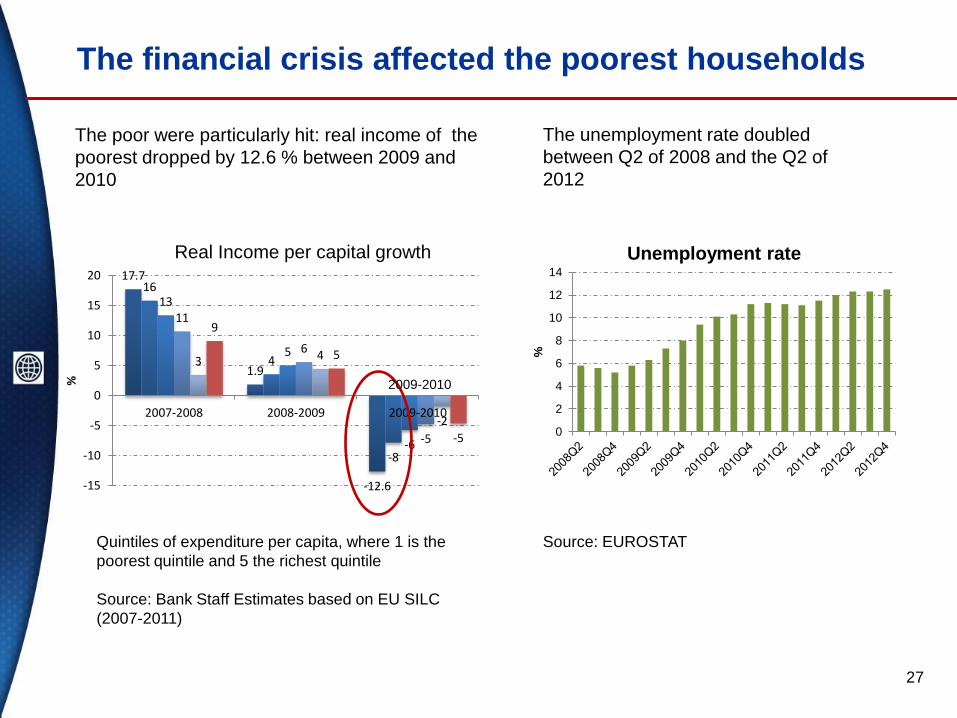
The poor were particularly hit: real income of the
poorest dropped by 12.6 % between 2009 and
2010
17.7
1.9
-12.6
16
4
-8
13
5
-6
11
6
-5
3 4
-2
9
5
-5
-15
-10
-5
0
5
10
15
20
2007-2008 2008-2009 2009-2010
%
Real Income per capital growth
Quintiles of expenditure per capita, where 1 is the
poorest quintile and 5 the richest quintile
Source: Bank Staff Estimates based on EU SILC
(2007-2011)
The financial crisis affected the poorest households
0
2
4
6
8
10
12
14
%
Unemployment rate
Source: EUROSTAT
The unemployment rate doubled
between Q2 of 2008 and the Q2 of
2012
2009-2010

28
The poorest spend the most on electricity (up to
9% of their total household expenditures)
Bulgarian households are more reliant on
electricity than households in other EU
Member States
Source: Bank staff estimates, ECAPOV database
Electricity is the most important energy source for households, especially for the poor
0%
10%
20%
30%
40%
50%
60%
70%
80%
90%
100%
Bu
lga
ria
Esto
nia
Hun
ga
ry
Latv
ia
Lith
uan
ia
Po
lan
d
Rom
an
ia
Sh
are
of e
ne
rgy e
xp
en
ditu
res b
y f
ue
l
Electricity Gas
LPG Wood
Coal District heat and hot water
Solid & Other Fuels
Source: Bank staff estimates, ECAPOV database

29
78% of the energy poor are located in urban areas
Bulgaria (61%) ranks second among countries in Europe and Central Asia, with the
highest rate of energy poor after Hungary (80%) and just before Tajikistan (60%)
* A conventional measure of high spending on energy is energy poverty, defined as spending more than 10 percent of household resources
to cover energy needs
Source: Bank staff estimates, ECAPOV database based on the 2007 HBS
61% of Bulgarian households considered energy poor*
90% 86%
78%
70%
46%
76%
62%
52% 48%
32%
73%
52%
0%
10%
20%
30%
40%
50%
60%
70%
80%
90%
100%
1 2 3 4 5
% o
f e
nerg
y
po
or
Rural Urban Average Rural Average Urban
Quintiles

30
Electricity tariffs hiked in 2012 but still below 2007 levels
Source: Bulgaria National Statistic Institute
Electricity tariffs for households by block of consumption, in real terms

Despite increases, tariffs lowest among EU Member States
31
0.08
0.11
0.13 0.14 0.15 0.15
0.16 0.17 0.17
0.19 0.20 0.21
0.23
0.26
0.30
0.00
0.05
0.10
0.15
0.20
0.25
0.30
0.35 Retail electricity prices (€ per kWh)

32
0
20
40
60
80
100
120
140
160
2003 2004 2005 2006 2007 2008 2009 2010
Ind
ex
(20
03
=1
00
Expenditure on Social Assistance declined
Pensions Last Resort Social Assistance Housing & utility benefits
Source: World Bank ECA Social Protection Database
Targeted safety nets have been marginalized
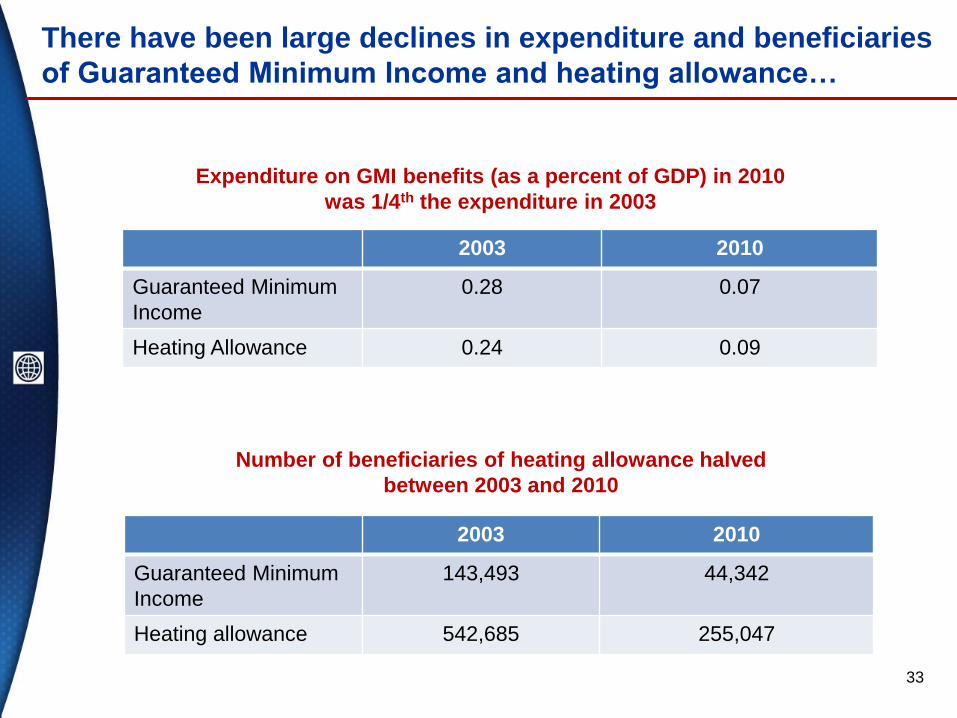
There have been large declines in expenditure and beneficiaries
of Guaranteed Minimum Income and heating allowance…
2003 2010
Guaranteed Minimum
Income
0.28 0.07
Heating Allowance 0.24 0.09
Expenditure on GMI benefits (as a percent of GDP) in 2010
was 1/4th the expenditure in 2003
2003 2010
Guaranteed Minimum
Income
143,493 44,342
Heating allowance 542,685 255,047
Number of beneficiaries of heating allowance halved
between 2003 and 2010
33

34
… as a result, more than 78% of the poor have not been
protected by targeted safety nets
Percentage receiving the Guaranteed
Minimum Income (GMI Benefits) Percentage receiving Heating Allowance
Source: Staff estimates from ECAPOV
Around 78% of the poor were not covered by
the main programs targeted to protect them
88% of the poor did not benefit from the
heating allowance
13%
4% 11%
87 96
89
0%
10%
20%
30%
40%
50%
60%
70%
80%
90%
100%
Poor Energy Poor Poor and EnergyPoor
88 96
89
0%
10%
20%
30%
40%
50%
60%
70%
80%
90%
100%
Poor Energy Poor Poor and EnergyPoor
13% 4%
11% 12% 4%
11%
To adequately protect the poor, at least restore budget allocation levels that existed in
the early 2000s

IV. Future Directions
35

Diagnosis and
objective
Package of actions
Immediate Follow-on
Public distrust:
Regain public
confidence by
emphasizing
transparency
Ensure that state officials and senior employees disclose
their financial interests in the energy sector
Dissolve BEH to increase transparency and accountability
of State Owned Enterprises (SOEs)
Grant financial and decision-making independence for the
Regulator as per EU Directives; Establish a plan to build
technical capacity
Eliminate conflicts of interest of state officials and senior
employees
Complete performance benchmarking and service audit in
the energy and mining sectors
Implement merit-based and competitive hiring of
new/replacement Board Members and Senior Management
of SOEs
Establish a power exchange to increase pricing
transparency and cost efficiency
Unsustainable
Cost Structure:
Address growing
deficits in the
sector
Eliminate abuse of preferential pricing for cogeneration
NEK and Ministry of Finance to equitably address
financial liabilities arising from preferential tariffs for
Renewable Energy, long-term agreements, and failed
investments such as Belene
Reduce costs by improving the allocation of generation
quotas in the regulated market and ensuring economic
dispatch
Facilitate exports to increase sector cash flows by
eliminating transmission surcharges and efficient allocation
of cross-border interconnection capacity
Regulator to define medium-term tariff adjustments to
reduce deficits in the sector
Affordability:
Make energy
services
affordable to the
poor
Increase budgetary funding to enhance coverage and
amount of the Guaranteed Minimum Income and Heating
Allowance programs
Scale-up Energy Efficiency (EE) program in the
residential buildings to make energy affordable
Reform the social protection system to improve incentives
to work and consolidate less effective programs
Improve mechanisms to utilize EU structural Funds for
national large-scale (EE) programs
Consult with citizens and other stakeholders to prepare and finalize a Policy Paper that sets the
strategic direction for the recovery and long-term development of the power sector
36
The full package of reforms needed to address the issues in the sector

Disclaimer:
This rapid assessment was conducted by staff of the International Bank for Reconstruction and Development/The World Bank. The findings, interpretations, and conclusions expressed in this assessment do not reflect the views of the Executive Directors of the World Bank or the governments they represent.
This assessment has been undertaken by the World Bank based on data provided by the Bulgarian Ministry of Economy, Energy and Tourism (MEET), the State Water and Energy Regulatory Commission (SWERC), the National Statistical Institute (NSI), and the Ministry of Labor and Social Policy (MLSP).
For questions please contact:
In Sofia: Ms. Ivelina Taushanova, World Bank; 359-2-969-7239; [email protected]
In Washington, DC: Ms. Heather Worley, World Bank; 1-202-458-4857; [email protected]
For more information:
http://www.worldbank.org/en/country/bulgaria
http://www.worldbank.org/content/dam/Worldbank/document/eca/Bulgaria-Snapshot.pdf
37