building science report
TRANSCRIPT
Project 1: Lighting and Acoustic Performance
Evaluation and Design
Brogues Coffee, Subang Jaya
Building Science 2 (ARC 3413)
Tutor: Mr. Siva
Group Members:
Chong Chui Wern 0321359
Ellen Gowiko 0318496
Law Yong Lin 0320516
Liew Hong Zhi 0315836
Nicholas Lee Ngang Kim 0320504
Abstract This report consists of the study of lighting and acoustic performance level of a selected building. The building we have chosen to study is Brogues Coffee, which is a modern café located at SS15, Subang Jaya. In order to carry out the analysis for this project, we asked owner of the café for the floor plan and edited parts of the café which was later changed, such as the furniture positions and positions of doors, so that a more accurate analysis can be conducted. Next, we then visited the café several times after that to ensure the data collected is sufficient for future analysis conducted on the cafe. Light and sound acoustic data are collected at different points all over the café at a distance of 1.5m apart. We analyzed the building components, furniture and the finishing. of both interior and exterior. A list of figures and data collected are used and some references is provided at the end of our report further detailed information. In addition, a lot of photos has been taken as references or evidence of the project studies.

Table of content
Content Pages
1.0 Introduction 1.1 Introduction to project 1.2 Introduction to site 1.3 Zoning
1 - 3
2.0 Lighting 2.1 Introduction to Lighting 2.2 Journal 2.3 Methodology 2.4 Lighting Analysis 2.5 Analysis Diagram 2.6 Conclusion
4 - 44
3.0 Acoustic 3.1 Introduction to Acoustic 3.2 Journal 3.3 Methodology 3.4 Acoustic Analysis 3.5 Analysis Diagram 3.6 Conclusion
45 - 103
4.0 Conclusion 103
Reference 104


1
1.0 Introduction
1.1 Introduction to project Lighting and acoustic performance of a building is one of the key in to making a space liveable and comfortable. When used within the right range, the user experience and comfort can be improved. Furthermore, the manipulation of these elements can help enhance the atmosphere, feelings and mood of the place.
Lightings are important as it is one of the main safety factors to the users of the spaces. Poor lighting may cause psychological issues such as anxiety and further lead to accidents if people cannot make sense of what is ahead of them. The acoustic performance of a building is also important as it controls the transfer of noise from one space to another. The requirements of each spaces may vary according to their users and functions. It helps provide a suitable environment by cancelling out unwanted noise from the outside.
In a group of 5, we are to choose a site to analyse their lighting and acoustic quality. The aim and objectives of this project are:
- To understand the day-lighting, artificial lighting and acoustic characteristic.
- To determine the characteristics and function of day-lighting, artificial lighting, sound and acoustic within the intended space.
- To critically report and analyse the lighting and acoustic qualities in the space.
- To be able to produce a complete documentation on analysis of space in relation to lighting requirement.
Hence, at the end of this project, we should be able to determine and understand the quality of spaces based on the lighting and acoustic quality. We will also be able to understand the various factors affecting the quality of light and acoustic performance. Lastly, we can be clear as of the different requirements for light and acoustic for each individual spaces.

2
1.2 Introduction to site
Figure 1.1 Brogues Coffee exterior
Case Study: Brogues Coffee, SS15, Subang Jaya
Building Space: Café
Business Hours: 11AM to 1AM
Brogues coffee cafe is a modern concept cafe which believes in not only serving good coffee to customers but attitude. The serves tarts, cakes and coffee. It is an ideal location to chill, gathering or relaxing, a good ambient for youngster nowadays. This makes the building worth studying or exploring which allow us to understand the effects on lighting and acoustic within the spaces. Moreover, the building which is just right at the corner, sits in between the street, surrounded by crowds and other shop lots. This becomes another issue that we should take note of in this study. We visited the site several times in order to collect all the necessary information and data for this project which includes the measured drawings, lighting and acoustic reading.

3
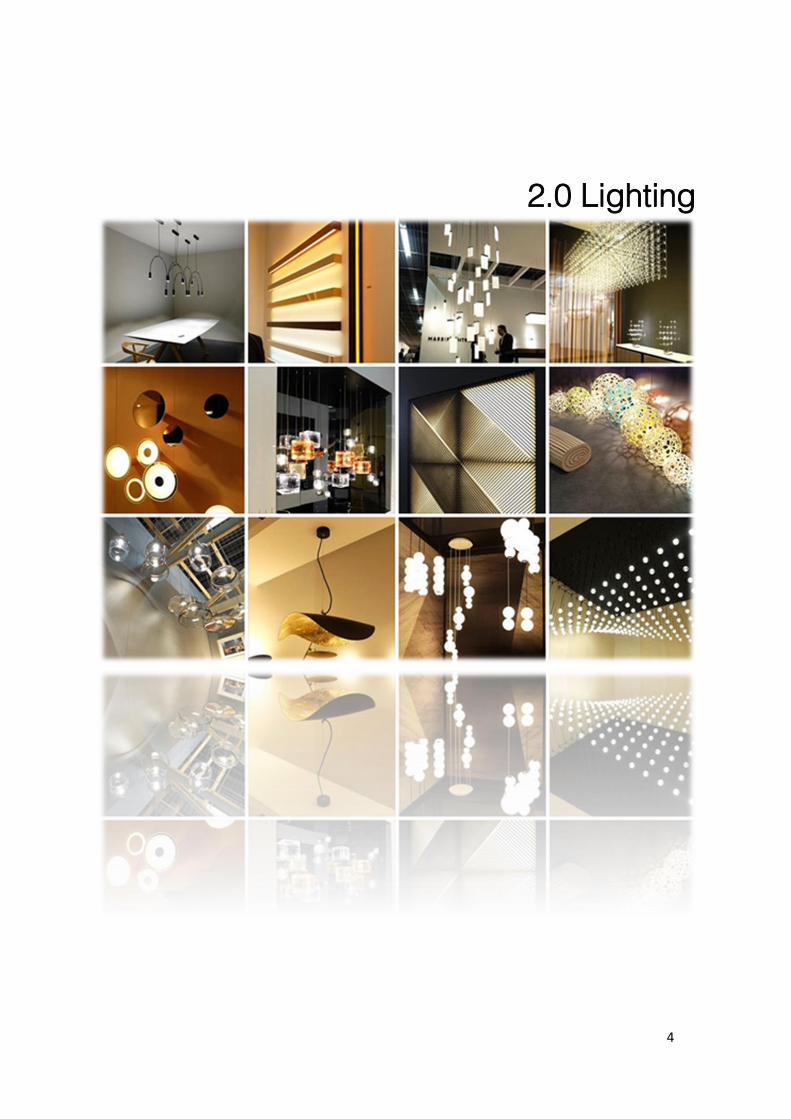
1.3 Zoning
Figure 1.2 Zoning of the spaces in the cafe
The zoning of the spaces is done based on the function of each spaces.
Purple – Toilet area
Yellow – Dining Zone1
Blue – Dining Zone 2
Red – Kitchen / Work area
Green – Outdoor area
4
2.0 Lighting

5
2.1 Introduction to lighting The relationship between light and architecture is closely related to the principles of physics, about energy and matter. But, light also helps define the architectural space as it contributes to its perception and understanding, at the mean time adding values to the function of spaces and adding an emotional component for its users. Of course, the primary purpose of light is to provide visibility for security and safety of the users.
Lighting play an important role as it achieves a certain level of human comfort. Different spaces do require different type of lighting as to cater to the function of the space and also the user comfort and experience. When the brightness of a space does not meet the requirements compatible to their function, the space is deemed unsuitable to carry out its destined function and purpose.
There are 2 main ways to light up a building, which is through:
1. Daylight (Natural) lighting
Daylighting is the controlled admission of natural sunlight and diffuse skylight into a building or space. Daylighting is a viable, energy-efficient strategy in almost any climate. The daylighting system is designed to bring in natural light in to the building, such that electric lights can be dimmed or turned off when daylighting system is at work.
2. Artificial lightings
Artificial light sources are sources of light which developed to compensate for of or assist the lacking of natural light. Artificial lightings come in different frequencies and wavelengths, which determines the light colour. Indoor lighting is usually accomplished using light fixtures, and is a key part of interior design.
Luminaire is a device that distributes the filters or transforms light emitted from one or more source. The basic physical principles used in optical luminaire are reflection, absorption, transmission and refraction.
Figure 2.1 Natural lighting and artificial lighting (Source: https://www.beautylish.com/a/vcjwj/makeup-lighting-tips)

6
2.2 Journal
2.2.1 Introduction
George C. Gordon Library
Figure 2.2 Interior view of George C. Gordon Library (Source: Architecture and Design, 2014)
Building Information:
Name : George C. Gordon Library
Project Completion : 2013
Function : Library
Locations : Worcester Polytechnic Institute,
Worcestershire, England.
Architects : CK Design International
Client : Worcester Polytechnic Institute
Located in Worcester Polytechnic Institute, George C. Gordon Library offers a fine
environment to the students studying in the campus. By enhance the user experience while
at the same time enabling the visibility of the soothing environment of the library’s interior, the
challenge in illuminating this library’s interior lay in the need to introduce functional and iconic
lighting. In order to achieve this, the strategy of the lighting has to be placed wisely over the
library. By designing the lighting systems up to its optimal, this library did a great job because
these systems are adaptive to sunlight as well as the users. George C. Gordon Library has

7
given a pleasant, glare-less, working environment for the building users which is a suitable
workspace for students, faculty and staff.
2.2.2 Lighting Analysis
Figure 2.3 Ground floor plan is comprised of Collaborative Work Space (Section 1 and 4), Computer
Work Space (Section 2), and Shelving (Section 3). Unlabeled spaces are the Archives. (Source:
LIGHTING STUDY OF THE GEORGE C. GORDON LIBRARY, 2015)
Referring to figure 2.3, the sunlight can enter to allow optimum natural lighting from the
collaborative workspaces organization. Unlike the computer work space and the shelving
area are located at the inner part of the library to ensure the need of having a mire controlled
lighting environment.
Collaborative Work Space
Figure 2.4 Collaborative space (Section 1) of Gordon Library.
(Source: LIGHTING STUDY OF THE GEORGE C. GORDON LIBRARY, 2015)
Fluorescent light
Tinted windows
Bright coloured walls Dominant Colours:
White and Grey

8
Figure 2.5 Collaborative space (Section 4) of Gordon Library.
(Source: LIGHTING STUDY OF THE GEORGE C. GORDON LIBRARY, 2015)
In the middle and the east side of the ground floor of the library is where the collaborative
work space is located. Since it is where the students get to do their work and discussion,
lighting is become an important factor. Fluorescent tubes can be found in section 1 whereas
fluorescent bulbs are used along the whole area of section 4, this allow the library to have a
controlled amount of light suitable for the users in the area. The lights are located on the
strategic area on the ceiling of the space which made light can enter directly to the area
where activities were took space. Tinted windows are also used for natural lighting to enter
the collaborative space. The collaborative room uses natural white lights, therefore white and
grey is the dominant colours of the place. Natural white light creates more suitable mood for
reading and studying than warm light which is become a reason of why natural white lights
were used instead of warm lights.
Figure 2.6 Fluorescent Light in the Collaborative space
Tinted windows
Fluorescent bulb
Bright Coloured Walls Dominant Colours:
White and Grey

9
Computer Work Space
Figure 2.7 Computer work space (Section 2) of Gordon Library.
(Source: LIGHTING STUDY OF THE GEORGE C. GORDON LIBRARY, 2015)
Located at the west side of ground floor, computer work space is the place where
students get to do their work using computer facilities with or without internet. Fluorescent
tubes are the main component that provides lighting in the area. It placed in the place that
can be seen above the areas. As a computer area, it is important that the lighting shouldn’t
be glare-free which is it suitable environment for the users to do their work with computer.
White coloured wall also can be seen around the area which is it giving the area a brighter
mood and at the same time it won’t hurt users eyes easily.
Figure 2.8 Fluorescent Light used in the Computer Work Space
Fluorescent tube
White wall
Dominant Colours:
White and Grey

10
Shelving
Figure 2.9 Shelving area (Section 3) of Gordon Library.
(Source: LIGHTING STUDY OF THE GEORGE C. GORDON LIBRARY, 2015)
The shelving area for ground floor is located at the north side. The shelving area has a
unique type of lighting control sytem called ‘Infrared Light Censor’. This system is used to
control the amount of light intensity that come from the lights. When the censor senses a high
amount of the light entering the area, it will reduce the light intensity of the lights. Light
intensity must to be control in this area because books here are to be kept in a propere
manner and with high intensity of light, the books will be damage as the time goes.
Figure 2.10 Fluorescent tube light used on the shelving area
Fluorescent tube
Infrared light censor
Dominant Colours:
Brown and Grey

11
Ground Floor Lux Measurement
This section describes the lux recommendations and measurements for each of the
sections on the ground floor.
Table 2.1 Lux recommendation for each of the sections on the ground floor
Table 2.2 comparison of measured lux with recommended lux for non-windowed sections on the
ground floor
Table 2.3 comparison of measured lux with recommended lux for the windowed section on the
ground floor

12
Figure 2.11 Lux measurements throughtout the day for section 4 on ground floor
Sunlight
Each floor contains windows that let in natural light throughtout the day. The team
compared the length of the windows to the length of the wall to determine what percentage
of the wall was comprised of windows. Table below shows the calculations for the library
window measurements in the library.
Table 2.4 Window Measurements

13
Figure 2.12 An image of the east-facing floor-to-ceiling windows in the library
The team tracked the position of the sun throughtout the day using a compass and an
online sun calculation to determine the windowed sections were affected by outside light.
Figure 2.13 below shows the position of the sun as the day progressed as the sections were
affected by sunlight at certain times of the day.
Figure 2.13 Sun movement

14
This lighting study was completed in early spring, just after the start of the daylight
savings time. At this time of year, the sun rise 48o east of due south, sets 48o west of due
south and will never directly affect the north side of the library. Later in the year, in June and
July, the sun will rise 64o east of due south and set 64o west of due south. The duration time
of the sun affects the library wil increase as spring turns to summer because of long daylight
hours. In the winter, the duration of sunlight will decreases which giving smaller effect sunlight
in the library. Measurements for this lighting study were collected in early April when the sun
illuminated the library for almost thirteen hours a day.
Illumination
The recorded lux measurements were compared to the recommended lux values for each
section. Subsequently, the team calculated the percentage that the measured lux differed
from the recommended lux value. The percentages were divided onto 5 categories:
Very bright : More than 75% above the recommended value
Bright between : 25% and 75% above the recommended value
Appropriately lit : Between ± 25% difference from the recommended value
Dim between : 25% and -75% below the recommended value
Very dim : Less than -75% below the recommended value
Figure 2.14 Percentage difference between recommended lux values and measured lux values on the ground floor of the library

15
The figure above shows the percentage off of recommended illuminance values for all
non-windowed sections of the library (ground floor). A sun symbol represents a section that
is significantly impacted by natural lighting. The windowed sections illumination level
changes according the day and will be discussed later in the project.
Bulb Temperature
The team found that only a relatively small percentage of input power to a bulb is output
as visible light. To assess the input power radiated as heat, the team measured the
temperatures of three household bulbs with the same lux output values: LED bulb, CFl bulb,
and Halogen bulb. The temperature data for the three bulbs are given in Figure 2.15.
Figure 2.15 Temperatures of 800 lumen household bulbs
The figure above shows that halogen bulb and CFL bulb are much hotter than LED bulb.
The difference in temperature between LEDs and older bulb indicate that LED bulb produce
less heat from the bulb’s input power, making LED bulb more efficient than older alternatives.

16
2.2.3 Conclusion
The Gordon Library has shown how different lighting control can be used in different
section of the area within a building. Some sections such as the shelving needed a more
specific lighting control to the extent of using infrared light censor while some sections
doesn’t need such a way.
Different kind of lighting are needed in a way for users be able to experience different
lighting design when moving from one space to another which also bring the users to have a
better lighting in different activies. Lighting design plays a very important role in architecture,
because with the correct lighting design, users are allow to do their activities comfortably
and at the same time providing the right mood and ambience to those around the space.

17
2.3 Methodology
2.3.1 Preparation
1. Preliminary studies and identification of the spaces that we are choosing were studied before we went to do the case study.
2. Choices of building were suggested for precedent studies to have a better understanding of light functioning would affect in a quality of space.
3. After getting approved for the site as our case study, we made phone calls the shop to have our permissions for our case study.
4. We obtained the plan drawing of the site from the owner of the shop.
5. We differentiated to a few spaces according to different function of the space.
6. We plotted a set of grid lines of 1.5m on the plan for recording later on.
7. Get the lighting data collection device, Digital Lux Meter from our university.
8. Understand how the device works in different conditions and situations before the site visit.
9. Study of basic standard and regulations such as CIBSE, ASHRAE and MS 1525 before that to understand analyzing and comparing the data further on.
2.3.2 Lighting data collection device
2.16 Digital Lux Meter Model LX-101
Lux meters are used to measure the intensity of illumination as distinguished by the human eyes. The value shown does not co-relate to an objective value of energy radiated or reflected. As different wavelengths within the visible spectrum are perceived with varying sensitivity of the eyes, lux meters evaluate light intensity in consideration of the said variable.

18
2.3.3 Lighting data collection method
One of our group member prepared the orthographic drawings before we went for the actual data collection day. We get our lighting data measuring device, Digital LUX meter by lending from our university resources. We then went to our site which located in SS15 to start our measuring work. We listed down all the lighting sources that available in site because it may affect our measurements. We set up a grid line of 1.5 meter of intervals for the lighting data collection after discussed with our lecturer. According to our gridlines, we collected our lighting data on every point of the gridlines by placing the device at a height of 1 meter and 1.5 meter as it is for sitting position and eye level position. We recorded the data on different time, which are the evening for the non-peak hour and night for peak hour. We then insert all the lighting data into a table for further analysis.
19
2.4 Lighting Analysis
2.4.1 Building components
Figure 2.17 Zoning
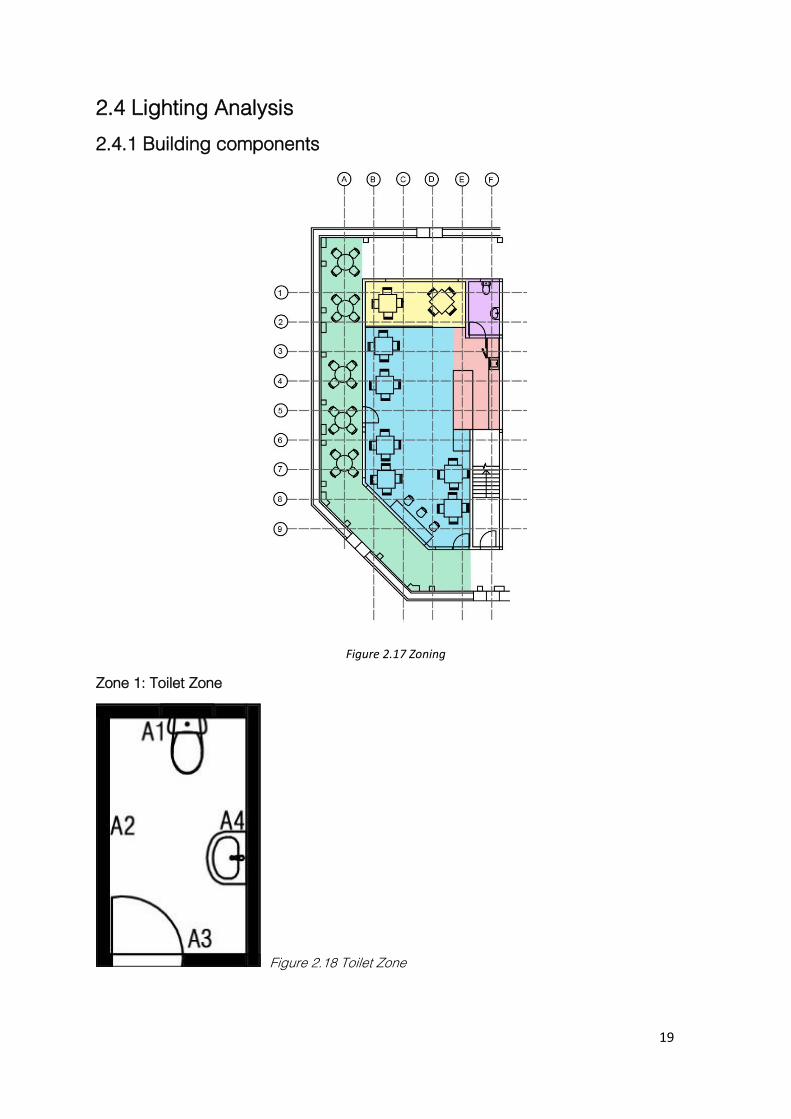
Zone 1: Toilet Zone
Figure 2.18 Toilet Zone

20
Floor
Component Details Surface Finish Reflectance Value (%)
Surface Area (m2)
Grey Ceramic
Smooth
Matte
Ceramic Tile
35
4.23
Walls
Component Details Surface Finish Reflectance Value (%)
Surface Area (m2)
A1
Grey Ceramic
Smooth
Matte
Ceramic Tile
35
4.70
A2
Grey Ceramic
Smooth
Matte
Ceramic Tile
35
8.12
A3
Grey Ceramic
Timber Door
Smooth
Matte
Wood
10
Ceramic Tile
35
Wall: 2.76
Door: 1.94
Total: 4.70

21
A4
Grey Ceramic
Smooth
Matte
Ceramic Tile
35
8.12
Ceiling
Component Details Surface Finish Reflectance Value (%)
Surface Area (m2)
Concrete
White Paint
Smooth
White Paint
71
4.23
Zone 2: Dining 1
Figure 2.19 Dining Zone 1
Floor
Component Details Surface Finish Reflectance Value (%)
Surface Area (m2)
Plywood
Matte
Wood
10
11.83
22
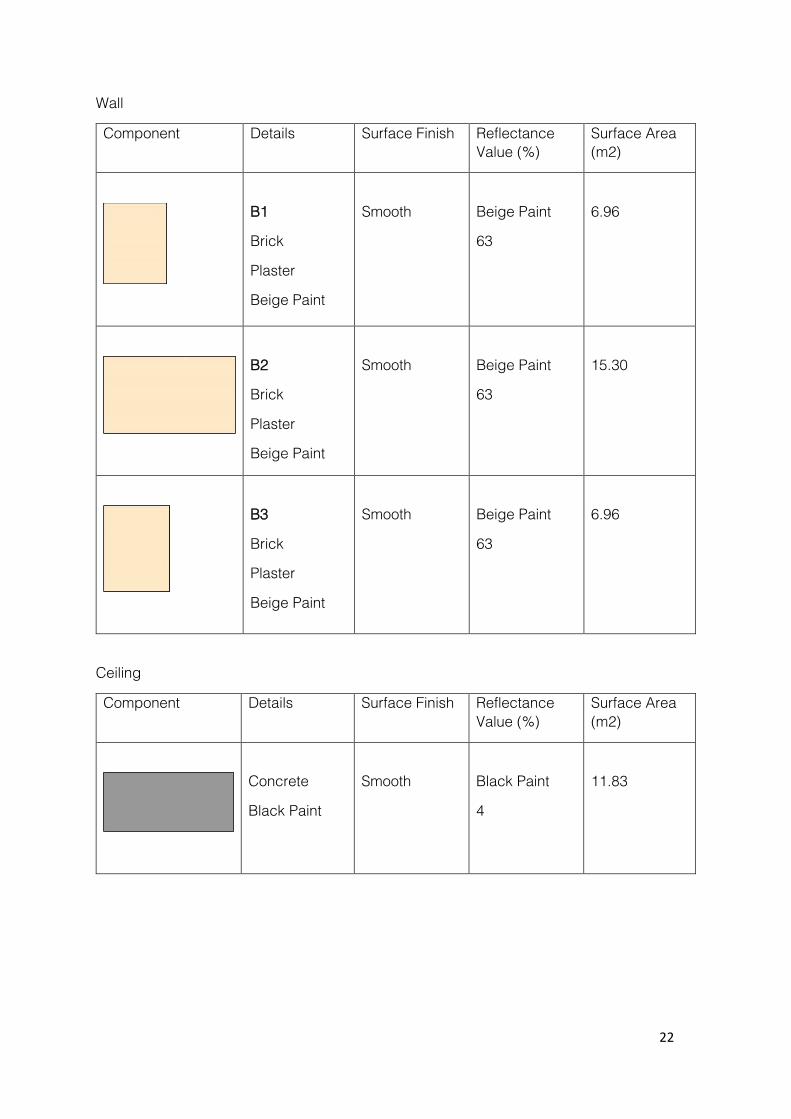
Wall
Component Details Surface Finish Reflectance Value (%)
Surface Area (m2)
B1
Brick
Plaster
Beige Paint
Smooth
Beige Paint
63
6.96
B2
Brick
Plaster
Beige Paint
Smooth
Beige Paint
63
15.30
B3
Brick
Plaster
Beige Paint
Smooth
Beige Paint
63
6.96
Ceiling
Component Details Surface Finish Reflectance Value (%)
Surface Area (m2)
Concrete
Black Paint
Smooth
Black Paint
4
11.83

23
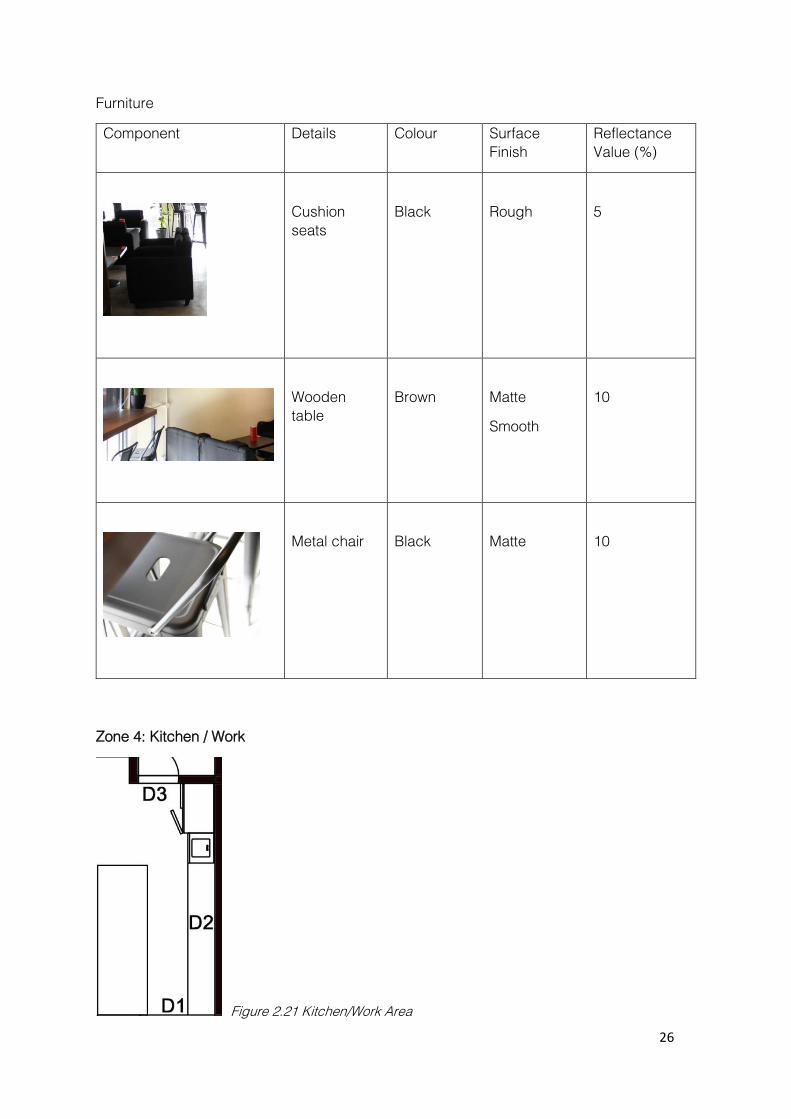
Furniture
Component Details Colour Surface Finish Reflectance Value (%)
Cushion seats
(Each)
Black
Rough
5
Wooden table
Dark brown
Wenge Finish
7.58
Zone 3: Dining 2
Figure 2.20 Dining Zone 2

24
Floor
Component Details Surface Finish Reflectance Value (%)
Surface Area (m2)
Concrete
Smooth
Concrete
8
49.47
Walls
Component Details Surface
Finish
Reflectance Value (%)
Surface Area (m2)
C1
Brick
Plaster
Beige Paint
Glass
Steel Frame
Wall
Smooth
Glass Transparent
Glass
8
Beige Paint
63
Wall: 12.72
Glass: 10.91
Total: 23.63
C2
Brick
Plaster
Beige Paint
Glass
Steel Frame
Wall
Smooth
Glass Transparent
Glass
8
Beige Paint
63
Wall: 4.77 Glass: 9.08 Total: 13.85

25
C3
Brick
Plaster
Beige Paint
Glass
Steel Frame
Wall
Smooth
Glass Transparent
Glass
8
Beige Paint
63
Wall: 2.04
Glass: 4.12
Total: 6.16
C4
Brick
Plaster
Beige Paint
Smooth
Beige Paint
63
17.44
Ceiling
Component Details Surface Finish Reflectance Value (%)
Surface Area (m2)
Concrete
Black Paint
Plywood
Smooth
Wood
10
Black Paint
4
Concrete:
39.04
Plywood:
10.43
Total: 49.47
26
Furniture
Component Details Colour Surface Finish
Reflectance Value (%)
Cushion seats
Black
Rough
5
Wooden table
Brown
Matte
Smooth
10
Metal chair
Black
Matte
10
Zone 4: Kitchen / Work
Figure 2.21 Kitchen/Work Area
27
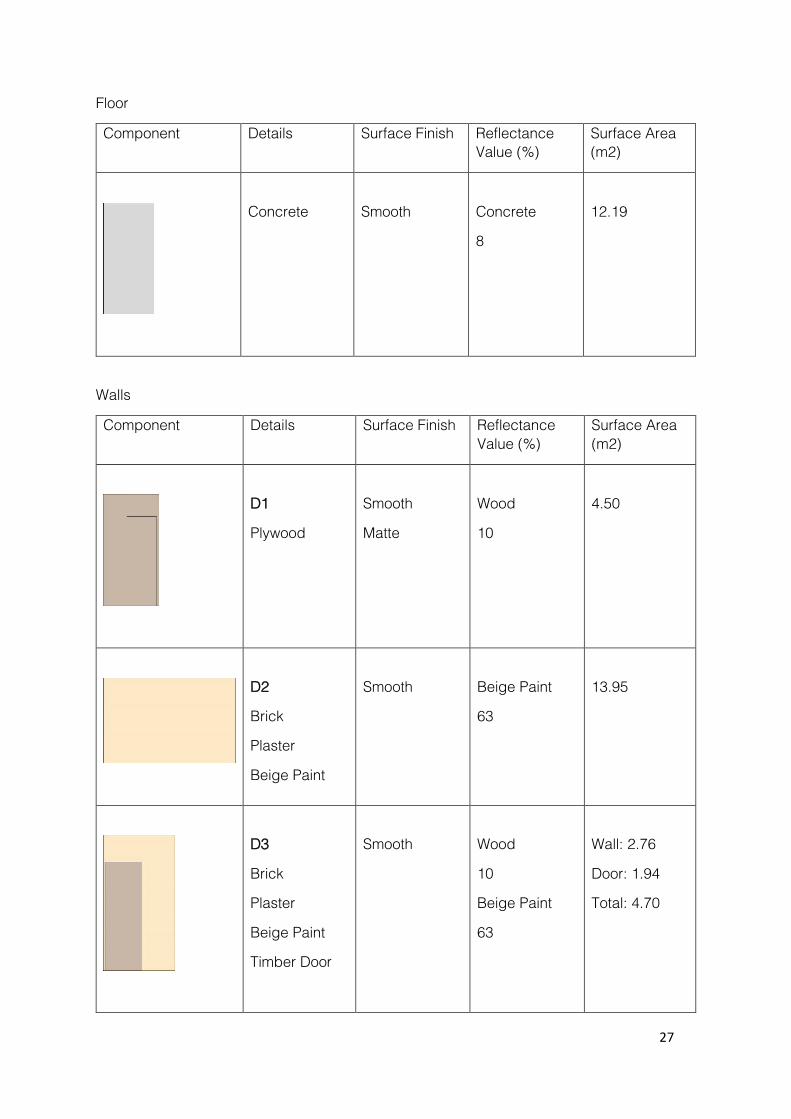
Floor
Component Details Surface Finish Reflectance Value (%)
Surface Area (m2)
Concrete
Smooth
Concrete
8
12.19
Walls
Component Details Surface Finish Reflectance Value (%)
Surface Area (m2)
D1
Plywood
Smooth
Matte
Wood
10
4.50
D2
Brick
Plaster
Beige Paint
Smooth
Beige Paint
63
13.95
D3
Brick
Plaster
Beige Paint
Timber Door
Smooth
Wood
10
Beige Paint
63
Wall: 2.76
Door: 1.94
Total: 4.70

28
Ceiling
Furniture
Component Details Colour Surface Finish Reflectance Value (%)
Wood board
Brown
Smooth
Matte
10
Glass
Transparent
Smooth
8
Component Details Surface Finish Reflectance Value (%)
Surface Area (m2)
Concrete
Black Paint
Smooth
Concrete
8
Black Paint
4
12.19

29
Zone 5: Outdoor
Figure 2.22 Outdoor area
Floor
Component Details Surface Finish Reflectance Value (%)
Surface Area (m2)
Concrete
Smooth
Concrete
8
44.41
Walls
Component Details Surface finish
Reflectance Value (%)
Surface Area (m2)
E1
Brick
Plaster
Beige Paint
Glass
Steel Frame
Wall
Smooth
Glass
Transparent
Glass
8
Beige Paint
63
Wall: 12.72
Glass: 10.91
Total: 23.63

30
E2
Brick
Plaster
Beige Paint
Glass
Steel Frame
Wall
Smooth
Glass
Transparent
Glass
8
Beige Paint
63
Wall: 4.77 Glass: 9.08
Total: 13.85
E3
Brick
Plaster
Beige Paint
Glass
Steel Frame
Wall
Smooth
Glass
Transparent
Glass
8
Beige Paint
63
Wall: 2.04
Glass: 4.12
Total: 6.16
Furniture
Component Details Colour Surface Finish Reflectance Value (%)
Rotan timber material
Brown
Matte
Smooth
10

31
2.4.2 Artificial Lightings in the Building
Figure 2.23 Position of lighting in the café
Symbol Image Lamps Colour Temperature
Colour Rendering
Net luminous
flux
Connected load
Luminous efficacy
LED
3000k
CRI > 80
700lm
11W
63lm/W
Fluorescent
3000k
CRI > 80
1140lm
14W
80lm/W
32
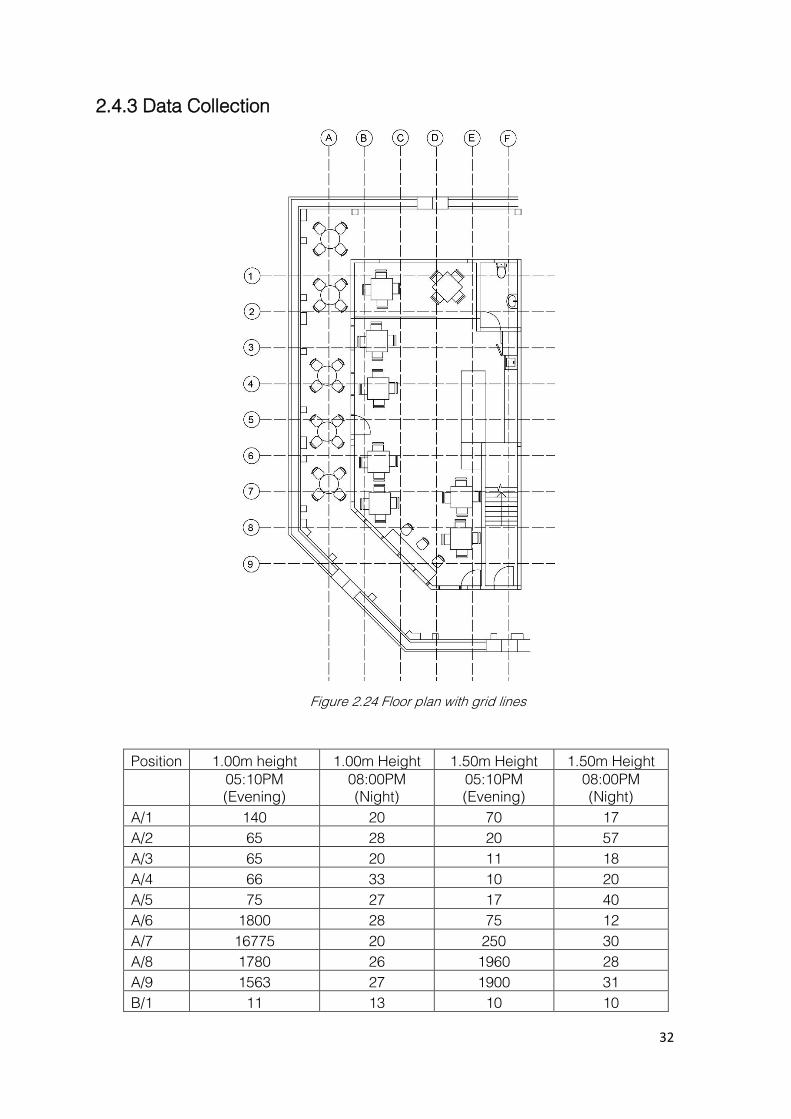
2.4.3 Data Collection
Figure 2.24 Floor plan with grid lines
Position 1.00m height 1.00m Height 1.50m Height 1.50m Height
05:10PM (Evening)
08:00PM (Night)
05:10PM (Evening)
08:00PM (Night)
A/1 140 20 70 17 A/2 65 28 20 57 A/3 65 20 11 18 A/4 66 33 10 20 A/5 75 27 17 40 A/6 1800 28 75 12 A/7 16775 20 250 30 A/8 1780 26 1960 28 A/9 1563 27 1900 31 B/1 11 13 10 10

33
B/2 102 48 68 82 B/3 83 135 95 255 B/4 86 44 105 25 B/5 75 90 56 60 B/6 108 113 144 143 B/7 85 40 52 80 B/8 1870 32 1626 45 B/9 1797 30 1899 24 C/1 207 200 192 230 C/2 46 20 25 18 C/3 34 20 27 14 C/4 30 20 33 12 C/5 52 21 31 17 C/6 56 15 40 10 C/7 100 20 50 22 C/8 175 92 154 71 C/9 1183 36 1117 50 D/1 98 120 136 284 D/2 12 16 9 10 D/3 31 20 27 15 D/4 43 18 38 14 D/5 50 15 544 11 D/6 135 13 108 15 D/7 78 40 69 20 D/8 270 20 130 11 D/9 167 160 62 115 E/1 6 10 7 10 E/2 4 6 6 4 E/3 24 25 33 84 E/4 70 70 57 75 E/5 62 35 45 40 E/6 75 60 135 50 E/7 63 150 70 190 E/8 75 23 66 E/9 150 16 56 F/1 58 67 70 97 F/2 87 76 160 89 F/3 159 54 187 62 F/4 224 200 390 230 F/5 55 67 70 80 F/6 - - - - F/7 - - - - F/8 - - - - F/9 - - - -

34
2.4.4 Calculation and Analysis
2.4.4.1 Day light factor calculation
Figure 2.25 The area whereby sunlight penetrates in.
Eo, Simultaneous outdoor
illuminance on a horizontal
plane from an unobstructed
hemisphere of overcast
sky, ( lux )
Ei, Average illuminance
due to daylight on the
indoor working plane,
( lux )
Day light factor,
DF=( Eo/ Ei ) x 100 %
32000
87.08
= (87.08/32000) x 100 %
=0.27

35
Table 2.5 Daylight factor and distribution
Based on the table above, the day light factor of the case study, 0.27%, is considered poor.
However, the day light factor could be higher because most of the daylight is blocked by
the visor and the canvas.
Figure 2.26 Shows the daylight is partially blocked by the visor.

36
Figure 2.27 shows the daylight is partially blocked by the canvas.
Figure 2.28 Shows the clear sky condition during our visit day.

37
2.4.4.2 Lumen method calculation
Figure 2.29 Toilet zone
Total floor area ( m 2 ) 4.239
Type of lighting feature Fluorescent light
Mounting height, Hm ( m ) 2
Number of fixture, N 2
Lumen of Lighting fixture, F ( lm ) 3000
Maintenance factor ( MF ) 0.75
Reflectance - ceiling 0.7
-wall 0.3
Room Index ( 1.57 x 2.70 ) / 2 ( 1.57 + 2.70 ) = 0.50
Ultilization factor ( UF ) 0.22
Standard Illuminance ( lux ) 150
Current illuminance ( lux ) 233.55
Actual number of fixture needed, N N = (150 x 4.24) / 3000 x 0.75 x 0.22
= 1.28
= 1 light fixture is needed

38
Figure 2.30 Dining Zone 1
Total floor area ( m 2 ) 11.83
Type of lighting feature LED Spotlight
Mounting height, Hm ( m ) 2
Number of fixture, N 6
Lumen of Lighting fixture, F ( lm ) 700
Maintenance factor ( MF ) 0.75
Reflectance - ceiling 0.3
-wall 0.5
Room Index ( 5.10 x 2.32 ) /2 x ( 5.10 + 2.32 ) = 0.80
Ultilization factor ( UF ) 0.27
Standard Illuminance ( lux ) 200
Current illuminance ( lux ) 71.88
Actual number of fixture needed, N N = (200 x 11.83) / 700 x 0.75 x 0.27
= 16.69
= 17 light fixtures are needed

39
Figure 2.31 Dining Zone 2
Total floor area ( m 2 ) 49.47
Type of lighting feature LED Spotlight
Mounting height, Hm ( m ) 2
Number of fixture, N 21
Lumen of Lighting fixture, F ( lm ) 700
Maintenance factor ( MF ) 0.75
Reflectance - ceiling 0.3
-wall 0.5
Room Index ( 13.76 x 7.12 ) /2 x ( 13.76 + 7.12 ) = 2.35
Ultilization factor ( UF ) 0.45
Standard Illuminance ( lux ) 200
Current illuminance ( lux ) 100.29
Actual number of fixture needed, N N = (200 x 49.47) / 700 x 0.75 x 0.45
= 41.88
= 42 light fixtures are needed

40
Figure 2.32 Kitchen/Work Area
Total floor area ( m 2 ) 12.19
Type of lighting feature LED Spotlight and fluorescent
Mounting height, Hm ( m ) 12
Number of fixture, N 21
Lumen of Lighting fixture, F ( lm ), halogen 700
Lumen of Lighting fixture, F ( lm ),
fluorescent
1140
Average Lumen ( 700 x 11 ) + 1140 / 12 = 736.67
Maintenance factor ( MF ) 0.75
Reflectance - ceiling 0.3
-wall 0.5
Room Index ( 2.35 x 4.65 ) /2 x ( 2.35 + 4.65 ) = 0.8
Ultilization factor ( UF ) 0.27
Standard Illuminance ( lux ) 200
Current illuminance ( lux ) 146.87
Actual number of fixture needed, N N = (200 x 12.19) / 736.77 x 0.75 x 0.27
= 16.34
= 16 light fixtures are needed

41
2.4.5 Analysis diagram
Light Source Analysis
Figure 2.33 Section line on plan
Section A-A
Section B-B

42
The spaces are mainly equipped with LED spotlight. Spotlight has very small light angle
therefore it only shines and provides light to a small area as shown in the section drawings.
During the day time, the space relies heavily on daylighting so each area gets their fair share
of light. However, during the night time, as the LED spotlight is unable to cover a big area,
leaving some bright, and some very dark. Though the space has a total of 36 ceiling
spotlights installed, it is still insufficient to cover the entire space or to achieve visual comfort.
Figure 2.34 The corners of the spaces are dark and no light shines there.
Ecotech simulation and analysis
Figure 2.34 The light contour for day time
It is quite clear that the lux value for the bottom part of the plan surpasses the other areas. This is because that’s the area where most of the glass panel are placed. Also it faces directly to the western sun. However, the simulation exceeded the data we got because in the actual building, the sunlight is partially blocked by the visors fixed on the surface of window.

43
Figure 2.35 The light contour for night time
According to MS 1525, the illuminance for cafeteria is 200lux. As mentioned before, the angle of light is small. Hence, as the simulation shows, the difference of light received at different position. The simulation shows that the highest reading is more than 300, whereas the highest reading recorded is only 284lux. This could be caused by the minimal light fixture selection of the Ecotech itself. Aside from that, the simulation generally matches our data.

44
2.5 Conclusion
The choice of lighting though does create a very modern, peaceful and homely atmosphere
which the shop wants to express. However, bases on the calculation and analysis, we can
conclude that the Brogues Coffee is lack of both artificial and natural light. In other words,
the lightings in this café is insufficient to achieve visual comfort for the users, and also to suit
the function of the space.
As seen in Figure 2.37 below, the back side of the space is dark. This is because the usage
of spotlight doesn’t not allow the whole room to be light up fully, which causes parts of the
spaces to be very bright, and parts of the spaces to be really dark. Though the reflectance
value of the beige colour wall is quite decent, the light hardly reaches the walls to be reflected
through the spaces. So, depending on where the user is within the space, the dullness and
darkness may make the user feel uncomfortable.
Also. there are large openings facing directly to the western sun. Though those opening are
partially blocked, the sunlight still manages to enter the building which causes glare problem.
This problem exists because the concrete floor reflects some of the sunlight into the building,
causing disturbance and discomfort to the users.
Figure 2.37 The glare problem exists within the building. (Photo taken at 5.30 pm)

45
3.0 Acoustic
46
3.1 Introduction
It can be denied that acoustic design is another element that should well considerate in
architecture. Sound is similar to light in its movements, such that it could be reflected,
refracted, diffracted and others. The field of building acoustics consists of two parts; Room
Acoustics and Building Acoustics. Basically, room acoustics is related to the quality of sound
while building acoustics is related to unwanted sound, or noise.
To achieve comfort level, rate of sound input is compensated by the rate of energy absorbed
in the room. In other words, sound level in the room will be reduced if more absorbing
materials are brought in. Rooms with highly reflecting surfaces will have a relatively long
reverberation time while rooms with lots of absorbing materials will have short reverberation
times. In building acoustics, engineers concentrate on the noise level due to what goes on in
adjacent rooms (or outside) an important parameter is the sound insulation.
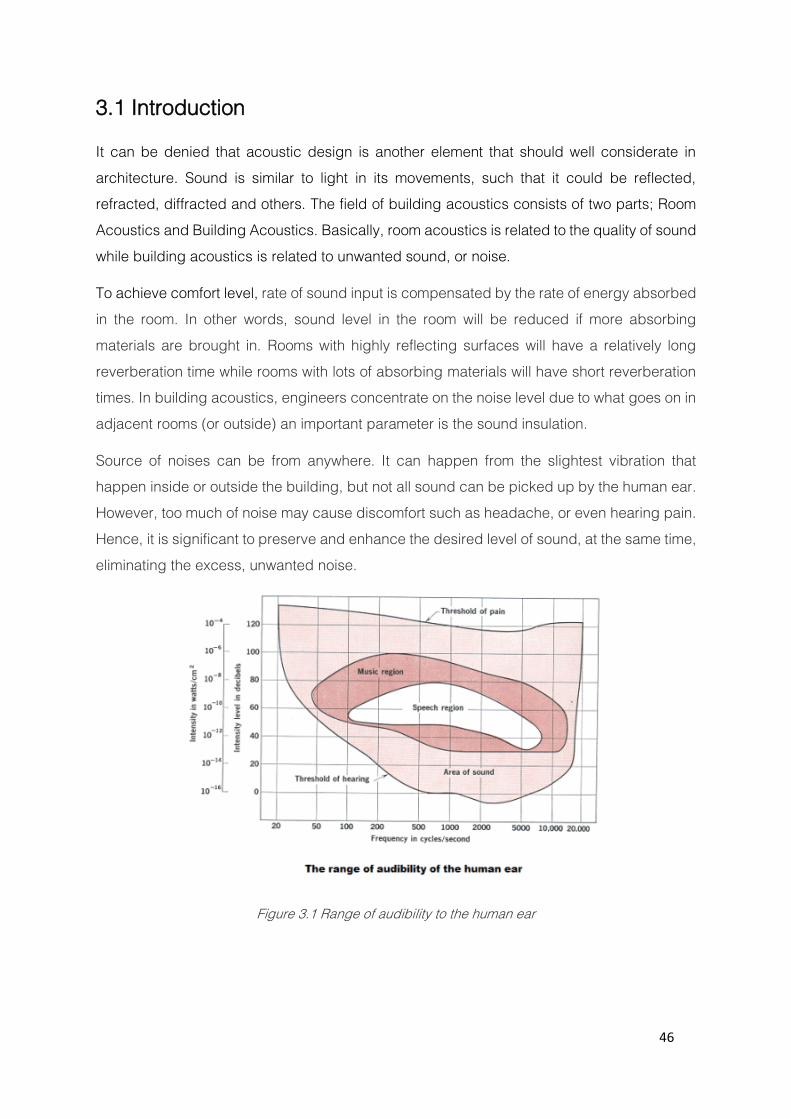
Source of noises can be from anywhere. It can happen from the slightest vibration that
happen inside or outside the building, but not all sound can be picked up by the human ear.
However, too much of noise may cause discomfort such as headache, or even hearing pain.
Hence, it is significant to preserve and enhance the desired level of sound, at the same time,
eliminating the excess, unwanted noise.
Figure 3.1 Range of audibility to the human ear
47
3.2 Journal
3.2.1 Introduction
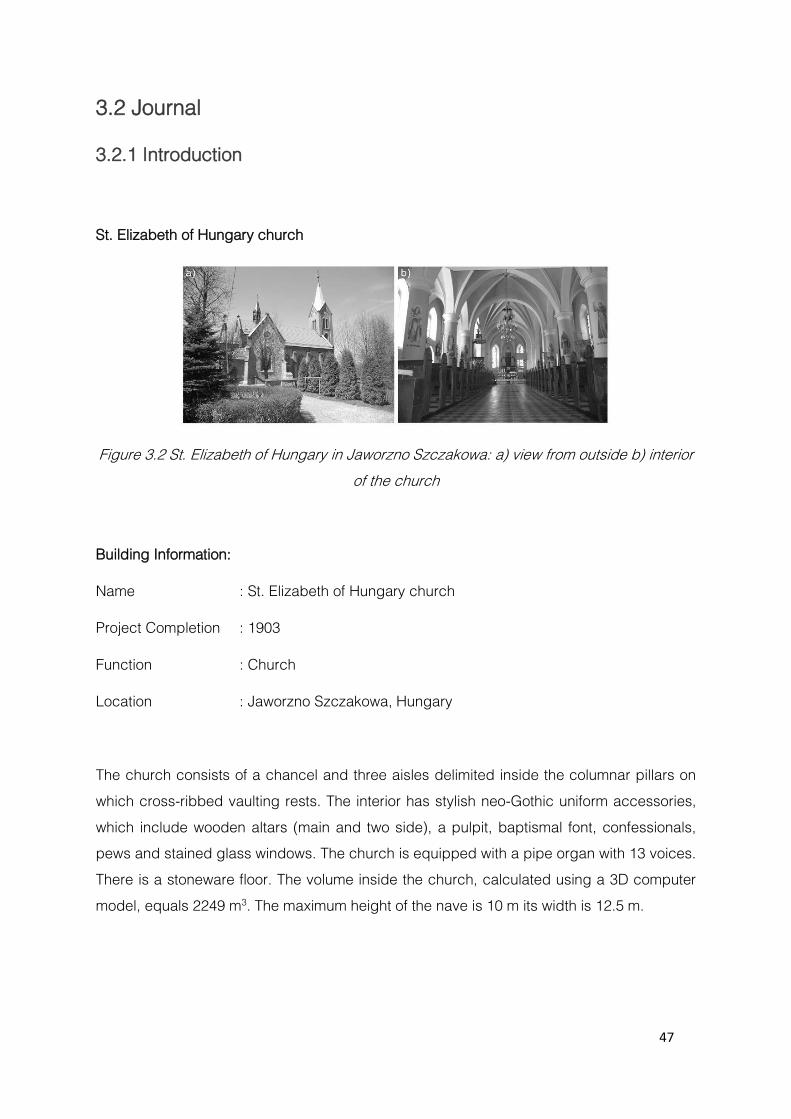
St. Elizabeth of Hungary church
Figure 3.2 St. Elizabeth of Hungary in Jaworzno Szczakowa: a) view from outside b) interior
of the church
Building Information:
Name : St. Elizabeth of Hungary church
Project Completion : 1903
Function : Church
Location : Jaworzno Szczakowa, Hungary
The church consists of a chancel and three aisles delimited inside the columnar pillars on
which cross-ribbed vaulting rests. The interior has stylish neo-Gothic uniform accessories,
which include wooden altars (main and two side), a pulpit, baptismal font, confessionals,
pews and stained glass windows. The church is equipped with a pipe organ with 13 voices.
There is a stoneware floor. The volume inside the church, calculated using a 3D computer
model, equals 2249 m3. The maximum height of the nave is 10 m its width is 12.5 m.

48
3.2.2 Acoustic Analysis
Different acoustical methods have been carried out in order to determine the reverberation
time values and to develop a proposal solution for an acoustical improvement of the studied
church.
For the acoustic field evaluation, the following steps were proposed:
A) Calculation of reverberation time using empirical methods (Sabine)
B) Reverberation time measurements
C) Result interpretation verification of obtained values
D) Acoustic rehabilitation proposal
Reverberation Time Calculation
The first method applied is based on the Sabine eq., empirical formula based on the room
geometry and on the absorption characteristics of the room delimiting surfaces defined by
the calculation
𝑇 =0.161 𝑉
𝐴
Where,
T = reverberation time [s]
V = room volume [m3]
A = total absorption area [m3]
Figure 3.3 Obtained value using the Sabine equation are presented here
49
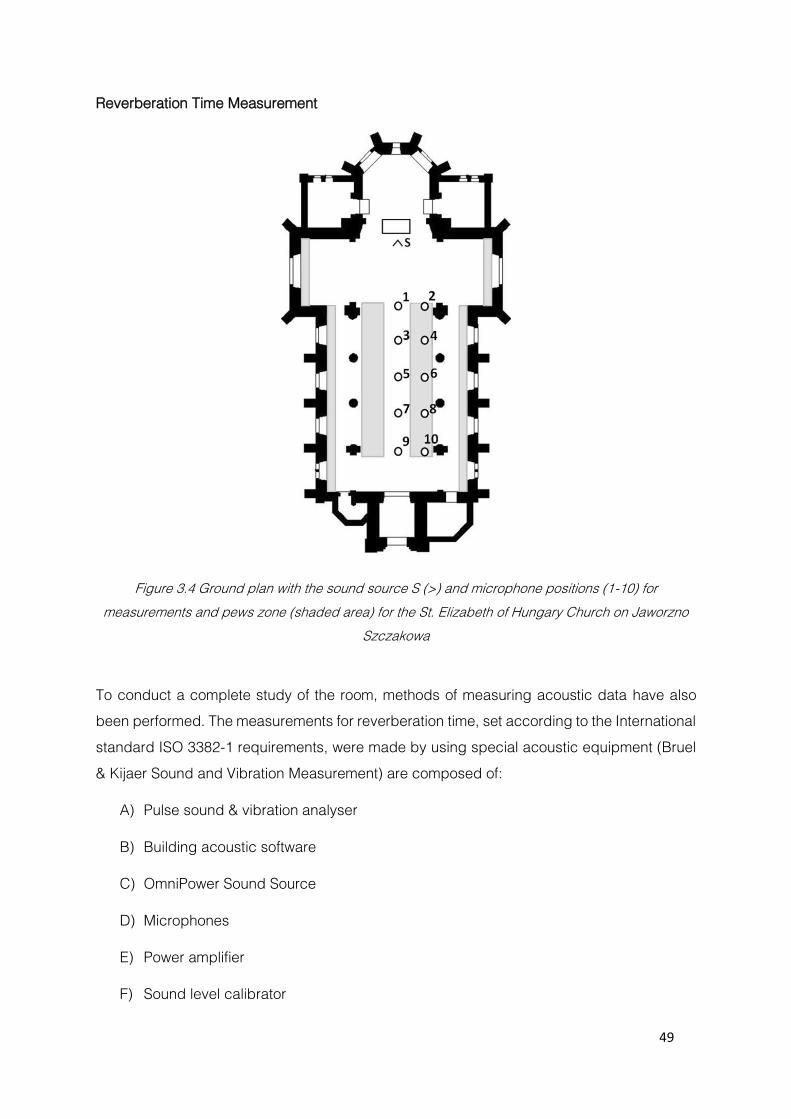
Reverberation Time Measurement
Figure 3.4 Ground plan with the sound source S (>) and microphone positions (1-10) for
measurements and pews zone (shaded area) for the St. Elizabeth of Hungary Church on Jaworzno
Szczakowa
To conduct a complete study of the room, methods of measuring acoustic data have also
been performed. The measurements for reverberation time, set according to the International
standard ISO 3382-1 requirements, were made by using special acoustic equipment (Bruel
& Kijaer Sound and Vibration Measurement) are composed of:
A) Pulse sound & vibration analyser
B) Building acoustic software
C) OmniPower Sound Source
D) Microphones
E) Power amplifier
F) Sound level calibrator

50
The measurements were taken inside the emptied church. According International Standards
ISO 3382-1, the reverberation time can be computed using different methods: interrupted
noise and integrated response to the impulse. In this case, the preferred method was
‘interrupted noise’, method comprising an omnidirectional sound source generating white
noise, which is a random signal with a flat power spectral density. The omnidirectional sound
source is composed of 12 speakers placed in such a way as to allow a spherical distribution
of the sound. According ISO 3382-1, the height of the sound source acoustic centre was
established at 1.5 m above the floor.
Acoustic model of the church
An acoustic model of the church has been developed by using the CATT-Acoustic v8
computer program. The location of the sound source and 10 test points in the model were
consistent with the location of the source and measuring points during in-situ measurements
in the church. The acoustic model consists of 918 surfaces. The reverberant sound
absorption coefficients α, chosen from the literature (MARTELLOTTA, 2009; MARTELLOTTA
et. Al., 2011; VORLANDER, 2008; CARMONA et. Al., 2009; MEYER, 2003) and assigned to
each area, correspond to the finishing materials of the church (Table 2.0.1).
Sound scattering coefficients s (Table 2.0.1_ were matched to the type of materials with
smooth surfaces (for example: walls or marble floor), moderately irregular (for example:
domes and arches) and irregular (for example: the altar) (ALONSO et. aL., 2014).
Figure 3.5 The acoustic model of the church, A0 – sound source, 1-10 – test points

51
Table 3.1. the reverberant sound absorption coefficients α, and the sound scattering
coefficients s in octave frequency bands of materials used in simulation tests.
Table 3.1 Adapted materials used for model calibration
Calibration of the acoustic model was carried out using the reverberation time. In the case of
this church the calibration process relied on adjusting the values of the sound absorption
coefficients α of the two materials with the largest percentage among all the finishing
materials, which were wall surfaces (31.6%) and domes and arches (33.4%). The values of
the sound absorption coefficients α of walls and domes and arches (Table 2.0.1) are similar
to those given in (VORLANDER, 2008) and (MARTELLOTTA, 2009), respectively. Such
adjustments ensured that satisfactory values of the simulated reverberation time were
obtained.
Comparisons of the reverberation time on octave frequency bands for the church without an
audience derived from T30 in-situ measurements and T30-unocc obtained from simulation tests
carried out on the model, are shown in the Table 2.0.2, along with the relative errors δ.
Table 1.5. Averaged, in space, values of the reverberation time in octave frequently bands
for the church without an audience derived from in-situ measurements T30 and obtained from
simulation tests T30-unocc carried out on the model, along with the relative errors δ.

52
Table 3.2 Values of T30 and T30-unocc
The values of T30 and T30-unocc varied less than 5% in each octave frequency band, which
corresponds to the Just Noticeable Difference (JND) threshold. Hence, it was assumed that
thee calibration of the church’s acoustic model was performed with sufficient accuracy
(VORLANDER M., 2008; BUENO et. aL., 2012). The temperature and humidity used in the
calibration of the model and in the simulation tests were the same as during in-situ
measurements in the church.
3.2.3 Conclusion
In churches, a favourable transmission of the sound level during liturgy through the entire
area occupied by the auditors is an essential requirement in the understanding process of
the spoken or sung words.
Research of this paper shows that the reverberation time values of the studied space were
sufficiently high to influence the communication activity.
Comfortable acoustic levels must be met in every hall in order to optimise the sound
transmission and listening conditions that are essential for every member of the audience.

53
3.3 Methodology
3.3.1 Preparation
1. Preliminary studies and identification of the spaces that we are choosing were studied
before we went to do the case study.
2. Choices of building were suggested for precedent studies to have a better understanding
of acoustics functioning would affect the surrounding of space.
3. After getting approved for the site as our case study, we made phone calls the shop to
have our permissions for our case study.
4. We obtained the plan drawing of the site from the owner of the shop.
5. We differentiated to a few spaces according to different function of the space.
6. We plotted a set of grid lines of 1.5m on the plan for recording later on.
7. Get the sound level meter from our university.
8. Understand how the device works in different conditions and situations before the site visit.
9. Study of basic standard and regulations such as CIBSE, ASHRAE and MS 1525 before
that to understand analyzing and comparing the data further on.
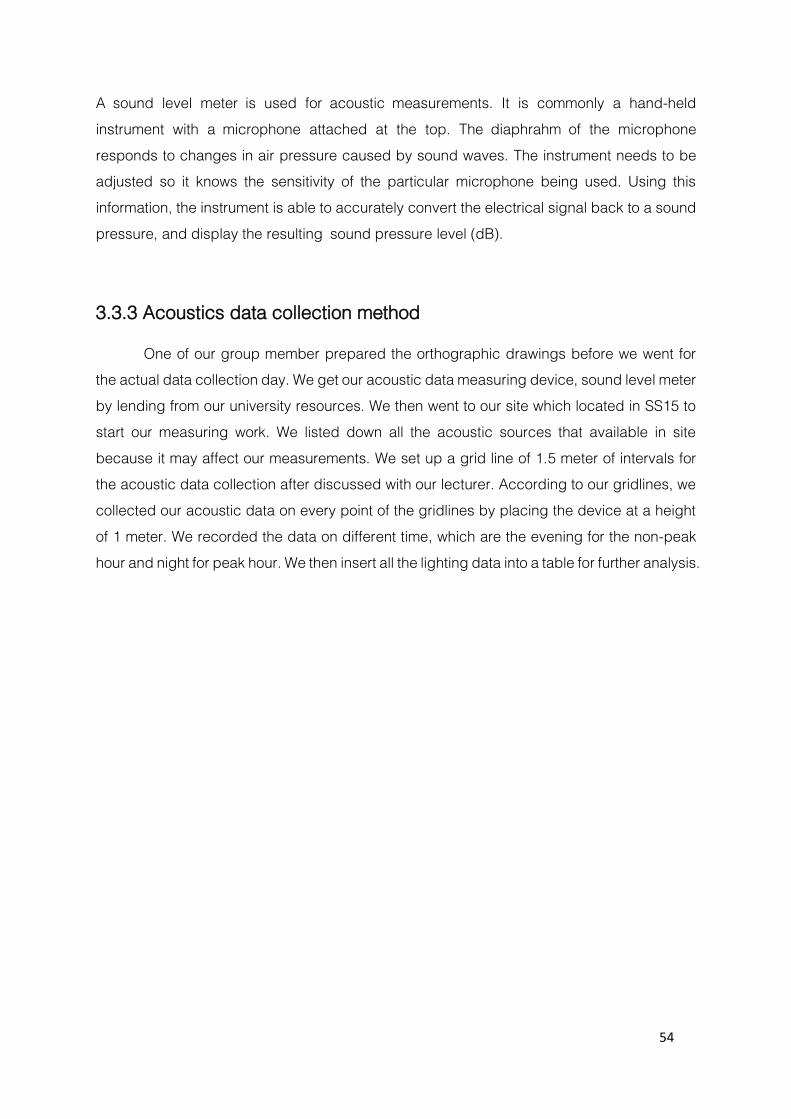
3.3.2 Acoustics data collection device
Figure 3.6 Sound level meter
54
A sound level meter is used for acoustic measurements. It is commonly a hand-held
instrument with a microphone attached at the top. The diaphrahm of the microphone
responds to changes in air pressure caused by sound waves. The instrument needs to be
adjusted so it knows the sensitivity of the particular microphone being used. Using this
information, the instrument is able to accurately convert the electrical signal back to a sound
pressure, and display the resulting sound pressure level (dB).
3.3.3 Acoustics data collection method
One of our group member prepared the orthographic drawings before we went for
the actual data collection day. We get our acoustic data measuring device, sound level meter
by lending from our university resources. We then went to our site which located in SS15 to
start our measuring work. We listed down all the acoustic sources that available in site
because it may affect our measurements. We set up a grid line of 1.5 meter of intervals for
the acoustic data collection after discussed with our lecturer. According to our gridlines, we
collected our acoustic data on every point of the gridlines by placing the device at a height
of 1 meter. We recorded the data on different time, which are the evening for the non-peak
hour and night for peak hour. We then insert all the lighting data into a table for further analysis.

55
3.4 Acoustic Analysis
3.4.1 Building Components
Figure 3.7 Zoning
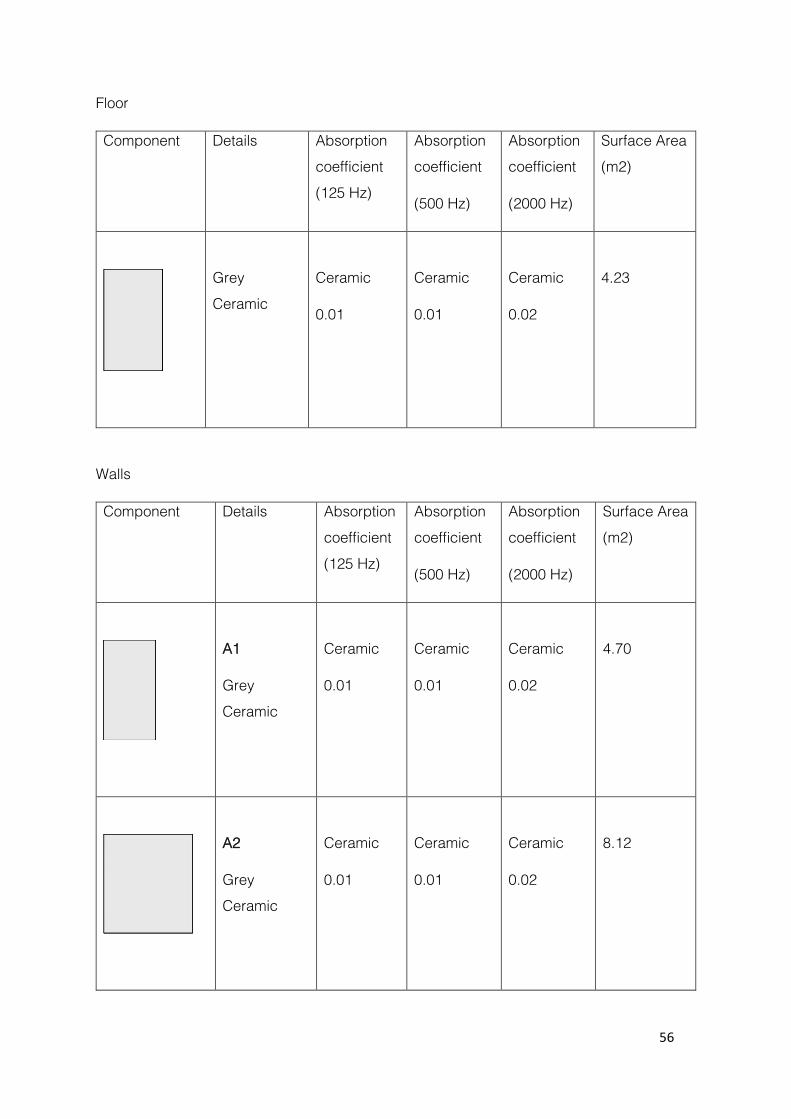
Zone 1: Toilet Zone
Figure 3.8 Toilet Area
56
Floor
Component Details Absorption
coefficient
(125 Hz)
Absorption
coefficient
(500 Hz)
Absorption
coefficient
(2000 Hz)
Surface Area
(m2)
Grey
Ceramic
Ceramic
0.01
Ceramic
0.01
Ceramic
0.02
4.23
Walls
Component Details Absorption
coefficient
(125 Hz)
Absorption
coefficient
(500 Hz)
Absorption
coefficient
(2000 Hz)
Surface Area
(m2)
A1
Grey
Ceramic
Ceramic
0.01
Ceramic
0.01
Ceramic
0.02
4.70
A2
Grey
Ceramic
Ceramic
0.01
Ceramic
0.01
Ceramic
0.02
8.12

57
A3
Grey
Ceramic
Timber Door
Ceramic
0.01
Wood
0.15
Ceramic
0.01
Wood
0.10
Ceramic
0.02
Wood
0.10
Wall: 2.76
Door: 1.94
Total: 4.70
A4
Grey
Ceramic
Ceramic
0.01
Ceramic
0.01
Ceramic
0.02
8.12
Ceiling
Component Details Absorption
Coefficient
(125 Hz)
Absorption
coefficient
(500 Hz)
Absorption
coefficient
(2000 Hz)
Surface Area
(m2)
Concrete
Plaster
White Paint
Brick
0.03
Plaster
0.01
Brick
0.03
Plaster
0.02
Brick
0.05
Plaster
0.04
4.23

58
Zone 2: Dining 1
Figure 3.9 Dining Zone 1
Floor
Component Details Absorption
Coefficient
(125 Hz)
Absorption
coefficient
(500 Hz)
Absorption
coefficient
(2000 Hz)
Surface
Area (m2)
Laminated
Hard wood
Wood
0.15
Wood
0.10
Wood
0.10
11.83
Wall
Component Details Absorption
Coefficient
(125 Hz)
Absorption
coefficient
(500 Hz)
Absorption
coefficient
(2000 Hz)
Surface
Area (m2)
B1
Brick
Plaster
Beige Paint
Brick
0.03
Plaster
0.02
Brick
0.03
Plaster
0.02
Brick
0.05
Plaster
0.04
6.96

59
B2
Brick
Plaster
Beige Paint
Brick
0.03
Plaster
0.02
Brick
0.03
Plaster
0.02
Brick
0.05
Plaster
0.04
15.30
B3
Brick
Plaster
Beige Paint
Brick
0.03
Plaster
0.02
Brick
0.03
Plaster
0.02
Brick
0.05
Plaster
0.04
6.96
Ceiling
Component Details Absorption
Coefficient
(125 Hz)
Absorption
coefficient
(500 Hz)
Absorption
coefficient
(2000 Hz)
Surface
Area (m2)
Concrete
Black Paint
Concrete
0.02
Concrete
0.05
Concrete
0.05
11.83

60
Furniture
Component Details Absorption
Coefficient
(125 Hz)
Absorption
coefficient
(500 Hz)
Absorption
coefficient
(2000 Hz)
Cushion
seats
(Each)
0.12
0.28
0.28
Wooden
table
0.08
0.15
0.18
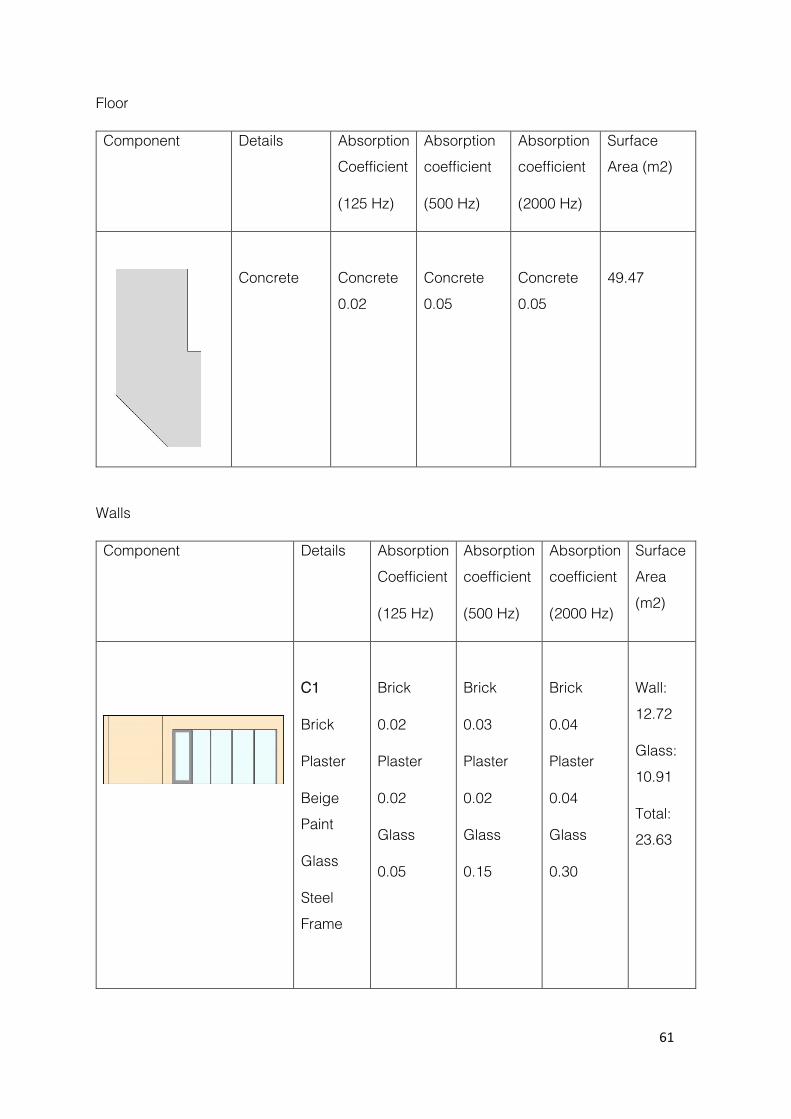
Zone 3: Dining 2
Figure 3.10 Dining Zone 2
61
Floor
Component Details Absorption
Coefficient
(125 Hz)
Absorption
coefficient
(500 Hz)
Absorption
coefficient
(2000 Hz)
Surface
Area (m2)
Concrete
Concrete
0.02
Concrete
0.05
Concrete
0.05
49.47
Walls
Component Details Absorption
Coefficient
(125 Hz)
Absorption
coefficient
(500 Hz)
Absorption
coefficient
(2000 Hz)
Surface
Area
(m2)
C1
Brick
Plaster
Beige
Paint
Glass
Steel
Frame
Brick
0.02
Plaster
0.02
Glass
0.05
Brick
0.03
Plaster
0.02
Glass
0.15
Brick
0.04
Plaster
0.04
Glass
0.30
Wall:
12.72
Glass:
10.91
Total:
23.63

62
C2
Brick
Plaster
Beige
Paint
Glass
Steel
Frame
Brick
0.02
Plaster
0.02
Glass
0.05
Brick
0.03
Plaster
0.02
Glass
0.15
Brick
0.04
Plaster
0.04
Glass
0.30
Wall:
4.77
Glass:
9.08
Total:
13.85
C3
Brick
Plaster
Beige
Paint
Glass
Steel
Frame
Brick
0.02
Plaster
0.02
Glass
0.05
Brick
0.03
Plaster
0.02
Glass
0.15
Brick
0.04
Plaster
0.04
Glass
0.30
Wall:
2.04
Glass:
4.12
Total:
6.16
C4
Brick
Plaster
Beige
Paint
Brick
0.02
Plaster
0.02
Brick
0.03
Plaster
0.02
Brick
0.04
Plaster
0.04
17.44

63
Ceiling
Component Details Absorption
Coefficient
(125 Hz)
Absorption
coefficient
(500 Hz)
Absorption
coefficient
(2000 Hz)
Surface
Area (m2)
Concrete
Black Paint
Plywood
Wood
0.15
Concrete
0.02
Wood
0.12
Concrete
0.05
Wood
0.08
Concrete
0.05
Concrete:
39.04
Plywood:
10.43
Total: 49.47
Furniture
Component Details Absorption
Coefficient
(125 Hz)
Absorption
coefficient
(500 Hz)
Absorption
coefficient
(2000 Hz)
Cushion
seats
(Each)
0.12
0.28
0.28
Wooden
table
0.08
0.15
0.18

64
Metal chair
0.07
0.14
0.14
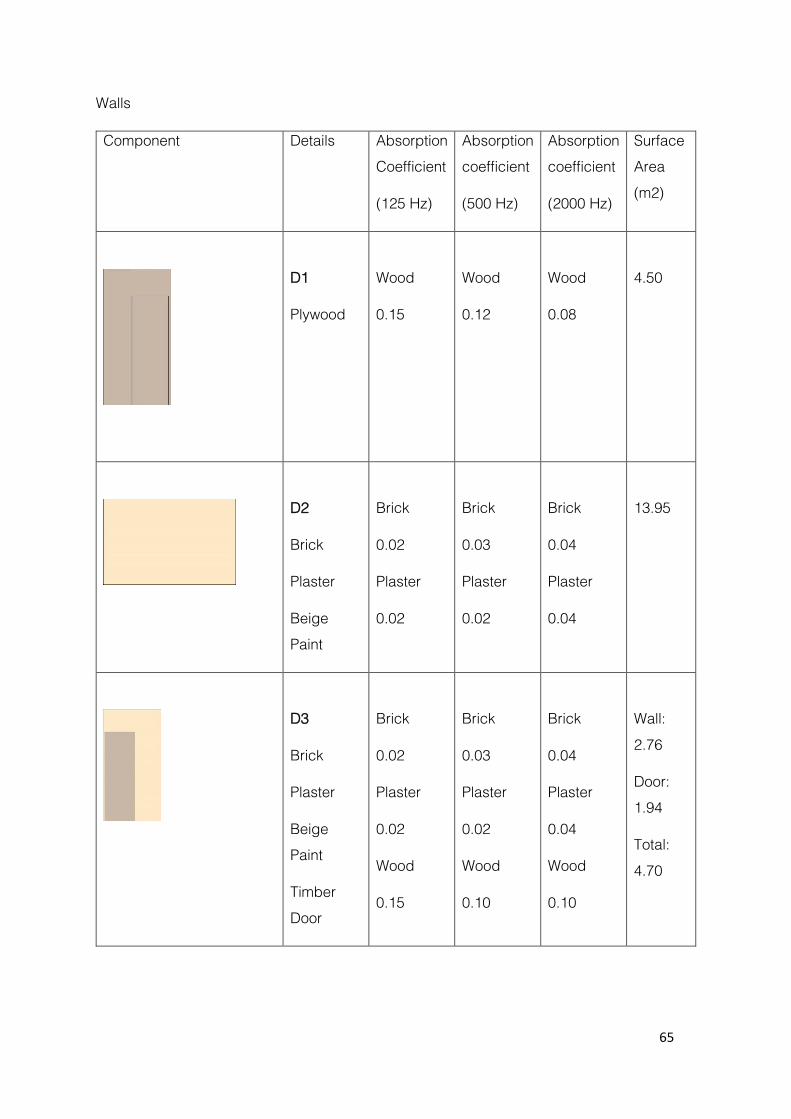
Zone 4: Kitchen/Work
Figure 3.11 Kitchen/Work Area
Floor
Component Details Absorption
Coefficient
(125 Hz)
Absorption
coefficient
(500 Hz)
Absorption
coefficient
(2000 Hz)
Surface
Area (m2)
Concrete
Concrete
0.02
Concrete
0.05
Concrete
0.05
12.19
65
Walls
Component Details Absorption
Coefficient
(125 Hz)
Absorption
coefficient
(500 Hz)
Absorption
coefficient
(2000 Hz)
Surface
Area
(m2)
D1
Plywood
Wood
0.15
Wood
0.12
Wood
0.08
4.50
D2
Brick
Plaster
Beige
Paint
Brick
0.02
Plaster
0.02
Brick
0.03
Plaster
0.02
Brick
0.04
Plaster
0.04
13.95
D3
Brick
Plaster
Beige
Paint
Timber
Door
Brick
0.02
Plaster
0.02
Wood
0.15
Brick
0.03
Plaster
0.02
Wood
0.10
Brick
0.04
Plaster
0.04
Wood
0.10
Wall:
2.76
Door:
1.94
Total:
4.70

66
Ceiling
Component Details Absorption
Coefficient
(125 Hz)
Absorption
coefficient
(500 Hz)
Absorption
coefficient
(2000 Hz)
Surface
Area (m2)
Concrete
Black Paint
Concrete
0.02
Concrete
0.05
Concrete
0.05
12.19
Furniture
Component Details Absorption
Coefficient
(125 Hz)
Absorption
coefficient
(500 Hz)
Absorption
coefficient
(2000 Hz)
Wood board
0.15
0.10
0.10
Glass
0.05
0.15
0.30

67
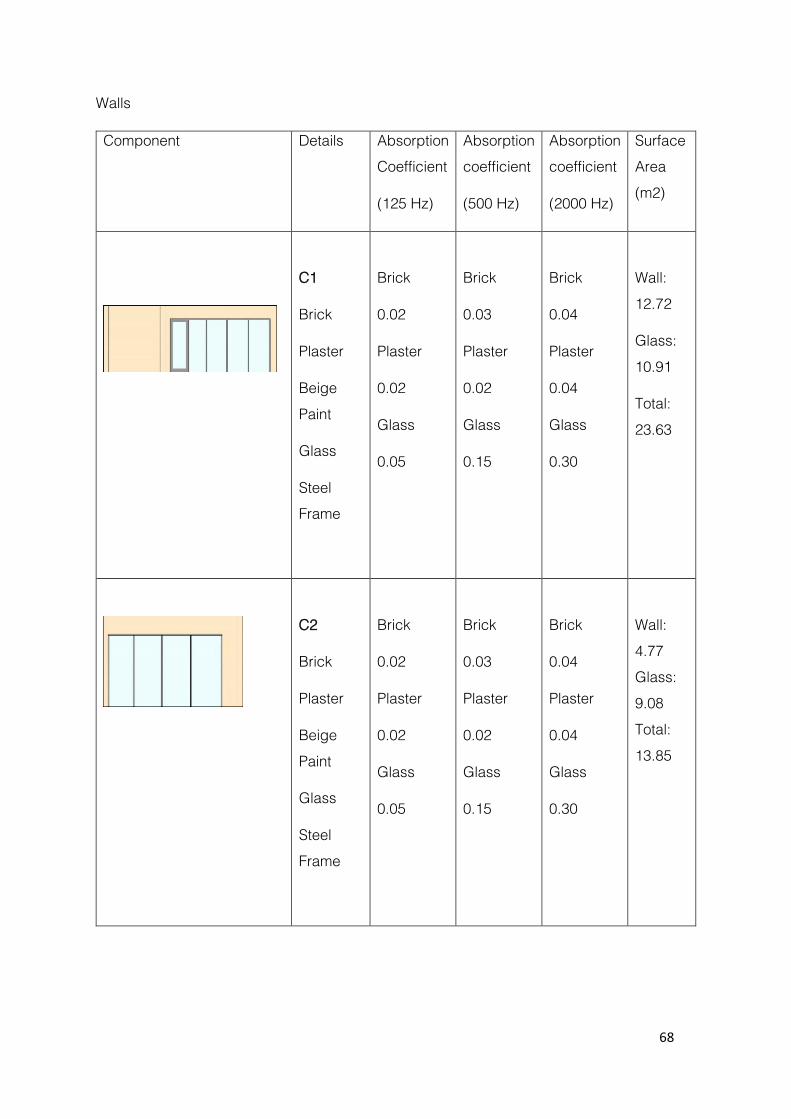
Zone 5: Outdoor
Figure 3.12 Outdoor Area
Floor
Component Details Absorption
Coefficient
(125 Hz)
Absorption
coefficient
(500 Hz)
Absorption
coefficient
(2000 Hz)
Surface
Area (m2)
Concrete
Concrete
0.02
Concrete
0.05
Concrete
0.05
44.41
68
Walls
Component Details Absorption
Coefficient
(125 Hz)
Absorption
coefficient
(500 Hz)
Absorption
coefficient
(2000 Hz)
Surface
Area
(m2)
C1
Brick
Plaster
Beige
Paint
Glass
Steel
Frame
Brick
0.02
Plaster
0.02
Glass
0.05
Brick
0.03
Plaster
0.02
Glass
0.15
Brick
0.04
Plaster
0.04
Glass
0.30
Wall:
12.72
Glass:
10.91
Total:
23.63
C2
Brick
Plaster
Beige
Paint
Glass
Steel
Frame
Brick
0.02
Plaster
0.02
Glass
0.05
Brick
0.03
Plaster
0.02
Glass
0.15
Brick
0.04
Plaster
0.04
Glass
0.30
Wall:
4.77
Glass:
9.08
Total:
13.85

69
C3
Brick
Plaster
Beige
Paint
Glass
Steel
Frame
Brick
0.02
Plaster
0.02
Glass
0.05
Brick
0.03
Plaster
0.02
Glass
0.15
Brick
0.04
Plaster
0.04
Glass
0.30
Wall:
2.04
Glass:
4.12
Total:
6.16
Furniture
Component Details Absorption
Coefficient
(125 Hz)
Absorption
coefficient
(500 Hz)
Absorption
coefficient
(2000 Hz)
Rotan timber
material
0.1
0.08
0.08

70
3.4.2 Constant Source of Sound
Figure 3.13 Source of constant sound
Symbol Source of sound
Speakers
Kitchen appliances / Machines

71
3.4.3 Data Collection
Figure 3.14 Floor plans with grid lines
Position Non-Peak Non- Peak Peak 1st reading 2nd reading
A/1 60 61 65 A/2 60 63 65 A/3 58 62 68 A/4 55 61 64 A/5 58 67 65 A/6 55 64 70 A/7 58 63 72 A/8 62 56 75 A/9 59 64 77 B/1 59 60 62
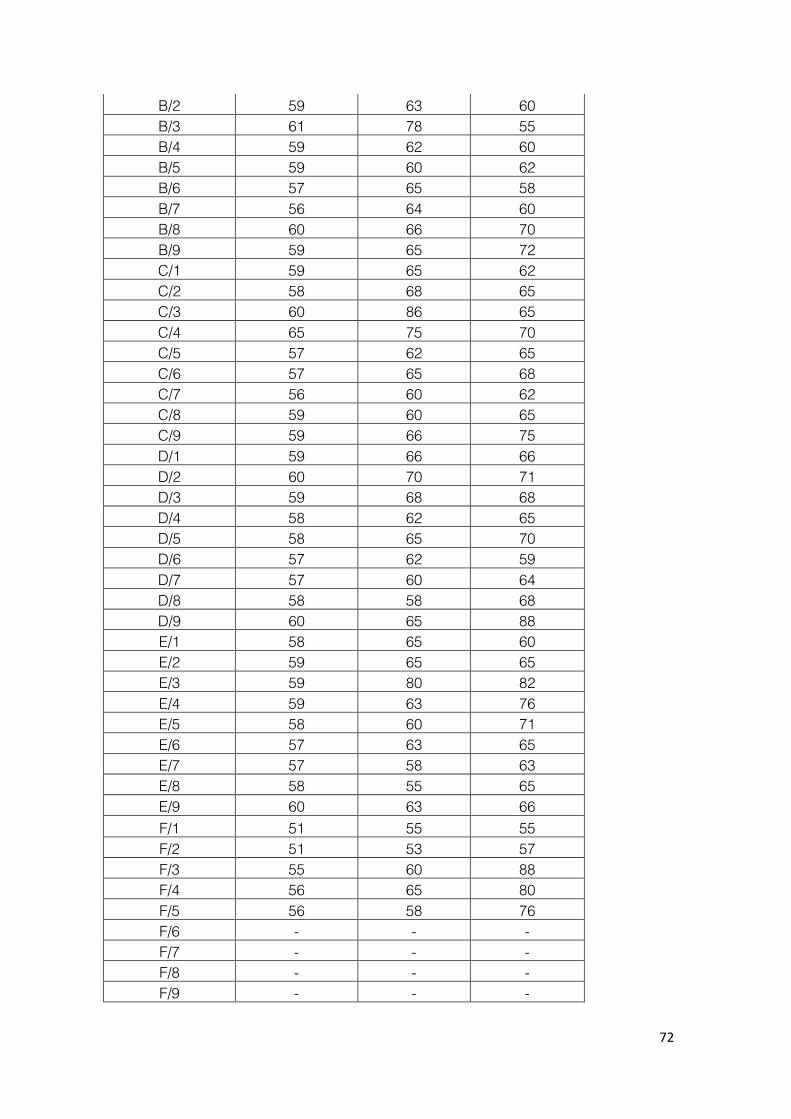
72
B/2 59 63 60 B/3 61 78 55 B/4 59 62 60 B/5 59 60 62 B/6 57 65 58 B/7 56 64 60 B/8 60 66 70 B/9 59 65 72 C/1 59 65 62 C/2 58 68 65 C/3 60 86 65 C/4 65 75 70 C/5 57 62 65 C/6 57 65 68 C/7 56 60 62 C/8 59 60 65 C/9 59 66 75 D/1 59 66 66 D/2 60 70 71 D/3 59 68 68 D/4 58 62 65 D/5 58 65 70 D/6 57 62 59 D/7 57 60 64 D/8 58 58 68 D/9 60 65 88 E/1 58 65 60 E/2 59 65 65 E/3 59 80 82 E/4 59 63 76 E/5 58 60 71 E/6 57 63 65 E/7 57 58 63 E/8 58 55 65 E/9 60 63 66 F/1 51 55 55 F/2 51 53 57 F/3 55 60 88 F/4 56 65 80 F/5 56 58 76 F/6 - - - F/7 - - - F/8 - - - F/9 - - -

73
3.4.4 Calculation and Analysis
3.4.4.1 Sound level intensities calculation
Figure 3.15 Toilet Area
Non peak hour
Highest sound level = 55db
Using formula,
Swl = 10 log10 𝑙
𝑙0
Where 𝑙o = reference power intensity ( 1 x 10-12 watts )
55 = 10 log10 l / 1 x 10-12
l = 105.5 x 1 x 10-12
= 3.16 x 10⁻⁷
Lowest sound level = 53 db
53 = 10 log10 l / 1 x 10-12
l = 105.3 x 1 x 10-12
=1.99 x 10⁻⁷
Total intensity = ( 1.99 + 3.16 ) x 10-7
= 5.15 x 10⁻⁷ watts
Combine sound level = 10 log10 5.15 x 10⁻⁷ / 1 x 10-12
= 57.12 db
74
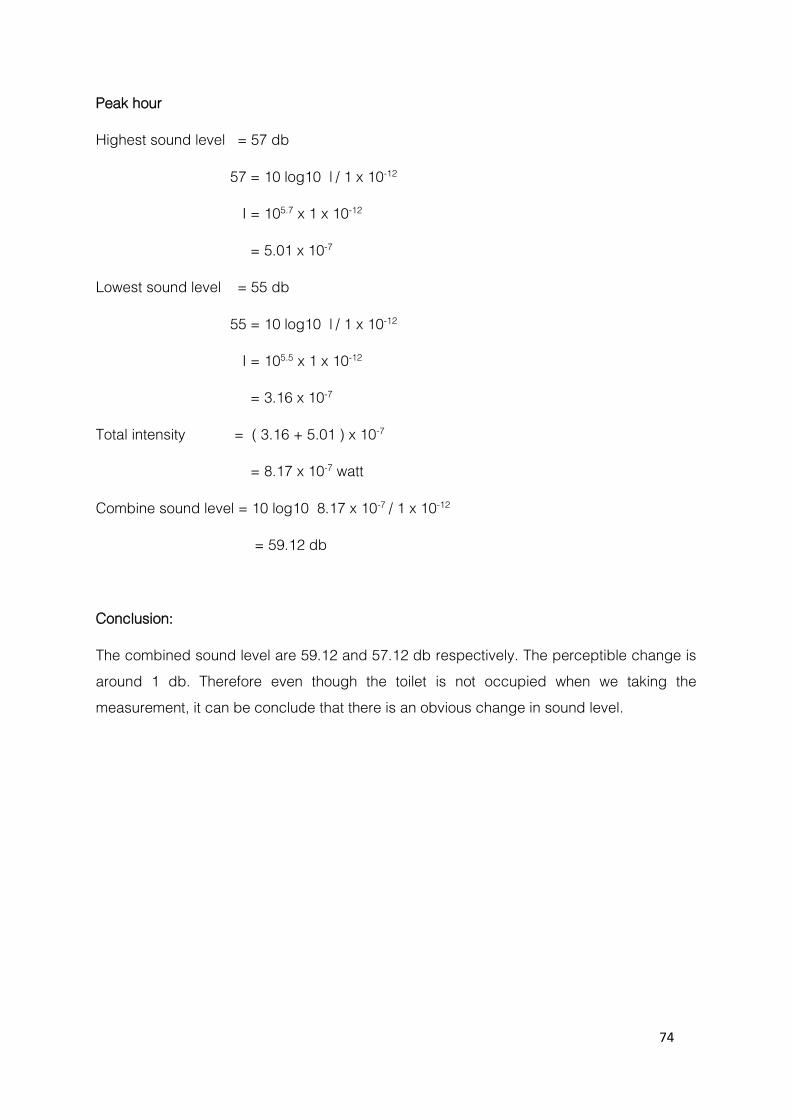
Peak hour
Highest sound level = 57 db
57 = 10 log10 l / 1 x 10-12
I = 105.7 x 1 x 10-12
= 5.01 x 10⁻⁷
Lowest sound level = 55 db
55 = 10 log10 l / 1 x 10-12
I = 105.5 x 1 x 10-12
= 3.16 x 10⁻⁷
Total intensity = ( 3.16 + 5.01 ) x 10-7
= 8.17 x 10⁻⁷ watt
Combine sound level = 10 log10 8.17 x 10⁻⁷ / 1 x 10-12
= 59.12 db
Conclusion:
The combined sound level are 59.12 and 57.12 db respectively. The perceptible change is
around 1 db. Therefore even though the toilet is not occupied when we taking the
measurement, it can be conclude that there is an obvious change in sound level.

75
Figure 3.16 Dining Zone 1
Non Peak hour
Highest sound level = 70 db
70 = 10 log10 l / 1 x 10-12
I = 107.0 x 1 x 10-12
= 1.0 x 10⁻⁵
Lowest sound level = 60 db
60 = 10 log10 l / 1 x 10-12
I = 106.0 x 1 x 10-12
= 1.0 x 10⁻⁶
Total intensity = ( 1 + 0.1 ) x 10-5
= 1.10 x 10⁻⁵ watt
Combine sound level = 10 log10 1.10 x 10⁻⁵ / 1 x 10-12
= 70.41 db
76
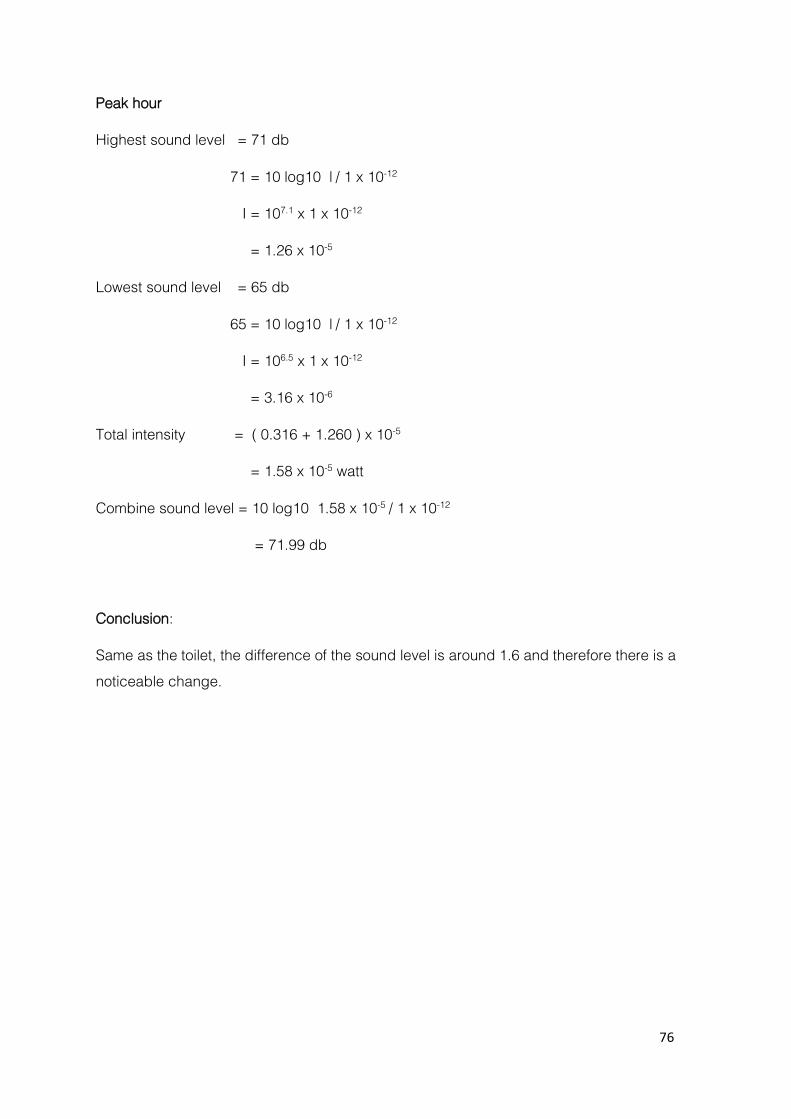
Peak hour
Highest sound level = 71 db
71 = 10 log10 l / 1 x 10-12
I = 107.1 x 1 x 10-12
= 1.26 x 10⁻⁵
Lowest sound level = 65 db
65 = 10 log10 l / 1 x 10-12
I = 106.5 x 1 x 10-12
= 3.16 x 10⁻⁶
Total intensity = ( 0.316 + 1.260 ) x 10-5
= 1.58 x 10⁻⁵ watt
Combine sound level = 10 log10 1.58 x 10⁻⁵ / 1 x 10-12
= 71.99 db
Conclusion:
Same as the toilet, the difference of the sound level is around 1.6 and therefore there is a
noticeable change.

77
Figure 3.17 Dining Zone 2
Non Peak hour
Highest sound level = 86 db
86 = 10 log10 l / 1 x 10-12
I = 108.6 x 1 x 10-12
= 3.98 x 10⁻⁴
Lowest sound level = 55 db
55 = 10 log10 l / 1 x 10-12
I = 105.5 x 1 x 10-12
= 3.16 x 10⁻⁷
Total intensity = ( 3.98 + 0.0316 ) x 10-5
= 4.01 x 10⁻⁵ watt
Combine sound level = 10 log10 4.01 x 10⁻⁵ / 1 x 10-12
= 76.0 db

78
Peak hour
Highest sound level = 88 db
88 = 10 log10 l / 1 x 10-12
I = 108.8 x 1 x 10-12
= 6.31 x 10⁻⁴
Lowest sound level = 55 db
55 = 10 log10 l / 1 x 10-12
I = 105.5 x 1 x 10-12
= 3.16 x 10⁻⁷
Total intensity = ( 6.31 + 0.00316 ) x 10-4
= 6.31316 x 10⁻⁵ watt
Combine sound level = 10 log10 6.31316 x 10⁻⁵ / 1 x 10-12
= 88.00 db
Conclusion:
The sound level for peak hour is much greater than the non-peak. The number of occupant
is the main reason resulting the increase of sound level.

79
Figure 3.18 Kitchen/Work Area
Non Peak hour
Highest sound level = 80 db
80 = 10 log10 l / 1 x 10-12
I = 108.0 x 1 x 10-12
= 1.0 x 10⁻⁴
Lowest sound level = 58 db
58 = 10 log10 l / 1 x 10-12
I = 105.8 x 1 x 10-12
= 6.31 x 10⁻⁷
Total intensity = ( 0.00631 + 1 ) x 10-4
= 1.00631 x 10⁻⁴ watt
Combine sound level = 10 log10 1.00631 x 10⁻⁴ / 1 x 10-12
= 80.00 bd

80
Peak hour
Highest sound level = 88 db
88 = 10 log10 l / 1 x 10-12
I = 108.8 x 1 x 10-12
= 6.31 x 10⁻⁴
Lowest sound level = 71 db
71 = 10 log10 l / 1 x 10-12
I = 107.1 x 1 x 10-12
= 1.26 x 10⁻⁵
Total intensity = ( 6.31 + 0.126 ) x 10-4
= 6.436 x 10⁻⁴ watt
Combine sound level = 10 log10 6.436 x 10⁻⁴ / 1 x 10-12
= 88.09 db
Conclusion:
The kitchen is the nosiest zone overall. The sound made by the blender machine results the
high sound level and when it is not used, the sound level of this zone remains around the
same as the other. ( 58 db )

81
Figure 3.19 Outdoor Area
Non Peak hour
Highest sound level = 62 db
62 = 10 log10 l / 1 x 10-12
I = 106.2 x 1 x 10-12
= 1.58 x 10⁻⁶
Lowest sound level = 55 db
55 = 10 log10 l / 1 x 10-12
I = 105.5 x 1 x 10-12
= 3.16 x 10⁻⁷
Total intensity = ( 0.316 + 1.58 ) x 10-6
= 1.896 x 10⁻⁶ watt
Combine sound level = 10 log10 1.896 x 10⁻⁶ / 1 x 10-12
= 62.78 db

82
Peak hour
Highest sound level = 77 db
77 = 10 log10 l / 1 x 10-12
I = 107.7 x 1 x 10-12
= 5.01 x 10⁻⁵
Lowest sound level = 64 db
64 = 10 log10 l / 1 x 10-12
I = 106.4 x 1 x 10-12
= 2.51 x 10⁻⁶
Total intensity = ( 5.01 + 0.251 ) x 10-5
= 5.261 x 10⁻⁵ watt
Combine sound level = 10 log10 5.261 x 10⁻⁵ / 1 x 10-12
= 77.21 db
Conclusion:
The great difference could be the sound generated by vehicle and the music retail right
opposite of the coffee shop. Since the peak hour is 8.00pm, that’s the time whereby people
having their dinning therefore higher sound level is recorded.

83
3.4.4.2 Calculation of reverberation time
Reverberation time
Reverberation time is defined as the length of time required for sound to decay 60 dB from
its initial level. Designer sometimes incorporate RT when they designing to either allow the
space to be more lively by lengthening the RT and vice versa. The length of RT is closely
related to material coefficient and the volume of the enclosed space.
.
Figure 3.20 Enclosed space of the Brogues coffee

84
At 125 Hz
Figure 3.21 Dining Zone 1
Element Material a S ( m2 ) A
Floor Laminated hard wood 0.15 11.83 1.7745
B1 wall painted plaster brick wall 0.02 6.96 0.1392
B2 wall painted plaster brick wall 0.02 15.3 0.306
B3 wall painted plaster brick wall 0.02 6.96 0.1392
Roof rough concrete 0.02 11.83 0.2366
Occupant 0.21 4 0.84
chair cusion 0.12 8 0.96
table wood 0.08 2 0.16
Total A 4.5555

85
Figure 3.22 Dining Zone 2
Element Material a S ( m2 ) A
Floor smooth unpainted concrete 0.01 49.47 0.4947
c1 wall painted plaster brick wall 0.02 12.72 0.2544
c1 wall glass 0.05 10.91 0.5455
c2 wall painted plaster brick wall 0.02 4.77 0.0954
c2 wall glass 0.05 9.08 0.454
c3 wall painted plaster brick wall 0.02 2.04 0.0408
c3 wall glass 0.05 4.12 0.206
c4 wall painted plaster brick wall 0.02 17.44 0.3488
c5 wall plywood 0.15 4.5 0.675
c6 wall painted plaster brick wall 0.02 13.95 0.279
c7 wall painted plaster brick wall 0.02 2.76 0.0552
c7 wall Wood hollow core door 0.3 1.94 0.582
ceiling concrete 0.02 39.04 0.7808

86
ceiling wood 0.15 10.43 1.5645
Occupant 0.21 14 2.94
chair cushion 0.12 24 2.88
table wood 0.08 6 0.48
chair metal 0.07 3 0.21
Total A 12.8861
Figure 3.23 Kitchen/Work Area
Element material a S ( m2 ) A
Floor concrete 0.02 12.19 0.2438
D1 wall plywood 0.15 4.5 0.675
D2 wall painted plaster brick wall 0.02 13.95 0.279
D3 wall painted plaster brick wall 0.02 2.76 0.0552
D3 wall wood 0.15 1.94 0.291
ceiling concrete 0.02 12.19 0.2438
Total A 1.7878

87
Using formula,
RT = 0.16 x V
A
Whereby V is the volume of the enclosed space
and A = a x S
a is the absorption coefficient and S is the surface area
Total A of 3 zones = 1.7878 + 4.5555 + 12.8816
= 19.2294
Volume = 3 x ( 12.19 + 11.83 + 49.47 )
= 220.47
RT = 0.16 x 220.47
19.2294
= 1.83 s
The reverberation time for 125 Hz is 1.83s.

88
At 500 Hz
Figure 3.24 Dining Zone 1
Element Material a S ( m2 ) A
Floor Laminated hard wood 0.1 11.83 1.183
B1 wall painted plaster brick wall 0.02 6.96 0.1392
B2 wall painted plaster brick wall 0.02 15.3 0.306
B3 wall painted plaster brick wall 0.02 6.96 0.1392
Roof rough concrete 0.05 11.83 0.5915
Occupant 0.46 4 1.84
chair cushion 0.28 8 2.24
table wood 0.15 2 0.3
Total A 6.7389

89
Figure 3.25 Dining Zone 2
Element Material a S
( m2 )
A
Floor smooth unpaint concrete 0.02 49.47 0.9894
c1 wall painted plaster brick wall 0.02 12.72 0.2544
c1 wall glass 0.15 10.91 1.6365
c2 wall painted plaster brick wall 0.02 4.77 0.0954
c2 wall glass 0.15 9.08 1.362
c3 wall painted plaster brick wall 0.02 2.04 0.0408
c3 wall glass 0.15 4.12 0.618
c4 wall painted plaster brick wall 0.02 17.44 0.3488
c5 wall plywood 0.12 4.5 0.54
c6 wall painted plaster brick wall 0.02 13.95 0.279
c7 wall painted plaster brick wall 0.02 2.76 0.0552
c7 wall Wood hollow core door 0.15 1.94 0.291

90
ceiling concrete 0.05 39.04 1.952
ceiling wood 0.12 10.43 1.2516
Occupant 0.46 14 6.44
chair cushion 0.28 24 6.72
table wood 0.15 6 0.9
chair metal 0.14 3 0.42
Total A 23.774
Figure 3.26 Kitchen/Work Area
Element material a S ( m2 ) A
Floor concrete 0.05 12.19 0.6095
D1 wall plywood 0.12 4.5 0.54
D2 wall painted plaster brick wall 0.02 13.95 0.279
D3 wall painted plaster brick wall 0.02 2.76 0.0552
D3 wall wood 0.1 1.94 0.194
ceiling concrete 0.05 12.19 0.6095
Total A 2.2872
91
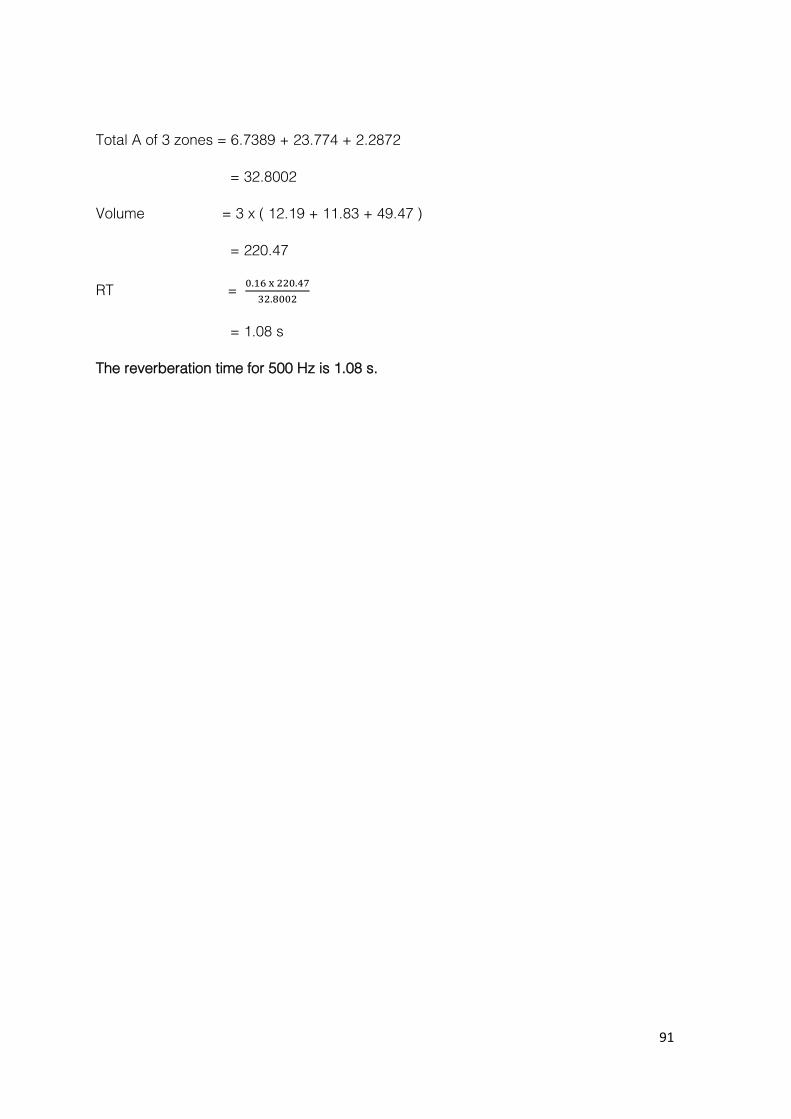
Total A of 3 zones = 6.7389 + 23.774 + 2.2872
= 32.8002
Volume = 3 x ( 12.19 + 11.83 + 49.47 )
= 220.47
RT = 0.16 x 220.47
32.8002
= 1.08 s
The reverberation time for 500 Hz is 1.08 s.

92
At 2000 Hz
Figure 3.27 Dining Zone 1
Element Material a S
( m2 )
A
Floor Laminated hard wood 0.1 11.83 1.183
B1 wall painted plaster brick wall 0.02 6.96 0.1392
B2 wall painted plaster brick wall 0.02 15.3 0.306
B3 wall painted plaster brick wall 0.02 6.96 0.1392
Roof rough concrete 0.05 11.83 0.5915
Occupant 0.51 4 2.04
chair cushion 0.28 8 2.24
table wood 0.18 2 0.36
Total A 6.9989

93
Figure 3.28 Dining Zone 2
Element Material a S
( m2 )
A
Floor smooth unpainted
concrete
0.02 49.47 0.9894
c1 wall painted plaster brick wall 0.02 12.72 0.2544
c1 wall glass 0.3 10.91 3.273
c2 wall painted plaster brick wall 0.02 4.77 0.0954
c2 wall glass 0.3 9.08 2.724
c3 wall painted plaster brick wall 0.02 2.04 0.0408
c3 wall glass 0.3 4.12 1.236
c4 wall painted plaster brick wall 0.02 17.44 0.3488
c5 wall plywood 0.08 4.5 0.36
c6 wall painted plaster brick wall 0.02 13.95 0.279
c7 wall painted plaster brick wall 0.02 2.76 0.0552
c7 wall Wood hollow core door 0.1 1.94 0.194

94
ceiling concrete 0.05 39.04 1.952
ceiling wood 0.08 10.43 0.8344
Occupant 0.51 14 7.14
chair cushion 0.28 24 6.72
table wood 0.18 6 1.08
chair metal 0.14 3 0.42
Total A 19.776
Figure 3.29 Kitchen/Work Area
Element material a S
( m2 )
A
Floor concrete 0.05 12.19 0.6095
D1 wall plywood 0.08 4.5 0.36
D2 wall painted plaster brick wall 0.02 13.95 0.279
D3 wall painted plaster brick wall 0.02 2.76 0.0552
D3 wall wood 0.1 1.94 0.194
ceiling concrete 0.05 12.19 0.6095
Total A 2.1072

95
Total A of 3 zones = 6.9989 + 19.776 + 2.1072 = 28.8825
Volume = 3 x ( 12.19 + 11.83 + 49.47 )
= 220.47
RT = 0.16 x 220.47
28.8825
= 1.22 s
The reverberation time for 2000 Hz is 1.22 s.
Conclusion:
The reverberation time is between 1 to 2 second when frequency of sound 125, 500 and
2000 Hz.

96
2.4.4.3 Calculation of Sound Reduction Index / Transmission loss
Calculating sound reduction index is good for designer to know whether the space is well
sound proof or not. Sound reduction index tells us that how effective the materials at reducing
the sound.
Figure 3.30 Materials transmission loss under different frequency.
According to Saint-Gobain, a global force in engineered materials, transmission loss provides
more information than STC because it covers bigger range of frequency. There are few
common ways to reduce the unwanted sound, one is by adding drywall on wall and ceiling
or just build a cavity wall.
Figure 3.31 Dining Zone 2

97
Using formula
SRI = 10 log10 ( 1 / T )
Where by T = Transmission coefficient of material
For plastered brick painted wall,
44 = 10 log10 ( 1 / T )
T = 1 / 104.4
T = 3.98 x 10⁻⁵
For glass,
26 = 10 log10 ( 1 / T )
T = 1 / 102.6
T = 2.52 x 10⁻³
For steel frame,
42 = 10 log10 ( 1 / T )
T = 1 / 104.2
T = 5.69 x 10⁻⁵
Element S ( m2 ) SRI T T x S
painted plaster brick
wall 19.53 44 3.98 x 10 -5 7.78 x 10⁻⁴
glass 24.11 26 2.51 x 10 -3 6.06 x 10⁻²
steel frame 0.9024 42 6.30 x 10 -5 5.70 x 10⁻⁵
98
Using formula,
TL = 10 log10 1
Tav
Tav = ( 6.06 + 0.0778 + 0.0057 ) x 10 -2
Tav = 6.14 x 10 -2
TL = 10 log10 ( 1 / 6.14 x 10 -2 )
TL = 28.61 db
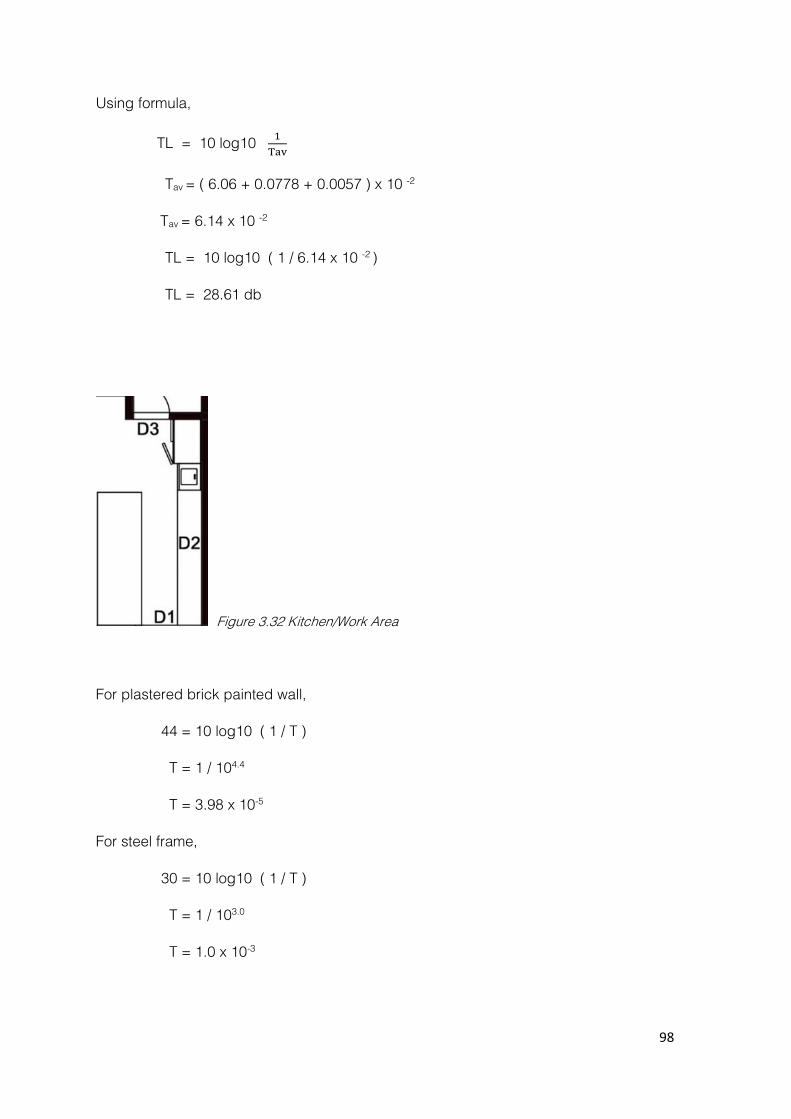
Figure 3.32 Kitchen/Work Area
For plastered brick painted wall,
44 = 10 log10 ( 1 / T )
T = 1 / 104.4
T = 3.98 x 10⁻⁵
For steel frame,
30 = 10 log10 ( 1 / T )
T = 1 / 103.0
T = 1.0 x 10⁻³
99
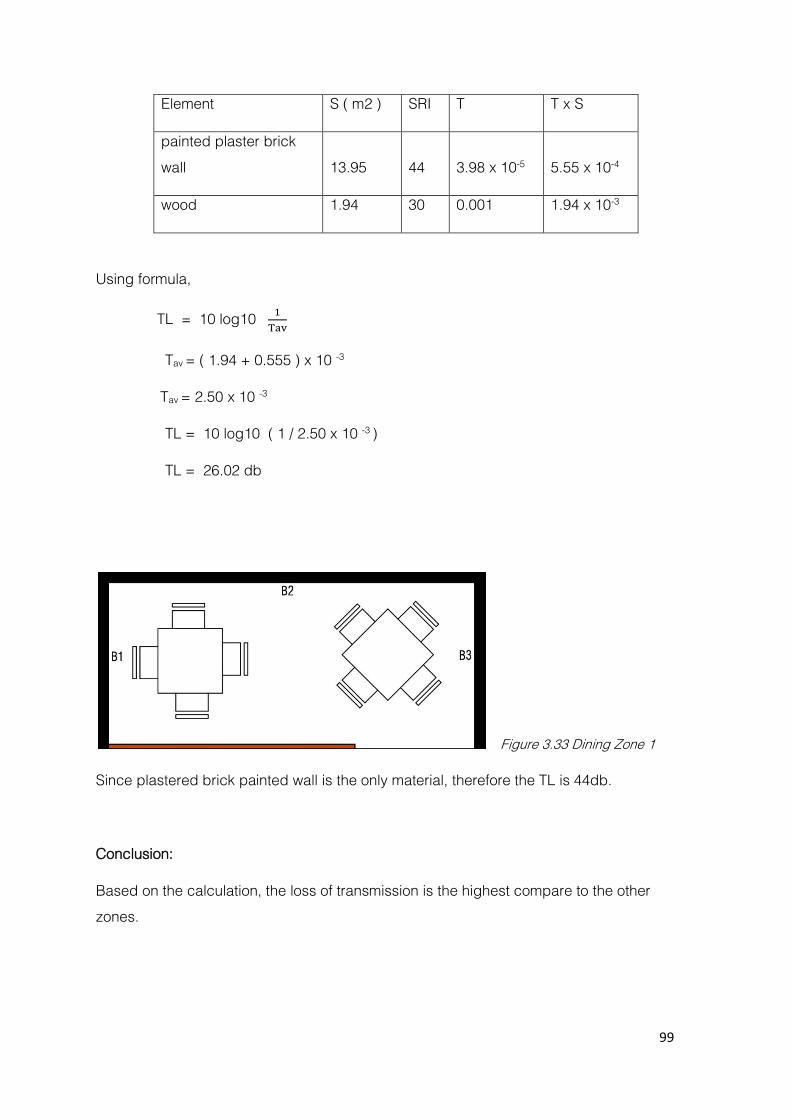
Element S ( m2 ) SRI T T x S
painted plaster brick
wall 13.95 44 3.98 x 10⁻⁵ 5.55 x 10⁻⁴
wood 1.94 30 0.001 1.94 x 10⁻³
Using formula,
TL = 10 log10 1
Tav
Tav = ( 1.94 + 0.555 ) x 10 -3
Tav = 2.50 x 10 -3
TL = 10 log10 ( 1 / 2.50 x 10 -3 )
TL = 26.02 db
Figure 3.33 Dining Zone 1
Since plastered brick painted wall is the only material, therefore the TL is 44db.
Conclusion:
Based on the calculation, the loss of transmission is the highest compare to the other
zones.
100
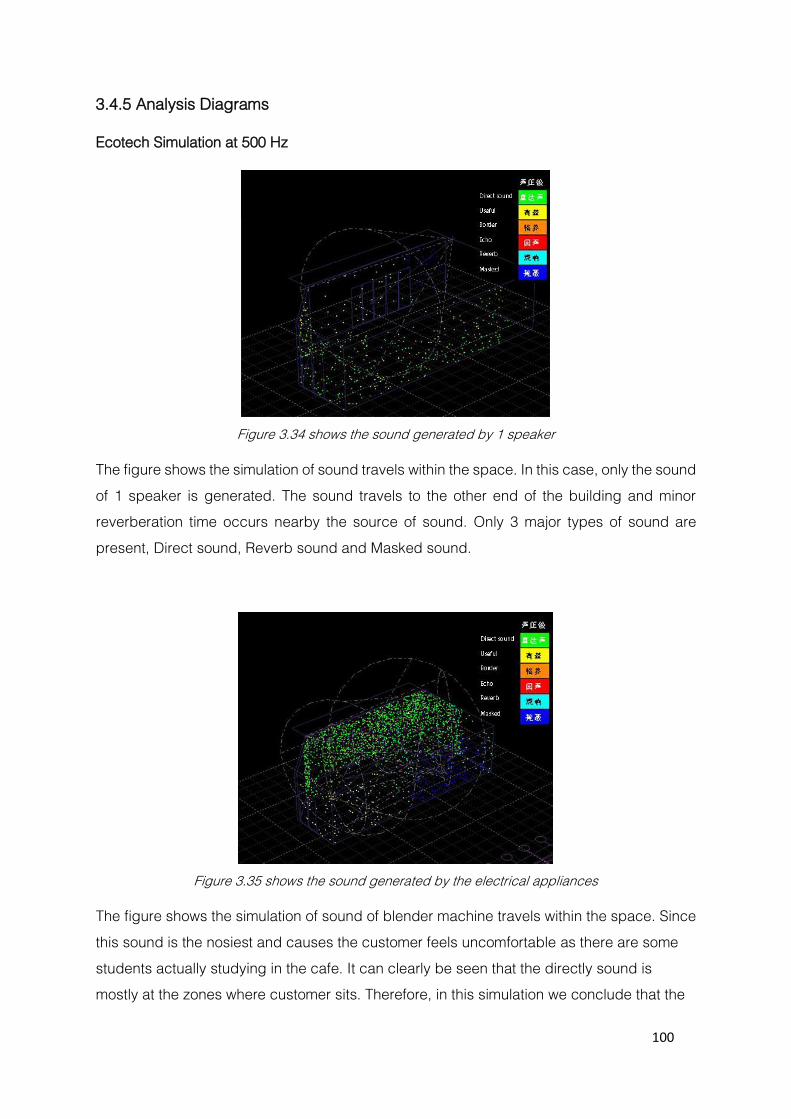
3.4.5 Analysis Diagrams
Ecotech Simulation at 500 Hz
Figure 3.34 shows the sound generated by 1 speaker
The figure shows the simulation of sound travels within the space. In this case, only the sound
of 1 speaker is generated. The sound travels to the other end of the building and minor
reverberation time occurs nearby the source of sound. Only 3 major types of sound are
present, Direct sound, Reverb sound and Masked sound.
Figure 3.35 shows the sound generated by the electrical appliances
The figure shows the simulation of sound of blender machine travels within the space. Since
this sound is the nosiest and causes the customer feels uncomfortable as there are some
students actually studying in the cafe. It can clearly be seen that the directly sound is
mostly at the zones where customer sits. Therefore, in this simulation we conclude that the
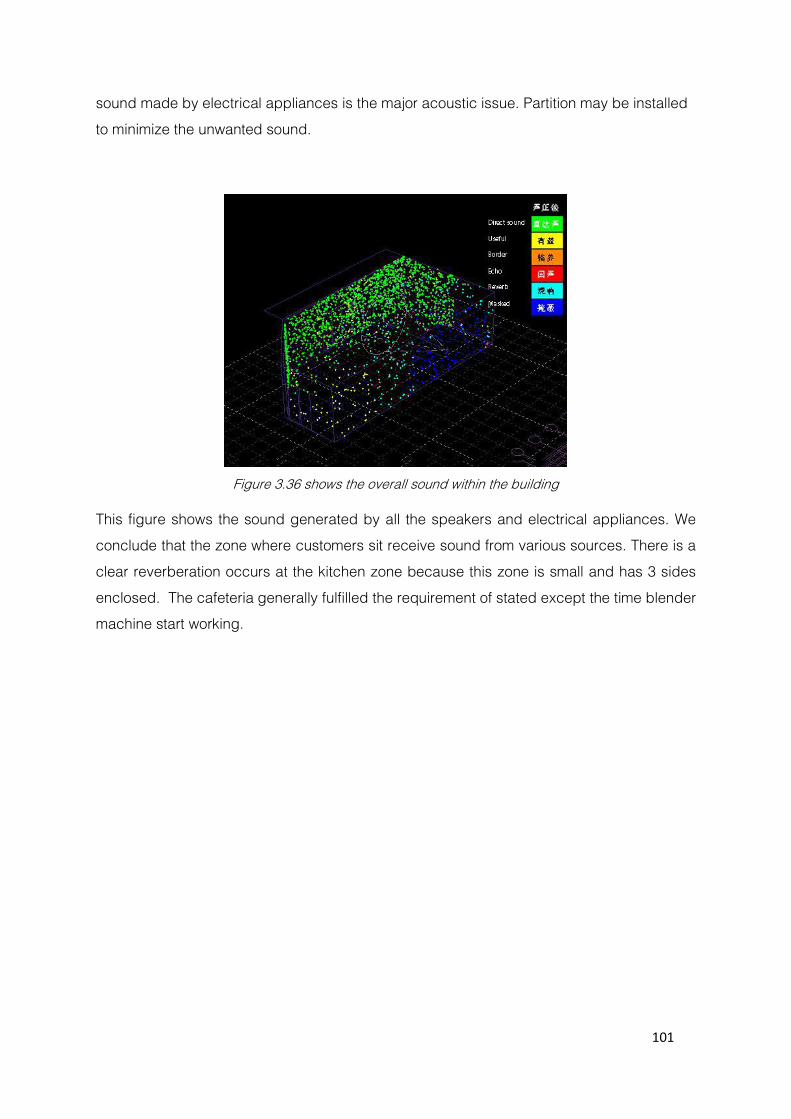
101
sound made by electrical appliances is the major acoustic issue. Partition may be installed
to minimize the unwanted sound.
Figure 3.36 shows the overall sound within the building
This figure shows the sound generated by all the speakers and electrical appliances. We
conclude that the zone where customers sit receive sound from various sources. There is a
clear reverberation occurs at the kitchen zone because this zone is small and has 3 sides
enclosed. The cafeteria generally fulfilled the requirement of stated except the time blender
machine start working.
102
3.4.6 Acoustic evaluation and conclusion The transmission loss of sound of Brogues coffee is generally fine as it reduces almost 30dB
from the external sound source. Whereas for the reverberation time, the time range is
between 1 to 2 seconds. There is not much sound reflected within the building, therefore
users can carry out their conversation without worries of disturbing the other users within the
space.
However, since the scale of the cafe is not big, therefore people find that the noise generated
by the kitchen gadget is loud and noisy especially from the blender machine and coffee
beans grinder. Sometimes, loud honks and exhaust sound from the vehicles directly outside
the cafe can also disturb the users inside the space.

103
4.0 Conclusion
Overall, based on the calculation and analysis, we can conclude that this café performs
decently in its acoustic performance, but its lighting performance is still insufficient.
Brogues Coffee is lack of both artificial and natural light. During the day, the large openings
cases glare to the users inside at certain times. At other times, even though there are many
openings around, the natural sunlight is partially shaded or blocked. Those under the light
may experience a decent amount of slight shining at they are, but the dark corners of the
café may cause the users at those areas some hard time to carry out some activity such as
reading. Though the beige colour paint at the wall is able to reflect light properly, it wasn’t
utilised. Hence, leaving the area with patches of bright and dark during the night. With that,
the lightings in this café is insufficient to achieve visual comfort, nor to suit the function of the
space.
The acoustic performance, however, is pretty decent. It reduces sufficient external noises,
and the reverberation time is only between 1 to 2 seconds. Reflection of sound in the space
is also properly controlled. However, due to the size of the space, the noises from kitchen
appliances may cause some disturbance to the users.

104
Reference
Absorption Coefficient Chart - Soundproof Your Home. (n.d.). Retrieved November 06, 2016, from http://soundproofyourhome.com/absorption-coefficient-chart/
ABSORPTION COEFFICIENTS - acoustic. (n.d.). Retrieved November 6, 2016, from http://www.acoustic.ua/st/web_absorption_data_eng.pdf
Acoustics in Buildings. (n.d.). Retrieved November 2, 2016, from http://acoustic-products.co.uk/faq/acoustics-in-buildings/
L. (2016). LRV Light Reflectance Value of Paint Colors - TheLandofColor.com. Retrieved November 06, 2016, from http://thelandofcolor.com/lrv-light-reflectance-value-of-paint-colors/
Light in Architecture. (2015, January). Light in Architecture. Retrieved November 03, 2016, from https://light2015blog.org/2015/01/27/light-in-architecture/
Reverberation Time - Georgia State University. (n.d.). Retrieved November 4, 2016, from http://hyperphysics.phy-astr.gsu.edu/hbase/acoustic/revtim.html Understanding transmission loss | Green Glue. (n.d.). Retrieved November 04, 2016, from http://www.greengluecompany.com/benefit/how-green-glue-works/understanding-transmission-loss
Varrichione, A., & Jarvis, E. (2015, May). LIGHTING STUDY OF THE GEORGE C. GORDON LIBRARY.