building science ii report
TRANSCRIPT

PROJECT 1 LIGHTING & ACOUSTIC PERFORMANCE EVALUATION AND DESIGN OF YELLOW APRON CAFÉ
1 | P a g e
1.0 Introduction
1.1 Aim and Objective
The aim and objective of conducting this study is to understand and explore on day
lighting, artificial lighting requirement and performances as well as acoustic
performances and requirement of a specific space. In order to analyse the quality of
the lighting and acoustic of the chosen space, the characteristics and function of day
lighting, artificial lighting and acoustic of the intended space has to be determined.
Thorough understanding of the site and its surrounding aid in producing a critical and
analytical report.
1.2 Site Study
1.2.1 Introduction of Site
Figure 1.1 Exterior View of Yellow Apron
Yellow Apron is a café/ multipurpose event space located in section 13, Petaling Jaya.
It is located in the busy office district, within the Heritage Centre commercial building
that holds ¼ of the block. Located next to an ongoing construction site, Yellow Apron
is a 2-storey double volume café with simple contemporary façade and interior design.

PROJECT 1 LIGHTING & ACOUSTIC PERFORMANCE EVALUATION AND DESIGN OF YELLOW APRON CAFÉ
2 | P a g e
1.3 Selection Criteria
Figure 1.2 Interior View of Yellow Apron

PROJECT 1 LIGHTING & ACOUSTIC PERFORMANCE EVALUATION AND DESIGN OF YELLOW APRON CAFÉ
3 | P a g e
The location of the café being in a busy office district makes it critical to study its
acoustical performances for this project. The busy main road that is opposite of the
café and the fairly high amount of patrons that visit and stay in the café adds to the
noise that challenges the acoustical performance of the café.
Other than that, the contemporary design of the café façade is made up mainly of full
glass windows that allow good penetration of daylight; therefore, the interior spaces
are well lit up and do not require artificial lighting during the day.
The café comprises a few functional spaces to be analysed in terms of lighting and
acoustical functionality. The spaces to be analysed in the following subtopics are the
dining area on the first floor, the open dining area on the second floor and the enclosed
meeting room.

PROJECT 1 LIGHTING & ACOUSTIC PERFORMANCE EVALUATION AND DESIGN OF YELLOW APRON CAFÉ
4 | P a g e
1.4 Measured Drawings
1.4.1 Ground Floor Plan
Figure 1.3 Ground Floor Plan
Scale: 1: 200

PROJECT 1 LIGHTING & ACOUSTIC PERFORMANCE EVALUATION AND DESIGN OF YELLOW APRON CAFÉ
5 | P a g e
1.4.2 First Floor Plan
Figure 1.4 First floor plan
Scale: 1:200

PROJECT 1 LIGHTING & ACOUSTIC PERFORMANCE EVALUATION AND DESIGN OF YELLOW APRON CAFÉ
6 | P a g e
2.1 Literature Review
2.1.1 Architecture Acoustics
This is a study on how to design buildings and other spaces that have pleasing sound
quality with safe sound levels. Some design example includes galleries, restaurants.
And event halls. It is important to obtain appropriate sound quality for the spaces in
the building. The acoustic mood created in the spaces can be affected by the buffer
from the building exterior and building interior design, as to achieving good quality.
2.1.2 Sound Pressure Level
Sound pressure level (SPL) can be used for acoustic system design. It is the average
sound level at a space caused by a sound wave, which can easily be measured by a
microphone. It is also a logarithmic measure of the effective sound pressure of a sound
relative to a reference value that is calculated in decibels (dB).
Sound pressure formula given below:
SPL=10 log ( 𝑃
𝑃𝑜 )
Where, log is the common logarithm
P = Sound pressure
Po = Standard reference pressure of 20 micro Pascals

PROJECT 1 LIGHTING & ACOUSTIC PERFORMANCE EVALUATION AND DESIGN OF YELLOW APRON CAFÉ
7 | P a g e
2.1.3 Reverberation Time
Reverberation is when a sound is created or signal is reflected causing large number
of reflection to build up and then decay as it is absorbed by the surfaces by the
surfaces in the space including furniture and people. The length of reverberation time
is highly considerate in the architectural design of spaces which requires specific
timing to achieve optimum performance for the related activity.
Reverberation time is affected by the size of the space and the amount of reflective or
absorptive surfaces within the space. Spaces with absorptive surfaces will absorb the
sound and stop it from reflecting back into the space, which would create a shorter
reverberation time. Whereas reflective surfaces will reflect sound and increase
reverberation time. As for sizes, larger spaces have longer reverberation time as
compared to smaller spaces which have shorter reverberation time.
Reverberation time formulas as follow:
T = 0.161 𝑉
𝐴
Where, T= Reverberation time (s)
V= Room volume (m³)
A= Absorption coefficient
2.1.4 Issues of Acoustic System Design
It is essential to obtain acoustic comfort to a certain level of satisfaction amongst users
within the space. The two main aspects that contributes to acoustic comfort are indoor
and outdoor noise. Spatial acoustic may contribute to the productivity in a particular
space which depends on the function and type of users occupying the space. This can
be seen in spaces that require music setting, where proper sound isolation helps
create a musical space. Improper acoustic design may backfire if not implemented
properly as noise is an increasing public health problem. It can result in following health
effects such as hearing loss, sleep disturbances and performance reduction.

PROJECT 1 LIGHTING & ACOUSTIC PERFORMANCE EVALUATION AND DESIGN OF YELLOW APRON CAFÉ
8 | P a g e
Therefore, proper acoustical design should be of importance to ensure comfort in
spaces occupied by users for prolonged hours.
2.1.5 Acoustic Design for Café
There are two major concerns for acoustic design for interior spaces. The first concern
is incorporating design strategies to isolate sound of cafes from exterior sources
including atmospheric and man-made noises. Adjacent traffic noises and surrounding
noise from neighbouring buildings may interfere with the experience of the café space.
The other major concern is the room acoustics and related comfort parameters.
Reverberation time guides on the intelligibility and noise levels due to suspended
sound within enclosed interior spaces that are furnished. Selection of materials also
play an importance in the spaces as reverberation time helps in determining the best
selection.
PROJECT 1 LIGHTING & ACOUSTIC PERFORMANCE EVALUATION AND DESIGN OF YELLOW APRON CAFÉ
9 | P a g e
2.2 Precedent Study
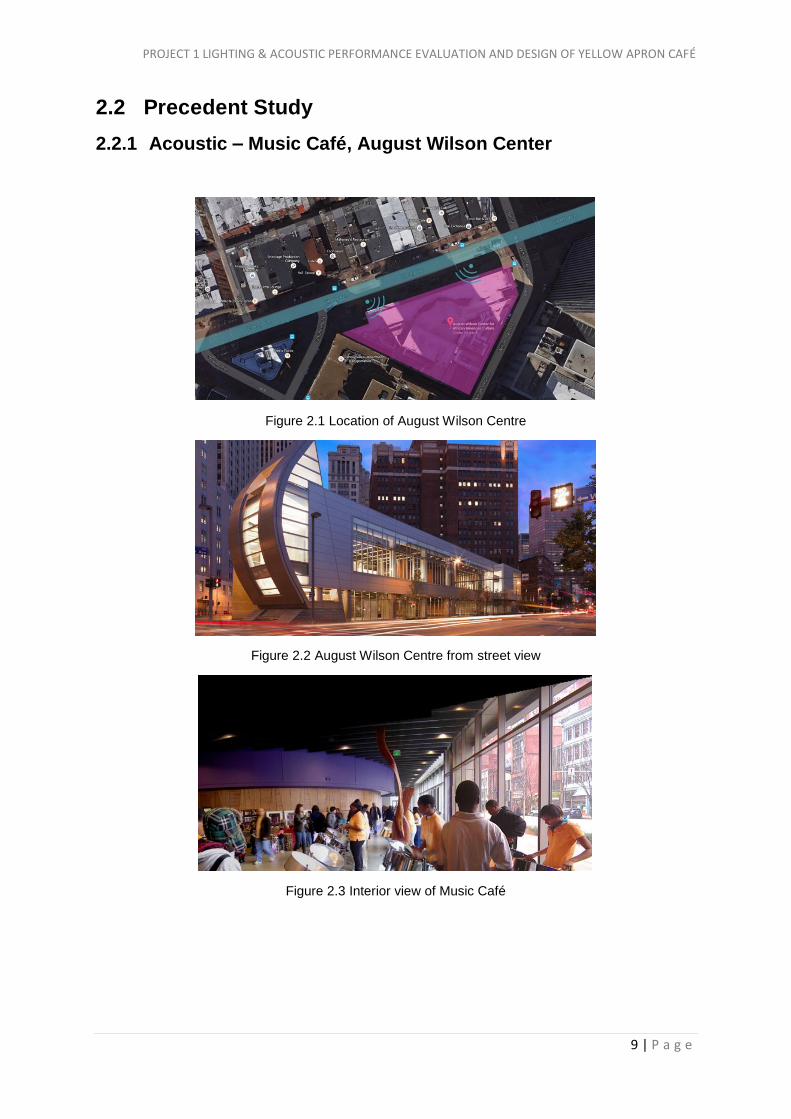
2.2.1 Acoustic – Music Café, August Wilson Center
Figure 2.1 Location of August Wilson Centre
Figure 2.2 August Wilson Centre from street view
Figure 2.3 Interior view of Music Café

PROJECT 1 LIGHTING & ACOUSTIC PERFORMANCE EVALUATION AND DESIGN OF YELLOW APRON CAFÉ
10 | P a g e
2.2.2 Introduction
August Wilson Centre is an arts organization that presents performing and visual arts
programs. As a centre to arts and culture, August Wilson Centre is a home to variety
of acoustic performances. The Music Café is located at sidewalk level and can be
accessed from the street or from the centre within via the lobby. It accommodates an
on-going menu of program and to function as an alternative performance space with
limited seating for jazz and poetry which forms a club setting at night.
2.2.3 Function
This space is essential a large rectangular box with three glass sides, a hard floor, and
sound absorbing treatment on the ceiling (although behind baffles and ductwork). It
is evident design does recognize the need for acoustical design elements, with
hanging metal baffles and acoustical blanket over 80% of the underside of the floor
structure above. Based on the use description provided by the architect, a
reverberation time of approximately 1.0 second would be ideal. This would place the
space somewhere between speech and speech/music use. According to the
Architectural Acoustics: Principles and Design a very high STC value (60+) between
the Music Café and lobby would be desirable. This is important to both spaces, as a
spoken word performance in the café could suffer if a large crowd was gathering in the
lobby for a performance in the main theatre, while the lobby must remain quiet during
a performance in the main theatre if patrons are entering or exiting the auditorium
since a main set of doors is directly across from the café.
PROJECT 1 LIGHTING & ACOUSTIC PERFORMANCE EVALUATION AND DESIGN OF YELLOW APRON CAFÉ
11 | P a g e
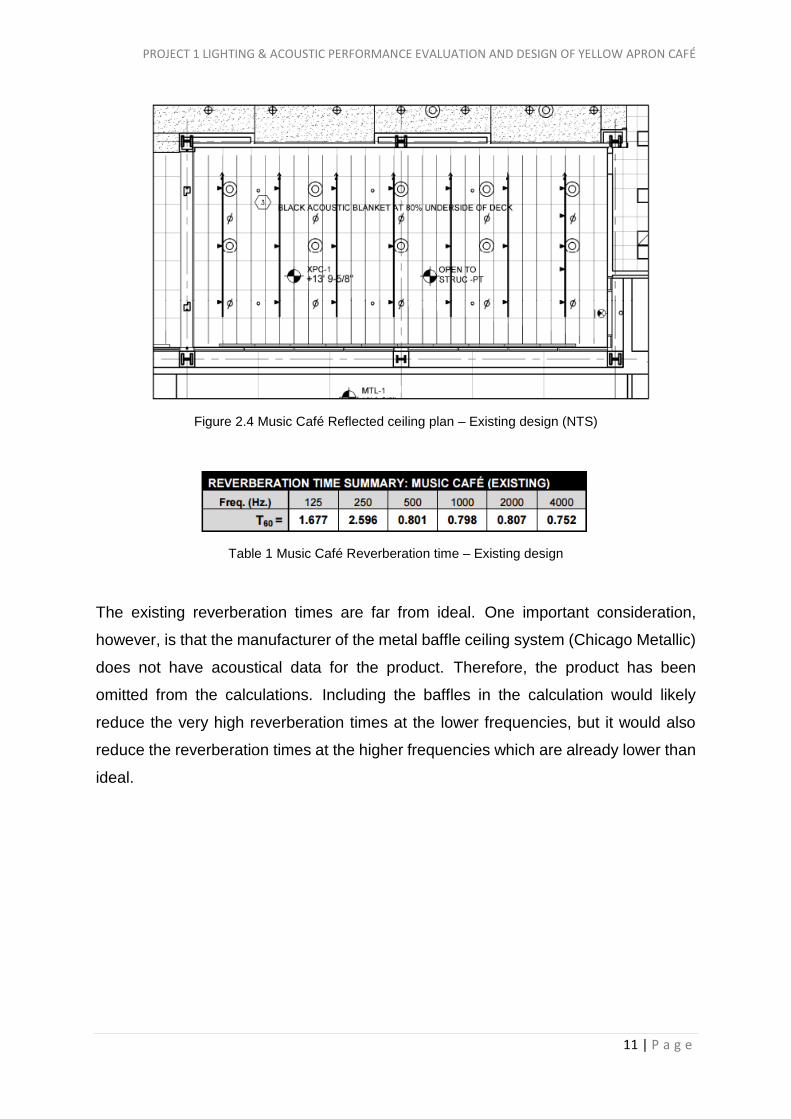
Figure 2.4 Music Café Reflected ceiling plan – Existing design (NTS)
Table 1 Music Café Reverberation time – Existing design
The existing reverberation times are far from ideal. One important consideration,
however, is that the manufacturer of the metal baffle ceiling system (Chicago Metallic)
does not have acoustical data for the product. Therefore, the product has been
omitted from the calculations. Including the baffles in the calculation would likely
reduce the very high reverberation times at the lower frequencies, but it would also
reduce the reverberation times at the higher frequencies which are already lower than
ideal.
PROJECT 1 LIGHTING & ACOUSTIC PERFORMANCE EVALUATION AND DESIGN OF YELLOW APRON CAFÉ
12 | P a g e
2.2.4 Sound Transmission Class
Additional analysis of the sound transmission class (STC) on the wall between the
café and the main lobby reveals a potential for unwanted noise transfer between the
spaces. At 46, the calculated STC falls far below the ideal value of 60+ (See Appendix
J for STC calculations). This problem is generated by the use of glass doors and
partitions between the spaces. Changing the glass type from ½” tempered glass to
½” laminated glass improves the STC to 49, but this is only a marginal increase. To
really improve this potentially negative situation, significant changes to the architecture
are required. These changes may include changing the glass to another material such
as wood or creating a small vestibule at the entrances. These changes, however,
would significantly alter the architecture. It would be appropriate to point out the
problem to the architect, but it is unlikely that the changes would be made. Improving
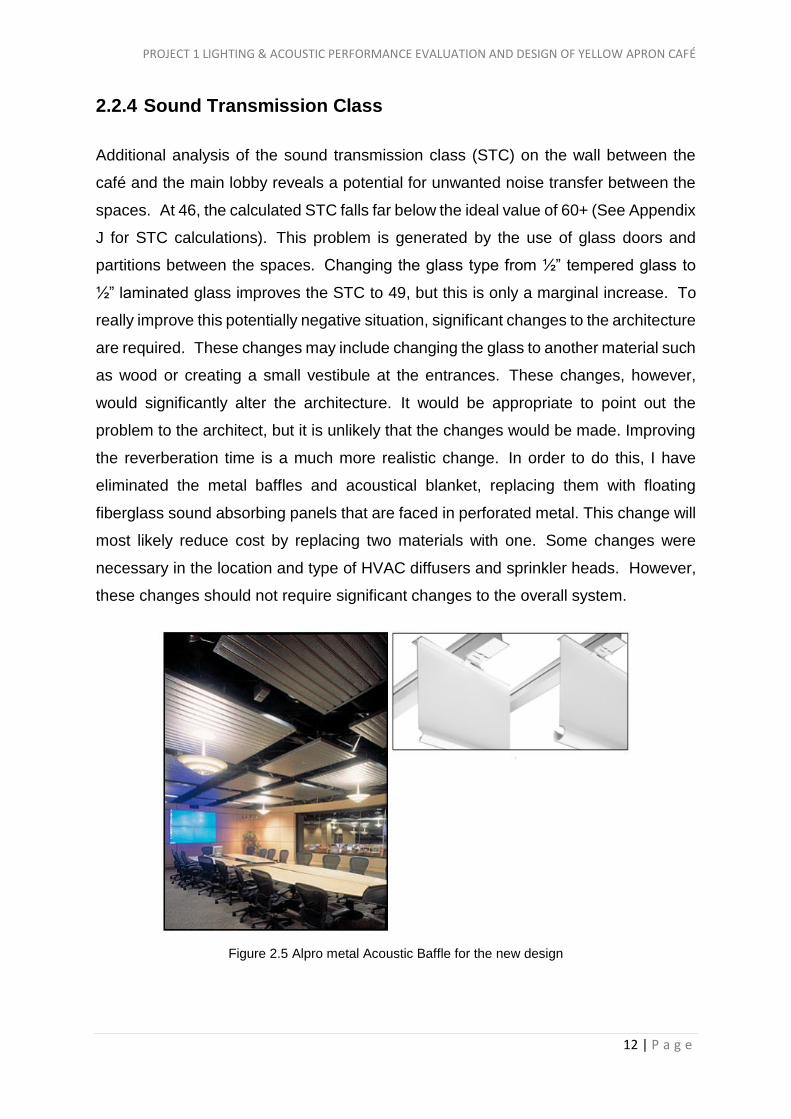
the reverberation time is a much more realistic change. In order to do this, I have
eliminated the metal baffles and acoustical blanket, replacing them with floating
fiberglass sound absorbing panels that are faced in perforated metal. This change will
most likely reduce cost by replacing two materials with one. Some changes were
necessary in the location and type of HVAC diffusers and sprinkler heads. However,
these changes should not require significant changes to the overall system.
Figure 2.5 Alpro metal Acoustic Baffle for the new design

PROJECT 1 LIGHTING & ACOUSTIC PERFORMANCE EVALUATION AND DESIGN OF YELLOW APRON CAFÉ
13 | P a g e
Figure 2.6 Reflected ceiling plan-new design
Table 2 Reverberation time (modified)
Table 3 Baffle Schedule of new Material
The new reverberation times are very close to the desired values. According to
Architectural Acoustics: Principles and Design optimum reverberation times at 125
hertz should be 1.3 times the ideal reverberation time at 500 hertz and a multiplier of
1.15 should be used at 250 hertz. These multipliers are used to correct for the fact
that the human ear is less sensitive at lower frequencies. With these factors included,
the new design is very near the target. The new ceiling system will provide superior
acoustical performance at a reduced cost.

PROJECT 1 LIGHTING & ACOUSTIC PERFORMANCE EVALUATION AND DESIGN OF YELLOW APRON CAFÉ
14 | P a g e
Conclusion
The study shows how the original reverberation time and STC rating of the music café
was not ideal. By proposing new acoustic panels to be installed on the ceiling. The
acoustical properties of the space are improved. The precedent study provide insight
on how to deduce whether the vibration time suitable according to the function of the
space. The function of the Music Café is similar to our proposed Coffee Shop as both
are cafes and they held events sometimes. Likewise, the music Café is also located
facing the main road, which contributed to more noise.

PROJECT 1 LIGHTING & ACOUSTIC PERFORMANCE EVALUATION AND DESIGN OF YELLOW APRON CAFÉ
15 | P a g e
2.3 Methodology of Acoustic Research
2.3.1 Description of Equipment
Sound Level Meter
It is an electronic equipment that is used to get measurement in acoustics of an area.
The device picks up accurate reading as it is sensitive to sound pressure level.
General Specifications
Standard References IEC 804 and IEC 651
Grade of Accuracy Not assigned
Quantities Displayed Lp, Lp Max, Leq
LCD Display Resolution 1 dB
Frequency Weighting Fast
Time Integration Free or user defined
Measurement Range 30-120dB/Range : 30-90 & 60-120
Linearity +- 1.5db
Overload From (+- 1.5dB maximum) 93dB and 123 Db
peak
Dimensions/Weight 160x64x22mm/150g without battery
Battery/Battery Life Alkaline (6LR61)/min 30h (20oC)
Environment Relative Humidity Storage < 95% / measurement <90%
Temperature Storage < 55oC/0oC < measurement < 50oC
CE Marking Comply with : EN 50061-1 and EN 50062-1

PROJECT 1 LIGHTING & ACOUSTIC PERFORMANCE EVALUATION AND DESIGN OF YELLOW APRON CAFÉ
16 | P a g e
Camera
The camera is used to record pictures on the sources of sound in the café and its
surrounding and also to document the furniture and materials applied on site.
Measuring Tape
The tape is used to measure a constant height of the position of the sound meter,
which is at 1.5m. The height is taken on one person as reference to obtain an accurate
reading. The tape was also used to measure the width and length of the site.
2.3.2 Data Collection Method
Measurements were taken on same day with two different times, 12-2pm (peak hour)
and 5-7pm (non-peak hour) on 2 May 2016 intervals with one set of data each.
Perpendicular 2m x 2m grid lines were set on the floor plan creating intersection points
to aid the data collection. The sound level meter is placed at the same height of 1.5m
for each point in order to obtain an accurate and reading. This standard was used to
ensure that the data collected was accurate. The person who was holding the meter
was not allowed to talk to make any noise so that the readings were not affected. Other
than that, the sound level meter should be facing similar directions to achieve

PROJECT 1 LIGHTING & ACOUSTIC PERFORMANCE EVALUATION AND DESIGN OF YELLOW APRON CAFÉ
17 | P a g e
consistent results. Same process was repeated for several times in different time
zones. Both ground floor plan and first floor plan were measured.
Procedure
Identification of area for sound source were noted based on gridlines
produced.
Data was obtained by using sound level meter. The device is placed on
each point according to the guidelines at a height of 1.0m
Measurement is then recorded by indicating sound level in each point
based on gridlines. Variables affecting the site is also noted.
Steps 1 to 3 is repeated for 5-7pm as there might be different light
condition.
2.3.3 Data Constrain
Environmental factor
The sound level meter is very sensitive to minimal sound. For example, rainy
days may yield higher dB readings.
Incomplete definition
Differences in height levels affect the reading of the sound level meter. The
height levels may fluctuate slightly when taking readings. As different operators
have varying heights, this may result in slight inaccuracy.
Failure to account of a factor
Non-peak hours and peak hours are not properly utilized. For example, the bar tender
might be away for the bar during the data is recorded during peak hours.

PROJECT 1 LIGHTING & ACOUSTIC PERFORMANCE EVALUATION AND DESIGN OF YELLOW APRON CAFÉ
18 | P a g e
2.3.4 Acoustic Analysis Calculation Method
2.3.4.1 Sound Pressure Level, (SPL)
Sound pressure level is a logarithmic measure of the effective sound pressure of a
sound relative to a reference value. It is measured in decibels above a standard
reference level. Equation:
2.3.4.2 Reverberation Time, (RT)
Reverberation time is the primary descriptor of an acoustic environment. A space with
a long reverberation time is referred to as a ‘live’ environment. When sound dies out
quickly within a space it is referred to as being an acoustically ‘dead’ environment. An
optimum reverberation time depends on the function of the space. Equation:
V = Volume of space

PROJECT 1 LIGHTING & ACOUSTIC PERFORMANCE EVALUATION AND DESIGN OF YELLOW APRON CAFÉ
19 | P a g e
2.3.4.3 Sound Reduction Index, (SRI)
Sound reduction index is measure of the insulation against the direct transmission of
air-borne sound. The SRI or transmission loss of a partition measures the number of
decibels lost when a sound of a given frequency through the partition.
Where,
Tav = Average transmission coefficient of materials

PROJECT 1 LIGHTING & ACOUSTIC PERFORMANCE EVALUATION AND DESIGN OF YELLOW APRON CAFÉ
20 | P a g e
2.4 Existing Surrounding Condition
2.4.1 Surrounding Context
Figure 2.7 Noise from the construction site
Figure 2.8 Noise from traffic of the road (opposite of Yellow Apron)
Figure 2.9 Noise from traffic of road Jalan 13/6 and the adjacent construction site

PROJECT 1 LIGHTING & ACOUSTIC PERFORMANCE EVALUATION AND DESIGN OF YELLOW APRON CAFÉ
21 | P a g e
2.4.2 Internal Noise Source
2.4.2.1 Noise Source from Electrical Appliance
Type of Sound
Source Brand Unit(s)
Wattage
(w)
Voltage
(v)
Noise level
(dBa)
Acson 4 1550 230 24
Evid 5 16 3 35
Kdk 2 55 120 21
Promac 1 800 220 63
Tefal 1 400 240 70

PROJECT 1 LIGHTING & ACOUSTIC PERFORMANCE EVALUATION AND DESIGN OF YELLOW APRON CAFÉ
22 | P a g e
Fan
Juice Blender
Coffee Maker
Speaker
Air Conditioner
Figure 2.10 Internal noise sources on ground floor

PROJECT 1 LIGHTING & ACOUSTIC PERFORMANCE EVALUATION AND DESIGN OF YELLOW APRON CAFÉ
23 | P a g e
Fan
Speaker
Figure 2.11 Internal noise sources on ground floor

PROJECT 1 LIGHTING & ACOUSTIC PERFORMANCE EVALUATION AND DESIGN OF YELLOW APRON CAFÉ
24 | P a g e
2.4.2.2 Noise Source from Human
Human
Figure 2.12 Human noise sources on ground floor
Figure 2.13 Human noise sources on first floor
PROJECT 1 LIGHTING & ACOUSTIC PERFORMANCE EVALUATION AND DESIGN OF YELLOW APRON CAFÉ
25 | P a g e
2.5 Acoustics Design Analysis
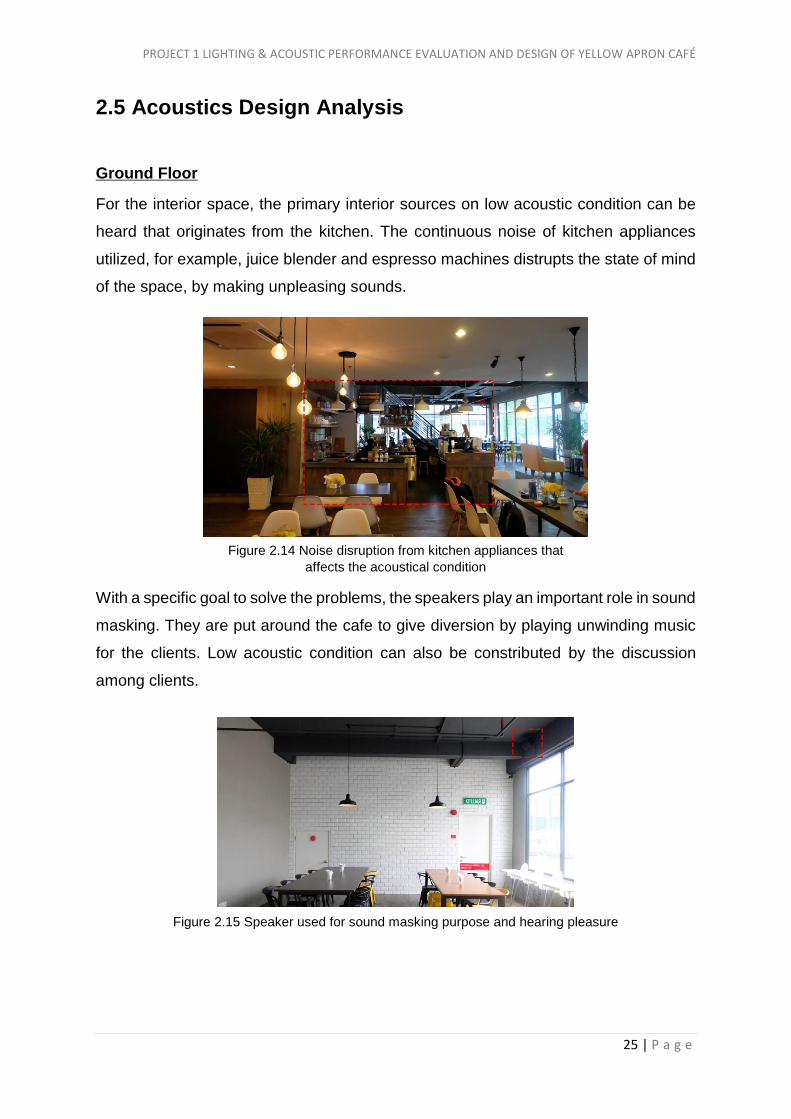
Ground Floor
For the interior space, the primary interior sources on low acoustic condition can be
heard that originates from the kitchen. The continuous noise of kitchen appliances
utilized, for example, juice blender and espresso machines distrupts the state of mind
of the space, by making unpleasing sounds.
With a specific goal to solve the problems, the speakers play an important role in sound
masking. They are put around the cafe to give diversion by playing unwinding music
for the clients. Low acoustic condition can also be constributed by the discussion
among clients.
Figure 2.14 Noise disruption from kitchen appliances that
affects the acoustical condition
Figure 2.15 Speaker used for sound masking purpose and hearing pleasure

PROJECT 1 LIGHTING & ACOUSTIC PERFORMANCE EVALUATION AND DESIGN OF YELLOW APRON CAFÉ
26 | P a g e
First Floor
As the first floor is an open space, the main sound source comes from the vehicles on
the bustling road that is situated opposite the cafe. Other than that, the noise that
originates from the construction site also affects the acoustics of the interior of the
cafe.
With a specific goal to solve the problems, the speakers, have an important role in
sound masking, similar with the ground floor.
Figure 2.16 Noise disruption from the vehicles and the construction site
that affect the interior condition
Figure 2.17 Speaker used for sound masking purpose and hearing pleasure

PROJECT 1 LIGHTING & ACOUSTIC PERFORMANCE EVALUATION AND DESIGN OF YELLOW APRON CAFÉ
27 | P a g e
2.6 Materials
Figure 2.18 Materials on Ground Floor
Figure 2.19 Materials on First Floor

PROJECT 1 LIGHTING & ACOUSTIC PERFORMANCE EVALUATION AND DESIGN OF YELLOW APRON CAFÉ
28 | P a g e
2.7 Acoustic Analysis Calculation
HEIGHT: 1m
UNIT: dB
2.7.1 Dining
2.7.1.1 Sound Pressure Level Calculation
GRID PEAK DAYTIME INTENSITY, I NON-
PEAK NIGHT TIME, I
A1 64 2.512 x 10⁻⁶ 40.5 1.122 x 10⁻⁸
A2 67.4 5.495 x 10⁻⁶ 47.2 5.248 x 10⁻⁸
A3 63.2 2.089 x 10⁻⁶ 51.8 1.51 x 10⁻⁶
A4 64.5 2.818 x 10⁻⁶ 40.4 1.10 x 10⁻⁸
A5 63.9 2.455 x 10⁻⁶ 43.3 2.14 x 10⁻⁸
A6 74.8 3.02 x 10⁻⁵ 48.6 7.24 x 10⁻⁸
A7 68.6 7.244 x 10⁻⁶ 48.6 7.24 x 10⁻⁸
A8 68 6.31 x 10⁻⁶ 47 5.01 x 10⁻⁸
A9 70 1 x 10⁻⁵ 60 1 x 10⁻⁶
A10 68.8 7.586 x 10⁻⁶ 68.2 6.61 x 10⁻⁶
A11 72 1.585 x 10⁻⁵ 45 3.16 x 10⁻⁶
GRID PEAK DAYTIME INTENSITY, I NON-
PEAK NIGHT TIME, I
B1 64.1 2.57 x 10⁻⁶ 40.3 1.07 x 10⁻⁸
B2 71.4 1.38 x 10⁻⁵ 41.3 1.35 x 10⁻⁸
B3 66.3 4.266 x 10⁻⁶ 43.5 2.24 x 10⁻⁶
B4 58.6 7.244 x 10⁻⁷ 34.6 2.88 x 10⁻⁹
B5 65.4 3.467 x 10⁻⁶ 36.6 4.57 x 10⁻⁹
B6 72.9 1.95 x 10⁻⁵ 49.1 8.13 x 10⁻⁸
B7 67.5 5.623 x 10⁻⁶ 49.1 8.13 x 10⁻⁸
B8 70.1 1.02 x 10⁻⁵ 50.2 1.05 x 10⁻⁷
B9 69.8 9.55 x 10⁻⁶ 53.2 2.09 x 10⁻⁷
B10 73 1.995 x 10⁻⁵ 50.2 1.05 x 10⁻⁷
B11 74.4 2.754 x 10⁻⁵ 49.2 8.32 x 10⁻⁸

PROJECT 1 LIGHTING & ACOUSTIC PERFORMANCE EVALUATION AND DESIGN OF YELLOW APRON CAFÉ
29 | P a g e
GRID PEAK DAYTIME INTENSITY, I NON-
PEAK NIGHT TIME, I
C1 62.9 1.95 x 10⁻⁶ 45.2 3.31 x 10⁻⁸
C2 64.2 2.63 x 10⁻⁶ 39.2 8.32 x 10⁻⁹
C3 65 3.16 x 10⁻⁶ 51.4 1.38 x 10⁻⁷
C4 65.8 3.802 x 10⁻⁶ 42.8 1.91 x 10⁻⁸
C5 75.1 3.236 x 10⁻⁵ 41.3 1.41 x 10⁻⁸
C6 73 1.99 x 10⁻⁵ 40.1 1.02 x 10⁻⁸
C7 65.3 3.39 x 10⁻⁶ 52.9 1.95 x 10⁻⁸
C8 70 1 x 10⁻⁵ 41.9 1.55 x 10⁻⁷
C9 69.8 9.55 x 10⁻⁵ 53.8 2.40 x 10⁻⁷
C10 70.6 1.15 x 10⁻⁵ 54.2 2.63 x 10⁻⁷
C11 74.3 2.69 x 10⁻⁵ 50.3 1.07 x 10⁻⁷
GRID PEAK DAYTIME INTENSITY, I NON-
PEAK NIGHT TIME, I
D1 65.3 3.39 x 10⁻⁶ 49 7.94 x 10⁻⁸
D2 63.1 2.04 x 10⁻⁶ 39.4 8.71 x 10⁻⁹
D3 66.9 4.90 x 10⁻⁶ 45.1 3.4 x 10⁻⁸
D4 63.5 2.239 x 10⁻⁶ 48 6.31 x 10⁻⁸
D6 72.1 1.62 x 10⁻⁵ 48.7 3.24 x 10⁻⁶
D7 75 3.16 x 10⁻⁵ 62.2 1.66 x 10⁻⁶
D8 71.1 1.29 x 10⁻⁵ 53.2 2.09 x 10⁻⁷
D9 70.5 1.12 x 10⁻⁵ 49.68 9.12 x 10⁻⁸
D10 71.5 1.41 x 10⁻⁵ 48.8 7.6 x 10⁻⁸
D11 73.5 2.24 x 10⁻⁵ 50.2 1.05 x 10⁻⁷
GRID PEAK DAYTIME INTENSITY, I NON-
PEAK NIGHT TIME, I
E1 64.3 2.962 x 10⁻⁶ 42.9 1.95 x 10⁻⁸
E2 65 3.16 x 10⁻⁶ 37.8 5.50 x 10⁻⁹
E3 59.5 8.913 x 10⁻⁷ 34.5 2.82 x 10⁻⁹
E4 66.6 4.57 x 10⁻⁶ 45.5 3.55 x 10⁻⁶
E5 VOID
E6 66.6 4.57 x 10⁻⁶ 42.3 1.70 x 10⁻⁸
E7 74 2.51 x 10⁻⁵ 33.4 2.19 x 10⁻⁹
E8 75.1 3.24 x 10⁻⁵ 45.9 3.89 x 10⁻⁸
E9 70.2 1.05 x 10⁻⁵ 46 3.98 x 10⁻⁸
E10 74 2.51 x 10⁻⁵ 47 5.01 x 10⁻⁸
E11 74 2.51 x 10⁻⁵ 40 1 x 10⁻⁸

PROJECT 1 LIGHTING & ACOUSTIC PERFORMANCE EVALUATION AND DESIGN OF YELLOW APRON CAFÉ
30 | P a g e
GRID PEAK DAYTIME INTENSITY, I NON-
PEAK NIGHT TIME, I
F1 63.5 2.24 x 10⁻⁶ 44.6 2.88 x 10⁻⁸
F2 67.6 5.75 x 10⁻⁶ 47 5.01 x 10⁻⁸
F3 63.8 2.40 x 10⁻⁶ 40.9 1.23 x 10⁻⁸
F8 74 3.24 x 10⁻⁵ 44.6 2.88 x 10⁻⁸
F9 67 5.01 x 10⁻⁶ 45.4 3.47 x 10⁻⁸
F10 68 6.31 x 10⁻⁶ 45.2 3.31 x 10⁻⁸
F11 70.1 1.02 x 10⁻⁵ 44.2 2.63 x 10⁻⁸
GRID PEAK DAYTIME INTENSITY, I NON-
PEAK NIGHT TIME, I
G1 63.8 2.40 x 10⁻⁶ 42.5 1.778 x 10⁻⁸
G2 62.9 1.95 x 10⁻⁶ 46.5 4.47 x 10⁻⁸
G3 65.6 2.40 x 10⁻⁶ 52.7 1.86 x 10⁻⁷
G8 69.3 8.51 x 10⁻⁶ 45.2 3.31 x 10⁻⁸
G9 73.3 2.14 x 10⁻⁵ 40.2 1.05 x 10⁻⁸
G10 74 2.51 x 10⁻⁵ 42.3 1.70 x 10⁻⁸
G11 73 2 x 10⁻⁵ 43 2.0 x 10⁻⁸
TOTAL
INTENSITY
7.3 x 10⁻⁴
1.3 x 10⁻⁵
SOUND
PRESSURE
LEVEL
10log10 x [(7.3 x 10⁻⁴)] = 88.63 dB
10log10 x [(1.3 x 10⁻⁵)] = 71.14 dB

PROJECT 1 LIGHTING & ACOUSTIC PERFORMANCE EVALUATION AND DESIGN OF YELLOW APRON CAFÉ
31 | P a g e
2.7.1.2 Reverberation Time
Dining (Peak)
Area= 271.5 m2
Volume= 271.5 m2 x 3
= 814.56 m3
FLOOR
(m2) WALL CEILING AMOUNT
VOLUME
(m3)
ABSORPTION,
500 Hz
SOUND
ABSORPTION,
Sa
GLASS 111 0.04 4.44
BRICKWALL 19.8 0.02 3.96
WOOD
PANEL 6 0.10 0.6
WOOD 271.5 0.10 27.15
CONCRETE,
PAINTED 62.1 271.5 0.01 3.715
PLYWOOD 39 0.10 3.9
AIR 814.56 0.007 5.7
FURNITURE 96 0.87 78.8
NO. OF
PEOPLE 40 0.46 18.4
TOTAL 123.3
Rt = (0.16 x 814.56) / 123.3
= 1.06 s

PROJECT 1 LIGHTING & ACOUSTIC PERFORMANCE EVALUATION AND DESIGN OF YELLOW APRON CAFÉ
32 | P a g e
Dining (Non-Peak)
Area= 271.5 m2
Volume= 271.5 m2 x 3
= 814.56 m3
FLOOR
(m2) WALL CEILING AMOUNT
VOLUME
(m3)
ABSORPTION,
500 Hz
SOUND
ABSORPTION,
Sa
GLASS 111 0.04 4.44
BRICKWALL 19.8 0.02 3.96
WOOD
PANEL 6 0.10 0.6
WOOD 271.5 0.10 27.15
CONCRETE,
PAINTED 62.1 271.5 0.01 3.715
PLYWOOD 39 0.10 3.9
AIR 814.56 0.007 5.7
FURNITURE 96 0.87 78.8
NO. OF
PEOPLE 0 0 0
TOTAL 104.9
Rt = (0.16 x 814.56) / 104.9
= 1.24 s
PROJECT 1 LIGHTING & ACOUSTIC PERFORMANCE EVALUATION AND DESIGN OF YELLOW APRON CAFÉ
33 | P a g e
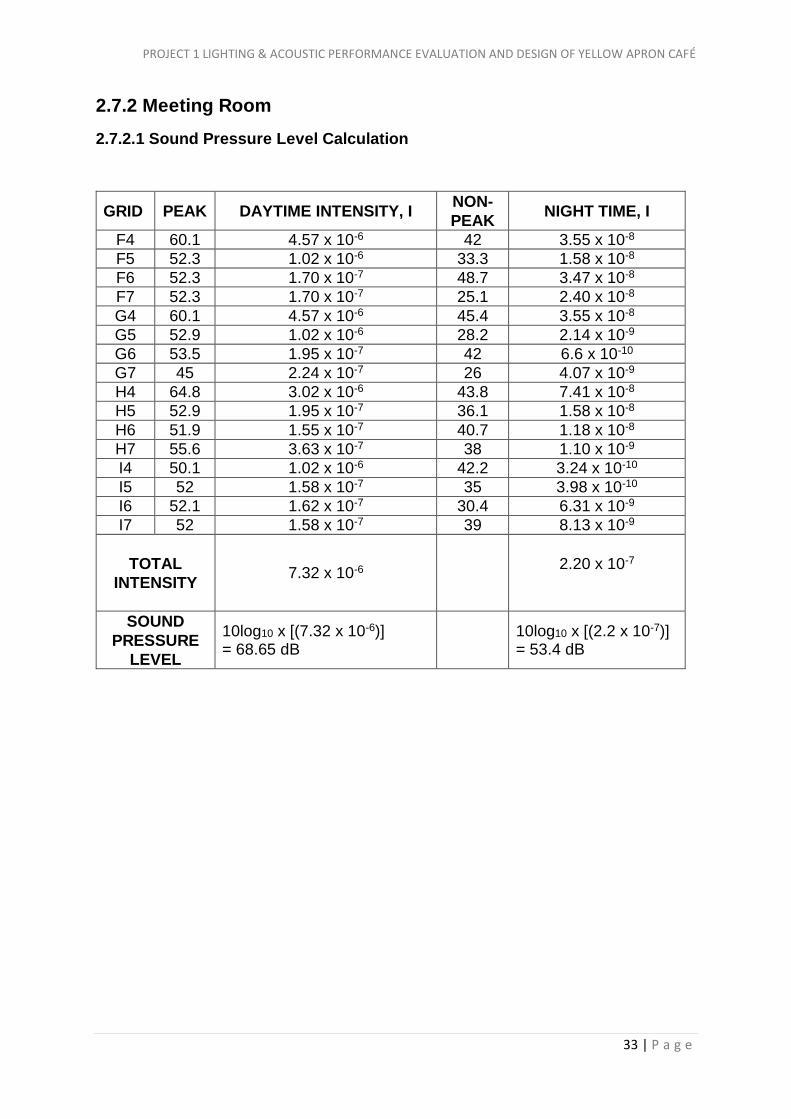
2.7.2 Meeting Room
2.7.2.1 Sound Pressure Level Calculation
GRID PEAK DAYTIME INTENSITY, I NON-
PEAK NIGHT TIME, I
F4 60.1 4.57 x 10⁻⁶ 42 3.55 x 10⁻⁸
F5 52.3 1.02 x 10⁻⁶ 33.3 1.58 x 10⁻⁸
F6 52.3 1.70 x 10⁻⁷ 48.7 3.47 x 10⁻⁸
F7 52.3 1.70 x 10⁻⁷ 25.1 2.40 x 10⁻⁸
G4 60.1 4.57 x 10⁻⁶ 45.4 3.55 x 10⁻⁸
G5 52.9 1.02 x 10⁻⁶ 28.2 2.14 x 10⁻⁹
G6 53.5 1.95 x 10⁻⁷ 42 6.6 x 10⁻¹⁰
G7 45 2.24 x 10⁻⁷ 26 4.07 x 10⁻⁹
H4 64.8 3.02 x 10⁻⁶ 43.8 7.41 x 10⁻⁸
H5 52.9 1.95 x 10⁻⁷ 36.1 1.58 x 10⁻⁸
H6 51.9 1.55 x 10⁻⁷ 40.7 1.18 x 10⁻⁸
H7 55.6 3.63 x 10⁻⁷ 38 1.10 x 10⁻⁹
I4 50.1 1.02 x 10⁻⁶ 42.2 3.24 x 10⁻¹⁰
I5 52 1.58 x 10⁻⁷ 35 3.98 x 10⁻¹⁰
I6 52.1 1.62 x 10⁻⁷ 30.4 6.31 x 10⁻⁹
I7 52 1.58 x 10⁻⁷ 39 8.13 x 10⁻⁹
TOTAL
INTENSITY
7.32 x 10⁻⁶
2.20 x 10⁻⁷
SOUND
PRESSURE
LEVEL
10log10 x [(7.32 x 10⁻⁶)] = 68.65 dB
10log10 x [(2.2 x 10⁻⁷)] = 53.4 dB

PROJECT 1 LIGHTING & ACOUSTIC PERFORMANCE EVALUATION AND DESIGN OF YELLOW APRON CAFÉ
34 | P a g e
2.7.2.2 Reverberation Time
MEETING ROOM (PEAK)
Area = 52.8 m2
Volume = 52.8 m2 x 3
= 158.4 m3
FLOOR
(m2)
WAL
L CEILING AMOUNT
VOLUM
E
(m3)
ABSORPTION,
500 Hz
SOUND
ABSORPTION,
Sa
BRICKWALL 19.8 0.02 0.396
WOOD
PANEL 6 0.10 0.6
WOOD 52.8 0.10 5.28
CONCRETE,
PAINTED 51 52.8 0.01 1.04
AIR 158.4 0.007 1.11
FURNITURE 20 0.10 2
NO. OF
PEOPLE 15 0.46 6.9
TOTAL 17.3
Rt = (0.16 x 52.8) / 17.3
= 1.5 s
PROJECT 1 LIGHTING & ACOUSTIC PERFORMANCE EVALUATION AND DESIGN OF YELLOW APRON CAFÉ
35 | P a g e
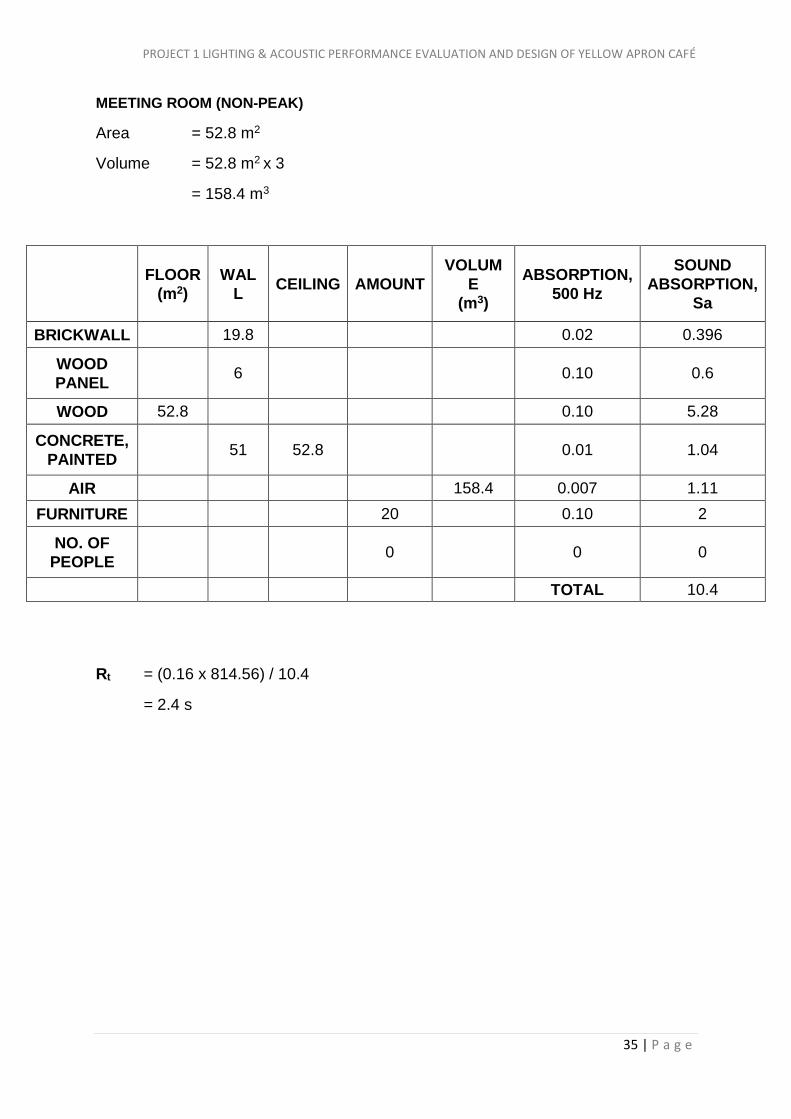
MEETING ROOM (NON-PEAK)
Area = 52.8 m2
Volume = 52.8 m2 x 3
= 158.4 m3
FLOOR
(m2)
WAL
L CEILING AMOUNT
VOLUM
E
(m3)
ABSORPTION,
500 Hz
SOUND
ABSORPTION,
Sa
BRICKWALL 19.8 0.02 0.396
WOOD
PANEL 6 0.10 0.6
WOOD 52.8 0.10 5.28
CONCRETE,
PAINTED 51 52.8 0.01 1.04
AIR 158.4 0.007 1.11
FURNITURE 20 0.10 2
NO. OF
PEOPLE 0 0 0
TOTAL 10.4
Rt = (0.16 x 814.56) / 10.4
= 2.4 s

PROJECT 1 LIGHTING & ACOUSTIC PERFORMANCE EVALUATION AND DESIGN OF YELLOW APRON CAFÉ
36 | P a g e
2.7.3 Outdoor Dining Area
2.7.3.1 Sound Pressure Level Calculation
GRID PEAK DAYTIME INTENSITY, I NON-
PEAK NIGHT TIME, I
A1 66.1 4.07 x 10⁻⁶ 50.6 1.15 x 10⁻⁷
A2 85 3.16 x 10⁻⁴ 40.7 1.18 x 10⁻⁷
A3 65.4 3.47 x 10⁻⁶ 44 2.51 x 10⁻⁸
A4 65.4 3.47 x 10⁻⁶ 43.3 2.14 x 10⁻⁸
A5 66 3.98 x 10⁻⁶ 55 3.16 x 10⁻⁷
B1 67.1 5.01 x 10⁻⁶ 41.6 1.45 x 10⁻⁸
B2 81.1 1.29 x 10⁻⁴ 44.7 2.95 x 10⁻⁸
B3 65.2 3.31 x 10⁻⁶ 45.2 3.31 x 10⁻⁷
B4 64.8 3.02 x 10⁻⁶ 44.4 2.75 x 10⁻⁸
B5 66.1 4.07 x 10⁻⁶ 55.9 3.89 x 10⁻⁷
C1 67.1 2.0 x 10⁻⁶ 43.8 2.40 x 10⁻⁸
C2 67.1 5.01 x 10⁻⁶ 54 2.51 x 10⁻⁷
C3 65.1 3.24 x 10⁻⁶ 45.8 3.80 x 10⁻⁸
C4 74 2.51 x 10⁻⁵ 44.1 2.57 x 10⁻⁸
C5 67.5 5.62 x 10⁻⁶ 47.2 5.25 x 10⁻⁸
D1 63 2.0 x 10⁻⁶ 58.7 7.41 x 10⁻⁷
D2 67.1 5.01 x 10⁻⁶ 45.8 3.80 x 10⁻⁸
D3 64.6 2.88 x 10⁻⁶ 50.5 1.12 x 10⁻⁷
E1 65.1 3.24 x 10⁻⁶ 38.7 7.41 x 10⁻⁹
E2 70.8 1.20 x 10⁻⁵ 50.5 1.12 x 10⁻⁷
E3 64.8 3.02 x 10⁻⁶ 60.2 1.05 x 10⁻⁷
F1 76.2 4.17 x 10⁻⁵ 40.2 1.05 x 10⁻⁸
F2 67 5.01 x 10⁻⁶ 60.2 1.05 x 10⁻⁶
F3 66.4 4.37 x 10⁻⁶ 58.3 6.76 x 10⁻⁷
G1 62.3 1.70 x 10⁻⁶ 50.6 1.15 x 10⁻⁷
G2 66.5 4.47 x 10⁻⁶ 39.6 9.12 x 10⁻⁹
G3 66.1 4.07 x 10⁻⁶ 40.2 1.08 x 10⁻⁸
TOTAL
INTENSITY
6.09 x 10⁻⁴
5.3 x 10⁻⁶
SOUND
PRESSURE
LEVEL
10log10 x [(6.09 x 10⁻⁴)] = 87.85 dB
10log10 x [(5.3 x 10⁻⁶)] = 67.24dB

PROJECT 1 LIGHTING & ACOUSTIC PERFORMANCE EVALUATION AND DESIGN OF YELLOW APRON CAFÉ
37 | P a g e
2.7.3.2 Reverberation Time
OUTDOOR DINING (PEAK)
Area= 88.9 m2
Volume= 88.9 m2 x 3
= 266.7 m3
FLOOR
(m2)
WAL
L CEILING AMOUNT
VOLUM
E
(m3)
ABSORPTION,
500 Hz
SOUND
ABSORPTION,
Sa
GLASS 41.1 0.04 0.504
CONCRETE,
PAINTED 51 52.8 0.01 2.063
AIR 266.7 0.007 1.87
FURNITURE 20 0.87 1.2
NO. OF
PEOPLE 4 0.46 1.84
TOTAL 39.05
Rt = (0.16 x 88.9) / 39.05
= 1.09 s

PROJECT 1 LIGHTING & ACOUSTIC PERFORMANCE EVALUATION AND DESIGN OF YELLOW APRON CAFÉ
38 | P a g e
OUTDOOR DINING (NON-PEAK)
Area = 88.9 m2
Volume = 88.9 m2 x 3
= 266.7 m3
FLOOR
(m2)
WAL
L CEILING AMOUNT
VOLUM
E
(m3)
ABSORPTION,
500 Hz
SOUND
ABSORPTION,
Sa
GLASS 41.1 0.04 0.504
CONCRETE,
PAINTED 51 52.8 0.01 2.063
AIR 266.7 0.007 1.87
FURNITURE 20 0.87 1.2
NO. OF
PEOPLE 0 0 0
TOTAL 37.21
Rt = (0.16 x 88.9) / 37.21
= 1.15 s

PROJECT 1 LIGHTING & ACOUSTIC PERFORMANCE EVALUATION AND DESIGN OF YELLOW APRON CAFÉ
39 | P a g e
2.7.4 Transmission Loss
Wall 1 – Ground Floor (Opposite of Main Road)
MATERIAL SURFACE
AREA SRI
TRANSMISSION
COEFFICIENT Sn x Tcn
GLASS 33.6 26 2.5 x 10⁻³ 84 x 10-3
CONCRETE 8.4 45 3.125 x 10⁻⁵ 26.25 x 10⁻⁵
SRIglass = 10Log10 (1/T)
26 = 10Log10 (1/T)
antilog2.6 = (1/T)
T = (1/ 4.0 x 10²)
Tglass = 2.5 x 10⁻³
SRIconcrete = 10Log10 (1/T)
45 = 10Log10 (1/T)
antilog4.5 = (1/T)
T = (1/ 3.2 x 10⁴)
Tconcrete = 3.125 x 10⁻⁵
Average transmission coefficient of materials
Tav = [(84 x 10-3 ) + (26.25 x 10⁻⁵ )] / (34.32 + 8.58)
= 1.964 x 10⁻³
SRI = 10log10 (1/ 1.964 x 10⁻³)
= 32.93 dB
SRI of wall 1= 32.93 dB, SRI of main road (opposite of café) = 66.74 dB
Wall 1 has reduced noise of 32.93 dB.
Hence, it can be concluded that wall 1 cannot fully cut off noise from the main road.

PROJECT 1 LIGHTING & ACOUSTIC PERFORMANCE EVALUATION AND DESIGN OF YELLOW APRON CAFÉ
40 | P a g e
Wall 2 – Ground Floor (Adjacent to Construction Building)
MATERIAL SURFACE
AREA SRI
TRANSMISSION
COEFFICIENT Sn x Tcn
GLASS 55.2 26 2.5 x 10⁻³ 138 x 10-3
CONCRETE 13.8 45 3.125 x 10⁻⁵ 43.13 x 10⁻⁵
SRIglass = 10Log10 (1/T)
26 = 10Log10 (1/T)
antilog2.6 = (1/T)
T = (1/ 4.0 x 10²)
Tglass = 2.5 x 10⁻³
SRIconcrete = 10Log10 (1/T)
45 = 10Log10 (1/T)
antilog4.5 = (1/T)
T = (1/ 3.2 x 10⁴)
Tconcrete = 3.125 x 10⁻⁵
Average transmission coefficient of materials
Tav = [(138 x 10-3 ) + (43.13 x 10⁻⁵ )] / (55.2 + 13.8) 69
= 2.0 x 10⁻³
SRI = 10log10 (1/ 2.0 x 10⁻³)
= 33 dB
SRI of wall 2= 33 dB, SRI of main road (opposite of café) = 77 dB
Wall 2 has reduced noise of 33dB. Hence, it can be concluded that wall 2 cannot fully
cut off noise from the adjacent construction building.

PROJECT 1 LIGHTING & ACOUSTIC PERFORMANCE EVALUATION AND DESIGN OF YELLOW APRON CAFÉ
41 | P a g e
2.7.5 Observations and Discussions
Based on readings and calculations, there are some observations followed with
discussion.
OBSERVATION 1
There are higher readings on the outdoor dining area
(eg: A2, 85 dB reading and F1, 76.2 dB reading)
Discussion: This is due to the dining area not having a barrier to cut off noise path that
travels from the main road and adjacent building on-going construction.
OBSERVATION 2
There is a slight rise in reading near the staircase that connects the first floor to ground
floor.
Discussion: Sound path travels from downstairs to upstairs via the double volume void
causes distinctive rise in reading especially during non-peak hour.
OBSERVATION 3
The readings nearest to adjacent building construction are higher on the first floor.
Discussion: Existence of glass wall on the ground floor blocks the noise path travelling
from main road and adjacent buildings.

PROJECT 1 LIGHTING & ACOUSTIC PERFORMANCE EVALUATION AND DESIGN OF YELLOW APRON CAFÉ
42 | P a g e
2.8 Conclusion for Acoustic Analysis
It can be seen that the noise level readings are higher in the ground floor due to the
fact that most of the customers are located there, as rarely do people dine in the
outdoor dining area because lack of air-conditioning on the first floor. Other than that,
due to the fact that there’s an open kitchen located on the ground floor, the sound
propagates towards the dining area. The first floor is an open space so the noise
generated from outside such as from moving cars nearby and construction site.
The use of wood ads in the sound absorption especially on the ground floor. Besides
that, it can be observed that there is no greenery within Yellow Apron Café. It is able
to reduce noise up to 6-8dB and also provide more privacy by placing plantation
between boundaries of zones. A test carried out by Rentokil Initial Research and
Development suggested that interior plants can absorb or reflect background noise in
buildings, thereby making the environment more comfortable for occupants. Planters
that placed near the edges and corners would be better than at the center of the room
as sounds reflected from the walls. Other than that, we can also plant the greenery
outside of Yellow Apron to reduce the sound pressure level from the traffic and
construction noise, therefore, subsequently reduce exterior voice which penetrates
into the café.
The acoustic issue can also be improved by adding materials that has high sound
absorption to further minimize echo and sound travel inward as well as outward.

PROJECT 1 LIGHTING & ACOUSTIC PERFORMANCE EVALUATION AND DESIGN OF YELLOW APRON CAFÉ
43 | P a g e
3.1 Literature Review
3.1.1 Importance of Light in Architecture
The word of space is directly connected to the way light integrates with it. Light
interacts with us and environment by our vision, experience and interpretation on
elements. Based on architecture study, in any dimension we can analyze such as
space, material or colour, it is essentially dependent on the lighting situation that
involves both the object and the observer. The dynamic daylight and the controlled
artificial lighting are able to affect not only distinct physical measurable setting in a
space, but also to instigate and provoke different visual experiences and moods. In
addition, light can perceive different atmospheres in the same physical environment.
It also integrates an element of basic relevance for design of spaces which plays a
significant role in the discussion of quality in architecture.
3.1.2 Natural Daylighting & Artificial Electrical Lighting
Although architects should always strive towards achieving a building which can draw
in as much natural daylight as possible, it is almost impossible to go on without
electrical lighting taking into consideration in design especially that it need to function
both day and night. Moreover, certain building typologies and uses are not suitable for
daylighting such as museums and galleries because exposure to natural light could
damage the artificial lighting and be able to apply it architecturally to achieve the best
performing building.
3.1.3 Balance between Science & Art
Science of light production and luminaire photometric are important as they are
balanced with the artistic application of light as a medium in our built environment.
Electrical lighting systems and daylighting systems should be integrated together while
considering the impacts of it. There are three fundamental aspects in architectural
lighting design for the illumination of building and spaces, including the aesthetic
appeal, ergonomic aspect and energy efficiency of illumination. Aesthetic appeal

PROJECT 1 LIGHTING & ACOUSTIC PERFORMANCE EVALUATION AND DESIGN OF YELLOW APRON CAFÉ
44 | P a g e
focuses on the importance of illumination in retail environments. Ergonomic aspect is
the measurement of how much function the lighting produces. Energy efficiency
covers the issue of light wastage due to over illumination which could happen by
unnecessary illumination of spaces or over providing light sources for aesthetic
purposes. Each of these aspects are important when lighting works are carried out. It
allows exploration on the attractiveness of the design by either providing subtle or
strong lighting sources which creates different emotions for the users.
3.1.4 Daylight Factor
It is a ratio that represent the amount of illumination available indoors relative to the
illumination present outdoors at the same time under overcast skies. Daylight factor is
usually used to obtain the internal natural lighting levels as perceived on a plane or
surface, in order to determine the sufficiency of natural lighting for the users in a
particular spaces to conduct their activities. It is also simply known to be the ratio of
internal light level to external light level, as shown below:
𝐷𝑎𝑦𝑙𝑖𝑔ℎ𝑡 𝐹𝑎𝑐𝑡𝑜𝑟, 𝐷𝐹 =𝐼𝑛𝑑𝑜𝑜𝑟 𝐼𝑙𝑙𝑢𝑚𝑖𝑛𝑎𝑛𝑐𝑒, 𝐸𝑖
𝑂𝑢𝑡𝑑𝑜𝑜𝑟 𝐼𝑙𝑙𝑢𝑚𝑖𝑛𝑎𝑛𝑐𝑒. 𝐸𝑜 × 100%
Where,
Ei = illuminance due to daylight at a point on the indoor working planes,
Eo = Simultaneous outdoor illuminance on a horizontal plane from an unobstructed
hemisphere of overcast sky.
Zone DF (%) Distribution
Very bright >6 Large (including thermal and glare problem)
Bright 3-6 Good
Average 1-3 Fair
Dark 0-1 Poor
Table 4 Daylight Factor and Distribution.
PROJECT 1 LIGHTING & ACOUSTIC PERFORMANCE EVALUATION AND DESIGN OF YELLOW APRON CAFÉ
45 | P a g e
3.1.5 Lumen Method
Lumen method is used to determine the number of lamps that should be installed in a
space. This can be done by calculating the total illuminance of the space based on the
number of fixtures and determine whether or not that particular space has enough
lighting fixtures.
The number of lamps can be calculated by the formula below:
𝑁 = 𝐸 × 𝐴
𝐹 × 𝑈𝐹 × 𝑀𝐹
Where,
N = Number of lamps required
E = Illuminance level required (Lux)
A = Area at working plane height (𝑚2)
F = Average luminous flux from each lamp (lm)
UF = Utilisation factor, an allowance for the light distribution of the luminaire and the room
surfaces
MF = Maintenance factor, an allowance for reduced light output because of deterioration and
dirt.
Room index, RI, is the ratio of room plan area to half wall area between the working
and luminaire planes. Which can be calculated by:
𝑅𝐼 = 𝐿 × 𝑊
𝐻𝑚 × (𝐿 + 𝑊)
Where,
L = Length of room
W = Width of room
Hm = Mounting height, the vertical distance between the working plane and the luminaire.

PROJECT 1 LIGHTING & ACOUSTIC PERFORMANCE EVALUATION AND DESIGN OF YELLOW APRON CAFÉ
46 | P a g e
3.2 Precedent Study
3.2.1 Lighting – The Art Room, W.D. Richards Elementary School
Figure 3.1 The Art Room, W.D. Richards Elementary School
3.2.2 Introduction
The W.D. Richards Elementary School has a vision of “providing a safe and positive
learning environment where students will have the opportunity to gain basic knowledge
through the use of appropriate curriculum and to achieve their potential.” The school
believes in four main principles: professional growth, continuous improvement,
education excellence for all learners and accountability. The school is ranked as a
four-star elementary school, meaning it is within the top twenty-five percent of all
schools within Indiana in four categories. The school also employs special needs
programs for students with communication disorders and learning disabilities.
Programs are also offered for exploring music, physical education, and visual arts.
PROJECT 1 LIGHTING & ACOUSTIC PERFORMANCE EVALUATION AND DESIGN OF YELLOW APRON CAFÉ
47 | P a g e
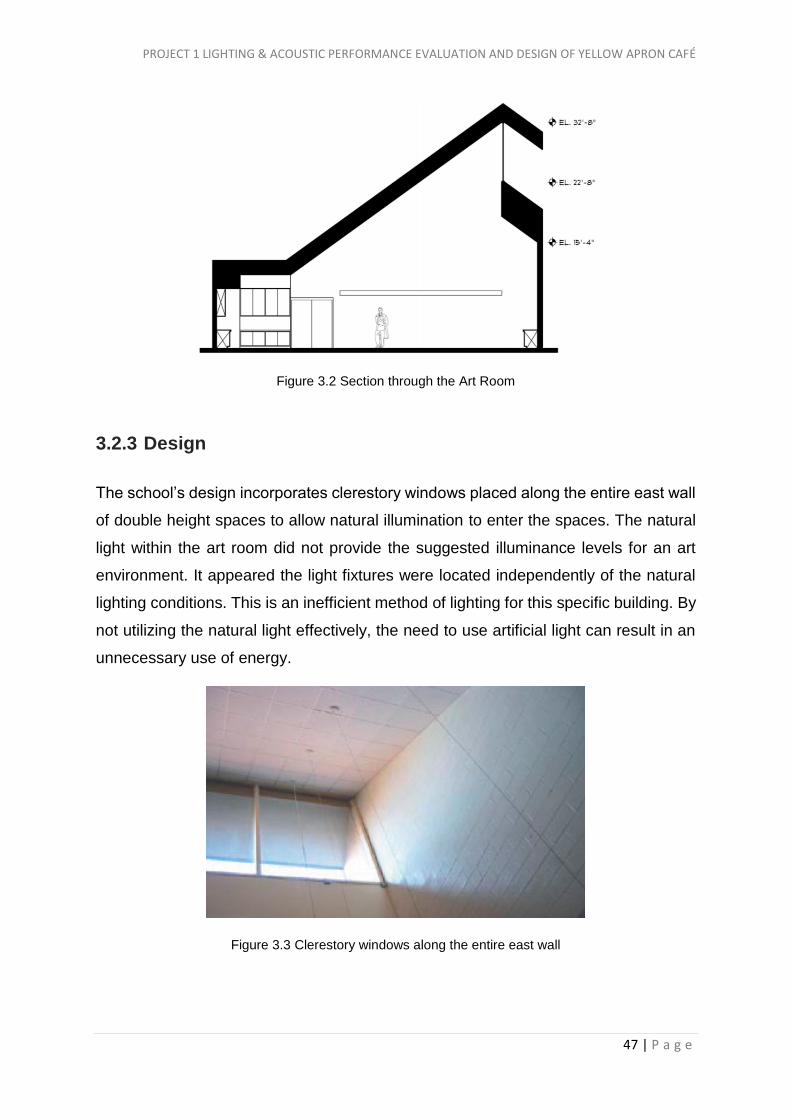
Figure 3.2 Section through the Art Room
3.2.3 Design
The school’s design incorporates clerestory windows placed along the entire east wall
of double height spaces to allow natural illumination to enter the spaces. The natural
light within the art room did not provide the suggested illuminance levels for an art
environment. It appeared the light fixtures were located independently of the natural
lighting conditions. This is an inefficient method of lighting for this specific building. By
not utilizing the natural light effectively, the need to use artificial light can result in an
unnecessary use of energy.
Figure 3.3 Clerestory windows along the entire east wall

PROJECT 1 LIGHTING & ACOUSTIC PERFORMANCE EVALUATION AND DESIGN OF YELLOW APRON CAFÉ
48 | P a g e
3.2.4 Methodology and Data Collection
The research team divided the room into 48 inch sections (see above) and took
measurements at the intersection points on the grid. The measurements were taken
three different times. The first set of data was taken using only the natural light entering
the room. The second set was takenusing only the artificial light within the room. The
final set was taken using a combination of both natural and artificial light. The next
step involved the placing of data loggers* on the grid to obtain the illumination within
the room at specific points throughout the different times of day. Also, luminance
measurements were taken on the work surfaces to identify contrast. Finally, all the
data were analyzed to develop a conclusion and to suggest several possible
improvements to the design of the room to enhance the design concept.
Figure 3.4 Hobo data logger placement on grid
Figure 3.5 Fluorescent bulbs along north and south walls

PROJECT 1 LIGHTING & ACOUSTIC PERFORMANCE EVALUATION AND DESIGN OF YELLOW APRON CAFÉ
49 | P a g e
Figure 3.6 Track lighting layout
Figure 3.7 Fluorescent bulbs along north and south walls
Figure 3.8 Reflected ceiling plan showing ceiling tile grid, ceiling heights, and lamp fixture locations

PROJECT 1 LIGHTING & ACOUSTIC PERFORMANCE EVALUATION AND DESIGN OF YELLOW APRON CAFÉ
50 | P a g e
The indicative phase of the research began with an initial visit to the W. D. Richards
Elementary School on September 9, 2003. This research team focused our
investigation within the school’s art room. The art room is located in the centre core of
the school, adjacent to the gymnasium. Unlike most of the other classrooms, it does
not have an exterior wall. The only source of natural light for the art room is the eastern
clerestory window. The room’s ceiling slopes to a height of 32’-8”. At the top of the
slope is a 10’- 0” deep clerestory window that runs uninterrupted the length of the
eastern wall. The sloped ceiling is finished with a white 24 inch acoustical lay-in ceiling
tile grid. The design concept of the room uses the clerestory window to bring exterior
light into the room and uses the ceiling to reflect the natural light into the space and
spread that light evenly within the room. In addition to the natural light brought into the
space by the clerestory window, the illumination of the room is supplemented by
several sets of light fixtures. The first is a set of six 2-bulb, 4’-0” fluorescent light fixtures
along the north and south walls of the room. Under the clerestory window, located in
the soffit, are five recessed incandescent can lights. In the west end of the room there
are three 24 inch square parabolic fixtures with two U-shaped fluorescent lamps.
Finally, arranged in a rectangle around the work space are twenty-two incandescent
can lights placed on a suspended track to provide task lighting over the student work
area.
The investigative phase of the research focused on the gathering of data within the art
room. First, the research team recorded the lighting fixture layout. Each luminaire was
located in plan and then associated with one of seven switches in the room. This
enabled the team to identify the way in which artificial light within the art room could
be manipulated for various tasks. The next task was to record illuminance within the
room. Using a Sylvania digital illuminance meter, the research team recorded the
illuminance in foot-candles of various points within the room. These measurements
were taken on the 48 inch. The team took three sets of measurements. The first set of
data measured only the natural light entering the space. The second set of data was
taken with all the light fixtures turned on and the clerestory windows fully exposed to
provide natural light. For the final set of data, the team covered the window and
measured only the illuminance levels from the light fixtures. The daylight-only data set
shows that the highest value recorded for the room was 9 foot-candles. This is too low
PROJECT 1 LIGHTING & ACOUSTIC PERFORMANCE EVALUATION AND DESIGN OF YELLOW APRON CAFÉ
51 | P a g e
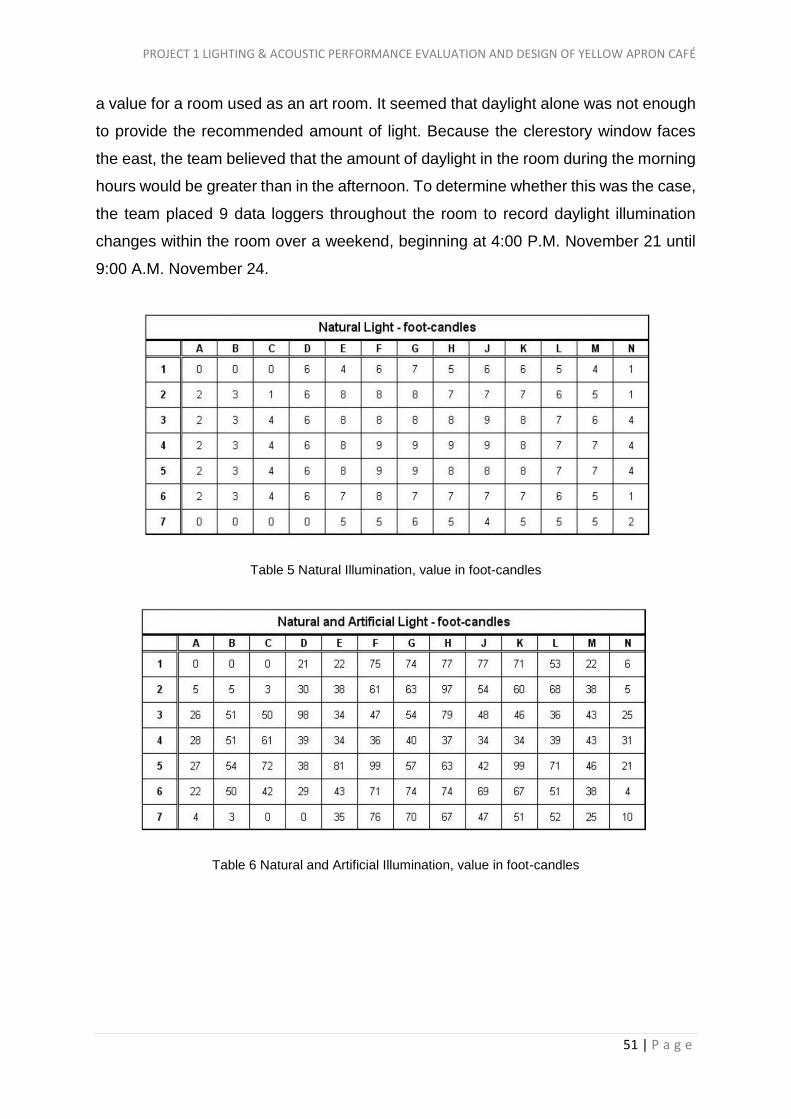
a value for a room used as an art room. It seemed that daylight alone was not enough
to provide the recommended amount of light. Because the clerestory window faces
the east, the team believed that the amount of daylight in the room during the morning
hours would be greater than in the afternoon. To determine whether this was the case,
the team placed 9 data loggers throughout the room to record daylight illumination
changes within the room over a weekend, beginning at 4:00 P.M. November 21 until
9:00 A.M. November 24.
Table 5 Natural Illumination, value in foot-candles
Table 6 Natural and Artificial Illumination, value in foot-candles

PROJECT 1 LIGHTING & ACOUSTIC PERFORMANCE EVALUATION AND DESIGN OF YELLOW APRON CAFÉ
52 | P a g e
Table 7 Artificial Illumination, value in foot-candles
3.2.5 Conclusion
The art room does provide the needed illumination for the tasks that are to be
performed. The illumination provided at the height of the student desks by the track
lighting is 100 foot-candles.
The research team also observed that the natural light entering the space is not
enough to provide even a minimum value of 50 foot-candles.
We conclude that the natural lighting within the art room is sufficient to provide for
personal orientation and light for occasional visual tasks. Understanding the limitations
in amount of light and the time of day that light is provided, designers chose to
incorporate the use of supplemental lighting found in various forms. The various light
fixtures can be turned on and off to adjust the required lighting for the various tasks.
The light fixtures can be used in conjunction with the natural light entering the space
to provide the most efficient use of energy for the space, customizing and adjusting
the light in the space depending on the task being performed at any given time.

PROJECT 1 LIGHTING & ACOUSTIC PERFORMANCE EVALUATION AND DESIGN OF YELLOW APRON CAFÉ
53 | P a g e
3.3 Methodology of Lighting Analysis
3.3.1 Description of Equipment
(a) Lux Meter
It is an electronic equipment that measures luminous flux per unit area and
illuminance level. The device picks up accurate reading as it is sensitive to
illuminance.
Features
LSI-circuit provides high reliability and durability
LCD display provides low power consumption
Sensor with exclusive photo diode, multi-colour correction filters and spectrum meeting C.I.E. standard
Sensor COS correction factor meets standard
LCD display can clearly read out even with high ambient light
Compact, light-weight and excellent operation
Precise, easy read out and wide range
Built-in low battery indicator
High accuracy in measuring
General Specifications
Display 13mm (0.5”) LCD
Ranges 0-50,000 Lux. 3 Ranges
Zero Adjustment Internal adjustment
Over-input Indication of “1”
Sampling Time 0.4 second
Sensor Structure Exclusive photo diode and colour correction filter
Operating Temperature 0 to 50c (32 to 122F)
Operating Humidity Less than 80% R.H.
Power Supply DC 9V battery. 006P MN1604 (PP3) or equivalent
Power Consumption Approximately DC 2 mA
Dimension Main Instrument : 108x73x23mm Sensor Probe : 82x55x7mm
Weight 160 (0.36 LB) with batteries
PROJECT 1 LIGHTING & ACOUSTIC PERFORMANCE EVALUATION AND DESIGN OF YELLOW APRON CAFÉ
54 | P a g e
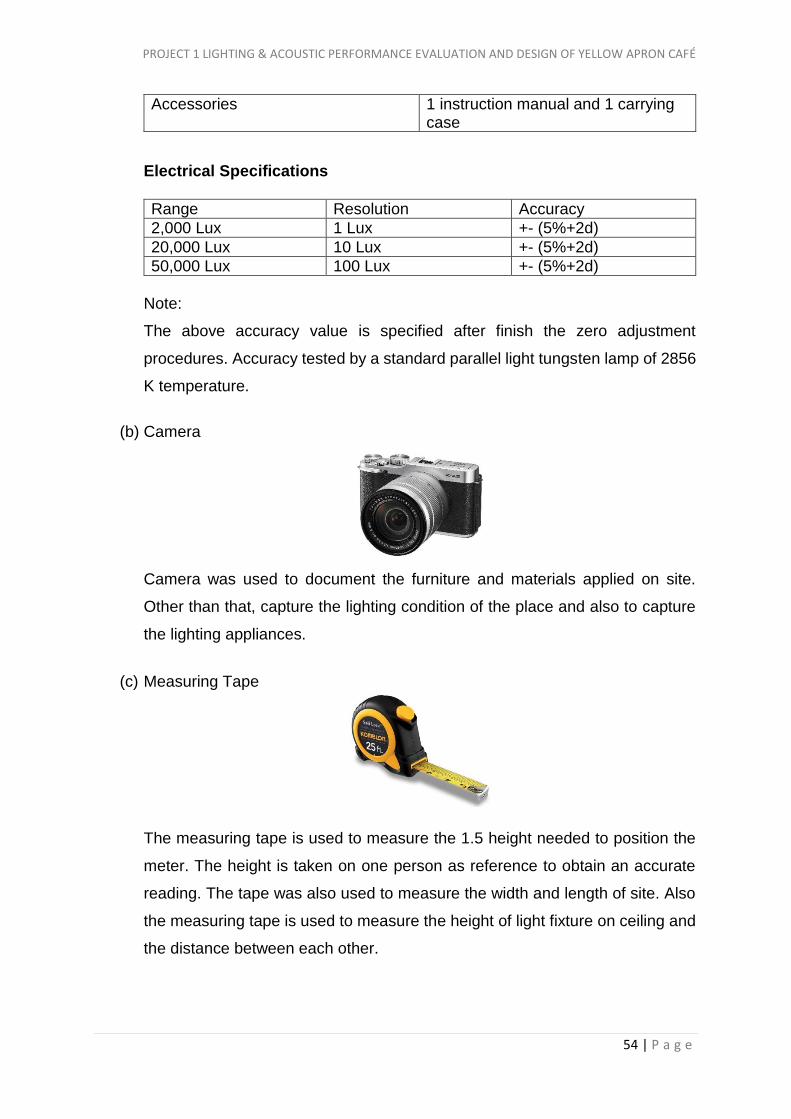
Accessories 1 instruction manual and 1 carrying case
Electrical Specifications
Range Resolution Accuracy
2,000 Lux 1 Lux +- (5%+2d)
20,000 Lux 10 Lux +- (5%+2d)
50,000 Lux 100 Lux +- (5%+2d)
Note:
The above accuracy value is specified after finish the zero adjustment
procedures. Accuracy tested by a standard parallel light tungsten lamp of 2856
K temperature.
(b) Camera
Camera was used to document the furniture and materials applied on site.
Other than that, capture the lighting condition of the place and also to capture
the lighting appliances.
(c) Measuring Tape
The measuring tape is used to measure the 1.5 height needed to position the
meter. The height is taken on one person as reference to obtain an accurate
reading. The tape was also used to measure the width and length of site. Also
the measuring tape is used to measure the height of light fixture on ceiling and
the distance between each other.

PROJECT 1 LIGHTING & ACOUSTIC PERFORMANCE EVALUATION AND DESIGN OF YELLOW APRON CAFÉ
55 | P a g e
3.3.2 Data Collection Method
Lighting measurement were taken on the same day in two different time of day
which is 12-2pm and night 7-9pm considering different lighting qualities in both
time. Perpendicular 2mx2m grid lines were set on the floor plan creating
intersection points to aid the data collection. The lux level meter was placed on
the intersection points at a standard 1.5m height from ground facing upwards.
This standard was used to ensure that the data collected is accurate. The lux
level meter should be facing upward and the person using it should not block
the source of light that will falls on the sensor probe for accurate results. Same
process was repeated for several times in different time zones.
Procedure
Identification of area for light source measurements were based on gridlines produced
Obtain data by using lux meter. The device is placed on each point according to the guidelines at height of 1.5m
Data is then recorded by indicating light level in each point based on gridlines. Variables affecting the site is also noted.
Steps 1 to 3 is repeated for time 5-7 night as there might be different lighting condition.

PROJECT 1 LIGHTING & ACOUSTIC PERFORMANCE EVALUATION AND DESIGN OF YELLOW APRON CAFÉ
56 | P a g e
3.3.3 Lighting Analysis Calculation Method
3.3.4.1.1 Daylight Factor Calculation
The ratio, in percent, of work plane illuminance (at a given point) to the outdoor
illuminance on a horizontal plane.
Where,
E internal = illuminance due to daylight at a point on the indoor working plane
E external = direct sunlight = 32000 lux
3.3.4.1.2 Lumen Method Calculation
Step 1:
Light Reflectance (Ceiling, Wall, Floor)
Find the light reflectance (%) for ceiling, wall, window and floor in the overall
space based on the reflectance table. For example:
Table 6 Light reflectance table
PROJECT 1 LIGHTING & ACOUSTIC PERFORMANCE EVALUATION AND DESIGN OF YELLOW APRON CAFÉ
57 | P a g e
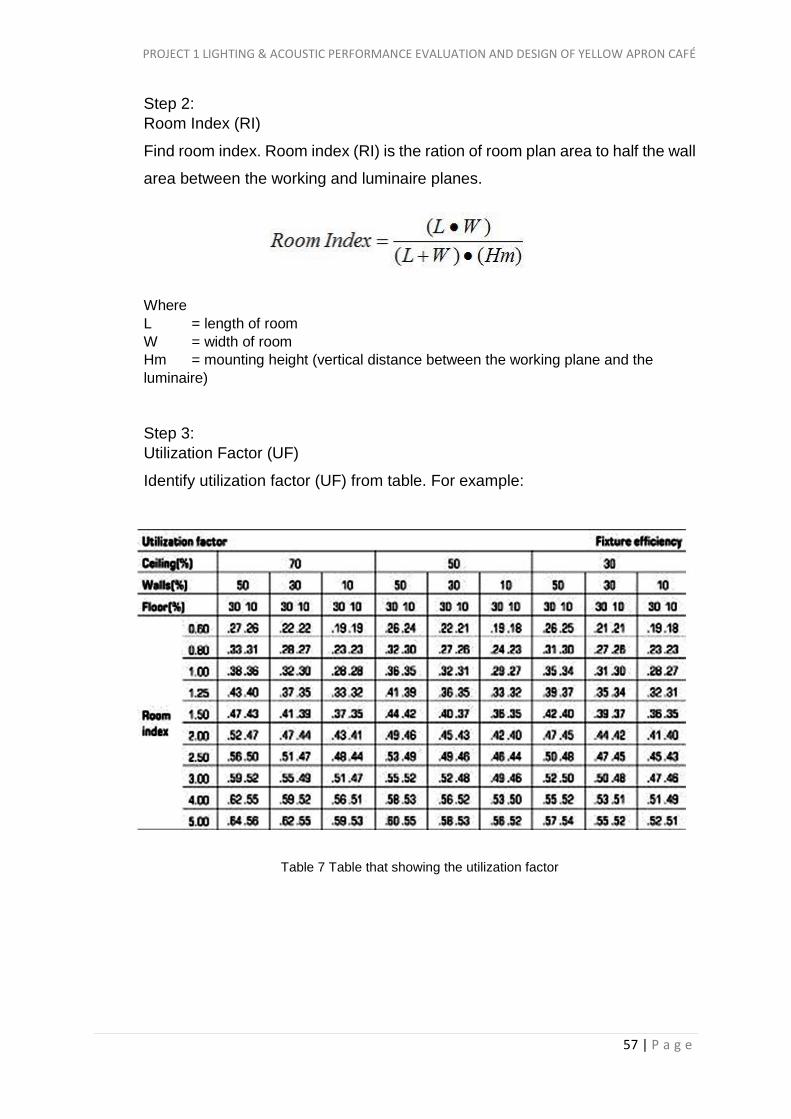
Step 2:
Room Index (RI)
Find room index. Room index (RI) is the ration of room plan area to half the wall
area between the working and luminaire planes.
Where
L = length of room
W = width of room
Hm = mounting height (vertical distance between the working plane and the
luminaire)
Step 3:
Utilization Factor (UF)
Identify utilization factor (UF) from table. For example:
Table 7 Table that showing the utilization factor

PROJECT 1 LIGHTING & ACOUSTIC PERFORMANCE EVALUATION AND DESIGN OF YELLOW APRON CAFÉ
58 | P a g e
Step 4:
Illuminance Level (E)
Find existing average illuminance level, E.
Where,
E = average illuminance over the horizontal working plane
n = number of lamps in each luminaire
N = number of luminaire
F = lighting design lumens per lamp
UF = utilization factor
MF = maintenance factor
A = area of horizontal working plane
Step 5:
Find number of fittings required, N.

PROJECT 1 LIGHTING & ACOUSTIC PERFORMANCE EVALUATION AND DESIGN OF YELLOW APRON CAFÉ
59 | P a g e
3.4 Lighting Analysis and Calculation
3.4.1 Lighting Data Record
3.4.1.1 Ground Floor Lux Reading
Height: 1 meter
Unit: Lux
Grid
Day Time/ Peak Hour
Night Time/ Non-peak
Hour
Grid
Day Time/ Peak Hour
Night Time/ Non-peak
Hour
12p.m.–2p.m. 5p.m.-7p.m. 12p.m–2p.m. 5p.m.-7p.m.
A1 3910 9 D1 13090 29
A2 2718 12 D2 528 12
A3 2730 21 D3 61 14
A4 630 12 D4 61 12
A5 1258 5 D5 55 24
A6 1097 1 D6 200 59
A7 1097 25 D7 95 58
A8 723 6 D8 99 127
A9 724 4 D9 143 62
A10 719 3
A11 715 3 D10 59 30
D11 60 18
B1 11180 21
B2 566 12 E1 10190 21
B3 161 12 E2 2690 8
B4 82 12 E3 146 6
B5 50 5 E4 45 24
B6 143 6 E5 73 23
B7 145 25 E6 193 60
B8 169 4 E7 39 65
B9 75 13 E8 130 118
B10 43 5 E9 100 122
B11 40 9 E10 150 10
C1 15270 29 F1 17680 7
C2 504 14 F2 1640 6
C3 123 12 F3 218 9
C4 63 9 F4 156 137
C5 66 9 F5 78 96
C6 185 83 F6 66 53
C7 139 70 F7 74 50
C8 202 29 F8 42 55
C9 110 100 F9 40 111
C10 108 42 F10 112 58
C11 98 15
PROJECT 1 LIGHTING & ACOUSTIC PERFORMANCE EVALUATION AND DESIGN OF YELLOW APRON CAFÉ
60 | P a g e
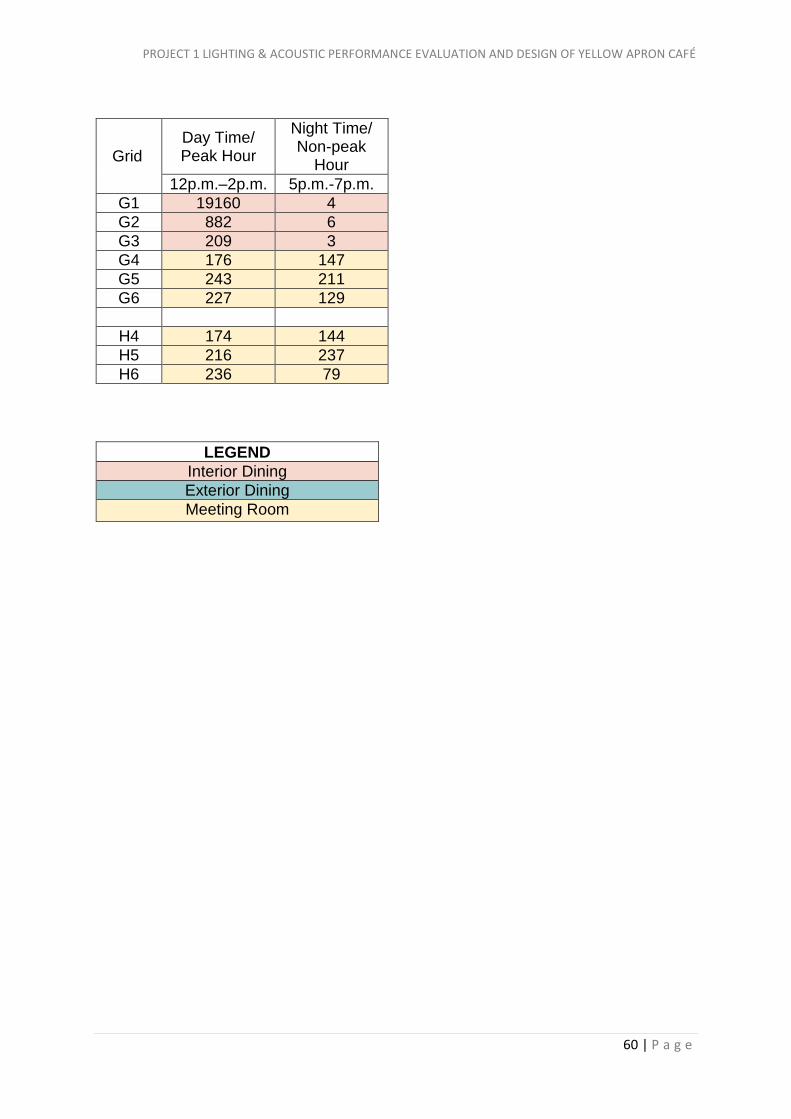
Grid Day Time/ Peak Hour
Night Time/ Non-peak
Hour
12p.m.–2p.m. 5p.m.-7p.m.
G1 19160 4
G2 882 6
G3 209 3
G4 176 147
G5 243 211
G6 227 129
H4 174 144
H5 216 237
H6 236 79
LEGEND
Interior Dining
Exterior Dining
Meeting Room

PROJECT 1 LIGHTING & ACOUSTIC PERFORMANCE EVALUATION AND DESIGN OF YELLOW APRON CAFÉ
61 | P a g e
3.4.1.2 First Floor Lux Reading
Grid Day Time/ Peak Hour
Night Time/ Non-peak
Hour
12p.m.–2p.m. 5p.m.-7p.m.
A1 2100 6
A2 1300 22
A3 1180 16
A4 3500 45
A5 60 11
B1 4600 117
B2 330 48
B3 200 52
B4 100 50
B5 180 32
C1 3200 107
C2 540 138
C3 70 64
C4 70 28
C5 190 43
D1 7200 157
D2 180 52
D3 50 29
Grid Day Time/ Peak Hour
Night Time/ Non-peak
Hour
12p.m.–2p.m. 5p.m.-7p.m.
E1 3700 147
E2 560 69
E3 80 39
F1 8400 32
F2 870 124
F3 150 136
F4 117 195
F5 104 142
G1 9000 76
G2 390 30
G3 100 9
G4 114 132
G5 118 129
H4 110 155
H5 118 198
LEGEND
Interior Dining
Exterior Dining
Meeting Room

PROJECT 1 LIGHTING & ACOUSTIC PERFORMANCE EVALUATION AND DESIGN OF YELLOW APRON CAFÉ
62 | P a g e
3.4.1.3 Observation & Discussion
Based on the Tables above, following observation were noted along with relevant
discussions.
Observation 1
Light data were collected for both during the peak hour/ day time and the non-peak
hour/ night time of the café. Light readings collected during peak hour are obviously
higher compared to the data collected during the non-peak hour.
Discussion 1
The major reason is because the peak hours of the café occur during the day time,
penetration of daylighting leads to the higher light reading compared to light reading
to the night time which have the contribution of acoustic lighting only.
Observation 2
Sequence of light density collected at different area: -
DENSITY OF LIGHT AREA
Highest Area near to the entrance and exterior
High Meeting room
Medium Coffee counter
Low Interior dining area
Discussion 2
AREA REASON
Entrance Material used at the entrance is glass wall, penetration of exterior day light increases the density of light at area near to the entrance
Meeting room Functional purpose which require this area to be bright enough for proper meeting and events
Coffee counter Functional purpose which require this area to have brighter light to carry out activities
Interior dining area Dim light is more than enough and suitable for users to enjoy this cozy ambient
PROJECT 1 LIGHTING & ACOUSTIC PERFORMANCE EVALUATION AND DESIGN OF YELLOW APRON CAFÉ
63 | P a g e
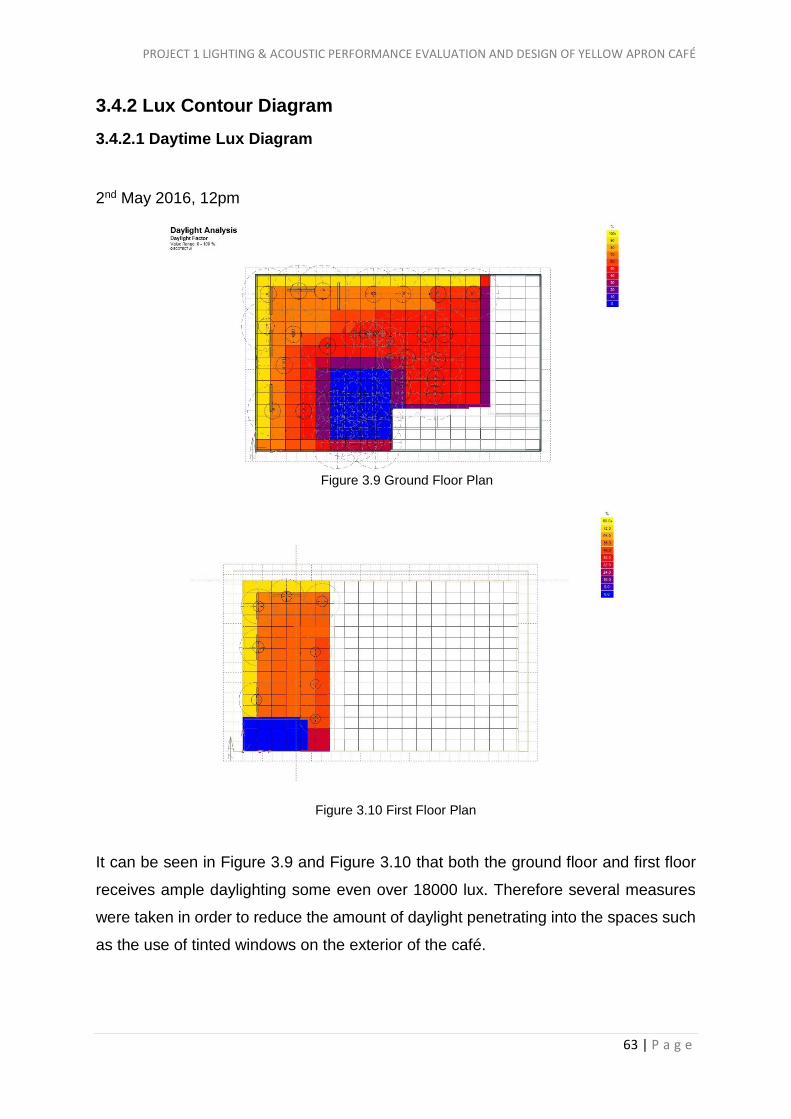
3.4.2 Lux Contour Diagram
3.4.2.1 Daytime Lux Diagram
2nd May 2016, 12pm
It can be seen in Figure 3.9 and Figure 3.10 that both the ground floor and first floor
receives ample daylighting some even over 18000 lux. Therefore several measures
were taken in order to reduce the amount of daylight penetrating into the spaces such
as the use of tinted windows on the exterior of the café.
Figure 3.10 First Floor Plan
Figure 3.9 Ground Floor Plan

PROJECT 1 LIGHTING & ACOUSTIC PERFORMANCE EVALUATION AND DESIGN OF YELLOW APRON CAFÉ
64 | P a g e
3.4.2.2 Artificial Lighting Lux Diagram
There is a lack of artificial lighting to brighten up the spaces such as dining area of
ground floor due to the café owner want to create relaxing and chilling feel. In Figure
3.11 and Figure 3.12, the space with the most ample amount of artificial lighting is
meeting room and the corner of the dining area. On the first floor, the artificial lighting
is slightly low as the area is more the outdoor sitting for smokers and because of the
placement of the accent light.
Figure 3.11 Ground Floor Plan
Figure 3.12 First Floor Plan

PROJECT 1 LIGHTING & ACOUSTIC PERFORMANCE EVALUATION AND DESIGN OF YELLOW APRON CAFÉ
65 | P a g e
3.4.3 Analysis & Calculation
3.4.3.1 Materials
A) Ground Floor
A) Ground Floor
Glass as the façade of café.
Ground floor all with a wood layer.
PROJECT 1 LIGHTING & ACOUSTIC PERFORMANCE EVALUATION AND DESIGN OF YELLOW APRON CAFÉ
66 | P a g e
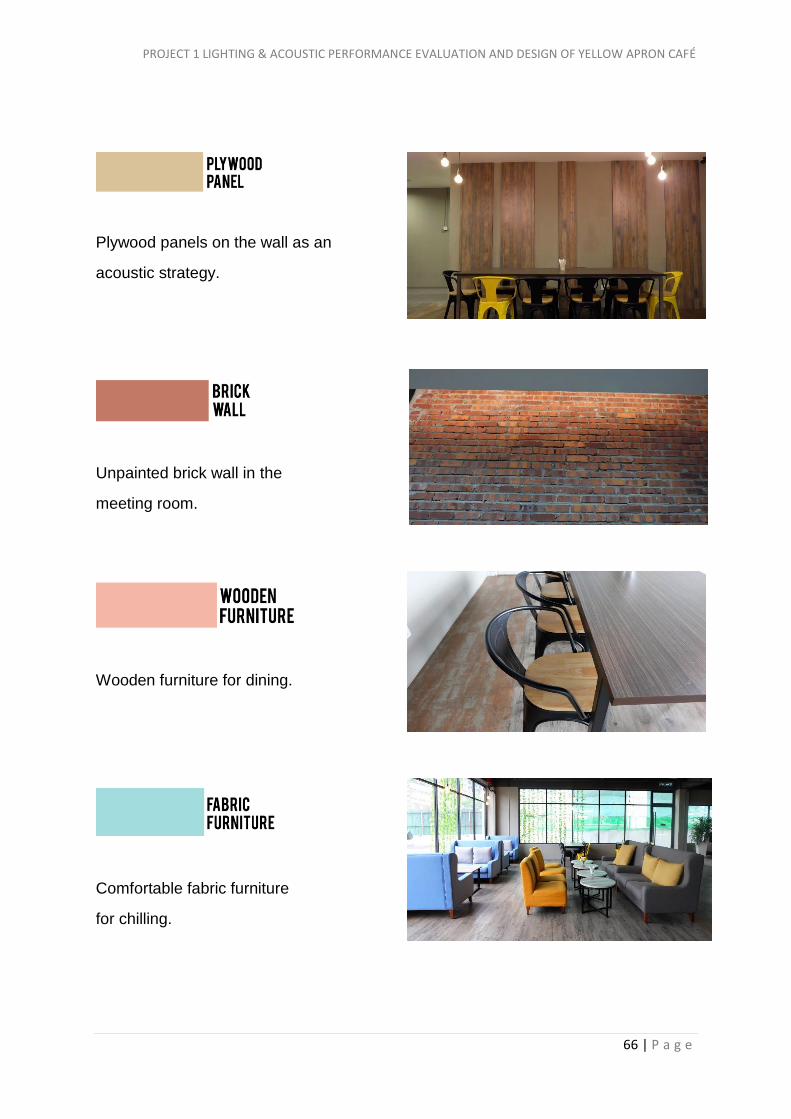
Plywood panels on the wall as an
acoustic strategy.
Unpainted brick wall in the
meeting room.
Wooden furniture for dining.
Comfortable fabric furniture
for chilling.

PROJECT 1 LIGHTING & ACOUSTIC PERFORMANCE EVALUATION AND DESIGN OF YELLOW APRON CAFÉ
67 | P a g e
B) First Floor
Concrete flooring for the
outdoor space.
Glass used to separate the
stairwell and upper floor.

PROJECT 1 LIGHTING & ACOUSTIC PERFORMANCE EVALUATION AND DESIGN OF YELLOW APRON CAFÉ
68 | P a g e
3.4.3.2 Lighting Sources
Product Brand Globe Edison E27 Filament Light Bulb
Lamp Luminous Flux 160 lumen
Rated Colour
Temperature 1800K
Colour Rendering
Index 100
Input 80-120V
Power 40W
Lumen Maintenance
Factor 0.7
Placement Ground Floor Ceiling
Product Brand PL-T Triple 4-Pin Base
Lamp Luminous Flux 2250 lumen
Rated Colour
Temperature 3500K
Colour Rendering
Index 82
Input 120V
Power 32W
Lumen Maintenance
Factor 0.7
Placement Ground Floor Ceiling & Meeting Room
Product Brand EcoVantage Halogen G25
Lamp Luminous Flux 500 lumen
Rated Colour
Temperature 2800K
Colour Rendering
Index 80
Input 120V
Power 40W
Lumen Maintenance
Factor 0.7
Placement Ground Floor Ceiling

PROJECT 1 LIGHTING & ACOUSTIC PERFORMANCE EVALUATION AND DESIGN OF YELLOW APRON CAFÉ
69 | P a g e
Product Brand LED - PAR16
Lamp Luminous Flux 500
Rated Colour
Temperature 2400K
Colour Rendering
Index 82
Input 220-240V
Power 7W
Lumen Maintenance
Factor 0.7
Placement First Floor Ceiling

PROJECT 1 LIGHTING & ACOUSTIC PERFORMANCE EVALUATION AND DESIGN OF YELLOW APRON CAFÉ
70 | P a g e
3.4.3.3 Indication of Light Sources and Light Distribution in Zone 1 (Ground
Floor Dining)

PROJECT 1 LIGHTING & ACOUSTIC PERFORMANCE EVALUATION AND DESIGN OF YELLOW APRON CAFÉ
71 | P a g e
SYMBOL PICTURE LIGHT TYPE UNIT LIGHT
DISTRIBUTION
LED – PAR 16
1
Globe Edison E27 Filament Light Bulb
8
EcoVantage Halogen G25
2
PL-T Triple 4-Pin Base
3
Globe Edison E27 Filament Light Bulb
13
PL-T Triple 4-Pin Base
3
PROJECT 1 LIGHTING & ACOUSTIC PERFORMANCE EVALUATION AND DESIGN OF YELLOW APRON CAFÉ
72 | P a g e
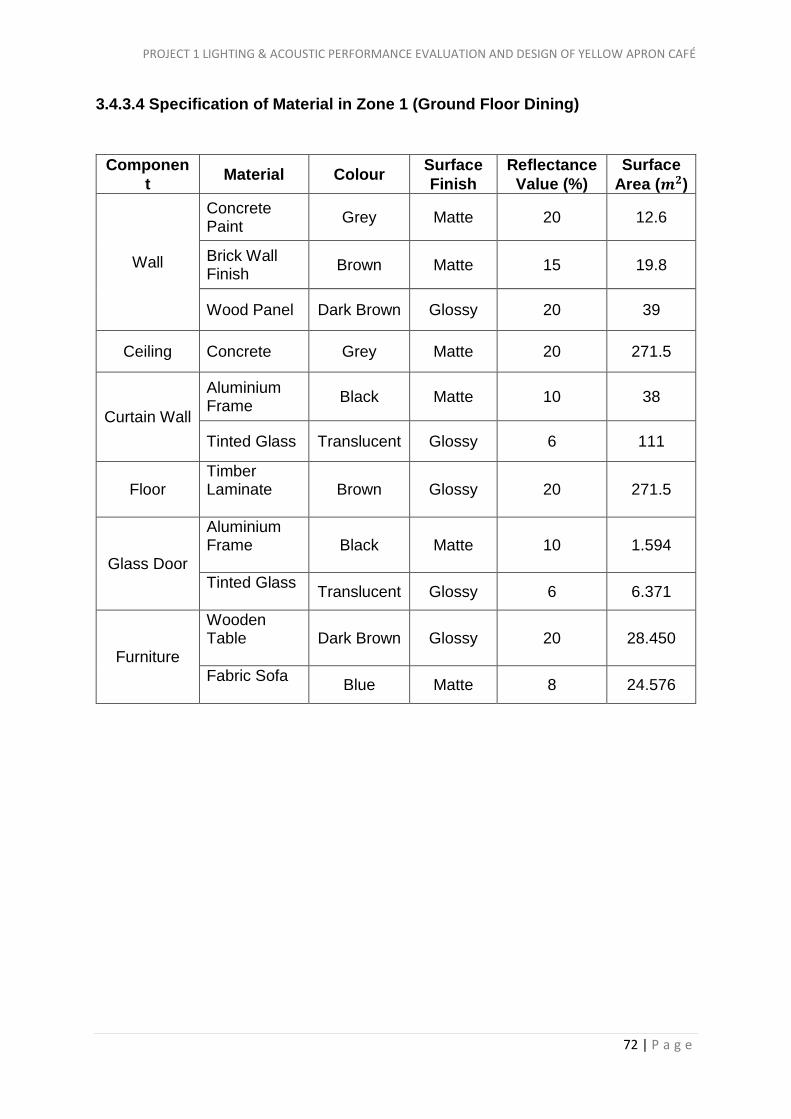
3.4.3.4 Specification of Material in Zone 1 (Ground Floor Dining)
Componen
t Material Colour
Surface
Finish
Reflectance
Value (%)
Surface
Area (𝒎𝟐)
Wall
Concrete Paint
Grey Matte 20 12.6
Brick Wall Finish
Brown Matte 15 19.8
Wood Panel Dark Brown Glossy 20 39
Ceiling Concrete Grey Matte 20 271.5
Curtain Wall
Aluminium Frame
Black Matte 10 38
Tinted Glass Translucent Glossy 6 111
Floor Timber Laminate
Brown Glossy 20 271.5
Glass Door
Aluminium Frame
Black Matte 10 1.594
Tinted Glass
Translucent Glossy 6 6.371
Furniture
Wooden Table
Dark Brown Glossy 20 28.450
Fabric Sofa
Blue Matte 8 24.576

PROJECT 1 LIGHTING & ACOUSTIC PERFORMANCE EVALUATION AND DESIGN OF YELLOW APRON CAFÉ
73 | P a g e
3.4.3.5 Calculation of Illuminance Level in Zone 1 (Ground Floor Dining)
Dimension od room (m)
19.47m x 14.03m
Total floor area / A (m²)
273.16m²
Type of lighting fixtures
Ceiling
Type of lighting LED Incandescent light (Type 1)
Incandescent light (Type 2)
Compact fluorescent
lamp
Number of lighting fixtures / N
1 21 2 6
Lumen of lighting fixture/ F
500 1800 500 2250
Height of luminaire (m)
2.8
Work level (m) 0.8
Mounting height / H (hm)
2.0
Assumption of reflectance value
Ceiling = 0.7 Wall = 0.5 Floor = 0.2
Room Index / RI (K)
K = ( 𝐿 𝑥 𝑀
( 𝐿 + 𝑀 ) ℎ𝑚 )
K = ( 19.47 𝑥 14.03
( 19.47 + 14.03 ) 2.0 )
= 4.08
Utilization factor / UF
0.71 0.68 0.68 0.68
Standard Luminance (lux)
200
Illuminance Level (lux) E =
( 𝑁 ( 𝐹 𝑥 𝑈𝐹 𝑥 𝑀𝐹 )
𝐴 )
E=(𝑁(𝐹 𝑥 𝑈𝐹 𝑥 𝑀𝐹)
𝐴)
=(1(500 𝑥 0.71 𝑥 0.8)
273.16)
=1.04
E=(𝑁(𝐹 𝑥 𝑈𝐹 𝑥 𝑀𝐹)
𝐴)
=(21(1800 𝑥 0.68 𝑥 0.8)
273.16)
=75.28
E=(𝑁(𝐹 𝑥 𝑈𝐹 𝑥 𝑀𝐹)
𝐴)
=(2(500 𝑥 0.68 𝑥 0.8)
273.16)
=1.99
E=(𝑁(𝐹 𝑥 𝑈𝐹 𝑥 𝑀𝐹)
𝐴)
=(6(2250 𝑥 0.68 𝑥 0.8)
273.16)
=26.89
Total illuminance level = 1.04 + 75.28 + 1.99 + 26.89
= 105.2
PROJECT 1 LIGHTING & ACOUSTIC PERFORMANCE EVALUATION AND DESIGN OF YELLOW APRON CAFÉ
74 | P a g e
According to the MS1525, the standard luminance for a dining area should be 200 lux.
However, according to the calculations, the dining area this zone does not meet the
standards with only 105.2 lux.
There is purpose for the designer to design such low light density in this area. The
main design of their café is to create a dim and soft ambient for the user to relax in this
area.

PROJECT 1 LIGHTING & ACOUSTIC PERFORMANCE EVALUATION AND DESIGN OF YELLOW APRON CAFÉ
75 | P a g e
3.4.3.6 Indication of Light Sources and Light Distribution in Zone 2 (Ground
Floor Meeting Room)
SYMBOL PICTURE LIGHT TYPE UNIT LIGHT
DISTRIBUTION
PL-T Triple 4-Pin Base
12

PROJECT 1 LIGHTING & ACOUSTIC PERFORMANCE EVALUATION AND DESIGN OF YELLOW APRON CAFÉ
76 | P a g e
3.4.3.7 Specification of Material in Zone 2 (Ground Floor Meeting Room)
Componen
t Material Colour
Surface
Finish
Reflectance
Value (%)
Surface
Area (𝒎𝟐)
Wall
Concrete Paint
Grey Matte 20 12.6
Brick Wall Finish
Brown Matte 15 19.8
Wood Panel Dark
Brown Glossy 20 6
Ceiling Concrete Grey Matte 20 52.8
Floor
Timber Laminate
Brown Glossy 20 52.8
Furniture
Wooden Table
Dark Brown
Glossy 20 8.308
Timber Chair
Brown Matte 10 7
PROJECT 1 LIGHTING & ACOUSTIC PERFORMANCE EVALUATION AND DESIGN OF YELLOW APRON CAFÉ
77 | P a g e
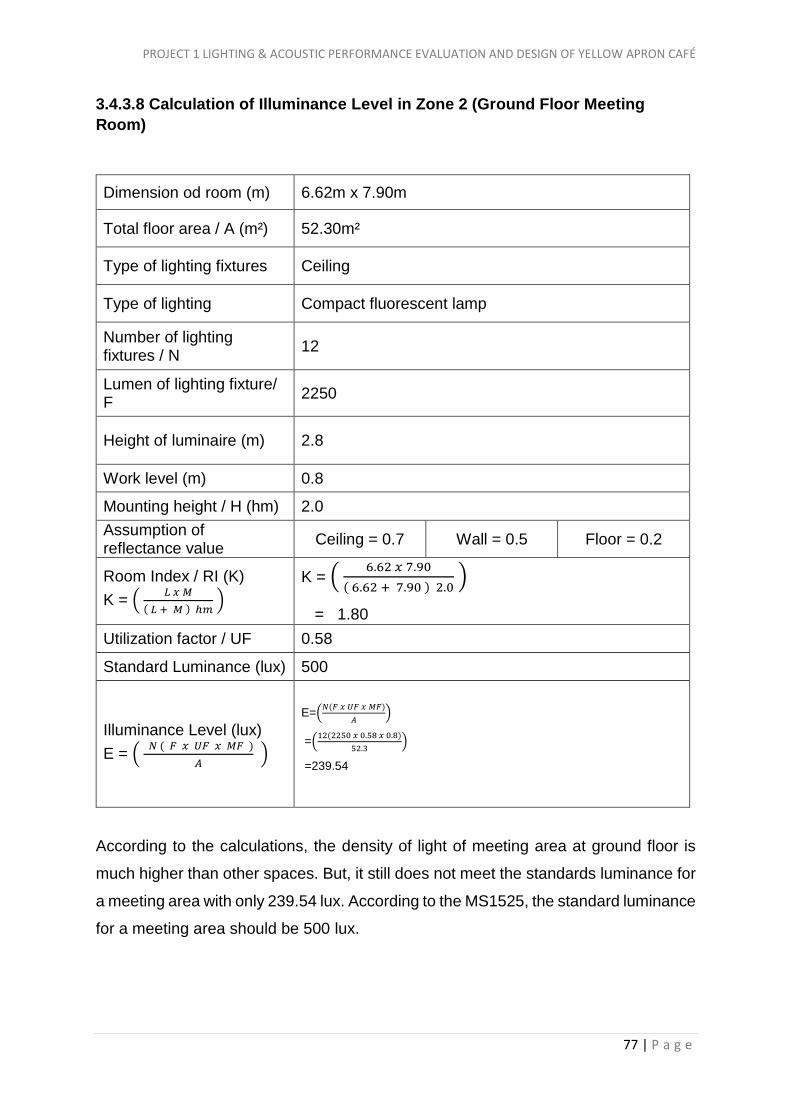
3.4.3.8 Calculation of Illuminance Level in Zone 2 (Ground Floor Meeting
Room)
Dimension od room (m) 6.62m x 7.90m
Total floor area / A (m²) 52.30m²
Type of lighting fixtures Ceiling
Type of lighting Compact fluorescent lamp
Number of lighting fixtures / N
12
Lumen of lighting fixture/ F
2250
Height of luminaire (m) 2.8
Work level (m) 0.8
Mounting height / H (hm) 2.0
Assumption of reflectance value
Ceiling = 0.7 Wall = 0.5 Floor = 0.2
Room Index / RI (K)
K = ( 𝐿 𝑥 𝑀
( 𝐿 + 𝑀 ) ℎ𝑚 )
K = ( 6.62 𝑥 7.90
( 6.62 + 7.90 ) 2.0 )
= 1.80
Utilization factor / UF 0.58
Standard Luminance (lux) 500
Illuminance Level (lux)
E = ( 𝑁 ( 𝐹 𝑥 𝑈𝐹 𝑥 𝑀𝐹 )
𝐴 )
E=(𝑁(𝐹 𝑥 𝑈𝐹 𝑥 𝑀𝐹)
𝐴)
=(12(2250 𝑥 0.58 𝑥 0.8)
52.3)
=239.54
According to the calculations, the density of light of meeting area at ground floor is
much higher than other spaces. But, it still does not meet the standards luminance for
a meeting area with only 239.54 lux. According to the MS1525, the standard luminance
for a meeting area should be 500 lux.

PROJECT 1 LIGHTING & ACOUSTIC PERFORMANCE EVALUATION AND DESIGN OF YELLOW APRON CAFÉ
78 | P a g e
3.4.3.9 Indication of Light Sources and Light Distribution in Zone 3 (First Floor
Dining)
SYMBOL PICTURE LIGHT TYPE UNIT LIGHT
DISTRIBUTION
LED – PAR16 12

PROJECT 1 LIGHTING & ACOUSTIC PERFORMANCE EVALUATION AND DESIGN OF YELLOW APRON CAFÉ
79 | P a g e
3.4.3.10 Specification of Material in Zone 3 (First Floor Dining)
Componen
t Material Colour
Surface
Finish
Reflectance
Value (%)
Surface
Area (𝒎𝟐)
Wall Paint Black Matte 20 30.249
Ceiling Paint Black Matte 20 122.97
Curtain Wall Clear Glass Translucent Glossy 6 40.5
Floor Concrete
Grey Glossy 20 122.97
Furniture
Wooden Table
Dark Brown Glossy 20 11.34
Fabric Sofa
Blue Matte 8 19.39
Timber Chair
Brown Matte 10 13.32
PROJECT 1 LIGHTING & ACOUSTIC PERFORMANCE EVALUATION AND DESIGN OF YELLOW APRON CAFÉ
80 | P a g e
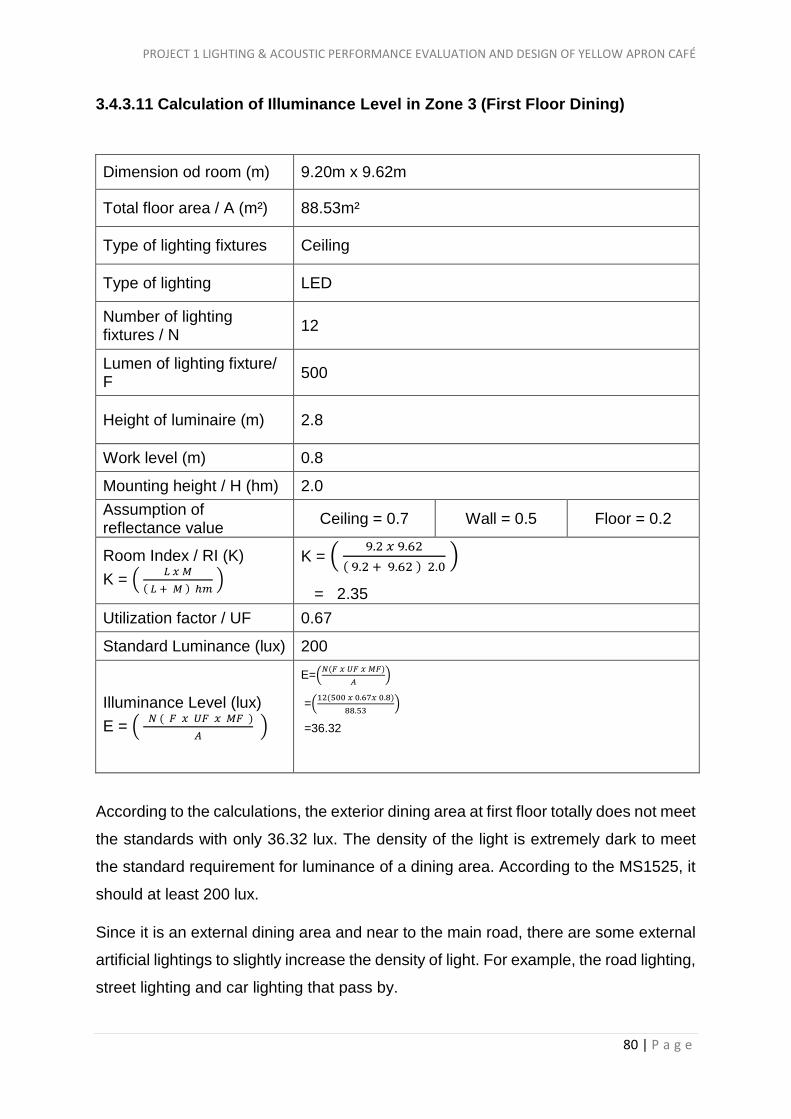
3.4.3.11 Calculation of Illuminance Level in Zone 3 (First Floor Dining)
Dimension od room (m) 9.20m x 9.62m
Total floor area / A (m²) 88.53m²
Type of lighting fixtures Ceiling
Type of lighting LED
Number of lighting fixtures / N
12
Lumen of lighting fixture/ F
500
Height of luminaire (m) 2.8
Work level (m) 0.8
Mounting height / H (hm) 2.0
Assumption of reflectance value
Ceiling = 0.7 Wall = 0.5 Floor = 0.2
Room Index / RI (K)
K = ( 𝐿 𝑥 𝑀
( 𝐿 + 𝑀 ) ℎ𝑚 )
K = ( 9.2 𝑥 9.62
( 9.2 + 9.62 ) 2.0 )
= 2.35
Utilization factor / UF 0.67
Standard Luminance (lux) 200
Illuminance Level (lux)
E = ( 𝑁 ( 𝐹 𝑥 𝑈𝐹 𝑥 𝑀𝐹 )
𝐴 )
E=(𝑁(𝐹 𝑥 𝑈𝐹 𝑥 𝑀𝐹)
𝐴)
=(12(500 𝑥 0.67𝑥 0.8)
88.53)
=36.32
According to the calculations, the exterior dining area at first floor totally does not meet
the standards with only 36.32 lux. The density of the light is extremely dark to meet
the standard requirement for luminance of a dining area. According to the MS1525, it
should at least 200 lux.
Since it is an external dining area and near to the main road, there are some external
artificial lightings to slightly increase the density of light. For example, the road lighting,
street lighting and car lighting that pass by.
PROJECT 1 LIGHTING & ACOUSTIC PERFORMANCE EVALUATION AND DESIGN OF YELLOW APRON CAFÉ
81 | P a g e
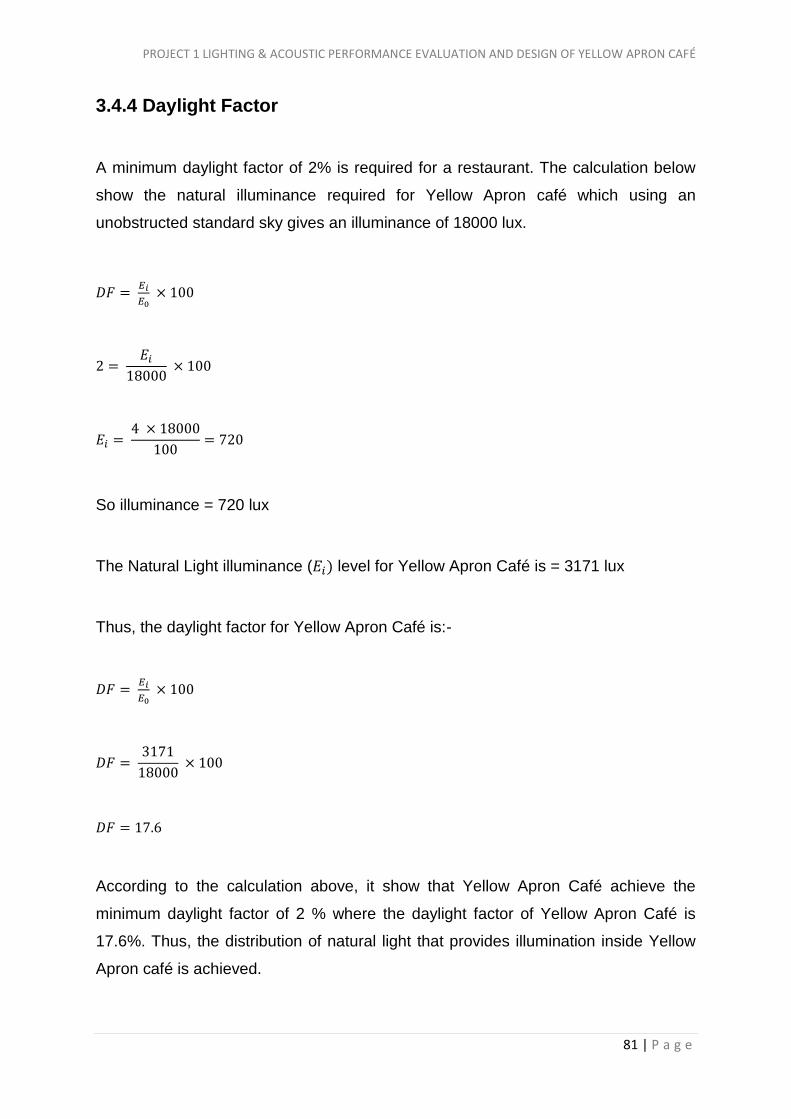
3.4.4 Daylight Factor
A minimum daylight factor of 2% is required for a restaurant. The calculation below
show the natural illuminance required for Yellow Apron café which using an
unobstructed standard sky gives an illuminance of 18000 lux.
𝐷𝐹 = 𝐸𝑖
𝐸0 × 100
2 = 𝐸𝑖
18000 × 100
𝐸𝑖 = 4 × 18000
100= 720
So illuminance = 720 lux
The Natural Light illuminance (𝐸𝑖) level for Yellow Apron Café is = 3171 lux
Thus, the daylight factor for Yellow Apron Café is:-
𝐷𝐹 = 𝐸𝑖
𝐸0 × 100
𝐷𝐹 = 3171
18000 × 100
𝐷𝐹 = 17.6
According to the calculation above, it show that Yellow Apron Café achieve the
minimum daylight factor of 2 % where the daylight factor of Yellow Apron Café is
17.6%. Thus, the distribution of natural light that provides illumination inside Yellow
Apron café is achieved.
PROJECT 1 LIGHTING & ACOUSTIC PERFORMANCE EVALUATION AND DESIGN OF YELLOW APRON CAFÉ
82 | P a g e
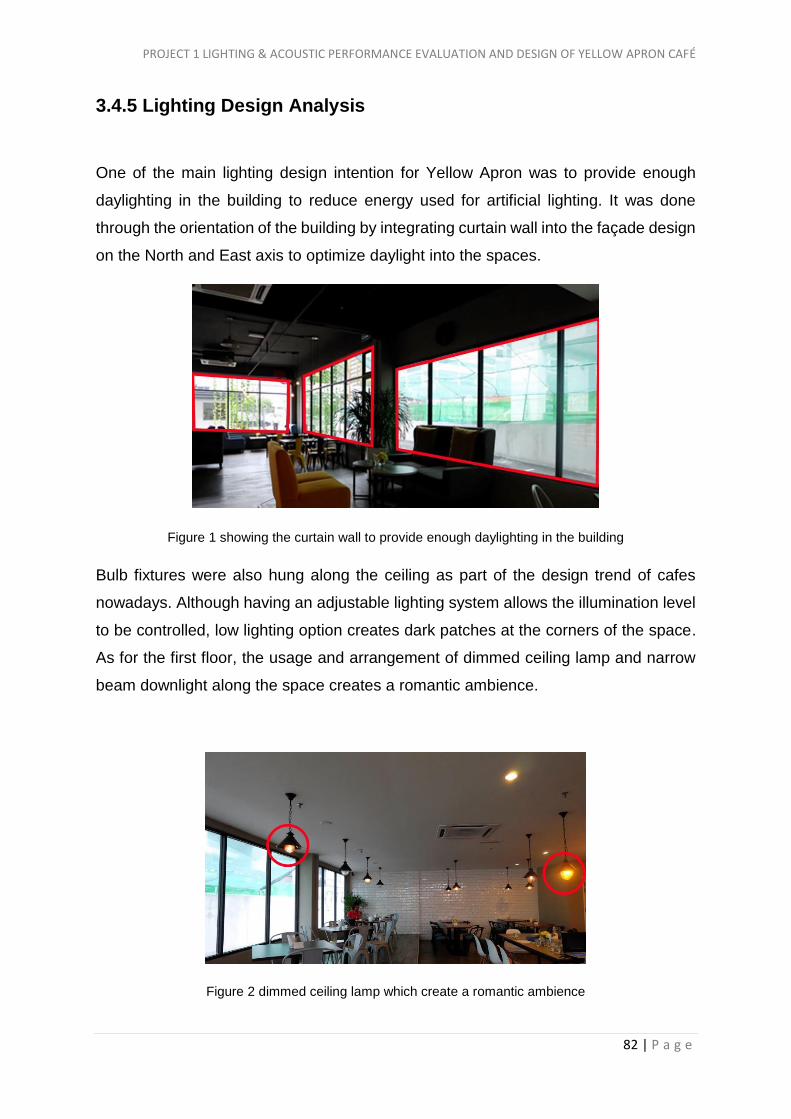
3.4.5 Lighting Design Analysis
One of the main lighting design intention for Yellow Apron was to provide enough
daylighting in the building to reduce energy used for artificial lighting. It was done
through the orientation of the building by integrating curtain wall into the façade design
on the North and East axis to optimize daylight into the spaces.
Figure 1 showing the curtain wall to provide enough daylighting in the building
Bulb fixtures were also hung along the ceiling as part of the design trend of cafes
nowadays. Although having an adjustable lighting system allows the illumination level
to be controlled, low lighting option creates dark patches at the corners of the space.
As for the first floor, the usage and arrangement of dimmed ceiling lamp and narrow
beam downlight along the space creates a romantic ambience.
Figure 2 dimmed ceiling lamp which create a romantic ambience
PROJECT 1 LIGHTING & ACOUSTIC PERFORMANCE EVALUATION AND DESIGN OF YELLOW APRON CAFÉ
83 | P a g e
Most of the interior finishes were specifically selected to improve the light reflection
and provide better lighting. To allow natural lighting to penetrate through in the morning
and reflects during the night, Yellow Apron use glass for doors, walls and windows.
There is no shading devices included such as louvres and overhangs, as to allows
maximum amount of sunlight and therefore glare from outside is possible with the high
luminosity from the sun.
White tile finishing on walls reflects and spreads light due to its shiny surface, hence
contributing the illumination of spaces. Laminated timber flooring also helps to reflect
and spread the light.
Figure 3 Shiny white tile finishing reflects light
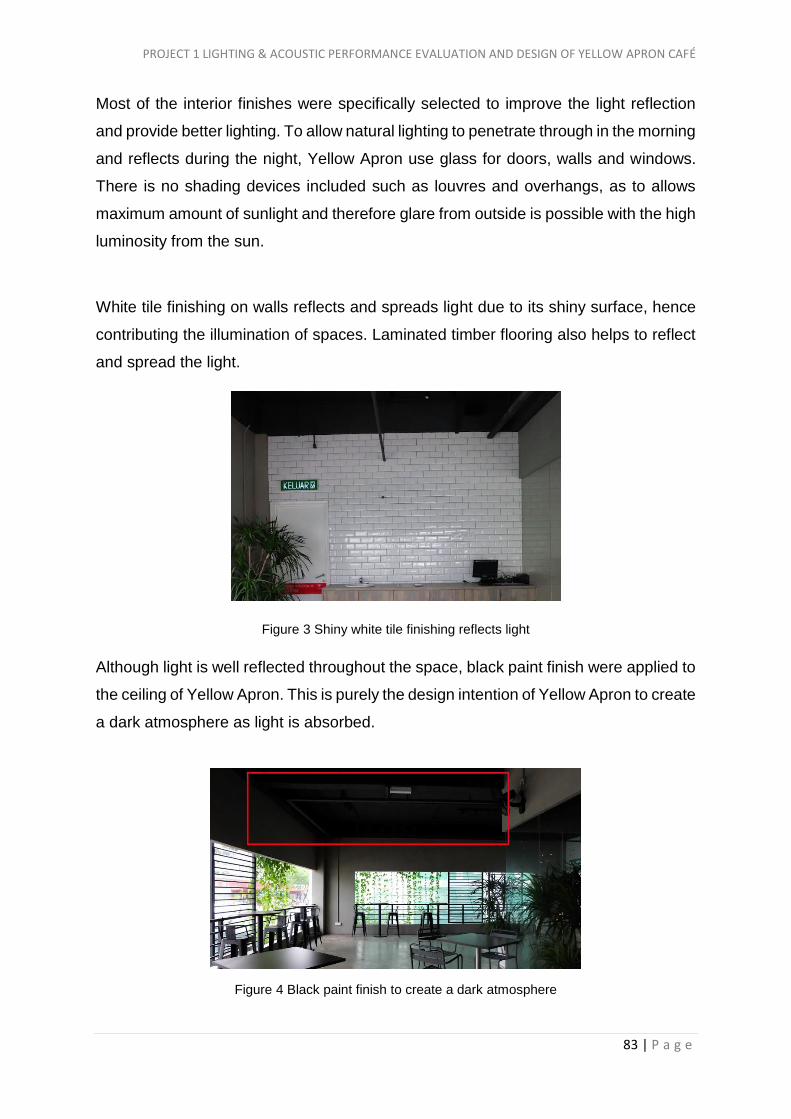
Although light is well reflected throughout the space, black paint finish were applied to
the ceiling of Yellow Apron. This is purely the design intention of Yellow Apron to create
a dark atmosphere as light is absorbed.
Figure 4 Black paint finish to create a dark atmosphere

PROJECT 1 LIGHTING & ACOUSTIC PERFORMANCE EVALUATION AND DESIGN OF YELLOW APRON CAFÉ
84 | P a g e
3.4.6 Conclusion for Lighting Analysis
Based on our data collections, it can be conclude that Yellow Apron has a dim
environment that lacks of artificial lighting. The use of dim light bulbs however has
become a trend in many café’s and provides a very calm ambience for the customers.
During day time, the restaurant receives sufficient day lighting focuses on certain area
with the aid of glass wall at the entrance and the side of the café. As for the night
lightings, we found that Yellow Apron are primarily using atmospheric overhead
lighting, and the lux meter reading shows that the café lacks lighting giving a general
dim environment as this might be the general idea of the café owner.
In order to create a pleasing working environment, Yellow Apron should have
additional lightings to put on. For example zone E-1, G4 and B6-B12 for ground floor,
lacks the requirement of MS1525. Different arrangement can be applied with the
combination of several types of luminaires in the spaces. Florescent can also be added
to create equal luminance throughout the space as beam angle spreads. Other than
that, up lights can also be added to shine upward casting pools of light on the surface
above them and when placed on the floor, behind plants, and in corners, add to the
atmosphere by creating dramatic shadows. Furthermore, use wall washers on textured
walls in Yellow Apron. Up lighting can be added to show off the texture of popular wall
finishes like untreated wood or hand-applied plaster. The sharp angle of the light
catches any variation in the surface it shines upon, creating sharp shadows that give
the walls life and dimension. These wall washer fixtures are sometimes tucked behind
booths or banquettes, or embedded in the top of wainscoting. White or gently warm
LED light can be added so foods and people look much better under white light than
they do under intense colours. Besides that, the exterior lighting of Yellow Apron needs
to be improved too. The outside lights often make the first impression of customers
and they can attract customers passing by into the café.

PROJECT 1 LIGHTING & ACOUSTIC PERFORMANCE EVALUATION AND DESIGN OF YELLOW APRON CAFÉ
85 | P a g e
4.0 Conclusion
Based on our evaluation and data collection, it can be concluded that Yellow Apron
Café has a dim environment that has no sufficient artificial lighting. The café receives
a lot of day lighting with the aid of glass wall at the entrance and dining area. The café
located at the corner of a row of shop lots thus, giving the maximum day lighting
through the side glass and front glass. As for the night lightings, it is found that Yellow
Apron Café are primarily using filament light bulbs. Spot lights at the same time are
arranged directed towards the sitting area at the first floor dining area. Through our
observation and evaluation of the space and sitting area, we feel that the lightings in
ground floor are slightly dim for readings but as for the first floor, the spot lights are
very effective where the light beam was sufficient for reading and perform other
activities. In order to improve lighting, additional lightings should be put on.
On the other hand, it can be seen that the noise levels are higher on first floor due to
the fact that it is an open space caused by the surrounding context such as vehicles
and construction site next to the café. Noises generated on the ground floor are mainly
from the open kitchen where the drinks are being served. However, some measures
were taken in order to increase the comfort of the environment such as installing
speakers to function as a mask. The speakers are strategically located in the dining
areas in close proximity to the customers. The use of wood aids in the sound
absorption especially in the ground floor.
Aesthetically, Yellow Apron Café managed to provide its customers a very cozy and
relaxing environment for the customers to dine in despite not meeting the minimal
requirements for lighting. In terms of acoustics, the playlist consists of a very calm
acoustic set which is to the liking of their customers.

PROJECT 1 LIGHTING & ACOUSTIC PERFORMANCE EVALUATION AND DESIGN OF YELLOW APRON CAFÉ
86 | P a g e
4.1 References
ABSORPTION COEFFICIENTS. (n.d.).
Retrieved May 25, 2016, from
http://www.acoustic.ua/st/web_absorption_dat
a_eng.pdf
Ambrose, J., & Olswang, J. (1995). Simplified
Design for Building Sound Control (1st ed., p.
161). Wiley-Interscience.
Bals, J. & Day, C. (2003). A study of illumination
and light distribution within the art room. Ball
State University, Indiana, United States
Fraser, N. (1998). Lighting and sound. Oxford:
Phaidon.
Absorption coefficients building materials
finishes RT60 alpha coefficient acoustic
absorbing absorption floor seating wall ceiling
miscellaneous materials – sengpielaudio
Sengpjel Berlin. (n.d). Retrieved May 27, 2016,
from http://www.sengpielaudio.com/calculator-
RT60Coeff.htm
Sound Absorption Coefficients. (n.d.).
Retrieved May 27, 2016, from
http://www.acousticalsurfaces.com/acoustic_I
OI/101_13.htm