brisbane cbd - knight frankcontent.knightfrank.com/research/332/documents/en/briscbd1705-4691… ·...
TRANSCRIPT
HIGHLIGHTS
RESEARCH
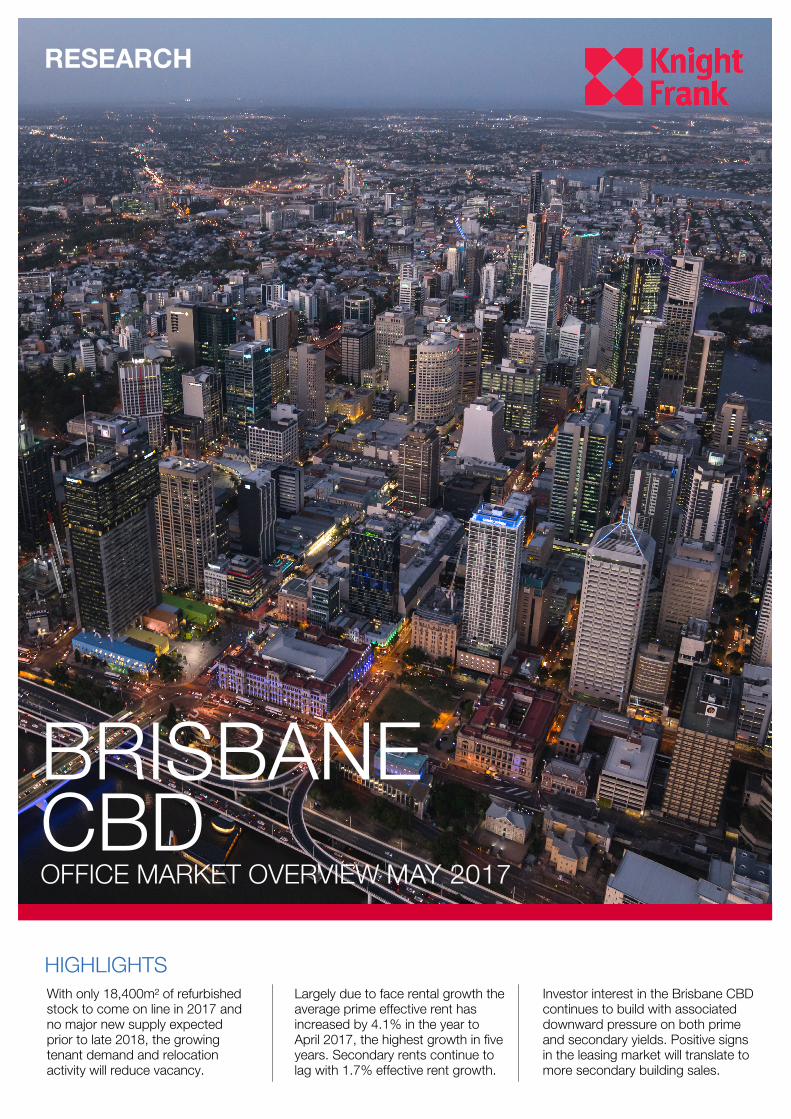
BRISBANE CBD OFFICE MARKET OVERVIEW MAY 2017
With only 18,400m² of refurbished stock to come on line in 2017 and no major new supply expected prior to late 2018, the growing tenant demand and relocation activity will reduce vacancy.
Largely due to face rental growth the average prime effective rent has increased by 4.1% in the year to April 2017, the highest growth in five years. Secondary rents continue to lag with 1.7% effective rent growth.
Investor interest in the Brisbane CBD continues to build with associated downward pressure on both prime and secondary yields. Positive signs in the leasing market will translate to more secondary building sales.

2
KEY FINDINGS Total vacancy was 15.3% as at
January 2017, down from the
cyclical high of 16.9% in mid-
2016 with further steady
improvement expected.
Greater leasing activity has
emerged, with upgrading and
cross border activity dominant.
Yields remain under downward
pressure as offshore investor
interest continues to build.
Greater activity in the secondary
market is expected for 2017.
Prime and secondary effective
rents grew by 4.1% p.a and
1.7% p.a respectively as the
rental cyclical low point is in the
past.
JENNELLE WILSON Senior Director — Research QLD
SUPPLY & DEVELOPMENT
TABLE 1
Brisbane CBD Office Market Indicators as at April 2017
Grade Total Stock
(m²)^
Vacancy
Rate (%)^
Annual Net
Absorption
(m²)^
Annual Net
Additions (m²)^
Average
Gross Face
Rent ($/m²)
Average
Incentive
(%)
Average Core
Market Yield (%)*
Prime 1,253,800 12.0 152,505 185,427 729 36.5 5.90—7.00
Secondary 1,026,255 19.4 -57,904 -62,712 560 39.5 7.45—9.30
Total 2,280,055 15.3 94,601 122,715
With no new stock additions expected during 2017, and for at least the majority of 2018, the market has the opportunity to re-balance. With increased tenant activity already in evidence this will further spur investment.
constructed to podium level as part of
the three tower mixed use development,
with the hotel and residential towers
under construction.
Following Origin’s 16,250m² commitment
to 180 Ann St and Telstra re-committing
for 10 years to 19,000m²+ at 275 George
St, the number of tenants with the
potential to trigger new construction
remains limited. Suncorp is expected to
soon come to the market with a brief for
20,000—40,000m² from late 2020.
Additionally the State Government
remains a target for developers with a
number of tenancies remaining in older
buildings. Apart from 300 George St,
other proposed supply includes Dexus’s
Blue Tower Annex (6,300m²), ISPT’s 150
Elizabeth St (c35,000m²) and Mirvac’s 80
Ann St (c55,000m²) where they currently
hold an option to purchase the site. For
longer term supply, interest is intensifying
in amalgamating a site in Queen Street.
Withdrawal of obsolete stock during 2016
somewhat offset the high supply levels,
with 64,332m² permanently withdrawn for
change of use, the bulk of which formed
the Queens Wharf site (57,676m²). In
2017 withdrawals will still be dominated
by former State Government occupied
assets such as 80 Ann St (14,429m²
permanent withdrawal) and the Health &
Forestry Buildings (26,651m² withdrawn
for refurbishment). Formerly slated for
conversion into student accommodation
the Health & Forestry buildings will now
undergo major refurbishment and remain
as office space.
There was a brief, but strong, supply
cycle for the Brisbane CBD in 2016,
adding 190,987m² of new stock. However
the coming two years will feature far
lower supply. The majority of this supply
was added to the premium market which
grew by 64% over 2016 from 1 William St
(75,853m²) and 480 Queen St (54,985m²).
These were the first premium additions
since the completion of 111 Eagle St in
2012 and brings the premium building
stock to 335,470m², still a relatively small
15% of the market.
The other major completion, in early
2016, was the A grade 180 Ann St
(57,465m²). Of the three buildings
completed last year, very little space
remains available. 1 William St is fully
committed by the State Government, 480
Queen St has 8,800m² of sub-lease
space largely within the low-rise podium,
and 180 Ann St is now 83% committed.
The recent commitment by Origin to eight
floors (c16,250m²) on a 17 year term at
180 Ann St means only a few low rise
floors remain available, with most of
these under offer.
In the short term, the return of the
refurbished 310 Ann St (18,450m²) will be
the only significant addition to the CBD
market in 2017. In terms of new
construction the hiatus is expected to last
unit late 2018/early 2019 when the
Shayher Group’s 300 George St is
expected to be completed. Considered
the most likely of the current proposals to
proceed in the short term, the office
tower of up to 47,000m² is already
Source: Knight Frank Research/PCA ^ as at January 2017 *WALE 4-6 years
3
RESEARCH BRISBANE CBD OFFICE MAY 2017
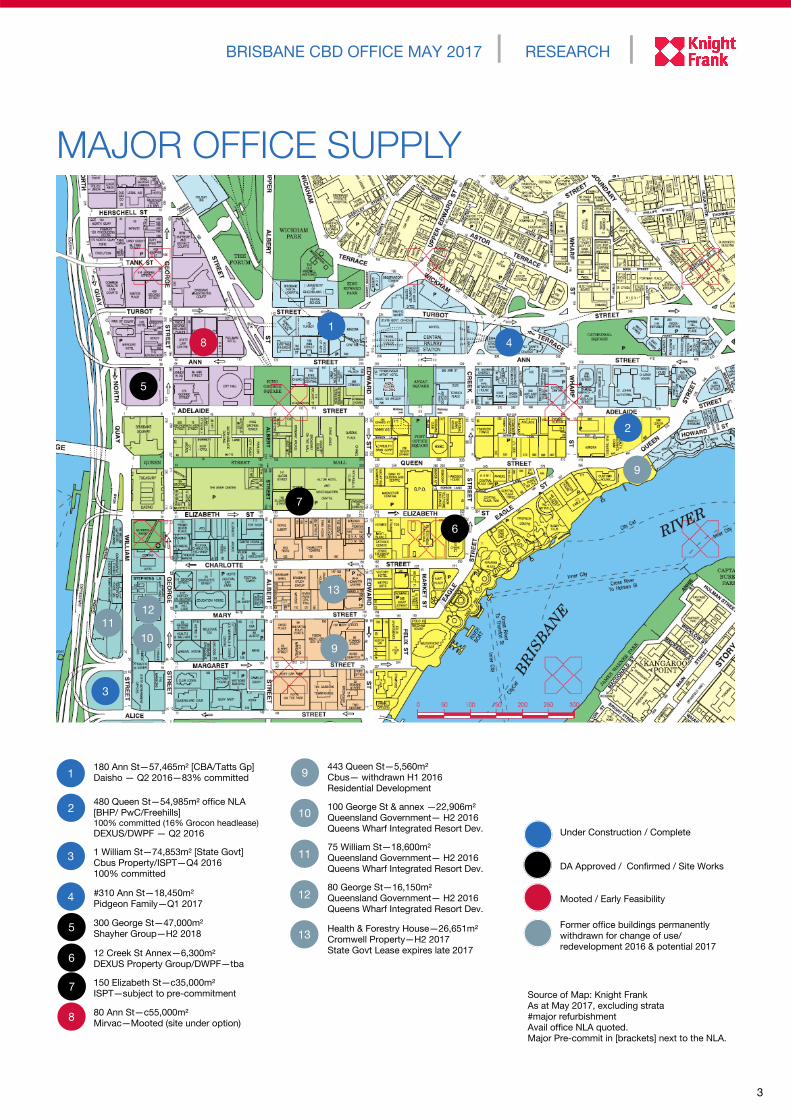
MAJOR OFFICE SUPPLY
180 Ann St—57,465m² [CBA/Tatts Gp]
Daisho — Q2 2016—83% committed
480 Queen St—54,985m² office NLA
[BHP/ PwC/Freehills] 100% committed (16% Grocon headlease)
DEXUS/DWPF — Q2 2016
1 William St—74,853m² [State Govt]
Cbus Property/ISPT—Q4 2016
100% committed
#310 Ann St—18,450m²
Pidgeon Family—Q1 2017
300 George St—47,000m²
Shayher Group—H2 2018
12 Creek St Annex—6,300m²
DEXUS Property Group/DWPF—tba
150 Elizabeth St—c35,000m²
ISPT—subject to pre-commitment
80 Ann St—c55,000m²
Mirvac—Mooted (site under option)
1
2
443 Queen St—5,560m²
Cbus— withdrawn H1 2016
Residential Development
100 George St & annex —22,906m²
Queensland Government— H2 2016
Queens Wharf Integrated Resort Dev.
75 William St—18,600m²
Queensland Government— H2 2016
Queens Wharf Integrated Resort Dev.
80 George St—16,150m²
Queensland Government— H2 2016
Queens Wharf Integrated Resort Dev.
Health & Forestry House—26,651m²
Cromwell Property—H2 2017
State Govt Lease expires late 2017
Under Construction / Complete
DA Approved / Confirmed / Site Works
Mooted / Early Feasibility
Former office buildings permanently
withdrawn for change of use/
redevelopment 2016 & potential 2017
Source of Map: Knight Frank
As at May 2017, excluding strata
#major refurbishment
Avail office NLA quoted.
Major Pre-commit in [brackets] next to the NLA.
9
3
4
5
6
7
3
10
11
12
13
8
7
1
2
4
5
12
9
6
10 9
11
13
8

4
Tenant demand has continued to
improve across the Brisbane CBD in the
early months of 2017 with the good
levels of enquiry from smaller tenants
beginning to broaden into the larger size
brackets. Total vacancy for the CBD has
reduced from 16.9% as at July 2016 to
15.3% in January 2017 with the
highpoint for this cycle now in the past.
Although Knight Frank believes there are
some one-off/calculation factors which
have increased the magnitude of the
vacancy rate decline, there is a real
sense that the leasing market has turned
the corner.
While the prime market vacancy is higher
than a year ago at 12.0% (as at January
2017), it has reduced from the recent
high-point of 15.7% in mid-2016. With
the highpoint triggered by the new
supply additions the speed at which it
has reduced indicates how quickly the
backfill space has largely been absorbed.
With much of this backfill space offered
as sub-lease, the space was largely
absorbed by opportunistic tenants at
discounted rents. Given the continued
trend to upgrading within the market it is
expected that the prime vacancy will
continue to contract.
Secondary vacancy was 19.4% as at
January 2017 as the total vacancy rate
remains stubbornly high. While the total
secondary vacant area has reduced from
203,960m² to 199,152m² over the past
year the vacancy rate has remained high
as a number of formerly fully occupied
buildings (State Govt) have been
withdrawn.
While there is definite positivity in the
Brisbane CBD leasing market, Knight
Frank believes the above figures
represent an element of overstatement
for the second half of 2017. In part this is
due to the complexity of the State
Government’s upgrading of their office
accommodation, spear-headed by the
move to occupy the whole of the newly
completed 1 William St. Beyond the
buildings to be demolished for the
Queens Wharf site, there are a further two
buildings which are in the process of
being vacated by the State Government.
These are 80 Ann St (14,429m²) where
the lease to the State expired in February
2017 and Health & Forestry House
(26,651m²) 147-163 Charlotte St & 142-
160 Mary St which has a lease in place to
the State until December 2017. Counting
these buildings as fully occupied, as well
as 1 William St, overstates the net
absorption by circa 40,000m².
Nevertheless the recent net absorption
result for the CBD represents continued
good rebounding for office demand,
particularly given Flight Centre’s
relocation out of the CBD to the Fringe
market. The underlying net absorption is
expected to continue to grow through
2017 with inflows from the Fringe market
building. However as the remaining state
government buildings are vacated the
numbers for 2017 are expected to
understate underlying market activity.
FIGURE 2
Brisbane CBD Vacancy % total vacancy
Source: Knight Frank Research/PCA
Net Absorption
Following three years of negative net
absorption, the Brisbane CBD has
recovered over the past 12 months with a
total of 94,601m² absorbed according to
the PCA survey. This was dominated by
the prime market with a total of
152,505m² absorbed, largely due to take-
up in the newly completed buildings and
solid take-up of associated prime backfill
space. In contrast the secondary market
saw negative net absorption of 57,904m²
as obsolete space was vacated and in
many cases also withdrawn from stock.
In the prime market good net absorption
was recorded in both the premium
(89,590m²) and A Grade (18,127m²)
sectors. The particularly high premium
net absorption was largely due to the
completion of 1 William St (75,853m²)
which was fully leased to the State
Government (relocating from lower grade
buildings) making the whole of the
building NLA a net gain for premium
grade. Additionally there was continued
high absorption of backfill sub-lease
space in premium buildings such as 123
Eagle St and 71 Eagle St. This resulted in
the total premium vacancy reducing from
21.1% in mid-2016, to 12.2% as at
January, with the premium sub-lease
vacancy also falling from 14.1% to 4.4%.
FIGURE 1
Brisbane CBD Net Absorption (‘000m²) per 6 month period
TENANT DEMAND & RENTS
TABLE 2
Brisbane CBD—Vacancy Rates
Precinct Jan 16 Jan 17
Premium 9.6% 12.2%
A Grade 11.3% 11.9%
Prime 11.0% 12.0%
B Grade 19.4% 19.7%
C Grade 16.6% 19.6%
D Grade 17.8% 14.5%
Secondary 18.7% 19.4%
Totals 14.9% 15.3%
Source: Knight Frank Research/PCA
Source: Knight Frank Research/PCA
-80
-70
-60
-50
-40
-30
-20
-10
0
10
20
30
40
50
60
Jan-1
3
Jul-1
3
Jan-1
4
Jul-1
4
Jan-1
5
Jul-1
5
Jan-1
6
Jul-1
6
Jan-1
7
Jul-1
7
Jan-1
8
Jul-1
8
Jan-1
9
Jul-1
9
Jan-2
0
six months to
NET ABSORPTION POTENTIAL NET ABSORPTION OVERSTATEMENT
projection
0%
2%
4%
6%
8%
10%
12%
14%
16%
18%
Jan-0
6
Jan-0
7
Jan-0
8
Jan-0
9
Jan-1
0
Jan-1
1
Jan-1
2
Jan-1
3
Jan-1
4
Jan-1
5
Jan-1
6
Jan-1
7
Jan-1
8
Jan-1
9
projection

5
RESEARCH BRISBANE CBD OFFICE MAY 2017
St and Origin Energy-16,250m²
consolidating from Milton to 180 Ann St).
Further relocation of Fringe tenants into
the CBD is expected over the course of
2017 with Allianz (c8,000m²) considering
a CBD location.
The demand from smaller tenants sub-
250m² has continued to form a large part
of the number of deals underway in the
CBD market, particularly within
speculatively fitted out suites. The ease of
choice for speculative suites as well as
the generally shorter lead time has
continued to encourage and foster
mobility for these smaller tenants. Over
the past six months the tenant demand
has not been aligned with any particular
industry with steady activity across the
board with IT (Digital Sense), Personnel
(Just Digital People, Attract People, Hays
Recruitment) and Building/consultancy
(Honeycombes, Conrad Gargett) and
Travel (China Eastern Airlines, Air NZ) all
active sectors.
Rental Levels
Brisbane prime gross effective rents have
begun to show some improvement after
reaching a low-point in January 2016 and
remaining stable for much of 2016. Prime
gross face rents currently average $729/
m², up by 3.3% over the past year. In the
same period incentives have fallen
slightly from an average of 37% to
36.5%, resulting in gross effective rental
growth of 4.1% over the 12 month
period. This is the highest level of
effective rental growth recorded since
Vacancy
The Brisbane CBD total vacancy rate
decreased to 15.3% as at January 2017,
from what will form the cyclical high of
16.9% in July 2016. This improvement
has occurred due to an increase in base
office demand and little backfill vacancy
created from the new supply. As
discussed above, the State Government
relocated into the newly completed, fully
leased building at 1 William St and at the
time created no backfill vacancy,
however some may emerge during 2017
if the buildings are not withdrawn from
stock.
Limited supply in 2017, comprising the
refurbished 310 Ann St, will assist to
bring the vacancy rate down over the
course of 2017 and 2018, reaching
12.4%, until significant anticipated
supply slows improvement in late 2018.
Tenant Demand
The trend towards greater tenant activity
has continued to build into early 2017.
Additionally there is now noticeably
greater tenant activity and mobility in
1,000m²+ tenants, a sector of the market
which had been lacking in activity until
recently. Upgrading remains a dominant
theme in the market whether in terms of
building grade (i.e. Qld Treasury—
2,830m² relocating from A to premium) or
from the Fringe markets into the CBD
(Sonic Health Plus—1,247m² moving and
consolidating from Spring Hill to 410 Ann
Source: Knight Frank Research
FIGURE 3
Brisbane CBD Rents $/m² p.a average gross effective rent
April 2012 when the resources boom was
in force.
Largely boosted by a better than
expected increase in gross face rents,
this rate of rental growth is higher than
was expected, given the considerable
vacancy which remains. However
sentiment has clearly turned with the lack
of new supply, improving leasing activity
and steady influx of tenants from the
Fringe having an impact on confidence.
Going forward gross effective rental
growth is forecast at 3.7% for the coming
12 months. As incentives remain
stubbornly high with only marginal falls,
the continued improvement to face rents
will be the greatest driver of rental
growth. In the longer term effective rental
growth expectations for the calendar
years of 2018—2020 will range between
5.0% and 6.0% per annum. Nevertheless
it will be mid-2019 before the effective
rent returns to levels seen in late 2009
($500+/m²), beyond the pre-GFC peak.
Secondary market rents have remained
quite flat with average incentives down
marginally to 39.5% from the peak of
40%. The gross face rent increased by
0.9% in the year to April 2017 to sit at
$560/m², with effective rents growing by
1.7% to $339/m². In the next year face
rental increases along with further minor
incentive firming will see gross effective
rental growth of 2.6% with the secondary
market expected to lag prime market
improvement in the near term.
TABLE 3
Recent Leasing Activity Brisbane CBD
Address NLA m²
Face
Rent
$/m²
Term
yrs
Incentive
(%)` Tenant
Start
Date
180 Ann St 16,250 undis 17 undis Origin Mar 18
295 Queen St 8,064 undis 10 undis NAB Oct 17
260 Queen St 1,000 685 g 10 35-40 Conrad & Gargett Jul 17
111 Eagle St 2,830 875 g 8 35-40 QLD Treasury Corp Jun 17
340 Adelaide St 902 545 g 5 35-40 Covermore Feb 17
120 Edward St 1,625 570 g 5 35-40 Arcadis Feb 17
32 Edward St 1,574 570 g 5 <20% Lifeflight Australia Feb 17
410 Ann St 1,247 520 g 5 35-40 Sonic HealthPlus Sep 16
`estimated incentive calculated on a straight line basis g gross Source: Knight Frank Research
150
250
350
450
550
650
750
850
Ap
r-06
Ap
r-07
Ap
r-08
Ap
r-09
Ap
r-10
Ap
r-11
Ap
r-12
Ap
r-13
Ap
r-14
Ap
r-15
Ap
r-16
Ap
r-17
Ap
r-18
Ap
r-19
PRIME SECONDARY
projection

6
low in the Brisbane CBD during 2016
with ten sales, or part sales, totalling
$1.008 billion recorded during 2016. This
was lower than the $1.20 billion recorded
in the year before and a reflection of the
relatively few opportunities which were
available to the market during 2016.
Despite the limited opportunities offshore
investors increased their exposure to the
Brisbane market acquiring $525.3 million
during 2016, up from $297.1 million in
2015. As shown in Figure 4, the
penetration of offshore investors into
Brisbane CBD transactions was a record
high level at 52%, just ahead of the 51%
market share in 2010 when Keppel REIT
Asia and PNB made key investments into
the city.
The largest transaction in the Brisbane
CBD during 2016 was an off-market
transfer of a 33% share in 111 Eagle
Street with the triggering of an option
between co-owners for GWOF to take up
the ADIA interest in the building for
$282.4 million. The next largest was the
$188.0 million sale of 300 Queen Street,
purchased by offshore entity ARA Asset
Management. Other significant offshore
acquisitions during 2016 included AEP
Investment Management’s $159.8 million
purchase of 41 George St, Investec
Australia Property Fund’s 50%
acquisition of 324 Queen St for $66
million, and Wee Hur’s acquisition of 80
Ann St for $62.5 million.
Investor interest has continued to build in
the Brisbane CBD market as the Sydney
and Melbourne CBDs are recording ever-
lower yields and a climate of fewer
opportunities. Additionally the certainty
that the leasing market has bottomed in
the Brisbane CBD is providing impetus to
the investment market with there now
seen to be a time limit to purchase
Brisbane assets to fully benefit from the
expected recovery in tenant demand.
Despite this steady and growing interest,
particularly from offshore buyers, the
level of transactions remained relatively
Source: Knight Frank Research
The first major sale of 2017, the $142.5
million transfer of 307 Queen St, was also
to an offshore buyer with LaSalle
Investment Management acquiring on
behalf of a third party.
Unlisted Funds and Syndicates have also
been strong buyers in the Brisbane
market and apart from GWOF’s increased
ownership in 111 Eagle St, there was also
APPF’s acquisition of the remaining 50%
of Transit Centre for $62.6 million and
Primewest’s purchase of 308 Queen St
for $37.3 million. Already in 2017 the
sector has been active with syndicator
Capital Property Funds purchasing 126
Margaret St for $34 million and private
FIGURE 5
Brisbane CBD Purchaser Profile 2016
INVESTMENT ACTIVITY & YIELDS
TABLE 4
Recent Sales Activity Brisbane CBD
Address Grade Price $
mil
Core
Market
Yield % NLA m²
$/m²
NLA
WALE
yrs Vendor Purchaser
Sale
Date
50 Ann St B 144.60 8.20 25,519 5,667 3.6 CIMB Propertylink/Goldman
Sachs May 17
40 Tank St B 56.10 undis 6,218 9,022^ 6.3^ 151 Property Group Ariadne/Kevin Seymour Apr 17
126 Margaret St B 34.00 7.16 5,583 6,090 3.8 Investec Property
Opportunity Fund 2 Capital Property Funds Feb 17
307 Queen St A 142.15 6.81 19,446 7,310 3.2 GDI Property Group LaSalle Investment
Management Jan 17
324 Queen St A 132.00 7.16 19,874 6,642 3.2 Brookfield Property Partners & DWPF
Abacus Property Group & Investec Australia
Dec 16
Source: Knight Frank Research *sold 63% vacant without income support. # Fully leased to State Govt with expiry December 2017 ^Building has a high carparking component of 321 bays which impacts the $/m² NLA and WALE quoted is by income
147 Charlotte St & 146 Mary St
B 65.00 n/a# 26,651 2,439 0.6 Cromwell Property
Group Ashe Morgan Group May 17
545 Queen St B 70.50 n/a* 13,422 5,253 n/a GPT Wholesale Fund Axis Capital Pty Ltd May 17
FIGURE 4
Office Market Investment ($10m+) $ million Brisbane & % turnover offshore buyers
Source: Knight Frank Research
AREIT
6%
Offshore
52%
Unlisted/
Syndicate
49%
Developer
2%
0%
10%
20%
30%
40%
50%
60%
0
500
1,000
1,500
2,000
2,500
3,000
2007
2008
2009
2010
2011
2012
2013
2014
2015
2016
TOTAL (LHS) % OFFSHORE BUYERS (RHS)

7
RESEARCH BRISBANE CBD OFFICE MAY 2017
syndicator Axis Capital placing 545
Queen St under an unconditional
contract for $70.50 million.
During 2016 both prime and secondary
yields continued to firm and indications
remain of a firming bias into 2017. The
Brisbane CBD prime yields have fallen to
a median range of 5.90% - 7.00% as
demand continues to grow and the
breadth and depth of potential
purchasers expands. The average prime
yield of 6.45% represents a fall of 15
basis points over the past year and 155
basis points through this firming cycle.
Despite the increased investment
interest, particularly for prime core
assets, few transactions have occurred at
this end of the market. The three prime
assets which were transacted on-market
during 2016 were older assets with
relatively shorter WALEs.
Secondary yields currently range
between 7.45% - 9.30%, reflecting an
average of 8.38%, a 22 basis point
decrease over the past year and 81 bps
since the prior peak. After steadily
widening over the past two years, the
secondary yield range has begun to
narrow as greater investor interest and
appetite for risk/refurbishment
opportunities has begun to impact on the
upper yield range, drawing it down in line
with the lower yield range.
Along with green shoots appearing in the
Brisbane leasing market, investment
demand is being reinforced by the
continued high spread between the
Brisbane yields and Sydney/Melbourne.
While both Sydney and Melbourne CBDs
are far further through the leasing
demand cycle, with signs of improvement
in the Brisbane market investment
interest has further increased. As shown
in Figure 7, the current spread between
prime yields in the Brisbane and Sydney
CBDs is 133 basis points, back in line
with the cyclical high of 132 basis points
at the start of 2016 and above the long
term average of 100bps.
With six sales in the first months of 2017
and other assets such as the 50%
interest in 400 George St and 120
Edward St in due diligence, the sales
activity levels for the Brisbane CBD are
looking promising.
FIGURE 7
Brisbane CBD & Sydney CBD Yields % Yield LHS & Basis Point Spread RHS
Tenant activity is expected to
remain at improved levels during
2017 with the number of deals
underpinned by smaller tenants.
At the same time there is greater
intent from larger tenants to both
test the market and relocate with
inflows from Fringe and
suburban locations to continue.
The use of speculative fitouts,
particularly at the smaller end of
the market is likely to continue,
although tenants are starting to
face high choice in this sector.
Nevertheless secondary
landlords must keep working on
their buildings to attract tenant
interest. The use of spec fitouts
has also allowed the face rents
to be pushed for these smaller
secondary suites, however the
market average rents (based on
a full floor basket) have shown
less improvement.
Effective rents, largely through
face rental growth have
consolidated the green shoots in
evidence in late 2016 with 4.1%
growth for prime and 1.7% for
secondary over the past year.
This trend will continue with
prime effective growth of 5.0% -
6.0% in 2018-2020.
The vacancy rate is expected to
continue to decline, reaching
12.4% before responding to
expected new supply in 2018,
which will interrupt the steady
improvement. Due to timing
impacts of former State
Government occupied buildings
the official stats are expected to
under-state the level of market
activity during 2017.
Yields remain under downward
pressure with interest in the
Brisbane market continuing to
build with both the yield gap to
Sydney and Melbourne and
positive signs in the leasing
market underpinning this
investment interest.
The changing fortunes in the
leasing market is introducing a
level of urgency for market
players without exposure to
Brisbane, with the expectation
that transactions need to be
entered into soon to fully gain
exposure to improvements in the
leasing market. While most
purchasers, particularly offshore
buyers, remain attracted to core
assets the limited opportunities
in the market is expected to
divert a portion of this demand
into value-add purchases.
Outlook
Source: Knight Frank Research
FIGURE 6
Brisbane CBD Core Market Yields % Yield LHS & Basis Point Spread RHS
Source: Knight Frank Research
-
40
80
120
160
200
3.0%
4.0%
5.0%
6.0%
7.0%
8.0%
9.0%
Jan
-99
Jan
-00
Jan
-01
Jan
-02
Jan
-03
Jan
-04
Jan
-05
Jan
-06
Jan
-07
Jan
-08
Jan
-09
Jan
-10
Jan
-11
Jan
-12
Jan
-13
Jan
-14
Jan
-15
Jan
-16
Jan
-17
SPREAD (RHS) SYDNEY CBD PRIME YIELD
BRISBANE CBD PRIME YIELD AVERAGE SPREAD
-
50
100
150
200
250
300
5.0%
6.0%
7.0%
8.0%
9.0%
10.0%
11.0%
Ap
r-91
Ap
r-93
Ap
r-95
Ap
r-97
Ap
r-99
Ap
r-01
Ap
r-03
Ap
r-05
Ap
r-07
Ap
r-09
Ap
r-11
Ap
r-13
Ap
r-15
Ap
r-17
SPREAD PRIME V SECONDARY (RHS)
SECONDARY YIELD (LHS)
PRIME YIELD (LHS)

Knight Frank Research provides strategic advice, consultancy services and forecasting
to a wide range of clients worldwide including developers, investors, funding
organisations, corporate institutions and the public sector. All our clients recognise the
need for expert independent advice customised to their specific needs.
RECENT MARKET-LEADING RESEARCH PUBLICATIONS
Brisbane Industrial
Vacancy Analysis
April 2017
Build-To-Rent
Insight
April 2017
The Wealth Report
2017
Knight Frank Research Reports are available at KnightFrank.com.au/Research
Sydney CBD Office
Market Overview
March 2017
Important Notice
© Knight Frank Australia Pty Ltd 2017 – This report is published for general information only and not to
be relied upon in any way. Although high standards have been used in the preparation of the
information, analysis, views and projections presented in this report, no responsibility or liability
whatsoever can be accepted by Knight Frank Australia Pty Ltd for any loss or damage resultant from
any use of, reliance on or reference to the contents of this document. As a general report, this material
does not necessarily represent the view of Knight Frank Australia Pty Ltd in relation to particular
properties or projects. Reproduction of this report in whole or in part is not allowed without prior
written approval of Knight Frank Australia Pty Ltd to the form and content within which it appears.
For the latest news, views and analysisof the commercial property market, visitknightfrankblog.com/commercial-briefing/
COMMERCIAL BRIEFING
RESEARCH
Jennelle Wilson
Senior Director—Research QLD
+61 7 3246 8830
CAPITAL MARKETS
Ben McGrath
Managing Director—QLD
Senior Director—Institutional Sales
+61 7 3246 8814
[email protected] Justin Bond
Senior Director—Institutional Sales
+61 7 3246 8872
[email protected] Neil Brookes
Head of Capital Markets—APAC
+65 8309 4985
OFFICE LEASING
Campbell Tait Senior Director, Joint Head of Office
Leasing Qld
+61 7 3246 8868
[email protected] Mark McCann Senior Director, Joint Head of Office
Leasing Qld
+61 7 3246 8853
Jamie Nason Associate Director, Office Leasing
+61 7 3246 8841
Michael O’Rourke Associate Director, Office Leasing
+61 7 3246 8856
Michael.O’[email protected]
VALUATIONS
Peter Zischke
Director
+61 7 3193 6811 [email protected]