brisbane cbd - microsoft brisbane cbd office april 2015 research major office supply #126 margaret...
TRANSCRIPT
HIGHLIGHTS
RESEARCH
BRISBANE CBD OFFICE MARKET OVERVIEW APRIL 2015
Tenant demand is improving with greater leasing activity expected in 2015. With growth and expansion still fragile the 188,000m² of new supply will push the vacancy to new heights in 2016.
Effective rents have stabilised with only marginal falls over the past year. Face rents across both prime and secondary have grown with this more than balanced by further increases to average incentives.
Investment demand has continued to grow as purchaser attention extends from the Sydney and Melbourne markets. Yield compression in the prime market is now spreading to secondary stock.

2
KEY FINDINGS
Total Vacancy increased to
15.6% as at January 2015. For
this cycle the peak is expected
to be 16.3% in early 2017
Increasing tenant confidence and
mobility is expected to benefit
the A and B+ grade markets
The current spread between
prime and secondary yields is
187bps, well above average
levels
Prime and secondary effective
rents softened by 1.6% and
2.1% respectively over the past
year, but have now stabilised
JENNELLE WILSON Director — Research QLD
SUPPLY & DEVELOPMENT
Net supply additions to the Brisbane CBD
was negative over the second half of
2014 (-5,297m²), with modest
withdrawals and only limited return of
refurbished space. In the six months to
January 2015, 3,613m² of stock was
added to the market, coming from two
smaller secondary refurbishment projects
of Rowes Arcade (2,500m²) and 138-140
Albert Street (1,113m²). Over the same
period there was withdrawal of 8,910m²
of stock from two buildings.
The first half of 2015 is expected to be
characterised by reductions to stock, as
a number of assets purchased for
redevelopment are removed from the
market. In contrast, the second half of
2015 will see the first of three major
construction completions, totalling
188,000m², which will be added prior to
the end of 2016. The first completion, the
57,465m², 180 Ann Street, is expected in
Q4 2015. The project is being developed
by the privately owned Daisho Group and
is currently 18% pre-committed with the
Commonwealth Bank of Australia taking
10,500m².
480 Queen Street will be completed early
in 2016 followed by 1 William Street later
in the year. The Grocon developed
(onsold to DXS and DWPF), 480 Queen
Street has pre-commitments which
account for 81% of the office space. The
final project in this short construction
cycle is 1 William Street (74,853m²),
which is fully leased by the State
Government. Beyond these projects
TABLE 1
Brisbane CBD Office Market Indicators as at April 2015
Grade Total Stock
(m²)^
Vacancy
Rate (%)^
Annual Net
Absorption
(m²)^
Annual Net
Additions (m²)^
Average
Gross Face
Rent ($/m²)
Average
Incentive
(%)
Average Core
Market Yield (%)
Prime 1,084,189 10.7 5,200 - 695 36 6.20—7.65
Secondary 1,109,614 20.5 -38,620 -4,436 545 39 8.00—9.60
Total 2,193,803 15.6 -33,420 -4,436
under construction, most existing office
development proposals have been
converted into residential or hotel
developments. At this stage further
significant new supply is not expected
prior to late 2018 at the earliest.
Stock Withdrawal
Withdrawals over the past six months
comprised 171 George Street (c8,260m²)
for a hotel conversion and 650m² of
space located at 155 Queen Street,
demolished for the construction of a new
retail and office building.
Stock withdrawals are expected to ramp
up with a total of 143,000m² currently
slated for permanent withdrawal between
now and the end of 2017. The majority of
this withdrawal is from mid-2016 and is
tied to the Queens Wharf and BaT
projects. At this stage the new Qld
Government has indicated the intention
to continue with the Queens Wharf
project, however the BaT Tunnel may be
delayed while alternate funding is sought.
Over the coming six months 363
Adelaide Street (14,700m²) and 240
Margaret Street (3,750m²) will be
withdrawn for student accommodation
conversion and residential development
respectively. Further withdrawals for
hotel or residential use are expected to
emerge over the coming year, with a
number of secondary properties having
relatively low occupancy and strong
redevelopment potential.
Withdrawals of stock will dominate in the short term as obsolete buildings are recycled. From late 2015 this will change with three buildings totalling 188,000m² coming to the market from late 2015 and in 2016.
Source: Knight Frank/PCA ^ as at January 2015

3
RESEARCH BRISBANE CBD OFFICE APRIL 2015
MAJOR OFFICE SUPPLY
#126 Margaret St—5,718m²
Investec Prop Opportunity Fund
Q1 2013—10% committed
#420 George St—6,500m²
Nielson Properties (under contract)
Q2 2013—14% committed
^69 Ann St—6,000m²
Charter Hall CPOF Q3 2014 —QLD Gas
^60 Albert St—c7,500m²
DWPF — Q1 2015 — Arrow/Worley Parsons/Rowland
#310 Ann St—16,500m²
Pidgeon Family—Q1 2015
155 Queen St— c2,500m²
ISPT—Q4 2015
180 Ann St— 57,465m² [CBA]
Daisho — Q4 2015—18% committed
480 Queen St—55,561m² [BHP/ PwC/
Freehills] —81% committed
Grocon (DEXUS/DWPF) — Q1 2016
1
2
1 William St—74,853m² [State Govt]
Cbus Property/ISPT—Q4 2016
100% committed (15,000m² sub-lease)
12 Creek St Annex—6,297m² of GFA
DEXUS Property Group/DWPF—tba
300 George St—46,162m²
Shayher Group—tba
80 Albert St—9,118m²
Frasers Hospitality—withdrawn Q1 2014
Hotel Conversion
171 George St—8,260m² office NLA
Toga Far East Hotels—withdrawn Q4
2014—Hotel Conversion
363 Adelaide St—14,700m²
Valparaiso Capital —withdrawn Q1 2015
Student Accommodation Conversion
240 Margaret St—3,750m²
Aspial Corporation—withdrawn Q1 2015
Residential Development
Under Construction / Complete
DA Approved / Confirmed / Site Works
Mooted / Early Feasibility
Former office buildings withdrawn for
hotel or residential conversion/
redevelopment
Source of Map: Knight Frank
As at April 2015, excluding strata
#major refurbishment/entire building available
^sub-lease space >5,000m² contiguous
Sub-lessor identified in italics.
Avail office NLA quoted.
Major Pre-commit in [brackets] next to the NLA.
9
3
4
5
6
7
1
9
10
11
12
13
14
8 15
2
3
6
7
8
5
11
12
4
10
13
14
15

4
Even though a considerable portion of the
negative net absorption can be attributed
to specific tenant relocations, it also
highlighted a lack of underlying growth
within the market to counterbalance
these negative influences.
While the first half of 2015 is also
expected to be impacted by one-off
negative influences (ie Suncorp’s
relocation from the 16,435m² 310 Ann
Street to 123 Albert Street and their
existing space in Brisbane Square) there
are continued signs of improving market
activity. This is expected to offset the
contractions and result in some positive
net absorption.
Vacancy
The vacancy rate is likely to dip slightly by
mid-2015 to 14.8%, before increasing
again under the weight of new supply,
with the total vacancy expected to be
back to current levels in January 2016.
The vacancy is expected to peak in
January 2017 at 16.3% following the
addition of 1 William Street. Thereafter no
supply, combined with the expected high
withdrawals will see the vacancy rate
make significant improvement throughout
2017 and 2018.
Disappointing demand levels in the
second half of 2014 resulted in the total
vacancy rate increasing to 15.6% as at
January 2015. The prime market vacancy
rate was 10.7%, down marginally from
11.2% six months earlier. Despite
significant A grade backfill space left by
tenants relocating to the Fringe market,
the prime market has continued to
improve as tenants take the opportunity
to upgrade.
In contrast, the secondary market has
continued to weaken, with the total
vacancy increasing to 20.5% up from
17.3% in January 2014. B Grade, which
accounts for the vast majority of
secondary accommodation, has
continued to suffer and has the highest
vacancy rate at 23.0%.
Net Absorption
The Brisbane CBD recorded negative net
absorption of –33,140m² over the course
of 2014, with the second half of 2014 in
particular showing high negative net
absorption of –23,989m². Much of this
negative figure can be attributed to
specific tenant relocations with Ventyx
(6,085m²) and Bank of Queensland
(7,957m²) moving from the CBD to the
Fringe market. In addition Boeing’s
relocation and contraction from 363
Adelaide Street (14,700m²) into 7,459m²
of space in 150 Charlotte Street
contributed to the decline in net
absorption for this period as Boeing only
took occupancy mid-year, despite the
deal being agreed in early 2013.
FIGURE 3
Brisbane CBD Backfill & Contraction (‘000m²) remaining available 2013-2015
Knight Frank has continued to track the
major backfill and contraction space and
this has begun to show positive signs
with the available sub-lease space
decreasing by 50,000m² over the past 12
months, supporting the view that tenant
demand has begun to improve.
Backfill space is expected to increase in
late 2015 and into 2016 as tenants
relocate into the new CBD buildings. This
backfill space will be concentrated in
prime buildings such as Waterfront Place,
Riverside Centre and 240 Queen Street
and will be a combination of direct and
sub-lease space.
FIGURE 2
Brisbane CBD Vacancy % total vacancy
Source: Knight Frank/PCA
FIGURE 1
Brisbane CBD Net Absorption (‘000m²) per 6 month period
TENANT DEMAND & RENTS
TABLE 2
Brisbane CBD—Vacancy Rates
Precinct Jan 14 Jan 15
Premium 12.8% 9.1%
A Grade 10.9% 11.1%
Prime 11.2% 10.7%
B Grade 18.7% 23.0%
C Grade 12.6% 12.1%
D Grade 16.1% 16.6%
Secondary 17.3% 20.5%
Totals 14.3% 15.6%
Source: Knight Frank/PCA
Source: Knight Frank/PCA
Source: Knight Frank
-70
-60
-50
-40
-30
-20
-10
0
10
20
30
40
50
60
Jan-1
2
Jul-1
2
Jan-1
3
Jul-1
3
Jan-1
4
Jul-1
4
Jan-1
5
Jul-1
5
Jan-1
6
Jul-1
6
Jan-1
7
six months to
projection
0%
2%
4%
6%
8%
10%
12%
14%
16%
18%
Jan
-04
Jan
-05
Jan
-06
Jan
-07
Jan
-08
Jan
-09
Jan
-10
Jan
-11
Jan
-12
Jan
-13
Jan
-14
Jan
-15
Jan
-16
Jan
-17
projection
0
20
40
60
80
100
120
140
Feb-13 Aug-13 Feb-14 Aug-14 Feb-15
TOTAL DIRECT TOTAL SUB-LEASE

5
RESEARCH BRISBANE CBD OFFICE APRIL 2015
Queensland International Institute (580m²)
with further activity expected in this
sector in the short term.
Aside from the major pre-commitments
by professional firms to new buildings
such as 480 Queen Street, there has also
been increasing leasing activity from both
the legal and accounting sector due to a
number of take-overs and consolidations
in that sector.
Rental Levels
Effective rental levels have found their
low-point for this cycle with only modest
falls recorded over the past 12 months.
As the level of available sub-lease has
continued to fall, this has assisted to
place a floor under the rental levels.
Prime gross face rents have increased by
2.2% over the past year to average
$695/m² as the claw-back on face rents
has continued to gain momentum.
However incentives have also increased
to average 36%, resulting in an overall fall
to gross effective rents of 1.6% from April
2014.
Prime effective rental levels are expected
to remain largely stable to April 2016 (up
1.5%) with modest growth of 3.1%
forecast for the year to April 2017 to
herald the first material improvement to
effective rents since 2012.
Tenant Demand
Tenant demand has continued to
improve steadily if modestly over the
second half of 2014 and into 2015.
Enquiry levels remain subject to
fluctuation on a week to week basis with
tenants’ confidence easily shaken by
external events such as changes of
Government or poor economic news.
However the tenants which do come to
the market with a serious brief are now
more likely to relocate than to re-commit
to their existing accommodation than
was the case a year ago.
The opportunity to both upgrade their
location and obtain a new fit-out is an
attractive proposition to tenants and
fuelling this increased relocation activity.
In some cases such as McInnes Wilson,
the landlords have retained an existing
tenant in the building however on a
higher floor and refurbished space.
The education and training sector has
been particularly active in the leasing
market, boosted by both the lower AUD
which improves demand from offshore
students and increased funding from
federal and state government
programmes. Recent relocations in this
space have included Pragmatic Training
(1,406m²), Impact English (1,128m²),
Imperial College (595m²), Karstens
(952m²), The Language Pod (562m²) and
A similar pattern has emerged for the
secondary market with slight
improvement in the gross face rentals
more than offset by a further increase to
average incentives. Face secondary rents
averaged $545/m² as at April 2015 which
was a 1.9% increase over the past year.
However with incentives now averaging
39%, the gross effective rent softened by
2.1% over the 12 month period.
Secondary rents are expected to plateau
from this point with little to no major
improvement expected until late 2016/
early 2017.
Source: Knight Frank
FIGURE 4
Brisbane CBD Rents $/m² p.a average gross effective rent
“Average effective rentals have found their low-point for this cycle”
TABLE 3
Recent Leasing Activity Brisbane CBD
Address NLA m²
Face
Rent
$/m²
Term
yrs
Incentive
(%)` Tenant
Start
Date
480 Queen St 2,800 undis 10 undis DLA Piper^ PC
180 Ann St 10,500 undis 11 undis Commonwealth Bank^ Dec 15
175 Eagle St 1,150 695 g 8 35+ Fisher Adams Kelly Aug 15
239 George St 2,619 570 g 8 35+ City Beach Jul 15
295 Ann St 2,422 585 g 8 30-35 ABS Jun 15
69 Ann St 3,600 625 g 10 30-35 Remserv Jun 15
295 Ann St 2,480 565 g 10 25-30 Manpower May 15
295 Ann St 1,233 385 g 5.5 - Davidson Recruitment# Mar 15
143 Turbot St 1,406 520 g 7 30-35 Pragmatic Training Feb 15
400 George St 1,457 430 g 4 - Central Petroleum# Oct 14
`estimated incentive calculated on a straight line basis g gross ^ pre-commitment # sub-lease
379 Queen St 1,128 475 g 7 35+ Impact English Jan 15
Source: Knight Frank
150
250
350
450
550
650
750
850
Ap
r-09
Oct-0
9
Ap
r-10
Oct-1
0
Ap
r-11
Oct-1
1
Ap
r-12
Oct-1
2
Ap
r-13
Oct-1
3
Ap
r-14
Oct-1
4
Ap
r-15
Oct-1
5
Ap
r-16
Oct-1
6
Ap
r-17
PRIME SECONDARY
projection

6
8.4 years. The other major core sale was
Challenger Life purchasing 53 Albert
Street in December 2014 for $209.268
million. The modern building is fully
occupied by the State Government on a
recently re-negotiated lease with a WALE
of 7.0 years, and the sale reflected a core
market yield of 6.79%. Unusually it is
understood that the purchaser will remain
liable for the outstanding incentive
component in relation to the building,
largely rental abatement, which has an
estimated present value of $25.4 million.
Outside of this, particularly in the latter
half of 2014, remaining sales have been
further up the yield curve as value add or
development acquisitions. 300 Adelaide
Street was purchased by Hong Kong
based Lei Shing Hong for $47.5 million
and the 13,140m² B grade building was
circa 35% vacant at the time of sale. The
sale reflected a core market yield of
8.93%, and with a relatively low
improved rate of $3,615/m² the
purchaser has the flexibility to hold or
redevelop.
Another offshore group, Valparaiso
Capital, has purchased 363 Adelaide
Street for approx. $48 million for
redevelopment into student
accommodation. The 14,962m² building
was sold with vacant possession and has
large floorplates of approx. 1,000m² over
its 14 office levels. This sale adds to 240
As the low interest rate environment
persists, the demand across the
investment market has continued to build
with both local and offshore buyers
seeking to expand their property
portfolios. While 2014 was a record year
for the Australian office investment
market, recording $15.96 billion for
transactions $10 million+, the Brisbane
market’s transaction levels were below
2013 levels. However 2013 was an
exceptionally strong year due to the
transaction of 1 William Street ($400m for
50%), 480 Queen Street ($543.9m) and a
portfolio of Qld Government assets
purchased by QIC Funds Management
($561.9m). Therefore the 2014 total
transaction level of $1.69 billion was 40%
below the $2.86 billion recorded in 2013.
Of the 2014 sales, the influence of
offshore investors was stronger than ever
with 45% of all transactions by value
attributable to offshore purchasers. This
is in contrast to the Australian office
market as a whole where 40% of
transaction value came from offshore
buyers.
Despite the sustained demand for prime,
core assets only two sales were recorded
in this sphere during 2014. In April 2014,
70 Eagle Street was purchased by
Pembroke Real Estate for $122.7 million,
which reflected a core market yield of
6.25% on the asset which had a WALE of
Margaret Street and 171 George Street as
sales in 2014 where the buildings will be
withdrawn from the office market for
conversion or redevelopment.
After a flurry of sales in November and
December 2014, sales activity to date
during 2015 has been relatively slower
with only two completed sales. However
there is a high level of activity within the
market for both on and off-market
opportunities and the number of sales is
expected to accelerate to the end of the
financial year ie Waterfront Place, which
has recently entered due diligence.
Source: Knight Frank
FIGURE 5
Brisbane CBD Purchaser/Vendor $ million sales ($10 million+) Year to March 2015
INVESTMENT ACTIVITY & YIELDS
TABLE 4
Recent Sales Activity Brisbane CBD
Address Grade Price $
mil
Core
Market
Yield % NLA m²
$/m²
NLA
WALE
yrs Vendor Purchaser
Sale
Date
10 Felix St B 26.0 7.76 4,622 5,577 2.0 Canberra Raiders
Leagues Club AIMS Funds Management
Feb 15
363 Adelaide St ‡ B 48.00 VP 14,962 3,208 VP Investa Property
Group Valparaiso Capital Jan 15
414 George St ± A 30.00 9.14 4,989 6,013 2.4 Lend Lease Core Plus
Fund LaSalle Investment
Management Dec 14
53 Albert St A 209.27* 6.79 19,059 10,980 7.0 Hatham Holdings Challenger Life Dec 14
60 Edward St~ A/B 61.09 7.93 10,725 5,696 2.5 AMP Capital RACQ Dec 14
300 Adelaide St B 47.50 8.93 13,140 3,615 2.1# Charter Hall Direct
Property Fund Lei Shing Hong
Properties Dec 14
‡ purchased for redevelopment as student accommodation ± purchased as part of a national portfolio, allocated price only *purchaser will take on responsibilities for outstanding incentives (rental abatement) with an estimated PV of $25.4 million
~purchaser will owner occupy in the order of 4,000m² of space to be vacated in the building. # sold with circa 35% vacancy Source: Knight Frank
-500
-400
-300
-200
-100
0
100
200
300
400
AR
EIT
Priv
ate
Investo
r
Offs
ho
re
Un
liste
d/
Synd
icate
Sup
er
Fund
Oth
er
PURCHASER VENDOR NET PURCHASE/SELL
7
RESEARCH BRISBANE CBD OFFICE APRIL 2015
Demand for investment in Australian
office assets has continued to build,
however in recent months a greater
proportion of this has been directed into
the Melbourne and Sydney markets,
particularly underscored by potential
residential conversion and
redevelopment in Sydney. As values
continue to increase in the southern
markets it is expected that additional
purchasing activity will flow into the
Brisbane market.
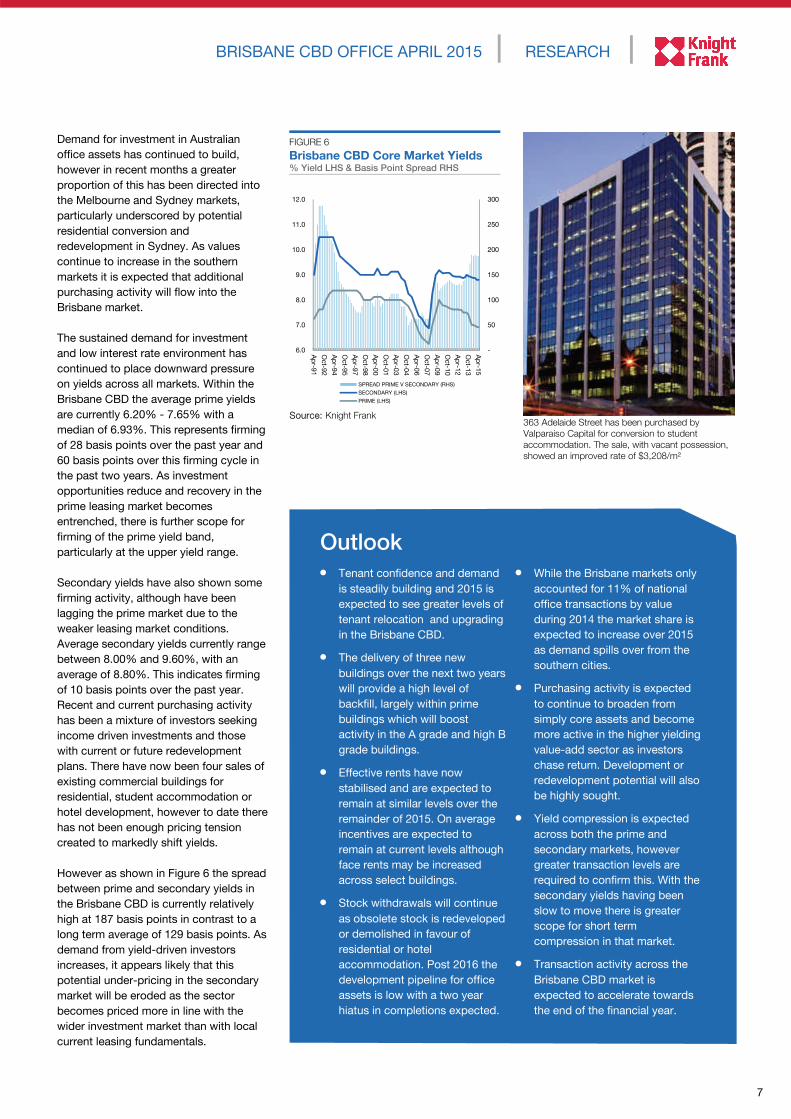
The sustained demand for investment
and low interest rate environment has
continued to place downward pressure
on yields across all markets. Within the
Brisbane CBD the average prime yields
are currently 6.20% - 7.65% with a
median of 6.93%. This represents firming
of 28 basis points over the past year and
60 basis points over this firming cycle in
the past two years. As investment
opportunities reduce and recovery in the
prime leasing market becomes
entrenched, there is further scope for
firming of the prime yield band,
particularly at the upper yield range.
Secondary yields have also shown some
firming activity, although have been
lagging the prime market due to the
weaker leasing market conditions.
Average secondary yields currently range
between 8.00% and 9.60%, with an
average of 8.80%. This indicates firming
of 10 basis points over the past year.
Recent and current purchasing activity
has been a mixture of investors seeking
income driven investments and those
with current or future redevelopment
plans. There have now been four sales of
existing commercial buildings for
residential, student accommodation or
hotel development, however to date there
has not been enough pricing tension
created to markedly shift yields.
However as shown in Figure 6 the spread
between prime and secondary yields in
the Brisbane CBD is currently relatively
high at 187 basis points in contrast to a
long term average of 129 basis points. As
demand from yield-driven investors
increases, it appears likely that this
potential under-pricing in the secondary
market will be eroded as the sector
becomes priced more in line with the
wider investment market than with local
current leasing fundamentals.
Source: Knight Frank
FIGURE 6
Brisbane CBD Core Market Yields % Yield LHS & Basis Point Spread RHS
Tenant confidence and demand
is steadily building and 2015 is
expected to see greater levels of
tenant relocation and upgrading
in the Brisbane CBD.
The delivery of three new
buildings over the next two years
will provide a high level of
backfill, largely within prime
buildings which will boost
activity in the A grade and high B
grade buildings.
Effective rents have now
stabilised and are expected to
remain at similar levels over the
remainder of 2015. On average
incentives are expected to
remain at current levels although
face rents may be increased
across select buildings.
Stock withdrawals will continue
as obsolete stock is redeveloped
or demolished in favour of
residential or hotel
accommodation. Post 2016 the
development pipeline for office
assets is low with a two year
hiatus in completions expected.
While the Brisbane markets only
accounted for 11% of national
office transactions by value
during 2014 the market share is
expected to increase over 2015
as demand spills over from the
southern cities.
Purchasing activity is expected
to continue to broaden from
simply core assets and become
more active in the higher yielding
value-add sector as investors
chase return. Development or
redevelopment potential will also
be highly sought.
Yield compression is expected
across both the prime and
secondary markets, however
greater transaction levels are
required to confirm this. With the
secondary yields having been
slow to move there is greater
scope for short term
compression in that market.
Transaction activity across the
Brisbane CBD market is
expected to accelerate towards
the end of the financial year.
Outlook
363 Adelaide Street has been purchased by Valparaiso Capital for conversion to student accommodation. The sale, with vacant possession, showed an improved rate of $3,208/m²
-
50
100
150
200
250
300
6.0
7.0
8.0
9.0
10.0
11.0
12.0
Ap
r-91
Oct-9
2
Ap
r-94
Oct-9
5
Ap
r-97
Oct-9
8
Ap
r-00
Oct-0
1
Ap
r-03
Oct-0
4
Ap
r-06
Oct-0
7
Ap
r-09
Oct-1
0
Ap
r-12
Oct-1
3
Ap
r-15
SPREAD PRIME V SECONDARY (RHS)
SECONDARY (LHS)
PRIME (LHS)

Knight Frank Research provides strategic advice, consultancy services and forecasting
to a wide range of clients worldwide including developers, investors, funding
organisations, corporate institutions and the public sector. All our clients recognise the
need for expert independent advice customised to their specific needs.
RECENT MARKET-LEADING RESEARCH PUBLICATIONS
Brisbane Industrial
Vacancy Analysis
February 2015
Australian Apartment
Market Overview
February 2015
Australian Retail
Overview
February 2015
Knight Frank Research Reports are available at KnightFrank.com.au/Research
Brisbane Suburban
Market Overview
February 2015
© Knight Frank 2015 This report is published for general information only. Although high standards have been used in
the preparation of the information, analysis, views and projections presented in this report, no legal responsibility can be
accepted by Knight Frank Research or Knight Frank for any loss or damage resultant from the contents of this
document. As a general report, this material does not necessarily represent the view of Knight Frank in relation to
particular properties or projects. Reproduction of this report in whole or in part is not permitted without prior consent of,
and proper reference to Knight Frank Research.
For the latest news, views and analysisof the commercial property market, visitknightfrankblog.com/commercial-briefing/
COMMERCIAL BRIEFING
RESEARCH
Jennelle Wilson
Director—Research QLD
+61 7 3246 8830
[email protected] Matt Whitby
Group Director
Head of Research & Consulting
+61 2 9036 6616
CAPITAL MARKETS
Ben McGrath
Managing Director—QLD
Senior Director—Institutional Sales
+61 7 3246 8814
[email protected] Justin Bond
Senior Director—Institutional Sales
+61 7 3246 8872
[email protected] Richard Morrison
Director—Commercial Sales
+61 7 3246 8846 [email protected] Neil Brookes
Head of Capital Markets—APAC
+65 8309 4985
OFFICE LEASING
David Howson Senior Director, Head of Division —
Office Leasing
+61 7 3246 8833
Campbell Tait Senior Director—Office Leasing
+61 7 3246 8868
VALUATIONS
Peter Zischke
Director
+61 7 3246 8811 [email protected]