brighton secondary school - brightonss.sa.edu.au · lift dance students performed at the adelaide...
TRANSCRIPT
Brighton Secondary School Number: 803Partnership: Holdfast
Name of School Principal: _______________________________________Name of Governing Council Chair: _______________________________________Date of Endorsement: _______________________________________
Brighton Secondary School2017 Annual Report
to the School Community
Olivia O'NeillJacqui Squires5th March 2018
School Context and Highlights
Governing Council Report
| Brighton Secondary School2017 Annual Report to the School Community1
A number of projects was noteworthy in raising the image of the school in the community: whole school exterior and interiorsignage; the new website developed for launch early 2018; the LED screen installed and all livery redesigned with the newlogo.
The Principal, Olivia O’Neill represented South Australia to present the flexibilities in our SACE to the Northern QueenslandPrincipals who are grappling with a return to examinations since moving away from such a system in 1973; attended the WorldSpace Conference to discover the STEM program, CubeRider, which will send students’ data to the World Space Station in2018; designed and implemented the inaugural and successful Thinking Carnival with three leaders in the Flinders 2 Portfolio toprovide an opportunity for primary and secondary students to solve real-world problems.
The Governing Council's weekend conference day explored digital technologies and used the virtual reality headsets, which thestudents are now using as part of their everyday lessons. This kind of technology, together with the vast array of design andtechnology equipment, such as laser cutters and 3D printers, means our students will be well-versed and competent with all thecurrent technologies when they progress to further education or work after school.
The Holdfast Partnership of 8 kindergartens, 5 primary schools and Brighton Secondary School has grown to be a modelpartnership, due in part to the Combined Preschool/Schools Working Partnership Governing Council Conference Day.
The school is fortunate to have a splendid group of volunteers who help make our school community a better place.
The F1 in Schools Team, Spectrum, won the National Finals and the Collaboration Team (Australia’s Spectrum and Germany’sEvolve) took Second Place at the Malaysian World Competition. The March to Kokoda Concert supported the ReconciliationKokoda Walk that 2 staff and 2 students courageously completed.
Special Interest Volleyball (SIV) program was awarded: Overall Australian Champion Volleyball School, Girls Champion School,6 Gold, 5 Silver and 1 Bronze medals out of 24 teams. The Q and A event supporting White Ribbon campaign promotedrespectful relationships and a high profile opportunity for learner voice with invited student leaders from secondary schools-Adelaide, Charles Campbell, Christies Beach, Glenunga International, Norwood Morialta, Reynella East, Thebarton and VictorHarbor. The Brighton Boys White Ribbon Action Team was recognised at 10th Anniversary Adelaide breakfast at theConvention Centre.Science students excelled in the Oliphant Science awards- 2 students selected to attend the prestigiousNational Youth Science Forum in Canberra.
Lift Dance students performed at the Adelaide Fringe Festival and the Drama faculty established Urban Theatre with StephenSewell from NIDA. Special Interest Music culminated in the international tour to Scandinavia. The SIMC 40th AnniversaryConcert with Woodville, Marryatville and Playford International Schools at the Adelaide Town Hall was a spectacular eveningattended by Minister for Education, the Hon. Susan Close.
A new Inner South Curriculum Alliance VET course, Certificate 3 in Information, Digital Media and Technology focusing onCoding for Game Development was prepared for 2018. A record year for the 17 year 12 graduates with a Certificate 3contributing to their ATAR.
Brighton’s status as an Apple Distinguished School was renewed and Aimee Shattock awarded Apple Distinguished Educator.A Virtual Reality class kit provides Google Expeditions across all curriculum areas.
The International Student Program continued to flourish with 3 students winning year 12 subject awards; an increase in theSACE enrolment; strong growth in the year 8 and 9 graduate student enrolments to ensure the sustainability of the programand highly positive comments from the students in the official DECD International Student satisfaction survey.
The Student Leadership model was revised as part of the Innovation Model focussing on learner voice for contemporarylearning and social action.
Improvement Planning and Outcomes
| Brighton Secondary School2017 Annual Report to the School Community 2
1: How can teachers incorporate learner voice in task design and assessment practices so that students may successfullydemonstrate their learning and thinking?
Faculties investigated a range of processes to expand student input including using Socratic seminars for assessment;co-designing rubrics with students; incorporating choice into all tasks; challenge-based learning units; individual conferencingsessions with Stage 1 and 2 students during drafting stages for summative pieces; Verso as a digital tool for reflection andassessment. The Talk Team Project had volunteer teachers investigate, with the Holdfast Partnership Primary colleagues,building students’ capacity to articulate their thinking and learning . The project identified: 32% thought they had a say in theirlearning; 89% felt they had a fixed amount of intelligence/can’t change; 14% get learning feedback from peers. This data drovethe strategic directions of using coloured stickers to identify light bulb moments/stumbling blocks; entry and exit cards for avisual thinking journal displayed on posters and boards; co-construction of a Vocab Wall for students to practise using thesubject’s correct terminology in their reflections. Drama students focussed on co-designing the curriculum to include a newwork devised by the students under the mentorship of NIDA’s Stephen Sewell; year 9 Volleyball students with year 11 studentmentors, ran coaching workshops at Ceduna Area School, Koonibba Aboriginal Primary, Elliston Area School and WhyallaStuart Primary school. Design and Technology created a standardised feedback form to collect data for tracking studentenjoyment and provide feedback on teaching practices, coupled with an initial understanding form to gauge students' perceivedgrowth. SACE Stage 1 Sport and Recreation classes demonstrated successful leadership planning and implementing sportsclinics with Paringa Park Primary students in year 3,4,6 and 7 classes.
2. How can teachers use what they have learned about Positive Education to ensure students develop a growth mindset?
All classes adopted strategies to address how to develop a growth mindset when they find themselves in the ‘learning pit’. After60 students failed year 9 Mathematics in Semester 1, targeted gendered classes showed a reduction from 19.9% failing to10.8% across the whole cohort. 63.6% of students in the intervention classes who failed Mathematics in the first semester,reduced to 12.5% in Term 3. Professional learning days focussed on pedagogical shift: Martin Westwell and the combinedHoldfast Partnership; Lee Crockett’s Solution Fluency and Shifts of Practice Day and two days for Learning Design andAssessment. The Teacher Learning Communities focussed on an inquiry approach to pedagogical shift.Teachers have workedto deprivatise their practice through task design and moderation. The focus was on transition points to support the continuity oflearning (a Holdfast Partnership priority). Brighton has led the professional learning and participated in the use of InstructionalRounds in Holdfast Partnership to inquire into pedagogy across sites.
3. How can digital technologies enable teachers to create a classroom environment that challenges students to be critical andcreative thinkers?
The Apple Teacher program ensured staff proficiency in using Apple Technologies in the classroom. Learning is personalisedthrough flipped pedagogies and platforms such as Duolingo, Language Perfect, Education Perfect and Worldflyers, thusencouraging students to take content at their own pace. The use of Daymap and staff-produced websites encourage learninganywhere, anytime. Professional learning (especially demo slams) showcased the use of digital technologies.
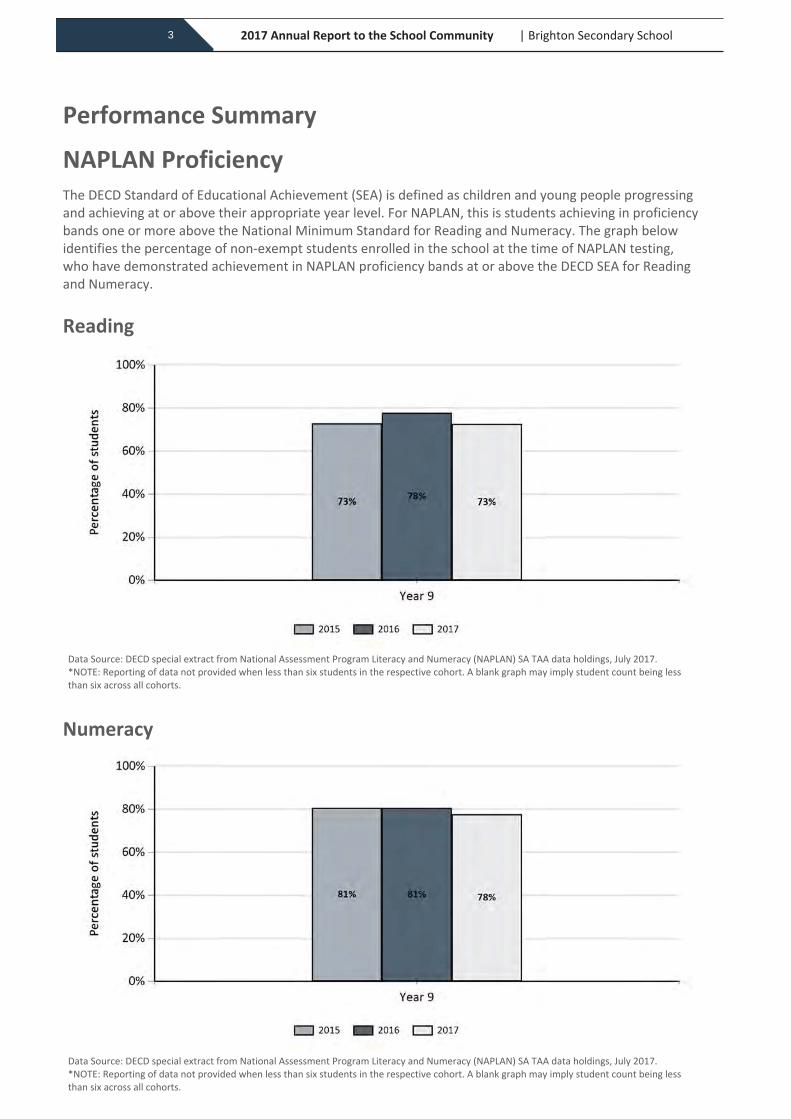
NAPLAN ProficiencyThe DECD Standard of Educational Achievement (SEA) is defined as children and young people progressing and achieving at or above their appropriate year level. For NAPLAN, this is students achieving in proficiency bands one or more above the National Minimum Standard for Reading and Numeracy. The graph below identifies the percentage of non-exempt students enrolled in the school at the time of NAPLAN testing, who have demonstrated achievement in NAPLAN proficiency bands at or above the DECD SEA for Reading and Numeracy.
Reading
Numeracy
Data Source: DECD special extract from National Assessment Program Literacy and Numeracy (NAPLAN) SA TAA data holdings, July 2017.*NOTE: Reporting of data not provided when less than six students in the respective cohort. A blank graph may imply student count being less than six across all cohorts.
Data Source: DECD special extract from National Assessment Program Literacy and Numeracy (NAPLAN) SA TAA data holdings, July 2017.*NOTE: Reporting of data not provided when less than six students in the respective cohort. A blank graph may imply student count being less than six across all cohorts.
Performance Summary
| Brighton Secondary School2017 Annual Report to the School Community3
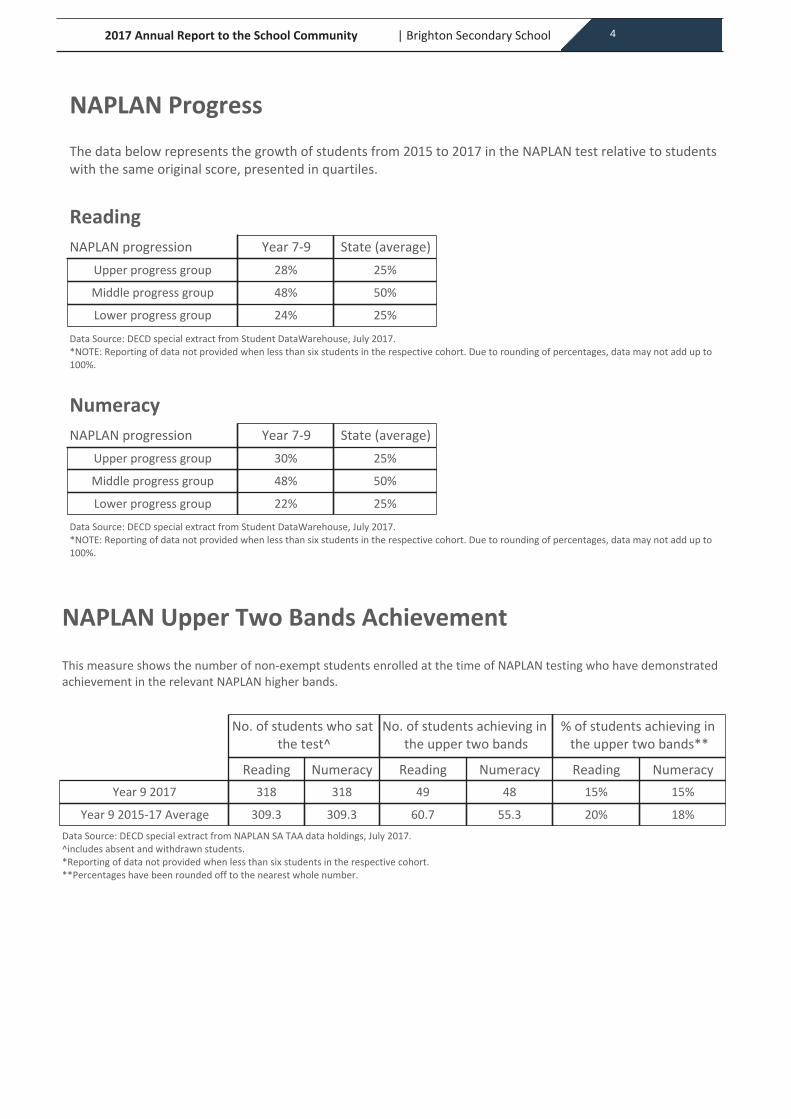
NAPLAN ProgressThe data below represents the growth of students from 2015 to 2017 in the NAPLAN test relative to students with the same original score, presented in quartiles.
Reading
Numeracy
NAPLAN progression Year 7-9 State (average)Upper progress group 28% 25%
Middle progress group 48% 50%
Lower progress group 24% 25%
NAPLAN progression Year 7-9 State (average)Upper progress group 30% 25%
Middle progress group 48% 50%
Lower progress group 22% 25%
Data Source: DECD special extract from Student DataWarehouse, July 2017.*NOTE: Reporting of data not provided when less than six students in the respective cohort. Due to rounding of percentages, data may not add up to 100%.
Data Source: DECD special extract from Student DataWarehouse, July 2017.*NOTE: Reporting of data not provided when less than six students in the respective cohort. Due to rounding of percentages, data may not add up to 100%.
No. of students who sat the test^
No. of students achieving in the upper two bands
% of students achieving in the upper two bands**
Reading Numeracy Reading Numeracy Reading NumeracyYear 9 2017 318 318 49 48 15% 15%
Year 9 2015-17 Average 309.3 309.3 60.7 55.3 20% 18%
This measure shows the number of non-exempt students enrolled at the time of NAPLAN testing who have demonstrated achievement in the relevant NAPLAN higher bands.
NAPLAN Upper Two Bands Achievement
Data Source: DECD special extract from NAPLAN SA TAA data holdings, July 2017.^includes absent and withdrawn students.*Reporting of data not provided when less than six students in the respective cohort.**Percentages have been rounded off to the nearest whole number.
| Brighton Secondary School2017 Annual Report to the School Community 4
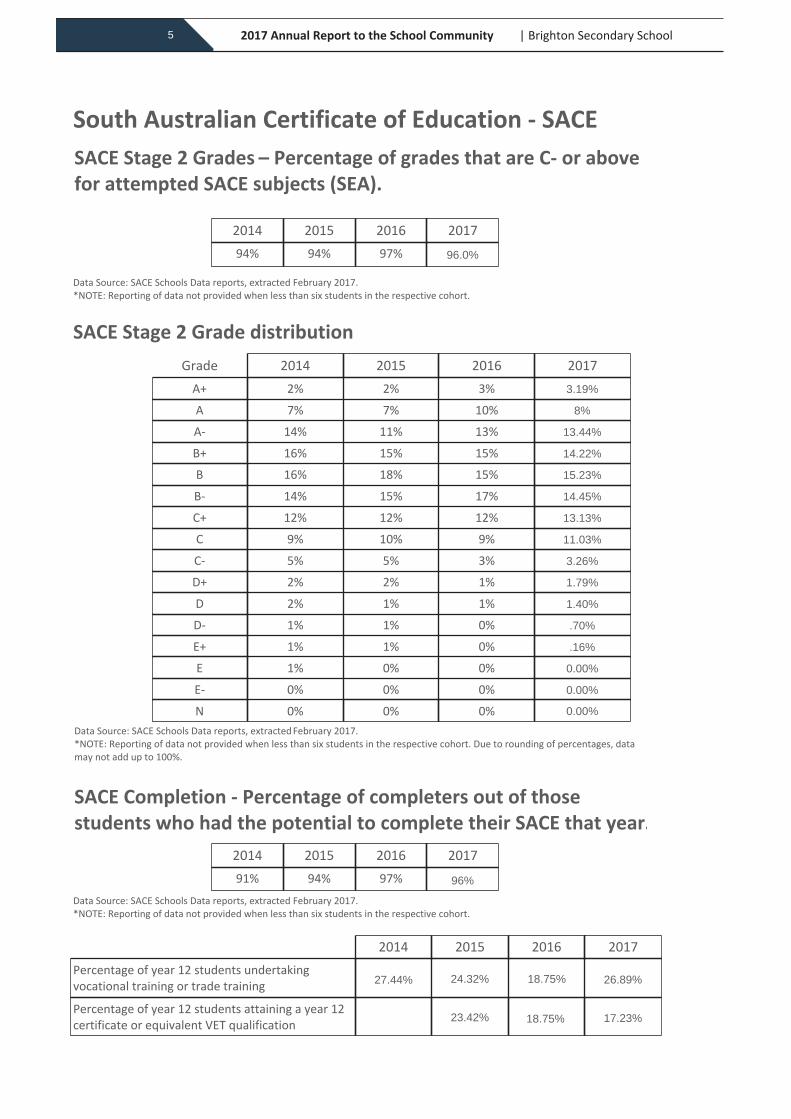
South Australian Certificate of Education - SACESACE Stage 2 Grades – Percentage of grades that are C- or above for attempted SACE subjects (SEA).
Data Source: SACE Schools Data reports, extracted February 2017.*NOTE: Reporting of data not provided when less than six students in the respective cohort.
SACE Stage 2 Grade distributionGrade 2014 2015 2016 2017
A+ 2% 2% 3%A 7% 7% 10%A- 14% 11% 13%B+ 16% 15% 15%B 16% 18% 15%B- 14% 15% 17%C+ 12% 12% 12%C 9% 10% 9%C- 5% 5% 3%D+ 2% 2% 1%D 2% 1% 1%D- 1% 1% 0%E+ 1% 1% 0%E 1% 0% 0%E- 0% 0% 0%N 0% 0% 0%
SACE Completion - Percentage of completers out of those students who had the potential to complete their SACE that year.
2014 2015 2016 201791% 94% 97%
Data Source: SACE Schools Data reports, extracted February 2017.*NOTE: Reporting of data not provided when less than six students in the respective cohort.
2014 2015 2016 201794% 94% 97%
2014 2015 2016 2017Percentage of year 12 students undertaking vocational training or trade training
Percentage of year 12 students attaining a year 12 certificate or equivalent VET qualification
Data Source: SACE Schools Data reports, extracted February 2017.*NOTE: Reporting of data not provided when less than six students in the respective cohort. Due to rounding of percentages, data may not add up to 100%.
| Brighton Secondary School2017 Annual Report to the School Community5
.16%
0.00%
0.00%
0.00%
3.19%
8%
14.22%
11.03%
13.44%
14.45%
13.13%
15.23%
1.79%
1.40%
.70%
3.26%
96.0%
96%
17.23%
26.89%27.44% 24.32% 18.75%
23.42% 18.75%
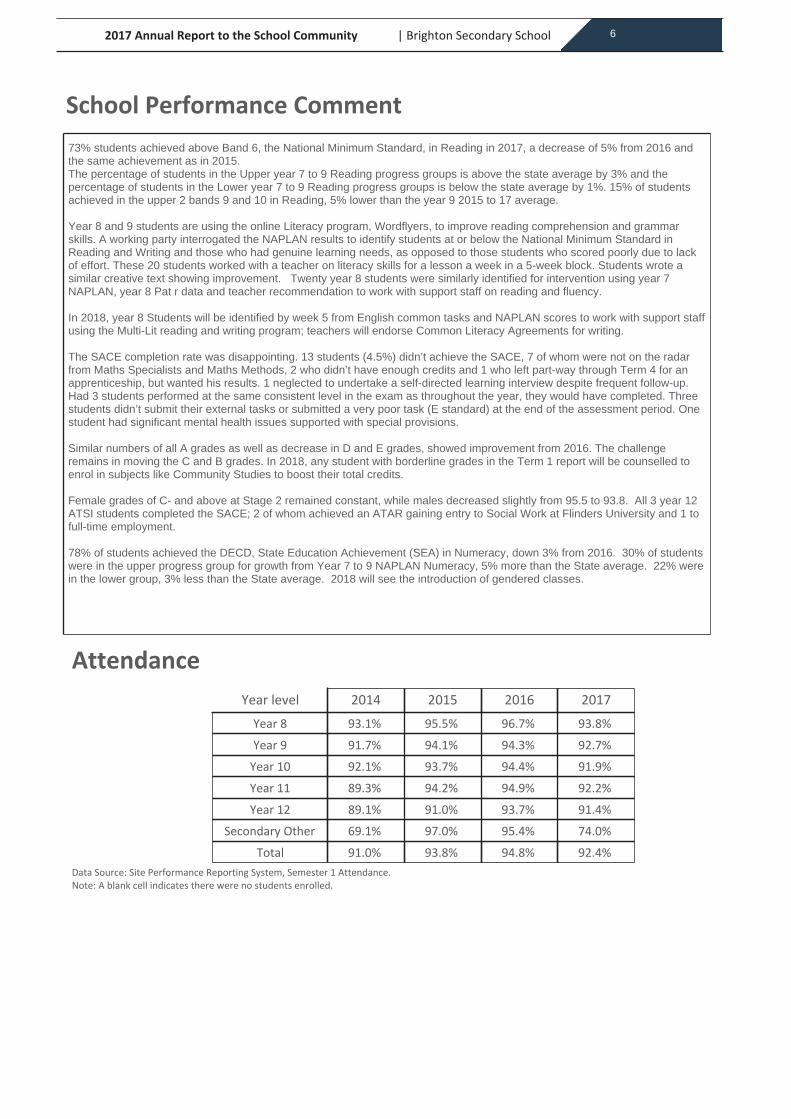
Year level 2014 2015 2016 2017Year 8 93.1% 95.5% 96.7% 93.8%Year 9 91.7% 94.1% 94.3% 92.7%
Year 10 92.1% 93.7% 94.4% 91.9%Year 11 89.3% 94.2% 94.9% 92.2%Year 12 89.1% 91.0% 93.7% 91.4%
Secondary Other 69.1% 97.0% 95.4% 74.0%Total 91.0% 93.8% 94.8% 92.4%
Attendance
Data Source: Site Performance Reporting System, Semester 1 Attendance.Note: A blank cell indicates there were no students enrolled.
School Performance Comment
| Brighton Secondary School2017 Annual Report to the School Community 6
73% students achieved above Band 6, the National Minimum Standard, in Reading in 2017, a decrease of 5% from 2016 andthe same achievement as in 2015.The percentage of students in the Upper year 7 to 9 Reading progress groups is above the state average by 3% and thepercentage of students in the Lower year 7 to 9 Reading progress groups is below the state average by 1%. 15% of studentsachieved in the upper 2 bands 9 and 10 in Reading, 5% lower than the year 9 2015 to 17 average.
Year 8 and 9 students are using the online Literacy program, Wordflyers, to improve reading comprehension and grammarskills. A working party interrogated the NAPLAN results to identify students at or below the National Minimum Standard inReading and Writing and those who had genuine learning needs, as opposed to those students who scored poorly due to lackof effort. These 20 students worked with a teacher on literacy skills for a lesson a week in a 5-week block. Students wrote asimilar creative text showing improvement. Twenty year 8 students were similarly identified for intervention using year 7NAPLAN, year 8 Pat r data and teacher recommendation to work with support staff on reading and fluency.
In 2018, year 8 Students will be identified by week 5 from English common tasks and NAPLAN scores to work with support staffusing the Multi-Lit reading and writing program; teachers will endorse Common Literacy Agreements for writing.
The SACE completion rate was disappointing. 13 students (4.5%) didn’t achieve the SACE, 7 of whom were not on the radarfrom Maths Specialists and Maths Methods, 2 who didn’t have enough credits and 1 who left part-way through Term 4 for anapprenticeship, but wanted his results. 1 neglected to undertake a self-directed learning interview despite frequent follow-up.Had 3 students performed at the same consistent level in the exam as throughout the year, they would have completed. Threestudents didn’t submit their external tasks or submitted a very poor task (E standard) at the end of the assessment period. Onestudent had significant mental health issues supported with special provisions.
Similar numbers of all A grades as well as decrease in D and E grades, showed improvement from 2016. The challengeremains in moving the C and B grades. In 2018, any student with borderline grades in the Term 1 report will be counselled toenrol in subjects like Community Studies to boost their total credits.
Female grades of C- and above at Stage 2 remained constant, while males decreased slightly from 95.5 to 93.8. All 3 year 12ATSI students completed the SACE; 2 of whom achieved an ATAR gaining entry to Social Work at Flinders University and 1 tofull-time employment.
78% of students achieved the DECD, State Education Achievement (SEA) in Numeracy, down 3% from 2016. 30% of studentswere in the upper progress group for growth from Year 7 to 9 NAPLAN Numeracy, 5% more than the State average. 22% werein the lower group, 3% less than the State average. 2018 will see the introduction of gendered classes.
Behaviour Management Comment
Client Opinion Summary
Attendance Comment
| Brighton Secondary School2017 Annual Report to the School Community7
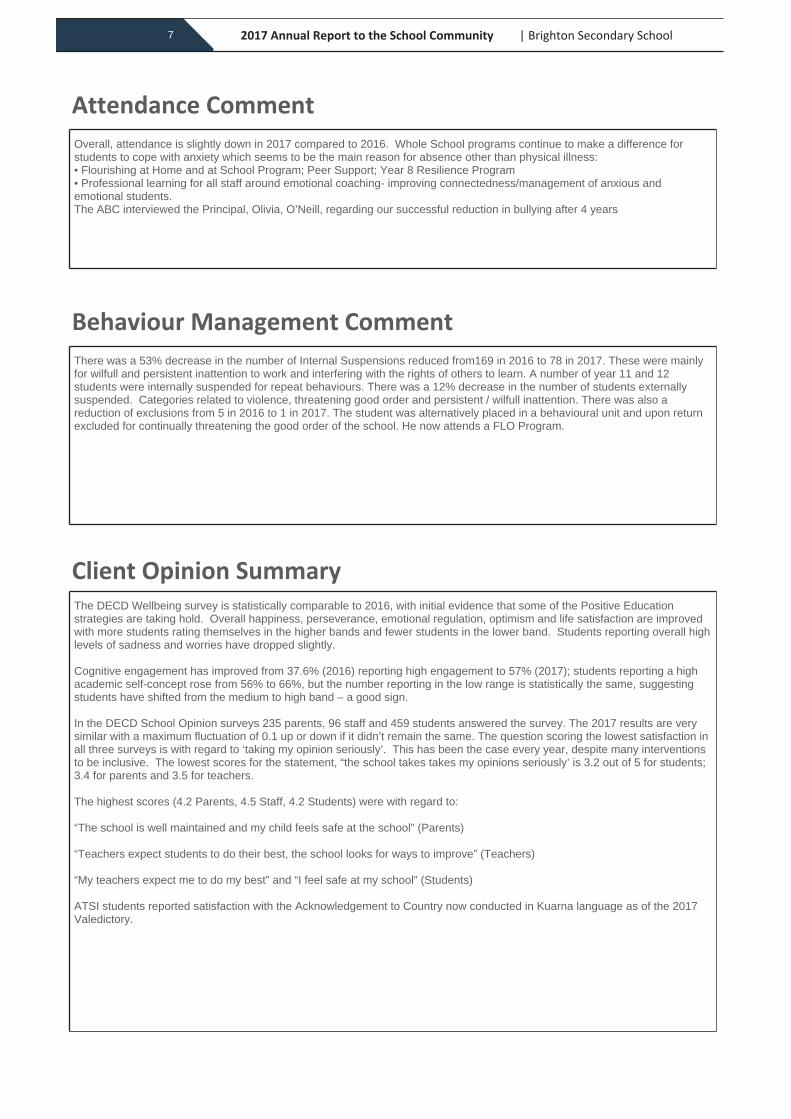
There was a 53% decrease in the number of Internal Suspensions reduced from169 in 2016 to 78 in 2017. These were mainlyfor wilfull and persistent inattention to work and interfering with the rights of others to learn. A number of year 11 and 12students were internally suspended for repeat behaviours. There was a 12% decrease in the number of students externallysuspended. Categories related to violence, threatening good order and persistent / wilfull inattention. There was also areduction of exclusions from 5 in 2016 to 1 in 2017. The student was alternatively placed in a behavioural unit and upon returnexcluded for continually threatening the good order of the school. He now attends a FLO Program.
The DECD Wellbeing survey is statistically comparable to 2016, with initial evidence that some of the Positive Educationstrategies are taking hold. Overall happiness, perseverance, emotional regulation, optimism and life satisfaction are improvedwith more students rating themselves in the higher bands and fewer students in the lower band. Students reporting overall highlevels of sadness and worries have dropped slightly.
Cognitive engagement has improved from 37.6% (2016) reporting high engagement to 57% (2017); students reporting a highacademic self-concept rose from 56% to 66%, but the number reporting in the low range is statistically the same, suggestingstudents have shifted from the medium to high band – a good sign.
In the DECD School Opinion surveys 235 parents, 96 staff and 459 students answered the survey. The 2017 results are verysimilar with a maximum fluctuation of 0.1 up or down if it didn’t remain the same. The question scoring the lowest satisfaction inall three surveys is with regard to ‘taking my opinion seriously’. This has been the case every year, despite many interventionsto be inclusive. The lowest scores for the statement, “the school takes takes my opinions seriously’ is 3.2 out of 5 for students;3.4 for parents and 3.5 for teachers.
The highest scores (4.2 Parents, 4.5 Staff, 4.2 Students) were with regard to:
“The school is well maintained and my child feels safe at the school” (Parents)
“Teachers expect students to do their best, the school looks for ways to improve” (Teachers)
“My teachers expect me to do my best” and “I feel safe at my school” (Students)
ATSI students reported satisfaction with the Acknowledgement to Country now conducted in Kuarna language as of the 2017Valedictory.
Overall, attendance is slightly down in 2017 compared to 2016. Whole School programs continue to make a difference forstudents to cope with anxiety which seems to be the main reason for absence other than physical illness:• Flourishing at Home and at School Program; Peer Support; Year 8 Resilience Program• Professional learning for all staff around emotional coaching- improving connectedness/management of anxious andemotional students.The ABC interviewed the Principal, Olivia, O’Neill, regarding our successful reduction in bullying after 4 years
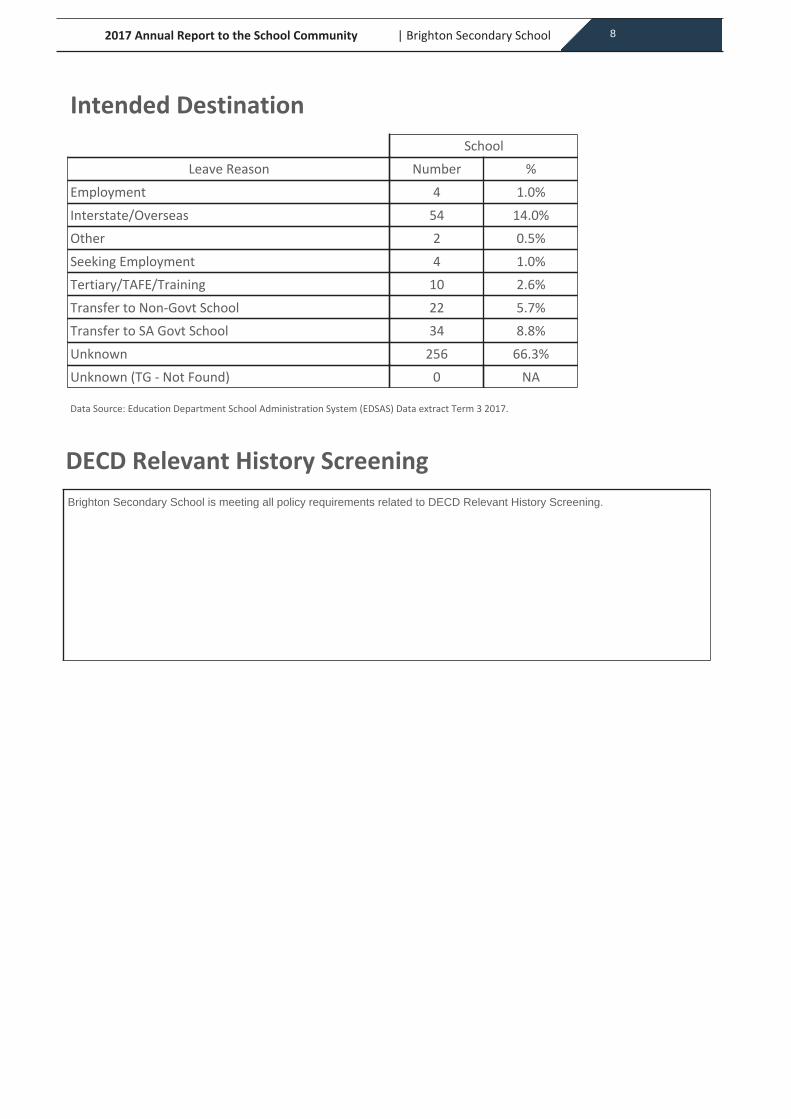
Intended Destination
DECD Relevant History Screening
Data Source: Education Department School Administration System (EDSAS) Data extract Term 3 2017.
SchoolLeave Reason Number %
Employment 4 1.0%Interstate/Overseas 54 14.0%Other 2 0.5%Seeking Employment 4 1.0%Tertiary/TAFE/Training 10 2.6%Transfer to Non-Govt School 22 5.7%Transfer to SA Govt School 34 8.8%Unknown 256 66.3%Unknown (TG - Not Found) 0 NA
| Brighton Secondary School2017 Annual Report to the School Community 8
Brighton Secondary School is meeting all policy requirements related to DECD Relevant History Screening.
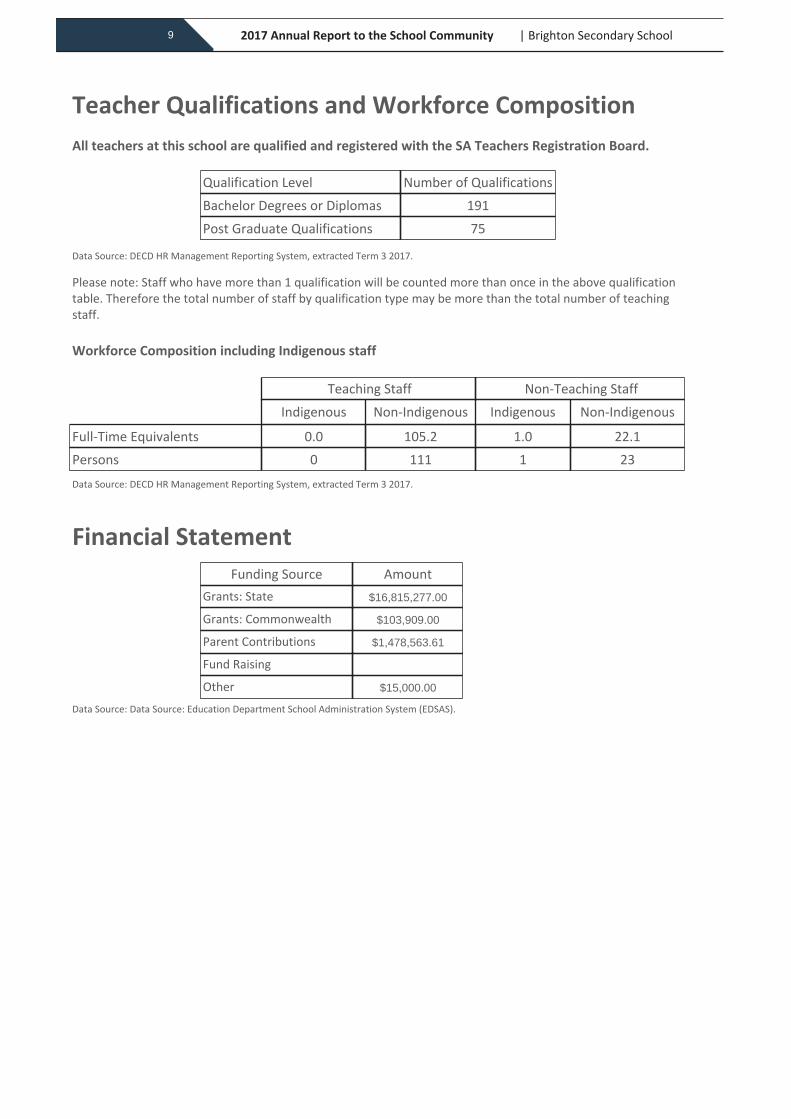
All teachers at this school are qualified and registered with the SA Teachers Registration Board.
Qualification Level Number of QualificationsBachelor Degrees or Diplomas 191Post Graduate Qualifications 75
Please note: Staff who have more than 1 qualification will be counted more than once in the above qualification table. Therefore the total number of staff by qualification type may be more than the total number of teaching staff.
Workforce Composition including Indigenous staff
Teaching Staff Non-Teaching StaffIndigenous Non-Indigenous Indigenous Non-Indigenous
Full-Time Equivalents 0.0 105.2 1.0 22.1Persons 0 111 1 23
Funding Source AmountGrants: State
Grants: Commonwealth
Parent Contributions
Fund Raising
Other
Data Source: DECD HR Management Reporting System, extracted Term 3 2017.
Data Source: DECD HR Management Reporting System, extracted Term 3 2017.
Data Source: Data Source: Education Department School Administration System (EDSAS).
Teacher Qualifications and Workforce Composition
Financial Statement
| Brighton Secondary School2017 Annual Report to the School Community9
$103,909.00
$16,815,277.00
$15,000.00
$1,478,563.61
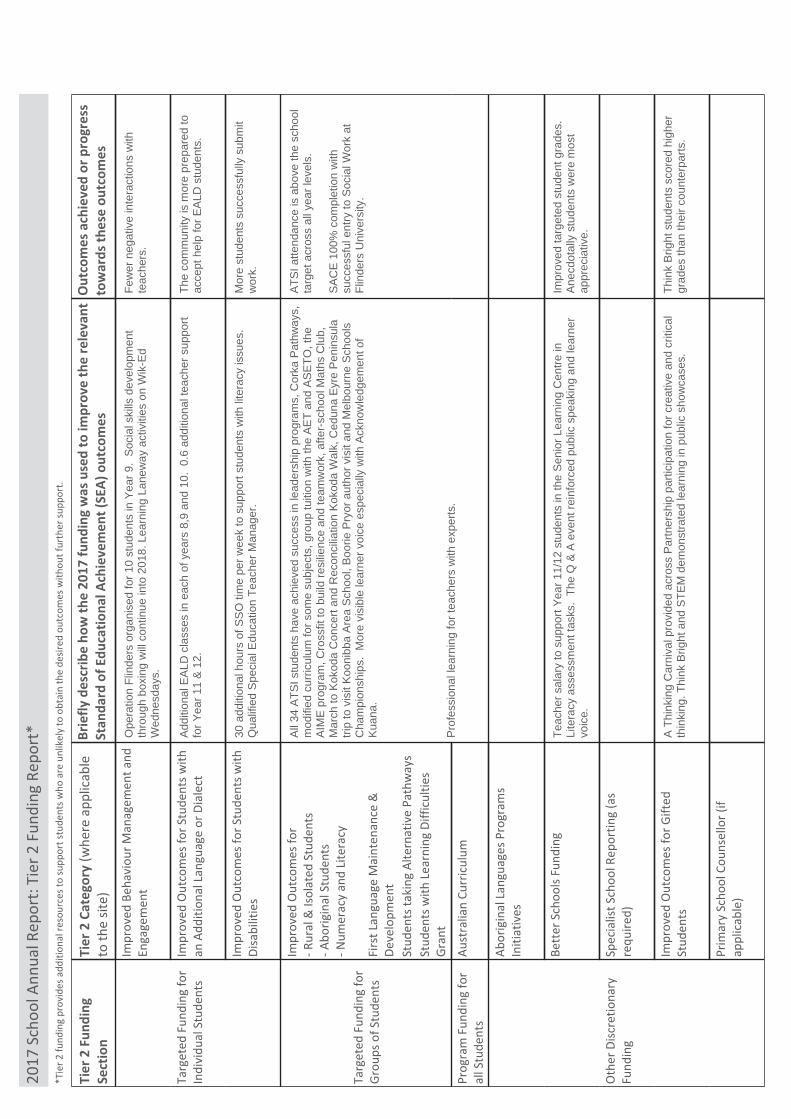
2017
Sch
ool A
nnua
l Rep
ort:
Tier
2 F
undi
ng R
epor
t*
Tier
2 F
undi
ng
Sect
ion
Tier
2 C
ateg
ory
(whe
re a
pplic
able
to
the
site)
Brie
fly d
escr
ibe
how
the
2017
fund
ing
was
use
d to
impr
ove
the
rele
vant
St
anda
rd o
f Edu
catio
nal A
chie
vem
ent (
SEA)
out
com
esO
utco
mes
ach
ieve
d or
pro
gres
s to
war
ds th
ese
outc
omes
Impr
oved
Beh
avio
ur M
anag
emen
t and
En
gage
men
t
Targ
eted
Fun
ding
for
Indi
vidu
al S
tude
nts
Impr
oved
Out
com
es fo
r Stu
dent
s with
an
Add
ition
al L
angu
age
or D
iale
ct
Impr
oved
Out
com
es fo
r Stu
dent
s with
Di
sabi
litie
s
Targ
eted
Fun
ding
for
Grou
ps o
f Stu
dent
s
Impr
oved
Out
com
es fo
r - R
ural
& Is
olat
ed S
tude
nts
- Abo
rigin
al S
tude
nts
- Num
erac
y an
d Li
tera
cy
Firs
t Lan
guag
e M
aint
enan
ce &
De
velo
pmen
tSt
uden
ts ta
king
Alte
rnat
ive
Path
way
sSt
uden
ts w
ith L
earn
ing
Diffi
culti
es
Gran
t
Prog
ram
Fun
ding
for
all S
tude
nts
Aust
ralia
n Cu
rric
ulum
Abor
igin
al L
angu
ages
Pro
gram
s In
itiat
ives
Bett
er S
choo
ls Fu
ndin
g
Oth
er D
iscre
tiona
ry
Fund
ing
Spec
ialis
t Sch
ool R
epor
ting
(as
requ
ired)
Impr
oved
Out
com
es fo
r Gift
ed
Stud
ents
Prim
ary
Scho
ol C
ouns
ello
r (if
appl
icab
le)
*Tie
r 2 fu
ndin
g pr
ovid
es a
dditi
onal
reso
urce
s to
supp
ort s
tude
nts w
ho a
re u
nlik
ely
to o
btai
n th
e de
sired
out
com
es w
ithou
t fur
ther
supp
ort.
Teac
hers
alar
yto
supp
ortY
ear1
1/12
stud
ents
inth
eS
enio
rLea
rnin
gC
entre
inLi
tera
cyas
sess
men
ttas
ks.
The
Q&
Aev
entr
einf
orce
dpu
blic
spea
king
and
lear
ner
voic
e.
Ope
ratio
nFl
inde
rsor
gani
sed
for1
0st
uden
tsin
Yea
r9.
Soc
ials
kills
deve
lopm
ent
thro
ugh
boxi
ngw
illco
ntin
uein
to20
18.L
earn
ing
Lane
way
activ
ities
onW
ik-E
dW
edne
sday
s.
ATh
inki
ngC
arni
valp
rovi
ded
acro
ssP
artn
ersh
ippa
rtici
patio
nfo
rcre
ativ
ean
dcr
itica
lth
inki
ng.T
hink
Brig
htan
dS
TEM
dem
onst
rate
dle
arni
ngin
publ
icsh
owca
ses.
30ad
ditio
nalh
ours
ofS
SO
time
perw
eek
tosu
ppor
tstu
dent
sw
ithlit
erac
yis
sues
.Q
ualif
ied
Spe
cial
Edu
catio
nTe
ache
rMan
ager
.
Add
ition
alE
ALD
clas
ses
inea
chof
year
s8,
9an
d10
.0.
6ad
ditio
nalt
each
ersu
ppor
tfo
rYea
r11
&12
.
All
34A
TSIs
tude
nts
have
achi
eved
succ
ess
inle
ader
ship
prog
ram
s,C
orka
Pat
hway
s,m
odifi
edcu
rric
ulum
fors
ome
subj
ects
,gro
uptu
ition
with
the
AE
Tan
dA
SE
TO,t
heA
IME
prog
ram
,Cro
ssfit
tobu
ildre
silie
nce
and
team
wor
k,af
ter-
scho
olM
aths
Clu
b,M
arch
toK
okod
aC
once
rtan
dR
econ
cilia
tion
Kok
oda
Wal
k,C
edun
aE
yre
Pen
insu
latri
pto
visi
tKoo
nibb
aA
rea
Sch
ool,
Boo
rieP
ryor
auth
orvi
sita
ndM
elbo
urne
Sch
ools
Cha
mpi
onsh
ips.
Mor
evi
sibl
ele
arne
rvoi
cees
peci
ally
with
Ack
now
ledg
emen
tof
Kua
na.
Pro
fess
iona
llea
rnin
gfo
rtea
cher
sw
ithex
perts
.
Impr
oved
targ
eted
stud
entg
rade
s.A
necd
otal
lyst
uden
tsw
ere
mos
tap
prec
iativ
e.
Few
erne
gativ
ein
tera
ctio
nsw
ithte
ache
rs.
Thin
kB
right
stud
ents
scor
edhi
gher
grad
esth
anth
eirc
ount
erpa
rts.
Mor
est
uden
tssu
cces
sful
lysu
bmit
wor
k.
The
com
mun
ityis
mor
epr
epar
edto
acce
pthe
lpfo
rEA
LDst
uden
ts.
ATS
Iatte
ndan
ceis
abov
eth
esc
hool
targ
etac
ross
ally
earl
evel
s.
SA
CE
100%
com
plet
ion
with
succ
essf
ulen
tryto
Soc
ialW
ork
atFl
inde
rsU
nive
rsity
.