bridges project final reportv3 - allen, shea
TRANSCRIPT

Bridges Project Final Database Summary and Excerpts from Selected Other Reports
November 2008

Bridges Project Final Database Summary and Excerpts from Selected Other Reports
November 2008
Prepared for California Department of Rehabilitation
Under Contract with Social Security Administration
Prepared by
Allen, Shea & Associates Evaluation Contractor
Acknowledgement This report would not have been possible without the support and
teamwork of the Department of Rehabilitation and the Bridges sites. They have made this experience a constant pleasure.

Table of Contents
Page Section I. Summaries of Selected Reports 1 Introduction 1
Reports Generated From October 2004 to September 2008 1
California Bridges State Evaluation - 2004 2
An Overview Regarding Levels of Independence and Self-Sufficiency for Bridges Participants - 2005
4
Collaborative Planning: A Key Element in Successful Transitions - 2005 5
2006 Site Visit Summary Regarding Bridges Services Coordination and Benefits Planning Practices
7
Bridges to Youth Self-Sufficiency Project Participants Who Left the Project 04 and 07
8
Bridges Survey Summary: Knowledge of Benefits, Future Plans and Quality of Life - 2005-2007
9
Summary of 2006 Satisfaction Survey Responses 10
Interagency Collaboration: A Key Element in Supporting Successful Outcomes (2004 – 2006)
10
Bridges Collaborating Agency Survey - 2006 12
Bridges Workshop Evaluations: 2004-2007 13
Summary of Participant and Family Interviews 2004-2007 14
Bridges Participants Not Currently Receiving SSA Benefits Comparison of Under and Over 18 - 2008
16
Some Initial Thoughts About Service Coordination and Benefits Planning in the Bridges Project - 2004
17
Tasks Performed by Bridges Staff - 2008 18
The Case for Testing Some SSI Waivers As Time-Limited Rewards -2006 19
Bridges Action Plan Report: A Brief Summary of Selected Queries - 2008 19
After Bridges Participant, Parent, Caregiver, Family Member Survey Summary - 2008
21
Interview Summary of Bridges Participants Not Working, Not Going to School -2007
22

Updated Overview Regarding Employment for Bridges Participants as of June 30th 2008
23
Movement Towards Less Reliance on SSA Benefits 24
Youth Transition from Supplemental Security Income (SSI) to Social Security Disability Insurance (SSDI) - 2008
25
Selected Employment Data for Bridges Participants Using SSA Benefits - 2008
26
Logic Model – 2008 28
Section II. Charts and Graphs From Selected Data 29 Introduction 29
What Can Be Learned from the Charts 29
Figure 1: Total Participants by Projects 30
Figure 2: Percentage of All Participants in School (K-22) 31
Figure 3: Participants Using SSA Benefits 31
Figure 4: SSI/SSDI Concurrent Beneficiaries 32
Figure 5: Participants by Gender 32
Figure 6: Ethnicity of Participants 33
Figure 7: Average Age of Participants 33
Figure 8: Participants by Major Living Arrangement 34
Figure 9: Participants by Primary Diagnostic Category 34
Figure 10: Primary Educational Placements of Bridges Participants in School
35
Figure 11: Participants by Employment Status 35
Figure 12: Percent of All Participants Working, Full or Part-time 36
Figure 13: If Working Average Hours Worked Per Week 36
Figure 14: If Working, Average Hourly Wage 37
Figure 15: If Working, Relationship to Minimum Wage 37
Appendix: Data Tables 38

Bridges Project Final Database Summary and Excerpts from Selected Other Reports
1
Section I. Summaries of Selected Reports
Introduction. This section includes a listing and brief summaries of many of the reports and special projects completed by the evaluation team during the course of Bridges. The summaries are loosely in chronological order with some attention to the grouping of similar topics (e.g., time and task, satisfaction). Reports Generated From October 2004 to September 2008
Twenty Quarterly Database Reports
Forty-two Monthly Overview Reports
Characteristics of Project ‘Leavers’
Description of Unique Site Attributes
Partnerships and Collaborations
Current 'Core' and Bridges 'Enhanced' Services
Description of 'Enhanced' Transition Services
Some Initial Thoughts About Service Coordination and Benefits Planning in the Bridges Project
Evaluating the Net Impact of BRIDGES: Pros and Cons of Alternative Comparison Groups
Interagency Planning Survey Summary
Core Responsibilities Visual and Narrative
Interagency Collaboration Baseline and Follow-Up Reports
Individual Outcome Survey and Self-Sufficiency Plan
An Overview Regarding Levels of Independence and Self-Sufficiency for Bridges Participants as of 1/31/05
Bridges Action Plan
Bridges Skill Sets
Bridges Baseline Service Satisfaction Report
Bridges Baseline and Follow-up on Individual and Family Interviews
Bridges Collaborating Agency Survey Summary of Results
Selected Employment Data for Bridges Participants 18-25 (In or Out of School) Using SSA Benefits
Bridges Satisfaction Survey Report 12-06

Bridges Project Final Database Summary and Excerpts from Selected Other Reports
2
Initial Action Plan Queries
Job Codes Across All Bridges Participants Work
Selected Bridges Quarterly Data from March 2004 to December 2006
2006 Site Visit Summary Regarding Bridges Services Coordination and Benefits Planning Practices
Baseline Action Plan Queries Report
Selected Query Report Regarding SSA Information
Employment Report
2006 Summary of Participant and Family Interviews
Summary of Workshop Evaluations (2004-2007)
Updated Overview Regarding Employment for Bridges Participants as of December 31st 2007
DOR Funded Report on Selected Youth Employment Programs in Relation to Successful Department of Rehabilitation (DOR) Case Closures, Employment and Earnings
Interview Summary of Bridges Participants Not Working, Not Going to School
Youth Transition from Supplemental Security Income (SSI) to Social Security Disability Insurance (SSDI)
Updated Overview Regarding Employment for Bridges Participants
Graphs Regarding Increase in Participants Who are Dual SSI/SSDI Recipients
Report Summaries. California Bridges State Evaluation - 2004 Introduction. For the past five years, evaluation activities have included: providing monthly and quarterly reports on basic demographic information (e.g., employment data, usage of SSA benefits); reporting selected participant data to the Social Security Administration; collecting and analyzing information on selected topics (e.g., service coordination and benefits planning, participant and caregiver satisfaction, interagency collaboration); conducting site visits (e.g., delineating best practices, interviewing participants and family members); participating in quarterly team meetings; and, working with the national evaluation team. In addition, ASA has developed and maintained a website for the Bridges team which can be found at http://www.allenshea.com/bridges.html. Two to four times per year (depending on the need), ASA visited each Bridges site for the purposes of: (1) reviewing site operations including collection of MIS data, individual service files, staff duties, local advisory committees; (2) determining how projects are finding ways to effectively achieve the goals of the Bridges project; (3)

Bridges Project Final Database Summary and Excerpts from Selected Other Reports
3
providing technical assistance with the Bridges database; (4) interviewing Bridges participants and their families regarding the level of services provided and satisfaction; and, (5) collecting information required for selected topic, State and Federal reports. Overview of the Inputs, Processes, and Outputs/Outcomes in Bridges Evaluation Activities. One way to describe the evaluation of a given “intervention” like those involved in the Bridges project, is to outline the inputs, processes and outputs/outcomes involved. Those three terms can be defined as follows:
� Inputs are the human, material, or financial resources involved in Bridges. � Processes are all the activities of the project. In general, processes involve
the use the resources or inputs in a project that will eventually produce outputs (e.g., units of service, like number of PASS plans written) and outcomes (e.g., beneficial changes in the student/family).
� Outputs/Outcomes can be (1) goals and objectives to be achieved; (2) units of service; and (3) outcomes (or beneficial changes from the service recipient’s point of view) that occur when inputs are transformed by the processes into units of service (e.g., 2-hour workshop for 10 families on SSA work incentives).
Below, is a summary of the inputs, processes, and outputs of the Bridges project.
INPUTS PROCESSES OUTPUTS Examples of Resources Examples of Activities Examples of Outputs or
Outcomes Participants and their
unique characteristics (e.g., age, disability, living arrangement)
Families and their unique characteristics (e.g., needs, expectations, culture)
Preexisting transition resources: Teachers, aides,
specialists, administrators
WorkAbility ($, staff, sites, slots)
Transition Partnership ($, staff, etc.)
Existing collaborative relationships
Benefits planning and assistance
Service coordination (augmenting ‘natural supports’ and teacher/aide assistance)
Added job development Education of individuals
and parents regarding SSA benefits, work incentives, self-advocacy and self-determination
Training of education and other agency staff regarding public benefits
Outreach to out-of-school and at risk youth with disabilities, foster youth, youth in the juvenile
Outputs: Person-hours of family
workshop services. PASS plans written. Other work incentives (e.g.,
Student Earned Income Exclusion; IRWE, Subsidy) used.
Accomplishments of Service Coordinator in helping to implement transition plans.
Increased interagency collaboration with local youth transition systems.
Outcomes (individual and family):
Changes in intentions and expectations of parents (and students).

Bridges Project Final Database Summary and Excerpts from Selected Other Reports
4
INPUTS PROCESSES OUTPUTS Examples of Resources Examples of Activities Examples of Outputs or
Outcomes Bridges-funded resources: Benefits Coordinator Service Coordinator Additional Job
Developer Social Security Waivers Local Project Advisory
Committees Local enhanced
interagency collaboration
Statewide Project Steering Committee
justice system and from diverse cultural backgrounds.
Early intervention strategies to provide options or alternatives to public benefits.
Program partnering with local service agencies to do certain things.
Tangible incentives provided to youth for being more self-sufficient.
Coordination of health care services, and planning for health care coverage.
Increase in employment outcomes (e.g., earnings, hours, career advancement).
Increase in self-sufficiency (e.g., living arrangement, transportation type and planning)
Decrease in (or non-use of) SSA and/or other public benefits.
Quality of Life Indicators: Individual satisfaction; Parental satisfaction; Level of self-determination/self advocacy; and, Improved living situation.
Individual and family satisfaction with Bridges services and individual outcomes
An Overview Regarding Levels of Independence and Self-Sufficiency for Bridges Participants - 2005 Introduction. The Social Security Administration (SSA) grant to California included measurement of a number of important outcomes. One of them was the level of independence. In the context of this project, SSA viewed greater independence as the [reduction of] benefits due to earnings, departure from the SSI or SSDI rolls, and reduced use of other public benefits. Of course, these outcomes are influenced by a number of underlying factors across individuals.
The Bridges project used several ongoing ‘proxy’ measures that would help predict movement towards greater independence. One such proxy was a series of survey questions about self-sufficiency. The project considered the likelihood that ‘movement’ towards greater self-sufficiency and greater independence would translate into less reliance on public benefits.
In order to see if differences in self-sufficiency measures generalize to other areas of life, data regarding a composite average score across six measures of self-sufficiency and hourly wages (of those currently employed part or full time, in or out of school) were scatter plotted. This data suggested that Bridges participants with higher average self-sufficiency were more likely: (1) to be working; and (2) to be working at a higher wage.
Bridges Project Final Database Summary and Excerpts from Selected Other Reports
5
We also learned that Bridges participants needed additional training and support across all areas of self-sufficiency. In particular, assuming more responsibilities around the house, planning and participating in social activities and getting around town. Of course, we believe that the ‘pay-off’ for increased self-sufficiency are greater employment outcomes (at least, in terms of hourly wages) and, most likely, less dependence on public benefits. Collaborative Planning: A Key Element in Successful Transitions - 2005
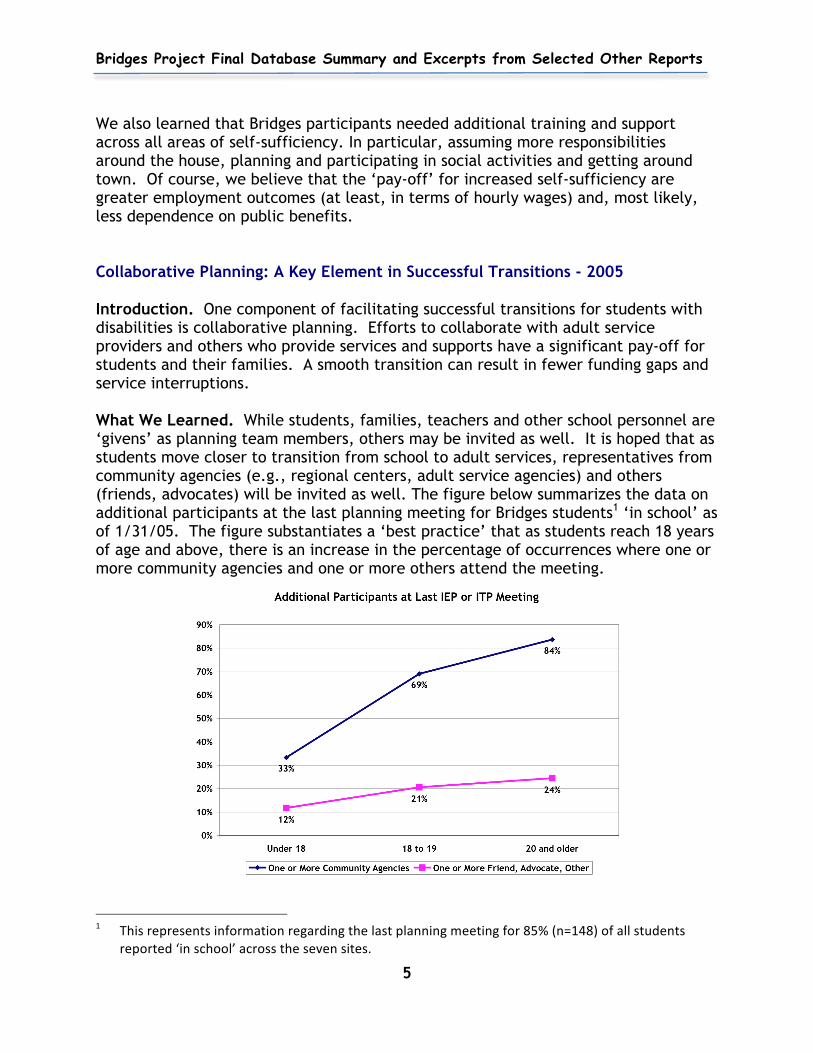
Introduction. One component of facilitating successful transitions for students with disabilities is collaborative planning. Efforts to collaborate with adult service providers and others who provide services and supports have a significant pay-off for students and their families. A smooth transition can result in fewer funding gaps and service interruptions. What We Learned. While students, families, teachers and other school personnel are ‘givens’ as planning team members, others may be invited as well. It is hoped that as students move closer to transition from school to adult services, representatives from community agencies (e.g., regional centers, adult service agencies) and others (friends, advocates) will be invited as well. The figure below summarizes the data on additional participants at the last planning meeting for Bridges students1 ‘in school’ as of 1/31/05. The figure substantiates a ‘best practice’ that as students reach 18 years of age and above, there is an increase in the percentage of occurrences where one or more community agencies and one or more others attend the meeting.
1 Thisrepresentsinformationregardingthelastplanningmeetingfor85%(n=148)ofallstudents
reported‘inschool’acrossthesevensites.

Bridges Project Final Database Summary and Excerpts from Selected Other Reports
6
Employer Involvement In it’s Request for Application, the Social Security Administration mentioned employer involvement as a proven best practice or strategy that they are interested in testing. While the Bridges database indicates that current or potential employers are rarely (if ever) at planning meetings2, input regarding employment strengths and support needs is typically requested from employers and employment support providers. Here are several examples from the sites that reflect other ways of employer involvement at both ‘individual’ and ‘systems’ levels:
Participation in monthly, Chamber of Commerce tabletop meetings. This is a networking meeting that gives job developers at one project site the opportunity to sit down with about 10 employers to talk about the general employment needs of Bridges participants.
Job developers at middle schools work with cooperative employers to set up
tours as a part of their career exploration and work experience programs.
Employers routinely speak to middle and high school classes about employment and career opportunities.
Employers typically prefer to provide feedback on individual performance as it
occurs and, especially, if some job-related problem needs a resolution.
If a job coach is assigned to support an individual, he or she acts the liaison between the school/transition program and the employer. Communication and timely response is a key to a successful individual job placement (and future placements) with an employer.
Smaller business owners often tend to be more directly involved with individual
placements than do their counterparts in large franchise of chain-operated businesses.
In the latter, ‘floor’ or ‘shift’ supervisors represent managers. Proactive
communication with transitioning supervisors (especially in high turnover occupations) is critical!
2 Theprimaryreasonthatemployersdonotattendindividualplanningmeetingsisthatthebusiness
does,andshould,comefirst!Anotheristhatemployers[accurately]viewthesemeetingsasfocusedonschoolrelatedmatters.

Bridges Project Final Database Summary and Excerpts from Selected Other Reports
7
2006 Site Visit Summary Regarding Bridges Services Coordination and Benefits Planning Practices About the Site Visits. In May and June 2006 site visits, staff interviews and staff questionnaires were conducted in order to better understand how Bridges services were provided and how they are similar or different across sites. Summary. The visits provided insight into how staff at each of the sites carries out the tasks to serve Bridges participants and their families. In general, we found that:
• Sites showed remarkable similarities in their approaches to and the value they placed on building relationships and trust.
• Staff reported the several adaptations to tasks related to intake, assessment,
service planning, vocational training and service coordination.
• A comparison of how staff spends their time at each site showed evidence of job specialization around benefits planning and service coordination tasks.
• Overall, the interviews highlighted the dedication and creativity that the staff
brings to their work as they assist Bridges participants and families in meeting their immediate needs and planning for their futures.
The information from the site visits was used to further clarify the time recording categories. An improved understanding of how staff spends their time resulted in revised time recording categories in August 2006.

Bridges Project Final Database Summary and Excerpts from Selected Other Reports
8
Bridges to Youth Self-Sufficiency Project Participants Who Left the Project 04 and 07 Introduction. Although there have been few challenges for Bridges sites in the recruitment and retention of participants, there has always been some turnover. The reasons stated for leaving the project are varied, but the themes changed somewhat over the five years. Early on in the project, sites developed the following criteria for considering participants as inactive:
� Formally (e.g., mutually agreed upon, parent request) or informally (e.g., refuses to complete follow-along interview) ends participation in project activities; or
� Moves out of area; or � Out of school longer than five years; or � Unable to contact after three or more attempts.
Differences Between October-December 2004 and October-December 2007. The sample on the table below is very reflective of the database, that is: (1) the rate of turnover decreased considerably over the life of the project; and (2) fewer participants left because of lack of contact or a decision to end participation (e.g., no longer interested).
Time Period Reason Number Moved out of area 5 Formally or informally ended participation
9
Behavior challenges 2
October – December 04
Total for quarter 16 Moved out of area 4 October –
December 07 Formally or informally ended participation
3
Total for quarter 7

Bridges Project Final Database Summary and Excerpts from Selected Other Reports
9
Bridges Survey Summary: Knowledge of Benefits, Future Plans and Quality of Life - 2005-2007 About the Survey. Four different surveys were used by the Bridges sites to measure:
• Knowledge of Social Security Benefits (“Test Your Knowledge” and “Understanding Your Benefits”); and
• Perspectives about future goals and quality of life (“Project Questionnaire-Participant” and “What are your Thoughts about Your Son’s or Daughter’s Life in the Future?”).
This report describes what was learned from those surveys about: (1) participant and parents’ knowledge of the aspects of working and benefits that are the focus of the Bridges program; (2) goals for the future as described by participants and parents; and (3) parents’ descriptions of a good quality of life for their son or daughter.
The Bridges program focused on making information about benefits useful to the participants. In this same spirit, the implementation of the evaluation varied across sites and over time depending on what each site felt was useful to the program. As a result, the content and distribution of the surveys were modified over time and across sites. This summary specifically highlights areas that were asked in a consistent or comparable way.
Pre and post-tests were used when available. When pre and post tests were not distributed consistently, only the post tests were used in the summary. Summary. A review of surveys distributed to participants in the Bridges program and their parents shows
• Increased knowledge of benefits,
• A variety of educational and employment goals and
• The need for ongoing support to reach these goals.
The surveys submitted showed an improvement in parent and participant’s knowledge of benefits after receiving various Bridges interventions (e.g., workshops, individual consultations, printed materials).
When surveyed about the future, participants and parents typically described employment and education goals. Participants indicated the types of support they need to reach those goals: job coaching and training, information about how to access colleges, and assistance with obtaining and maintaining financial resources.
In describing a good quality of life for their son or daughter, parents were most likely to mention employment and socialization. Many parents indicated they want their son or daughter to be independent and several outlined the support that would help

Bridges Project Final Database Summary and Excerpts from Selected Other Reports
10
their child increase or maintain independence: supported living arrangements, job coaches and accessible transportation.
Summary of 2006 Satisfaction Survey Responses About the Survey. This report was prepared to inform the Bridges project staff on the individual and family satisfaction with Bridges services. The Bridges Satisfaction Survey was developed in 2005 by the evaluation team in collaboration with staff. It was distributed to parents and participants by mail in 2005 and in 2006. The 2005 surveys were summarized in a previous report. The response rate in 2005 was not as high as the evaluation team had hoped, and several measures were taken in 2006 to improve the number of surveys returned. In 2006, the survey packet included a cover letter signed by local Bridges staff and a one-dollar bill. Each respondent was offered a chance to win movie tickets if the survey was returned within a two-week time period and tickets were awarded in each of the seven regions. All surveys were returned in a self-addressed, stamped envelope directly to the evaluation team. Summary. The Bridges project continues to provide excellent service to participants and parents. Respondents to the 2006 Bridges Satisfaction Survey rated the staff, the workshops, the written information and the planning services very highly. As this was the second year this survey was distributed, this report compares the information collected in 2005 to the responses received in 2006. Responses were overwhelmingly positive, and on most measures the Bridges project showed improved ratings from parents and participants. Areas that respondents indicated could use improvement included: providing more written information; reducing language and scheduling barriers for parent workshops; and customizing services and supports for participants and parents as needed. Interagency Collaboration: A Key Element in Supporting Successful Outcomes (2004 – 2006) About the Survey. In order to look at differences in interagency relationships between sites and their ‘major’ partners over time, sites were asked to describe the types of interagency relationships using a checklist. They were asked to: (1) choose their five major transition partners and to include the Social Security Administration (SSA) in their top five; and (2) describe their interagency relationships through a checklist of collaboration activities. While there were many differences in the ‘top 5’ choices, all sites agreed that the Department of Rehabilitation (DR) and the Regional Center were major players in the network.

Bridges Project Final Database Summary and Excerpts from Selected Other Reports
11
What We Learned? Here’s what we learned about the interagency relationships with SSA, DR and Regional Centers:
The relationship between DR and the Bridges sites changed very little (no more than a ‘one site’ difference in rating) from 2003 to 2005. However, the ratings in all areas were very high from the start (even in the more difficult categories of collaboration activities). This likely reflects the long-standing relationships between the sites and DR. In addition, these relationships are defined by both contract language (e.g., Transition Partnerships) and well-defined, known procedures.
The relationship between regional centers and Bridges sites typically declined
across all areas of collaboration from baseline 2003 through 2004-2005. Actually, the ratings in all areas were very low from the start. This finding likely reflects: (1) differences from regional center to regional center in organizational structure (e.g., some have Transition Units, some do not); (2) turnover in service coordinators; and (3) a lack of defined procedures and relationships between school districts and their regional center partners.
In regards SSA, the relationship changed dramatically from literally no
relationship to a mature relationship in about two and a half years. Again, as with DR, the presence of contract language and a defined procedure has facilitated a multi-faceted, collaborative partnership between Bridges sites and SSA in a very short time. Sites point out that barriers to developing relationships with SSA are primarily a function of turnover in staff or a consolidation or moving of offices.
Primarily, we learned that interagency collaboration is quite likely directly affected by policy and practice. In the case of DR and SSA, the presence of contract language and well-defined procedures facilitates and supports multi-faceted, collaborative partnerships. We also noted that five of seven sites indicated one or more different agencies in the list of ‘top five’ collaboration partners (not including SSA) from 2003 to 2004. These changes tended to be new collaborations with either school-based, or community employment providers. This makes sense because as the Bridges project has developed, employment has become a major focus. In addition, five of seven sites suggested one or more different agencies in their ‘top five’ collaborators (not including SSA) from 2003 to 2004. Changes in top five lists tended to be additional collaboration with either school-based, or community employment providers.

Bridges Project Final Database Summary and Excerpts from Selected Other Reports
12
Bridges Collaborating Agency Survey - 2006 About the Survey. To look at differences in interagency relationships between sites and their ‘major’ partners over time, sites were asked to describe both the types (e.g., informative, collaborative, cooperative) and the status (e.g., underdeveloped, good) of interagency relationships. However, information on interagency collaboration was always provided from the Bridges site perspective. In order to capture other perspectives, we have recently completed a survey of local, collaborating agencies regarding their relationships with Bridges. Summary. A total of one hundred and sixty-six surveys were mailed and eighty were returned, for a response rate of forty-eight percent. What we learned from respondents, who have worked with Bridges staff on either a regular basis or infrequent basis, is that:
Requests to respondents for information regarding Bridges participants are reasonable (98%);
Requests to Bridges from respondents for information regarding Bridges participants are completed in a timely way (100%) and that the information is useful (100%);
When Bridges staff share information about benefits and work incentives, it is helpful (100%);
As planning team members, Bridges staff are cooperative (100%) and responsible (98%);
Most respondents (95% Strongly Agree or Agree) rate their working relationship with Bridges staff as a good one; and,
Most respondents (96% Strongly Agree or Agree) that the Bridges project has made a positive impact for Bridges participants.
The figure on the following page suggests that the more frequent the contact between Bridges staff and other agency personnel, the higher the ratings regarding a positive impact for Bridges participants.

Bridges Project Final Database Summary and Excerpts from Selected Other Reports
13
This survey of Bridges partner agencies corroborates what we also learned from families and participants. That Bridges staff have positive attitudes, are helpful and responsive. In addition, they are collaborative, cooperative partners who understand and practice teamwork. Also, that staff knowledge of benefits and effects on work are invaluable to participants, families, and other agencies as well. We also learned that partner agency perceptions of Bridges grow positively as the frequency of their interactions increase.
Bridges Workshop Evaluations: 2004-2007 About the Evaluations. Part of the Bridges program involved workshops for participants, parents of participants and service providers who work with participant. This report summarizes the workshop evaluation forms that were completed by attendees between April 2004 and March 2007 and forwarded to the evaluation team. Summary. The key findings reviewed in this summary are detailed below:
Attendees rated the workshop presentation and content highly.
� 93% rated the presentation as “Great” or “Good”, 92% indicated the speaker answered all of their questions, and 94% reported the speaker used terms that were understandable.
� 94% rated the workshop content as “Great” or “Good” and 99% noted the information was useful.

Bridges Project Final Database Summary and Excerpts from Selected Other Reports
14
There were common themes when attendees were asked about additional workshops.
� The most frequently noted areas for additional workshops and information were Independent Living Options (29%), Living Trust/Wills/Special Needs Trust (29%) and Adult Service Providers (26%).
Specifically, attendees noted that the knowledge gained and the opportunities to network were the best parts of the workshops.
� 94% rated the workshop overall as “Excellent” or “Good.” � Networking and Knowledge gained were both cited as important benefits. � 88% reported an “Excellent” or “Good” understanding3 of the workshop
topic after the presentation, compared to 30% prior to the presentation. Summary of Participant and Family Interviews 2004-2007 About the Interviews. Beginning in 2004, individual interviews were conducted each year with a sample group of Bridges participants and /or their families. Usually occurring in late September, interviewers met with largely the same core group of participants and families each year. The initial goal was to interview around 6-8 participants and/or families at each site so that the total would be 50 or more (representing about 20% of all participants and families). Additional Bridges participants and families were added to each year’s schedule as needed to replace individuals who had left the program. Members of the Bridges state evaluation team conducted the interviews each year. The original seven-question interview and protocol was developed with input from the Bridges program staff at all the school districts. In Year 3, the interview questionnaire was modified with 6 additional questions or sub-questions. This adaptation proved helpful to capture more specific feedback among the participants after three full years of the project implementation. In the event that Spanish was the primary language of the participant and/or family, a bilingual and bicultural team member conducted the interview in Spanish. While the findings from these interviews do not represent all Bridges participants, they helped inform the sites and others about differences in goals and expectations over time. General Observations. Participants and families who were interviewed continued to be cooperative and candid in their response to questions about the Bridges program. Since Bridges was a new program at the time of the initial interview, responses were sometimes limited. Often, participants and families could only reflect their thoughts about the enrollment process and initial contacts and little about service coordination and benefits planning. Responses in year 2 were much more thorough. And in 2006, it was notable that many participants and family members were more forthcoming in
3Somerespondentsusedadifferentscalenotingtheyhad“Alot”or“Some”knowledgeofthetopic.

Bridges Project Final Database Summary and Excerpts from Selected Other Reports
15
expressing their views based on having had more time and comfort level being connected to the Bridges project. What we learned from the final year of interviews is that, in general, participants and families:
1. Recognize their expanded knowledge about Social Security benefits.
2. Reaffirm their appreciation for the Bridges program as the conduit for that knowledge.
The continuity of Bridges staff members over the past 4 years is likely one of the factors that resulted in participants and families feeling so closely aligned with the program. The role and scope of the Bridges project was, at the beginning, a new enterprise for everyone involved. However, as participants and families engaged in the services offered by the program, the purpose became more concrete. Here are some additional findings from the final round of interviews:
• In 2007, the number of interviewees who reported they were working part-time, more than doubled from the previous year.
• Community Colleges, Adult Education and Transition programs prove to be popular paths for achieving post high school vocational skills or certification status. (e.g., Early Childhood Development, Auto Mechanic, Food and Beverage).
• “Job Club” and other job training opportunities provided for many individuals, a variety of safe trials to explore their work options. Responses from Year 3 interviews in comparison to Year 4 indicate that this led to refinement of work goals (“work in movies” to “a design job in animation” or “working with kids” to “pre-school teacher”, or “music industry” to “my own DJ business”.)
• Social development and friendship outlets could be a “rocky transition” for some participants after graduating high school.
• In Year 4, the coordinated and concentrated efforts with actively involved families and participants seemed to be where some of the more creative and progressive use of benefits occurred (e.g., IDA accounts, home purchases, etc.).
• Awareness of the end of the Bridges project generated many comments of concern. There were also, a number of responses that indicated the resiliency of families and participants to “go forward ” on their own with the knowledge and access they had gained from Bridges to consider future services and supports.
• More than in previous years, interviewees mentioned other service systems such as Regional Center, Department of Rehabilitation, HUD. This could be
Bridges Project Final Database Summary and Excerpts from Selected Other Reports
16
attributed to greater understanding of how the systems work and willingness to access those services.
• Families and participants greatly appreciated the individualized approach to services and supports. This is said to distinguish Bridges from most, if not all, other services they encounter.
• There is genuine trust of Bridges staff and their expertise about benefits and employment.
• Regardless of their current use of Social Security benefits, families and participants are learning about Social Security disability benefits and are less fearful, and more hopeful, about using this support.
• For the most part, many Bridges participants have made progress towards expectations and goals of greater independence (e.g., living independently, living with a roommate).
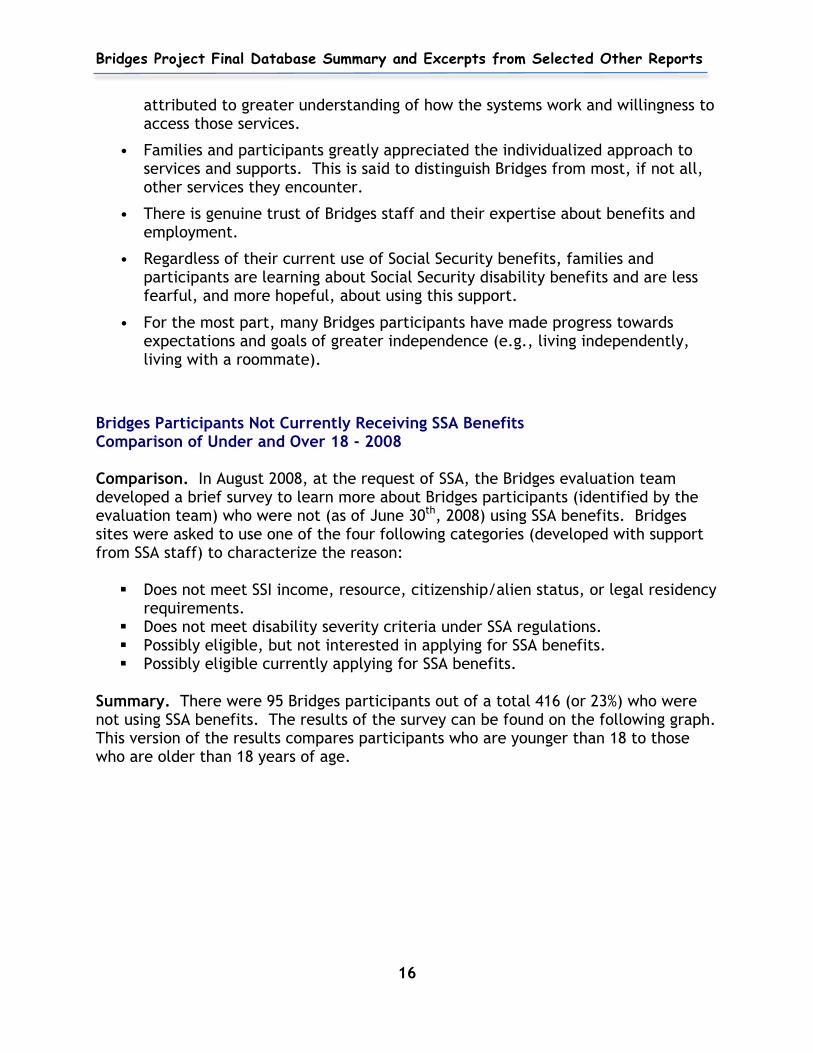
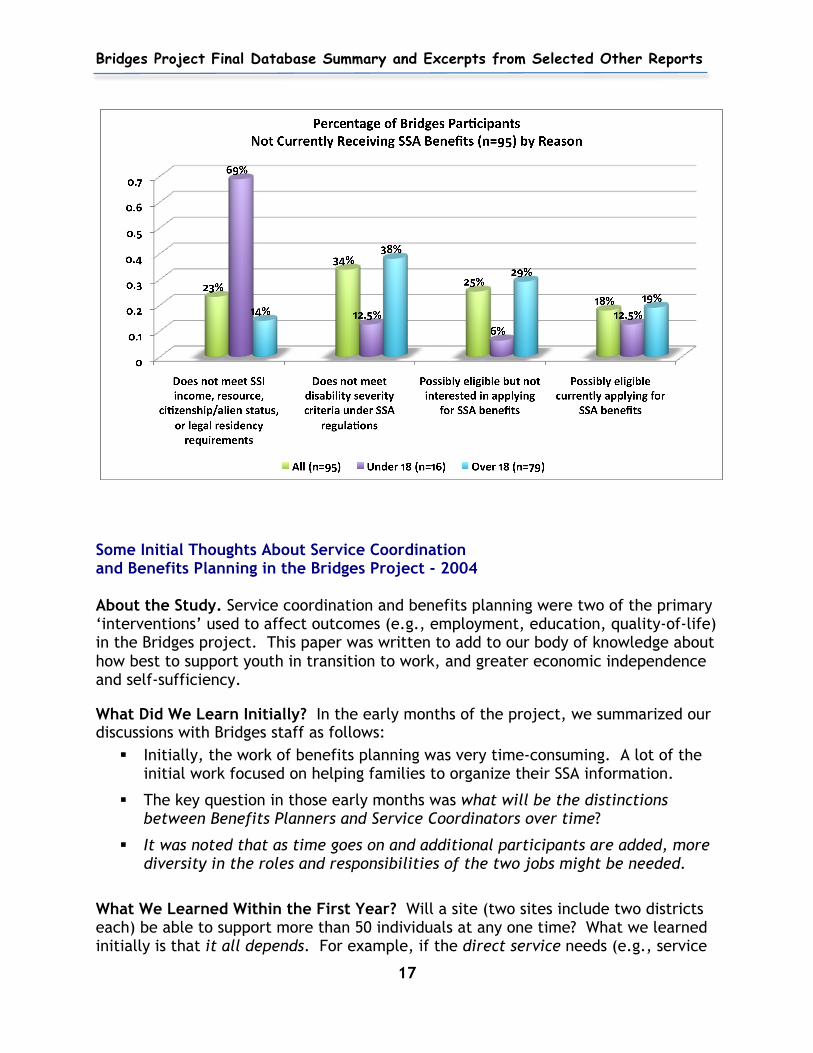
Bridges Participants Not Currently Receiving SSA Benefits Comparison of Under and Over 18 - 2008 Comparison. In August 2008, at the request of SSA, the Bridges evaluation team developed a brief survey to learn more about Bridges participants (identified by the evaluation team) who were not (as of June 30th, 2008) using SSA benefits. Bridges sites were asked to use one of the four following categories (developed with support from SSA staff) to characterize the reason:
Does not meet SSI income, resource, citizenship/alien status, or legal residency requirements.
Does not meet disability severity criteria under SSA regulations. Possibly eligible, but not interested in applying for SSA benefits. Possibly eligible currently applying for SSA benefits.
Summary. There were 95 Bridges participants out of a total 416 (or 23%) who were not using SSA benefits. The results of the survey can be found on the following graph. This version of the results compares participants who are younger than 18 to those who are older than 18 years of age.
Bridges Project Final Database Summary and Excerpts from Selected Other Reports
17
Some Initial Thoughts About Service Coordination and Benefits Planning in the Bridges Project - 2004
About the Study. Service coordination and benefits planning were two of the primary ‘interventions’ used to affect outcomes (e.g., employment, education, quality-of-life) in the Bridges project. This paper was written to add to our body of knowledge about how best to support youth in transition to work, and greater economic independence and self-sufficiency.
What Did We Learn Initially? In the early months of the project, we summarized our discussions with Bridges staff as follows:
Initially, the work of benefits planning was very time-consuming. A lot of the initial work focused on helping families to organize their SSA information.
The key question in those early months was what will be the distinctions between Benefits Planners and Service Coordinators over time?
It was noted that as time goes on and additional participants are added, more diversity in the roles and responsibilities of the two jobs might be needed.
What We Learned Within the First Year? Will a site (two sites include two districts each) be able to support more than 50 individuals at any one time? What we learned initially is that it all depends. For example, if the direct service needs (e.g., service

Bridges Project Final Database Summary and Excerpts from Selected Other Reports
18
coordination, benefits planning, job development) of most individuals served are high, the total number served will be lower than if there is some balance between direct service and resource information and referral needs. Also, there are two major transition times for most school-aged participants who enter the program (18 and 22) that will affect how many people can be supported.
We used the time sheets from one benefits planner to look at a baseline of how time is allocated across work categories. Here’s what that 2004 baseline indicated:
Trends for outreach and referral/intake are very similar and move up and down together.
Time for interagency collaboration appears to be most affected by upward trends in benefits planning and administrative services.
Service coordination trended down as benefit planning trended up.
The first two months after the enrollment of a participant are the most ‘intense’ in terms of benefits planning and service coordination.
Tasks Performed by Bridges Staff - 2008 As a follow-up to the above report completed in 2004, we produced two follow-up reports in 2006 and 2008. The 2006 report titled “How Bridges Staff Spent Their Time” differs from 2008 report in two respects:
1. This report covers a time period (Year 4, largely) well into the five-year Bridges project. The earlier report covered six quarters in Years 1 and 2 of the project.
2. Seventeen task areas were named in the earlier report. Considerable guesswork was involved in categorizing work. Based on interviews in the field in 2006, and back-and-forth conversations with Bridges staff, a revised, simpler configuration of eight task areas was designed.
Summary. Benefits planning and assistance and Updating case notes/work with evaluators, combined, accounted for about 35% of all project time spent by Benefits Coordinators and Service Coordinators. Across eight task areas, Service coordination ranked 5th, accounting for about 12% of all time used by BCs and SCs. The increase in the percentage of work time devoted to Benefits planning and assistance (about 8%, in the earlier report, to 18% in this report) reflects, in part, the increased number (and percentage) of project participants receiving Social Security benefits and working. Within a five-quarter period, the relative number of hours devoted to Benefits planning by Benefits Coordinators increased. In the earlier report, both Benefits Coordinators and Service Coordinators spent about the same amount of time helping

Bridges Project Final Database Summary and Excerpts from Selected Other Reports
19
people with financial planning and public benefits. Both were getting up to speed on the very complex system of public financial (and health) benefits. With the passage of time, it is clear that there was increased specialization and division of labor. By the final quarter of 2007, BCs were spending just over 30% of their time on Benefits planning and assistance, while SCs were spending about 10% of their time on such matters. As one would expect, SCs spend a higher proportion of their time on Service coordination than BCs. Other uses of staff time varied somewhat over the five quarters we studied. Because the Bridges project was to end on September 30, 2008, Bridges staff were working with participants, especially those earning more than $85 per month, in hopes of assuring a smooth landing when the $1 for $4 SSI waiver ended, and SSI recipients were faced once again with the $1 for $2 Additional Earned Income Exclusion. This doubtless accounts for a rather sharp drop in the proportion of time spent by BCs and SCs on Intake, assessment, and service planning, from 6.3% in the 4th quarter of 2006, to 3.8% a year later. The Case for Testing Some SSI Waivers As Time-Limited Rewards -20064
Introduction. There is reason to believe that liberalization within SSA disability benefit programs has been a key factor in widening of the gap in employment rates between working-age adults with disabilities and those without. Summary. The $3 for $4 waiver appears to have helped (increase employment in New York, increase earnings in California), but not enough to offset the increased outlays attributable to this waiver. SSI waivers (work rule changes) that provide a greater incentive to work are worthy of careful testing. The $3 for $4, as a freely available (non-contingent) incentive, may not be as powerful in the right direction (i.e., greater self-sufficiency) as it would be as a reward contingent not only on wanting to work (in a verbal sense), but taking action (with any needed assistance) to work, earn, and be more self-sufficient. Bridges Action Plan Report: A Brief Summary of Selected Queries - 2008 Introduction. In 2006, The Bridges Project developed an Action Plan to be used as a: (1) an agreement regarding the types of service provided by Bridges staff to individuals and their families; (2) a method to track growth in knowledge and actions about benefits, self-sufficiency, and independence; and (3) a way to structure and sequence the types of activities in which participants and families would participate. While considered to be an agreement, it was not a legal contract nor does it supplement to the Individual Education Plan (IEP) or other legally authorized plans.
4Thispaperwaswrittenoutsideofcontracthoursforthisproject.

Bridges Project Final Database Summary and Excerpts from Selected Other Reports
20
As of 2/29/08, 93% of all participants’ plans had been entered into the Bridges database. This report summarizes selected information from the database. It served as a follow-up to a baseline survey completed in 2006:
In aggregate, about two thirds of participants using Social Security benefits and had completed a benefits analysis with Bridges staff. About half of participants currently use Special Education, Department of Rehabilitation, or Regional Center services. Approximately one quarter of participants use services provided through the Community College, Transition Partnership, or Workability.
The Action Plan included a set of skill sets agreed upon by Bridges staff as
important in mastering knowledge of Social Security and other benefits. The data query suggested that very few participants had mastery over any of the skills prior to enrollment in Bridges. About fifty percent mastered basic awareness of benefits as a result of Bridges participation. Roughly forty percent mastered general knowledge of SSA procedures and took responsibility for presenting documents to SSA as needed (e.g., pay stubs). The most difficult skills to master for Bridges participants were organization of SSA paperwork, understanding and planning for overpayments, and using benefits analysis tools.
The Action Plan included a set of skill sets agreed upon by Bridges staff as
important in mastering greater independence and self-sufficiency in community life and employment. With the exception of awareness of public transportation, the data suggested that few participants had mastery over any of the skills prior to enrollment in Bridges. About a third of participants mastered basic awareness of public transportation and general money management as a result of Bridges participation. About twenty-five percent have mastered general knowledge of typical adult services and supports (e.g., Regional Center, IHSS). The most difficult skills to master for Bridges participants were knowledge of services and supports needed to live and work independently, use of benefits information in planning, and knowledge of and application for typical community services.
The Action Plan included a method of indicating the types of activities used to
develop mastery of skill sets. The primary method for providing information and/or instruction was individual contact. Fifty percent of all Bridges activities with individuals or families were completed with face-to-face meetings or phone contacts. Small groups and workshops are used in roughly the same percentages for both benefits planning (sixteen and thirty-eight percent respectively) and independent living and self-sufficiency (sixteen and thirty-one percent respectively). Referral to other agencies (e.g., Independent Living, Disability Resource Centers) accounted for about six percent of all information and/or training in independent living and self-sufficiency.

Bridges Project Final Database Summary and Excerpts from Selected Other Reports
21
After Bridges Participant, Parent, Caregiver, Family Member Survey Summary - 2008 About the Survey. In the last six months of the project (October 2002 through September 2008), all Bridges sites completed ‘exit interviews’ with participants and their families. The purpose of this face-to-face meeting was to provide: (1) information about what to expect when the project ended (e.g., waivers, availability of Bridges staff); (2) a resource binder of materials (e.g., Social Security, community services, contact lists) for use beyond September 2008; and (3) answer questions and concerns about the future (e.g., relationship with SSA staff, effects of changes in waives on income, etc.). In order to gather information about overall satisfaction with the Bridges project as well as service and support needed after the project ended, all participants and families/caregivers (if appropriate) were asked to complete a survey. The survey was provided at the exit interview along with a self-addressed, stamped envelope. The completed survey was mailed to the evaluation team. A small remuneration was provided whether or not the survey was completed. Summary. Participants and parents remained steadfast in their enthusiasm for Bridges staff and the information (e.g., community resources, public benefits), training (e.g., budgeting, understanding benefits, reporting wages), and support (e.g., applying for services, advocacy with SSA and community service agencies) they have provided. They also identified these as important needs after the project has ended. This is likely because of the smaller than typical (e.g., Regional Center, Department of Rehabilitation) staff-to-participant ratio. This has afforded far greater individualized service coordination. Additionally, the benefits planning aspect of the project is simply not available with most or all other support agencies and is a critical aspect of the service relationship. While participants and parents were less concerned about losing SSA and medical benefits, they requested ongoing support in understanding the effects of SSA on work. This could be due, in part, because of the elimination of waivers (especially the Student Earned Income Exclusion and the $1 for $4) at the end of the project. It’s also obvious that Bridges participants and parents appreciated the benefit of a ‘facilitated’ relationship with SSA staff and were weary that it would change. Any or all of these services and supports that can be provided to Bridges participants after the project has ended will increase the likelihood of positive and long-term outcomes in employment, decreased use of public benefits, and quality-of-life.

Bridges Project Final Database Summary and Excerpts from Selected Other Reports
22
Interview Summary of Bridges Participants Not Working, Not Going to School -2007 Introduction. Each month, there were Bridges participants identified in the database as having left school (K-22) and who were currently not working or going to school (e.g., post-secondary training or education). Since employment and post-secondary education are important outcomes for the Bridges project, participants who were not employed or seeking further education and training were of particular interest. In order to better understand why this occurs, the Bridges evaluation team developed an interview tool regarding barriers to employment. This document is a summary of those interviews. What We Learned. When asked whether they had been employed in the past two years, sixty-six percent (14/21) of the participants interviewed answered in the affirmative. Some indicated that (see Table 3) they had one job and others three or more jobs in that time period, although they were not currently employed. In addition, participants who had worked in the past two years were asked why the job ended. Most participants either quit, were fired, or had seasonal work that ended.
Each interviewee was asked to describe their work situation right now. Participants indicated their top five current employment status descriptors as: need more training; looking for work; unable to find a job; need transportation; and, unwilling to give up benefits. In order to obtain a ranking of employment barriers, participants were asked what gets in the way of work the most, next, and so on. Medical/health problems, transportation, help finding a job, training and anxiety or depression were the most common barriers to employment.
Summary. This brief report provided a picture of the back-story for why Bridges participants who are out of school (K-22) are not working or going to post-secondary education or training. We know that those who continue to seek employment are typically unable to find a job match (e.g., skills required, hours or schedule) or do not have adequate transportation resources. Also, those who are not seeking employment have health or mental health challenges or are concerned that they may have to give up benefits. According to Bridges staff interviewed, one overarching factor in successfully finding and maintaining employment for many of these participants may be a more active connection to and participation in the Bridges program.

Bridges Project Final Database Summary and Excerpts from Selected Other Reports
23
Updated Overview Regarding Employment5 for Bridges Participants as of June 30th 20086
Introduction. On a periodic basis, the evaluation team prepared a brief overview of the employment status of Bridges participants. This is the final in that series of reports.
Employment Data Across All Participants (n=416)
Month
Percentage of All Participants
Working (Paid Work)
Average Hours Worked Per Week Of Total Working
Average Hourly Wage Of Total
Working
Percentage of Total Working
with Subsidized Wages
June Working (n=214)
51% 20.7 $8.22 18%
Range of hours worked per week across all participants: 2-50 Range of per hour wage across all participants: $1.23-$25.00
Minimum Wage Across All Participants Who Work (n=214)
Month
Percentage of Those Working Below State
7
Minimum Wage
Percentage of Those Working At
State Minimum Wage
Percentage of Those Working
Above State Minimum Wage
Percentage of Those Working Above Federal Minimum Wage
June Working (n=214)
16% 42% 42%
88%
Employment Data Across Out-of-School Participants (n=214)
Month
Percentage of Out-of-School Participants
Working (Paid Work)
Average Hours Worked Per Week Of Out-of-School
Working
Average Hourly Wage Of
Out-of-School Working
Percentage of Out-of-School Working with
Subsidized Wages
June Working (n= 139)
62% 23.0 $8.29 13%
5 Work here is defined as any participant with any hours of paid work in a given week. 6 Prepared for the California Department of Rehabilitation by Allen, Shea & Associates. 7 California minimum wage increased to $8.00 per hour on January 1st 2008; and Federal minimum wage increased to $5.85 on July 24th 2007.

Bridges Project Final Database Summary and Excerpts from Selected Other Reports
24
Use of Waivers by Bridges Recipients Currently Using SSI Benefits (n=221)
Waiver Number Percentage of Total n
Student Earned Income Exclusion 46 21% 1 for 4 (participants with earned income) 118 53%
Individual Development Accounts 1 .04% All PASS Plans 4 2%
Status of Bridges Participants Out of School and Not Working (n=60)
Look
ing
for
wor
k
Stay
ing
hom
e to
tak
e ca
re o
f fa
mily
Una
ble
to g
et c
hild
ca
re h
elp
Una
ble
to f
ind
job
Una
ble
to w
ork
due
to h
ealt
h pr
oble
ms
Una
ble
to f
ind
tran
spor
tati
on
Unw
illin
g to
giv
e up
SS
I or
othe
r be
nefi
ts
Nee
d m
ore
trai
ning
fo
r jo
b
Uni
nter
este
d in
w
orki
ng
Non
e
Wor
k at
hom
e
June 08 42% 5% 3% 33% 25% 6% 2% 25% 8% 6% 0%
Job Codes Across All Bridges Participants Who Work (n=214)

Bridges Project Final Database Summary and Excerpts from Selected Other Reports
25
Examples of Job Titles Job Codes Examples of Job Titles Agricultural, Fishery, Forestry, and Related Occupations
Garden Assistant
Clerical and Sales Occupations
Clerical Assistant, Cashier/Sales Assistant, Stock Assistant, Substitute Secretary Sales and Stock Assistant, Sales Associate Cashier/Sales Assistant, Clerical, Food Sales
Machine Trades Occupations Grinder Miscellaneous Occupations Customer Service, Lifeguard, Coach Professional, Technical, and Managerial Occupations
Lab Assistant, Technical Assistant, Interpreter
Service Occupations
Cart Handler, Courtesy Clerk, Pre-school Assistant, Dishwasher, Security Guard, Receptionist, Food Server, Aide, Maintenance, Sandwich Maker, Greeter, Bus Person, Coach, Childcare Assistant, Sales Clerk
Movement Towards Less Reliance on SSA Benefits

Bridges Project Final Database Summary and Excerpts from Selected Other Reports
26
Youth Transition from Supplemental Security Income (SSI) to Social Security Disability Insurance (SSDI) - 2008 Introduction. SSI is a welfare program, funded by the General Taxpayer. SSDI is a social insurance program funded by payroll taxes deposited into the Old Age, Survivor’s, and Disability Insurance (OASDI) Trust Fund. SSDI is generally viewed more positively than SSI because of this basic difference. Is transitioning from SSI to SSDI a good thing? Summary. Movement of funds from the U.S. Treasury (and the OASDI Trust Fund) to individuals in the form of cash benefits under both the SSI and SSDI programs constitute transfer payments, meaning a redistribution of existing National Income. There are financial implications of redistribution of existing income, to be sure, but no economic benefits for society as a whole, in terms of change in National Income, at least on the surface. Of course, to the extent that transfer payments support or impede work and earnings, there would be economic effects. Current earnings, on the other hand, represent – under reasonable assumptions (i.e., people working, not displacing other workers) – a general economic benefit because National Income is larger than it otherwise would be. Are there ways to improve the interaction between SSI and SSDI, consistent with principles of equity (fairness), getting as many Americans as possible out of poverty, maintaining economic security (the “safety net”), strengthening incentives to work, and facilitating community membership and participation? In general, SSI and liberalization of SSDI have lifted some people out of poverty, and helped society move away from warehousing some people with psychiatric, developmental, or other disabilities. Not keeping pace with the cost of the basics (especially housing), however, almost surely keeps some individuals trapped in care homes and other congregate settings. There is a trade-off between emphasizing the “safety net” or economic security, poverty reduction, and community participation, on the one hand, and figuring out ways to strengthen incentives to work and earn, on the other. Selected Employment Data for Bridges Participants Using SSA Benefits - 2008
Introduction. Here’s what we know about SSI recipients and employment (from Social Security Advisory Board, Statement on the Supplemental Security Income Program, May 2005):
Nationally, about 11% of SSI recipients who are 18-21 are employed.
The highest employment rate (15%) among SSI recipients, are those that are 22-29 year olds.
The percentage drops back to about 11% among those 30-39, and then declines steadily with age to 7% (40-49), 4% (50-59), and 2.5% (60-64).

Bridges Project Final Database Summary and Excerpts from Selected Other Reports
27
However, in any given month, the employment rate for SSI recipients who are Bridges participants (18-25) is typically over 50% (see figure below).
During that time period (9/05-3/07), average hours worked per week and average hourly wage increased as well.
Higher employment outcomes for Bridges participants equates to decreased use
of public benefits, including SSI.
On average, 60% of all youth program participants achieved a successful case closure (reached a positive employment outcome). This was true for only about 30% of youth who did not participate in youth employment programs.
Staying connected to BRIDGES provides youth with: (1) the support needed to
find and keep a job; (2) the knowledge to understand the myths and realities of employment and SSI benefits; and (3) building capacity for long-term, sustaining employment and asset-building.

Bridges Project Final Database Summary and Excerpts from Selected Other Reports
28
Logic Model – 2008 All of the Bridges staff worked together on describing the Bridges interventions and how they affected outcomes.