bread of healing clinic return on investment analysis
TRANSCRIPT

Bread of Healing Clinic Return on Investment Analysis
Prepared for
Aurora Health Care and Bread of Healing Clinic
Prepared by
VERITÉ HEALTHCARE CONSULTING, LLC March 4, 2014

1
Bread of Healing Clinic
ROI Analysis
TABLE OF CONTENTS
TABLE OF CONTENTS ............................................................................................................................................ 1
INTRODUCTION ....................................................................................................................................................... 2
METHODOLOGY ...................................................................................................................................................... 3
RESULTS ..................................................................................................................................................................... 4
Reduced Emergency Department Costs ....................................................................................................... 5 1.
Reduced Inpatient Admissions and Costs .................................................................................................... 7 2.
SENSITIVITY ANALYSIS ...................................................................................................................................... 10
APPENDIX ................................................................................................................................................................ 11
2
Bread of Healing Clinic
ROI Analysis
INTRODUCTION
This report summarizes findings from an analysis of the return on investment (“ROI”) in the
Bread of Healing Clinic (“BOHC”). Aurora Health Care (“Aurora”) and other entities and
individuals provide financial (cash) and in-kind support to BOHC. These investments help to
enable BOHC to provide numerous benefits to uninsured, chronically ill patients and to hospitals
and health systems in the Milwaukee Wisconsin area. The ROI analysis estimates the dollar
value of the investments in BOHC and of the benefits associated with the clinic’s services and
outcomes.
Measuring ROI is a valuable undertaking, because it helps:
Build a business case for initiating, continuing, enhancing, or ending a hospital’s
investment in a community benefit program;
Communicate more fully (and both internally and externally) the value and impacts
provided by specific programs;
Prioritize among alternative contributions/grants and program investments; and,
Enhance and extend the results of program evaluations by expressing program impacts in
financial and economic terms.
The Bread of Healing Clinic is a neighborhood-based free clinic for individuals with financial or
other barriers to quality health care. Based at the Cross Lutheran Church and at two other,
smaller sites, the clinic offers health education, screening and preventive services, and care for
acute and chronic illnesses. BOHC also serves as a valuable teaching and training site for
medical students and residents.
The clinic began as a ministry of Cross Lutheran Church in 2000. Beginning with one room, one
resident physician volunteer, one nurse volunteer, and one half-day each week, the clinic opened
and saw 150 patients in 2000. Since that time, BOHC incorporated as a 501(c)(3) corporation,
expanded to six half-days each week at Cross Lutheran. Two other clinic sites also have opened,
one at Eastbrook Church two half-days each week; the other at Florist Avenue Lutheran Church
two half-days each week.
In 2013, BOHC provided almost 9,400 visits for about 2,000 patients. Its annual budget has
increased to over $1.2 million (including the value of in-kind services provided by Aurora and
other community partners).
Aurora and the BOHC are key partners in providing primary health care for uninsured adults, the
majority of whom have one or more chronic illnesses. Since BOHC’s inception, the two
organizations have worked together to create a model that includes:
a free clinic model that increases access to ongoing primary care for individuals with
chronic illness rather than a more common episodic service model;
3
Bread of Healing Clinic
ROI Analysis
medical education for interns, residents, and medical students that builds the commitment
of a future workforce to serving medically underserved populations in urban settings;
the involvement of multiple health systems that share responsibility for serving the
uninsured;
comprehensive services including vision, dental, medical specialty consultation, podiatry
and health services for issues affecting people with diabetes and other chronic health
conditions; and
a Community MedShare program that provides free medications to uninsured persons of
the BOHC and other free clinics through low cost purchasing, collection of sample
medications and streamlined patient assistance programs.
Aurora funds the BOHC Clinic Director position, provides free laboratory and radiology services
to BOHC’s patients, and provides access to specialty care through the Specialty Access for the
Uninsured Program (“SAUP”). The two organizations work together to arrange training
opportunities for medical residents and medical students at BOHC.
METHODOLOGY
The methodology applied in the analysis involved estimating two types of financial/economic
returns:
The ROI to Aurora (cash flow impacts on Aurora entities due to the investments and
outcomes associated with the clinic), and
The additional ROI to the community served by the clinic, or “CROI” (additional net
cash flow, economic effects, and value of health gains for other organizations/
collaborators associated with the clinic and for community members).
The following types of data were gathered and organized into a ROI model: the number and
characteristics of BOHC patients, the cash and in-kind expenses borne by Aurora to support the
BOHC, BOHC financial statements, contracts between Aurora and BOHC (including the
contract in place for medical education), grant applications that discuss BOHC services, and
financial information (including per-unit fixed and variable costs) about Aurora services affected
by BOHC’s operations (emergency department, inpatient, and Aurora Medical Group).
Utilization effects associated with BOHC’s services (e.g., the number of emergency room visits
and admissions that were avoided or prevented) were estimated based on findings from an
extensive literature review1 and data from Milwaukee’s “ED to Primary Medical Care Home
Referral and Retention Project.” Findings from numerous research studies and program
evaluations were analyzed to inform the model’s assumptions about the changes in health
resource utilization expected from improved chronic disease management. National benchmarks
for utilization of health services by uninsured and chronically ill populations similar to those
1 The Appendix lists studies reviewed for this purpose.

4
Bread of Healing Clinic
ROI Analysis
served by BOHC also were assessed. Relevant data and assumptions were incorporated into a
ROI model.
Several discussions were held to discuss data needs and review drafts of the ROI model,
including an in-person meeting with Aurora and BOHC representatives. During these
interactions, initial findings, relevant literature, and key assumptions were reviewed and
discussed. Feedback from this meeting helped to validate assumptions and enhance the accuracy
of data inputs.
RESULTS
Table 1 summarizes the results of the return on investment analysis.
Table 1: Summary Return Investment Results, 2013
According to the analysis, in 2013 Aurora’s costs to support BOHC were approximately
$340,000 and Aurora’s return on investment was $837,000 to $1.2 million (depending on the
method used to estimate the number of inpatient admissions that were prevented due to BOHC
services – see below). Aurora’s ROI in percentage terms was 146 to 245 percent.
Other community resources supporting BOHC were approximately $1.0 million, and the return
on investment was $2.3 to $2.5 million, or 230 to 244 percent.
Low High
Aurora's Return on Investment
Investment 339,784$ 339,784$
Return 837,217 1,172,750
Return on Investment
Amount 497,434$ 832,966$
Percentage 146% 245%
Community (Excluding Aurora)
Investment 1,007,403$ 1,007,403$
Return 3,319,437 3,463,237
Return on Investment
Amount 2,312,035$ 2,455,834$
Percentage 230% 244%
Combined
Investment 1,347,186$ 1,347,186$
Return 4,156,655 4,635,987
Return on Investment
Amount 2,809,468$ 3,288,801$
Percentage 209% 244%
Return on Investment: 2013 Summary
5
Bread of Healing Clinic
ROI Analysis
Combined, the one-year ROI is estimated to have been 209 to 244 percent – based on the
assumptions and calculations described in this report.
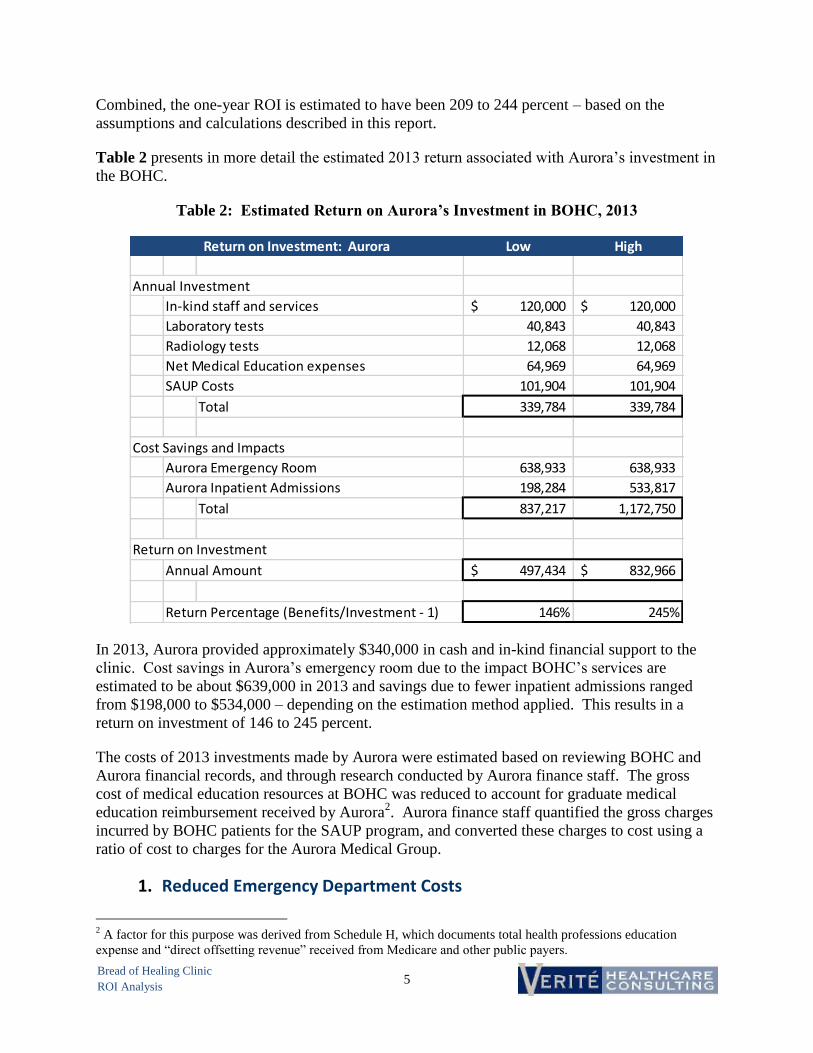
Table 2 presents in more detail the estimated 2013 return associated with Aurora’s investment in
the BOHC.
Table 2: Estimated Return on Aurora’s Investment in BOHC, 2013
In 2013, Aurora provided approximately $340,000 in cash and in-kind financial support to the
clinic. Cost savings in Aurora’s emergency room due to the impact BOHC’s services are
estimated to be about $639,000 in 2013 and savings due to fewer inpatient admissions ranged
from $198,000 to $534,000 – depending on the estimation method applied. This results in a
return on investment of 146 to 245 percent.
The costs of 2013 investments made by Aurora were estimated based on reviewing BOHC and
Aurora financial records, and through research conducted by Aurora finance staff. The gross
cost of medical education resources at BOHC was reduced to account for graduate medical
education reimbursement received by Aurora2. Aurora finance staff quantified the gross charges
incurred by BOHC patients for the SAUP program, and converted these charges to cost using a
ratio of cost to charges for the Aurora Medical Group.
Reduced Emergency Department Costs 1.
2 A factor for this purpose was derived from Schedule H, which documents total health professions education
expense and “direct offsetting revenue” received from Medicare and other public payers.
Low High
Annual Investment
In-kind staff and services 120,000$ 120,000$
Laboratory tests 40,843 40,843
Radiology tests 12,068 12,068
Net Medical Education expenses 64,969 64,969
SAUP Costs 101,904 101,904
Total 339,784 339,784
Cost Savings and Impacts
Aurora Emergency Room 638,933 638,933
Aurora Inpatient Admissions 198,284 533,817
Total 837,217 1,172,750
Return on Investment
Annual Amount 497,434$ 832,966$
Return Percentage (Benefits/Investment - 1) 146% 245%
Return on Investment: Aurora
6
Bread of Healing Clinic
ROI Analysis
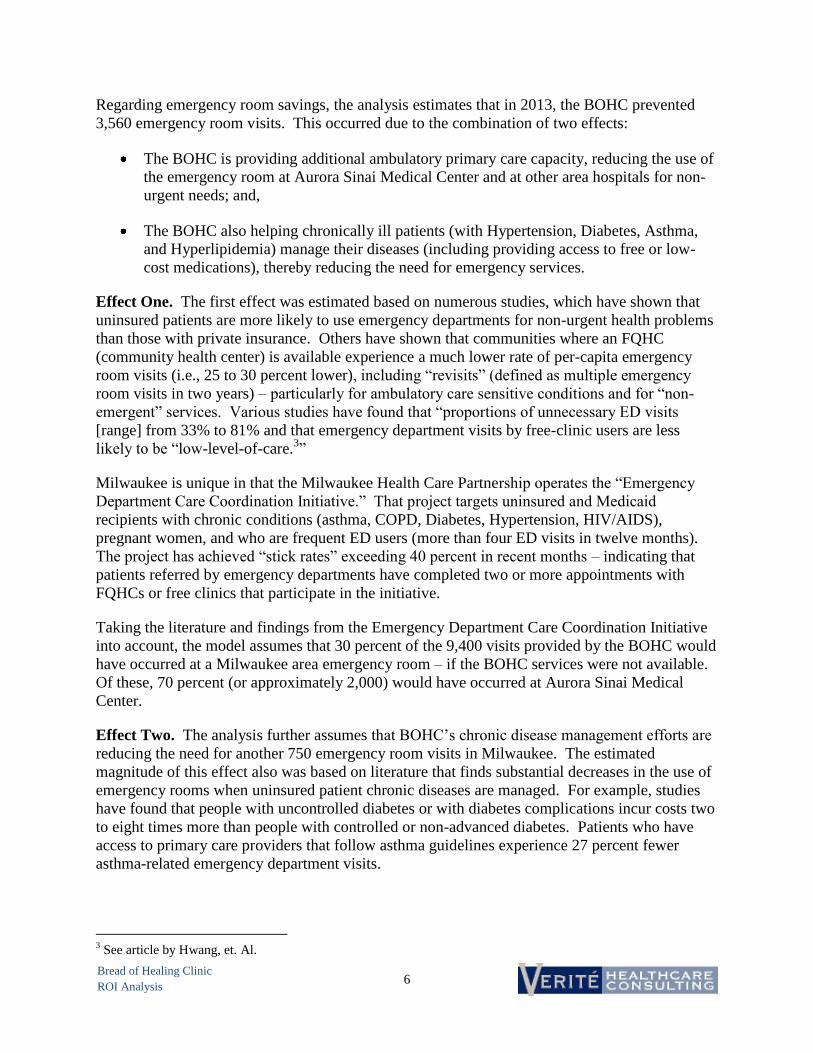
Regarding emergency room savings, the analysis estimates that in 2013, the BOHC prevented
3,560 emergency room visits. This occurred due to the combination of two effects:
The BOHC is providing additional ambulatory primary care capacity, reducing the use of
the emergency room at Aurora Sinai Medical Center and at other area hospitals for non-
urgent needs; and,
The BOHC also helping chronically ill patients (with Hypertension, Diabetes, Asthma,
and Hyperlipidemia) manage their diseases (including providing access to free or low-
cost medications), thereby reducing the need for emergency services.
Effect One. The first effect was estimated based on numerous studies, which have shown that
uninsured patients are more likely to use emergency departments for non-urgent health problems
than those with private insurance. Others have shown that communities where an FQHC
(community health center) is available experience a much lower rate of per-capita emergency
room visits (i.e., 25 to 30 percent lower), including “revisits” (defined as multiple emergency
room visits in two years) – particularly for ambulatory care sensitive conditions and for “non-
emergent” services. Various studies have found that “proportions of unnecessary ED visits
[range] from 33% to 81% and that emergency department visits by free-clinic users are less
likely to be “low-level-of-care.3”
Milwaukee is unique in that the Milwaukee Health Care Partnership operates the “Emergency
Department Care Coordination Initiative.” That project targets uninsured and Medicaid
recipients with chronic conditions (asthma, COPD, Diabetes, Hypertension, HIV/AIDS),
pregnant women, and who are frequent ED users (more than four ED visits in twelve months).
The project has achieved “stick rates” exceeding 40 percent in recent months – indicating that
patients referred by emergency departments have completed two or more appointments with
FQHCs or free clinics that participate in the initiative.
Taking the literature and findings from the Emergency Department Care Coordination Initiative
into account, the model assumes that 30 percent of the 9,400 visits provided by the BOHC would
have occurred at a Milwaukee area emergency room – if the BOHC services were not available.
Of these, 70 percent (or approximately 2,000) would have occurred at Aurora Sinai Medical
Center.
Effect Two. The analysis further assumes that BOHC’s chronic disease management efforts are
reducing the need for another 750 emergency room visits in Milwaukee. The estimated
magnitude of this effect also was based on literature that finds substantial decreases in the use of
emergency rooms when uninsured patient chronic diseases are managed. For example, studies
have found that people with uncontrolled diabetes or with diabetes complications incur costs two
to eight times more than people with controlled or non-advanced diabetes. Patients who have
access to primary care providers that follow asthma guidelines experience 27 percent fewer
asthma-related emergency department visits.
3 See article by Hwang, et. Al.

7
Bread of Healing Clinic
ROI Analysis
The combined effects suggest that BOHC may have prevented a total of 3,600 emergency room
visits in 2013. Given the partnership between BOHC and Aurora and the proximity of the clinic
to Aurora Sinai Medical Center, it is assumed that 70 percent of this effect benefits Aurora.
The 3,600 visits are arrayed by acuity level, based on data provided by Aurora’s finance staff.
Aurora finance staff also provided direct (variable, 2013) per-visit costs by level. The costs per
visit averaged $183.49. Average costs per visit for Aurora Medical Group physicians who
provide services in the emergency room were estimated to be another $73. Aurora’s total cost
savings for the emergency room visits – all of which are for uninsured patients – thus are
estimated to be $639,000 (3,600 x 70% x ($183.49 + $73).
Reduced Inpatient Admissions and Costs 2.
The impact of BOHC on inpatient admissions and costs was estimated in two ways.
First, on a national level, approximately 7.2 percent of emergency room visits result in
admission. Applying this 7.2 percent statistic to the 2,500 emergency room visits that are
avoided due to BOHC’s services indicates that about 180 uninsured admissions also were
prevented. These admissions were arrayed by acuity level, and a weighted average
variable cost savings of $2,976 per admission was applied to estimate inpatient cost
reductions of about $534,000 at Aurora.
Second, national statistics also indicate that adult, uninsured persons are admitted as
inpatients at a rate of 140.1 per 1,000 persons. Because BOHC serves uninsured adults
with multiple chronic diseases, this “use rate” was doubled, suggesting that BOHC’s
1,987 patients would have yielded 557 admissions if BOHC services were not available.
The literature review conducted for this analysis indicates that treatment and care
management services provided by organizations like BOHC reduce admission rates.
Data from BOHC suggest that about 60 percent of BOHC patients have hypertension, 30
percent have diabetes, 17 percent have asthma, and 10 percent have hyperlipidemia
(values do not add to 100 percent due to multiple conditions). This distribution was
coupled with assumptions from the literature regarding the impact of care management
on each type of chronic disease (5 percent reduction for hypertension, 25 percent for
diabetes, 50 percent for asthma, and 10 percent for hyperlipidemia) to estimate the
number of inpatient admissions prevented in 2013 due to BOHC’s services. This second
methodology suggests that about 95 admissions were prevented community-wide; 67 at
Aurora.
The weighted average variable cost per admission also was applied to the 95 admissions
to estimate inpatient cost reductions of approximately $198,000 at Aurora.
The analysis thus includes a range estimate for inpatient cost savings, based on a range of 95 to
180 admissions prevented by BOHC’s services.
Table 3 presents in more detail the estimated 2013 return associated with investments by other
(non-Aurora) community members in the BOHC.

8
Bread of Healing Clinic
ROI Analysis
Table 3: Estimated Return on Aurora’s Investment in BOHC, 2013
In 2013, the community ROI (excluding Aurora) was an estimated 230 to 244 percent. As
described below, the community ROI consists of cost savings from reductions in emergency
room visits and inpatient admissions, as well as two economic effects: increased earnings for
clients and the economic value of improved quality of life for BOHC patients.
The $1.0 million 2013 investment by other community members was derived from BOHC
financial statements, which include a variety of grants and other revenue that supports
operations. In-kind support was based on information presented in a grant application.
Seventy percent of total cost savings for emergency rooms and inpatient admissions were
included in Table 2 (Aurora’s ROI). Accordingly, Table 3 includes 30 percent of the total
estimated impact of BOHC services on hospital utilization. The 30 percent is assumed to be
realized by other hospitals in the Milwaukee area. Aurora’s variable costs per-unit of service
(per emergency room visit, and inpatient unit) were used as a proxy for these per-unit costs at
other area hospitals.
Low High
Annual Investment
Individuals and corporations 114,816$ 114,816$
Churches 34,902 34,902
Grants and Foundations 243,241 243,241
Contracts (excluding Aurora) 34,870 34,870
FC-3 Income 99,574 99,574
In-kind support (excluding Aurora) 480,000 480,000
Total 1,007,403 1,007,403
Cost Savings and Impacts
Other Emergency Rooms 273,829 273,829
Inpatient admissions to other hospitals 84,979 228,779
Subtotal 358,807 502,607
Increased earnings for clients 476,880 476,880
Value of QALY improvement 2,483,750 2,483,750
Total 3,319,437$ 3,463,237$
Return on Investment
Annual Amount 2,312,035$ 2,455,834$
Return Percentage (Benefits/Investment - 1) 230% 244%
Return on Investment: Community
9
Bread of Healing Clinic
ROI Analysis
Two other benefits are estimated, namely: increased earnings for BOHC clients due to reduced
absenteeism resulting from improved health, and the economic value of improvements in
“Quality Adjusted Life Years” or “QALY.”
Based in part on data from a Marquette University study4, the ROI model assumes that
50 percent of BOHC patients work. The model also assumes that BOHC’s services
reduces absenteeism for these working patients by 4 days per year – a conservative
assumption informed by the literature review.
The quality-adjusted life-year is a widely used measure of both quality and quantity of
life that is applicable to all individuals and diseases. The QALY concept is important to
outcomes researchers who are attempting to evaluate the efficacy and cost of various
healthcare interventions based on their impact on QALYs5. As a population health
indicator, QALY used to combine the quantity and quality of life of a population.
Applying the QALY measure to the ROI model assumes that 50 percent of [all] BOHC
patients experience a 5 percent improvement in health status resulting from services
provided (including medication access). Economists generally value one QALY at
amounts ranging from $30,000 to $100,000. For the purpose of this analysis, we will
estimate $50,000 per QALY. QALY benefits to BOHC patients thus are estimated to be
$2.5 million (994 patients x 5% x $50,000).
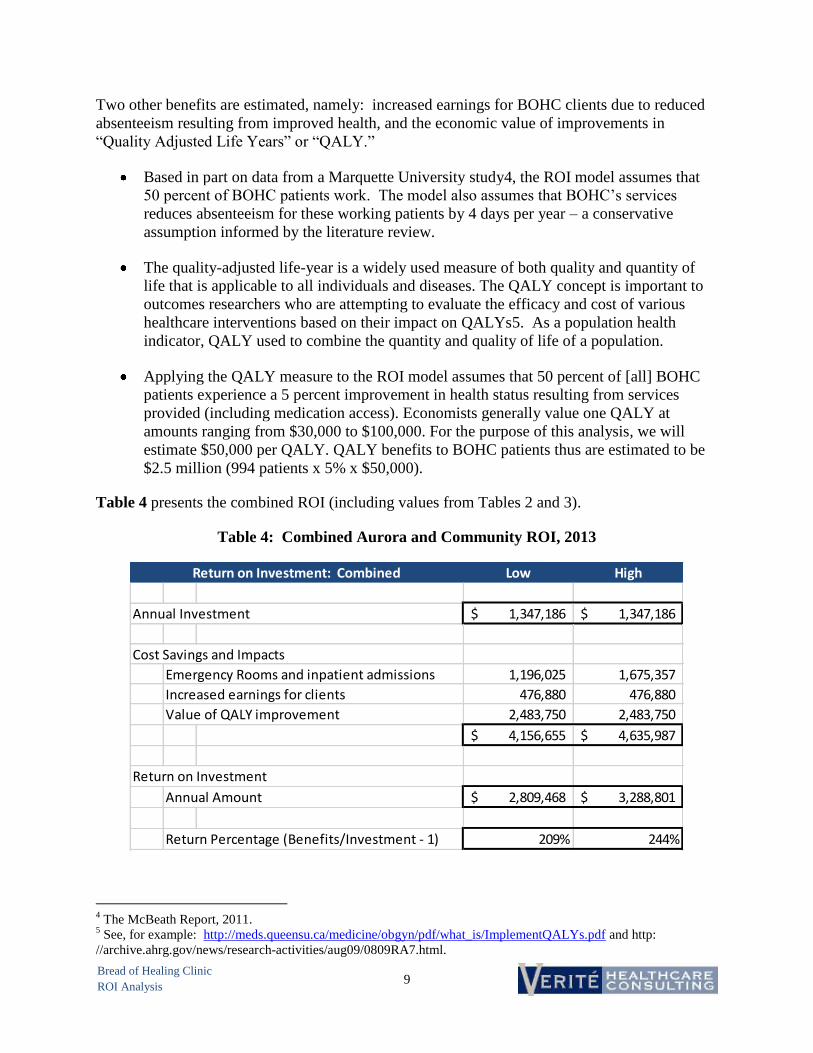
Table 4 presents the combined ROI (including values from Tables 2 and 3).
Table 4: Combined Aurora and Community ROI, 2013
4 The McBeath Report, 2011.
5 See, for example: http://meds.queensu.ca/medicine/obgyn/pdf/what_is/ImplementQALYs.pdf and http:
//archive.ahrg.gov/news/research-activities/aug09/0809RA7.html.
Low High
Annual Investment 1,347,186$ 1,347,186$
Cost Savings and Impacts
Emergency Rooms and inpatient admissions 1,196,025 1,675,357
Increased earnings for clients 476,880 476,880
Value of QALY improvement 2,483,750 2,483,750
4,156,655$ 4,635,987$
Return on Investment
Annual Amount 2,809,468$ 3,288,801$
Return Percentage (Benefits/Investment - 1) 209% 244%
Return on Investment: Combined

10
Bread of Healing Clinic
ROI Analysis
Note that the community ROI most likely is understated, because in the absence of the BOHC,
patients would have sought care not only at emergency rooms and hospitals but also at other
clinic sites in the area.
In 2013, the community ROI (including Aurora) was an estimated 209 to 244 percent. If
“economic effects” are excluded, ROI would be -11 to 24 percent.
SENSITIVITY ANALYSIS
Table 2 portrays Aurora’s estimated 2013 return on investment in BOHC. As described in this
report, the analysis is based on numerous data inputs, assumptions, and parameters derived from
available literature. All analyses of this nature involve uncertainty, and different results would
be presented under alternative assumptions regarding the impact of BOHC services on the
Aurora Sinai Medical Center emergency room and on inpatient admissions.
Table 5 portrays a “break-even” result in which the dollar value of the impact on Aurora is equal
to Aurora’s 2013 investment.
Table 5: “Break-Even” ROI for Aurora, 2013
The analysis shows that if assumed impacts on emergency room visits and admissions were
reduced by 59 to 71 percent, Aurora’s ROI would be zero. This analysis suggests that Aurora is
receiving a positive ROI from its investment in BOHC.
Low High
ROI Model Results
Aurora's Investment 339,784$ 339,784$
Aurora's Return 837,217 1,172,750
Sensitivity Analysis
Percentage Change in Return -59% -71%
Revised Return 339,784$ 339,784$
Return on Investment: Aurora "Break-Even" Levels

11
Bread of Healing Clinic
ROI Analysis
APPENDIX

12
Bread of Healing Clinic
ROI Analysis
References Providing Assumptions for the ROI Model
Agency for Healthcare Research and Quality. (2013). National Quality Measures Summary:
Hypertension Admission Rate. Retrieved 2013, from
http://www.qualitymeasures.ahrq.gov/content.aspx?id=38561
Agency for Healthcare Research and Quality. (2013). Statistical Brief #166: Overview of
Hospital Stays in the United States, 2011. Retrieved 2013, from http://www.hcup-
us.ahrq.gov/reports/statbriefs/sb166.pdf
American College of Allergy, Asthma, and Immunology. (2013). Reducing 2.1 Million
Emergency Room Visits, One Count at a Time. Retrieved 2013, from
http://www.acaai.org/allergist/news/New/Pages/Reducing21MillionEmergencyRoomVisi
ts,OneCountataTime.aspx
American Diabetes Association. (2013). Economic Costs of Diabetes in the US in 2012. Diabetes
Care.
Bertakis, Klea D. and Azari, Rahman. (2005). Obesity and the Use of Health Care Services.
Obesity Research. Volume 13, Number 2.
Centers for Disease Control and Prevention. (2010). National Hospital Ambulatory Medical
Care Survey: 2010 Emergency Department Summary Tables. Retrieved 2013, from
http://www.cdc.gov/nchs/data/ahcd/nhamcs_emergency/2010_ed_web_tables.pdf
Chu, N.F. et.al. (2010). Medical Services Utilization and Expenditure of Obesity-Related
Disorders in Taiwanese Adults. Value Health. Volume 13, Number 6.
Cloutier, M.M. et.al. (2005). Use of Asthma Guidelines by Primary Care Providers to Reduce
Hospitalizations and Emergency Department Visits in Poor, Minority, Urban Children.
The Journal of Pediatrics. Volume 146, Number 5.
Folmann, N.B. et.al. (2007). Obesity, Hospital Services Use and Costs. Advances in Health
Economics and Health Services Research. Volume 17.
Jackson, Thomas; Yakusheva, Olga; and Horner-Ibler, Barbara. (n.d.). Bread of Healing
Clinic/Aurora Health Care Research Project.
Rust, George et.al. (2009). Presence of a Community Health Center and Uninsured Emergency
Department Visit Rates in Rural Counties. Journal of Rural Health. Volume 25, Number
1.
Sidorov, Jaan et.al. (2002). Does Diabetes Disease Management Save Money and Improve
Outcomes? Diabetes Care. Volume 25, Number 4.
Will, Julie C. and Yoon, PW. (2013) Preventable Hospitalizations for Hypertension:
Establishing a Baseline for Monitoring Racial Differences in Rates. Preventing Chronic

13
Bread of Healing Clinic
ROI Analysis
Disease. Volume 10. Retrieved 2013, from
http://www.cdc.gov/pcd/issues/2013/12_0165.htm
Other Relevant Documents Reviewed
Agency for Healthcare Research and Quality. (2013). Prevention Quality Indicator v4.5
Benchmark Data Tables. Retrieved 2013, from
http://www.qualityindicators.ahrq.gov/Downloads/Modules/PQI/V45/Version_45_Bench
mark_Tables_PQI.pdf
Agency for Healthcare Research and Quality. (2010). Statistical Brief #100: Emergency
Department Visits for Adults in Community Hospitals, 2008. Retrieved 2013, from
http://www.hcup-us.ahrq.gov/reports/statbriefs/sb100.pdf
Cawley, John and Meyerhoefer, Chad. (2012). The Medical Care Costs of Obesity: An
Instrumental Variables Approach. Journal of Health Economics. Volume 31.
Goetzel, Ron Z. et.al. (2005). Return on Investment in Disease Management: A Review. Health
Care Financing Review. Volume 26, Number 4.
Hwang, Wenke et.al. (2012). Do Free Clinics Reduce Unnecessary Emergency Department
Visits? The Virginian Experience. Journal of Health Care for the Poor and Underserved.
Volume 23.
National Association of Community Health Centers. (2009).The Effect of Community Health
Centers on Healthcare Spending & Utilization. Retrieved 2013, from
http://www.nachc.com/client/Avalere_NACHC_Report_Final_10.2.09.PDF
New Hampshire Department of Health & Human Services (2005). Ambulatory Care Sensitive
Emergency Department Visits: Chronic Disease Conditions, New Hampshire, 2001-2005.
Retrieved 2013, from
http://www.dhhs.nh.gov/dphs/cdpc/documents/emergencydeptvisits.pdf
Trust for America’s Health. (2008). Prevention for a Healthier America: Investments in Disease
Prevention Yield Significant Savings, Stronger Communities. Retrieved 2013, from
http://healthyamericans.org/reports/prevention08/