final report bread of healing clinic
TRANSCRIPT
MEMORANDUM
TO: Terence T. Ow
FROM: Michael Petrella, Adam Thomas, Alexander Larder, Alexandra Dossey, and Mario Avila
DATE: (December 6th, 2013)
RE: Submission of Report No. 4 for Bread of Healing Clinic
In this report, you will find the table structures of the database, the data dictionary of the database, and a use manual showing the reader how to properly operate the database. The user manual also
shows diagrams and pictures of all the screens that should appear in the process of using the database, and how all the forms and
reports work.
Page 2
Table of Contents
Introduction 3
Structures of the Tables 4-5
Data Dictionary 5-6
User Manual 6-22
Final Thoughts 23

Page 3
I. Introduction
After 12 weeks of work, we are happy to present the Bread of Healing Clinic with a
brand new Access Database. Our hope is that this database will be able to categorize
all of the clinic’s patients efficiently, store all the necessary patient information, and
help the clinic help their patient’s obtain some sort of medical insurance. We believe
that this database will be of major assistance to the clinic seeing as they don’t have
any sort of Access Database to begin with, let alone being able to help their patients
obtain medical insurance. It has been our goal since the beginning to come together as
a team and help the Bread of Healing Clinic achieve their goals of the future.
Given the fact that no one in the clinic is familiar with using an Access Database, the
user manual provided in this report should be of great assistance to whoever is using
this system. It will be able to provide all employees with a step-by-step process of
how to input all types of information and how to generate all the necessary reports.
Being able to talk with Barbara about all the parameters and business requirements
that must be included in the database on the initial meeting day has allowed us to
create what we believe to be the answer to their current problems. It is with great
pleasure that we are ready to present the Bread of Healing Clinic with a brand new
Access Database.

Page 4
II. Structure of the Tables (*) Indicates Primary Key
Table: Employee Type Size
Employee_ID (*) Autonumber Long Integer First_name Short Text 50
Last_name Short Text 50 Email_address Short Text 5o Location_ID (*) Number Long Integer
Table: Location Type Size
Location_ID (*) Autonumber Long Integer Name_of_location Short Text 50 Address_of_location Short Text 50
Table: Meeting Type Size
Meeting_ID (*) Autonumber Long Integer Date_of_meeting Date/Time
Time_of_meeting Date/Time Notes Long Text
Meeting_no Number Long Integer Employee_ID (*) Number Long Integer Patient_ID (*) Number Long Integer
Table: Patient Type Size
Patient_ID (*) Autonumber Long Integer First_name Short Text 50
Last_name Short Text 50 Date_of_birth Date/Time
Address Short Text 50 City Short Text 50 State Short Text 50
Zip Number Long Integer Phone_number Short Text 30
Sex Short Text 30 Race Short Text 50 Income_level Number Long Integer
Medical_condition Long Text Smoker_status Short Text 30
Decision_status Short Text 30 Plan_ID (*) Number Long Integer
Page 5
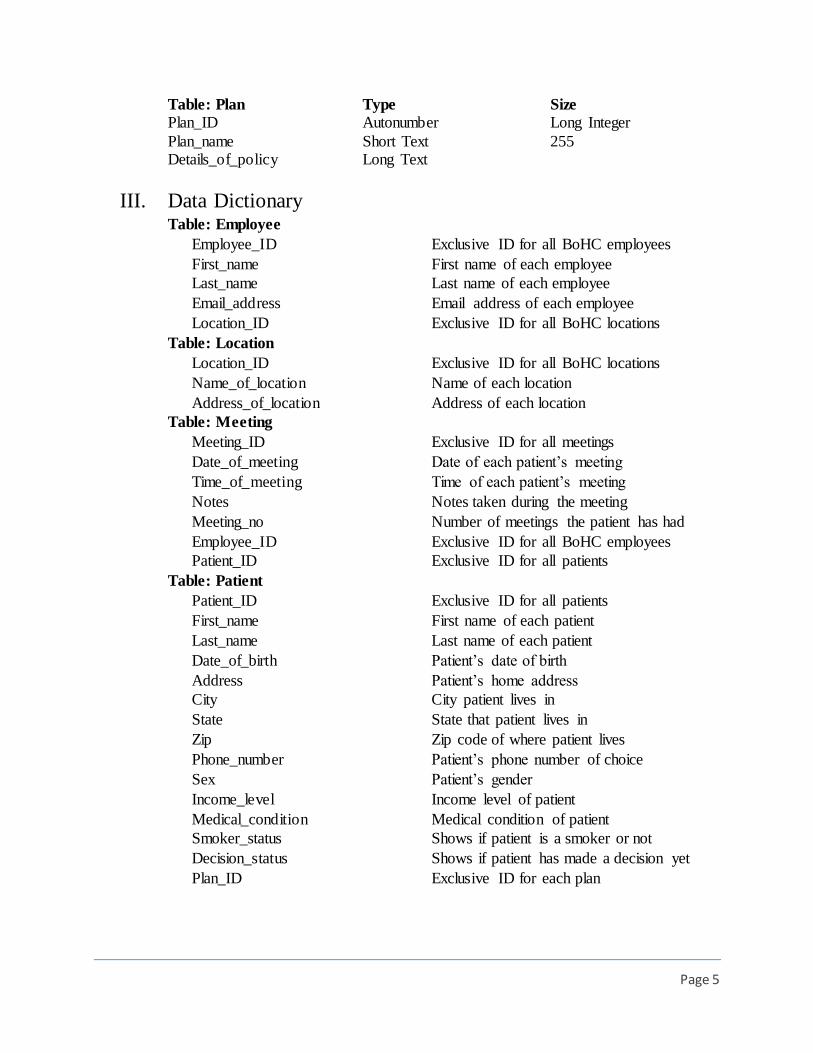
Table: Plan Type Size
Plan_ID Autonumber Long Integer
Plan_name Short Text 255 Details_of_policy Long Text
III. Data Dictionary Table: Employee
Employee_ID Exclusive ID for all BoHC employees
First_name First name of each employee
Last_name Last name of each employee
Email_address Email address of each employee
Location_ID Exclusive ID for all BoHC locations
Table: Location
Location_ID Exclusive ID for all BoHC locations
Name_of_location Name of each location
Address_of_location Address of each location
Table: Meeting
Meeting_ID Exclusive ID for all meetings
Date_of_meeting Date of each patient’s meeting
Time_of_meeting Time of each patient’s meeting
Notes Notes taken during the meeting
Meeting_no Number of meetings the patient has had
Employee_ID Exclusive ID for all BoHC employees
Patient_ID Exclusive ID for all patients
Table: Patient
Patient_ID Exclusive ID for all patients
First_name First name of each patient
Last_name Last name of each patient
Date_of_birth Patient’s date of birth
Address Patient’s home address
City City patient lives in
State State that patient lives in
Zip Zip code of where patient lives
Phone_number Patient’s phone number of choice
Sex Patient’s gender
Income_level Income level of patient
Medical_condition Medical condition of patient
Smoker_status Shows if patient is a smoker or not
Decision_status Shows if patient has made a decision yet
Plan_ID Exclusive ID for each plan
Page 6
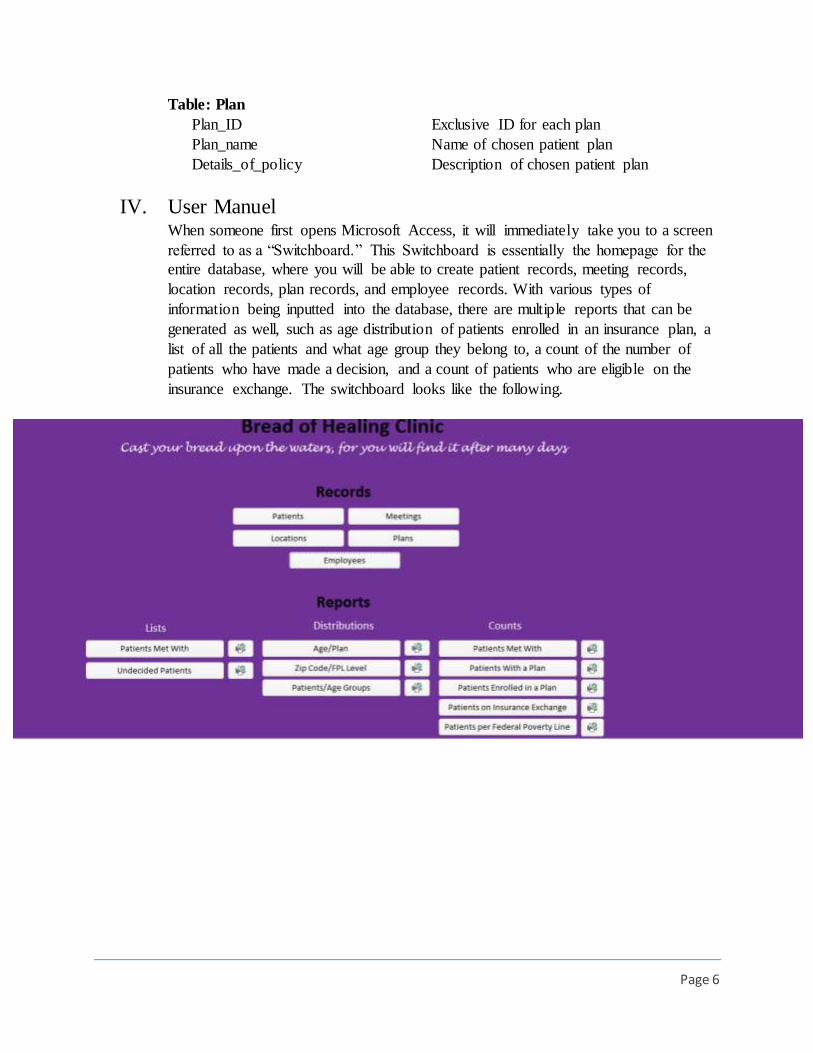
Table: Plan
Plan_ID Exclusive ID for each plan
Plan_name Name of chosen patient plan
Details_of_policy Description of chosen patient plan
IV. User Manuel When someone first opens Microsoft Access, it will immediately take you to a screen
referred to as a “Switchboard.” This Switchboard is essentially the homepage for the
entire database, where you will be able to create patient records, meeting records,
location records, plan records, and employee records. With various types of
information being inputted into the database, there are multiple reports that can be
generated as well, such as age distribution of patients enrolled in an insurance plan, a
list of all the patients and what age group they belong to, a count of the number of
patients who have made a decision, and a count of patients who are eligible on the
insurance exchange. The switchboard looks like the following.
Page 7
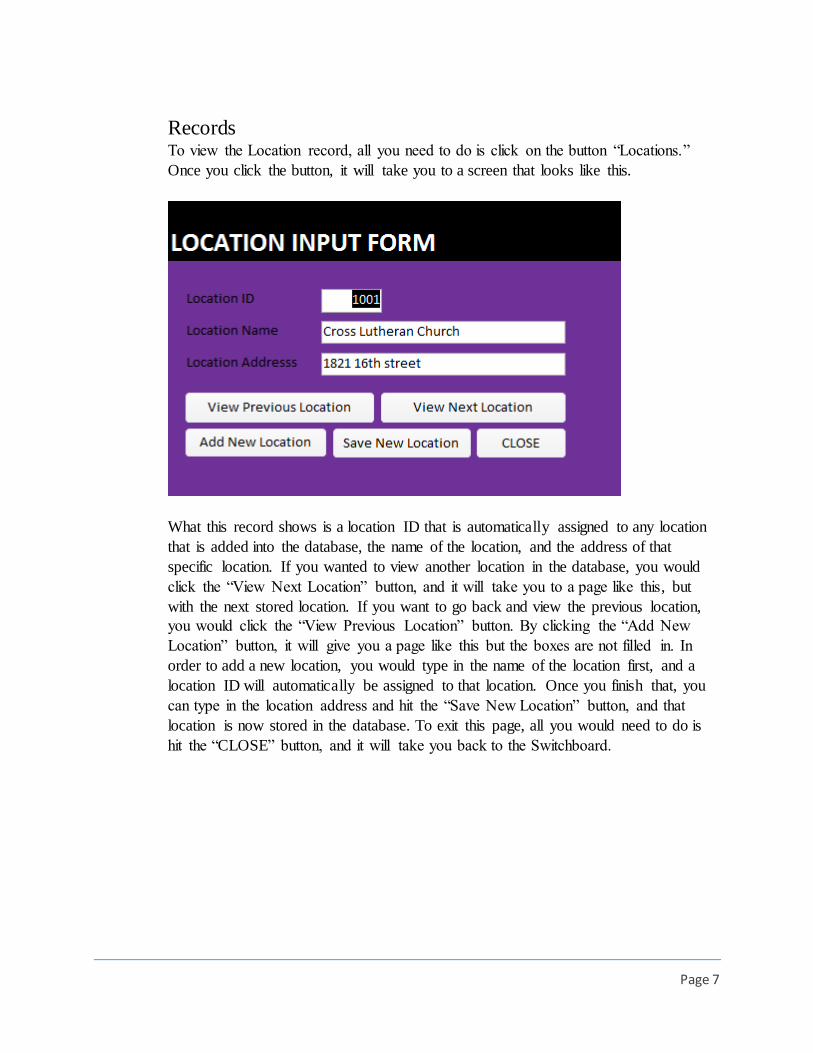
Records To view the Location record, all you need to do is click on the button “Locations.”
Once you click the button, it will take you to a screen that looks like this.
What this record shows is a location ID that is automatically assigned to any location
that is added into the database, the name of the location, and the address of that
specific location. If you wanted to view another location in the database, you would
click the “View Next Location” button, and it will take you to a page like this, but
with the next stored location. If you want to go back and view the previous location,
you would click the “View Previous Location” button. By clicking the “Add New
Location” button, it will give you a page like this but the boxes are not filled in. In
order to add a new location, you would type in the name of the location first, and a
location ID will automatically be assigned to that location. Once you finish that, you
can type in the location address and hit the “Save New Location” button, and that
location is now stored in the database. To exit this page, all you would need to do is
hit the “CLOSE” button, and it will take you back to the Switchboard.

Page 8
To view the Employees records, you would click on the “Employees” button. Once
you click that, it will take you to a screen that looks like this.
This record shows is an Employee ID, the employee’s first and last name, a phone
number to reach them at, their email address, and which location they work at. To add
a new employee, click “Add Employee Record” and begin to fill in tall the
information. Again, start with first name, and the employee ID will automatically be
assigned. As you can see, there is a drop down box next to location ID. If you click
that button, it will give you a list of all the location IDs and the names of those
locations in the database. So when you are storing the location that employee works
in, all you have to do is click one of those options in the drop down menu, and once
you click in the location name section, the name of that location will appear instantly
when it recognizes the location ID. If you want to view the next employee, you can
click “View Next Employee” and it will take you to the next employee’s record. To
go back, click “View Previous Employee.” To close this record, click “CLOSE.”

Page 9
To view the Plans records, click the “Plans” button. Once you click that button, this
screen will appear.
This record shows the ID number that is associated with each plan, the name of the
plan, and the details of that specific plan. If you want to add another plan, click the
“Add New Plan” button. It will take you to this page with nothing filled in. Begin
typing in the plan name first, and the ID will automatically be assigned to that ID.
Once you finish filling in all the information, hit the “Save New Plan” button, and
that plan will be stored in the database. To view the next plan stored in the database,
click “View Next Plan.” To go back to the previous plan, click “View Previous Plan.”
To exit the Plan record, hit the “CLOSE” button

Page 10
To view the Patient records, click the “Patients” button. Once the button is clicked, it
will take you to a screen that looks like this.
This is what the patient record looks like in the database. To add a new patient, click
the “Add New Patient” button. Once that button is clicked, this screen will appear
with nothing filled in. Begin by typing in the patient’s first name, and an ID will
automatically be created. Continue to type in all the information. At the gender box,
there is another drop down where it gives you options to choose, choose whichever
meets the patient’s criteria. The same goes for ethnicity, choose whichever option
meets the patient’s criteria. When you reach the income level and smoker status,
check whichever box meets the patient’s criteria. For plan ID, there is another drop
down box that shows all the Plan IDs and the plans that they belong to. Seeing as not
all patients have a medical insurance plan, what you will do is choose the plan ID
1006 that is called “UNDECIDED.” That way, they won’t be given a random plan.
For those who do have a plan, select the proper Plan ID and plan name from the drop
down box, click in the plan name box, and it will automatically fill in. Once finished
with all this, click “Save Patient.” To view the next patient, click “View Next Patient”
and to look at the previous patient, click “View Previous Patient.” If you want to find
a specific patient, click the “Find Patient” button, and a new box will pop up that
looks like the following.
Page 11
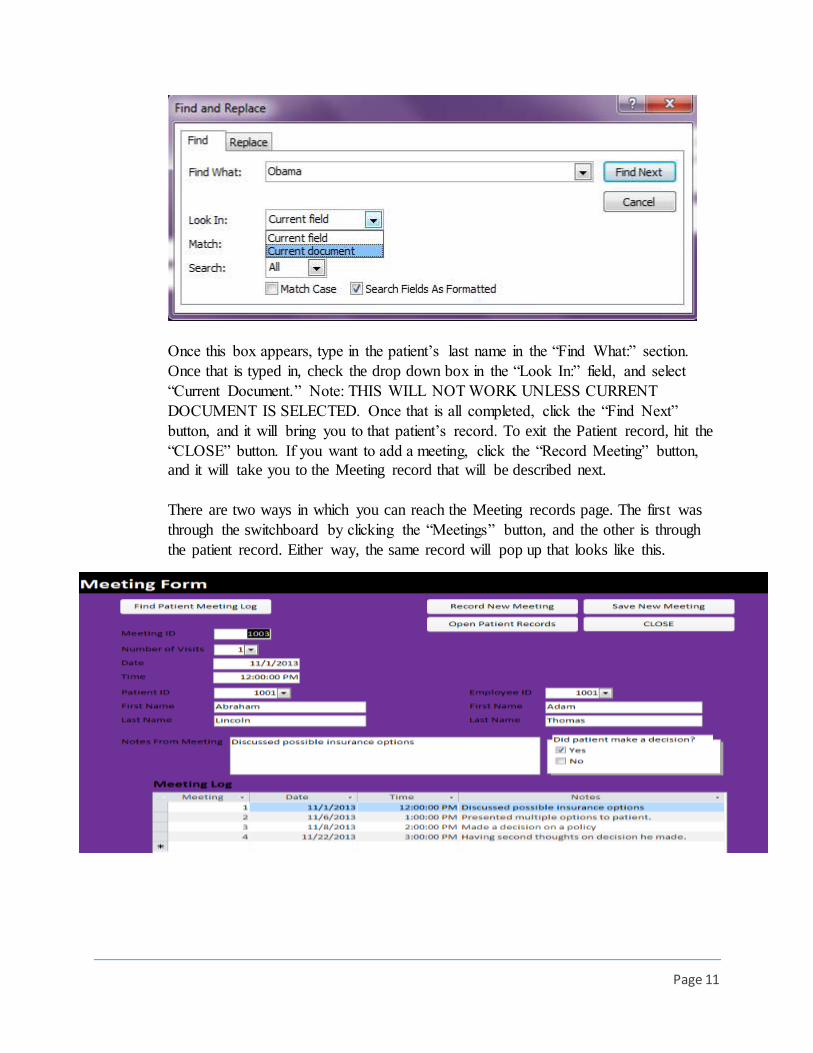
Once this box appears, type in the patient’s last name in the “Find What:” section.
Once that is typed in, check the drop down box in the “Look In:” field, and select
“Current Document.” Note: THIS WILL NOT WORK UNLESS CURRENT
DOCUMENT IS SELECTED. Once that is all completed, click the “Find Next”
button, and it will bring you to that patient’s record. To exit the Patient record, hit the
“CLOSE” button. If you want to add a meeting, click the “Record Meeting” button,
and it will take you to the Meeting record that will be described next.
There are two ways in which you can reach the Meeting records page. The first was
through the switchboard by clicking the “Meetings” button, and the other is through
the patient record. Either way, the same record will pop up that looks like this.

Page 12
To record a meeting, click the “Record New Meeting” button. This page will appear
with empty spaces to fill in. Begin by selecting the drop down next to “Number of
visits” and a meeting ID will automatically be assigned. What this section means is
the number of times the patient has had a meeting. So if it is the patient’s first
meeting, select “1.” If it is there fifth meeting, select “5” and so on. For Date of
Meeting, type in the date as follows: “XX/XX/XXXX.” For Time of Meeting, the
time is set in military time for all P.M. times, so to type in the time for P.M., type for
example “16:00” and 4:00 P.M. will appear. For A.M. times, regular time will
generate properly. When choosing Patient ID and Employee ID drop downs, all the
patients and employees stored in the database will appear. Select the patient and
employee involved in the meeting and click in their respective name boxes and they
will automatically generate. In the “Notes From Meeting” section, type any notes
from the meeting that you wish to store. If a decision was made by the patient, check
the box that says “Yes” under “Did patient make a decision?” If not, then check
“No.” Once all the information has been filled in, click the “Save New Meeting”
button, and all that meeting information will be stored in the sub form at the bottom
of that record. If you wish to find a specific patient’s meeting log, click “Find Patient
Meeting Log” and this box will pop up.
Once this box appears, type in the patient’s last name in the “Find What:” section.
Once that is typed in, check the drop down box in the “Look In:” field, and select
“Current Document.” Note: THIS WILL NOT WORK UNLESS CURRENT
DOCUMENT IS SELECTED. Once that is all completed, click the “Find Next”
button, and it will bring you to that patient’s meeting records. To exit out of this
record, click the “CLOSE” button.

Page 13
Lists The reports that are labeled “lists” are simply just a list of patients that meet the
criteria given to the name of the report. In order to open the first list, which is the List
of Patients Met With, all you need to do is click on the button “Patients Met With.”
Upon clicking, you will see a pop up that looks like this.
What this box does is it allows you to select patients who have been met with during
specific time periods. For example, if you want to know how many patients have been
met with from 11/1/2013-11/30/2013, you would type “11/01/13” in this box, then
click OK. Once you click OK, another box will appear that looks like this.
When this box appears, you will then type “11/30/13,” then click OK again. After that
is completed, a list will be generated that looks like the following:

Page 14
What this list shows is all the names of all the patients who have been met with between
the dates November 1st, 2013 and November 30th, 2013. You can type in any date range
in the box that pops up when you click the “Patients Met With”, and all the patients in
that parameter will appear in the report. To print this report, click the small button next to
the button “Patients Met With” that looks like this.
To view the next report under the Lists section, click the “Undecided Patients” button.
When that button is clicked, this report will appear.
What this report shows is a list of patients who have not decided on an insurance policy
yet. Any time a new patient record is added or a previous record is updated, this report
will update depending on the decision status of that patient. If a new patient is added to
the records and that patient hasn’t made a decision yet on a policy, their name will
automatically be added to this report.

Page 15
Distributions
The reports listed as “distributions” are basic distributions of patients that meet the given
criteria. To view the “Age/Plan” report, click the “Age/Plan” button on the switchboard,
and a report will appear that looks like the following.
What this report shows is a distribution of all the patients, categorized by the age groups,
and which plans the patients of each age group enrolled in. As it shows now, there is 1
patient in the age group of 0-19 who is enrolled with the Bronze Plan, and no one else
from that age group has made a decision. As you update the patient records with the
decisions the individual patients made, this report will automatically include each patient
decision into it. To print this report, exit out of this report in the top right corner of the
report by clicking the “X.” NOTE: DON’T EXIT ACCESS, EXIT THE REPORT. Then,
click the small icon next to “Age/Plan” button.

Page 16
To view Zip Code/FPL Level report, click the “Zip Code/FPL Level” button on the
switchboard. A report will appear on the screen that looks like the following.
What this report is showing the count of the number of patients that live in each zip code
of Milwaukee, and how many people given the following income levels live in each zip
code. Again, this information will automatically update as more patient information are
stored into the database. To print this report, exit out of this report in the top right corner
of the report by clicking the “X.” NOTE: DON’T EXIT ACCESS, EXIT THE REPORT.
Then, click the small icon next to “Age/Plan” button.

Page 17
To view the Patients/Age Group report, click the button labeled “Patients/Age Groups.”
Once you click the button, the report will appear on the screen that looks like this.
What this report shows is the number of patients that belong to each age group. At the
bottom of the report, a pie graph is displayed with a legend that shows a visual picture
of the information posted above in the report. All reports and charts will
automatically update upon information being inputted into the system. To print this
report, exit out of this report in the top right corner of the report by clicking the “X.”
NOTE: DON’T EXIT ACCESS, EXIT THE REPORT. Then, click the small icon
next to “Patients/Age Group” button.

Page 18
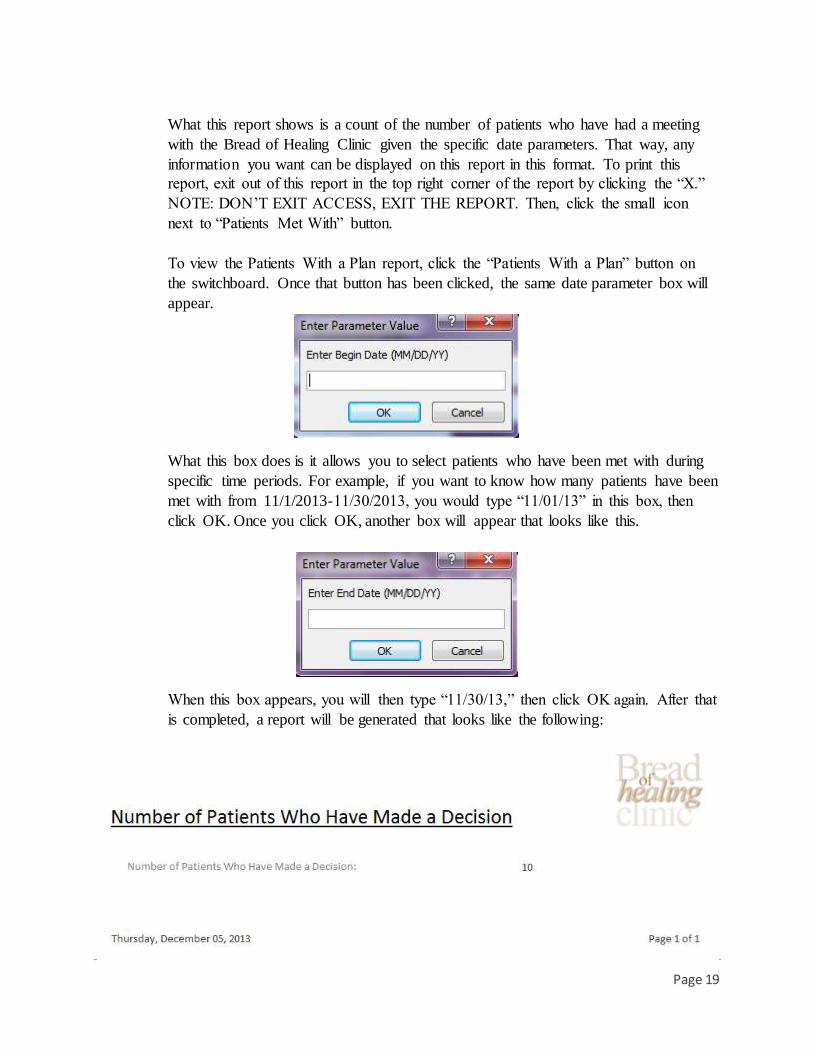
Counts The reports listed as “Counts” are reports that counts of the number of patients that
meet the given criteria displayed on the buttons. To open up the Patients Met With
report, click the “Patients Met With” button on the switch board, and the following
pop up will appear on the screen.
What this box does is it allows you to select patients who have been met with during
specific time periods. For example, if you want to know how many patients have been
met with from 11/1/2013-11/30/2013, you would type “11/01/13” in this box, then
click OK. Once you click OK, another box will appear that looks like this.
When this box appears, you will then type “11/30/13,” then click OK again. After that
is completed, a report will be generated that looks like the following:
Page 19
What this report shows is a count of the number of patients who have had a meeting
with the Bread of Healing Clinic given the specific date parameters. That way, any
information you want can be displayed on this report in this format. To print this
report, exit out of this report in the top right corner of the report by clicking the “X.”
NOTE: DON’T EXIT ACCESS, EXIT THE REPORT. Then, click the small icon
next to “Patients Met With” button.
To view the Patients With a Plan report, click the “Patients With a Plan” button on
the switchboard. Once that button has been clicked, the same date parameter box will
appear.
What this box does is it allows you to select patients who have been met with during
specific time periods. For example, if you want to know how many patients have been
met with from 11/1/2013-11/30/2013, you would type “11/01/13” in this box, then
click OK. Once you click OK, another box will appear that looks like this.
When this box appears, you will then type “11/30/13,” then click OK again. After that
is completed, a report will be generated that looks like the following:

Page 20
What this report displays is the number of patients stored in the database who have
made an insurance decision given the date parameters entered in the boxes.
Information will be automatically updated upon input into the database. To print this
report, exit out of this report in the top right corner of the report by clicking the “X.”
NOTE: DON’T EXIT ACCESS, EXIT THE REPORT. Then, click the small icon
next to “Patients Met With” button.
To view the Patients Enrolled per Plan, click the button “Patients Enrolled per Plan”
button on the switchboard. The same date parameters box will appear previously
discussed.
What this box does is it allows you to select patients who have been met with during
specific time periods. For example, if you want to know how many patients have been
met with from 11/1/2013-11/30/2013, you would type “11/01/13” in this box, then
click OK. Once you click OK, another box will appear that looks like this.
When this box appears, you will then type “11/30/13,” then click OK again. After that
is completed, a report will be generated that looks like the following:

Page 21
This report is essentially the same as the Patients With a Plan, but it breaks down
which plans the patients have enrolled in. All information displayed on the report will
update automatically upon input. To print this report, exit out of this report in the top
right corner of the report by clicking the “X.” NOTE: DON’T EXIT ACCESS, EXIT
THE REPORT. Then, click the small icon next to “Patients Enrolled per Plan” button.
To view the Patients on Insurance Exchange report, click the button “Patients on
Insurance Exchange” button on the switchboard. Once you click the button, the
following report will appear on the screen.
What this report shows is the count of the number of patients who are eligible on the
health insurance exchange stored in the entire database. As patients are being inputted
into the database, this report will continue to count the number of patients eligible on
the health insurance. To print this report, exit out of this report in the top right corner
of the report by clicking the “X.” NOTE: DON’T EXIT ACCESS, EXIT THE
REPORT. Then, click the small icon next to “Patients on Insurance Exchange”
button.

Page 22
To view the Patients per Federal Poverty Line report, click the button “Patients per
Federal Poverty Line” button on the switchboard. Once you click the button, the
following report will appear on the screen.
What this report shows is the distribution of all the patients stored in the database
based upon where they are positioned in comparison to the Federal Poverty Line. The
chart below the report just shows a visual comparison of the numbers listed above the
chart. All charts and reports will update automatically upon further inputs of patient
information. To print this report, exit out of this report in the top right corner of the
report by clicking the “X.” NOTE: DON’T EXIT ACCESS, EXIT THE REPORT.
Then, click the small icon next to “Patients on Insurance Exchange” button.

Page 23
V. Final Thoughts Lexi Dossey: I enjoyed working on this project because it helped me to apply what
we learned in class to an actual database. Working on teams is always a good learning
experience and I know I will take what I have learned from this project into other
projects in the future. It was interesting to go behind the scenes of Bread of Healing
and think like an employee when we were creating our database. Overall, this was a
great experience that has taught me about trends in the Information Technology world
and about being part of a team.
Alex Larder: Although at times this project was stressful, I really appreciated
everything I learned from it. Everything, from consulting with Barbara to building the
actual database was valuable. I know the knowledge I gained from this project will be
very useful for my career, even though I’m not majoring in IT. This project was a
great experience and I’m thrilled that it’s over.
Michael Petrella: I never thought I would have an experience like this during my time
in college. Being assigned this massive project with no prior knowledge to IT during
the first couple weeks of the class was pretty crazy, but I never realized how valuable
this project would be until it was finally completed. I never imagined being able to
complete any of the tasks we have done collectively and by myself, and it is
something that I will never forget. This project is something that I will never forget
completing, and it is something I will be proud of forever.
Adam Thomas: This project I believe was truly a good introduction to Information
Technology and projects we will have throughout our careers. We had to meet and
communicate with an actual company as well as arrange meeting times amongst each
other at times that were mutually convenient. The fact that we did this project for an
actual company made it much more authentic. Additionally because Bread of Healing
is a non-profit I believe we as a group were a lot more dedicated to making a quality
database. As a whole the project was a good learning experience that left us feeling
good about the service we were providing.
Mario Avila: This project was a great learning opportunity because it involved the
collaboration of different groups from class with actual organizations like Bread of
Healing. The aim of the whole project was to create a database for the organization
that would make the organization more efficient. Creating a database for an already
established organization like Bread of Healing was a challenge because it is difficult
to implement a database that you have little to no experience in using the software. I
can honestly say that I did not know how to use Access and not knowing how to use
the software and trying to create a database for Bread of Healing is a difficult task.
Working in a team and collaborating with other groups from the class made the
creation of a database possible.