braveheart investment group · pdf filebraveheart investment group plc annual report and...
TRANSCRIPT

Bra
veh
eart In
vestm
en
t Gro
up
plc A
nn
ual R
epo
rt and
Acco
un
ts 2012
Annual Report and Accounts
Braveheart Investment Group plc
2012
The Cherrybank CentreCherrybank GardensPerthPH2 0PFUnited Kingdom
[email protected]: +44 (0)1738 587555F: +44 (0)1738 587666
www.braveheartinvestmentgroup.co.uk

For the company looking to raise money, we provide the following:
• Equitycapital.Thisformoffinancingistypicallylong term and is usually appropriate for fast growing businesses or early stage companies. Wewillconsiderequityfinancingsofupto£2malthough we are happy to participate in larger financingsaspartofasyndicate;
• Debtfinance.Typicallyshorttomediumtermandfor companies with cash flow to service the loan. Ourunitsizeforthistypeoffinanceisup£1mand we will usually provide junior debt which is unsecuredbutlinkedtoanequityparticipation.Thistypeoffinanceisoftenreferredtoasmezzanine;
• Corporatefinanceadviceonallaspectsofraisingmoney, strategic development and corporate governance.
The money we invest comes from a variety of sources and is sometimes linked to particular geographical locations.
To the investor, we provide a one stop shop for the following groups who are looking for exposure to SMEinvestments:
• Highnetworth(HNW)individualslookingtobuildtaxefficientEnterpriseInvestmentScheme(EIS)andSeedEISportfolios;
• Familyofficesandprivatesectorinstitutions;
• Publicsectorinvestors.
Investorscanchoosebetweendifferenttypesofservice offering ranging from self-build portfolios, to a full fund management service.
WehaveofficesinPerth,Yorkshire,London,JerseyandtheIsleofManandassociateofficesinManchesterandDubai.
Front cover image courtesy of Belfast Visitor & Convention Bureau
Directors, Secretary, Registered Office and Advisers
Directors Garry S Watson OBE CA, Chairman (n) (r)
Geoffrey C B Thomson, Chief Executive Officer Carolyn Smith BA Hons ACIS, Chief Investment Officer Colin C Grant BCom CA, Chief Financial Officer (resigned 9 January 2012) Aileen Brown CA, Chief Financial Officer (appointed 31 January 2012) Edward B Cunningham CBE FRSE, Non-executive Director (a) (n) (r)
J Kenneth Brown BA CA, Non-executive Director (a) (r)
Jeremy H Delmar-Morgan MA MSI, Non-executive Director (a)
(a) Member of Audit and Risk Management Committee (n) Member of Nominations Committee (r) Member of Remuneration Committee
Secretary Colin C Grant BCom CA (resigned 9 January 2012) Aileen Brown CA (appointed 26 January 2012)
RegistrationNumber SC247376
RegisteredOffice The Cherrybank Centre Cherrybank Gardens Perth PH2 0PF Telephone +44 (0) 1738 587555
Website www.braveheartinvestmentgroup.co.uk
Advisers Registrar Auditors Capita Registrars Ltd Grant Thornton UK LLP Northern House 1-4 Atholl Crescent Woodsome Park Edinburgh Fenay Bridge EH3 8LQ Huddersfield HD8 0LA Solicitors Solicitors Semple Fraser LLP Maclay Murray & Spens LLP 80 George Street Quartermile One Edinburgh 15 Lauriston Place EH2 3BU Edinburgh EH3 6EP
Principal Bankers Bankers HSBC Bank plc Bank of Scotland plc 76 Hanover Street Pentland House Edinburgh 8 Lochside Avenue EH2 1HQ Edinburgh EH12 9DJ
NominatedAdviserandBroker JointBroker Seymour Pierce Limited (Nominated Advisor and Broker Pentland House from 29 June 2012) 20 Old Bailey Merchant Securities Limited London 51-55 Gresham Street EC4M 7EN London EC2V 7EL
Designed and produced by corporateprm, Edinburgh and London.www.corporateprm.co.uk
53COMPANYINFORMATION |
Braveheart Investment Group | Annual Report and Accounts 2012
Our business is all about financing small and medium sized enterprises (SMEs)

Braveheart Investment Group | Annual Report and Accounts 2012
KEY POINTS | Overview | 01
Overview
01 Key Points02 Chairman’s Statement
Business Review
03 Chief Executive Officer’s Report
04 Chief Financial Officer’s Report06 Chief Investment Officer’s
Report
Governance
07 Directors’ Report10 Board of Directors and
Management Board12 Corporate Governance
Statement15 Directors’ Remuneration
Report18 Independent Auditors’
Report
Accounts and Notes
19 Consolidated Statement of Comprehensive Income
20 Consolidated Statement of Financial Position
21 Company Statement of Financial Position
22 Consolidated Statement of Cash Flows
23 Company Statement of Cash Flows
24 Consolidated Statement of Changes in Equity
25 Notes to the Financial Statements
49 Notice of Annual General Meeting
53 Company Information
Operational
Financial
Events since the year end
• CompletedacquisitionofNeonCapitalPartnersLtd, manager of £48m Finance Yorkshire Equity Fund;
• Appointedtomanage£50mGrowthLoanFundin Northern Ireland (in partnership with NEL and Clarendon);
• Envestorsopenedforbusinessinthe Isle of Man;
• Envestorsled£13.1mfinancingforclientcompanies;
• Raised£950,000(beforeexpenses)throughplacingof4,132,574shares;
• Facilitatedstrategicexitoftwoinstitutionalshareholders;
• Fundsundermanagementatyearendof£110m(2011:£12m).
• Investmentmanagementandconsultancy feeincomeincreased37%to£1,265,000 (2011:£926,000);
• Excludingunrealisedportfoliomovements, lossbeforetaxincreasedto£1,513,000 (2011:£862,000);
• Netunrealisedlossonrevaluationofportfolioinvestmentsof£742,000(2011:lossof£444,000);
• Includingunrealisedportfoliomovements, thelossbeforetaxincreased31%to£1,713,000(2011:£1,306,000);
• Cashutilisationintheyeardecreasedto £555,000(2011:£831,000);
• Cashbalancesof£424,000(2011:£643,000);
• Netassetspershareof21.73pence (2011:30.66pence).
• Placed3,333,331sharesraising£500,000;
• FormedWhiteRockCapitalPartnerstomanageGrowth Loan Fund in Northern Ireland;
• Awardedfundmanagementcontractfor£10mLachesis fund, a University Challenge Seed Fund;
• Envestorsledafurther£2.4mfinancingforclientcompanies.
DisclaimerThis Annual Report contains certain forward-looking statements, which reflect the knowledgeof,andinformationavailableto,thedirectorsatthedateofpreparationofthisAnnualReport.Bytheirnature,thesestatementsinvolveriskanduncertaintybecausethey relate to events and depend on circumstances that may or may not occur in the future andthereareanumberoffactorsthatcouldcauseactualresultsordevelopmentstodiffermateriallyfromthoseexpressedorimpliedbytheseforward-lookingstatements.

Braveheart Investment Group | Annual Report and Accounts 2012
| Overview | CHAIRMAN’S STATEMENT02
investors, and I should like to thank a number of our existing shareholders for their increased support.
These new activities are a profound step in the implementation of your Board’s strategy of focusing on the management of regional SME focused investment, with the consequent improvement in the quality of the Group’s income.
ResultsTotal fee-based revenue and finance income for the year ended 31 March 2012 increased to £1,265,000 (2011: £926,000). Additionally, we recorded a gain on the realisation of portfolio investments of £39,000 (2011: £168,000). Total operating costs increased to £2,836,000 (2011: £1,988,000), resulting in a loss before unrealised movements in portfolio investments of £1,513,000 (2011: £862,000). Operating costs include £249,000 in relation to an M&A transaction only part of which was concluded. The net unrealised movement on the revaluation of portfolio investments was a loss of £742,000 (2011: £444,000).
After taking account of portfolio movements, the loss after tax was £1,713,000 (2011: £1,306,000) equating to a loss per share of 9.46 pence (2011: 9.06 pence).
Cash utilisation in the year decreased to £555,000 (2011:£831,000) and the Group ended the year with cash balances of £424,000 (2011: £643,000).
Investment PortfolioWith the value of weaker investments now written off, we remain confident about the performance of the on going portfolio, consisting of investments in some 20 companies, most of them having made useful progress during the year. No material realisations were achieved during the year but that progress, in a recession that shows no sign of abating, augurs well for their disposal in a more benign business climate.
Board, Management and Staff There was one change in our Board of Directors during the year. Aileen Brown joined us as the Chief Financial Officer in January 2012.
For staff, it has been a tough year, with reduced numbers in our Head Office, as we have sought to contain our costs. I want to express my thanks for the enthusiasm and hard work that have been so important during a period of considerable change.
ProspectsSince the year end work has progressed on integrating the new investment management businesses into our structure. These businesses will result in a significant change in our operating results, and they represent important milestones for us. Your Board is determined to build critical mass and our management team is seeking further opportunities that will enable the Group to increase its SME targeted funds under management.
Annual General MeetingThe notice regarding the business to be dealt with at the Company’s Annual General Meeting, to be held on 25 September 2012, is set out on pages 49 to 51.
In particular I would draw your attention to Resolution 6 which renews the directors’ authority to allot up to 6,784,313 new shares for cash without reverting to the shareholders for further approval. This authority provides the Group with the flexibility to take advantage of expansion opportunities and to satisfy liquidity requirements.
Your directors are unanimously in favour of Resolutions 1 - 10 which they consider to be in the best interests of shareholders as a whole.
Accordingly, your directors recommend shareholders to vote in favour of these resolutions, as they intend to do in respect of their own beneficial shareholdings.
I look forward to welcoming those shareholders who are able to attend.
Garry S WatsonChairman
Implementing ChangeIn our Interim Statement I reported that we had been actively pursuing our strategy of increasing fee income through the acquisition of additional investment management businesses. I am therefore delighted to report that in the month prior to our year end we were able to make two announcements that are highly significant in relation to the future of the Group.
The first was that we were leaders of a consortium, consisting of ourselves, NEL Fund Managers Ltd and Clarendon Fund Managers Ltd, that has been appointed to manage a £50 million growth loan fund aimed at supporting small to medium sized enterprises (SMEs) in Northern Ireland. The second related to the acquisition of Neon Capital Partners Ltd which manages the £48 million Finance Yorkshire Equity Fund, supporting SMEs in the Yorkshire and Humber region.
Immediately prior to and post the year end, the Group arranged further equity placements, aggregating £500,000 in support of its acquisition programme and for working capital purposes. I am delighted to welcome several new
I have pleasure in providing shareholders with my Statement which accompanies the results of the Group for the year ended 31 March 2012.

Braveheart Investment Group | Annual Report and Accounts 2012
03CHIEF ExECUTIvE OFFICER’S REPORT | Business Review |
GLF provides debt funding to SMEs and is scheduled to run until 2022. Working with our partners, NEL Fund Managers and Clarendon Fund Managers, we have established a joint venture vehicle under the name of WhiteRock Capital Partners. Paul Millar has been appointed Chief Investment Officer and leads a newly recruited team of three investment managers and two financial analysts.
Since the year end we have reported that, subject to contract, we have been appointed to manage the £10.25 million Lachesis Fund (Lachesis). Lachesis is the University Challenge Seed Fund for a number of universities in the East Midlands and supports seed stage technology investments emanating from those universities. Our appointment is for a minimum of two years and involves providing support, mentoring and business development services to portfolio companies in addition to providing fund administration services.
Last summer we completed a share placing which raised just under £1 million of fresh capital for the Group, at the same time as achieving an exit for two institutional shareholders. This placing and the removal of a share ‘overhang’ gave us confidence going forward and when we acquired Neon Capital Partners some months later, we did so using our own resources. Once the acquisition was complete, we raised an additional £500,000 of equity at a premium to our share price. A strong shareholder base is vital and I would like to thank our shareholders for their support.
The financial performance of the business underlines the appropriateness of our strategy. The results show that our fee generating business is growing while our investment portfolio has continued to suffer from downward valuations, partly as a function of the poor market for initial public offerings and M&A. Envestors made an important maiden full year contribution and this is a business that we are looking to expand in other regions. Included within our overheads are fees that relate to a partially aborted acquisition package. Neon was the most important part and we concluded that acquisition.
Our investment portfolio is maturing well and we have good expectations for realisations. However, as we have noted on previous occasions, the timing of these realisations is uncertain and in prevailing
market conditions one has to be patient. Our current focus is on optimising exit valuations and supporting incumbent management.
The Coalition Government has made progress on the important matter of SME financing, with more money being made available to the sector and, with an increasing amount of it being distributed by intermediaries other than banks. While the amounts at this stage are modest, the general trend is good news for SMEs and bodes well for us as a business.
In my last annual report I noted various Government initiatives that were due to improve the financing landscape for SMEs. The £50 million Angel Cofund is now up and running and we are represented on the Board of that entity. The Enterprise Investment Scheme (EIS) landscape has been improved once again, and as noted above we are seeing more public money being managed by intermediaries such as ourselves, rather than being provided as a guarantee to clearing banks. This is all positive news for us and I believe we are well placed to win additional fund management mandates over the next few years.
Outside the UK, the eurozone continues to be in serious difficulty and attempts to remedy the crisis have to date proved largely ineffective. Market commentary tends to view a European banking union as a likelihood and we remain unsure what impact that might have on the UK economy.
The transformation mentioned earlier is now complete and we are at the start of our journey. The next few years will see us consolidate our position as a leading manager of equity and equity linked products to the SME market. In addition, we will use our balance sheet to good effect when circumstances allow, and we will continue to provide innovative products to a receptive market.
We are a ‘people’ business and in closing I would like to thank our staff for all their hard work over the year.
Geoffrey C B ThomsonChief Executive Officer
This transformation has taken us a number of years and has included three acquisitions and one substantial fund management contract award. During this time we have also extended our geographical footprint and this year we established operations in Belfast and the Isle of Man.
During the year, we acquired Neon Capital Partners for £380,000. Neon is the fund manager for the £48 million Finance Yorkshire Equity Fund (FYEF). The FYEF is scheduled to run until 2018 and invests equity and/or debt in SMEs in Yorkshire and the Humber. This acquisition consolidates our position in a region where we already operate as Viking Fund Managers and have various funds under management. Andrew Burton, our regional managing director, has assumed responsibility for both Neon and Viking and in the fullness of time we expect to operate under one brand in the region.
In February we announced that we had been successful in leading a consortium bid to manage the £50 million Growth Loan Fund (GLF) in Northern Ireland. A new product in Northern Ireland, the
This year has seen a major transformation of our business and we are now an SME focused fund and services management provider rather than being an investment company.

04
Braveheart Investment Group | Annual Report and Accounts 2012
| Business Review | CHIEF FINANCIAL OFFICER’S REPORT
income and the adverse movement on the valuation of our investment portfolio.
The Group’s net assets also include goodwill of £1,353,000 (2011: £987,000) and intangible assets of £109,000 (2011: £122,000). Goodwill arises from the acquisitions of VFM, Envestors and Neon. The carrying value of goodwill has been reviewed during the year and in light of current projections of future performance the directors do not believe the assets are impaired. Intangible assets are amortised straight line over 10 years.
At the year end the Group had cash balances of £424,000 (2011: £643,000) of which £336,000 was in respect of the new share subscription, the new shares being formally admitted to trading on 5 April 2012. There were no material borrowings. Cash utilisation decreased to £555,000 (2011: £831,000).
Events since the year endOn 5 April 2012 and 11 May 2012 we completed a placing of 2,239,998 and 1,093,333 new shares, respectively. This raised £500,000 (before expenses) to augment cash balances following the Neon acquisition. £336,000 of this new cash was received prior to the year end although the new shares were not admitted to trading until 5 April 2012.
Aileen BrownChief Financial Officer
Income statementFee based revenue is now generated by Braveheart Ventures Ltd (BVL), Viking Fund Managers Ltd (VFM), Envestors Ltd and from March 2012 Neon Capital Partners Ltd (Neon). The revenue comprises investment management fees and consultancy income, which grew 37% during the year to £1,265,000 (2011: £926,000).
Investment management revenue, including success fees of £377,000 (2011: £148,000) generated by Envestors, was £932,000 (2011: £678,000), an increase of 38%.
Consultancy income, earned from the provision of business advisory services by VFM and by the provision of corporate finance services by Envestors, was £333,000 (2011: £248,000), an increase of 34%.
Finance income was £19,000 (2011: £32,000), the reduction being due to conversion of loan notes to equity and reducing overall balances.
At the start of the year, the Group’s own active investment portfolio of 23 companies was valued at £3.98 million. During the year the Group made investments totalling £101,000 (2011: £113,000) into three existing portfolio companies. Of this investment, £25,000 (2011: £78,000) was made by way of equity. The balance of £76,000 (2011: £35,000) was convertible loan notes and fees converted. One realisation was made in the year generating a gain on disposal of £39,000 (2011: £168,000). One portfolio company has instigated insolvency proceedings. Two companies repaid loan notes totalling £9,000.
At 31 March 2012 the fair value of the active investment portfolio of 20 companies was £3.28 million, resulting in an aggregate unrealised revaluation loss of £742,000 (2011: unrealised revaluation loss £464,000). The Group’s investments are held either by the Company, Strathclyde Innovation Fund LP (SIF) (which made its first investments in 2010), or Caledonia Portfolio Realisations Ltd (CPR) (acquired on a contingent consideration basis in 2007). Offsetting the aggregate unrealised loss is a decrease in contingent consideration of £184,000 (2011: £20,000) payable on future exit values of CPR portfolio companies.
Total income for the year ended 31 March 2012 including realised gains and unrealised revaluation losses was £1,123,000, an increase from £682,000 in 2011.
Employee numbers increased by three on average in the year. However, there was some fine-tuning of headcount in Q4 which reduced employee numbers in Perth and Yorkshire by six in total. Employee benefits expense was £1.76 million (2011: £1.26 million). Other operating and finance costs increased to £1.074 million (2011: £697,000). The increase in costs is due largely to advisors fees and abort fees of £249,000 in respect of an M&A transaction package part of which did not proceed as originally envisaged. One constituent of this package was the acquisition of Neon which proceeded with £53,000 of costs attributable to that transaction. Excluding unrealised portfolio movements, the loss before tax increased to £1.5 million (2011: £862,000) reflecting the investment in capability for growing the fee-earning side of the business and £249,000 of fees mentioned above. The total loss after tax and amounts attributable to minority interests increased to £1.72 million (2011: £1.31 million), equivalent to a loss per share of 9.46 pence (2011: 9.06 pence).
Financial positionNet assets at 31 March 2012 were £4.19 million (2011: £4.52 million), equivalent to 21.73 pence per share (2011: 30.66 pence). The decrease reflects the excess of operating costs over fee

Braveheart Investment Group | Annual Report and Accounts 2012
05 CHIEF FINANCIAL OFFICER’S REPORT | Business Review |
A summary analysis of the Group’s performance is:
2012 2011
£’000 £’000
Investment management revenue 932 678
Consultancy income 333 248
Fee-based revenue 1,265 926
Finance income 19 32
Income before portfolio movements 1,284 958
Realised gain on disposal of investments 39 168
Net unrealised movement arising on the revaluation of investments (200) (444)
Total income 1,123 682
Employee benefits expense (including share based compensation) (1,762) (1,291)
Other operating and finance costs (1,074) (697)
Total costs (2,836) (1,988)
Loss before tax (1,724) (1,306)
Loss after tax and amount attributable to minority interest (1,713) (1,306)
Loss per share 9.46 pence 9.06 pence
Opening cash balance 643 1,474
Increase in portfolio investments (101) (113)
Decrease in relation to acquisition of Envestors / VFM (46)
Utilised in other activities (454) (672)
Cash held in respect of new share issue 336
Closing cash balance 424 643
Net assets 4,190 4,522
Net assets per share 21.73 pence 30.66 pence
06
Braveheart Investment Group | Annual Report and Accounts 2012
| Business Review | CHIEF INvESTMENT OFFICER’S REPORT
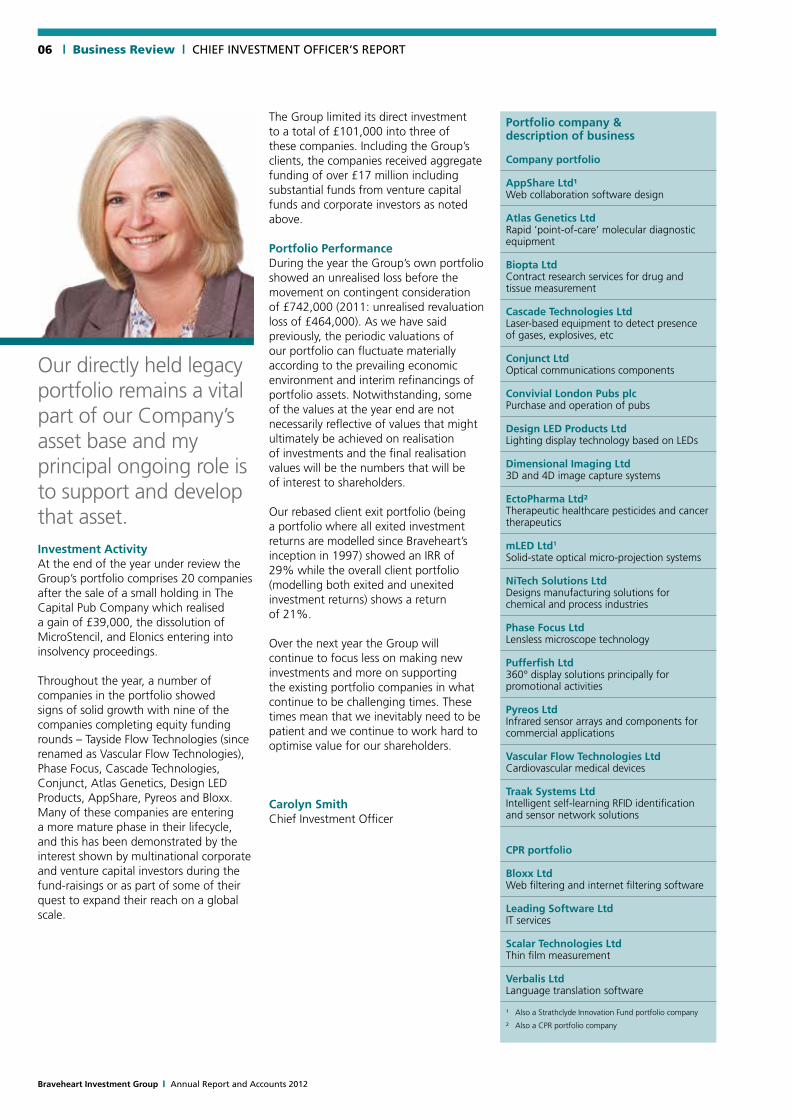
Portfolio company & description of business
Company portfolio
AppShare Ltd¹ Web collaboration software design
Atlas Genetics Ltd Rapid ‘point-of-care’ molecular diagnostic equipment
Biopta Ltd Contract research services for drug and tissue measurement
Cascade Technologies Ltd Laser-based equipment to detect presence of gases, explosives, etc
Conjunct Ltd Optical communications components
Convivial London Pubs plc Purchase and operation of pubs
Design LED Products Ltd Lighting display technology based on LEDs
Dimensional Imaging Ltd 3D and 4D image capture systems
EctoPharma Ltd² Therapeutic healthcare pesticides and cancer therapeutics
mLED Ltd1 Solid-state optical micro-projection systems
NiTech Solutions Ltd Designs manufacturing solutions for chemical and process industries
Phase Focus Ltd Lensless microscope technology
Pufferfish Ltd 360° display solutions principally for promotional activities
Pyreos Ltd Infrared sensor arrays and components for commercial applications
Vascular Flow Technologies Ltd Cardiovascular medical devices
Traak Systems Ltd Intelligent self-learning RFID identification and sensor network solutions
CPR portfolio
Bloxx Ltd Web filtering and internet filtering software
Leading Software Ltd IT services
Scalar Technologies Ltd Thin film measurement
Verbalis Ltd Language translation software
¹ Also a Strathclyde Innovation Fund portfolio company
² Also a CPR portfolio company
The Group limited its direct investment to a total of £101,000 into three of these companies. Including the Group’s clients, the companies received aggregate funding of over £17 million including substantial funds from venture capital funds and corporate investors as noted above.
Portfolio PerformanceDuring the year the Group’s own portfolio showed an unrealised loss before the movement on contingent consideration of £742,000 (2011: unrealised revaluation loss of £464,000). As we have said previously, the periodic valuations of our portfolio can fluctuate materially according to the prevailing economic environment and interim refinancings of portfolio assets. Notwithstanding, some of the values at the year end are not necessarily reflective of values that might ultimately be achieved on realisation of investments and the final realisation values will be the numbers that will be of interest to shareholders. Our rebased client exit portfolio (being a portfolio where all exited investment returns are modelled since Braveheart’s inception in 1997) showed an IRR of 29% while the overall client portfolio (modelling both exited and unexited investment returns) shows a return of 21%. Over the next year the Group will continue to focus less on making new investments and more on supporting the existing portfolio companies in what continue to be challenging times. These times mean that we inevitably need to be patient and we continue to work hard to optimise value for our shareholders.
Carolyn SmithChief Investment Officer
Our directly held legacy portfolio remains a vital part of our Company’s asset base and my principal ongoing role is to support and develop that asset.Investment ActivityAt the end of the year under review the Group’s portfolio comprises 20 companies after the sale of a small holding in The Capital Pub Company which realised a gain of £39,000, the dissolution of MicroStencil, and Elonics entering into insolvency proceedings.
Throughout the year, a number of companies in the portfolio showed signs of solid growth with nine of the companies completing equity funding rounds – Tayside Flow Technologies (since renamed as Vascular Flow Technologies), Phase Focus, Cascade Technologies, Conjunct, Atlas Genetics, Design LED Products, AppShare, Pyreos and Bloxx. Many of these companies are entering a more mature phase in their lifecycle, and this has been demonstrated by the interest shown by multinational corporate and venture capital investors during the fund-raisings or as part of some of their quest to expand their reach on a global scale.

Braveheart Investment Group | Annual Report and Accounts 2012
07DIRECTORS’ REPORT | Governance |
The directors present their report together with the audited financial statements for the year ended 31 March 2012.
Principal ActivitiesThe Group provides funding and advisory services for SMEs and continues to manage investments in young, emerging British companies, specialising in building tax efficient portfolios for business angels, high net worth individuals and family offices. The Group also provides fund management and specialist advisory services.
Results and DividendsThe financial statements of the Group and the Company for the year to 31 March 2012 are set out on pages 19 to 48.
The Group’s consolidated loss for the year after tax was £1,712,996 (2011: £1,306,132), which has been transferred to reserves.
The directors do not recommend payment of a dividend for the year (2011: £nil).
Directors and their InterestsThe names of the directors who held office during the financial year are listed on page 53.
Biographical details of the directors who held office at the end of the financial year are shown on page 10.
No director had a material interest in any contract, other than their contract for services, during or at the end of the financial year that was significant to the Group’s business.
Directors’ Interests in SharesThe directors at 31 March 2012 and their interests in the share capital in the Company (all of which are held beneficially, other than 39,062 shares held by Garry Watson as executor for his late wife, 13,750 shares held in trust for Garry Watson’s children, 10,000 shares held in trust for Garry Watson’s grandchildren and options to acquire ordinary shares which are detailed in the analysis of options included in the Directors’ Remuneration Report), are as follows:
At 31 March 2012 At 31 March 2011
Directors Ordinary shares Options over
ordinary shares Ordinary shares Options over
ordinary shares
G S Watson 328,177 – 328,177 –
G C B Thomson 2,350,890 339,242 2,750,890 339,242
C Smith 231,680 239,394 231,680 239,394
A Brown – – – –
E B Cunningham 493,275 – 493,275 –
J K Brown – – – –
J H Delmar-Morgan – – – –
C C Grant – – – 213,967
Since 31 March 2012 the 39,062 shares held by Garry Watson as executor were transferred to his children and an additional 15,000 shares were transferred to be held in trust for his grandchildren. Also since 31 March 2012 the directors have purchased shares as follows:
G S Watson purchased 38,810 ordinary sharesC Smith purchased 15,524 ordinary sharesA Brown purchased 15,524 ordinary sharesE B Cunningham purchased 54,333 ordinary sharesJ K Brown purchased 38,810 ordinary sharesJ H Delmar-Morgan purchased 50,000 ordinary shares
No notification of any other change in the above interests has been received in the period from 31 March 2012 to the date of this report.
Business Review and Future DevelopmentsAccompanying this Directors’ Report are the Chairman’s Statement, Chief Executive Officer’s Report, Chief Financial Officer’s Report, Chief Investment Officer’s Report, Corporate Governance Statement and Directors’ Remuneration Report.
A review of the business and the future developments of the Group is presented in the Chairman’s Statement on page 2, the Chief Executive Officer’s Report on page 3, the Chief Financial Officer’s Report on pages 4 to 5 and the Chief Investment Officer’s Report on page 6, all of which forms part of this Directors’ Report by reference.

08
Braveheart Investment Group | Annual Report and Accounts 2012
| Governance | DIRECTORS’ REPORT
Key Performance Indicators (KPI’s)The KPI’s we use to monitor business performance, which given the nature of our business are primarily financial measures, are:
2012 2011
Net assets (£m) 4.19 4.52
Cash balance (£m) 0.4 0.64
(Loss)/profit after tax attributable to equity holders (£m) (1.71) (1.31)
Investments made by Group (£m) 0.10 0.11
Investments made by Group (number of companies) 3 6
Realised gain on sale of Group investments (£m) 0.04 0.17
Net unrealised movement on revaluation of Group investments (£m) (0.74) (0.44)
Returns achieved on client exit portfolio (% to date) 28.6 29.6
Funds Under Management £110m £12m
Commentary on these KPIs can be found in the Chief Financial Officer’s Report on pages 4 to 5 and the Chief Investment Officer’s Report on page 6.
Principal Risks and Uncertainties, and Financial InstrumentsThrough its operations the Group is exposed to a number of risks. The Group’s risk management objectives and policies are described in the Corporate Governance Statement on pages 12 to 14.
The Group’s financial instruments comprise investments designated at fair value through profit or loss, cash and various items such as trade and other receivables, and trade payables, all of which arise directly from its normal operations. The main purposes of these financial instruments are to provide returns from investment and finance for the Group’s operations.
Further information regarding the Group’s financial risk management objectives and policies, including those in relation to credit risk, liquidity risk and market risk, is provided in note 26 to the financial statements.
Share CapitalDetails of the structure of the Company’s share capital and the rights attaching to the shares are set out in note 21 to the financial statements.
At 31 March 2012 the Company had 19,281,047 allotted, called up and fully paid ordinary shares of 2 pence each.
The Company has one class of ordinary shares. All shares carry equal voting rights, equal rights to income and distribution of assets on liquidation or otherwise, and no right to fixed income.
There are no specific restrictions on the size of a holding or on the transfer of shares, which are both governed by the general provisions of the Company’s Articles of Association (the Articles) and prevailing legislation.
Power to purchase the Company’s own shares is provided in the Company’s Articles subject to statutory provisions. The directors have no existing authority from the shareholders to purchase the Company’s own shares.
Articles of AssociationThe Company’s Articles may be amended by a special resolution of the shareholders.
Appointment and Replacement of DirectorsThe Company may by ordinary resolution appoint a person who is willing to act to be a director, either to fill a vacancy or as an addition to the existing directors and may also determine the rotation in which any additional directors are to retire. Any person so appointed by the directors shall hold office only until the conclusion of business at the next Annual General Meeting and shall be eligible for reappointment by ordinary resolution at that meeting. The Company may also by ordinary resolution remove a director from office.
At each Annual General Meeting of the Company, directors eligible to retire shall retire from office by rotation. No director shall continue to hold office as a director after the third Annual General Meeting following his election or re-election, without submitting themselves for re-election at the said third Annual General Meeting.

Braveheart Investment Group | Annual Report and Accounts 2012
09DIRECTORS’ REPORT | Governance |
Significant ShareholdingsAs at 31 March 2012, the following beneficial owners each held 3% or more of the Company’s issued share capital:
Name Number Percentage
G C B Thomson 2,350,890 12.19
D C Thomson Ltd 1,319,300 6.84
BBHISL Nominees Limited1 5,626,840 29.18
A T G Burton 885,161 4.59
Chase Nominees Limited2 1,055,440 5.47
1 Beneficial owner being A Norris2 Beneficial owner being W Rehman
Directors’ ResponsibilitiesThe directors are responsible for preparing the Annual Report and the financial statements in accordance with law and regulations.Company law requires the directors to prepare financial statements for each financial year. Under that law the directors have elected to prepare the financial statements in accordance with International Reporting Standards (IFRSs) as adopted by the European Union. Under company law the directors must not approve the financial statements unless they are satisfied that they give a true and fair view of the state of affairs and profit or loss of the company and group. for that period. In preparing those financial statements, the directors are required to:
• selectsuitableaccountingpoliciesandthenapplythemconsistently;• makejudgementsandestimatesthatarereasonableandprudent;• statewhetherapplicableIFRSshavebeenfollowed,subjecttoanymaterialdeparturesdisclosedandexplainedinthefinancial
statements;and• preparethefinancialstatementsonagoingconcernbasisunlessitisinappropriatetopresumethattheCompanywillcontinue
in business.
The directors are responsible for keeping adequate accounting records which are sufficient to show and explain the Company’s transactions and disclose with reasonable accuracy at any time the financial position of the Group and of the Company and enable them to ensure that the financial statements comply with the Companies Act 2006. They are also responsible for safeguarding the assets of the Company and hence for taking reasonable steps for the prevention and detection of fraud and other irregularities.
Financial statements are published on the Group’s website in accordance with legislation in the United Kingdom governing the preparation and dissemination of financial statements, which may vary from legislation in other jurisdictions. The maintenance and integrity of the Group’s website is the responsibility of the directors.
Creditor Payment PolicyThe Group’s policy is to:• agreepaymenttermswitheachsupplierwhenplacingordersand• adheretotheagreedterms.
The Group’s and Company’s average creditor payment period at 31 March 2012 was 42 days (2011: 30 days) and 40 days (2011: 28 days) respectively.
Political and Charitable DonationsIt is the Board’s policy not to make any political donations nor charitable donations which exceed £200. The Group did not make any such donations in the year (2011: £nil).
Disclosure of Information to AuditorsThe directors confirm that:• sofaraseachdirectorisaware,thereisnorelevantauditinformationofwhichtheCompany’sauditorisunaware;and• thedirectorshavetakenallthestepsthattheyoughttohavetakenasdirectorsinordertomakethemselvesawareofany
relevant audit information and to establish that the auditors are aware of that information.
AuditorsIn accordance with section 489 of the Companies Act 2006, a resolution proposing the reappointment of Grant Thornton UK LLP will be put to the shareholders at the forthcoming Annual General Meeting.
On behalf of the Board
Aileen BrownCompany Secretary10 August 2012
Braveheart Investment Group | Annual Report and Accounts 2012
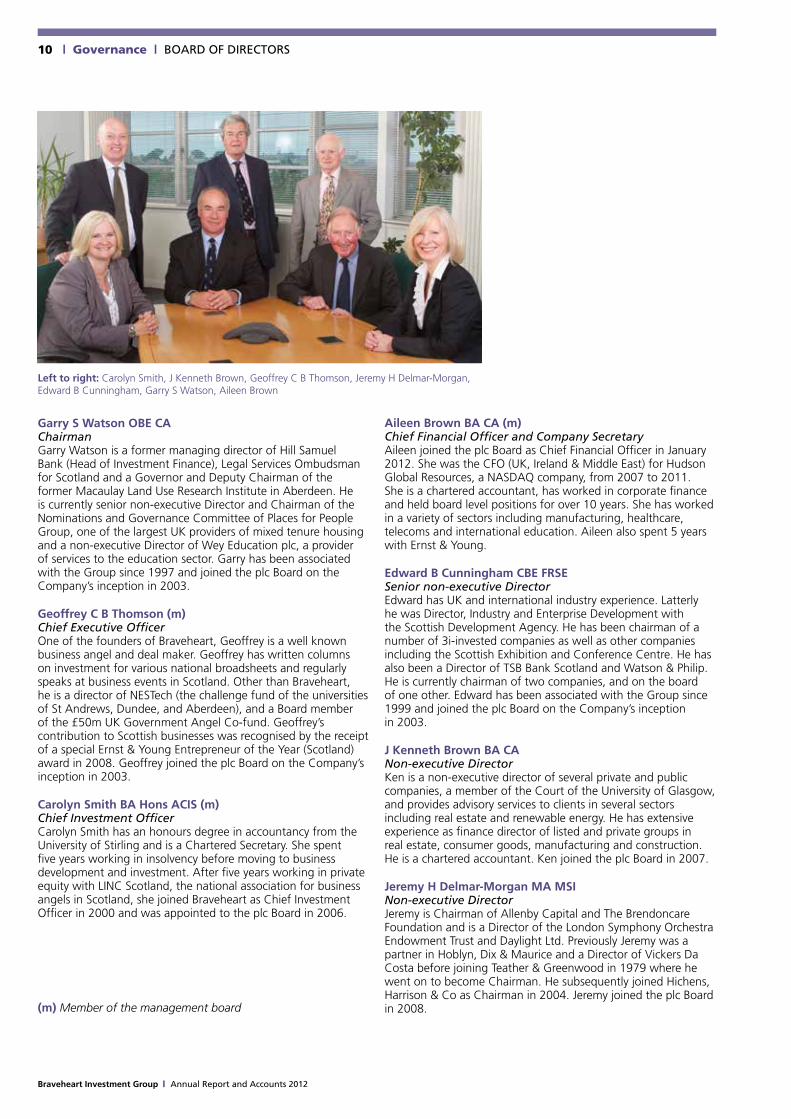
| Governance | BoARd of diRectoRs10
Left to right: Carolyn Smith, J Kenneth Brown, Geoffrey C B Thomson, Jeremy H Delmar-Morgan, Edward B Cunningham, Garry S Watson, Aileen Brown
Garry S Watson OBE CAChairmanGarry Watson is a former managing director of Hill Samuel Bank (Head of Investment Finance), Legal Services Ombudsman for Scotland and a Governor and Deputy Chairman of the former Macaulay Land Use Research Institute in Aberdeen. He is currently senior non-executive Director and Chairman of the Nominations and Governance Committee of Places for People Group, one of the largest UK providers of mixed tenure housing and a non-executive Director of Wey Education plc, a provider of services to the education sector. Garry has been associated with the Group since 1997 and joined the plc Board on the Company’s inception in 2003.
Geoffrey C B Thomson (m)Chief Executive OfficerOne of the founders of Braveheart, Geoffrey is a well known business angel and deal maker. Geoffrey has written columns on investment for various national broadsheets and regularly speaks at business events in Scotland. Other than Braveheart, he is a director of NESTech (the challenge fund of the universities of St Andrews, Dundee, and Aberdeen), and a Board member of the £50m UK Government Angel Co-fund. Geoffrey’s contribution to Scottish businesses was recognised by the receipt of a special Ernst & Young Entrepreneur of the Year (Scotland) award in 2008. Geoffrey joined the plc Board on the Company’s inception in 2003.
Carolyn Smith BA Hons ACIS (m)Chief Investment OfficerCarolyn Smith has an honours degree in accountancy from the University of Stirling and is a Chartered Secretary. She spent five years working in insolvency before moving to business development and investment. After five years working in private equity with LINC Scotland, the national association for business angels in Scotland, she joined Braveheart as Chief Investment Officer in 2000 and was appointed to the plc Board in 2006.
(m) Member of the management board
Aileen Brown BA CA (m)Chief Financial Officer and Company SecretaryAileen joined the plc Board as Chief Financial Officer in January 2012. She was the CFO (UK, Ireland & Middle East) for Hudson Global Resources, a NASDAQ company, from 2007 to 2011. She is a chartered accountant, has worked in corporate finance and held board level positions for over 10 years. She has worked in a variety of sectors including manufacturing, healthcare, telecoms and international education. Aileen also spent 5 years with Ernst & Young.
Edward B Cunningham CBE FRSESenior non-executive DirectorEdward has UK and international industry experience. Latterly he was Director, Industry and Enterprise Development with the Scottish Development Agency. He has been chairman of a number of 3i-invested companies as well as other companies including the Scottish Exhibition and Conference Centre. He has also been a Director of TSB Bank Scotland and Watson & Philip. He is currently chairman of two companies, and on the board of one other. Edward has been associated with the Group since 1999 and joined the plc Board on the Company’s inception in 2003.
J Kenneth Brown BA CA Non-executive DirectorKen is a non-executive director of several private and public companies, a member of the Court of the University of Glasgow, and provides advisory services to clients in several sectors including real estate and renewable energy. He has extensive experience as finance director of listed and private groups in real estate, consumer goods, manufacturing and construction. He is a chartered accountant. Ken joined the plc Board in 2007.
Jeremy H Delmar-Morgan MA MSINon-executive DirectorJeremy is Chairman of Allenby Capital and The Brendoncare Foundation and is a Director of the London Symphony Orchestra Endowment Trust and Daylight Ltd. Previously Jeremy was a partner in Hoblyn, Dix & Maurice and a Director of Vickers Da Costa before joining Teather & Greenwood in 1979 where he went on to become Chairman. He subsequently joined Hichens, Harrison & Co as Chairman in 2004. Jeremy joined the plc Board in 2008.

Braveheart Investment Group | Annual Report and Accounts 2012
MANAGEMENT BOARD | Governance | 11
Andrew T G Burton BSc Andrew is Managing Director of Viking Fund Managers Ltd (VFM) and Neon Capital Partners Ltd. Andrew has been involved in early stage technology investing since 1986. Before setting up VFM in 2002 he ran the Yorkshire Association of Business Angels (which he now chairs) and previously worked for UniVentures International at Leeds Metropolitan University where he was responsible for high growth programmes and incubators.
Vivian D Hallam MBA BSc CEngViv is Consultancy Director of VFM. Viv is a Chartered Mechanical Engineer and has an MBA from Aston Business School. He joined VFM in 2003 following twenty years of senior management in international advanced engineering companies, including Sarna, GKN and GEC where he was responsible for design, development and marketing of new products for the plastics, automotive and power industries.
Oliver E Woolley MBA BA (Hons)Oliver has been working in early-stage venture capital since selling his business in 1997. After university and travelling, Oliver decided not to become an accountant, but instead raised private equity and bank debt to start his own venture in the food industry. Oliver is an Executive Director of the British Business Angels Association (BBAA) and has an MBA from Imperial College Management School. Robert N K Taylor MBA BA (Hons)Bob is a founder of Envestors and an active private investor. He has been involved in early-stage venture capital since 2004. Bob’s background spans several industry sectors. He worked extensively in the oil industry initially, in Africa as a seismologist, followed by oil trading and broking roles in London. This led to a move into energy finance, joining an investment bank in Singapore to work on project finance deals throughout South East Asia. After Singapore, Bob moved back to the UK to complete an MBA and co-founded Envestors. Bob has a degree in Geology from Durham University. W Scott M Haughton MBA BA (Hons)Scott is a founder of Envestors and has been advising and supporting SMEs in fundraising since 2004. After 16 years working in senior sales and marketing roles for multi-national blue chip FMCG corporations, including Mars Confectionery, Rank Hovis McDougall and GlaxoSmithKline, Scott left the corporate consumer product world to successfully raise venture capital backing for a family orientated leisure business. Scott has a degree in Economics and Business and an MBA.
1: Andrew Burton, 2: Viv Hallam, 3: Oliver Woolley, 4: Bob Taylor, 5: Scott Haughton, 6: Geoffrey Thomson,7: Carolyn Smith, 8: Aileen Brown
6
7 8
1 2
4
5
3

12
Braveheart Investment Group | Annual Report and Accounts 2012
| Governance | CORPORATE GOvERNANCE STATEMENT
The directors recognise the importance of sound corporate governance. As a company whose shares are traded on the London Stock Exchange (Alternative Investment Market) (AIM), the Company is not obliged to comply with the corporate governance regime as set out in the UK Corporate Governance Code, but it does support the principles of the Code. It intends to comply with the Quoted Companies Alliance’s Corporate Governance Guidelines for Smaller Quoted Companies insofar as it is reasonably practicable for a public company of its size and nature. The directors have adopted a code of conduct for dealings by directors and employees which complies with the AIM Rules and are committed to maintaining the highest standards of corporate governance.
The Board of Directors The Board currently comprises the Chairman, Garry Watson, three other non-executive directors, Edward Cunningham, the senior non-executive director, Ken Brown and Jeremy Delmar-Morgan and three executive directors, the Chief Executive Officer, Geoffrey Thomson, the Chief Investment Officer, Carolyn Smith and the Chief Financial Officer, Aileen Brown.
Biographical details of the current directors are set out on page 10. Executive and non-executive directors are subject to re-election at intervals of no more than three years. The letters of appointment of all directors are available for inspection at the Company’s registered office during normal business hours. The Board meets at least eight times per annum. It has established an Audit and Risk Management Committee, a Remuneration Committee and a Nominations Committee, particulars of which appear hereafter.
All members of the Board and its committees served throughout the year.
Certain executive and non-executive directors are clients of Braveheart Ventures Ltd, the Company’s principal investment management subsidiary. Further information regarding related party transactions during the year is detailed in note 25 to the financial statements.
Non-executive DirectorsThe non-executive directors have a broad range of experience, as evidenced by their biographical details and are well equipped to bring independent judgement to bear on issues of strategy, performance, resources and standards of conduct that are vital to the success of the Company.
The Board has adopted guidelines for the appointment of non-executive directors which have been in place and which have been observed throughout the year. These provide for the orderly and constructive succession and rotation of the chairman and non-executive directors insofar as both chairman and non-executive directors will be appointed for an initial term of three years and may, at the Board’s discretion believing it to be in the best interests of the Company, be appointed for subsequent terms. The Chairman may serve as a non-executive director before commencing a first term as chairman.
InaccordancewiththeCompaniesAct2006,thedirectorscomplywith:adutytoactwithintheirpowers;adutytopromotethesuccessoftheCompany;adutytoexerciseindependentjudgement;adutytoexercisereasonablecare,skillanddiligence;adutytoavoidconflictsofinterest;adutynottoacceptbenefitsfromthirdpartiesandadutytodeclareanyinterestinaproposedtransaction or arrangement.
Delegation of Responsibilities by the Board of DirectorsUltimate authority for all aspects of the Group’s activities rests with the Board, the respective responsibilities of the Chairman and ChiefExecutiveOfficerarisingasaconsequenceofdelegationbytheBoard.TheBoardhasadoptedtwostatements;thefirstsetsout matters which are reserved to the Board and the second establishes the division of responsibilities between the Chairman and the Chief Executive Officer. The Chairman is responsible for the effectiveness of the Board and for ensuring communication with shareholders, while management of the Group’s business has been delegated by the Board to the Chief Executive Officer.
Audit and Risk Management CommitteeThe Audit and Risk Management Committee comprises Ken Brown (its Chairman), Edward Cunningham and Jeremy Delmar-Morgan and has primary responsibility for monitoring the quality of internal controls and ensuring that the financial performance of the Group is properly measured and reported. It receives reports from the executive management and auditors relating to the interim and annual accounts and the accounting and internal control systems in use throughout the Group. The Audit and Risk Management Committee meets not less than three times in each financial year and has unrestricted access to the Group’s auditors.

Braveheart Investment Group | Annual Report and Accounts 2012
13CORPORATE GOvERNANCE STATEMENT | Governance |
Remuneration CommitteeThe Remuneration Committee comprises Edward Cunningham (its Chairman), Ken Brown and Garry Watson. The Remuneration Committee reviews the performance of the executive directors and employees and makes recommendations to the Board on matters relating to their remuneration and terms of employment. The Remuneration Committee also considers and approves the granting of share options pursuant to the share option plan.
Nominations CommitteeThe Nominations Committee comprises Edward Cunningham (its Chairman) and Garry Watson and is responsible for the identification and nomination of candidates for the roles of Chairman, Chief Executive Officer, other executive directors and non-executive directors, the nomination of all directors of subsidiary companies and succession planning in relation to the above aforementioned posts. It is also concerned with matters relating to corporate governance, insofar as they may relate to concerns or complaints from shareholders concerning the conduct of Board directors, and bringing any such issue to the attention of the Board.
Attendance at Board and Committee Meetings The following table summarises the number of board and committee meetings held during the year and the attendance record of individual directors:
BoardAudit and Risk Management Remuneration Nominations
AttendedEligible to
attend AttendedEligible to
attend AttendedEligible to
attend AttendedEligible to
attend
G S Watson 11 11 – – 2 2 1 1
G C B Thomson 11 11 – – – – – –
C Smith 11 11 – – – – – –
C C Grant 9 9 – – – – – –
A Brown 2 2
E B Cunningham 8 11 3 3 2 2 1 1
J K Brown 10 11 3 3 2 2 – –
J H Delmar-Morgan 11 11 3 3 – – – –
Share DealingsThe Company has adopted, with effect from the date on which its shares were admitted to AIM, a code for directors’ and employees’ dealings in securities which is appropriate for a company whose securities are traded on AIM, and is in accordance with rule 21 of the AIM rules.
Investment AuthoritiesInvestment authorities are reviewed in March of each year and more frequently as determined by the Board. These authorities relate to the maximum amount that the executive directors may invest from the Group’s own resources in any one portfolio investment. Investments outwith the agreed parameters may be made with the agreement of a non-executive director or by the Board.
14
Braveheart Investment Group | Annual Report and Accounts 2012
| Governance | CORPORATE GOvERNANCE STATEMENT
Risk Management and Internal ControlRisk management is the responsibility of the Risk Management Group, which comprises the three executive directors. The Risk Management Group reports to the Audit and Risk Management Committee, which is responsible to the Board for ensuring that procedures are in place, and are being effectively implemented to identify, evaluate and manage the significant risks faced by the Group. A risk assessment matrix sets out those risks, and identifies their ownership and the controls that are in place. The Risk Management Group updates this matrix as changes arise in the nature of risks or the controls that are implemented to mitigate them. The Audit and Risk Management Committee reviews the risk matrix and the effectiveness of scenario testing by the Risk Management Group on a regular basis.
The following key risks, and controls to mitigate them, have been identified:
Activity Risk Impact Control(s)
Management Recruitment and retention of key staff.
Reduction in operating capability.
Stimulating and safe working environment.Balancing salary with longer term incentive plans.
Regulatory adherence
Breach of rules. Censure or withdrawal of authorisation.
Strong compliance regime.
Strategic Damage to reputation. Inability to secure new capital or clients.
Effective communications with shareholders and road shows.Robust compliance.
Inadequate disaster recovery procedures.
Loss of key operational and financial data.
Secure off-site storage of data.Two networks.
Financial Liquidity, market and credit risk.
Inability to continue as going concern.Reduction in asset values.
Robust capital management policies and procedures.Appropriate authority and investment levels as set by Treasury and Investment Policies.
Inappropriate controls and accounting policies.
Incorrect reporting of assets.
Audit and Risk Management Committee.
Further details of the financial risks, including quantitative considerations of their potential impacts, are set out in note 26 to the financial statements.
The directors have established procedures, as represented by this statement, for the purpose of providing a system of internal control. An internal audit function is not considered necessary or practical due to the size of the Group and the close day to day control exercised by the executive directors. However, the Board will continue to monitor the need for an internal audit function.
Going ConcernThe directors have reviewed the Group’s and the Company’s budgets and plans, taking account of reasonably possible changes in trading performance and, given the placing of shares described in note 28 and the level of currently available but undrawn bank facilities, have a reasonable expectation that the Group and the Company have adequate resources to continue in operational existence for the foreseeable future and that it is therefore appropriate to continue to adopt the going concern basis in preparing the financial statements.
Communication with ShareholdersThe Board is committed to maintaining good communication and having constructive dialogue with its shareholders. The Company has close ongoing relationships with its investment clients, many of whom are also private shareholders. Institutional shareholders, private client brokers and analysts have the opportunity to discuss issues and provide feedback at meetings with and presentations by the Company. In addition, all shareholders are encouraged to attend the Company’s Annual General Meeting.
Investors also have access to current information on the Company though its website, www.braveheartinvestmentgroup.co.uk, and via Aileen Brown, Company Secretary who is available to answer investor relations enquiries.
Braveheart Investment Group | Annual Report and Accounts 2012
15DIRECTORS’ REMUNERATION REPORT | Governance |
Remuneration CommitteeThe Remuneration Committee is comprised entirely of non-executive directors. It is chaired by Edward Cunningham and its other members are Garry Watson and Ken Brown. The Chief Executive Officer, Geoffrey Thomson, attends by invitation and assists the Committee. The Committee met twice during the year.
Remuneration PolicyThe Remuneration Committee recognises and has accepted the FSA’s Remuneration Code as it applies to the Group. The Committee is responsible for implementing and maintaining a remuneration policy which ensures that Executive Directors, other Group company directors, senior management and other employees are remunerated in such a manner as to ensure that (i) they are fairly rewarded in a manner which secures and retains the skilled and experienced individuals the Group requires to ensure its corporate objectives, includinganincreaseinshareholdervalue;(ii)conflictsofinterestareminimisedandthattheinterestsofstaffarealignedwiththelongterminterestsoftheGroup;and(iii)remunerationisconsistentwithandpromotessoundandeffectiveriskmanagementanddoes not encourage risk taking that exceeds the level of tolerated risk set by the Board and is in line with the business strategy, objectives, values and long-term interests of the Group. The Committee is committed to ensuring compliance with the FSA’s Remuneration Code.
Determination of Directors’ and Senior Management’s SalariesThe Remuneration Committee believes that the interests of the executive directors, other Group company directors, senior management and staff and those of the shareholders and other stakeholders are best aligned by a remuneration policy that provides a base salary together with awards under the Group’s Share Option Scheme. The Remuneration Committee reviews and determines annually directors’ and senior management’s salaries in relation to the tasks and responsibilities involved and the level of comparable salaries in the market place. In particular, the Committee seeks to ensure that salaries are competitive. In its final determination of salaries, the Committee’s conclusions are set within what is affordable. During the year contribution to certain Viking Fund Manager employee pension arrangements continued. The Group increased contractual salaries with effect from 1 July 2011 in respect of three executive directors but did not contribute to any pension schemes nor pay any bonuses. The increases to contractual salaries were £3,250 (2.3%), £5,000 (4.8%) and £10,000 (10%) for G Thomson, C Smith and C Grant respectively. However executive directors had accepted voluntary reductions in salary in the prior year which were subsequently re-reimbursed on a discretionary basis following Board approval, hence the apparent increase in remuneration in the table.
Executive Director Service AgreementsEach of the executive directors has a service agreement with the Company. These agreements can be terminated by either party giving the other written notice at any time, not less than six months in the case of Geoffrey Thomson and not less than three months in the cases of Carolyn Smith and Aileen Brown. Payments on termination are restricted to the value of the salary for the notice period.
Non-executive DirectorsThe fees payable to the Chairman and the non-executive directors are first reviewed by the Committee, taking into account market rates, following which it submits recommendations to the Board for approval. The Company did not increase non-executive directors’ contractual fees during the year. However non-executive directors had accepted voluntary reductions in fees in the prior year which were subsequently re-reimbursed on a discretionary basis following Board approval, hence the apparent increase in remuneration.
The Chairman and each non-executive director have agreed a letter of appointment which sets out their duties, responsibilities and fees.
Directors’ Remuneration The total amount of directors’ remuneration is set out below:
Total 2012
£
Total 2011
£
Executive directors:
G C B Thomson 155,946 113,400
C Smith 117,417 84,000
A Brown 23,692 –
C C Grant 92,539 80,000
Non-executive directors:
G S Watson 16,144 11,025
E B Cunningham 10,762 7,350
J K Brown 10,762 7,350
J H Delmar-Morgan 10,762 7,350
438,024 310,475
The Company did not contribute to any director’s pension scheme nor pay any bonuses to directors during the year (2011: £nil). During the year the Company paid private medical insurance premiums of £1,740, £608 and £1,396 (2011: £1,394, £484 and £1,119) in respect of Geoffrey Thomson, Carolyn Smith and Colin Grant.
16
Braveheart Investment Group | Annual Report and Accounts 2012
| Governance | DIRECTORS’ REMUNERATION REPORT
Share Option SchemeThe Company operates the Braveheart Investment Group plc Executive Share Option Scheme 2006 (the Scheme), which comprises Part A, a share option scheme approved by HMRC (the Approved Scheme) and Part B, an unapproved share option scheme (the Unapproved Scheme).
Historically, the Scheme was open to all directors and employees of the Group, although non-executive directors could only participate in Part B. The Scheme is now open only to all executive directors and employees.
Options are granted by the Board taking into account the need to motivate, retain and recruit high calibre employees and with regard to the contribution that such employees are expected to make in achieving the Company’s objectives.
Options granted under the Scheme are categorised as Employment Options, Performance Options or Other Options. Employment Options may be granted under either Part A or Part B. All Performance Options and Other Options are granted under Part B.
Employment Options vest and become exercisable on the third anniversary of date of grant, and generally lapse on the earlier of cessation of employment (or 6 months thereafter if options have vested at cessation date) or the 10th anniversary of date of grant.
Performance Options have to date had vesting conditions linked to the growth in the Company’s market capitalisation from the date of grant (Performance Conditions). If a Performance Condition is not met, the related Performance Option lapses at the end of the relevant measurement period.
Otherwise Performance Options vest on attainment of the Performance Condition and become exercisable on the 1st anniversary of the date of the Performance Condition being met, and lapse on the 10th anniversary of date of grant.
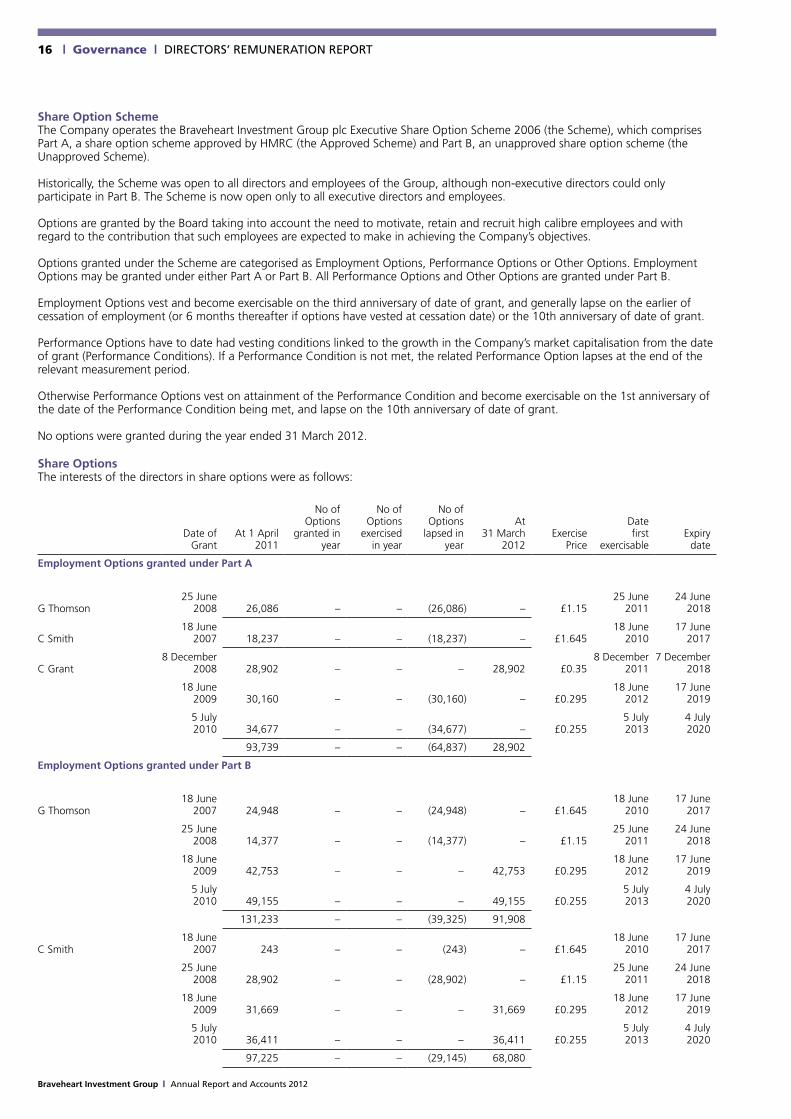
No options were granted during the year ended 31 March 2012.
Share Options The interests of the directors in share options were as follows:
Date of Grant
At 1 April 2011
No of Options
granted in year
No of Options
exercised in year
No of Options
lapsed in year
At 31 March
2012Exercise
Price
Date first
exercisableExpiry
date
Employment Options granted under Part A
G Thomson25 June
2008 26,086 – – (26,086) – £1.1525 June
201124 June
2018
C Smith18 June
2007 18,237 – – (18,237) – £1.64518 June
201017 June
2017
C Grant8 December
2008 28,902 – – – 28,902 £0.358 December
20117 December
2018
18 June 2009 30,160 – – (30,160) – £0.295
18 June 2012
17 June 2019
5 July 2010 34,677 – – (34,677) – £0.255
5 July 2013
4 July 2020
93,739 – – (64,837) 28,902
Employment Options granted under Part B
G Thomson18 June
2007 24,948 – – (24,948) – £1.64518 June
201017 June
2017
25 June 2008 14,377 – – (14,377) – £1.15
25 June 2011
24 June 2018
18 June 2009 42,753 – – – 42,753 £0.295
18 June 2012
17 June 2019
5 July 2010 49,155 – – – 49,155 £0.255
5 July 2013
4 July 2020
131,233 – – (39,325) 91,908
C Smith18 June
2007 243 – – (243) – £1.64518 June
201017 June
2017
25 June 2008 28,902 – – (28,902) – £1.15
25 June 2011
24 June 2018
18 June 2009 31,669 – – – 31,669 £0.295
18 June 2012
17 June 2019
5 July 2010 36,411 – – – 36,411 £0.255
5 July 2013
4 July 2020
97,225 – – (29,145) 68,080
Braveheart Investment Group | Annual Report and Accounts 2012
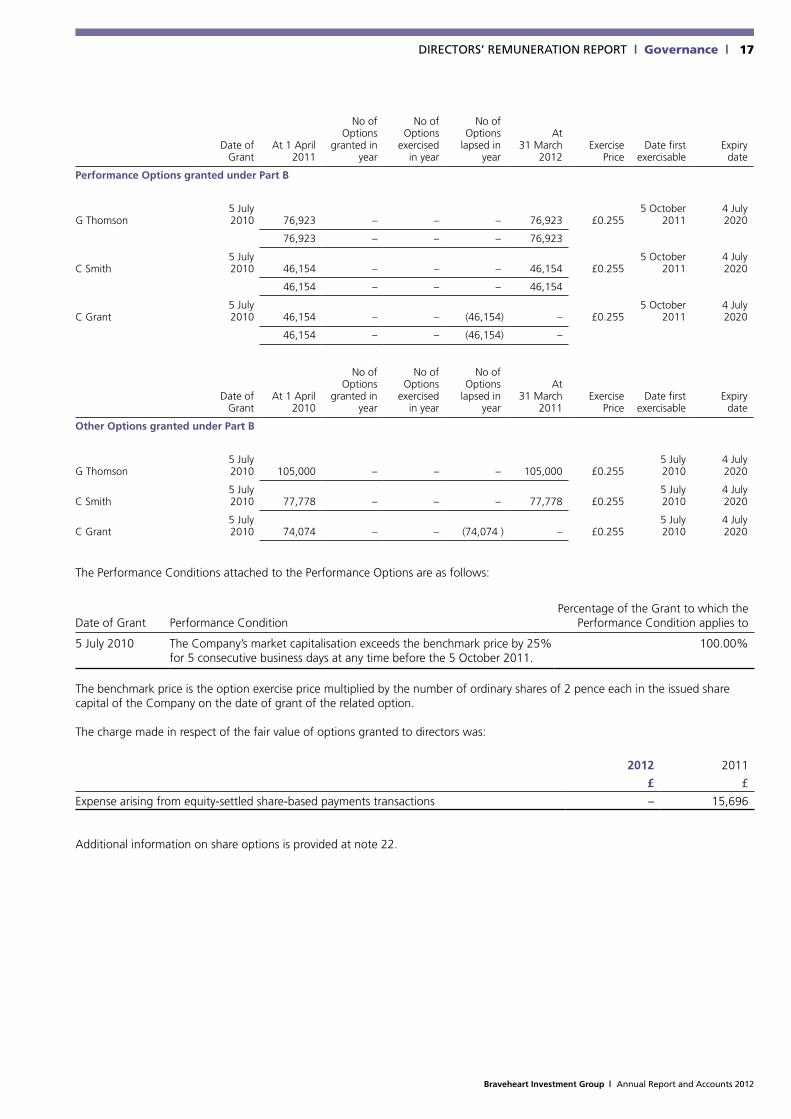
17DIRECTORS’ REMUNERATION REPORT | Governance |
Date of Grant
At 1 April 2011
No of Options
granted in year
No of Options
exercised in year
No of Options
lapsed in year
At 31 March
2012Exercise
PriceDate first
exercisableExpiry
date
Performance Options granted under Part B
G Thomson5 July 2010 76,923 – – – 76,923 £0.255
5 October 2011
4 July 2020
76,923 – – – 76,923
C Smith5 July 2010 46,154 – – – 46,154 £0.255
5 October 2011
4 July 2020
46,154 – – – 46,154
C Grant5 July 2010 46,154 – – (46,154) – £0.255
5 October 2011
4 July 2020
46,154 – – (46,154) –
Date of Grant
At 1 April 2010
No of Options
granted in year
No of Options
exercised in year
No of Options
lapsed in year
At 31 March
2011Exercise
PriceDate first
exercisableExpiry
date
Other Options granted under Part B
G Thomson5 July 2010 105,000 – – – 105,000 £0.255
5 July 2010
4 July 2020
C Smith5 July 2010 77,778 – – – 77,778 £0.255
5 July 2010
4 July 2020
C Grant5 July 2010 74,074 – – (74,074 ) – £0.255
5 July 2010
4 July 2020
The Performance Conditions attached to the Performance Options are as follows:
Date of Grant Performance ConditionPercentage of the Grant to which the
Performance Condition applies to
5 July 2010 The Company’s market capitalisation exceeds the benchmark price by 25% for 5 consecutive business days at any time before the 5 October 2011.
100.00%
The benchmark price is the option exercise price multiplied by the number of ordinary shares of 2 pence each in the issued share capital of the Company on the date of grant of the related option.
The charge made in respect of the fair value of options granted to directors was:
2012 2011
£ £
Expense arising from equity-settled share-based payments transactions – 15,696
Additional information on share options is provided at note 22.
Braveheart Investment Group | Annual Report and Accounts 2012
18 | Governance | Independent AudItoRs’ RepoRt to the MeMbeRs of bRAveheARt InvestMent GRoup plc
We have audited the financial statements of Braveheart Investment Group plc for the year ended 31 March 2012 which comprise the Consolidated Statement of Comprehensive Income, the Consolidated and Parent Company Statement of Financial Position, the Consolidated and Parent Company Statement of Cash Flows, the Consolidated and Parent Company Statement of Changes in Equity and the related notes. The financial reporting framework that has been applied in their preparation is applicable law and International Financial Reporting Standards (IFRS) as adopted by the European Union and, as regards the parent company financial statements, as applied in accordance with the provisions of the Companies Act 2006.
This report is made solely to the Company’s members, as a body, in accordance with Chapter 3 of Part 16 of the Companies Act 2006. Our audit work has been undertaken so that we might state to the Company’s members those matters we are required to state to them in an auditors’ report and for no other purpose. To the fullest extent permitted by law, we do not accept or assume responsibility to anyone other than the Company and the Company’s members as a body, for our audit work, for this report, or for the opinions we have formed.
Respective responsibilities of directors and auditorsAs explained more fully in the Directors’ Responsibilities Statement on page 9, the directors are responsible for the preparation of the financial statements and for being satisfied that they give a true and fair view. Our responsibility is to audit and express an opinion on the financial statements in accordance with applicable law and International Standards on Auditing (UK and Ireland). Those standards require us to comply with the Auditing Practices Board’s (APB’s) Ethical Standards for Auditors.
Scope of the audit of the financial statementsA description of the scope of an audit of financial statements is provided on the APB’s website at www.frc.org.uk/apb/scope/private.cfm.
Opinion on financial statementsIn our opinion:• thefinancialstatementsgiveatrueandfairviewofthestateoftheGroup’sandoftheparentCompany’saffairsasat31March
2012 and of the Group’s loss for the year then ended; • theGroupfinancialstatementshavebeenproperlypreparedinaccordancewithIFRSasadoptedbytheEuropeanUnion;• theparentCompanyfinancialstatementshavebeenproperlypreparedinaccordancewithIFRSasadoptedbytheEuropean
Union and as applied in accordance with the provisions of the Companies Act 2006; and• thefinancialstatementshavebeenpreparedinaccordancewiththerequirementsoftheCompaniesAct2006.
Opinion on other matter prescribed by the Companies Act 2006In our opinion the information given in the Directors’ Report for the financial year for which the financial statements are prepared is consistent with the financial statements.
Matters on which we are required to report by exceptionWe have nothing to report in respect of the following matters where the Companies Act 2006 requires us to report to you if, in our opinion:• adequateaccountingrecordshavenotbeenkeptbytheParentCompany,orreturnsadequateforouraudithavenotbeen
received from branches not visited by us; or• theParentCompanyfinancialstatementsarenotinagreementwiththeaccountingrecordsandreturns;or• certaindisclosuresofdirectors’remunerationspecifiedbylawarenotmade;or• wehavenotreceivedalltheinformationandexplanationswerequireforouraudit.
Robert HannahSenior Statutory AuditorFor and on behalf of Grant Thornton UK LLPStatutory AuditorChartered AccountantsEDINBURGH10 August 2012

Braveheart Investment Group | Annual Report and Accounts 2012
19 consolIdAted stAteMent of coMpRehensIve IncoMe for the year ended 31 March 2012 | Accounts and notes |
Notes2012
£2011
£
Revenue 3 1,265,139 925,781
Unrealised loss on the fair value movements of investments 12 (742,143) (464,029)
Movement on contingent consideration 20 541,882 20,314
Fair value uplift on disposal of investment 39,326 168,365
Finance revenue 5 18,811 31,629
Total income 1,123,015 682,060
Employee benefits expense 4 (1,762,114) (1,291,280)
Other operating costs (1,045,206) (692,543)
Total operating expenses (2,807,320) (1,983,823)
Finance costs 6 (28,691) (4,369)
Total costs (2,836,011) (1,988,192)
Loss before tax (1,712,996) (1,306,132)
Tax 8 – –
Total loss and total comprehensive loss for the year (1,712,996) (1,306,132)
Loss attributable to:
Equity holders of the parent (1,724,083) (1,305,815)
Non-controlling interest 11,087 (317)
(1,712,996) (1,306,132)
Loss per share Pence Pence
– basic and diluted 10 (9.46) (9.06)
All revenues and losses arise from continuing operations.
The accompanying accounting policies and notes form part of these financial statements.
20
Braveheart Investment Group | Annual Report and Accounts 2012
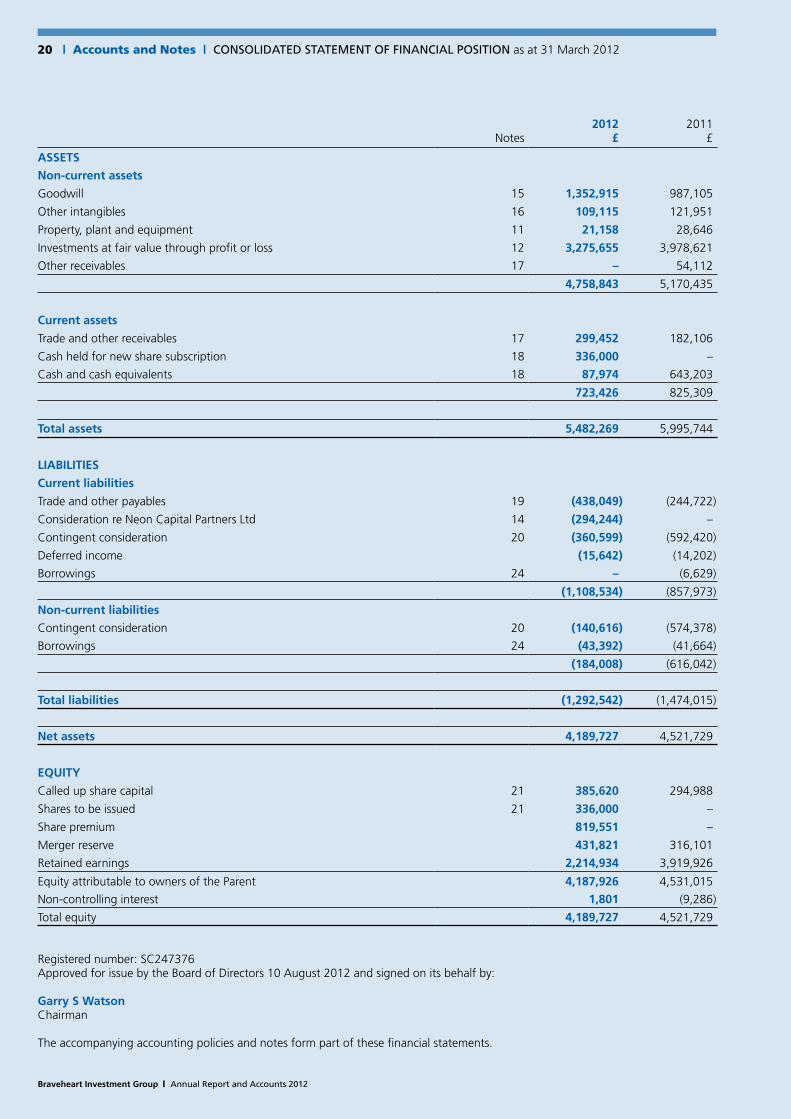
| Accounts and Notes | consolIdAted stAteMent of fInAncIAl posItIon as at 31 March 2012
Notes2012
£2011
£
ASSETS
Non-current assets
Goodwill 15 1,352,915 987,105
Other intangibles 16 109,115 121,951
Property, plant and equipment 11 21,158 28,646
Investments at fair value through profit or loss 12 3,275,655 3,978,621
Other receivables 17 – 54,112
4,758,843 5,170,435
Current assets
Trade and other receivables 17 299,452 182,106
Cash held for new share subscription 18 336,000 –
Cash and cash equivalents 18 87,974 643,203
723,426 825,309
Total assets 5,482,269 5,995,744
LIABILITIES
Current liabilities
Trade and other payables 19 (438,049) (244,722)
Consideration re Neon Capital Partners Ltd 14 (294,244) –
Contingent consideration 20 (360,599) (592,420)
Deferred income (15,642) (14,202)
Borrowings 24 – (6,629)
(1,108,534) (857,973)
Non-current liabilities
Contingent consideration 20 (140,616) (574,378)
Borrowings 24 (43,392) (41,664)
(184,008) (616,042)
Total liabilities (1,292,542) (1,474,015)
Net assets 4,189,727 4,521,729
EQUITY
Called up share capital 21 385,620 294,988
Shares to be issued 21 336,000 –
Share premium 819,551 –
Merger reserve 431,821 316,101
Retained earnings 2,214,934 3,919,926
Equity attributable to owners of the Parent 4,187,926 4,531,015
Non-controlling interest 1,801 (9,286)
Total equity 4,189,727 4,521,729
Registered number: SC247376Approved for issue by the Board of Directors 10 August 2012 and signed on its behalf by:
Garry S WatsonChairman
The accompanying accounting policies and notes form part of these financial statements.

21
Braveheart Investment Group | Annual Report and Accounts 2012
coMpAny stAteMent of fInAncIAl posItIon as at 31 March 2012 | Accounts and notes |
Notes2012
£2011
£
ASSETS
Non-current assets
Investments at fair value through profit or loss 12 2,123,002 2,509,143
Investment in subsidiaries 13 2,673,968 2,238,097
Other receivables 17 – 54,112
4,796,970 4,801,352
Current assets
Trade and other receivables 17 721,921 505,409
Cash held for new share subscription 18 336,000 –
Cash and cash equivalents 18 12,688 573,965
1,070,609 1,079,374
Total assets 5,867,579 5,880,726
LIABILITIES
Current liabilities
Trade and other payables 19 (682,968) (334,619)
Consideration re Neon Capital Partners Ltd 14 (294,244) –
Contingent consideration 20 (360,599) (592,420)
(1,337,811) (927,039)
Non-current liabilities
Contingent consideration 20 (140,616) (574,378)
(140,616) (574,378)
Total liabilities (1,478,427) (1,501,417)
Net assets 4,389,152 4,379,309
EQUITY
Called up share capital 21 385,620 294,988
Shares to be issued 21 336,000 –
Share premium 819,551 –
Merger reserve 431,821 316,101
Share-based payments 284,862 265,771
Retained earnings 2,131,298 3,502,449
Equity attributable to owners of the Parent 4,389,152 4,379,309
Registered number: SC247376Approved for issue by the Board of Directors on 10 August 2012 and signed on its behalf by:
Garry S WatsonChairman
The accompanying accounting policies and notes form part of these financial statements.
22
Braveheart Investment Group | Annual Report and Accounts 2012
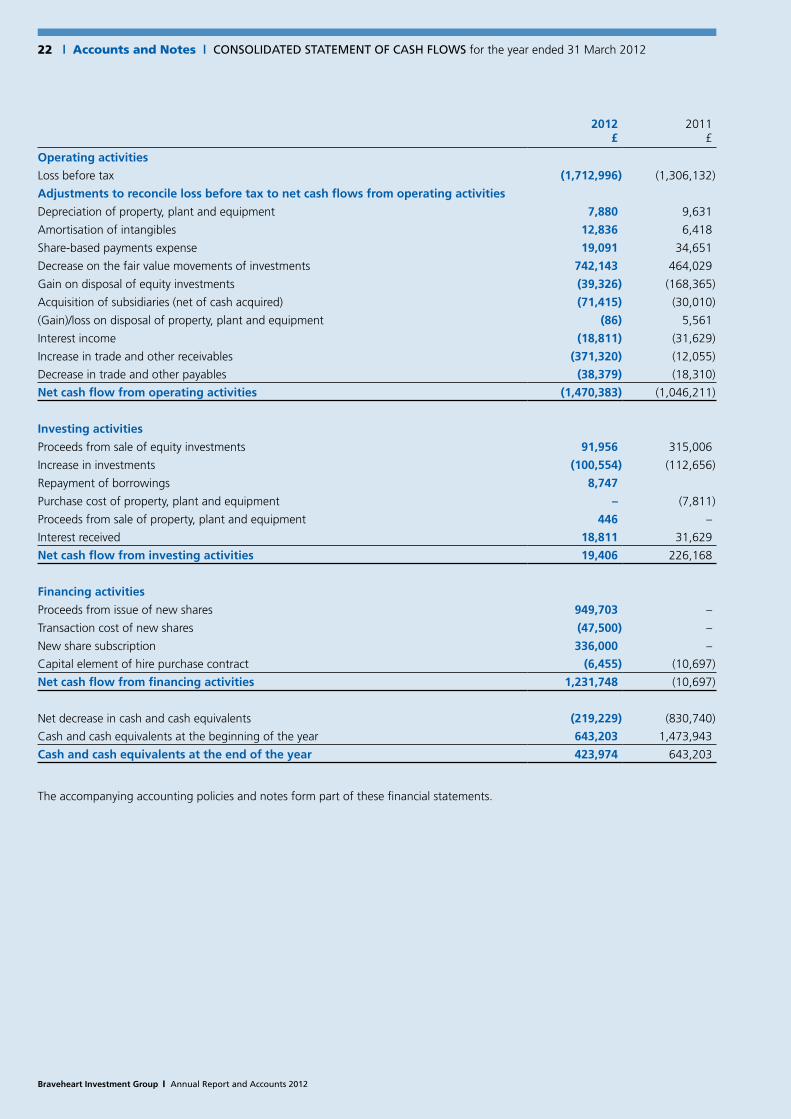
| Accounts and Notes | consolIdAted stAteMent of cAsh flows for the year ended 31 March 2012
2012£
2011£
Operating activities
Loss before tax (1,712,996) (1,306,132)
Adjustments to reconcile loss before tax to net cash flows from operating activities
Depreciation of property, plant and equipment 7,880 9,631
Amortisation of intangibles 12,836 6,418
Share-based payments expense 19,091 34,651
Decrease on the fair value movements of investments 742,143 464,029
Gain on disposal of equity investments (39,326) (168,365)
Acquisition of subsidiaries (net of cash acquired) (71,415) (30,010)
(Gain)/loss on disposal of property, plant and equipment (86) 5,561
Interest income (18,811) (31,629)
Increase in trade and other receivables (371,320) (12,055)
Decrease in trade and other payables (38,379) (18,310)
Net cash flow from operating activities (1,470,383) (1,046,211)
Investing activities
Proceeds from sale of equity investments 91,956 315,006
Increase in investments (100,554) (112,656)
Repayment of borrowings 8,747
Purchase cost of property, plant and equipment – (7,811)
Proceeds from sale of property, plant and equipment 446 –
Interest received 18,811 31,629
Net cash flow from investing activities 19,406 226,168
Financing activities
Proceeds from issue of new shares 949,703 –
Transaction cost of new shares (47,500) –
New share subscription 336,000 –
Capital element of hire purchase contract (6,455) (10,697)
Net cash flow from financing activities 1,231,748 (10,697)
Net decrease in cash and cash equivalents (219,229) (830,740)
Cash and cash equivalents at the beginning of the year 643,203 1,473,943
Cash and cash equivalents at the end of the year 423,974 643,203
The accompanying accounting policies and notes form part of these financial statements.

Braveheart Investment Group | Annual Report and Accounts 2012
23coMpAny stAteMent of cAsh flows for the year ended 31 March 2012 | Accounts and Notes |
2012£
2011£
Operating activities
Loss before tax (1,371,151) (2,283,064)
Adjustments to reconcile loss before tax to net cash flows from operating activities
Decrease on the fair value movements of investments 400,318 484,912
Decrease on the fair value of subsidiaries 473,282 1,442,848
Gain on disposal of equity investments (39,326) (156,622)
Acquisition of subsidiaries (380,000) (45,267)
Interest income (18,724) (30,038)
Increase in trade and other receivables (162,400) (156,529)
Increase in trade and other payables (9,352) 97,251
Net cash flow from operating activities (1,107,353) (646,509)
Investing activities
Investment in subsidiaries (400,000) (420,000)
Proceeds from sale of equity investments 91,956 283,263
Increase in investments (75,554) (50,154)
Repayment of borrowings 8,747 –
Interest received 18,724 30,038
Net cash flow from investing activities (356,127) (156,853)
Financing activities
Proceeds from issue of new shares 949,703 –
Transaction cost of new shares (47,500) –
New share subscription 336,000 –
Net cash flow from financing activities 1,238,203 –
Net decrease in cash and cash equivalents (225,277) (803,362)
Cash and cash equivalents at the beginning of the year 573,965 1,377,327
Cash and cash equivalents at the end of the year 348,688 573,965
The accompanying accounting policies and notes form part of these financial statements.

24
Braveheart Investment Group | Annual Report and Accounts 2012
| Accounts and Notes | consolIdAted stAteMent of chAnGes In equIty for the year ended 31 March 2012
Attributable to owners of the Parent
Share Capital
£
Shares to be issued
£
Share Premium
£
Merger Reserve
£
Retained Earnings
£Total
£
Non-controlling
interest£
Total Equity
£
Group
At 1 April 2010 278,316 – – 140,783 5,191,090 5,610,189 (8,969) 5,601,220
Issue of new share capital 16,672 – – 175,318 – 191,990 – 191,990
Share-based payments – – – – 34,651 34,651 – 34,651
Transactions with owners 16,672 – – 175,318 34,651 226,641 – 226,641
Loss and total comprehensive loss for the year – – – – (1,305,815) (1,305,815) (317) (1,306,132)
At 1 April 2011 294,988 – – 316,101 3,919,926 4,531,015 (9,286) 4,521,729
Issue of new share capital 90,632 – 819,551 115,720 – 1,025,903 – 1,025,903
Shares to be issued – 336,000 – – – 336,000 – 336,000
Share-based payments – – – – 19,091 19,091 – 19,091
Transactions with owners 90,632 336,000 819,551 115,720 19,091 1,380,994 – 1,380,994
Loss and total comprehensive loss for the year – – – – (1,724,083) (1,724,083) 11,087 (1,712,996)
At 31 March 2012 385,620 336,000 819,551 431,821 2,214,934 4,187,926 1,801 4,189,727
Share Capital
£
Shares to be issued
£
Share Premium
£
Merger Reserve
£
Retained Earnings
£Total
£
Company
At 1 April 2010 278,316 – – 140,783 5,785,513 6,204,612
Issue of new share capital 16,672 – – 175,318 – 191,990
Share-based payments – – – – 265,771 265,771
Transactions with owners 16,672 – – 175,318 265,771 457,761
Loss and total comprehensive loss for the year – – – – (2,283,064) (2,283,064)
At 1 April 2011 294,988 – – 316,101 3,768,220 4,379,309
Issue of new share capital 90,632 – 819,551 115,720 – 1,025,903
Share-based payments – – – – 19,091 19,091
Shares to be issued – 336,000 – – – 336,000
Transactions with owners 90,632 336,000 819,551 115,720 19,091 1,380,994
Loss and total comprehensive loss for the year – – – – (1,371,151) (1,371,151)
At 31 March 2012 385,620 336,000 819,551 431,821 2,416,160 4,389,152
The accompanying accounting policies and notes form part of these financial statements.

Braveheart Investment Group | Annual Report and Accounts 2012
25notes to the fInAncIAl stAteMents for the year ended 31 March 2012 | Accounts and Notes |
1 Corporate informationThe Group and Company financial statements of Braveheart Investment Group plc (the Company) for the year ended 31 March 2012 were authorised for issue by the Board of Directors on 10 August 2012 and the statements of financial position were signed on the Board’s behalf by Garry Watson.
Braveheart Investment Group plc is a company incorporated in the United Kingdom under the Companies Act 2006. The address of the registered office is detailed at the back of this report. The nature of the Group’s operations and its principal activities are set out in the Directors’ Report. The Company is registered in Scotland. The Company’s ordinary shares are traded on the London Stock Exchange Alternative Investment Market (AIM).
2 Accounting policies(a) basis of preparationThe Group and Company financial statements have been prepared in accordance with International Financial Reporting Standards (IFRS) as adopted by the European Union as they apply to financial statements for the year ended 31 March 2012 and as applied in accordance with the provisions of the Companies Act 2006. The principal accounting policies adopted by the Group and by the Company are set out in the following notes.
The Company has taken advantage of the provision of section 408 of the Companies Act 2006 not to publish its own Statement of Comprehensive Income. The amount of loss for the financial year dealt with in the financial statements of the Company is set out in note 9 to the accounts.
The financial statements have been prepared on a historical cost basis, except where otherwise indicated. The financial statements are presented in sterling and all values are rounded to the nearest pound (£) except where otherwise indicated.
The Group’s business activities (together with the factors likely to affect its future development, performance and position) and its financial position are set out in the Chairman’s Statement on page 2, the Chief Executive Officer’s Report on page 3, the Chief Financial Officer’s Report on pages 4 to 5 and the Chief Investment Officer’s Report on page 6. The Group’s risk management objectives and policies are described in the Corporate Governance Statement on pages 12 to 14. Further information regarding the Group’s financial risk management objectives and policies, including those in relation to credit risk, liquidity risk and market risk, is provided in note 26 to the financial statements. The Group’s capital management objectives are stated below on page 29.
The directors have reviewed the Group’s and the Company’s budgets and plans, taking account of reasonably possible changes in trading performance and, given the placing of shares described in note 28 and the level of currently available but undrawn bank facilities, have a reasonable expectation that the Group and the Company have adequate resources to continue in operational existence for the foreseeable future and that it is therefore appropriate to continue to adopt the going concern basis in preparing the financial statements.
(b) changes in accounting policy and disclosuresNo new standards, interpretations and amendments effective from 1 April 2011 have had a material effect on the Group’s financial statements.
(c) new standards and interpretations not yet applied The International Accounting Standards Board has issued the following standards and interpretations with an effective date after the date of these financial statements:
International Accounting Standards (IAS/IFRS) Effective for accounting periods commencing on or after
IFRS 9 Financial Instruments 1 January 2015
IFRS 10 Consolidated Financial Statements 1 January 2013
IFRS 11 Joint Arrangements 1 January 2013
IFRS 12 Disclosure of Interests in Other Entities 1 January 2013
IFRS 13 Fair Value Measurement 1 January 2013
IFRS 9 will eventually replace IAS 39 in its entirety and is intended to simplify the classification and measurement requirements for financial instruments. The process has been divided into three main phases, classification and measurement; impairment; and hedge accounting.
IFRS 13 establishes a single framework for all fair value measurements when fair value is required or permitted by IFRS. It does not change when an entity is required to use fair value but rather describes how to measure fair value under IFRS when it is required or permitted.
The directors do not anticipate that the adoption of the remaining standards and interpretations will have a material impact on the Group’s financial statements in the period of initial application.

26
Braveheart Investment Group | Annual Report and Accounts 2012
| Accounts and Notes | NOTES TO THE FINANCIAL STATEMENTS for the year ended 31 March 2012 continued
2 Accounting policies (continued)(d) basis of consolidationThe Group’s financial statements consolidate the results of Braveheart Investment Group plc and its subsidiaries (together referred to as the Group) drawn up to 31 March each year. The financial statements of the subsidiaries used in the preparation of the consolidated financial statements are prepared for the same reporting year as the parent company using consistent accounting policies. All intra-group balances, transactions, income and expenses are eliminated in full on consolidation.
The subsidiaries have been consolidated from the date of their acquisition, being the date on which the Group obtained control, and will continue to be consolidated until the date that such control ceases. Control comprises the power to govern the financial and operating policies of the subsidiary so as to obtain benefit from its activities and is achieved through direct ownership.
Group companies manage, and have an 89.29% equity interest in, Strathclyde Innovation Fund LP, which is included in the consolidated financial statements.
Non-controlling interests represent the portion of profit or loss and net assets that is not held by the Group and are presented separately in the consolidated statement of comprehensive income and within equity in the consolidated statement of financial position separately from parent shareholders’ equity.
(e) use of estimates and assumptionsThe preparation of the financial statements in conformity with IFRS requires management to make judgements, estimates and assumptions that affect the application of policies and reported amounts of assets and liabilities, income and expenses. The estimates and associated assumptions are based on historical experience and other factors that are believed to be reasonable under the circumstances, the results of which form the basis of making the judgements about carrying values of assets and liabilities that are not readily apparent from other sources. Actual results may differ from these estimates. Where management’s judgement has been applied, this is noted in the relevant accounting policy.
The key assumptions concerning the future and other key sources of estimating uncertainty at the reporting date that have a significant risk of causing a material adjustment to the carrying amounts of assets and liabilities within the next financial year are discussed below:
Fair value of unquoted investmentsUnquoted investments have been valued by the directors in compliance with the principles of the International Private Equity and Venture Capital Guidelines. The use of such valuation techniques requires the directors to make certain judgements including making assessments of future revenue and earnings of portfolio companies, appropriate multiples to apply, and marketability and other risk discounts and provisions, and hence they are subject to uncertainty. The fair value of unquoted investments at 31 March 2012 was £3,275,655 (2011: £3,925,991).
Share-based paymentsThe Group measures the cost of equity-settled transactions by reference to the fair value of the equity instruments at the date at which they were granted. Judgement is required in determining the most appropriate valuation model for a grant of equity instruments depending on the terms and conditions of the grant. Management are also required to use certain assumptions in determining the most appropriate inputs to the valuation model including expected life of the option, volatility, risk free rate and dividend yield. The assumptions and models used are fully disclosed in note 22.
Contingent considerationUnder IFRS 3: Business combinations contingent consideration is included in the cost of a business combination to the extent that it is deemed probable and can be measured reliably. This requires management to assess the probability and to estimate the financial impact of events on which consideration is contingent. Under IFRS 3 Revised an assessment of probability is no longer required but initial fair value has to be assessed at acquisition date, and post acquisition changes in fair value are charged to the statement of comprehensive income.
Intangible assetsIntangible assets that are acquired as a result of a business combination are separately recognised on acquisition at their fair value, and amortised over their expected useful life. This requires management to make an assessment of an asset’s separability, revenue stream and life, and apply suitable valuation methodologies thereto.
Impairment of goodwill Goodwill is subject to an impairment test on an annual basis or earlier where any event or change in circumstance is identified that indicates that the carrying value may not be recoverable. Testing for impairment requires a comparison of the carrying value amount of goodwill against the recoverable amount, which is the value-in-use of the cash-generating unit to which the goodwill is allocated. Value-in-use requires estimation of future cash flows expected from the cash-generating unit as well as an appropriate growth factor and discount rate to calculate the present value of the cash flows.
Braveheart Investment Group | Annual Report and Accounts 2012
27NOTES TO THE FINANCIAL STATEMENTS for the year ended 31 March 2012 continued | Accounts and Notes |
(f) Revenue recognition and segmental reportingThe Group earns fee income from the services it provides to its clients. Revenue is recognised at the fair value of the consideration received or receivable, excluding rebates. Fees earned for the provision of an ongoing service are recognised as that service is provided. Deal fees and facilitation fees are earned on individual transactions and related revenue is recognised on completion of the underlying transaction.
Dividend income is recognised when the Group’s right to receive payment is established.
Interest income is recognised using the effective interest method. Interest income is interest earned on bank deposit accounts and loan notes and is included within the statement of comprehensive income.
The business is regarded as one segment due to the nature of services provided and the methods used to provide these services. All operations are conducted in the United Kingdom and Channel Islands.
(g) taxation The tax expense represents the sum of the tax currently payable, and deferred tax. Current tax is based on taxable profit for the year. Taxable profit differs from net profit as reported in the statement of comprehensive income because it excludes items of income or expenses that are deductible in other years and it further excludes items that are never taxable or deductible. The Group’s liability for current tax is calculated using tax rates that have been enacted or substantively enacted by the reporting date.
Deferred tax is the tax expected to be payable or recoverable on differences between the carrying amounts of assets and liabilities in the financial statements and the corresponding tax bases used in the computation of taxable profits (temporary differences) and is accounted for using the liability method.
A deferred tax asset or liability shall be recognised for all taxable temporary differences, except to the extent that the deferred tax asset or liability arises from (a) the initial recognition of goodwill, (b) the initial recognition of an asset or liability in a transaction which (i) is not a business combination and (ii) at the time of the transaction, affects neither accounting profit/ (loss) nor taxable profit/(loss) or (c) relates to an investment in subsidiary, except to the extent that (i) the parent is able to control timing of reversal and (ii) it is probable that temporary differences will not reverse in the foreseeable future. Deferred tax assets are recognised to the extent that it is probable that taxable profits will be available against which deductible temporary differences can be utilised. Deferred tax is calculated at the tax rates that are expected to apply in the period when the liability is settled or the asset is realised using tax rates and laws that have been enacted or substantively enacted by the reporting date.
(h) property, plant and equipment Property, plant and equipment are stated at cost less accumulated depreciation and any recognised impairment. Computer equipment 33.3% reducing balance Fixtures and fittings 20.0% reducing balance
The carrying value of assets and their useful lives are reviewed at each reporting date and if an indication of impairment exists, the assets will be written down to their recoverable amount and the impairment charged to the statement of comprehensive income in the period in which it arises.
(i) Intangible assetsGoodwillGoodwill represents the excess of the cost of an acquisition over the fair value of the net identifiable assets of the acquired subsidiary at the date of acquisition. Goodwill on acquisition of subsidiaries is included in intangible assets. Goodwill is tested annually for impairment and carried at cost less accumulated impairment losses.
Other intangible assetsIntangible assets that are acquired as a result of a business combination are separately recognised on acquisition at their fair value. Brands are valued using the ‘relief from royalty’ method and databases are valued using the ‘cost to recreate’ method. Amortisation is charged on a 10% straight-line basis to the statement of comprehensive income over their expected useful economic lives, and is included within other operating costs.
(j) Impairment of intangible assets Goodwill is subject to an impairment test on an annual basis or earlier where any event or change in circumstance is identified that indicates that the carrying value may not be recoverable. Testing for impairment requires a comparison of the carrying value amount of goodwill against the recoverable amount, which is the value-in-use of the cash-generating unit to which the goodwill is allocated. Value-in-use requires estimation of future cash flows expected from the cash-generating unit as well as an appropriate growth factor and discount rate to calculate the present value of the cash flows.
Assets that are subject to amortisation are tested for impairment whenever events or changes in circumstances indicate that the carrying amount may not be recoverable. The recoverable amount is the higher of an asset’s fair value less costs to sell and its value in use.
Impairment losses are recognised immediately in the statement of comprehensive income.
28
Braveheart Investment Group | Annual Report and Accounts 2012
| Accounts and Notes | NOTES TO THE FINANCIAL STATEMENTS for the year ended 31 March 2012 continued
2 Accounting policies (continued)(k) financial assets Financial assets are recognised when the Group becomes party to the contracts that give rise to them and are classified at initial recognition as either financial assets at fair value through profit or loss or loans and receivables. Financial assets are derecognised when the rights to receive cash flows from the asset have expired or the Group has transferred substantially all the risks and rewards of the asset.
Investments at fair value through profit or loss Investments, which include equity and debt investments, are designated on initial recognition as financial assets at fair value through profit or loss. This measurement basis is consistent with the fact that the Group’s performance in respect of its portfolio investments is evaluated on a fair value basis in accordance with an established investment strategy. When investments are recognised initially, they are measured at fair value.
After initial recognition the fair value of listed investments is determined by reference to bid prices at the close of business on the reporting date.
Unlisted equity investments are measured at fair value by the directors in compliance with the principles of the International Private Equity and Venture Capital Guidelines, updated and effective August 2010, as recommended by the European Venture Capital Association (EVCA). The fair value of unlisted equity investments is determined using one of the valuation methodologies set out in the guidelines. These include using recent arm’s length market transactions; reference to the current market value of another instrument, which is substantially the same; earnings or profit multiples; indicative offers; discounted cash flow analysis and pricing models.
Wherever possible the Group uses valuation techniques which make maximum use of observable market based inputs and accordingly the basis of the valuation methodology used most commonly by the Group is ‘price of most recent investment’.
In calculating fair value, the directors have also taken account of rights which when exercised either enhance or diminish the value of the investment. These rights are reviewed on a regular basis to assess whether they are likely to be exercised. The extent of any impact on the value of the investments has been calculated on the basis that all quantifiable rights are, or are likely to be exercisable, or that occur automatically on certain events taking place, such as exit and liquidation preferences on realisation.
Debt investments are generally unquoted debt instruments which are convertible to equity at a future point in time. Such instruments are considered to be hybrid instruments containing a fixed rate debt host contract with an embedded equity derivative. The Group designates the entire hybrid contract at fair value through profit or loss on initial recognition and accordingly, the embedded derivative is not separated from the host contract and accounted for separately. Given their short term nature, the fair value of debt investments is deemed to be cost less any impairment provision.
The gains and losses arising from changes in fair value are recognised in the statement of comprehensive income in the period in which they arise.
Loans and receivablesLoans and receivables are non derivative financial assets with fixed or determinable payments that are not quoted in an active market, and comprise trade and other receivables, other financial assets and cash and cash equivalents, all of which are initially recognised at fair value and are subsequently measured at amortised cost using the effective interest rate method.
Trade receivablesTrade receivables are initially recognised at fair value which is normally the invoice value in short term receivables. Thereafter the receivables are carried at amortised cost. Provision is made where there is objective evidence that a balance will not be recovered in full in accordance with the instruments original terms. An impairment calculation is based on a comparison between the carrying amount and the net present value of expected future cash flows, discounted by the original effective rate.
Cash and cash equivalentsCash and cash equivalents comprise cash in hand and short-term bank deposits.
(l) financial liabilitiesFinancial liabilities, which comprise trade and other payables, are initially recognised at fair value and are carried at amortised cost.
(m) the company’s investment in its subsidiariesIn the Company’s accounts, investment in its subsidiary undertakings is stated at cost less any provision for impairment.
(n) contingent considerationContingent consideration is recognised at fair value. Under IFRS 3 contingent consideration was recognised when it was probable and was capable of being measured reliably, and changes after initial recognition were recognised as movements in goodwill. Under IFRS 3 Revised, contingent consideration is fair valued at initial recognition even if it is not probable, with subsequent changes recognised in the statement of comprehensive income.

Braveheart Investment Group | Annual Report and Accounts 2012
29NOTES TO THE FINANCIAL STATEMENTS for the year ended 31 March 2012 continued | Accounts and Notes |
(o) leases Lease payments under operating leases, where a significant proportion of the risks and benefits remain with the lessor, are recognised on a straight line basis over the term of the lease.
Hire purchase contracts, which transfer to the Group substantially all the risks and benefits incidental to ownership of the leased assets, are capitalised at the commencement of the lease at the fair value of the leased assets or, if lower, at the present value of the minimum lease payments. Lease payments are apportioned between finance charges and reduction of the lease liability so as to achieve a constant rate of interest on the remaining balance of the liability. Finance charges are recognised in the statement of comprehensive income. (p) share capitalFinancial instruments issued by the Group are treated as equity if the holders have only a residual interest in the Group’s assets after deducting all liabilities. The Group considers its capital to comprise its share capital, merger reserve and retained earnings.
The Group’s capital management objectives are:
• toensuretheGroup’sabilitytocontinueasagoingconcern;• toensureasufficientcashbalanceismaintained;and• tomaximisereturnstoshareholders.
The Group continuously monitors rolling cash flow forecasts to ensure sufficient cash is available for anticipated cash requirements. The Group may issue new shares or realise investments to meet such requirements. To date the Group has negligible borrowings and does not pay a dividend. Investments made by the Group are subject to detailed selection criteria and are monitored carefully by the Board.
Braveheart Ventures Ltd, a Group investment management subsidiary, and Envestors Ltd, a Group corporate finance subsidiary and Neon Capital Partners Ltd, a Group fund management subsidiary, are subject to external capital requirements imposed by the Financial Services Authority and as such must ensure that they have sufficient capital to satisfy these requirements. The Group ensures it remains compliant with these requirements as described in the financial statements of each company.
There has been no change in capital management objectives, policies and procedures from the previous year.
(q) share-based paymentsThe cost of equity-settled transactions with employees is measured by reference to the fair value of the instruments issued at the date at which they are granted and is recognised as an expense over the vesting period, which ends on the date on which the relevant employees become fully entitled to the award. Fair value is determined using an appropriate pricing model. In valuing equity-settled transactions, no account is taken of any vesting conditions, other than conditions linked to the price of the shares of the Company (market conditions).
No expense is recognised for awards that do not ultimately vest, except for awards where vesting is conditional upon a market condition, which are treated as vesting irrespective of whether or not the market condition is satisfied, provided that all other performance conditions are satisfied.
At each reporting date before vesting, the cumulative expense is calculated, representing the extent to which the vesting period has expired and management’s best estimate of the achievement or otherwise of non-market conditions and of the number of equity instruments that will ultimately vest or, in the case of an instrument subject to a market condition, be treated as vesting as described above. The movement in cumulative expense since the previous reporting date is recognised in the statement of comprehensive income, with a corresponding entry in equity.
Where the terms of an equity-settled award are modified or a new award is designated as replacing a cancelled or settled award, the cost based on the original award terms continues to be recognised over the original vesting period. In addition, any expense is recognised over the remainder of the new vesting period for the incremental fair value of any modification, based on the difference between the fair value of the original award and the fair value of the modified award, both as measured on the date of the modification. No reduction is recognised if this difference is negative.
Where an equity-settled award is cancelled, it is treated as if it had vested on the date of cancellation, and any cost not yet recognised in the statement of comprehensive income for the award is expensed immediately. Any compensation paid up to the fair value of the award at the cancellation or settlement date is deducted from equity, with any excess over fair value being treated as an expense in the statement of comprehensive income.
(r) pensionsThe Group makes defined pension contributions under flexible remuneration arrangements to certain employees of Viking Fund Managers Ltd and Neon Capital Partners Ltd, its subsidiary undertakings.
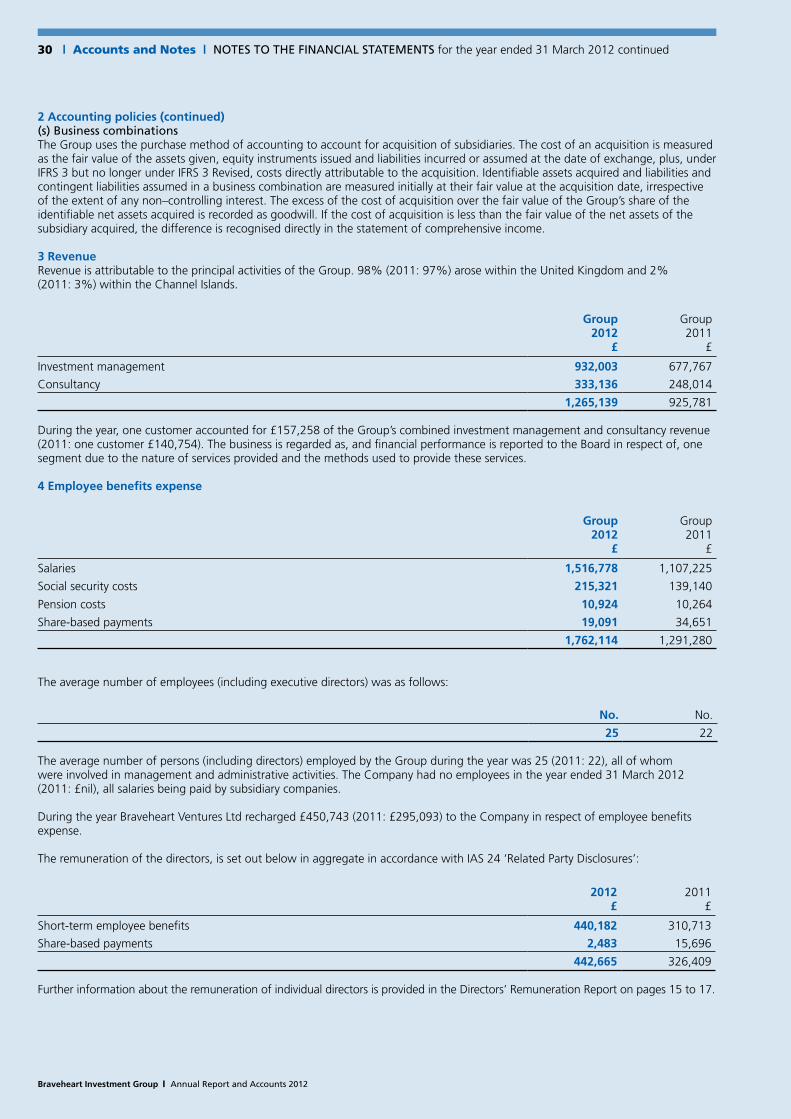
30
Braveheart Investment Group | Annual Report and Accounts 2012
| Accounts and Notes | NOTES TO THE FINANCIAL STATEMENTS for the year ended 31 March 2012 continued
2 Accounting policies (continued)(s) business combinationsThe Group uses the purchase method of accounting to account for acquisition of subsidiaries. The cost of an acquisition is measured as the fair value of the assets given, equity instruments issued and liabilities incurred or assumed at the date of exchange, plus, under IFRS 3 but no longer under IFRS 3 Revised, costs directly attributable to the acquisition. Identifiable assets acquired and liabilities and contingent liabilities assumed in a business combination are measured initially at their fair value at the acquisition date, irrespective of the extent of any non–controlling interest. The excess of the cost of acquisition over the fair value of the Group’s share of the identifiable net assets acquired is recorded as goodwill. If the cost of acquisition is less than the fair value of the net assets of the subsidiary acquired, the difference is recognised directly in the statement of comprehensive income.
3 Revenue Revenue is attributable to the principal activities of the Group. 98% (2011: 97%) arose within the United Kingdom and 2% (2011: 3%) within the Channel Islands.
Group2012
£
Group2011
£
Investment management 932,003 677,767
Consultancy 333,136 248,014
1,265,139 925,781
During the year, one customer accounted for £157,258 of the Group’s combined investment management and consultancy revenue (2011: one customer £140,754). The business is regarded as, and financial performance is reported to the Board in respect of, one segment due to the nature of services provided and the methods used to provide these services.
4 Employee benefits expense
Group 2012
£
Group 2011
£
Salaries 1,516,778 1,107,225
Social security costs 215,321 139,140
Pension costs 10,924 10,264
Share-based payments 19,091 34,651
1,762,114 1,291,280
The average number of employees (including executive directors) was as follows:
No. No.
25 22
The average number of persons (including directors) employed by the Group during the year was 25 (2011: 22), all of whom were involved in management and administrative activities. The Company had no employees in the year ended 31 March 2012 (2011: £nil), all salaries being paid by subsidiary companies.
During the year Braveheart Ventures Ltd recharged £450,743 (2011: £295,093) to the Company in respect of employee benefits expense.
The remuneration of the directors, is set out below in aggregate in accordance with IAS 24 ‘Related Party Disclosures’:
2012£
2011£
Short-term employee benefits 440,182 310,713
Share-based payments 2,483 15,696
442,665 326,409
Further information about the remuneration of individual directors is provided in the Directors’ Remuneration Report on pages 15 to 17.

Braveheart Investment Group | Annual Report and Accounts 2012
31NOTES TO THE FINANCIAL STATEMENTS for the year ended 31 March 2012 continued | Accounts and Notes |
The remuneration of the management board detailed on page 11, who are considered to be key management personnel of the Group, is set out below in aggregate in accordance with IAS 24 ‘Related Party Disclosures’:
2012£
2011£
Short-term employee benefits 921,424 638,544
Share-based payments 10,675 21,324
932,099 659,868
5 Finance revenue
Group2012
£
Group2011
£
Bank interest receivable 1,327 9,856
Interest on loan notes 17,484 21,773
18,811 31,629
6 Finance costs
Group2012
£
Group2011
£
Finance charges payable under hire purchase contract 237 956
Bank charges 28,454 3,413
28,691 4,369
7 Loss before tax
Group2012
£
Group2011
£
Loss for the year has been arrived at after charging:
Depreciation of property, plant and equipment 7,880 9,631
Amortisation of intangibles 12,836 6,418
Lease payments recognised as an operating lease (office rent) 96,360 79,486
Loss on the disposal of property, plant, and equipment – 5,561
Auditors remuneration:
– audit of parent company 23,000 23,000
– audit of subsidiary companies 21,000 21,000
– audit related regulatory reporting 3,500 3,350
– taxation compliance 11,500 11,300

32
Braveheart Investment Group | Annual Report and Accounts 2012
| Accounts and Notes | NOTES TO THE FINANCIAL STATEMENTS for the year ended 31 March 2012 continued
8 Tax on loss on ordinary activities No liability to UK corporation tax arose on ordinary activities for the year ended 31 March 2012 or for the year ended 31 March 2011.
Group2012
£
Group2011
£
Reconciliation of total tax:
Loss before tax (1,712,996) (1,306,132)
Tax at the rate of 20% (2011: 21%) (342,599) (274,288)
Disallowed expenses 25,593 46,841
Unrealised loss on the fair value movement of investments 128,848 73,441
Increase in unutilised tax losses 186,583 150,636
Other adjustments 1,575 3,370
Total tax reported in the statement of comprehensive income – –
The Group has potential deferred tax assets in respect of:
• excessmanagementexpensesof£2,209,907(2011:£1,475,547)arisingfromBraveheartInvestmentGroupplc;• excessmanagementexpensesof£929,877(2011:£928,777)arisingfromCaledoniaPortfolioRealisationsLtd;• unutilisedtradinglossesof£1,795,925(2011:£1,343,471)inBraveheartVenturesLtd;• unutilisedtradinglossesof£266,894(£145,887)inVikingFundManagersLtd;and• unutilisedtradinglossesof£205,890(£132,543)inEnvestorsLtd.
No deferred tax assets have been recognised in respect of these amounts as it is uncertain that there will be suitable taxable profits from which the future reversal of the deferred tax could be deducted.
9 Loss of the Parent Company
2012£
2011£
Loss of the Parent Company only (1,371,151) (2,283,064)
10 Loss per share
Basic loss per share has been calculated by dividing the loss attributable to equity holders of the parent by the weighted average number of ordinary shares in issue during the year.
The calculations of loss per share are based on the following loss and numbers of shares in issue:
2012
£2011
£
Loss for the year attributable to equity holders of the parent (1,724,083) (1,305,815)
Weighted average number of ordinary shares in issue: No. No.
For basic loss per ordinary share 18,225,817 14,412,495
Potentially dilutive ordinary shares – –
For diluted loss per ordinary share 18,225,817 14,412,495
There were no potentially dilutive ordinary shares which would decrease the loss per share at the year end.
Following the year end, on 5 April the Company issued 2,239,998 new shares and on 11 May the Company issued 1,093,333 new shares (see note 28).

Braveheart Investment Group | Annual Report and Accounts 2012
33NOTES TO THE FINANCIAL STATEMENTS for the year ended 31 March 2012 continued | Accounts and Notes |
11 Property, plant and equipment
Group
Fixtures& fittings
£
Computerequipment
£Total
£
Cost
At 1 April 2010 32,747 49,241 81,988
Additions 4,242 3,569 7,811
Acquired 4,660 – 4,660
Disposals (6,887) (3,310) (10,197)
At 31 March 2011 34,762 49,500 84,262
Acquired – 753 753
Disposals – (764) (764)
At 31 March 2012 34,762 49,489 84,251
Accumulated depreciation
At 1 April 2010 20,683 29,938 50,621
Charge for year 3,007 6,624 9,631
Disposals (1,777) (2,859) (4,636)
At 31 March 2011 21,913 33,703 55,616
Charge for year 2,636 5,244 7,880
Disposals – (403) (403)
At 31 March 2012 24,549 38,544 63,093
Net Book Value
At 31 March 2012 10,213 10,945 21,158
At 31 March 2011 12,849 15,797 28,646
Included within the net book value of computer equipment is £5,672 (2011: £8,509) relating to an asset which was held under a hire purchase agreement. The depreciation of computer equipment charged to the financial statements in the year in respect of this asset amounted to £2,836 (2011: £4,254).

34
Braveheart Investment Group | Annual Report and Accounts 2012
| Accounts and Notes | NOTES TO THE FINANCIAL STATEMENTS for the year ended 31 March 2012 continued
12 Investments at fair value through profit or loss
Level 1 Level 2 Level 3
Group
Equity investments
in quoted companies
£
Equity investments in unquoted
companies£
Debt investments in unquoted
companies£
Equity investments in unquoted
companies£
Debt investments in unquoted
companies£
Total£
At 1 April 2010 35,021 – – 4,201,301 294,425 4,530,747
Additions at Cost – – – 77,389 35,267 112,656
Disposals – – – (200,753) – (200,753)
Conversions – – – 239,117 (239,117) –
Change in Fair Value 17,609 – – (521,063) 39,425 (464,029)
At 31 March 2011 52,630 – – 3,795,991 130,000 3,978,621
Additions at Cost – – – 65,554 35,000 100,554
Disposals (52,630) – – – (8,747) (61,377)
Conversions – – – 105,000 (105,000) –
Change in Fair Value – – – (742,143) – (742,143)
At 31 March 2012 – – – 3,224,402 51,253 3,275,655
Level 1 Level 2 Level 3
Company
Equity investments
in quoted companies
£
Equity investments in unquoted
companies£
Debt investments in unquoted
companies£
Equity investments in unquoted
companies£
Debt investments in unquoted
companies£
Total£
At 1 April 2010 35,021 – – 2,795,208 294,425 3,124,654
Additions at Cost – – – 14,887 35,267 50,154
Disposals – – – (180,753) – (180,753)
Conversions – – – 239,117 (239,117) –
Change in Fair Value 17,609 – – (541,946) 39,425 (484,912)
At 31 March 2011 52,630 – – 2,326,513 130,000 2,509,143
Additions at Cost – – – 40,554 35,000 75,554
Disposals (52,630) – – – (8,747) (61,377)
Conversions – – – 105,000 (105,000) –
Change in Fair Value – – – (400,318) – (400,318)
At 31 March 2012 – – – 2,071,749 51,253 2,123,002
Investments, which include equity and debt investments, are designated on initial recognition as financial assets at fair value through profit or loss. This measurement basis is consistent with the fact that the Group’s performance in respect of its portfolio investments is evaluated on a fair value basis in accordance with an established investment strategy. When investments are recognised initially, they are measured at fair value.
After initial recognition the fair value of listed investments is determined by reference to bid prices at the close of business on the reporting date.
Unlisted equity investments are measured at fair value by the directors in compliance with the principles of the International Private Equity and Venture Capital Guidelines, updated and effective August 2010, as recommended by the European Venture Capital Association (EVCA). The fair value of unlisted equity investments is determined using one of the valuation methodologies set out in the guidelines. These include using recent arm’s length market transactions; reference to the current market value of another instrument, which is substantially the same; earnings or profit multiples; indicative offers; discounted cash flow analysis and pricing models.

Braveheart Investment Group | Annual Report and Accounts 2012
35NOTES TO THE FINANCIAL STATEMENTS for the year ended 31 March 2012 continued | Accounts and Notes |
The Group classifies its investments using a fair value hierarchy. Classification within the hierarchy has been determined on the basis of the lowest level input that is significant to the fair value measurement of the relevant investment as follows:
• Level1–valuedusingquotedpricesinactivemarketsforidenticalassets;• Level2–valuedbyreferencetovaluationtechniquesusingobservableinputsotherthanquotedpricesincludedwithinLevel1;
and• Level3–valuedbyreferencetovaluationtechniquesusinginputsthatarenotbasedonobservablemarketdata.
All unquoted investments have been classified within Level 3, their respective valuations having been calculated using a number of valuation techniques and assumptions, notwithstanding that the basis of the valuation methodology used most commonly by the Group is ‘price of most recent investment’. The use of reasonably possible alternative assumptions has no material effect on the fair valuation of the related investments. £97,903 of the Group Level 3 reduction in fair value (2011: £181,276) and £97,903 of the Company Level 3 reduction in fair value (2011: £91,206) relate to investments no longer held at the year end.
Details of investments where the nominal value of the holding in the undertaking is 20% or more of any class of share are as follows:
Name of Company Holding % of class of shares held Nature of Business
Verbalis Ltd (Verbalis) ‘A’ Ordinary shares 100% Design and production of automated language translation systems
The above shareholding, which is held by Caledonia Portfolio Realisations Ltd (CPR), represents a 20% aggregate shareholding in Verbalis. Neither CPR nor the Company is represented on the Board or within management of Verbalis and in the opinion of the directors, this shareholding does not entitle the Company to exert a significant or dominant influence over Verbalis. The carrying value of Verbalis is nil.
13 Investment in subsidiariesThe Company has the following interests in subsidiary undertakings:
NameCountry of Incorporation Nature of Business % Interest
Braveheart Ventures Ltd (BVL) Scotland Investment management 100%
Caledonia Portfolio Realisations Ltd (CPR) Scotland Investment management 100%
Caledonia LP Ltd Scotland Investment management 100%
Strathclyde Innovation Fund GP Ltd Scotland Investment management 100%
Caledonia Specialist Finance Ltd Scotland Dormant 100%
Envestors Ltd (ENV) England Investment management & business advisory services 100%
Viking Fund Managers Ltd (VFM) England Investment management & business advisory services 100%
Inkopo Consulting Ltd England Dormant 100%
Neon Capital Partners Ltd (Neon) England Investment management 100%
WhiteRock Capital Partners Ltd Scotland Investment management 33%
Company £
Cost
At 1 April 2010 2,296,205
Increase in investment value arising from share-based payments 265,771
Additions: BVL 200,000
Impairment in investment value: BVL (1,442,848)
Additions: ENV 894,403
Decrease in investment value: CPR (20,314)
Increase in investment value VFM 44,880
At 31 March 2011 2,238,097
Increase in investment value arising from share-based payments 19,091
Additions: BVL (note 14,25) 350,000
Impairment in investment value: BVL (note 15) (473,282)
Additions: ENV (note 14,25) 50,000
Additions: Neon (note 14) 674,244
Decrease in investment value: CPR (184,182)
At 31 March 2012 2,673,968

36
Braveheart Investment Group | Annual Report and Accounts 2012
| Accounts and Notes | NOTES TO THE FINANCIAL STATEMENTS for the year ended 31 March 2012 continued
13 Investment in subsidiaries (continued)During the year the directors determined to write down the carrying value of the Company’s investment in BVL by £473,282 (2011: £1,442,848) to BVL’s net asset value. This impairment provision is charged within the Company’s operating costs.
Group entities act as General Partner to, and have an interest in, the following limited partnership:
Name Place of Business % Interest
Strathclyde Innovation Fund LP (SIF) Scotland 89.29%
Caledonia Specialist Finance LP Scotland 100.00%
SIF has been included in the consolidated financial statements since 1 April 2008.
In addition, VFM holds the undernoted interest in the following business:
Name Country of Incorporation Nature of Business % Interest
Ridings Holdings Ltd (RHL) England Fund management 33.33%
This holding is classified as an investment held by a venture capital organisation, and is measured at a fair value of £nil (2011: £nil) in accordance with IAS 39 Financial Instruments: Recognition and Measurement. For the 12 months ended 31 March 2012 RHL generated a profit after tax of £164,544 (2011: profit after tax of £198,448) and at 31 March 2012 had share capital and reserves of £364,656 (2011: £200,112).
14 Business combinationOn 22 March 2012 the Company acquired 100% of the issued share capital of Neon Capital Partners Ltd from NF Holdings Ltd for a total consideration of £674,244, such consideration satisfied entirely in cash. Neon owns 100% of the issued share capital of Finance Yorkshire Equity GP Ltd (FYGP). Both companies are based in the UK.
The cost of the acquisition excludes legal and other fees of £53,000 which have been charged to the statement of comprehensive income in accordance with IFRS 3 Revised under other operating costs. The acquisition forms part of the Group’s strategy to grow its fee business and to increase its geographical reach.
The allocation of the acquisition cost to the identifiable assets and liabilities of Neon and FYGP consolidated at the acquisition date is as follows:
Neon & FYGP Consolidated
Carrying Value
£
Fair Value
£
Property, plant and equipment 753 753
Cash and cash equivalents 308,595 308,595
Trade and other payables (914) (914)
Net assets 308,434 308,434
Cash paid 380,000 380,000
Deferred consideration 294,244 294,244
Fair value of cost of acquisition 674,244 674,244
Goodwill 365,810 365,810
The goodwill that arose on the acquisition can be attributed to revenue synergies expected to be derived from the combination and the value of personnel of Neon, which cannot be recognised as an intangible asset under IAS38. From the date of acquisition, Neon has contributed £24,798 revenue and £14,190 profit to the Group. Neon had not traded and until immediately prior to the acquisition the management services for the Fund were performed by another company in the NF Holdings group.

Braveheart Investment Group | Annual Report and Accounts 2012
37NOTES TO THE FINANCIAL STATEMENTS for the year ended 31 March 2012 continued | Accounts and Notes |
15 Goodwill
VFM£
Envestors£
Neon£
Total£
At 1 April 2010 327,064 – – 327,064
Acquired on acquisition – 615,161 – 615,161
Increase in period 44,880 – – 44,880
At 31 March 2011 371,944 615,161 – 987,105
Acquired on acquisition (note 14) – – 365,810 365,810
At 31 March 2012 371,944 615,161 365,810 1,352,915
The acquisition of Viking Fund Managers (VFM) has been accounted for under IFRS 3. At initial recognition, contingent consideration settled, or to be settled, in shares was fair valued by reference to the Company’s share price at the acquisition date. The movement in goodwill in the period since acquisition is primarily due to movements in the fair value of contingent consideration resulting from movements in the Company’s share price.
The acquisition of Envestors has been accounted for under IFRS 3 Revised. At initial recognition, consideration settled, or to be settled, in shares was fair valued by reference to the Company’s share price at the acquisition date. Under IFRS 3 Revised, future changes to the fair value of contingent consideration are applied to the statement of comprehensive income, and accordingly goodwill will remain constant unless impaired.
The acquisition of Neon has been accounted for under IFRS 3 Revised. £380,000 was paid to NF Holdings Ltd on 22 March 2012 and a further £244,244 paid over on 7 June 2012. On the first anniversary of the acquisition, subject to certain specific liabilities not having arisen by such date, a further £50,000 is due to be paid.
At the end of the year, the Group assessed the recoverable amount of the above goodwill associated with each of the VFM and Envestors cash-generating units (both being part of the Group’s only operating segment), and determined that goodwill was not impaired. The recoverable amount was assessed by reference to the cash-generating unit’s value in use based on internally prepared and approved 3 year cash flow projections and inflationary growth based projections for a further 7 years (a reasonable measurement period in the Group’s line of business) assuming continued client retention, ongoing fundraising, the following inflationary growth rates and applying the following discount factors:
VFM Envestors Neon
Cash-generating unit 2012 2011 2012 2011 2012 2011
Inflationary growth rate (average p.a.) 3 - 5% 3 - 5% 3 - 5% 3 - 5% N/A N/A
Discount factor (p.a.) 9% 9% 9% 9% 9% N/A
These factors are based on past experience and future expectations which the directors consider to be appropriate. Value in use estimates arising from reasonably possible changes to these factors do not indicate impairment.
16 Intangible assets
GroupBrand
£Database
£Total
£
Cost
At 1 April 2011 and 31 March 2012 66,869 61,500 128,369
Accumulated amortisation
At 1 April 2011 3,343 3,075 6,418
Amortisation 6,686 6,150 12,836
At 31 March 2012 10,029 9,225 19,254
Net Book Value
At 31 March 2012 56,840 52,275 109,115
At 31 March 2011 63,526 58,425 121,951
Intangible assets acquired on acquisition first arose on the acquisition by Envestors of the business of Envestors LLP, and comprise Envestors’ brand and database of high-net-worth investor contacts. The brand has been valued using the ‘relief from royalty’ method and the database using the ‘cost to recreate’ method.
All intangible assets are amortised at 10% straight line over 10 years.

38
Braveheart Investment Group | Annual Report and Accounts 2012
| Accounts and Notes | NOTES TO THE FINANCIAL STATEMENTS for the year ended 31 March 2012 continued
17 Trade and other receivables
Group 2012
£
Group 2011
£
Company 2012
£
Company 2011
£
Trade receivables 182,065 124,895 – –
Prepayments and accrued income 63,275 57,211 59,935 18,571
Amounts due from related parties – – 607,874 477,373
Other receivables 54,112 54,112 54,112 63,577
299,452 236,218 721,921 559,521
As trade receivables are generally of short-term maturity, the directors consider the carrying amounts to approximate their fair value. All receivables are non-interest bearing and unsecured.
18 Cash and cash equivalents
Group 2012
£
Group 2011
£
Company 2012
£
Company 2011
£
Cash at bank and on hand 87,974 643,203 12,688 573,965
At 31 March 2012, £336,000 was held with HSBC Bank plc for the subscription of new shares which took place on 5 April 2012. Cash balances are held with HSBC Bank plc and Bank of Scotland plc and earn interest at floating rates based on daily bank deposit rates.
19 Trade and other payables
Group Group Company Company
2012 2011 2012 2011
£ £ £ £
Trade payables 263,946 74,714 192,895 25,994
Other payables 294,244 – 294,244 –
Amounts due to related parties – – 415,223 269,675
Other taxes and social security 50,411 65,424 – –
Accruals 123,692 104,584 74,850 38,950
732,293 244,722 977,212 334,619
Due to the short-term maturity of trade payables, the directors consider the carrying amounts to approximate their fair value. Trade payables are non-interest bearing and are normally settled on 30-day terms.
20 Contingent considerationShort-term contingent consideration of £360,599 comprises (i) £76,062 being the fair value of the short-term contingent consideration due to Envestors and will be satisfied by the issue of 647,334 ordinary shares of 2 pence each in the Company, and (ii) £284,537 being the sum due on future exit values of the Caledonia Portfolio Realisation portfolio.
At the year ended 31 March 2011 the short-term contingent consideration of £592,420 comprised (i) £123,701 being the fair value of the consideration due in respect of the acquisition of Viking Fund Managers (VFM), and (ii) £468,719 being the sum due on future exit values of the Caledonia Portfolio Realisation portfolio.
Long-term contingent consideration of £140,616 (2011: £574,378 ) represents the fair value of long-term contingent consideration due in respect of the acquisition of Envestors, equivalent to 1,196,731 shares (2011: 1,852,832 shares).
No further consideration remains payable in respect of the acquisition of VFM (2011: £123,701).

Braveheart Investment Group | Annual Report and Accounts 2012
39NOTES TO THE FINANCIAL STATEMENTS for the year ended 31 March 2012 continued | Accounts and Notes |
21 Share capital
2012£
2011£
Authorised
33,645,000 ordinary shares of 2 pence each
(2011: 33,645,000 ordinary shares of 2 pence each) 672,900 672,900
Allotted, called up and fully paid
19,281,047 ordinary shares of 2 pence each
(2011: 14,749,439 ordinary shares of 2 pence each) 385,620 294,988
On 24 June 2011, the Company issued 4,132,574 new ordinary shares at a placing price of 23 pence. On 27 July 2011 the Company issued 399,034 ordinary shares of 2 pence each in satisfaction of the third and final tranche of consideration due on its acquisition of Viking Fund Managers. The Company has one class of ordinary shares. All shares carry equal voting rights, equal rights to income and distribution of assets on liquidation or otherwise, and no right to fixed income.
As at 31 March, £336,000 was held in respect of a new share subscription which took place on 5 April comprising 2,239,998 new ordinary shares.
22 Share-based payments The Group operates the Braveheart Investment Group plc Executive Share Option Scheme 2006 (the Scheme), which comprises Part A, a share option scheme approved by HMRC (the Approved Scheme) and Part B, an unapproved share option scheme (the Unapproved Scheme).
Historically, the Scheme was open to all directors and employees of the Group, although non-executive directors could only participate in Part B. The Scheme is now only open to all executive directors and employees.
Options are granted by the Board taking into account the need to motivate, retain and recruit high calibre employees and with regard to the contribution that such employees are expected to make in achieving the Group’s objectives.
Options granted under the Scheme are categorised as either Employment Options, Performance Options or Other Options. Employment Options may be granted under either Part A or Part B. All Performance Options and Other Options are granted under Part B.
Employment Options vest and become exercisable on the third anniversary of date of grant, and generally lapse on the earlier of cessation of employment (or 6 months thereafter if options have vested at cessation date) or the 10th anniversary of date of grant.
Performance Options have vesting conditions linked to the growth in the Company’s market capitalisation from the date of grant (Performance Conditions). If a Performance Condition is not met, the related Performance Option lapses at the end of the relevant measurement period.
Otherwise Performance Options vest on attainment of the Performance Condition and become exercisable on the 1st anniversary of the date of the Performance Condition being met, and lapse on the 10th anniversary of date of grant.
Other Options, are immediately exercisable and lapse on the 10th anniversary of date of grant.
During the current year, no Employment Options, Performance Options or Other Options were granted. 240,453 Employment Options lapsed, 46,154 Performance Options lapsed and 74,074 Other Options lapsed during the year either due to the cessation of employment or related Performance Condition not having been met.
During the year ended 31 March 2011, on 5 July 2010, 322,257 Employment Options, 338,458 Performance Options and 353,538 Other Options were granted. On 5 October 2010, 96,154 Employment Options and 95,237 Performance Options were granted. No Employment Options vested or were exercised, and 66,049 lapsed. 512,975 Performance Options lapsed during the year, the majority due to the related Performance Condition not having been met. All 426,003 Performance Options remaining outstanding at 31 March 2011 have vested, though are not yet exercisable. Also, 8,889 Other Options lapsed during the year.
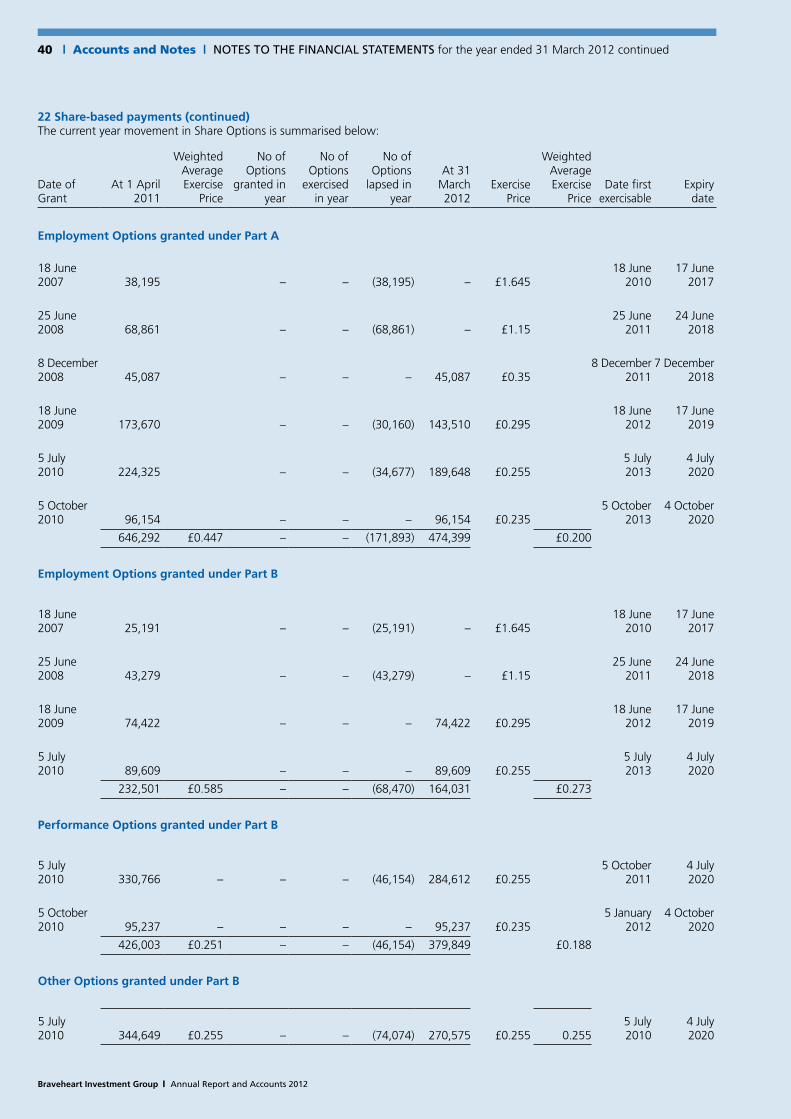
40
Braveheart Investment Group | Annual Report and Accounts 2012
| Accounts and Notes | NOTES TO THE FINANCIAL STATEMENTS for the year ended 31 March 2012 continued
22 Share-based payments (continued)The current year movement in Share Options is summarised below:
Date of Grant
At 1 April 2011
Weighted Average Exercise
Price
No of Options
granted in year
No of Options
exercised in year
No of Options
lapsed in year
At 31 March 2012
Exercise Price
Weighted Average Exercise
PriceDate first
exercisableExpiry
date
Employment Options granted under Part A
18 June 2007 38,195 – – (38,195) – £1.645
18 June 2010
17 June 2017
25 June 2008 68,861 – – (68,861) – £1.15
25 June 2011
24 June 2018
8 December 2008 45,087 – – – 45,087 £0.35
8 December 2011
7 December 2018
18 June 2009 173,670 – – (30,160) 143,510 £0.295
18 June 2012
17 June 2019
5 July 2010 224,325 – – (34,677) 189,648 £0.255
5 July 2013
4 July 2020
5 October 2010 96,154 – – – 96,154 £0.235
5 October 2013
4 October 2020
646,292 £0.447 – – (171,893) 474,399 £0.200
Employment Options granted under Part B
18 June 2007 25,191 – – (25,191) – £1.645
18 June 2010
17 June 2017
25 June 2008 43,279 – – (43,279) – £1.15
25 June 2011
24 June 2018
18 June 2009 74,422 – – – 74,422 £0.295
18 June 2012
17 June 2019
5 July 2010 89,609 – – – 89,609 £0.255
5 July 2013
4 July 2020
232,501 £0.585 – – (68,470) 164,031 £0.273
Performance Options granted under Part B
5 July 2010 330,766 – – – (46,154) 284,612 £0.255
5 October 2011
4 July 2020
5 October 2010 95,237 – – – – 95,237 £0.235
5 January 2012
4 October 2020
426,003 £0.251 – – (46,154) 379,849 £0.188
Other Options granted under Part B
5 July 2010 344,649 £0.255 – – (74,074) 270,575 £0.255 0.255
5 July 2010
4 July 2020
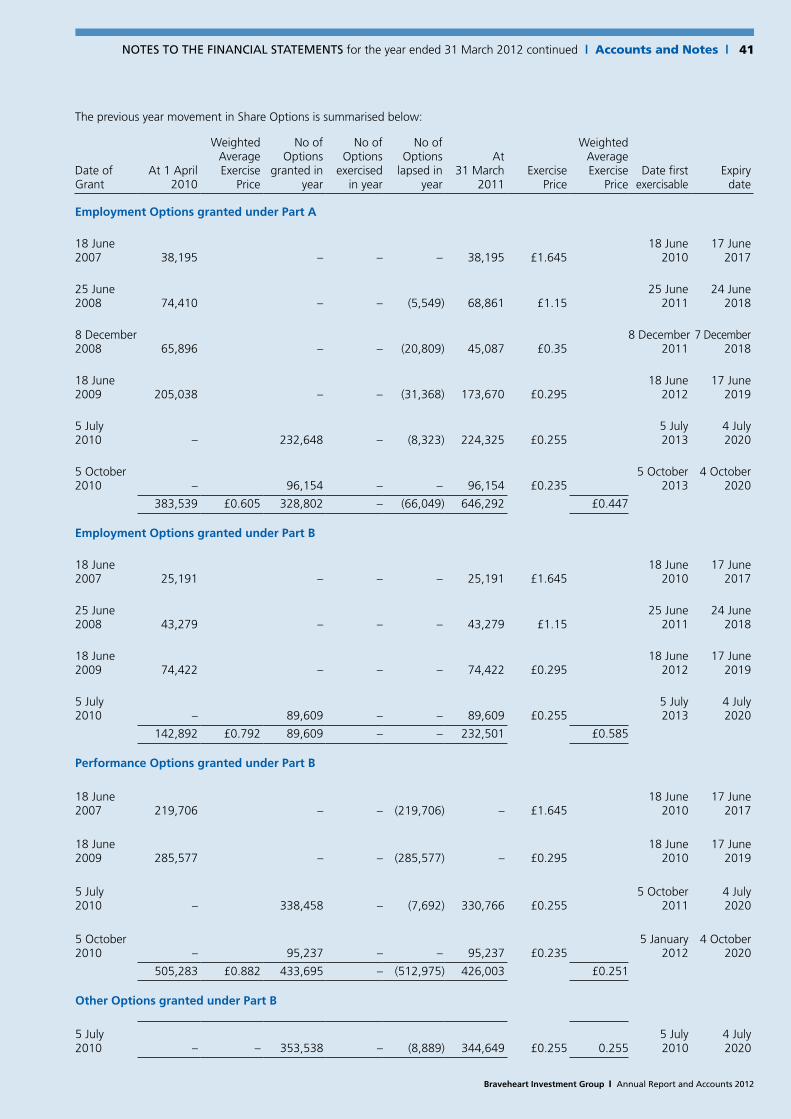
Braveheart Investment Group | Annual Report and Accounts 2012
41NOTES TO THE FINANCIAL STATEMENTS for the year ended 31 March 2012 continued | Accounts and Notes |
The previous year movement in Share Options is summarised below:
Date of Grant
At 1 April 2010
Weighted Average Exercise
Price
No of Options
granted in year
No of Options
exercised in year
No of Options
lapsed in year
At 31 March
2011Exercise
Price
Weighted Average Exercise
PriceDate first
exercisableExpiry
date
Employment Options granted under Part A
18 June 2007 38,195 – – – 38,195 £1.645
18 June 2010
17 June 2017
25 June 2008 74,410 – – (5,549) 68,861 £1.15
25 June 2011
24 June 2018
8 December 2008 65,896 – – (20,809) 45,087 £0.35
8 December 2011
7 December 2018
18 June 2009 205,038 – – (31,368) 173,670 £0.295
18 June 2012
17 June 2019
5 July 2010 – 232,648 – (8,323) 224,325 £0.255
5 July 2013
4 July 2020
5 October 2010 – 96,154 – – 96,154 £0.235
5 October 2013
4 October 2020
383,539 £0.605 328,802 – (66,049) 646,292 £0.447
Employment Options granted under Part B
18 June 2007 25,191 – – – 25,191 £1.645
18 June 2010
17 June 2017
25 June 2008 43,279 – – – 43,279 £1.15
25 June 2011
24 June 2018
18 June 2009 74,422 – – – 74,422 £0.295
18 June 2012
17 June 2019
5 July 2010 – 89,609 – – 89,609 £0.255
5 July 2013
4 July 2020
142,892 £0.792 89,609 – – 232,501 £0.585
Performance Options granted under Part B
18 June 2007 219,706 – – (219,706) – £1.645
18 June 2010
17 June 2017
18 June 2009 285,577 – – (285,577) – £0.295
18 June 2010
17 June 2019
5 July 2010 – 338,458 – (7,692) 330,766 £0.255
5 October 2011
4 July 2020
5 October 2010 – 95,237 – – 95,237 £0.235
5 January 2012
4 October 2020
505,283 £0.882 433,695 – (512,975) 426,003 £0.251
Other Options granted under Part B
5 July 2010 – – 353,538 – (8,889) 344,649 £0.255 0.255
5 July 2010
4 July 2020

42
Braveheart Investment Group | Annual Report and Accounts 2012
| Accounts and Notes | NOTES TO THE FINANCIAL STATEMENTS for the year ended 31 March 2012 continued
22 Share-based payments (continued)896,028 shares were exercisable at 31 March 2012 (2011: 408,038). The weighted average exercise price of the total number of options granted and not exercised at 31 March 2012 was £0.209 (2011: £0.376) and the weighted average contractual life of the options was 2,926 days (2011: 3,227 days).
The charge made in respect of the fair value of options granted was:
2012£
2011£
Expense arising from equity-settled share-based payments transactions 19,091 34,651
The fair value of Performance Options is estimated at the date of grant using a Trinomial option pricing model. The fair value of Employment Options is estimated at the date of grant using a Black-Scholes option pricing model.
The following assumptions have been used in calculating the fair value of share options:
2012 2011
EmploymentOptions
PerformanceOptions
EmploymentOptions
PerformanceOptions
Valuation method Black-Scholes Trinomial Black-Scholes Trinomial
Risk free interest rate 1.5% 1.5% 1.5% 1.5%
Expected life (average years) 3 2 3 2
Expected volatility 42% 42% 42% 42%
Dividend yield 0% 0% 0% 0%
The expected life of the options is the expected average point at which an option becomes exercisable. The expected volatility is based on historical volatility of the share price of the Company and of quoted comparable companies over the most recent period at the date of grant that is commensurate with the average expected life of the option. The weighted average share price used in each calculation was equal to the option exercise price.
23 Operating lease commitments The Group entered into a commercial lease on its office premises in Perth in June 2005 for a 5-year period, and the lease has been extended for a further five years. Viking Fund Managers entered into a one year commercial lease on its office premises in November 2011. Envestors entered into a five year commercial lease on its office premises commencing July 2010. Renewals are at the option of the lessor. There are no restrictions placed upon the lessee by entering into these leases.
Future minimum rentals payable under operating leases are as follows:
2012£
2011£
Future minimum payments due:
Not later than one year 77,980 77,980
In two to five years 145,133 210,933
223,113 288,913

Braveheart Investment Group | Annual Report and Accounts 2012
43NOTES TO THE FINANCIAL STATEMENTS for the year ended 31 March 2012 continued | Accounts and Notes |
24 BorrowingsThe Group entered into a hire purchase contract for the purchase of computer equipment in November 2008 which is now fully paid. The asset is included under computer equipment in note 11. The effective interest rate is 7.6%
Future minimum rentals payable under the hire purchase contract are as follows:
2012£
2011£
Future minimum payments due:
Not later than one year – 6,629
In two to five years – –
– 6,629
At 31 March 2012 Strathclyde Innovation Fund LP had received £43,392 (2011: £41,664) from limited partners unrelated to the Group to cover partnership obligations. Such sums are treated as long terms loans from limited partners.
25 Related party disclosuresTrade and other receivables (note 17) include the following amounts due from subsidiary undertakings:
2012£
2011£
Caledonia Portfolio Realisations Ltd 5,211 21,210
Caledonia LP Ltd 316,293 293,972
Viking Fund Managers Ltd 254,070 161,570
Envestors Ltd 4,621 621
Strathclyde Innovation Fund LP 27,679 –
607,874 477,373
Trade and other payables (note 19) include the following amounts due to subsidiary undertakings:
2012£
2011£
Braveheart Ventures Ltd 415,223 269,675
All above amounts are unsecured, interest free and repayable on demand.
During the year, the Company subscribed for 3,500,000 ordinary shares of 10p each in BVL with an aggregate nominal value of £350,000. During the year ended 31 March 2011 the Company subscribed for 2,000,000 redeemable preference shares of 10p each in BVL at an aggregate cost of £200,000.
During the current year, the Company also subscribed for 50,000 redeemable preference shares (2011: 220,000) of £1 each in Envestors at an aggregate cost of £50,000 (2011: £220,000).
Transactions between the Company and its subsidiaries are eliminated on consolidation.
Group entities have a limited partnership interest in (note 13), and act as General Partner to, Strathclyde Innovation Fund LP and Caledonia Specialist Finance LP.
Certain executive and non–executive directors are clients of BVL. Investment transactions executed on their behalf are carried out on the same commercial terms as all other clients of BVL. Fees arising during the year from such transactions were as follows: Garry Watson £nil (2011: £1,090) and Edward Cunningham £nil (2011: £5,154).
Andrew Burton is a director of VFM. During the year Mr Burton was a 33% shareholder in Yorkshire Association of Business Angels Ltd which VFM invoiced £157,258 (2011: £140,754) for services during the year of which £15,767 (2011: £14,203) was outstanding at 31 March 2012. During the year, VFM was charged rent totalling £20,880 (2011: £20,880) in respect of business premises owned personally by Mr and Mrs Burton. As at 31 March 2012, £2,166 (2011: £3,600) was due to Mr and Mrs Burton.

44
Braveheart Investment Group | Annual Report and Accounts 2012
| Accounts and Notes | NOTES TO THE FINANCIAL STATEMENTS for the year ended 31 March 2012 continued
26 Financial risk management objectives and policies (Group and Company)The Group and Company’s financial instruments comprise investments designated at fair value through profit or loss, cash and various items such as trade and other receivables, and trade and other payables, all of which arise directly from its normal operations.
The carrying values of all of the Group and Company’s financial instruments approximate their fair values at 31 March 2012 and 31 March 2011. The Accounting Policies described in note 2 outlines how the financial instruments are measured.
An analysis of the statement of financial position, relevant to an analysis of risk management, is as follows:
Financial instruments
Designated at fair value
through profit or loss
£
Loans and receivables
£
Non–financial assets & financial
assets outwith the scope of IAS 39
£Total
£
Group
2012
Investments 3,275,655 – – 3,275,655
Trade and other receivables – 236,177 63,275 299,452
Cash and cash equivalents – 87,974 – 87,974
Cash held for new shares – 336,000 – 336,000
3,275,655 660,151 63,275 3,999,081
2011
Investments 3,978,621 – – 3,978,621
Trade and other receivables – 179,007 57,211 236,218
Cash and cash equivalents – 643,203 – 643,203
3,978,621 822,210 57,211 4,858,042
Company
2012
Investments 2,123,002 – 2,673,968 4,796,970
Trade and other receivables – 661,986 59,935 721,921
Cash and cash equivalents – 12,688 – 12,688
Cash held for new shares – 336,000 – 336,000
2,123,002 1,010,674 2,733,903 5,867,579
2011
Investments 2,509,143 – 2,238,097 4,747,240
Trade and other receivables – 540,950 18,571 559,521
Cash and cash equivalents – 573,965 – 573,965
2,509,143 1,114,915 2,256,668 5,880,726
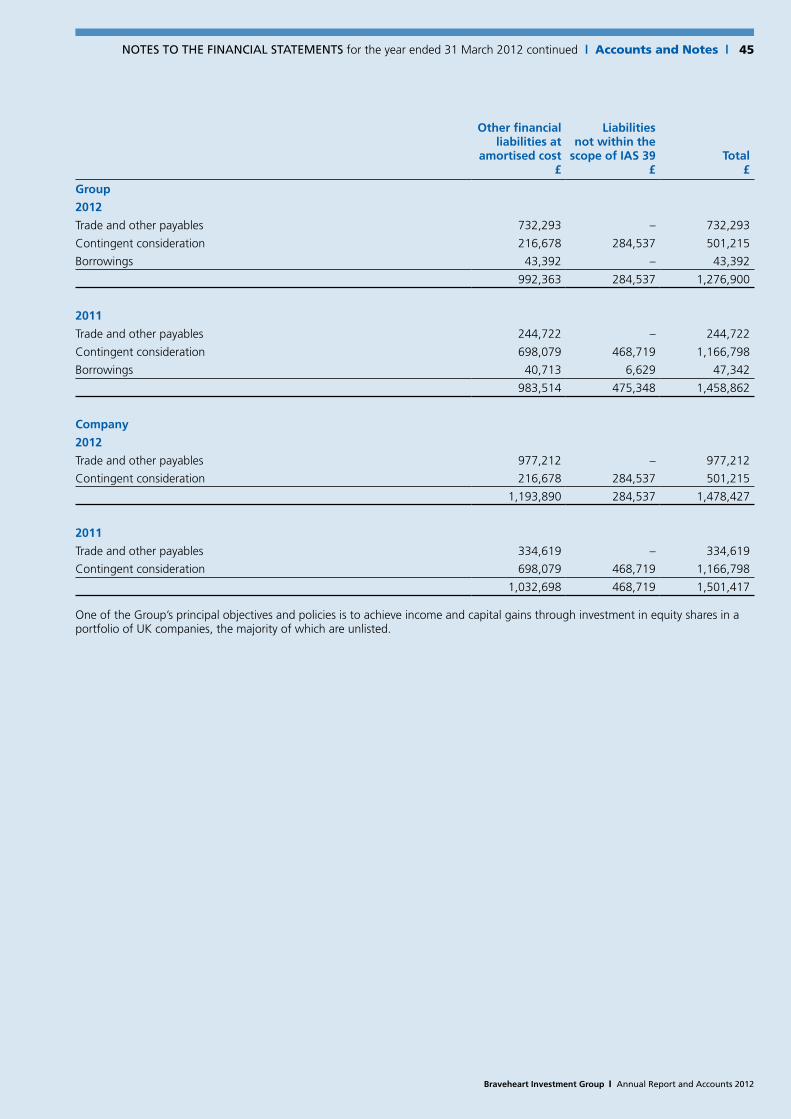
Braveheart Investment Group | Annual Report and Accounts 2012
45NOTES TO THE FINANCIAL STATEMENTS for the year ended 31 March 2012 continued | Accounts and Notes |
Other financial liabilities at
amortised cost£
Liabilities not within the
scope of IAS 39£
Total£
Group
2012
Trade and other payables 732,293 – 732,293
Contingent consideration 216,678 284,537 501,215
Borrowings 43,392 – 43,392
992,363 284,537 1,276,900
2011
Trade and other payables 244,722 – 244,722
Contingent consideration 698,079 468,719 1,166,798
Borrowings 40,713 6,629 47,342
983,514 475,348 1,458,862
Company
2012
Trade and other payables 977,212 – 977,212
Contingent consideration 216,678 284,537 501,215
1,193,890 284,537 1,478,427
2011
Trade and other payables 334,619 – 334,619
Contingent consideration 698,079 468,719 1,166,798
1,032,698 468,719 1,501,417 One of the Group’s principal objectives and policies is to achieve income and capital gains through investment in equity shares in a portfolio of UK companies, the majority of which are unlisted.
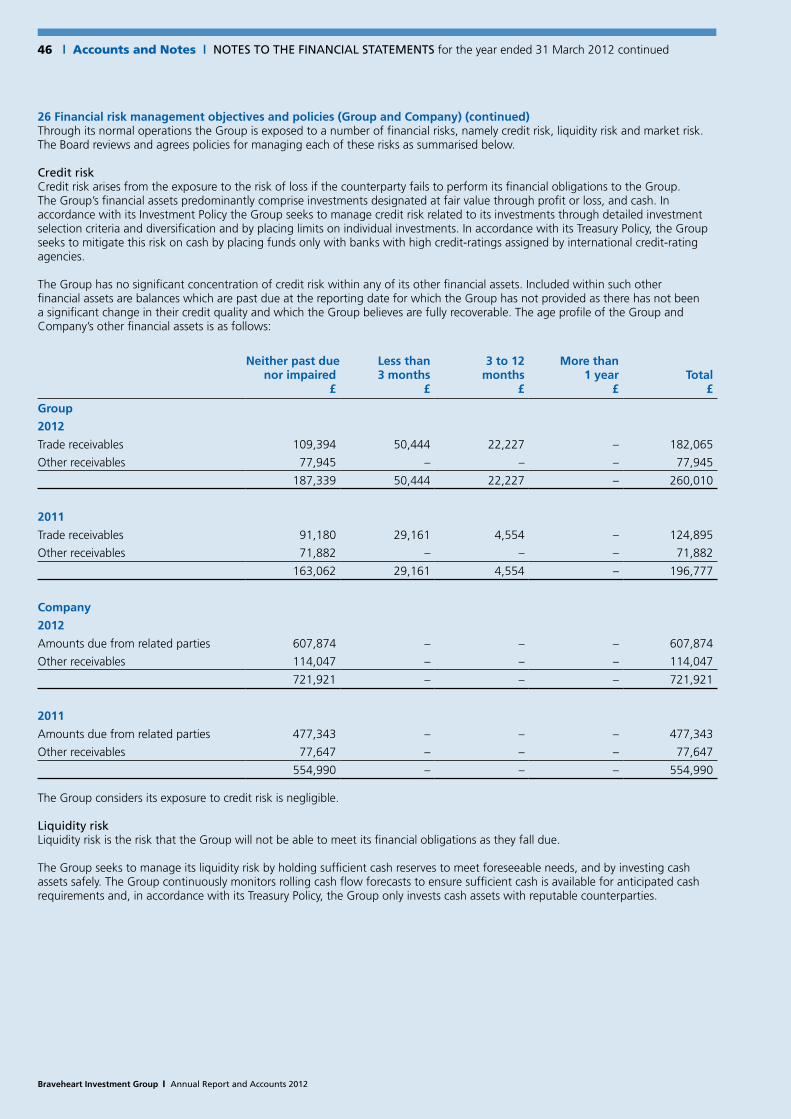
46
Braveheart Investment Group | Annual Report and Accounts 2012
| Accounts and Notes | NOTES TO THE FINANCIAL STATEMENTS for the year ended 31 March 2012 continued
26 Financial risk management objectives and policies (Group and Company) (continued)Through its normal operations the Group is exposed to a number of financial risks, namely credit risk, liquidity risk and market risk. The Board reviews and agrees policies for managing each of these risks as summarised below.
credit riskCredit risk arises from the exposure to the risk of loss if the counterparty fails to perform its financial obligations to the Group. The Group’s financial assets predominantly comprise investments designated at fair value through profit or loss, and cash. In accordance with its Investment Policy the Group seeks to manage credit risk related to its investments through detailed investment selection criteria and diversification and by placing limits on individual investments. In accordance with its Treasury Policy, the Group seeks to mitigate this risk on cash by placing funds only with banks with high credit-ratings assigned by international credit-rating agencies.
The Group has no significant concentration of credit risk within any of its other financial assets. Included within such other financial assets are balances which are past due at the reporting date for which the Group has not provided as there has not been a significant change in their credit quality and which the Group believes are fully recoverable. The age profile of the Group and Company’s other financial assets is as follows:
Neither past due nor impaired
£
Less than 3 months
£
3 to 12 months
£
More than 1 year
£Total
£
Group
2012
Trade receivables 109,394 50,444 22,227 – 182,065
Other receivables 77,945 – – – 77,945
187,339 50,444 22,227 – 260,010
2011
Trade receivables 91,180 29,161 4,554 – 124,895
Other receivables 71,882 – – – 71,882
163,062 29,161 4,554 – 196,777
Company
2012
Amounts due from related parties 607,874 – – – 607,874
Other receivables 114,047 – – – 114,047
721,921 – – – 721,921
2011
Amounts due from related parties 477,343 – – – 477,343
Other receivables 77,647 – – – 77,647
554,990 – – – 554,990
The Group considers its exposure to credit risk is negligible.
liquidity riskLiquidity risk is the risk that the Group will not be able to meet its financial obligations as they fall due.
The Group seeks to manage its liquidity risk by holding sufficient cash reserves to meet foreseeable needs, and by investing cash assets safely. The Group continuously monitors rolling cash flow forecasts to ensure sufficient cash is available for anticipated cash requirements and, in accordance with its Treasury Policy, the Group only invests cash assets with reputable counterparties.

Braveheart Investment Group | Annual Report and Accounts 2012
47NOTES TO THE FINANCIAL STATEMENTS for the year ended 31 March 2012 continued | Accounts and Notes |
The maturity profile of the Group and Company’s financial liabilities is as follows:
On demand£
Less than 3 months
£
3 to 12 months
£
More than 1 year
£Total
£
Group
2012
Trade and other payables 547,588 184,705 – – 732,293
Other liabilities 15,642 – – 43,392 59,034
563,230 184705 – 43,392 791,327
2011
Trade and other payables 240,800 3,922 – – 244,722
Other liabilities 14,202 3,717 2,912 40,713 61,544
255,002 7,639 2,912 40,713 306,266
Company
2012
Trade and other payables 383,107 178,882 – – 561,989
Amounts due to related parties 415,223 – – – 415,223
798,330 178,882 – – 977,212
2011
Trade and other payables 63,324 1,620 – – 64,944
Amounts due to related parties 269,675 – – – 269,675
332,999 1,620 – – 334,619 Market RiskMarket risk is the risk that changes in market conditions such as equity prices, interest rates and foreign exchange rates will have an adverse impact on the Group’s financial position or results.
equity price riskThe Group is exposed to equity price risk due to uncertainties about future values of its portfolio of listed and unlisted equity investments. The Group manages such equity price risk in a similar way to credit risk through detailed investment selection criteria and diversification and by placing limits on individual investments. Investments are monitored carefully and the Board reviews the portfolio on a regular basis.
It is estimated that the maximum effect of a 10% fall in market prices to which the Group is exposed would be an increase in the loss before tax for the twelve months to 31 March 2012 of £327,565 (2011: £384,862).
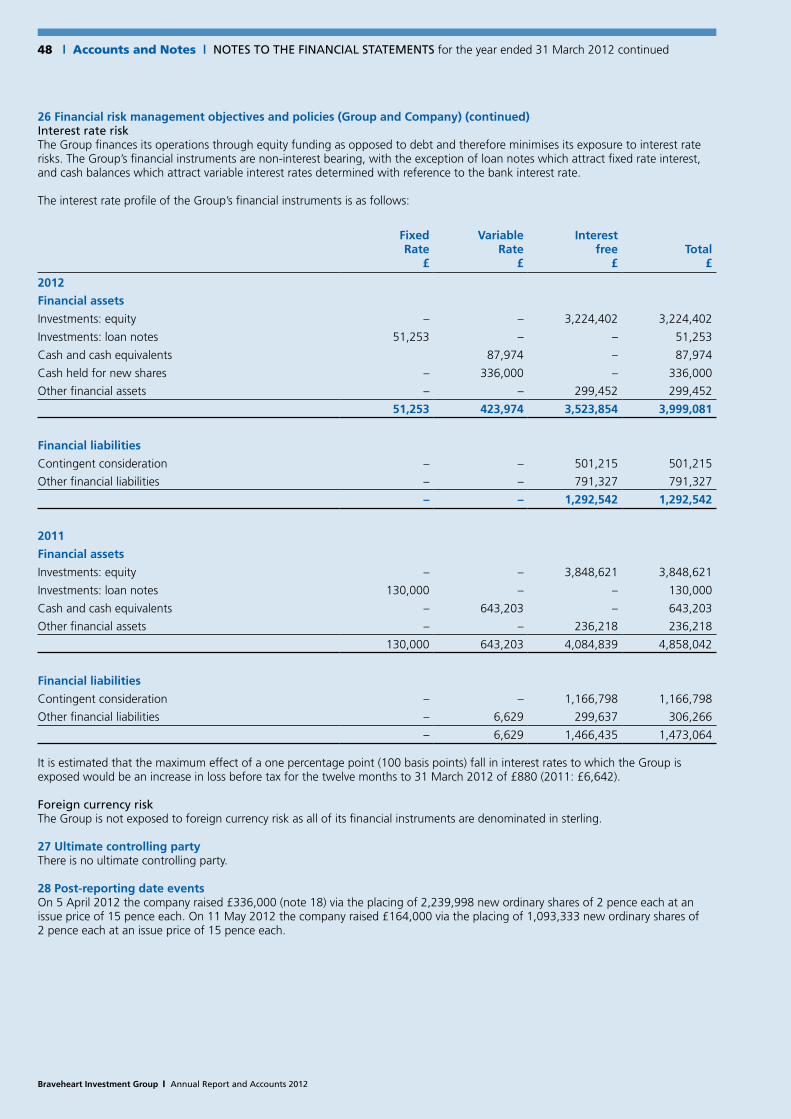
48
Braveheart Investment Group | Annual Report and Accounts 2012
| Accounts and Notes | NOTES TO THE FINANCIAL STATEMENTS for the year ended 31 March 2012 continued
26 Financial risk management objectives and policies (Group and Company) (continued)Interest rate riskThe Group finances its operations through equity funding as opposed to debt and therefore minimises its exposure to interest rate risks. The Group’s financial instruments are non-interest bearing, with the exception of loan notes which attract fixed rate interest, and cash balances which attract variable interest rates determined with reference to the bank interest rate.
The interest rate profile of the Group’s financial instruments is as follows:
Fixed Rate
£
Variable Rate
£
Interest free
£Total
£
2012
Financial assets
Investments: equity – – 3,224,402 3,224,402
Investments: loan notes 51,253 – – 51,253
Cash and cash equivalents 87,974 – 87,974
Cash held for new shares – 336,000 – 336,000
Other financial assets – – 299,452 299,452
51,253 423,974 3,523,854 3,999,081
Financial liabilities
Contingent consideration – – 501,215 501,215
Other financial liabilities – – 791,327 791,327
– – 1,292,542 1,292,542
2011
Financial assets
Investments: equity – – 3,848,621 3,848,621
Investments: loan notes 130,000 – – 130,000
Cash and cash equivalents – 643,203 – 643,203
Other financial assets – – 236,218 236,218
130,000 643,203 4,084,839 4,858,042
Financial liabilities
Contingent consideration – – 1,166,798 1,166,798
Other financial liabilities – 6,629 299,637 306,266
– 6,629 1,466,435 1,473,064 It is estimated that the maximum effect of a one percentage point (100 basis points) fall in interest rates to which the Group is exposed would be an increase in loss before tax for the twelve months to 31 March 2012 of £880 (2011: £6,642).
foreign currency riskThe Group is not exposed to foreign currency risk as all of its financial instruments are denominated in sterling.
27 Ultimate controlling partyThere is no ultimate controlling party.
28 Post-reporting date eventsOn 5 April 2012 the company raised £336,000 (note 18) via the placing of 2,239,998 new ordinary shares of 2 pence each at an issue price of 15 pence each. On 11 May 2012 the company raised £164,000 via the placing of 1,093,333 new ordinary shares of 2 pence each at an issue price of 15 pence each.
Braveheart Investment Group | Annual Report and Accounts 2012
49notIce of AnnuAl GeneRAl MeetInG |
BRAVEHEART INVESTMENT GROUP PLC(“The Company”)
NOTICE OF ANNUAL GENERAL MEETING(Registered in Scotland with company number SC247376)
NOTICE IS HEREBY GIVEN that an Annual General Meeting of the Company will be held at The Cherrybank Centre, Cherrybank Gardens, Perth, PH2 0PF on Tuesday 25 September 2012 at 12.30 to consider the following resolutions:
Ordinary BusinessTo consider and, if thought fit, pass the following resolutions which will be proposed as Ordinary Resolutions of the Company:
Resolution 1THAT the audited accounts of the Company for the financial year ended 31 March 2012 and the reports of the directors and auditors thereon be received.
Resolution 2THAT Grant Thornton UK LLP be re-appointed as auditors of the company to hold office until the conclusion of the next general meeting of the Company before which audited accounts are laid.
Resolution 3THAT the directors be authorised to determine the remuneration of the auditors.
Resolution 4THAT Garry Sanderson Watson who retires by rotation under article 109.1 of the Company’s existing Articles of Association, be re-elected as a director of the Company.
Resolution 5THAT Carolyn Smith who retires by rotation under article 109.1 of the Company’s existing Articles of Association, be re-elected as a director of the Company.
Resolution 6THAT Aileen Brown having been appointed by the Board since the last Annual General Meeting, be re-elected as a director of the Company.
Resolution 7That the Company’s Share Option Scheme be limited to 15% of the Company’s enlarged share capital from time to time.
Resolution 8THAT, the Rules of the Braveheart Investment Group plc Unapproved Company Share Option Plan, comprised within Part B of the Rules of the Company’s Executive Share Option Scheme, (the “Unapproved Scheme”) be amended to extend the definition of Eligible Employees to include employees , directors (including non-executive directors) consultants or contractors of or to a Relevant Undertaking, being a company or other undertaking in which the Company, or a subsidiary of the Company, controls at least 30% of the voting rights.
Resolution 9THAT the directors be generally and unconditionally authorised for the purposes of Section 551 of the Companies Act 2006 (the CA 2006) to allot or grant rights to subscribe for shares in the Company up to an aggregate nominal amount of £339,216 (representing 75% of the issued ordinary share capital of the Company as at 29 August 2012) provided that this authority shall, unless reviewed, varied or revoked by the Company, expire on 25 September 2015 save that the Company may, before such expiry, make offers or agreements which would or might require shares to be allotted and the directors may allot shares in the Company in pursuance of such offer or agreement notwithstanding that the authority conferred by this resolution has expired.
This resolution revokes and replaces all unexercised authorities previously granted to the directors to allot shares pursuant to section 551 of the CA 2006 but without prejudice to any allotment of shares or grants of rights already made, offered or agreed to be made pursuant to such authorities.
Special BusinessTo consider and, if thought fit, pass the following resolution which will be proposed as a Special Resolution of the Company:
Resolution 10THAT, subject to the passing resolution 7 above, the directors, pursuant to the general authority conferred on them, be empowered pursuant to section 570 of the CA 2006 to allot for cash equity securities (as defined in section 560 of the CA 2006) as if section 561 of the CA 2006 did not apply to such allotment provided that this power shall be limited to the allotment of equity securities wholly for cash up to an aggregate nominal value of £135,686 (being 30% of the issued share capital of the Company as at 29 August 2012) and shall expire on 25 September 2013 or, if earlier, the date of the next annual general meeting of the Company, save that the Company may, before such expiry, make offers or agreements which would or might require equity securities to be allotted and the directors may allot equity securities in pursuance of such offer or agreement notwithstanding that the authority conferred by this resolution has expired.
Registered office BY ORDER OF THE BOARDThe Cherrybank Centre Aileen Brown Cherrybank Gardens Company Secretary PerthPH2 0PF
Dated 29 August 2012

50
Braveheart Investment Group | Annual Report and Accounts 2012
| notIce of AnnuAl GeneRAl MeetInG continued
Explanations of the Resolutions proposed.Explanation of Resolution 1: The directors are required by law to present to the shareholders of the Company at a general meeting the audited accounts of the Company for the financial year ended 31 March 2012 and the reports of the directors and auditors thereon. The report of the directors and the audited accounts have been approved by the directors and the report of the auditors has been approved by the auditors. A copy of each of these documents may be found in the annual report of the Company.
Explanation of Resolution 2: The auditors are responsible for examining the annual accounts of the Company and forming an opinion as to whether or not they give a true and fair view of its results and the financial position. It is a requirement of law that the Company appoint auditors at each meeting at which accounts are presented to shareholders, such appointment to continue until the next audited accounts of the Company.
Explanation of Resolution 3: The resolution gives the directors of the Company the authority to determine the remuneration paid to the auditors for the next financial year. The amount of the remuneration for the next financial year will be disclosed in the next audited accounts of the Company.
Explanation of Resolution 4: Garry Sanderson Watson, a director of the Company, is retiring by rotation pursuant to the requirements of the Company’s Articles of Association and is making himself available for re-election. Biographical details for Mr Watson are shown on page 10 of the annual report.
Explanation of Resolution 5: Carolyn Smith, a director of the Company, is retiring by rotation pursuant to the requirements of the Company’s Articles of Association and is making herself available for re-election. Biographical details for Ms Smith are shown on page 10 of the annual report.
Explanation of Resolution 6: Aileen Brown was elected a director of the Company by the Board on 31 January 2012 and pursuant to the requirements of the Company’s Articles of Association is making herself available for re-election. Biographical details for Mrs Brown are shown on page 10 of the annual report.
Explanation of Resolution 7: On 16 May 2008 the members of the Company approved the adoption of a Share Option Scheme, limited to 10% of the enlarged share capital of the Company from time to time, and on 9 September 2009 approved an increase in that limit to 15% issued share capital from time to time. The notes to the resolution of 2009 indicated that it was the Company’s intention that such an increase should have been to 15% of the enlarged, not issued, share capital of the Company from time to time. This resolution is intended to clarify that the Share Option Scheme is limited to 15% of the enlarged share capital of the Company from time to time.
Explanation of Resolution 8: Currently only eligible employees of the Company or a subsidiary of the Company are permitted to take part in the Unapproved Scheme. The directors believe it is desirable for the purposes of incentivising individuals who may make a contribution to the benefit of the performance of the group to be able to offer options under the Unapproved Scheme to employees and directors of undertakings in which the Company, or a subsidiary of the Company, has a substantial minority interest but which otherwise fall outwith the definition of the Company’s Group for the purposes of the Unapproved Scheme.
Explanation of Resolution 9: It is being proposed to replace the existing authority of the directors of the Company to allot shares in the Company (or rights in respect thereof) in connection with section 551 of the CA 2006. The directors are seeking authority to issue up to 16,960,783 shares having an aggregate nominal value of £339,216, representing approximately 75% of the issued share capital of the Company as at 21 August 2012, such authority to expire on 25 September 2015.
The directors wish to continue the strategy of the growth of the Group as outlined in the Chairman’s Statement and the Chief Executive’s Report through prudent acquisitions which do not require recourse to cash resources and are therefore seeking authority to allot shares to enable them to pursue this strategy.
The limitations to the directors’ authority do not extend to: • theallotmentofshares,orthegrantofarighttosubscribefor,orconvertanysecurityinto,sharesintheCompanypursuanttoan
employee’s share scheme (as defined by section 1166 of the CA 2006); or
• theallotmentofsharespursuanttoarighttosubscribefor,orconvertsecuritiesinto,sharesintheCompanypreviouslygrantedinaccordance with the directors’ authority.
Explanation of Resolution 10: This resolution, which will be prosed as a special resolution, supplements the directors’ general authority to allot shares as conferred on them pursuant to Resolution 8. Section 561 of the CA 2006 requires a Company proposing to allot equity securities to offer them first to existing shareholders in proportion to their existing shareholdings. If passed, this requirement will not apply to allotments of shares for cash up to a total nominal value of £135,686 being 30% of the issued share capital of the Company at 21 August 2012. This authority enables the directors to raise additional equity capital through an issue of shares for cash. This authority will expire after one year or at the date of the next annual general meeting, whichever is the earlier.

Braveheart Investment Group | Annual Report and Accounts 2012
51notes |
Notes:1. A member entitled to attend and vote at the Annual General Meeting (the Meeting) is entitled to appoint one or more proxies to
exercise all or any of his rights to attend, vote and speak instead of him. A proxy need not be a member of the Company. You may appoint more than one proxy provided each proxy is appointed to exercise rights attached to different shares. You may not appoint more than one proxy to exercise the rights attached to any one share.
2. To be valid, a form of proxy (other than an electronic communication appointing a proxy) together with the power of attorney or other authority (if any) under which it is signed (or a copy of such authority certified notarially) must be lodged at the office of the Company’s registrars, Capita Registrars, PXS, 34 Beckenham Road, Beckenham, Kent, BR3 4TU by 12.30 pm on
23 September 2012, or not less than 48 hours before the time appointed for holding any adjourned meeting.
3. Pursuant to Regulation 41 of the Uncertificated Securities Regulation 2001, the Company has specified that only those shareholders registered in the register of members of the Company as at 6.00 pm on 23 September 2012 or, in the event that this meeting is adjourned, in the register of members 48 hours before the time of any adjourned meeting, will be entitled to vote, or to appoint one or more proxies to vote on their behalf, at this meeting in respect of the number of shares registered in their names at that time. Changes to entries on the register of members after 6.00 pm on 23 September 2012 or, in the event that this meeting is adjourned, in the register of members 48 hours before the time of any adjourned meeting, shall be disregarded in determining the rights of any person to attend or vote at the meeting.
4. Completion and return of a form of proxy will not prevent a member from attending the meeting and voting in person should he wish to do so.
5. CREST members who wish to appoint a proxy or proxies by utilising the CREST electronic proxy appointment service may do so for the Meeting and any adjournment(s) thereof by utilising the procedures described in the CREST Manual. CREST personal members or other CREST sponsored members and those CREST members who have appointed a voting service provider(s), should refer to their CREST sponsor or voting service provider(s), who will be able to take the appropriate action on their behalf.
6. In order for a proxy appointment made by means of CREST to be valid, the appropriate CREST message (a ‘CREST Proxy Instruction’) must be properly authenticated in accordance with Euroclear UK & Ireland Limited’s (‘EUI’) specifications and must contain the information required for such instructions, as described in the CREST Manual. The message regardless of whether it relates to the appointment of a proxy or to an amendment to the instruction given to a previously appointed proxy must, in order to be valid, be transmitted so as to be received by the issuer’s agent (ID RA10) by 12.30 pm on 23 September 2012. For this purpose, the time of receipt will be taken to be the time (as determined by the timestamp applied to the message by the CREST Applications Host) from which the issuer’s agent is able to retrieve the message by enquiry to CREST in the manner prescribed by CREST.
7. CREST members and, where applicable, their CREST sponsors or voting service providers should note that EUI does not make available special procedures in CREST for any particular messages. Normal system timings and limitations will therefore apply in relation to the input of CREST Proxy Instructions. It is therefore the responsibility of the CREST member concerned to take (or, if the CREST member is a CREST personal member or sponsored member or has appointed a voting service provider(s), to procure that his CREST sponsor or voting service provider(s) take(s)) such action as shall be necessary to ensure that a message is transmitted by means of the CREST system by any particular time. In this connection, CREST members and, where applicable, their CREST sponsors or voting service providers are referred, in particular, to those sections of the CREST Manual concerning practical limitations of the CREST system and timings.
8. The Company may treat as invalid a CREST Proxy Instruction in the circumstances set out in Regulation 35(5) (a) of the Uncertificated Securities Regulations 2001.
9. In order to facilitate voting by corporate representatives at the meeting, arrangements will be put in place at the meeting so that (i) if a corporate shareholder has appointed the chairman of the meeting as its corporate representative to vote on a poll in accordance with the directions of all the other corporate representatives for that shareholder at the meeting, then on a poll those corporate representatives will give voting directions to the chairman and the chairman will vote (or withhold a vote) as corporate representative in accordance with those directions; and (ii) if more than one corporate representative for the same corporate shareholder attends the meeting but the corporate shareholder has not appointed the chairman of the meeting as its corporate representative, a designated corporate representative will be nominated, from those corporate representatives who attend, who will vote on a poll and the other corporate representatives will give voting directions to that designated corporate representative. Corporate shareholders are referred to the guidance issued by the Institute of Chartered Secretaries and Administrators on proxies and corporate representatives (www.icsa.org.uk) for further details of this procedure. The guidance includes a sample form of appointment letter if the chairman is being appointed as described in (i) above.
10. Copies of the Articles of Association of the Company will be available for inspection at the Company’s registered office from 29 August 2012 to (and including) the date of the Meeting during normal business hours on any day (Saturdays, Sundays and
public holidays excepted).

52
Braveheart Investment Group | Annual Report and Accounts 2012
| notes

For the company looking to raise money, we provide the following:
• Equitycapital.Thisformoffinancingistypicallylong term and is usually appropriate for fast growing businesses or early stage companies. Wewillconsiderequityfinancingsofupto£2malthough we are happy to participate in larger financingsaspartofasyndicate;
• Debtfinance.Typicallyshorttomediumtermandfor companies with cash flow to service the loan. Ourunitsizeforthistypeoffinanceisup£1mand we will usually provide junior debt which is unsecuredbutlinkedtoanequityparticipation.Thistypeoffinanceisoftenreferredtoasmezzanine;
• Corporatefinanceadviceonallaspectsofraisingmoney, strategic development and corporate governance.
The money we invest comes from a variety of sources and is sometimes linked to particular geographical locations.
To the investor, we provide a one stop shop for the following groups who are looking for exposure to SMEinvestments:
• Highnetworth(HNW)individualslookingtobuildtaxefficientEnterpriseInvestmentScheme(EIS)andSeedEISportfolios;
• Familyofficesandprivatesectorinstitutions;
• Publicsectorinvestors.
Investorscanchoosebetweendifferenttypesofservice offering ranging from self-build portfolios, to a full fund management service.
WehaveofficesinPerth,Yorkshire,London,JerseyandtheIsleofManandassociateofficesinManchesterandDubai.
Front cover image courtesy of Belfast Visitor & Convention Bureau
Directors, Secretary, Registered Office and Advisers
Directors Garry S Watson OBE CA, Chairman (n) (r)
Geoffrey C B Thomson, Chief Executive Officer Carolyn Smith BA Hons ACIS, Chief Investment Officer Colin C Grant BCom CA, Chief Financial Officer (resigned 9 January 2012) Aileen Brown CA, Chief Financial Officer (appointed 31 January 2012) Edward B Cunningham CBE FRSE, Non-executive Director (a) (n) (r)
J Kenneth Brown BA CA, Non-executive Director (a) (r)
Jeremy H Delmar-Morgan MA MSI, Non-executive Director (a)
(a) Member of Audit and Risk Management Committee (n) Member of Nominations Committee (r) Member of Remuneration Committee
Secretary Colin C Grant BCom CA (resigned 9 January 2012) Aileen Brown CA (appointed 26 January 2012)
RegistrationNumber SC247376
RegisteredOffice The Cherrybank Centre Cherrybank Gardens Perth PH2 0PF Telephone +44 (0) 1738 587555
Website www.braveheartinvestmentgroup.co.uk
Advisers Registrar Auditors Capita Registrars Ltd Grant Thornton UK LLP Northern House 1-4 Atholl Crescent Woodsome Park Edinburgh Fenay Bridge EH3 8LQ Huddersfield HD8 0LA Solicitors Solicitors Semple Fraser LLP Maclay Murray & Spens LLP 80 George Street Quartermile One Edinburgh 15 Lauriston Place EH2 3BU Edinburgh EH3 6EP
Principal Bankers Bankers HSBC Bank plc Bank of Scotland plc 76 Hanover Street Pentland House Edinburgh 8 Lochside Avenue EH2 1HQ Edinburgh EH12 9DJ
NominatedAdviserandBroker JointBroker Seymour Pierce Limited (Nominated Advisor and Broker Pentland House from 29 June 2012) 20 Old Bailey Merchant Securities Limited London 51-55 Gresham Street EC4M 7EN London EC2V 7EL
Designed and produced by corporateprm, Edinburgh and London.www.corporateprm.co.uk
53COMPANYINFORMATION |
Braveheart Investment Group | Annual Report and Accounts 2012
Our business is all about financing small and medium sized enterprises (SMEs)

Bra
veh
eart In
vestm
en
t Gro
up
plc A
nn
ual R
epo
rt and
Acco
un
ts 2012
Annual Report and Accounts
Braveheart Investment Group plc
2012
The Cherrybank CentreCherrybank GardensPerthPH2 0PFUnited Kingdom
[email protected]: +44 (0)1738 587555F: +44 (0)1738 587666
www.braveheartinvestmentgroup.co.uk