block a lidar 3rd quality assessment report - amazon s3 · block a lidar 3rd party quality...
TRANSCRIPT

Block A LiDAR 3rd Party Quality Assessment Report
Prepared for:
Produced by:
6901 East Fish Lake Road Suite 140 Maple Grove Minnesota 55369
October 6, 2008
www.houstonengineeringinc.com
IInntteerrnnaattiioonnaall WWaatteerr IInnssttiittuuttee RReedd RRiivveerr BBaassiinn
LLiiDDAARR MMaappppiinngg IInniittiiaattiivvee
1301 12th Avenue North Box 5057 Fargo North Dakota 58105

October 6, 2008 i
CERTIFICATION I hereby certify that this plan, specification or report was prepared by me or under my direct supervision and that I am a duly licensed professional under the laws of the State of Minnesota or the State of North Dakota.
Curtis A. Skarphol, RLS Mark R. Deutschman, P.E. Minn. Reg. No. 42303 Minn. Reg. No. 41259 North Dakota Reg. No. 4723 Quality assurance oversight has been provided by me during the completion of this project, and I certify that I have reviewed the work products in accordance with the specifications and criteria contained herein
Mr. Brian Fischer, GIS Project Manager Date: October 6, 2008 Houston Engineering, Inc. Suite 140 6901 East Fish Lake Road Maple Grove, Minnesota 55679 763.493.4522 (Phone) 763.493.5572 (Fax) and Houston Engineering, Inc. 2505 N. University Dr. P.O. Box 5054 Fargo, ND 58105 701.237.5065 (Phone) 701.237.5101 (Fax) www.houstonengineeringinc.com

October 6, 2008 ii
Table of Contents Page Section 1.0 Project Overview 1
Section 2.0 Quality Assurance Considerations 3 2.1 References and Applicable Methods 3 2.2 Performance Specifications for LiDAR Products Established
by the Contract 3 2.3 Quality Assurance Process 5 2.4 Quality Assurance Unit 6 2.5 Collection of Known Elevations in the Field 7 2.6 Chain of Custody 12 2.7 Computing the RMSE(z) 12 2.8 Visual Assessment 12 2.9 Criteria for Acceptance 13
Section 3.0 Quality Assurance Results and Conclusions for Block A 14 3.1 Block Description 14 3.2 Results 14
3.2.1 Vertical Accuracy 14 3.2.2 Visual Assessment 19 3.2.3 Concurrence With the Specification 19
List of Figures
Figure 1. LiDAR Collection Areas and Blocks 2
Figure 2. Land Use Within the LiDAR Project Area 8
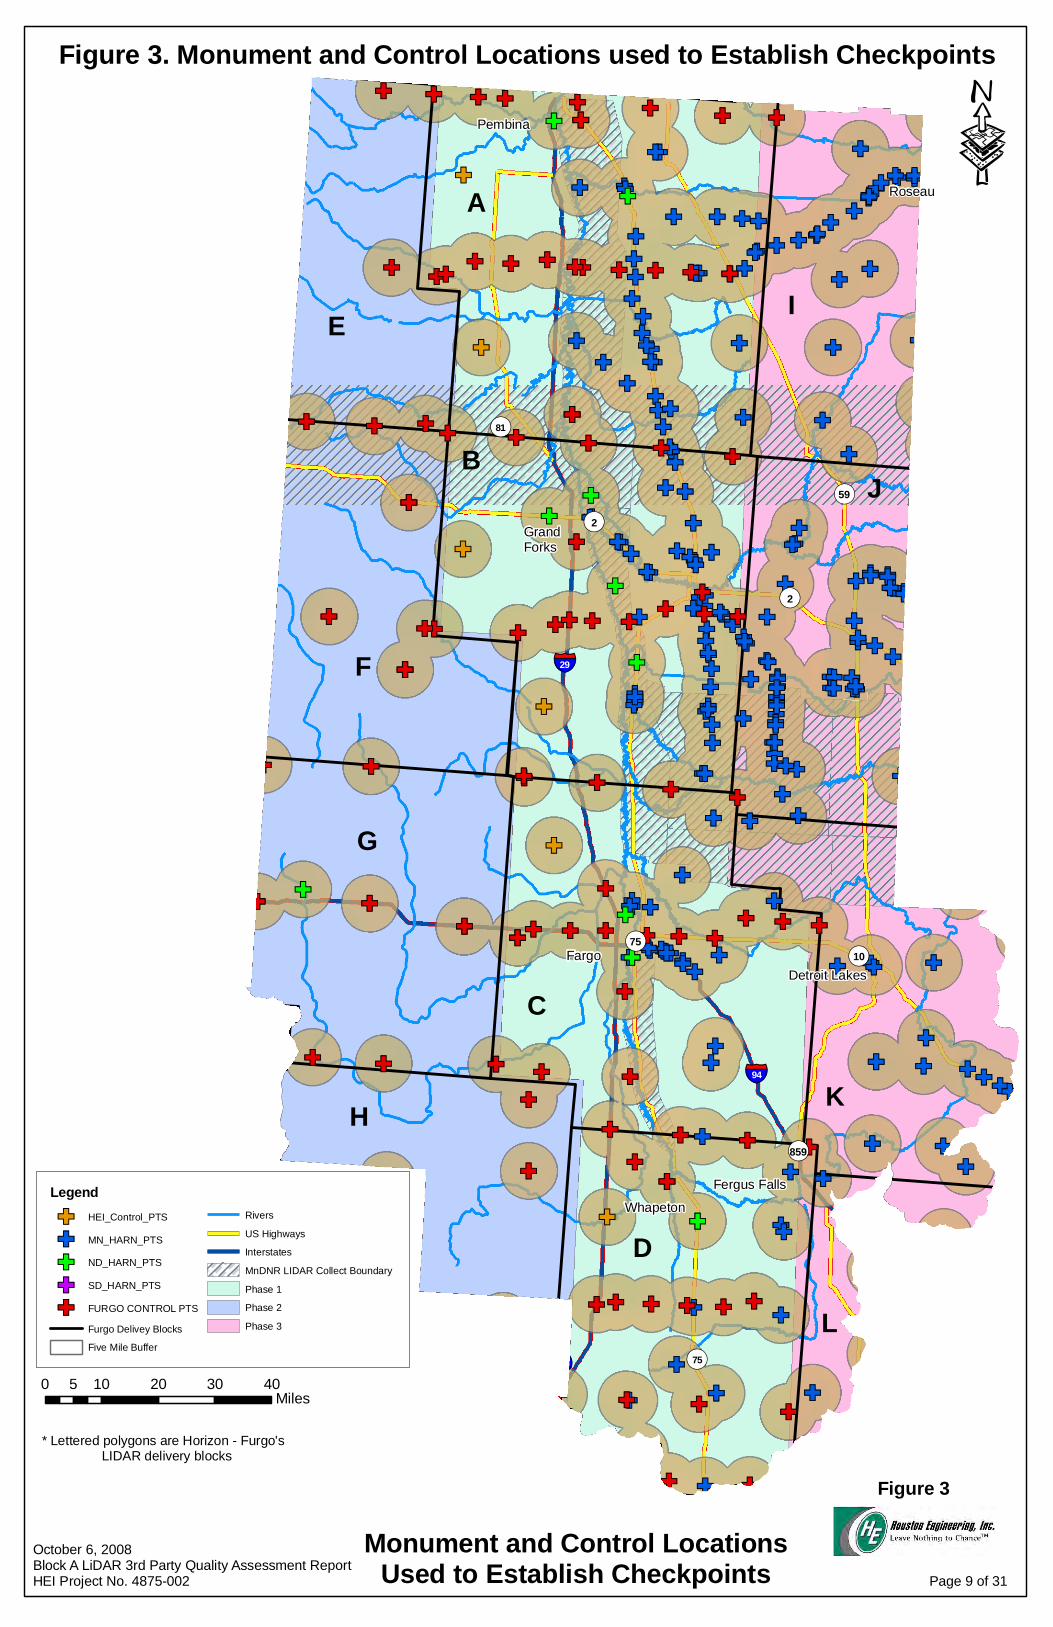
Figure 3. Monument and Control Locations Used to Establish Checkpoints 9
Figure 4. Check Point Locations within the Project Area 11
Figure 5. Land Use within Block A 15
Figure 6. Control Points within Block A 16
Figure 7. Checkpoints within Block A 17
Figure 8. RMSE(Z) by Land Class in Block A 18
Figure 9. Tiles Visually Assessed for Anomalies within Block A 20

October 6, 2008 iii
List of Tables Page
Table 1. Vertical Accuracy Statistics per NSSDA/FEMA Guidelines by Land Class 21
Table 2. Vertical Accuracy Computations by HEI Checkpoint 22
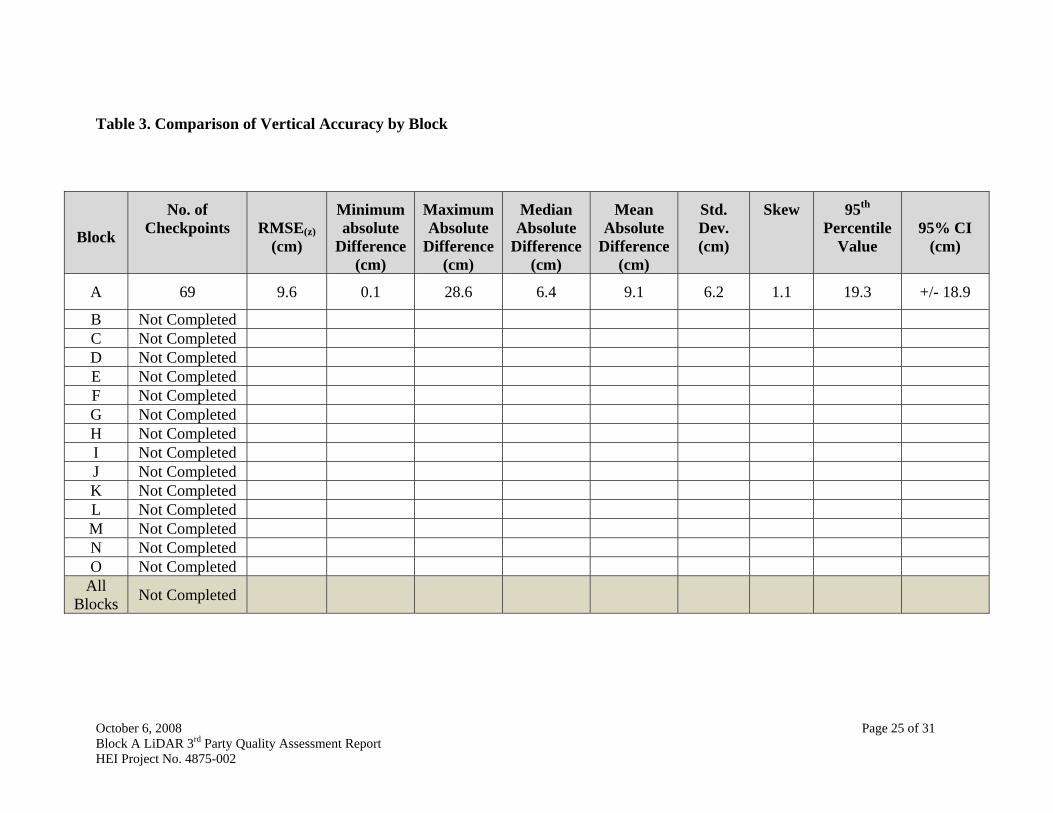
Table 3. Comparison of Vertical Accuracy by Block 25
Table 4. Vertical Accuracy Statistics for MnDNR Checkpoints in Block A 26
Table 5. Vertical Accuracy Computations by MnDNR Checkpoint in Block A 26
List of Appendices Appendix A: Chain of Custody Form 27
Appendix B: Visual Assessment Screenshots 28
Appendix C: CD-ROM containing an ESRI shapefile of HEI checkpoints and Photos 31

October 6, 2008 Page 1 of 31 Block A LiDAR 3rd Party Quality Assessment Report HEI Project No. 4875-002
SECTION 1.0 PROJECT OVERVIEW
The International Water Institute (IWI) has secured funding for a high resolution digital
elevation data collection project in the United States portion of the Red River of the North
watershed. The Red River Basin Mapping Initiative (RRBMI) includes all or portions of 45
counties in North Dakota, Minnesota, and South Dakota. (i.e., the Project Area) The size of the
proposed collection area is approximately 45,000 square miles. In the Spring of 2008, the IWI
selected Fugro-Horizons as the vendor to collect and process the LiDAR data. The United States
Army Corps of Engineers (COE) has entered into a cost share agreement with the Minnesota Red
River Watershed Management Board and the North Dakota Red River Joint Water Resource
District to contribute funding and resources towards the project. The COE is using Fugro-
Horizons to also collect and process LIDAR data.
The Project Area was generally divided into priority areas 1-5 as shown on Figure 1.
Fugro-Horizons is under contract to deliver the final products by blocks (A thru O) using 2000 x
2000 meter tiles. During the spring of 2008 approximately 17,584 square miles of the project
area was flown and collected. The first block (Block A) was delivered in late August 2008.
The IWI selected Houston Engineering, Inc. to conduct the 3rd party Quality Assessment
(QA) review of select LiDAR deliverables. By passing the QA review, final acceptance of the
data by the IWI is possible. Houston Engineering is primarily responsible for assessing the
vertical accuracy1 of the data using Global Positioning Survey (GPS) checkpoints.
1 Horizontal accuracy and orthoimagery are excluded from this QC process.

!.
!.
Marshall Roberts
Sargent
Ransom
Richland
Cass
Barnes
Stutsman
Foster
Traill
SteeleGriggs
EddyWells
Sheridan
GrandForksNelson
Benson
Walsh
Ramsey
Pierce
McHenry
RoletteTowner
Cavalier Pembina
Pierce
BigStone
Stevens
Traverse
Grant
Wilkin OtterTail
BeckerClay
Hubbard
MahnomenNorman
ItascaRedLake
Clearwater
Pennington
Polk
Beltrami
Marshall
Koochiching
RoseauKittsonLakeof the
Woods
I
JF
AE
O
C K
B
G
D
H
N
L
M
Figure 1. LiDAR Collection Areas and Blocks
!. Fargo
!. Grand Forks
Rivers
Delivery Blocks
MN DNR Project Boundary
South Dakota Counties
North Dakota Counties
Minnesota Counties
Priority 1Collection Area0 30 60 9015
MilesFigure 1
LiDAR Collection Blocks
´Sources: MN DOT, MN DNR, ND GIS Hub, US TIGER Data
Page 2 of 31
October 6, 2008Block A LiDAR 3rd Party Quality Assessment ReportHEI Project No. 4875-002

October 6, 2008 Page 3 of 31 Block A LiDAR 3rd Party Quality Assessment Report HEI Project No. 4875-002
SECTION 2.0 QUALITY ASSURANCE CONSIDERATIONS
2.1 REFERENCES AND APPLICABLE METHODS
The processes and methods used to QA the LiDAR products are largely based upon
guidance established by various federal agencies / entities including the Federal Emergency
Management Agency (FEMA) and the Federal Geographic Data Committee (FGDC). Portions of
the following references form the basis for the QA process:
American Society for Photogrammetry and Remote Sensing (ASPRS) Guidelines, Vertical Accuracy Reporting for LiDAR Data, Version 1.0, Released May 24, 2004, ASPRS LiDAR Committee, 20 p.
Federal Geographic Data Committee, 1996. Content Standards for Digital Geospatial Metadata (version 2.0), FGDC-STD-001-1998: Washington, D.C., Federal Geographic Data Committee, 9 p.
Federal Geographic Data Committee, 1998, Part 3: Geospatial Positioning Accuracy Standards, FGDC-STD-007.3-1998: Washington, D.C., Federal Geographic Data Committee, 25 p. Federal Emergency Management Agency, 2003, Guidelines and Specifications for Flood Hazard Mapping Partners, Appendix A: Guidance for Aerial Mapping and Surveying [February 2002], 57p. Federal Emergency Management Agency, 2003, Guidelines and Specifications for Flood Hazard Mapping Partners, Appendix 4B: LIDAR Specifications for Flood Hazard Mapping, 8p.
The QA process included select portions from these references (primarily to determine vertical
accuracy) as well as visual methods as described within this section.
2.2 PERFORMANCE SPECIFICATIONS FOR LIDAR PRODUCTS ESTABLISHED BY THE CONTRACT
The Request for Proposal (RFP) established the following requirements for several
LiDAR products (referenced to the RFP section):
Performance Standards - The performance standards for this project are the Federal Emergency Management Agency’s (FEMA) “Guidelines and Specifications for Flood

October 6, 2008 Page 4 of 31 Block A LiDAR 3rd Party Quality Assessment Report HEI Project No. 4875-002
Hazard Mapping Partners, Appendix A” Guidance for Aerial Mapping and Surveying” (http://www.fema.gov/pdf/fhm/frm_gsaa02.pdf). At a minimum, all bare earth digital elevation data delivered shall meet a 15 centimeter root mean square error (RMSE(z)) vertical and 1 (one ) meter horizontal accuracy.
Mandatory Deliverables - Delivery of the following products shall be required to satisfy the contract:
• All Raw Classified Data
o All raw classified (post calibrated, pre-filtered) data files shall be delivered for each collection area. Other raw data deliverable requirements include:
o Delivered in Universal Trans-Mercator (UTM) Coordinate System (Zone 14, NAD 83)
o Elevation values (z) provided in orthometric heights in meters with 1 (one) centimeter resolution in the NAVD88 datum.
o Classified raw data in LASer (LAS version 1.1) File Format Exchange format.
o Data as a collection of files which are subdivided using 2000m by 2000m tiles.
• Filtered Bare-earth Data
o Provide northing, easting, and elevation data for filtered raw data representing the bare earth – all other elevation points shall be removed (i.e. bridges, buildings, vegetations, etc). Other filtered bare earth data requirements include:
o Delivered in Universal Trans-Mercator (UTM) Coordinate System (Zone 14, NAD 83)
o Elevation values (z) provided in orthometric heights in integer meters with 1 (one) centimeter resolution in the NAVD88 datum.
o Filtered Bare-earth data in the LAS (version 1.1) format.
o Data as a collection of files which are subdivided using 2000m by 2000m tiles.
• Bare-Earth Digital Elevation Model (DEM)
o Provide a raster-based DEM derived from bare-earth points of the filtered bare-earth data that meets the following requirements:
o Horizontal DEM grid spacing of 1 (one) meter in Easting and Northing.
o Delivered in Universal Trans-Mercator (UTM) coordinate system (Zone 14, NAD 83).
o Vertical DEM resolution shall preserve ranging resolution at a minimum of 1 (one) centimeter resolution in the NAVD88 datum.

October 6, 2008 Page 5 of 31 Block A LiDAR 3rd Party Quality Assessment Report HEI Project No. 4875-002
o Provided in ASCII GRID format.
o Data as a collection of files which are subdivided using 2000m by 2000m tiles.
• Project Completion Report
o This report shall be provided to the IWI in both printed copy and electronic format (CDROM – Microsoft Word), and shall contain the information specified in FEMA’s Appendix A, Section A.8.7.2 (http://www.fema.gov/pdf/fhm/frm_gsaa.pdf)
• Metadata Record
o For each dataset produced under this contract, the Vendor shall use the information compiled in the Project Completion Report to deliver a metadata document compatible with the FGDC Content Standards for Digital Geospatial Metadata (http://www.fgdc.gov/standards/projects/FGDC-standards-projects/metadata/base-metadata/v2_0698.pdf)
Although several LiDAR products are generated by the current collection effort, this QA report
pertains solely to the bare earth products.
2.3 QUALITY ASSURANCE PROCESS
The QA process is intended to assess whether the LiDAR deliverables meets the
following criteria:
• The final products are delivered in UTM Coordinate System NAD 83, Zone 14 with elevation values in NAVD 1988 datum (orthometric heights);
• Files are named correctly in accordance with the tiling and collection area scheme and are not corrupt;
• Investigation for the presence of blunders based upon the checkpoints. Blunders are defined as a difference between the measured checkpoint elevation and the elevation determined from the bare earth products which exceeds 3 times the standard deviation (as defined by ASPRS Guidelines) as an indicator of potential for systematic error;
• Visual assessment of the raw classified data to ensure proper classification (2 – Ground, 6 – Building, 8 – Model Keypoint, 12 – Overlap Points) and qualitatively assess the number of unclassified points;
• Visual assessment of the filtered bare earth data to assess the homogeneity and density of points and ensure suitable overlap between the tiles;
• Lack of obvious anomalies as determined from visual audit goal of assessing 5% of the tiles.
o Per FEMA’s Appendix A, Section A.8.3.1, data voids are areas lacking points exceeding two times the DEM post spacing. For the purpose of this assessment

October 6, 2008 Page 6 of 31 Block A LiDAR 3rd Party Quality Assessment Report HEI Project No. 4875-002
voids are functionally defined by an absence of points within a maximum area of ~ 1,000 square meters (~1/4-acre). Except within bodies of water raw data voids cannot exceed 2.5% of any given tile.
o Per FEMA’s Appendix A, Section A.8.3.1, artifacts are regions of anomalous elevations or oscillations or ripples within the DEM data. Artifacts may consist of elevation spikes or depressions, ridges between tiles, poor penetration of the LiDAR or processing. Artifact aerial extent should generally be limited to a maximum area of ~ 1,000 square meters (~1/4-acre) and less than 25% of any given tile.
• Descriptive statistics computed by land use for the elevation difference between the checkpoint elevation and the LiDAR elevation to verify normality assumptions used when computing the root mean square error (RMSE(z)) for fundamental accuracy (mean of ± 2 cm and skewness coefficient of ± 4 cm);
• Vertical accuracy expressed as:
o Block RMSE(z) computed from all checkpoints within a block regardless of land use. The block RMSE(z) is consistent with the vertical accuracy as described within the RFP.
o Fundamental vertical accuracy within a block for those checkpoints located within open terrain where there is a high probability that the sensor detected the ground surface . The fundamental vertical accuracy is the value by which vertical accuracy can be equitably assessed and compared among different datasets. Fundamental vertical accuracy is calculated at the 95-percent confidence level as a function of the RMSE(z);
o Supplemental vertical accuracy for those check points not located within open terrain and expressed as the 95th percentile error value;
o Consolidated vertical accuracy computed across land use categories and expressed as the 95th percentile error value; and
o Absolute and percent difference between the checkpoint and LiDAR elevation;
• Metadata meets accepted standards.
2.4 QUALITY ASSURANCE UNIT
QA procedures were applied to the LiDAR deliverables by block. Each block comprises
an approximate area between 562 square miles and 5,472 square miles and is further subdivided
into tiles approximately 2000 meters by 2000 meters. Generally, a minimum of 20 known
elevations within the dominant land (i.e., comprising 90% of the total area within a block) use
were available to assess vertical accuracy.

October 6, 2008 Page 7 of 31 Block A LiDAR 3rd Party Quality Assessment Report HEI Project No. 4875-002
2.5 COLLECTION OF KNOWN ELEVATIONS IN THE FIELD
Known elevations (i.e., checkpoints) within five (5) land use categories were determined
using a Trimble survey grade global positioning system. There were areas were GPS signal was
not possible, for example in forested areas. In this case a GPS point was taken in an open area
and then total station was used to traverse into the area where GPS can not be used. Checkpoints
were collected within the following land use categories:
• Low grass, bare earth;
• High grass, weeds, crops;
• Brush, low trees;
• Forested; and
• Urban – developed.
Land use was based upon the National Land Cover Dataset (2001) as shown in Figure 2.
Land use categories are consistent with those recommended by various reference documents as
described within Section 2.1.
Houston Engineering performed the checkpoint survey relative to National Spatial
Reference System (NSRS) monuments and generally used the same NSRS monuments and
control points as those used by the contractor for the collection of the LiDAR data. Five
additional control points were established by Houston Engineering during the checkpoint survey
in priority area 1. Figure 3 shows the control network used to obtain checkpoint elevations.
Checkpoint locations were generally placed on flat terrain, removed from severe slopes and
breaklines, consistent with National Digital Elevation Program (NDEP) guidelines
(http://www.ndep.gov/TechSubComm.html). The GPS base station was established over these
monument and control points and in some cases, monuments and control points were “checked”
as an additional quality assurance measure.
The quality of a checkpoint can be inferred from the instrument Position Dilution of
Precision (“PDOP”). Generally the smaller the PDOP number, the higher the data quality.
PDOP values from the GPS are presented in results section of this report.

§̈¦29§̈¦94
§̈¦29
§̈¦94
§̈¦29
§̈¦94
§̈¦94LD
H
KGC
BJ
OM
NE A
F
I
´
0 40 80 120 16020Miles
Interstate
Delivery Blocks
Water, Low Grass, Bare Earth
High Grass, Weeds, Crops
Brush, Low Trees
Forested
Urban - Developed
Sources:National Land Cover Dataset 2001MN DOTND GIS HubUS TIGER Data Figure 2
Page 8 of 31
Figure 2. Land Use Within the LiDAR Project Area
October 6, 2008Block A LiDAR 3rd Party Quality Assessment ReportHEI Project No. 4875-002
GF
GF
GF
GFGFGF
GFGF
GFGFGFGFGFGF
GF
GF
GF
GFGF
GFGF
GFGFGFGFGFGFGFGF
GF
GFGF
GFGF
GF
GF
GFGF
GFGF
GFGFGF
GF
GFGFGF
GF
GF
GF
GF
GF
GF
GF
GF
GF
GFGFGF
GF
GFGF
GF
GF
GF
GF
GF
GF
GF
GF
GF
GF
GF
GFGF
GF
GF
GF
GF
GF
GF
GF
GF
GF
GF
GF
GF
GF
GF
GF
GF
GF
GF
GF
GF
GF
GF
GF
GF
GF
GF
GFGF
GF
GF
GFGF
GF GF
GF
GF
GF
GF
GF
GFGFGF
GF
GF
GF
GF
GF
GF
GFGF
GF
GF
GF
GF
GF
GF
GF
GF
GF
GF
GF
GF
GF
GF
GF
GF
GF
GF
GF
GF
GF
GF
GF
GF
GFGF
GF
GF
GF
GF
GF
GFGF
GF
GF
GF
GFGF
GF
GF
GF
GF
GF
GFGF
GF
GF
GFGF
GF
GFGF
GF
GF
GFGF
GF
GF
GF
GF
GF
GF
GF
GF
GF
GFGF
GF
GF
GF
GF
GF
GF
GF
GF
GF
GF
GF
GF
GF
GF
GFGFGF
GF
GF
GF
GF
GF
GF
GF
GFGF
GF
GF
GF
GF
GF
GF
GF
GF
GF
GF
GF
GF
GF
GFGF
GFGFGF
GF
GF
GF
GF
GF
GF
GF
GF
GF
GF
GF
GF
GF
GF
GF
GF
GF
GF
GF
GF
GF
GF
GF
GF
GF
GF
GF
GF
GF
GF
GF
GF
GF
GF
GF
GF
GF
GF GF
GF
GF
GF
GFGF
GF
GF
GF
GF
GF
GF
GF
GF
GF GF
GF
GFGF
GF
GF
GF
GF
GF
GFGF
GF
GF
GF
GF
GFGF
GF
GFGF
GF
GF GF
GF
GFGFGF
GF
GF
GF
GFGF
GFGF
GF
GF
GF
GF
GF
GF
GF
GF
GF
GF
GF
GF
GF
GF
GF
GF
GF
GF
GF
GF
GF
GF
GF
GF
GF
GF
GF
GF
GF
GF
GF
GF
GF
GF
GF
GF
GF
GF
GF
GF
GFGF
GF GFGF
GF
GF
GF
GF
GFGF
GF
GF
GF
GF
GF
GF
GF
GF
GF
GF
GF
GFGF
GF
GFGF
GF
GF GFGF GF
GFGF
GF GF
GF
GF
GF
GF
GF
GFGF
GF
GF
GF
GF
GFGF
GF
GFGF
GF
GF
GF
GFGF
GF
GFGF
GF
GFGF
GF
GFGF
GF
GF
GF
GF
GFGF
GF
GFGF
GF
GFGF
GF
GFGF
GF
GF
GF
GF
GF
GF
GF
GF
GF
GF
GF
GF
GF
GF
GF
GF
GF
GF
GF
GF
GF
GF
GF
GF
GF
GF
GFGF
GF
GF
GF
GF
GF
GF
GF
GF
GF
GF
GF
GF
GF
GF
GF
GF
GF
GF
GF
GF
GF
GF
GF
GF
GF
GF
GF
GF
GF
GF
GF
GF
GF
GF
GF
GF
GF
GF
GFGF
GF
GF
GF
GF
GF GF
GF GF
GF
GFGF
GF
GF GF
GFGFGFGF
GF GF
GFGFGF
GF
GF
GF
GF
GF
GF
GF
GF
¬«59
¬«75
¬«2
¬«10
¬«859
¬«2
§̈¦94
§̈¦I 29
§̈¦I 29
·
LegendGF HEI_Control_PTS
GF MN_HARN_PTS
GF ND_HARN_PTS
GF SD_HARN_PTS
GF FURGO CONTROL PTS
Furgo Delivey Blocks
Five Mile Buffer
Rivers
US Highways
Interstates
MnDNR LIDAR Collect Boundary
Phase 1
Phase 2
Phase 3
Monument and Control LocationsUsed to Establish Checkpoints
§̈¦29
¬«81
¬«75
0 10 20 30 405Miles
Pembina
RoseauA
E I
B
F
JGrandForks
FargoDetroit Lakes
G
C
KH
D
L
Fergus Falls
Whapeton
* Lettered polygons are Horizon - Furgo's LIDAR delivery blocks
Figure 3
October 6, 2008Block A LiDAR 3rd Party Quality Assessment ReportHEI Project No. 4875-002 Page 9 of 31
Figure 3. Monument and Control Locations used to Establish Checkpoints

October 6, 2008 Page 10 of 31 Block A LiDAR 3rd Party Quality Assessment Report HEI Project No. 4875-002
A minimum of 20 checkpoints (preferably 30) for each land use category is desirable
(because RMSE(z) computations are based on the assumption of a normality of the errors).
During the RFP process, the collection areas were envisioned as the quality assurance unit.
Subsequent to contract award, specific blocks within the collect areas became the quality
assurance unit. Changing the quality assurance unit to blocks resulted in fewer than 20 points for
each land use within a block. Consequently, 20 additional checkpoints were collected to achieve
a minimum of 20 for the dominant land use (i.e., land use 2, high grass, weeds and crops)
typically comprising 90% of the area within a block. Figure 4 shows the checkpoint locations
by land use in Blocks A-D. Additional checkpoints for the rest of the blocks will be collected as
the project moves forward. The checkpoints were used to compute the vertical RMSE(z). LiDAR
values for computing the RMSE(z) were obtain from a triangular irregular network (TIN) derived
from the LiDAR bare earth products.
There is a presumption that the checkpoint survey values are free of error and that
discrepancies between the LiDAR and checkpoint elevations are attributable to the LiDAR
technology. This assumption is considered valid provided the technology used to obtain the
checkpoint elevations yield accuracy at least three times greater than the expected accuracy of
LiDAR. It should be recognized that the checkpoint survey is in fact not free of error - the
PDOP values provide some indication of the quality of the checkpoint elevations.
Additional checkpoint locations are available within project areas 1 and 2 as a result of
previous LiDAR collection efforts from the Minnesota Department of Natural Resources
(MnDNR). During MnDNR LiDAR collection, approximately 456 checkpoints were collected.
These points may be used as an independent dataset for computing vertical accuracy for
informational purposes only, but will not be used to determine acceptance of the work products.
The results will be shown as a secondary verification check but not used towards determining an
acceptance of the block.

^^^̂^̂
^̂̂^^^^̂
^^^
^^̂^^^̂^̂̂^̂^̂̂̂ ^^̂̂̂̂^̂̂̂^̂̂̂̂^
^^̂^^^^̂̂^̂̂
^̂̂̂^̂̂^̂̂^
^̂^̂^̂̂̂
^̂^^̂̂̂^̂̂^̂̂^̂̂̂^̂̂^̂̂̂^̂^̂̂̂^^
^̂̂^^^̂̂^
^̂ ^^̂^^̂^
^^̂
^̂^̂̂^̂^̂̂^̂̂̂^̂̂̂̂^^̂̂̂̂
^
^
^^^̂
^
^^^^̂
^̂^̂
^̂^^
^
^̂^^^^̂̂̂^̂^̂
^^^
^^
^̂̂̂̂̂̂̂̂̂̂̂^̂
^^̂̂^̂
^̂̂^̂^̂^̂
^̂̂^̂^̂
^̂̂^̂^̂^̂
^̂
^̂^̂^̂^^̂^
^̂^̂
^^
^^̂ ^^^^
^^̂̂^^̂
^̂^̂̂^̂^^̂
^
^̂^̂̂^^^̂^
^
^^̂^^^̂
^^^
^^̂̂ ^̂^^^^
^^
^^̂
^ ^^^
^^̂^^̂
^̂̂̂̂̂̂̂̂^
^^^
^^ ^̂
^̂̂̂̂̂̂̂̂
^
^^
^
^
^^^̂^
^^
^ ^^^ ^^^^
^
^^^
^̂
^ ^
^^
^̂^̂
^̂̂̂̂
^̂̂̂̂^̂̂̂
^^^^̂̂^ ^̂^̂
^̂^^̂
^̂̂̂̂̂̂̂^^
^^
^̂̂̂̂̂̂̂̂̂^̂ ^^̂^^
^^
^^ ^̂̂̂̂̂̂̂̂̂ ^̂
^̂
^̂̂̂̂̂̂̂̂̂̂̂^
^
^ ^ ^
^^
^̂̂̂̂̂̂̂̂
^^^
^^^̂
^^^
^̂
^̂^̂^̂^̂^^^
^
^
^^^^̂^
^^^^ ^̂̂
^̂^
^^
^ ^ ^^^
^̂
^̂^^̂^̂^^^ ^
^̂^̂^̂^^̂
^̂^̂̂
^̂̂ ^^^̂
^̂^̂^
^^̂^̂̂ ^
^^
^̂^̂
^^̂^^
^
^̂
^
^
^̂̂^
^
^̂^^^
¬«59
¬«75
¬«2
¬«10
¬«859
¬«2
§̈¦94
0 8 16 24 324Miles
Legend^ MnDNR LIDAR Check Points (approx. 456)
^ Fargo LIDAR Check Points (appox. 160)
HEI Check PointsWater, Low Grass, Bare Earth
High Grass, Weeds, Crops
Brush, Low Trees
Forested
Urban - Developed
Delivery Blocks
Rivers
US Highways
Interstates
MN DNR LIDAR Project
Phase 1
Phase 2
Phase 3
§̈¦29
¬«81
¬«75
A
B
C
D
H
G
K
L
J
IE
F
Pembina
Grand Forks
Fargo
Whapeton
Fergus Falls
Detroit Lakes
Roseau ·
*
*Lettered polygons are Horizon - Furgo's LIDAR delivery blocks
Figure 4
Figure 4. Check Point Locations within the Project Area
Page 11of 31
October 6, 2008Block A LiDAR 3rd Party Quality Assessment ReportHEI Project No. 4875-002

October 6, 2008 Page 12 of 31 Block A LiDAR 3rd Party Quality Assessment Report HEI Project No. 4875-002
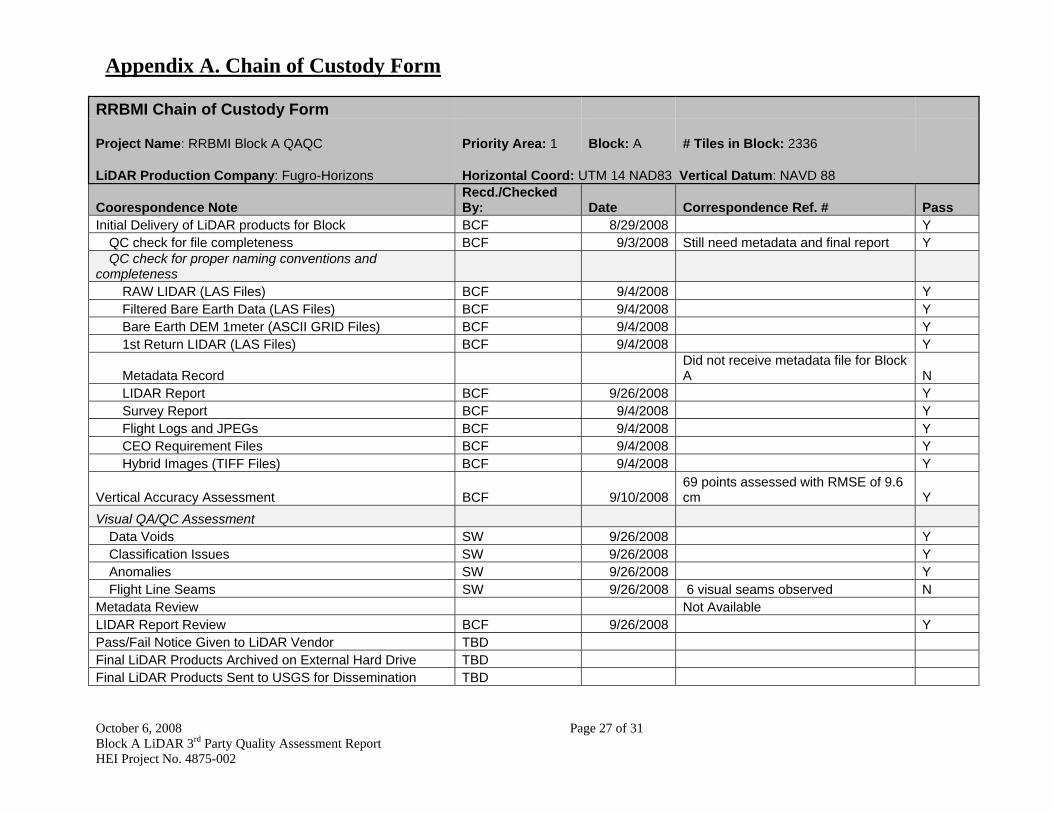
2.6 CHAIN OF CUSTODY
The work flow process for quality assuring the LIDAR products included following
chain-of-custody procedures to ensure data integrity, a visual assessment of the LIDAR bare
earth product for select tiles, completeness checks, and computing the Root Mean Square Error
(RMSE(z)) for vertical accuracy Upon receipt of the LiDAR products, Houston Engineering
checks for completeness of files and ensures naming conventions conformed to the tile naming
convention. The Chain of Custody form (see Appendix A) tracks progress through the QA
process.
2.7 COMPUTING THE RMSE(Z)
The vertical accuracy assessment calculations were generated using Coherent’s LP360
software program. The LiDAR surface elevations are calculated by interpolating from the bare
earth LAS files delivered by the vendor. A Triangular Irregular Network (TIN) is created around
each checkpoint, using LiDAR points. Then the triangle that covers the sample horizontally is
selected. The location on the surface of this triangle that matches the sample location then
provides the elevation. This elevation is a linear interpolation of the elevations of the 3 triangle
vertices; or more simply, it is the point in 3D on the TIN triangle at the sample location’s X and
Y. The RMSE(z) is computed as:
RMSE(z) = Sqrt [(∑ (ZLidar(i) – Zcheckpoint(i))2)/n] where n is the total number of checkpoints and i
represents any given checkpoint
2.8 VISUAL ASSESSMENT
The goal of the visual assessment is to inspect for three general issues; data voids greater
than 1,000 sq. meters, appropriate LiDAR point classification and anomalies in the bare earth
products. Anomalies include penetration problems, spikes, and vegetation artifacts. Houston
Engineering randomly selects at minimum 5% of the tiles within each block and visually
reviewed the bare earth point LAS files using the LP360 software.

October 6, 2008 Page 13 of 31 Block A LiDAR 3rd Party Quality Assessment Report HEI Project No. 4875-002
2.9 CRITERIA FOR ACCEPTANCE
The sole criteria for acceptance of the LiDAR product is per block RMSE(z) of 15 cm or
less for the bare earth data as defined within the Request for Proposal for those checkpoints
collected by Houston Engineering, Inc. Any other issues that are identified by the assessment
will be reported in the report for informational purposes.

October 6, 2008 Page 14 of 31 Block A LiDAR 3rd Party Quality Assessment Report HEI Project No. 4875-002
SECTION 3.0 QUALITY ASSURANCE RESULTS AND CONCLUSIONS
FOR BLOCK A
3.1 BLOCK DESCRIPTION
The QA process is being applied to Block A located within collect area 1 (see Figure 1).
High grass, weeds and crop comprise nearly 90% of the land use within Block A. Urban (5.1%),
forested (4.0%), low grass and bare earth (1%) and brush and low trees (< 1%) comprise the
remaining land uses within Block A (Figure 5). Control points used to collect checkpoints
within Block A numbered 15 as shown in Figure 6. Control points utilized by the checkpoint
survey included National Geodetic Survey (NGS), Minnesota Department of Transportation
(MnDOT) and HEI control networks. Sixty-nine checkpoints were collected within Block A and
used during completion of the QA process (Figure 7). Additionally there were also 13 MnDNR
checkpoints shown in Figure 7 that were used for a secondary check that will not be used for
final acceptance but reported for informational purposes.
3.2 RESULTS
3.2.1 Vertical Accuracy
Table 1 shows the block RMSE(z) derived from all checkpoints across all land uses and
by land use. Figure 8 graphically presents the RMSE(z) values by land class. Table 2 shows the
difference in elevation between each check point and the elevation derived from the LiDAR bare
earth TIN. Table 2 also shows the PDOP values as an index of the quality of individual quality
assurance checkpoints. Table 3 provides a summary of vertical accuracy across all Blocks
collected to date.
Table 1 shows the block RMSE(z) derived from all checkpoints across all land uses and
by land use. Calculation of the RMSE(z) assumes that the vertical errors are normally distributed
with a mean of zero. A mean error of ± 2 cm and skewness coefficient of ± 4 cm indicates the
vertical errors are normally distributed. Table 1 shows that the normality seems valid for the
errors within Block A. Figure 8 graphically presents the RMSE(z) values. Based upon the quality
assurance review, the data for this Block exhibit the following characteristics:

A
Delivery Blocks
Water, Low Grass, Bare Earth
High Grass, Weeds, Crops
Brush, Low Trees
Forested
Urban - Developed
0 4 8 122Miles Figure 5
´
Land Use: USGS NCD 2001
October 6, 2008Block A LiDAR 3rd Party Quality Assessment ReportHEI Project No. 4875-002 Page 15 of 31
Figure 5. Landuse Within Block A

#0
#0
#0
#0
#0
#0
#0
#0
#0
#0
#0
#0
#0
#0
#0
#0
#0#0
#0
#0 #0
#0
#0
#0
#0
#0
#0
#0
#0
#0
#0
#0
#0
#0
#0
#0
#0
#0
#0
#0
#0
#0$
$
$$
$
$
$
$
$
$
$
$
$
$
$
¬«220
¬«175
¬«171
¬«220
£¤59
£¤75
¬«1
¬«11
£¤81
¬«32
£¤81
¬«18
¬«66¬«66
¬«17
Alvarado
Argyle
Donaldson
EastGrandForks
Hallock
Halma
Humboldt
Karlstad
Kennedy
LakeBronson
Lancaster
Newfolden
Oslo
SaintVincent
Stephen
Strandquist
Viking
Warren
Cavalier
Neche
Bathgate
Hamilton
Pembina
Mountain Hensel
Crystal
St Thomas
Drayton
Fordville
Conway
Pisek
ParkRiver
EdinburgHoople
Grafton
Minto
ForestRiver
Ardoch
Inkster
Gilby Manvel
GrandForks
Emerado
Niagara
E
A
45002A
NADAMNDT
MKLY 18MnDOTH370
DEUTZ1990
K 373
D 373
W 371
NIECHE
GPS
PEMINAHEI
MNDOTROBBIN
OSLO
16 MDD
WALSH(HEI)
Delivery Block AControl Network for
Checkpoint Survey Points
´
0 10 205Miles
Base Stations$ 16 MDD
$ 45002A
$ D 373
$ DEUTZ 1990
$ GPS
$ K 373
$ MKLY 18
$ MNDOT ROBBIN
$ MnDOT H370
$ NADA MNDT
$ NIECHE
$ OSLO
$ PEMINA HEI
$ W 371
$ WALSH (HEI)
Check Points17 (Walsh)
D 373
DEUTZ 1990
GPS
K 373
MNDOT ROBBIN
MnDOT H370
NADA MNDT
NIECHE
OSLO
PEMINA HEI
VRS BASE
W 371
#0 Cities
Interstate
Rivers
US Highways
State Highways
Delivery Blocks
Figure 6. Control Network Within Block AScale: Drawn by: Checked by: Project No.: Date: Sheet:AS SHOWN SMW 4875-002 09/09/08
Map created by:
6901 E. Fish Lake Rd., Suite 140Maple Grove, MN 55369Bus: (763) 493-4522Fax: (763) 493-5572
Houston Engineering, Inc.
1 of 1
Figure 6. Control Points Within Block A
October 6, 2008Block A LiDAR 3rd Party Quality Assessment ReportHEI Project No. 4875-002 Page 16 of 31

#0
#0
#0
#0
#0
#0
#0
#0
#0
#0
#0
#0
#0
#0
#0
#0
#0#0
#0
#0 #0
#0#0
#0
#0
#0
#0
#0
#0
#0
#0
#0
#0
#0
#0
#0
#0
#0
#0
#0
#0
#0
#0
#0
#0
^̂
^̂
^̂
^
^
^^̂^̂
^^
^
^
!
!
!!!
! !
!! ! ! !
!!!
!
! ! !
! !!!
!!
! ! !
!
!!! ! !
!
!
!!!
!
!
!
!!
!
! !
!
!
!!!
!
!!
!
!
!
! ! !
!
!
!!
!
!
!!
!
!
!!
!
! !!
!!!
!
!
!
!¬«220
¬«175
¬«171
¬«220
£¤59
£¤75
¬«1
¬«11
£¤81
¬«32
£¤81
¬«18
¬«66¬«66
¬«17
Alvarado
Argyle
Donaldson
EastGrandForks
Hallock
Halma
Humboldt
Karlstad
Kennedy
LakeBronson
Lancaster
Newfolden
Oslo
SaintVincent
Stephen
Strandquist
Viking
Warren
Cavalier
Neche
Bathgate
Hamilton
Pembina
Mountain Hensel
Crystal
St Thomas
Drayton
Fordville
Conway
Pisek
ParkRiver
EdinburgHoople
Grafton
Minto
ForestRiver
Ardoch
Inkster
Gilby Manvel
GrandForks
Emerado
Larimore
Niagara
Checkpoints Within Block Aby Landuse Class
´
0 10 205Miles
! Water, Low Grass, Bare Earth
! High Grass, Weeds, Crops
! Brush. Low Trees
! Forested
! Urban - Developed
^ MN DNR LIDAR Checkpoints
#0 cities
Interstate
Rivers
US Highways
State Highways
Delivery Blocks
A
MN DNR Checkpoints
Figure 7. Control Network Within Block AScale: Drawn by: Checked by: Project No.: Date: Sheet:AS SHOWN SMW 4875-002 09/09/08
Map created by:
6901 E. Fish Lake Rd., Suite 140Maple Grove, MN 55369Bus: (763) 493-4522Fax: (763) 493-5572
Houston Engineering, Inc.
1 of 1
H.E.I Checkpoints
Figure 7. Check Points Within Block A
October 6, 2008Block A LiDAR 3rd Party Quality Assessment ReportHEI Project No. 4875-002 Page 17 of 31

October 6, 2008 Page 18 of 31 Block A LiDAR 3rd Party Quality Assessment Report HEI Project No. 4875-002
Figure 8. RMSE(z) by Land Class in Block A

October 6, 2008 Page 19 of 31 Block A LiDAR 3rd Party Quality Assessment Report HEI Project No. 4875-002
2 Fundamental Vertical Accuracy (cm) 16.2
3 Supplemental Vertical Accuracy (cm) 20.8
4 Consolidated Vertical Accuracy (cm) 19.3
5 Number of Blunders 4
Additional checkpoints were available from the MnDNR LiDAR collect. These 13
checkpoints were used as a secondary assessment of the vertical accuracy of the LiDAR data.
The results are to be used for information purposes only and have no effect on the acceptance of
the LiDAR data. Tables 4 and 5 show the results of those 13 MnDNR checkpoints.
3.2.2 Visual Assessment
There are a total of 2,336 tiles within the block A. The visual assessment included
reviewing 155 tiles (approximately 6.5% of total tiles) (Figure 9). In summary Houston
Engineering found no major anomalies with the visual assessment. A few minor anomalies were
found and are described below and shown in appendix B. The issues of the most signicance
include steps between six flight line seams within Block A. There were two seams that had steps
greater than 0.2 meters. Screen captures illustrating the seams are shown in Appendix B under
the section titled seams. A couple other potential minor anomalies where found as well. They
include one instance of poor LiDAR penetration, one instance of small data void and a couple
instances of incorrect point classification. All of the minor issues are would need to be field
verified to indicate whether they are truly an error or not.
3.2.3 Concurrence With the Specification
This quality assurance review shows that the RMSE(z) of 9.6 cm determined for the
Block A bare earth LiDAR products is equal to or less than the specification of 15 cm and
therefore achieves the required specification. Table 2 show the difference between each
checkpoint elevation and the elevation derived from the TIN derived from the bare earth LiDAR
data.
2 Equal to the 95-percentile confidence interval value for low grass and bare earth land class. 3 Equal to the 95-percentile error value for all land classed excluding low grass and bare earth. 4 Equal to the 95-percentile error value for all land classes. 5 Blunder defined as specific error value exceeding 3 times the standard deviation.

#0
#0
#0
#0
#0
#0
#0
#0
#0
#0
#0
#0
#0
#0
#0
#0
#0#0
#0
#0 #0
#0
#0
#0
#0
#0
#0
#0
#0
#0
#0
#0
#0
#0
#0
#0
#0
#0
#0
#0
#0
#0
¬«220
¬«175
¬«171
¬«220
£¤59
£¤75
¬«1
¬«11
£¤81
¬«32
£¤81
¬«18
¬«66¬«66
¬«17
Alvarado
Argyle
Donaldson
EastGrandForks
Hallock
Halma
Humboldt
Karlstad
Kennedy
LakeBronson
Lancaster
Newfolden
Oslo
SaintVincent
Stephen
Strandquist
Viking
Warren
Cavalier
Neche
Bathgate
Hamilton
Pembina
Mountain Hensel
Crystal
St Thomas
Drayton
Fordville
Conway
Pisek
ParkRiver
EdinburgHoople
Grafton
Minto
ForestRiver
Ardoch
Inkster
Gilby Manvel
Niagara
E
A
Delivery Block ATiles Reviewed
´
0 10 205Miles
#0 Cities
Interstate
Rivers
US Highways
State Highways
Delivery Blocks
QC Not Performed on Tile
QC Performed on Tile
October 6, 2008Block A LiDAR 3rd Party Quality Assessment ReportHEI Project No. 4875-002 Page 20 of 31
Figure 9. Tiles Reviewed Within Block AScale: Drawn by: Checked by: Project No.: Date: Sheet:AS SHOWN SMW 4875-002 09/09/08
Map created by:
6901 E. Fish Lake Rd., Suite 140Maple Grove, MN 55369Bus: (763) 493-4522Fax: (763) 493-5572
Houston Engineering, Inc.
1 of 1
Figure 9. Tiles Visually Assessed for Anomalies within Block A

October 6, 2008 Page 21 of 31 Block A LiDAR 3rd Party Quality Assessment Report HEI Project No. 4875-002
Table 1. Vertical Accuracy Statistics per NSSDA/FEMA Guidelines by Land Class for Block A.
Land Class
# of Check Points
Mean Absolute
Difference (cm)
Median Absolute
Difference (cm)
Skew
Std. Dev. (cm)
Min Absolute
Difference (cm)
Max Absolute
Difference (cm)
95% Confidence
Interval Value (cm)
95th Percentile
Value RMSE(z) (cm)
Low Grass, Bare Earth 14 7.8 7.1 0.6 5.5 1.1 18.2 +/- 19.1
16.2 9.4
High Grass, Weeds, Crops 24 9.1 9.5 1.0 7.2 0.1 28.6 +/- 22.7
22.2 11.6
Brush, Low Trees 5 10.4 7.1 1.0 8.29 1.5 23.05 +/- 24.8
21.0 12.7
Forested 12 4.9 4.6 0.7 4.26 0.2 12.58 +/- 12.5 12.1 6.4 Urban 14 5.3 3.8 0.9 4.3 0.5 14.2 +/- 13.4 13.4 6.9
All Points 69 9.1 6.4 1.1 6.28 0.1 28.6 +/- 18.9
19.3 9.6

October 6, 2008 Page 22 of 31 Block A LiDAR 3rd Party Quality Assessment Report HEI Project No. 4875-002
Table 2. Vertical Accuracy Computations by HEI Checkpoint (3 pages)
Block A HEI Survey Checkpoints (UTM 14 NAD83, NAVD 88) LiDAR
Elevations Results
Point ID X Coord Y Coord
Z Elev. (m) Landuse Class
Max PDOP Value
Max HDOP Value
Max VDOP Value
*Z from LiDAR Bare Earth TIN
(m) Delta Z
(m)
Absolute Difference
(cm)
Exceed Blunder Criteria
(Y/N) 1104 669076.328 5332379.639 263.543 Forested 0.0 1.1 1.7 263.668 0.125 12.5 N 1105 665733.196 5340520.518 260.67 Urban 1.9 1.1 1.6 260.675 0.005 0.5 N 1106 664092.806 5340374.505 258.77 Low Grass, Bare Earth 1.8 1.0 1.5 258.92 0.15 15 N 1107 648678.473 5339859.923 248.216 Urban 2.6 1.4 2.2 248.191 -0.025 2.5 N
1109 659505.682 5427213.637 290.292High Grass, Weeds,
Crops 1.9 1.0 1.6 290.398 0.106 10.6 N 1110 671376 5427641.015 304.15 Forested 2.7 1.5 2.3 304.153 0.003 0.3 N 1111 672269.522 5425497.661 303.013 Low Grass, Bare Earth 1.9 1.0 1.6 303.096 0.083 8.3 N
1113 672807.751 5424355.431 302.43 High Grass, Weeds,
Crops 1.9 1.0 1.7 302.528 0.098 9.8 N 1114 674633.683 5424450.273 305.01 Forested 2.2 1.1 1.9 305.03 0.02 2 N 1115 675784.915 5424489.465 305.797 Low Grass, Bare Earth 1.9 1.0 1.7 305.763 -0.034 3.4 N 1116 677090.049 5424512.9 306.197 Brush, Low Trees 1.9 1.0 1.6 306.268 0.071 7.1 N
1117 678725.256 5426329.682 307.911High Grass, Weeds,
Crops 1.9 0.9 1.6 308.009 0.098 9.8 N 1118 629897.112 5425405.421 242 Urban 2.5 1.3 2.2 241.985 -0.015 1.5 N 1119 627926.491 5425633.479 241.288 Urban 3.4 1.6 3.1 241.34 0.052 5.2 N 1120 626528.016 5424764.181 241.453 Forested 2.9 1.4 2.5 241.504 0.051 5.1 N 1121 624893.461 5426365.457 241.559 Low Grass, Bare Earth 2.1 1.1 1.7 241.632 0.073 7.3 N 1122 626683.168 5426386.58 241.312 Low Grass, Bare Earth 2.4 1.2 2.0 241.494 0.182 18.2 N
1123 629753.358 5425950.853 239.437High Grass, Weeds,
Crops 1.9 1.1 1.6 239.584 0.147 14.7 N 1124 650879.713 5404952.604 248.532 Urban 0.8 0.4 0.6 248.674 0.142 14.2 N 1125 652817.094 5404550.777 250.999 Low Grass, Bare Earth 1.3 0.8 1.1 251.013 0.014 1.4 N

October 6, 2008 Page 23 of 31 Block A LiDAR 3rd Party Quality Assessment Report HEI Project No. 4875-002
1126 651907.493 5404608.162 244.967High Grass, Weeds,
Crops 1.0 0.6 0.8 245.167 0.2 20 Y 1127 649663.303 5404536.911 248.234 Low Grass, Bare Earth 0.8 0.5 0.7 248.386 0.152 15.2 N 1128 653164.656 5386868.595 250.141 Low Grass, Bare Earth 1.0 0.6 0.8 250.13 -0.011 1.1 N
1129 653973.984 5387720.176 252.041High Grass, Weeds,
Crops 0.8 0.5 0.7 252.089 0.048 4.8 N 1130 654038.03 5389873.863 251.831 Urban 1.4 0.8 1.2 251.844 0.013 1.3 N 1131 656297.02 5390128.136 254.195 Forested 2.2 1.0 1.9 254.193 -0.002 0.2 N
1132 658717.585 5390308.272 257.12 High Grass, Weeds,
Crops 2.4 1.0 2.1 257.406 0.286 28.6 Y 1133 655189.971 5382042.919 252.858 Urban 1.9 1.2 1.6 252.843 -0.015 1.5 N 1134 661836.458 5355843.683 258.011 Urban 1.9 1.2 1.5 257.992 -0.019 1.9 N 1135 661495 5356216.649 257.183 Low Grass, Bare Earth 1.9 1.1 1.5 257.252 0.069 6.9 N 1136 658171.49 5356334.495 253.765 Low Grass, Bare Earth 1.9 1.1 1.5 253.809 0.044 4.4 N 1137 660193.351 5356725.298 255.721 Forested 2.5 1.5 2.0 255.744 0.023 2.3 N
1138 661733.597 5356476.074 256.916High Grass, Weeds,
Crops 2.6 1.5 2.1 257.068 0.152 15.2 N 1139 682688.5 5383478.829 319.114 Urban 2.6 1.5 2.2 318.985 -0.129 12.9 N 1140 682957.319 5386073.586 315.141 Low Grass, Bare Earth 1.7 1.0 1.3 315.087 -0.054 5.4 N
1141 683116.065 5384501.305 318.398High Grass, Weeds,
Crops 2.9 1.4 2.6 318.422 0.024 2.4 N 1142 681834.244 5384411.726 313.908 Forested 3.4 1.6 3.0 313.79 -0.118 11.8 N 1143 679791.007 5384371.513 310.178 Brush, Low Trees 2.5 1.3 2.1 310.163 -0.015 1.5 N 1144 683876.566 5381971.407 318.442 Brush, Low Trees 2.0 1.0 1.6 318.513 0.071 7.1 N
1145 684686.319 5379735.878 318.78 High Grass, Weeds,
Crops 1.9 1.0 1.6 318.799 0.019 1.9 N
1146 683255.775 5376382.246 315.294High Grass, Weeds,
Crops 1.9 1.0 1.6 315.409 0.115 11.5 N 11201 605664.899 5426828.013 253.54 Urban 0.0 0.0 0.0 253.462 -0.078 7.8 N 11202 603697.922 5424396.78 255.468 Forested 0.0 0.0 0.0 255.518 0.05 5 N 1147 601969.614 5424277.561 255.746 Low Grass, Bare Earth 2.0 1.1 1.7 255.732 -0.014 1.4 N
1148 607177.331 5424845.599 251.328High Grass, Weeds,
Crops 2.2 1.1 1.9 251.316 -0.012 1.2 N
1149 608391.73 5426047.468 251.345High Grass, Weeds,
Crops 2.3 1.1 1.9 251.346 0.001 0.1 N

October 6, 2008 Page 24 of 31 Block A LiDAR 3rd Party Quality Assessment Report HEI Project No. 4875-002
1150 614320.625 5385650.28 256.287 Urban 1.8 1.1 1.5 256.359 0.072 7.2 N 1151 613818.377 5386615.919 256.452 Forested 2.5 1.3 2.2 256.494 0.042 4.2 N
1152 614517.924 5380983.786 255.897High Grass, Weeds,
Crops 2.3 1.2 1.9 255.93 0.033 3.3 N 1153 614422.089 5382792.204 256.763 Brush, Low Trees 2.1 1.1 1.8 256.895 0.132 13.2 N 1154 611288.37 5384158.741 261.781 Low Grass, Bare Earth 2.0 1.0 1.7 261.875 0.094 9.4 N
1155 613997.688 5363264.97 254.593High Grass, Weeds,
Crops 1.8 1.0 1.4 254.714 0.121 12.1 N 1156 617701.722 5363343.584 252.819 Urban 3.4 1.8 2.8 252.916 0.097 9.7 N
1157 619020.258 5363358.13 249.562High Grass, Weeds,
Crops 2.4 1.3 2.0 249.788 0.226 22.6 Y 1158 620753.19 5349989.541 251.066 Urban 2.2 1.3 1.8 251.124 0.058 5.8 N 1159 621248.407 5347394.859 251.298 Brush, Low Trees 2.2 1.4 1.7 251.528 0.23 23 Y 1160 620361.103 5348905.673 248.915 Forested 0.0 1.0 1.3 248.983 0.068 6.8 N 1161 618371.464 5348881.311 252.445 Low Grass, Bare Earth 0.0 1.9 1.7 252.557 0.112 11.2 N
1162 619589.732 5351559.216 249.951High Grass, Weeds,
Crops 2.9 2.2 1.9 250.013 0.062 6.2 N
1226 604361.713 5406754.662 264.675High Grass, Weeds,
Crops 0.0 0.8 1.2 264.782 0.107 10.7 N
1227 601963.482 5406641.447 267.361High Grass, Weeds,
Crops 0.0 0.8 1.2 267.325 -0.036 3.6 N 1228 601196.317 5405227.318 270.077 Urban 0.0 1.0 1.3 270.097 0.02 2 N
1229 638058.924 5383321.615 243.24 High Grass, Weeds,
Crops 0.0 1.1 1.5 243.254 0.014 1.4 N 1230 636479.288 5381633.471 238.349 Forested 0.0 3.4 2.1 238.43 0.081 8.1 N
1231 635114.306 5382222.087 243.201High Grass, Weeds,
Crops 0.0 1.6 2.1 243.098 -0.103 10.3 N
1233 640491.611 5342956.362 245.44 High Grass, Weeds,
Crops 0.0 0.9 1.9 245.504 0.064 6.4 N
1234 635765.912 5339830.577 246.334High Grass, Weeds,
Crops 0.0 0.6 1.1 246.365 0.031 3.1 N 1235 638359.142 5339611.236 244.739 Forested 0.0 1.0 1.5 244.732 -0.007 0.7 N
1236 677675.625 5340724.423 281.434High Grass, Weeds,
Crops 0.0 1.1 1.4 281.527 0.093 9.3 N *Note: Z from LIDAR was extracted using Coherent's LP360 software using the TIN method. Elevations were extracted from the Bare Earth LAS files.
October 6, 2008 Page 25 of 31 Block A LiDAR 3rd Party Quality Assessment Report HEI Project No. 4875-002
Table 3. Comparison of Vertical Accuracy by Block
Block
No. of Checkpoints RMSE(z)
(cm)
Minimum absolute
Difference(cm)
Maximum Absolute
Difference(cm)
Median Absolute
Difference (cm)
Mean Absolute
Difference (cm)
Std. Dev. (cm)
Skew 95th Percentile
Value 95% CI
(cm)
A 69 9.6 0.1 28.6 6.4 9.1 6.2 1.1 19.3 +/- 18.9
B Not Completed C Not Completed D Not Completed E Not Completed F Not Completed G Not Completed H Not Completed I Not Completed J Not Completed K Not Completed L Not Completed M Not Completed N Not Completed O Not Completed
All Blocks Not Completed

October 6, 2008 Page 26 of 31 Block A LiDAR 3rd Party Quality Assessment Report HEI Project No. 4875-002
Table 4. Vertical Accuracy Statistics for MnDNR Checkpoints in Block A across all Land Classes
RMSE(z) (cm) Minimum
(cm) Median
(cm) Mean (cm)
Maximum (cm)
95% CI (cm)
No. of Checkpoints
10.5 -28.6 -6 5.3 12.9 +/- 18.9 69
Table 5. Vertical Accuracy Computations by MnDNR Checkpoint in Block A
Block A MnDNR Survey Checkpoints (UTM 14 NAD83, NAVD 88) LiDAR
Elevations Results
Point ID X Coord Y Coord Z Elev.
(m) Landuse Class *Z from
LiDAR (m) Delta Z
(m)
Absolute Difference
(cm) Kittson-2101 631145.989 5429059.121 241.061 Brush, Low Trees 241 0.061 6.1 Kittson-2102 631195.385 5428969.468 241.492 Urban 241.311 0.181 18.1 Kittson-2103 632063.605 5425720.784 242.507 Forested 242.554 -0.047 4.7 Kittson-2104 632171.078 5426555.719 242.058 Low Grass, Bare Earth 241.996 0.062 6.2 Kittson-2201 636975.213 5381686.277 242.962 Forested 242.811 0.151 15.1 Kittson-2202 636994.091 5381565.105 243.152 Urban 243.006 0.146 14.6 Kittson-2203 638504.067 5378474.644 243.454 High Grass, Weeds, Crops 243.344 0.11 11 Kittson-2204 639678.525 5381726.302 245.348 Low Grass, Bare Earth 245.363 -0.015 1.5 Marshall-3301 640699.885 5339528.579 246.125 Brush, Low Trees 246.283 -0.158 15.8 Marshall-3302 639257.518 5339342.037 247.035 High Grass, Weeds, Crops 247.072 -0.037 3.7 Marshall-3303 639283.944 5339357.992 246.283 Low Grass, Bare Earth 246.243 0.04 4 Marshall-3304 638471.748 5340338.042 245.879 Forested 245.771 0.108 10.8 Marshall-3305 638824.878 5339872.75 246.104 Urban 246.074 0.03 3 *Note: Z from LIDAR was extracted using Coherent's LP360 software using the TIN method. Elevations were extracted from the Bare Earth LAS files.

October 6, 2008 Page 26 of 31 Block A LiDAR 3rd Party Quality Assessment Report HEI Project No. 4875-002
October 6, 2008 Page 27 of 31 Block A LiDAR 3rd Party Quality Assessment Report HEI Project No. 4875-002
RRBMI Chain of Custody Form
Project Name: RRBMI Block A QAQC Priority Area: 1 Block: A # Tiles in Block: 2336
LiDAR Production Company: Fugro-Horizons Horizontal Coord: UTM 14 NAD83 Vertical Datum: NAVD 88
Coorespondence Note Recd./Checked By: Date Correspondence Ref. # Pass
Initial Delivery of LiDAR products for Block BCF 8/29/2008 Y QC check for file completeness BCF 9/3/2008 Still need metadata and final report Y QC check for proper naming conventions and
completeness RAW LIDAR (LAS Files) BCF 9/4/2008 Y Filtered Bare Earth Data (LAS Files) BCF 9/4/2008 Y Bare Earth DEM 1meter (ASCII GRID Files) BCF 9/4/2008 Y 1st Return LIDAR (LAS Files) BCF 9/4/2008 Y
Metadata Record Did not receive metadata file for Block A N
LIDAR Report BCF 9/26/2008 Y Survey Report BCF 9/4/2008 Y Flight Logs and JPEGs BCF 9/4/2008 Y CEO Requirement Files BCF 9/4/2008 Y Hybrid Images (TIFF Files) BCF 9/4/2008 Y
Vertical Accuracy Assessment BCF 9/10/200869 points assessed with RMSE of 9.6 cm Y
Visual QA/QC Assessment Data Voids SW 9/26/2008 Y Classification Issues SW 9/26/2008 Y Anomalies SW 9/26/2008 Y Flight Line Seams SW 9/26/2008 6 visual seams observed N
Metadata Review Not Available LIDAR Report Review BCF 9/26/2008 Y Pass/Fail Notice Given to LiDAR Vendor TBD Final LiDAR Products Archived on External Hard Drive TBD Final LiDAR Products Sent to USGS for Dissemination TBD
Appendix A. Chain of Custody Form

October 6, 2008 Page 28 of 31 Block A LiDAR 3rd Party Quality Assessment Report HEI Project No. 4875-002
Tile: 06565408 (Incorrect classification)
Tile: 05965396 (Small Data Void)
Tile: 06605414 (Area shown above) Tile: 06565408 (Area shown above)
Tile: 06605414 (Incorrect classification)
Appendix B. Visual Assessment Screenshots

October 6, 2008 Page 29 of 31 Block A LiDAR 3rd Party Quality Assessment Report HEI Project No. 4875-002
Tile: 06685358 (Possible poor LiDAR penetration)
Tile: 06425348 (Incorrect classification)

October 6, 2008 Page 30 of 31 Block A LiDAR 3rd Party Quality Assessment Report HEI Project No. 4875-002
Seams
Tile: 06445362 Tile: 06425362
Tile: 06185362 Tile: 05945372
Tile: 06485362 Tile: 06265362

October 6, 2008 Page 31 of 31 Block A LiDAR 3rd Party Quality Assessment Report HEI Project No. 4875-002
Appendix C. CD-ROM containing an ESRI Shapefile of HEI Checkpoints and Photos

� Page 1 of 2
Date: October 15, 2008
To: Chuck Fritz
Cc: Brian Fischer
Gregg Thielmann
File 4875-002
During the Quality Assurance (QA) review process for Block A, staff from Houston Engineering, Inc.
(HEI) identified a potential visual anomaly within the bare earth elevation data. The potential anomaly
consisted of a “step” in the bare earth LiDAR data along the flight lines within select tiles (see Appendix B
of the QA report). Although the Block A data attained the 15 cm RMSE(z) vertical accuracy criteria within
your contract with Fugro / Horizons, HEI included a description of the anomaly within the Block A QA
report.
During our conference call with representatives from Fugro / Horizons, the U.S. Army Corps of Engineers,
HEI and you on Friday, October 10th, we discussed the potential anomaly. Fugro / Horizon’s staff indicated
that a “consistent step” or elevation along the flight line suggests a processing issue (i.e., a consistent error),
while a longitudinally diminishing step (decreasing elevation) suggests instrument drift during collection
(because of the long flight lines). It is important to note that the magnitude of the step is generally less than
20 cm, near the magnitude of the 3 standard deviation criteria established for “blunders” and is noticeable in
the data in part because of the lack of relief within the collect area. Fugro / Horizon’s agreed to adjust the
deliverable for the tiles associated with flight lines 31, 32, and 33 of Block A during the conference call
because of a consistent step, but advised that adjusting tiles within a diminishing step will result in
adjustments to the elevations elsewhere within the tile.
Based upon our conference call, we recommend the following:
• Fugro / Horizon’s adjust the bare earth elevations for the tiles associated with flight lines 31, 32, and
33 of Block A based on the presence of a systematic step;
• Fugro / Horizon’s should not adjust the elevations for the tiles associated with the remaining flight
lines within Block A because of the presence of a diminishing step;
• The presence of the diminishing step be acknowledged for consideration during use of the data by
the end user, either through the metadata or through use of the QA report;
• Fugro / Horizon’s consider establishing a criteria for the maximum allowable (systematic) step
increase for use in processing subsequent tiles (perhaps a value near the blunder criteria); and
• Our QA report be considered amended by the Memorandum.
6901 E. Fish Lake Rd. Ste. 140 Maple Grove, MN 55369-5455
Ph. (763) 493-4522 Fax (763) 493-5572
External Correspondence
Houston Engineering, Inc.
From: Mark Deutschman, Ph.D., P.E.
Project Manager
Subject: Block A Quality Assurance Review
Addendum to QA Report

� Page 2 of 2
Please be advised that per your contract with Fugro / Horizons they are under no contractual obligation to
remove the systematic step. I appreciate their willingness to discuss the step issue and volunteering to
reprocess select tiles, which I believe reflects their commitment to providing the best possible product.