beverages africa - wesgro africa beverages.pdf · beverages africa ... the united kingdom was the...
TRANSCRIPT

Beverages Africa
Executive Summary
This sector fact sheet provides key trade and investment related statistics for the beverages sector. Specifically, it
shows global trade and investment flows including an analysis of top markets and products for South Africa and
the Western Cape in relation to Africa for the beverages sector. The key highlights in Africa’s beverages sector are
provided below:
Trade
Largest Africa beverage exporters:
South Africa: ZAR13.8bn (59.67% share) of African beverage exports;
Zambia: ZAR2.1bn (8.98% share); and
Namibia: ZAR2bn (8.72% share).
Largest African beverage importers:
South Africa: ZAR6.3bn (17.11% share) of African beverage imports;
Angola: ZAR6.1bn (14.50% share); and
Nigeria: ZAR4.5bn (3.37% share).
Africa’s beverage trade in 2013 amounted to ZAR13.1bn, growing by 35%, the leading traded products were:
Wine of fresh grapes (38% share);
Spirits, liqueurs, other spirit beverages, alcoholic preparations (20% share); and
Non-alcoholic beverages (excl. water, fruit or vegetable juices) (13% share).
South Africa exported beverages to the value of ZAR3.6bn in 2013 to Africa, growing by 27% from the
previous year.
Spirits, liqueurs, other spirit beverages, alcoholic preparations (ZAR10.3bn) were the largest beverage import
into Africa and accounting for 28% of beverages. These were mainly exports of whiskies, rum, vodka and
liqueurs.
Grape wines (ZAR821.1m) were South Africa’s largest beverage export to Africa. The Western Cape was
responsible for 76% of this export.
The Western Cape was responsible for 40% of South Africa total exports of beverages to Africa. In 2013,
Africa was the province’s second largest beverage export market after Europe.
Foreign Direct investment
Between January 2003 and July 2014, Africa received a total of 115 FDI projects into its beverage sector.
These projects represent a total capital investment of ZAR65bn.
The United Kingdom was the largest investor into the African beverages sector, followed by the United States
and the Netherlands. These were also the leading nations into the global beverage sector. South Africa is
currently the 4th largest investor into the African beverages sector.
The majority of outward investment into the global beverages sector was from South Africa into other African
countries.
Outward investment from South Africa to the African beverages market was mainly concerned with
manufacturing activities.
Stellenbosch-based Distell was responsible for all beverage sector investment from the Western Cape. The
group invested into 4 projects since 2006 amounting to ZAR2.75bn and created a total of 670 jobs.
2
Contents
1. Sector Overview .................................................................................................................................. 3
1.1 Global overview .................................................................................................................................. 3
1.2 African beverage overview ................................................................................................................ 4
1.2.1 Beer ....................................................................................................................................................... 4
1.2.2 Wine ...................................................................................................................................................... 4
1.2.3 Recent developments in the African beverage industry ................................................................ 5
2. Trade ..................................................................................................................................................... 6
2.1 African trade of beverages ................................................................................................................ 6
2.2 South African beverage trade ........................................................................................................... 9
2.3 Western Cape beverage trade with Africa .................................................................................... 11
3. Foreign Direct Investment (FDI) ..................................................................................................... 13
3.1 Global FDI into the African beverages .......................................................................................... 13
3.2 African FDI in the global beverage sector ..................................................................................... 16
3.3 South African investment into the African beverages market .................................................... 17
3.3.1 Outward investment from South Africa to the African beverages market ................................. 17
3.4 Western Cape FDI ............................................................................................................................ 17
3.4.1 Outward investment Western Cape to the African beverages market ...................................... 17

3
1. Sector Overview
1.1 Global overview
Global beverage sales have been driven by alcoholic drinks followed closely by soft drinks, these two segments
are projected to grow at a considerable rate in the near future. America and Western Europe are drinking less
mainstream beer on average, the wider beer industry seems to have been re-invigorated by the success of craft
beer, which as an industry has had more success in capturing the evolution of consumers' tastes and preferences.
The ability of craft beer to register sales growth despite this trend reflects its favourable performance.
While commercial beer is on the decline in developed countries, beer has generally done quite well across most of
the big developing economies over recent years (with the exception of Russia), which has been supported
SABMiller's emerging-markets-centric business. While the average Sub-Saharan African and Asian consumer is
either drinking more beer or drinking more expensive beer, the average Western European is drinking less beer
than in recent years. Premium whisky has been alcohol's best performing global areas over the past few years. It
is no surprise that global spirits giants Diageo and Pernod Ricard are increasing their investment into whisky.
Premium blends of Scotch whisky are particularly popular in countries such as China and India.
Global Long-Term Beverage Outlook
Whisky, particularly Scotch whisky, will be outperformers in global premium spirits while energy drinks will
provide considerable opportunities globally, (Business Monitor International, 2014).
Bottled water, juices and energy drinks will be outperformers in global soft drinks.(Business Monitor
International, 2014).
Government legislation will play an increasing role in marginalising unhealthy beverage products.
Governments will increasingly pursue alcohol as an effective means of raising revenue through higher
taxes.
Companies with strong emerging market exposure will largely continue to outperform in sales growth,
although the best opportunities may now be beyond the BRIC countries of Brazil, Russia, India and China.
Emerging-market-based firms will increasingly pursue developed-market investments for the purposes of
diversification and access to stellar brands.
Source: Euromonitor, 2012
2007 2008 2009 2010 2011 2012 2013 2014 2015 2016
Soft Drinks (USDm) 380 131 415 569 414 351 450 551 498 389 531 248 562 085 595 390 630 431 667 548
Hot Drinks (USDm) 88 614 98 866 98 774 109 143 125 920 133 972 141 533 149 761 158 260 167 470
Alcoholic Drinks (USDm) 491 924 539 475 526 444 564 820 612 416 644 415 677 054 714 096 754 851 802 004
0
200
400
600
800
1 000
1 200
1 400
1 600
1 800
Valu
e (
US
Dbn)
GLOBAL BEVERAGE RETAIL VALUE RSP, 2007-2016
4
1.2 African beverage overview
1.2.1 Beer
Due to a predominantly young population, rising incomes across the region, and an increasing national self-
confidence, Africa is primed to be a huge target market for the beverage industry. Africa’s emerging middle class
will be the largest trade opportunity for the world’s beverage industry over the next two decades. Producers of
alcoholic beverages, brewers in particular, stand to benefit from the growing consumer market in Africa as more
people on the continent move into higher income groups where resultantly there is a strong growth potential in the
African market as more people move from home-brewed beer and spirits to commercially produced alcohol
(Moody’s 2013)
The beer market in Africa currently represents only 5% of worldwide volumes with four players controlling more
than 80% of the market ;SABMiller plc, Diageo plc, Heineken NV and Castel Group. They have all obtained a first-
mover advantage among brewers operating in the continent. Nigeria is one of the largest Guinness markets in the
world for Diageo, and Sub-Saharan Africa is SABMiller's fastest-growing region. In the premium segment, the
Heineken brand is showing a higher rate of organic growth in Africa and the Middle East than the company's total
volume growth in the region. The overall profitability of alcoholic beverage companies' African operations is high
and most should benefit from continued growth in the premium segment.
Brewers are also using lower-priced alternatives to barley, such as sorghum or cassava, to produce beer tailored
to the local market. The use of locally grown raw materials has in some cases enabled companies to lower excise-
taxes, allowing them to reduce production costs and ensure affordability without lowering profit-margins.
Short term profits could however be limited by potential disruptions in the supply chain including a still-fragile
macroeconomic environment where countries may be subject to exogenous shocks, and regional droughts that
may severely hamper harvests. The large investment needed to run a number of small, regional breweries has
also led to significant cash outlays for brewers in the past. Furthermore, brewing capacity is a constraint and high
capital expenditure is likely to be a drag on free cash flow generation over the next 2-3 years (BancABC, 2013)
1.2.2 Wine
Wine producing regions in Africa
Central Africa
In Tanzania, organic wine is produced at 1100m above sea level, resulting in quality wines with intense bouquets
and personality. The wines are virtually free of acetic acidity, thanks to the optimal conditions in which the grapes
ripen.
Eastern Africa
Tej, also known as honey wine, is a unique drink only common to Ethiopia and Eritrea.
Northern Africa
Given Morocco and Tunisia’s Mediterranean climate, including abundant sun and dry air, it provides ideal
conditions for wine production. Following traditions in French winemaking, vintners have produced a unique and
flavourful assortment of wines. The countryside around Meknes, in the middle Atlas foothills of Morocco, produces
popular and impressive wines.
Western Africa
Palm wine is an incredibly important and popular beverage in West Africa that is consumed by more than 10 million
people. Most palm wine is made from raphia palms. It is normally consumed in a variety of flavours (ranging from
sweet to sour.) In Nigeria, these delicious wines are most popularly known as Emu or Ogogora while in Ghana,
palm wine is affectionately known as Nsafufuo.
Southern Africa
Southern Africa’s primary wine market, South Africa, the 8th largest wine producing country in the world, is the
continent’s leader in terms of quality and volume. Over 100,000 hectares of land is used for wine production. South
Africa’s wines come from the Western Cape region.

5
1.2.3 Recent developments in the African beverage industry
In 2014, beverage giant SABMiller, Gutsche Family Investments (GFI) and the Coca-Cola company have come to
an agreement to combine the bottling operations of their non-alcoholic ready-to-drink beverages businesses in
Southern and East Africa. This merger has led to the formation of Coca-Cola Beverages Africa. The newly formed
entity will service 12 high-growth countries that make up 40% of all Coca-Cola beverage volumes in Africa
(SABMiller, 2014).
In its initial stages Coca-Cola Beverages Africa will manufacture and distribute Coca-Cola beverages in nine
countries: South Africa, Kenya, Ethiopia, Mozambique, Tanzania, Uganda, Namibia, the Comoros and Mayotte.
SABMiller’s Swaziland soft drinks businesses and Zambia- and Botswana-based subsidiaries will be added. This
will also include the acquisition of or licensing rights for an additional 19 non-alcoholic ready-to-drink brands owned
by SABMiller and available in Africa and Latin America.
As one of the top 10 largest Coca-Cola bottling partners worldwide, Coca-Cola Beverages Africa can leverage the
scale, resources, capability and efficiency needed to accelerate Coca-Cola’s growth, and contribute to the
economic and social prosperity of African communities.
SABMiller Chief Executive Alan Clark said the soft drinks market is a significant part of the group’s growth strategy.
“This transaction increases our exposure to the total beverage market in Africa. The opportunity is significant, with
favourable demographics and economic development pointing to excellent growth prospects.”
According to Sharenet (2015), Ethiopian Greenfield brewer Habesha, majority-owned by Dutch brewer Bavaria NV,
said it plans to start selling beer in the second quarter of this year to tap rising domestic demand that has attracted
global brands. Bavaria NV is the latest beer maker lured by Ethiopia's expanding middle class over the last five
years and will compete with breweries owned by Heineken and Diageo.
The world’s leading brewers have turned their focus on emerging markets such as Africa as consumer demand in
Europe has stagnated and the United States offers limited expansion opportunities.
Ethiopia’s average annual beer consumption of less than five litres per capita is about half the average for sub-
Saharan Africa, excluding South Africa, offering scope for expansion among the population of 94 million. Bavaria
NV bought a stake in Habesha Breweries in 2012, and has since increased its holding to 60 percent. Habesha's
plant in Debre Birhan, will have a capacity to produce 350,000 hectolitres once it is completed, although production
will start before then. Heinekens USD130 million brewery near Addis Ababa is the largest in Ethiopia with a capacity
of 1.5 million hectolitres. The Dutch firm also owns the Bedele and Harar breweries it purchased from the state for
a combined USD163 million in 2011.

6
2. Trade
2.1 African trade of beverages
Since 2006 Africa has been a net importer of beverages and recovered successive trade deficits. These deficits
are the result of the lack of production capacity on the African continent to meet the growing demand. Demand is
set to continue to outstrip supply for the foreseeable future as countries’ young populations become more
developed and urbanized, leading to readymade beverages to be increasingly demanded. Africa showed
encouraging signs in its export potential with exports increasing by 35%.
Source: TradeMap, 2015
With its well developed and self-sufficient beverage market, South Africa is the largest exporter of beverages in
Africa and its exports amounted to 60% imports of African exports. Zambia’s beer market has experienced
considerable growth in the past few years. This is evident in Zambia’s ranking as the second largest exporter as
exports grew by a resounding 5000%. Namibia completed the top 3 export markets exporting beverages to the
value of ZAR2bn in 2015. The common denominator between the 3 markets is the presence of large brewing
companies namely South African breweries, Zambian Breweries and Namibian breweries.
As with imports, South Africa was Africa’s the largest import market, importing 18% of all Africa’s beverages which
equates to ZAR6.3bn. With the presence of most beverage segments in the South African markets, spirit imports
would constitute the majority of its imports. Angola was the second largest export market in 2013. With one of the
largest growing economies in Sub Saharan Africa, Angola has an ever growing demand for all basic food stuffs
due to shortage of manufacturing and bottling plants. The largest economy in Africa, Nigeria, was the third largest
import market, its imports however grew the least within the top import markets.
2004 2005 2006 2007 2008 2009 2010 2011 2012 2013
Exports (ZARm) 6 165,5 7 294,1 7 004,8 9 355,3 12 970,6 13 734,9 14 862,9 15 435,2 17 148,5 23 099,0
Imports (ZARm) 5 794,0 6 525,2 9 120,4 13 553,4 16 910,7 17 558,2 17 918,5 21 650,9 29 813,5 36 778,0
Trade Balance (ZARm) 371,5 769,0 -2 115,6 -4 198,1 -3 940,1 -3 823,3 -3 055,7 -6 215,7 -12 665,1 -13 679,0
-20 000
-10 000
0
10 000
20 000
30 000
40 000
Valu
e (
ZA
Rm
)
AFRICA'S BEVERAGE TRADE, 2004-2013

7
TOP 10 AFRICAN EXPORT MARKETS FOR BEVERAGES, 2013 TOP 10 AFRICAN IMPORT MARKETS FOR BEVERAGES, 2013
RANK
DESTINATION COUNTRY
VALUE 2013 (ZARm)
% GROWTH 2012-2013
% SHARE 2013
RANK DESTINATION
MARKETS
VALUE 2013
(ZARm)
% GROWTH 2012-2013
% SHARE
2013
1 South Africa 13 782.60 32.20% 59.67% 1 South Africa 6 292.5 17.97% 17.11%
2 Zambia 2 073.32 5029.57% 8.98% 2 Angola 6 080.9 14.50% 16.53%
3 Namibia 2 015.16 2.29% 8.72% 3 Nigeria 4 527.6 3.37% 12.31%
4 Uganda 576.64 20.14% 2.50% 4 Namibia 1 873.9 47.50% 5.10%
5 Ghana 467.36 99.94% 2.02% 5 Ghana 1 243.6 22.36% 3.38%
6 Tunisia 426.95 29.07% 1.85% 6 Equatorial Guinea 1 118.3 35.96% 3.04%
7 Kenya 419.08 -9.31% 1.81% 7 Democratic Republic of the Congo
1 058.9 128.85% 2.88%
8 Togo 372.90 116.76% 1.61% 8 Libya 1 010.6 34.00% 2.75%
9 Egypt 334.46 -12.07% 1.45% 9 Algeria 923.0 49.27% 2.51%
10 Algeria 330.72 24.67% 1.43% 10 Egypt 838.5 38.96% 2.28%
TOTAL EXPORTS 23 099.02 100.00% 34.70% TOTAL EXPORTS 36 778.0 23.36% 100.00%
Source: TradeMap, 2015
Largely due to South Africa’s prowess in viticulture and wine make, wine from fresh grapes (ZAR8.9bn) was the
largest beverage export from Africa. The wine exports were mainly of fortified wines and grape wines. Spirits,
liqueurs, other spirit beverages, alcoholic preparations (ZAR4.5bn) (mainly liqueurs and cordials) and non-alcoholic
beverages (excl. water, fruit or vegetable juices) were the second and third largest exports.
Spirits, liqueurs, other spirit beverages, alcoholic preparations (ZAR10.3bn) were the largest beverage import into
Africa and accounting for 28% of beverages. Non-alcoholic beverages (excl. water, fruit or vegetable juices)
(ZAR7.9bn) were the second largest import and the only beverage product to experience a decline in imports.
Growing by 17%, beer made from malt (ZAR6.8bn) was the 3rd largest import, as African consumers move from
home produced beers to commercially produced, this number is set to increase and South African brewers with its
footprint in most African countries, is perfectly placed to take advantage of this. South Africa also has a comparative
advantage in producing wines and would do well to forge relationships with local suppliers and reduce red tape to
expand its supply into African countries. In this instance, companies like Distell come to mind as incomes increase
and the middle class starts to swell there are opportunities for shift exports from bulk wine to premium brands.
AFRICA’S EXPORTS OF BEVERAGES, 2013 AFRICA’S IMPORTS OF BEVERAGES, 2013
RANK HS
CODE PRODUCT
VALUE 2013
(ZARm)
% GROWTH 2012-2013
RANK HS
CODE PRODUCT
VALUE 2013
(ZARm)
% GROWTH 2012-2013
1 2204 Wine of fresh grapes 8 887.3 34.39% 1 2208 Spirits, liqueurs, other spirit beverages, alcoholic preparations
10 266.4 50%
2 2208 Spirits, liqueurs, other spirit beverages, alcoholic preparations
4 546.9 114.84% 2 2202 Non-alcoholic beverages (excl. water, fruit or vegetable juices)
7 872.9 -1%
3 2202 Non-alcoholic beverages (excl. water, fruit or vegetable juices)
3 046.8 55.74% 3 2203 Beer made from malt 6 817.8 17%
4 2203 Beer made from malt 2 911.3 15.25% 4 2204 Wine of fresh grapes 6 455.7 47%
5 2207 Ethyl alcohol & other spirits (if undenatured then higher than 80% by
2 358.6
19.72% 5 2207 Ethyl alcohol & other spirits (if undenatured then higher than 80% by
3 476.5 9%
6 2206 Fermented beverages, nes
1 165.2 -5.70% 6 2206 Fermented beverages 1 268.9 12%
7 2201 Mineral & aerated waters 164.8 -77.00% 7 2201 Mineral & aerated waters
475.7 21%
8 2205 Vermouth & other grape wine flavoured with plants or aromatic substances
18.1
26.92% 8 2205 Vermouth & other grape wine flavoured with plants or aromatic substances
144.2
43%
TOTAL EXPORTS 23 099.0 34.70% TOTAL IMPORTS 36 778.0 23.3
Source: TradeMap, 2015

8
The top export products to each of the top 5 export markets are listed below:
South Africa
Wine of fresh grapes (ZAR1129.7m)
Spirits, liqueurs, other spirit beverages, alcoholic preparations (ZAR1035.1m)
Non-alcoholic beverages (excl. water, fruit or vegetable juices) (ZAR813.8m)
Zambia
Spirits, liqueurs, other spirit beverages, alcoholic preparations (ZAR356.4m)
Non-alcoholic beverages (excl. water, fruit or vegetable juices) (ZAR189.4m)
Wine of fresh grapes (ZAR47.5m)
Namibia
Beer made from malt (ZAR1427.5m)
Fermented beverages, (ZAR266.4m)
Spirits, liqueurs, other spirit beverages, alcoholic preparations (ZAR202.8m)
Uganda
Beer made from malt (ZAR226.8m)
Non-alcoholic beverages (excl. water, fruit or vegetable juices) (ZAR218.9m)
Spirits, liqueurs, other spirit beverages, alcoholic preparations (ZAR64.8m)
Ghana
Spirits, liqueurs, other spirit beverages, alcoholic preparations (ZAR341.4m)
Ethyl alcohol & other spirits (if undenatured then higher than 80% ) (ZAR106.8m)
Non-alcoholic beverages (excl. water, fruit or vegetable juices ) (ZAR9.4m)

9
2.2 South African beverage trade
South Africa’s beverage trade has been characterised by a positive trade balance for the past ten years backed by
strong export performance. As the most developed economy in Africa, South Africa is globally competing and
established companies, manufacturing plants and distribution channels are represented in most beverage
segments. In 2014, South Africa recorded its largest export surplus as a result of a 27 % growth in exports with
imports remaining subdued.
Source: Quantec, 2015
The table below shows South Africa’s top African export destination markets for beverages. These markets
accounted for ZAR2.3bn of South Africa’s beverage exports equating to 65% of total exports to Africa. The amounts
shaded in grey represent the country that imported the largest amount of that particular product. Angola was the
largest importer of three of South Africa’s beverage products with Mozambique importing the largest amount of
malt made beer.
SOUTH AFRICA'S TOP 5 BEVERAGE AFRICAN EXPORT DESINATIONS AND PRODUCTS
PRODUCT (HS:4) ANGOLA (ZARm)
MOZAMBIQUE (ZARm)
NIGERIA (ZARm)
ZAMBIA (ZARm)
ZIMBABWE (ZARm)
Liqueur, spirits and undenatured ethyl alcohol <80%
223.18 46.25 58.24 83.42 45.11
Grape wines(including fortified), alcoholic grape must
161.81 113.28
86.70 58.25 34.37
Fermented beverages nes (eg cider, perry, mead) 139.77 45.47 6.23 41.33 25.47
Ethyl alcohol, undenatured and > 80%, or denatured
24.23 42.46 98.18 71.52 11.87
Waters, non-alcoholic sweetened or flavoured beverages
12.13 62.56 0.92 115.74 252.03
Unsweetened beverage waters, ice and snow 2.11 3.64 0.01 2.28 5.47
Beer made from malt 0.00 345.21 0.00 74.15 26.30
Vermouth and other flavoured grape wine - 0.10 0.99 0.06 0.06
TOTAL 563.22 658.96 251.28 446.75 400.68
Source: Quantec, 2015
Unsurprisingly grape wines (ZAR821.1m) were the largest exports from South Africa, this is mainly to the nation’s
prowess in production. Waters, non-alcoholic sweetened or flavoured beverages (ZAR745.5m) and ethyl alcohol,
undenatured and > 80%, or denatured (ZAR610.3m) were the second and third largest exports. Barring exports of
liqueur, spirits and undenatured ethyl alcohol <80% and fermented beverages, most of South Africa’s beverage
exports experience healthy growth. Exports of vermouth and other flavoured grape wine grew the strongest in
2013, Africa is currently South Africa’s second largest export market for this product. Nigeria, Kenya and Congo
imported the lion’s share of vermouth and other flavoured grape wine from South Africa.
2005 2006 2007 2008 2009 2010 2011 2012 2013 2014
Exports (ZARm) 726,6 739,7 1 052,0 1 772,9 1 917,3 2 292,1 2 000,5 2 390,7 2 799,4 3 556,2
Imports (ZARm) 14,0 21,4 13,7 36,7 38,3 68,4 57,9 67,8 86,5 87,9
Trade Balance (ZARm) 712,6 718,3 1 038,3 1 736,2 1 879,0 2 223,7 1 942,6 2 322,9 2 712,9 3 468,3
0
500
1 000
1 500
2 000
2 500
3 000
3 500
4 000
Valu
e (
ZA
Rm
)
SOUTH AFRICAN TRADE OF BEVERAGES WITH AFRICA, 2005-2014
10
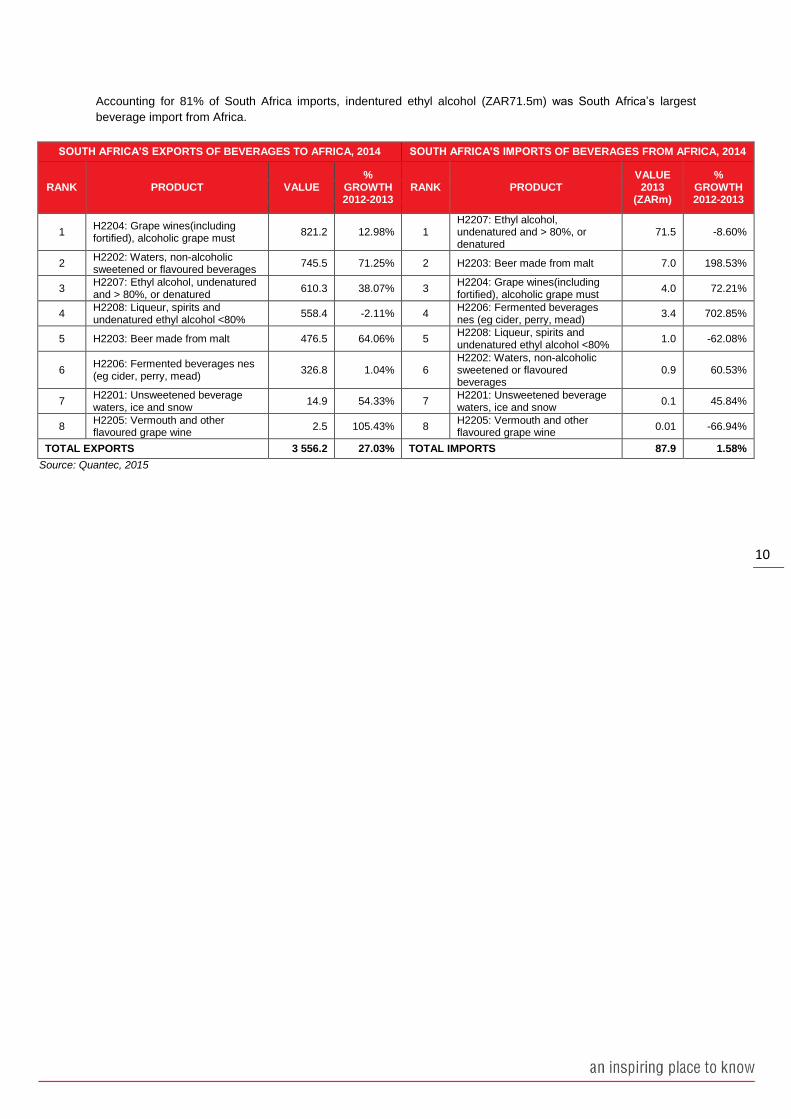
Accounting for 81% of South Africa imports, indentured ethyl alcohol (ZAR71.5m) was South Africa’s largest
beverage import from Africa.
SOUTH AFRICA’S EXPORTS OF BEVERAGES TO AFRICA, 2014 SOUTH AFRICA’S IMPORTS OF BEVERAGES FROM AFRICA, 2014
RANK PRODUCT VALUE %
GROWTH 2012-2013
RANK PRODUCT VALUE
2013 (ZARm)
% GROWTH 2012-2013
1 H2204: Grape wines(including fortified), alcoholic grape must
821.2 12.98% 1 H2207: Ethyl alcohol, undenatured and > 80%, or denatured
71.5 -8.60%
2 H2202: Waters, non-alcoholic sweetened or flavoured beverages
745.5 71.25% 2 H2203: Beer made from malt 7.0 198.53%
3 H2207: Ethyl alcohol, undenatured and > 80%, or denatured
610.3 38.07% 3 H2204: Grape wines(including fortified), alcoholic grape must
4.0 72.21%
4 H2208: Liqueur, spirits and undenatured ethyl alcohol <80%
558.4 -2.11% 4 H2206: Fermented beverages nes (eg cider, perry, mead)
3.4 702.85%
5 H2203: Beer made from malt 476.5 64.06% 5 H2208: Liqueur, spirits and undenatured ethyl alcohol <80%
1.0 -62.08%
6 H2206: Fermented beverages nes (eg cider, perry, mead)
326.8 1.04% 6 H2202: Waters, non-alcoholic sweetened or flavoured beverages
0.9 60.53%
7 H2201: Unsweetened beverage waters, ice and snow
14.9 54.33% 7 H2201: Unsweetened beverage waters, ice and snow
0.1 45.84%
8 H2205: Vermouth and other flavoured grape wine
2.5 105.43% 8 H2205: Vermouth and other flavoured grape wine
0.01 -66.94%
TOTAL EXPORTS 3 556.2 27.03% TOTAL IMPORTS 87.9 1.58%
Source: Quantec, 2015

11
2.3 Western Cape beverage trade with Africa
The province’s beverage trade mirrors that of South Africa. The Western Cape has been a strong exporter of
beverages to Africa for the past ten years and has continually maintained a trade surplus. In 2013, provincial
exports reached their peak by growing by 36% from 2012 while imports declined by 88%.
The Western Cape was responsible for 40% of South Africa’s total exports of beverages to Africa. In 2013, Africa
was the province’s second largest beverage export market after Europe.
Source: Quantec, 2015
The table below shows the Western Cape’s top African export destinations markets for beverages. These markets
accounted for ZAR1.1bn of the province’s beverage exports equating to 75% of total exports to Africa. With the
exception of Kenya, the province has the same top export destinations as South Africa. Western Cape beverages
seem to be well received by the Angolan market as it is the largest importer across most beverages categories.
The Western Cape has an export advantage with its proximity to the West African market, it is also encouraging to
see that the province is making inroads into east Africa.
WESTERN CAPE'S TOP 5 BEVERAGE AFRICANEXPORT DESTINATIONS AND PRODUCTS
PRODUCT (HS:4) ANGOLA (ZARm)
KENYA (ZARm)
MOZAMBIQUE (ZARm)
NIGERIA (ZARm)
ZIMBABWE (ZARm)
Grape wines(including fortified), alcoholic grape must 150.77 93.05 33.08 105.96 31.54
Liqueur, spirits and undenatured ethyl alcohol <80% 298.68 28.64 22.17 54.81 19.25
Fermented beverages nes (eg cider, perry, mead) 159.57 0.89 12.67 14.24 15.41
Waters, non-alcoholic sweetened or flavoured beverages
9.58 0.02 6.02 0.38 7.12
Beer made from malt 0.01 - 0.42 0.00 0.74
Unsweetened beverage waters, ice and snow 2.22 0.16 0.71 0.02 0.05
Vermouth and other flavoured grape wine 0.05 0.04 0.02 0.02 -
Ethyl alcohol, undenatured and > 80%, or denatured 0.00 - 0.10 - -
TOTAL 620.89 122.80 75.18 175.44 74.10
Source: Quantec, 2015
The Western Cape is South Africa’s largest grape producing region, it is thus unsurprising that grape wines were
the largest beverage export from the province and made up 44% of the province’s exports to Africa. With the
province’s prowess at wine production also comes its brandy and spirit production. The Western Cape is known
for making some of the best brandy’s which compete internationally and some premiums brands like Van Ryns
compete with French made cognac on the quality level.
2004 2005 2006 2007 2008 2009 2010 2011 2012 2013
Exports (ZARm) 170,6 235,1 266,4 400,6 671,8 692,8 850,5 1 084,6 1 134,9 1 412,5
Imports (ZARm) 4,5 10,7 7,1 6,0 11,1 17,4 8,2 9,4 18,6 2,2
Trade Balance (ZARm) 166,1 224,3 259,3 394,6 660,6 675,4 842,3 1 075,1 1 116,3 1 410,3
0
200
400
600
800
1 000
1 200
1 400
1 600
Valu
e (
ZA
Rm
)
WESTERN CAPE BEVERAGE TRADE WITH AFRICA, 2004-2013

12
Subsequently liqueur, spirits and undenatured ethyl alcohol <80% (ZAR474.5m) was the provinces second largest
export. Fermented beverages (ZAR267m) was the third largest exports, cider companies based in the Western
Cape benefit from their access for fresh produce.
As with national imports undenatured liqueur, spirits and ethyl alcohol (ZAR1.8m) was the province’s largest import
in 2013.
WESTERN CAPE’S EXPORTS OF BEVERAGES TO AFRICA, 2013 WESTERN CAPE’S IMPORTS OF BEVERAGES FROM AFRICA, 2013
RANK PRODUCT VALUE
2013 (ZAR)
% GROWTH 2012-2013
RANK PRODUCT VALUE
2013 (ZAR)
% GROWTH 2012-2013
1 H2204: Grape wines(including fortified), alcoholic grape must
620 381 243 27.75% 1 H2208: Liqueur, spirits and undenatured ethyl alcohol <80%
1 847 309 -15%
2 H2208: Liqueur, spirits and undenatured ethyl alcohol <80%
474 463 327 27.67% 2 H2204: Grape wines(including fortified), alcoholic grape must
289 642 -97%
3 H2206: Fermented beverages nes (eg cider, perry, mead)
267 532 373
14.59% 3 H2207: Ethyl alcohol, undenatured and > 80%, or denatured
46 340 -99%
4 H2202: Waters, non-alcoholic sweetened or flavoured beverages
41 409 388
20.51% 4 H2203: Beer made from malt 25 477 17470%
5 H2201: Unsweetened beverage waters, ice and snow
4 280 184 0.74% 5 H2202: Waters, non-alcoholic sweetened or flavoured beverages
18 382 -91%
6 H2203: Beer made from malt 4 178 031 5.41% 6 H2201: Unsweetened beverage waters, ice and snow
731 -3%
7 H2205: Vermouth and other flavoured grape wine
184 868 -85.37%
8 H2207: Ethyl alcohol, undenatured and > 80%, or denatured
117 924 -59.86%
TOTAL EXPORTS 1 412 547 338 24.47% TOTAL IMPORTS 2 227 881 -88%
Source: Quantec, 2015
Below are the Western Cape’s main exported beverages and their national export shares:
Grape wines (including fortified), alcoholic grape must,(ZAR620.4m) accounted for 44% of Western Cape
beverage exports and 76% of all the national exports were produced in Western Cape.
Liqueur, spirits and undenatured ethyl alcohol <80 %,( ZAR474.5m) accounted for 34% of Western Cape
beverage exports and 58% of all the national exports was produced in Western Cape.
Fermented beverages, (ZAR267.5m) accounted for 18.94% of Western Cape beverage exports and 33%
of all the national export was produced in Western Cape.

13
3. Foreign Direct Investment (FDI)
3.1 Global FDI into the African beverages
Between January 2003 and July 2014 a total of 115 FDI projects were recorded into the African beverage sector
from the world. These projects represent a total capital investment of ZAR64.96bn which is an average investment
of ZAR564.76m per project. During the period, a total of 22,755 jobs were created. Global investment into the
sector reached its peak in 2011. With the exception of 2012, Africa has received more than 10 projects since 2008.
Source: FDI Intelligence, 2015
The United Kingdom was the largest investor into the African beverages sector. Investments by British companies
into the sector accounted for 40% of capital expenditure (Capex) and 30% of projects. The United States (26
projects and ZAR9.3bn Capex) and the Netherlands (10 projects and ZAR11.5bn Capex) were the second and
third largest global investors respectively. The same markets were the largest investors into the global beverages
market. With 4 companies responsible for 8 projects and ZAR3.5bn, South Africa was the 4th largest investor in the
African beverage sector. For a country that is on the continent, more needs to be done to get a larger footprint and
influence in more African countries.
SOURCE MARKETS FOR GLOBAL FDI INTO THE AFRICAN BEVERAGES SECTOR JAN 2003-JULY 2014
RANK SOURCE COUNTRY PROJECTS %
PROJECTS CAPEX (ZARm)
% CAPEX
COMPANIES %
COMPANIES
1 United Kngdom 45 39.13% 26 262.60 40.43% 17 30.36%
2 United States 26 22.61% 9 329.10 14.36% 7 12.50%
3 Netherlands 10 8.70% 11 536.60 17.76% 4 7.14%
4 South Africa 8 6.96% 3 496.40 5.38% 4 7.14%
5 Portugal 6 5.22% 3 221.00 4.96% 5 8.93%
6 India 4 3.48% 1 209.20 1.86% 3 5.36%
7 UAE 3 2.61% 550.70 0.85% 3 5.36%
8 Saudi Arabia 3 2.61% 3 035.90 4.67% 3 5.36%
9 Mauritius 1 0.87% 653.80 1.01% 1 1.79%
10 Switzerland 1 0.87% 493.30 0.76% 1 1.79%
Other Countries 8 6.96% 5 171.80 7.96% 8 14.29%
TOTAL 115 100.00% 64 960.40 100.00% 56 100.00%
Source: FDI Intelligence, 2015
2003 2004 2005 2006 2007 2008 2009 2010 2011 2012 2013 2014
Capex (ZARm) 7 937, 2 455, 3 940, 638,6 500,3 10 737 6 839, 4 075, 14 266 3 221, 4 359, 5 988,
Projects 10 5 4 4 2 19 13 11 21 8 11 7
0
5
10
15
20
25
0
2 000
4 000
6 000
8 000
10 000
12 000
14 000
16 000
Pro
jects
Valu
e (
ZA
Rm
)
INWARD FDI INTO AFRICA'S BEVERAGE SECTOR, 2003-JULY 2014
14
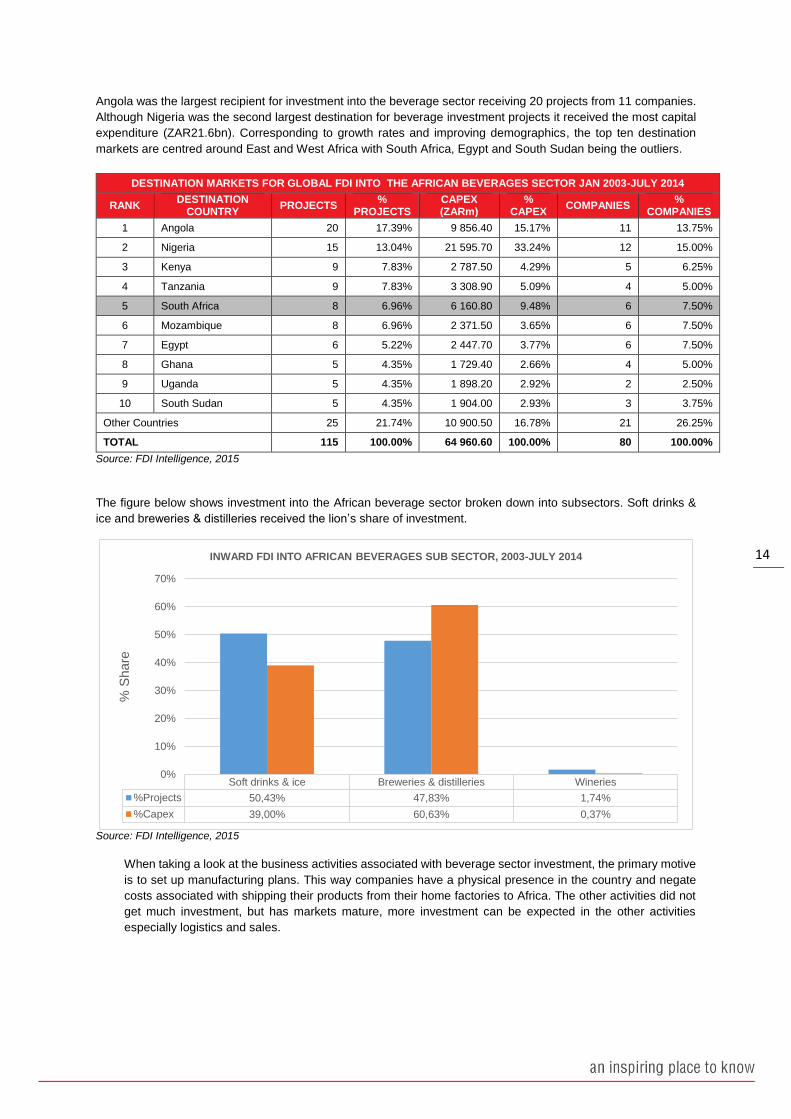
Angola was the largest recipient for investment into the beverage sector receiving 20 projects from 11 companies.
Although Nigeria was the second largest destination for beverage investment projects it received the most capital
expenditure (ZAR21.6bn). Corresponding to growth rates and improving demographics, the top ten destination
markets are centred around East and West Africa with South Africa, Egypt and South Sudan being the outliers.
DESTINATION MARKETS FOR GLOBAL FDI INTO THE AFRICAN BEVERAGES SECTOR JAN 2003-JULY 2014
RANK DESTINATION
COUNTRY PROJECTS
% PROJECTS
CAPEX (ZARm)
% CAPEX
COMPANIES %
COMPANIES
1 Angola 20 17.39% 9 856.40 15.17% 11 13.75%
2 Nigeria 15 13.04% 21 595.70 33.24% 12 15.00%
3 Kenya 9 7.83% 2 787.50 4.29% 5 6.25%
4 Tanzania 9 7.83% 3 308.90 5.09% 4 5.00%
5 South Africa 8 6.96% 6 160.80 9.48% 6 7.50%
6 Mozambique 8 6.96% 2 371.50 3.65% 6 7.50%
7 Egypt 6 5.22% 2 447.70 3.77% 6 7.50%
8 Ghana 5 4.35% 1 729.40 2.66% 4 5.00%
9 Uganda 5 4.35% 1 898.20 2.92% 2 2.50%
10 South Sudan 5 4.35% 1 904.00 2.93% 3 3.75%
Other Countries 25 21.74% 10 900.50 16.78% 21 26.25%
TOTAL 115 100.00% 64 960.60 100.00% 80 100.00%
Source: FDI Intelligence, 2015
The figure below shows investment into the African beverage sector broken down into subsectors. Soft drinks &
ice and breweries & distilleries received the lion’s share of investment.
Source: FDI Intelligence, 2015
When taking a look at the business activities associated with beverage sector investment, the primary motive
is to set up manufacturing plans. This way companies have a physical presence in the country and negate
costs associated with shipping their products from their home factories to Africa. The other activities did not
get much investment, but has markets mature, more investment can be expected in the other activities
especially logistics and sales.
Soft drinks & ice Breweries & distilleries Wineries
%Projects 50,43% 47,83% 1,74%
%Capex 39,00% 60,63% 0,37%
0%
10%
20%
30%
40%
50%
60%
70%
% S
hare
INWARD FDI INTO AFRICAN BEVERAGES SUB SECTOR, 2003-JULY 2014

15
Source: FDI Intelligence, 2015
The table below shows the companies making the most investments into the African beverage sector. Soft drinks
giant, Coca Cola lead the way with 18 projects. However it was the beer companies, SABMiller and Heineken that
there involved in the more capital intensive projects. In this regard Heineken made the largest investment per
project (ZAR1.3bn) amongst the top companies.
COMPANIES INVESTING INTO THE BEVERAGES SECTOR ,2003- JULY 2014
RANK INVESTING COMPANY SOURCE COUNTRY BUSINESS ACTIVITY
PROJECTS CAPEX (ZARm)
1 Coca-Cola United States Manufacturing 18 5 973.40
2 SABMiller UK Manufacturing 12 8 184.40
3 Heineken Netherlands Manufacturing 6 7 742.60
4 Tanzania Breweries Limited (TBL)
Tanzania Manufacturing 6 2 418.40
5 NILE Breweries (NBL) Uganda Manufacturing 4 1 675.50
6 Lonrho Springs UK Manufacturing 4 432.40
7 Distell Group South Africa Manufacturing 4 2 746.50
8 Guinness Nigeria UK Manufacturing 3 3 469.40
9 Coca-Cola Bottling (Luanda) United States Manufacturing 3 1 426.00
10 Zambian Breweries Plc Zambia Manufacturing 2 799.10
TOTAL 115 64 960.70
Source: FDI Intelligence, 2015
ManufacturingSales, Marketing &
Support
Logistics,Distribution &Transportation
HeadquartersDesign,
Development &Testing
%Projects 85,22% 6,96% 4,35% 2,61% 0,87%
%Capex 95,62% 2,58% 0,76% 0,94% 0,11%
0%
20%
40%
60%
80%
100%
% S
ha
reGLOBAL FDI INTO THE AFRICAN BEVERAGES SECTOR BY BUSINESS ACTIVITY 2003 - JULY
2014

16
3.2 African FDI in the global beverage sector
Between January 2003 and July 2014 a total of 14 FDI projects were recorded from Africa into the global beverages
sector. These projects represent a total capital investment of ZAR5.40bn which is an average investment of
ZAR385.49m per project. During the period, a total of 1,711 jobs were created. The majority of their investment
were from South Africa into other African countries. Most of the projects were concerned with manufacturing of
beverages.
OUTWARD FDI FROM AFRICAN COMPANIES INTO THE GLOBAL BEVERAGE SECTOR, 2003- JULY 2014
DATE INVESTING COMPANY
SOURCE COUNTRY
DESTINATION STATE
SUB-SECTOR INDUSTRY ACTIVITY CAPEX (ZARm)
JOBS
Jun-14 Distell Group South Africa Angola Breweries & distilleries Manufacturing 616.3 222
Jun-14 Distell Group South Africa Nigeria Breweries & distilleries Manufacturing 1 713.0 222
Apr-14 Distell Group South Africa Ghana Breweries & distilleries Manufacturing 399.6 222
Sep-13 East Africa Bottling Share
South Africa Ethiopia Soft drinks & ice Manufacturing 152.3 52
Sep-13 East Africa Bottling Share
South Africa Ethiopia Soft drinks & ice Manufacturing 234.3 81
Feb-11 First National Choice South Africa Mozambique Soft drinks & ice Manufacturing 70.3 24
Apr-10 Kasapreko Ghana Nigeria Breweries & distilleries Manufacturing 117.2 40
Jul-08 Bright World South Africa Hong Kong Wineries Logistics, Distribution & Transportation
411.3 92
Apr-08 Phoenix Beverages Mauritius Madagascar Breweries & distilleries Manufacturing 653.8 225
May-06 Kenya Maltings Kenya Uganda Breweries & distilleries Sales, Marketing & Support
222.6 22
Mar-06 Distell Group South Africa Namibia Wineries Logistics, Distribution & Transportation
17.6 4
Feb-05 Lourensford Wines South Africa India Wineries Manufacturing 460.5 199
May-04 Coca-Cola Sabco South Africa Kenya Soft drinks & ice Manufacturing 292.9 300
Jun-03 Specialist Mechanical Engineers (SME)
South Africa UAE Soft drinks & ice Manufacturing 35.2 6
Source: FDI Intelligence, 2015

17
3.3 South African investment into the African beverages market
3.3.1 Outward investment from South Africa to the African beverages market
Between January 2003 and July 2014 a total of 8 FDI projects were recorded from South Africa into the African
beverages sector. These projects represent a total capital investment of ZAR3.50bn which is an average
investment of ZAR437.05m per project. During the period, a total of 1,127 jobs were created. The investment
projects were equally shared among the breweries & distilleries and soft drinks & ice sub sectors. The projects
were mainly concerned with manufacturing activities with the exception of logistics, distribution & transportation for
the investment into wineries.
OUTWARD FDI FROM SOUTH AFRICA TO THE AFRICAN BEVERAGES SECTOR, JANUARY 2003- JULY 2014
DATE INVESTING COMPANY
SOURCE STATE
DESTINATION COUNTRY
SUB-SECTOR INDUSTRY ACTIVITY CAPEX JOBS
Jun-14 Distell Group Western Cape Angola Breweries & distilleries Manufacturing 616.3 222
Jun-14 Distell Group Western Cape Nigeria Breweries & distilleries Manufacturing 1 713.0 222
Apr-14 Distell Group Western Cape Ghana Breweries & distilleries Manufacturing 399.6 222
Sep-13 East Africa Bottling Share
Eastern Cape Ethiopia Soft drinks & ice Manufacturing 152.3 52
Sep-13 East Africa Bottling Share
Eastern Cape Ethiopia Soft drinks & ice Manufacturing 234.3 81
Feb-11 First National Choice
Eastern Cape Mozambique Soft drinks & ice Manufacturing 70.3 24
Mar-06 Distell Group Western Cape Namibia Wineries Logistics, Distribution & Transportation
17.6 4
May-04 Coca-Cola Sabco Eastern Cape Kenya Soft drinks & ice Manufacturing 292.9 300
Source: FDI Intelligence, 2015
*There has not been any recorded fdi into South Africa from African countries
3.4 Western Cape FDI
3.4.1 Outward investment Western Cape to the African beverages market
Stellenbosch-based Distell was responsible of all beverage sector investment from the Western Cape. The group
invested into 4 projects since 2006 amounting to ZAR2.75bn and created a total of 670 jobs. The largest investment
was into Nigeria in 2014 as the company setting up a manufacturing plant for brewing and distilling.
OUTWARD FDI FROM THE WESTERN CAPE INTO AFRICAN BEVERAGES SECTOR, 2003- JULY 2014
DATE INVESTING COMPANY
SOURCE CITY
DESTINATION COUNTRY
SUB-SECTOR INDUSTRY ACTIVITY CAPEX (ZARm)
JOBS
Jun-14 Distell Group Stellenbosch Angola Breweries & distilleries Manufacturing 616.3 222
Jun-14 Distell Group Stellenbosch Nigeria Breweries & distilleries Manufacturing 1 713.0 222
Apr-14 Distell Group Stellenbosch Ghana Breweries & distilleries Manufacturing 399.6 222
Mar-06 Distell Group Stellenbosch Namibia Wineries Logistics, Distribution & Transportation
17.6 4
Source: FDI Intelligence, 2015
*There has not been any recorded fdi into Western Cape from African countries
Distell’s investments into Africa is part of a wider growth strategy which will see an additional facility established in
Angola, Nigeria and Ghana. The plant aims to produce a range of beverages for distribution in within the countries
themselves and neighbouring countries.
Distell has identified Ghana as a growth market and as a potential springboard for further penetration of its brands
in neighbouring Togo, Benin, Burkina Faso and Cote d'Ivoire. Distell Ghana, sees the South-African-based
producer of wines, spirits and ready-to-drinks (RTDs) partnering with Finatrade Group to establish a bottling plant
in Accra. “By pooling our respective skills, Finatrade and Distell is an example of how other African partners should
collaborate for the good of the continent” (Distell, 2014).
For more information on this publication and other Wesgro publications please contact [email protected]. For more
publications like this visit the Wesgro publications portal on our website at http://wesgro.co.za/publications