food and beverages industry, 2009 - statistics south...
TRANSCRIPT
Statistical release P6421
Food and beverages industry, 2009
(Preliminary)
Embargoed until: 2 December 2010
9:00 Enquiries:
User Information Services 012 310 8600/8351

Statistics South Africa P6421
Food and beverages industry, 2009
1
Table of contents
1. Summary of findings for the year 2009 ........................................................................................................................................................................................................2 Figure 1 − Income in the food and beverages industry, 2009...............................................................................................................................................................................2 Figure 2 − Income by enterprise size in the food and beverages industry, 2009..................................................................................................................................................2 Figure 3 − Composition of expenditure in the food and beverages industry, 2009 ...............................................................................................................................................3 Figure 4 − Profit margin in the food and beverages industry, 2009 ......................................................................................................................................................................3 Figure 5 − Capital expenditure on new assets in the food and beverages industry, 2009....................................................................................................................................4 Figure 6 − Employment in the food and beverages industry, 2009 ......................................................................................................................................................................4 Figure 7 − Employment by enterprise size in the food and beverages industry, 2009..........................................................................................................................................5 Figure 8 − Gender ratios in the food and beverages industry, 2009.....................................................................................................................................................................5 2. Tables .............................................................................................................................................................................................................................................................6 Table 1 – Principal statistics in the food and beverages industry, 2009 ...............................................................................................................................................................6 Table 2 – Income in the food and beverages industry, 2009................................................................................................................................................................................7 Table 3 – Income by enterprise size in the food and beverages industry, 2009 ...................................................................................................................................................8 Table 4 – Expenditure in the food and beverages industry, 2009 ........................................................................................................................................................................9 Table 4 – Expenditure in the food and beverages industry, 2009 (concluded) ................................................................................................................................................... 10 Table 5 – Carrying value of assets at the end of the financial year in the food and beverages industry, 2009................................................................................................... 11 Table 6 – Details of assets in the food and beverages industry, 2009 ............................................................................................................................................................... 12 Table 7 – Details of liabilities and owners’ equity in the food and beverages industry, 2009.............................................................................................................................. 13 Table 8 – Capital expenditure on new assets in the food and beverages industry, 2009 ................................................................................................................................... 14 Table 9 – Employment in the food and beverages industry as at the end of June 2009..................................................................................................................................... 15 Table 10 – Employment by enterprise size in the food and beverages industry as at the end of June 2009...................................................................................................... 16 Explanatory notes............................................................................................................................................................................................................................................ 17 Table A – Size groups for the food and beverages industry............................................................................................................................................................................... 18 Table B – Income in the Food and beverages industry within 95% confidence limit: 2009................................................................................................................................. 18 Glossary ........................................................................................................................................................................................................................................................... 20 General information......................................................................................................................................................................................................................................... 24
Statistics South Africa P6421
Food and beverages industry, 2009
2
1. Summary of findings for the year 2009
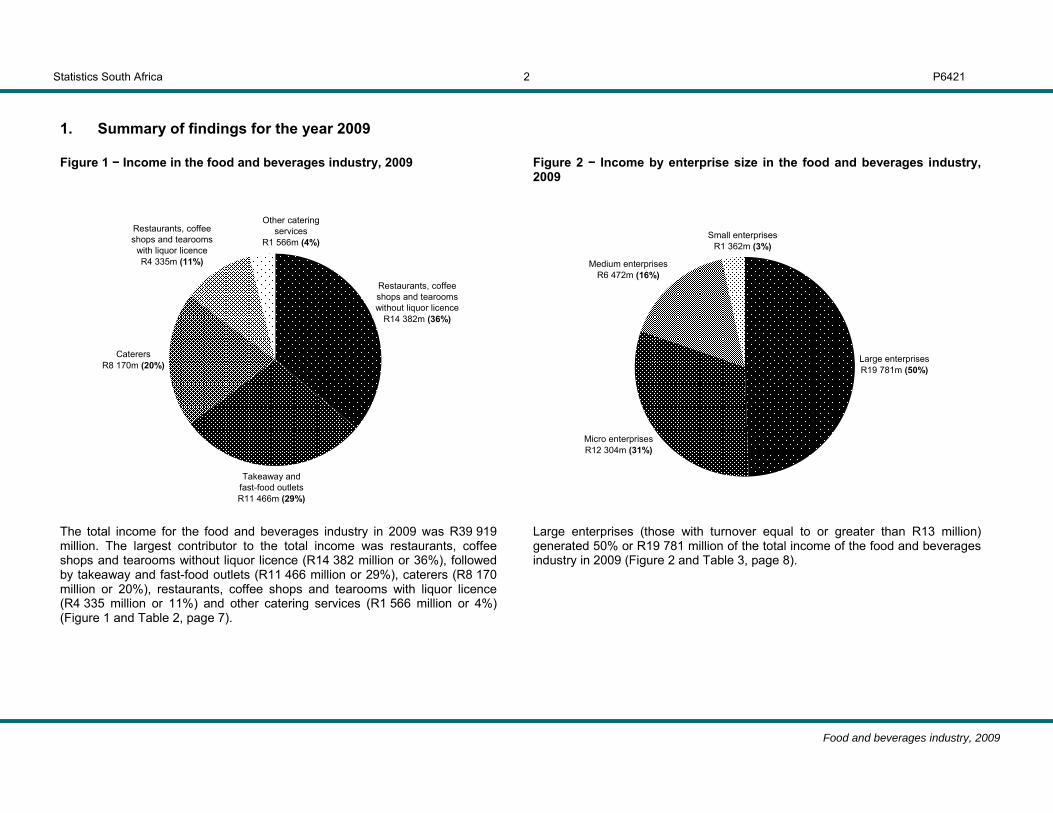
Figure 1 − Income in the food and beverages industry, 2009
Figure 2 − Income by enterprise size in the food and beverages industry, 2009
Other catering
servicesR1 566m (4%)
Restaurants, coffee shops and tearooms
with liquor licenceR4 335m (11%)
CaterersR8 170m (20%)
Takeaway and fast-food outletsR11 466m (29%)
Restaurants, coffee shops and tearooms without liquor licence
R14 382m (36%)
Small enterprises R1 362m (3%)
Medium enterprises R6 472m (16%)
Micro enterprises R12 304m (31%)
Large enterprises R19 781m (50%)
The total income for the food and beverages industry in 2009 was R39 919 million. The largest contributor to the total income was restaurants, coffee shops and tearooms without liquor licence (R14 382 million or 36%), followed by takeaway and fast-food outlets (R11 466 million or 29%), caterers (R8 170 million or 20%), restaurants, coffee shops and tearooms with liquor licence (R4 335 million or 11%) and other catering services (R1 566 million or 4%) (Figure 1 and Table 2, page 7).
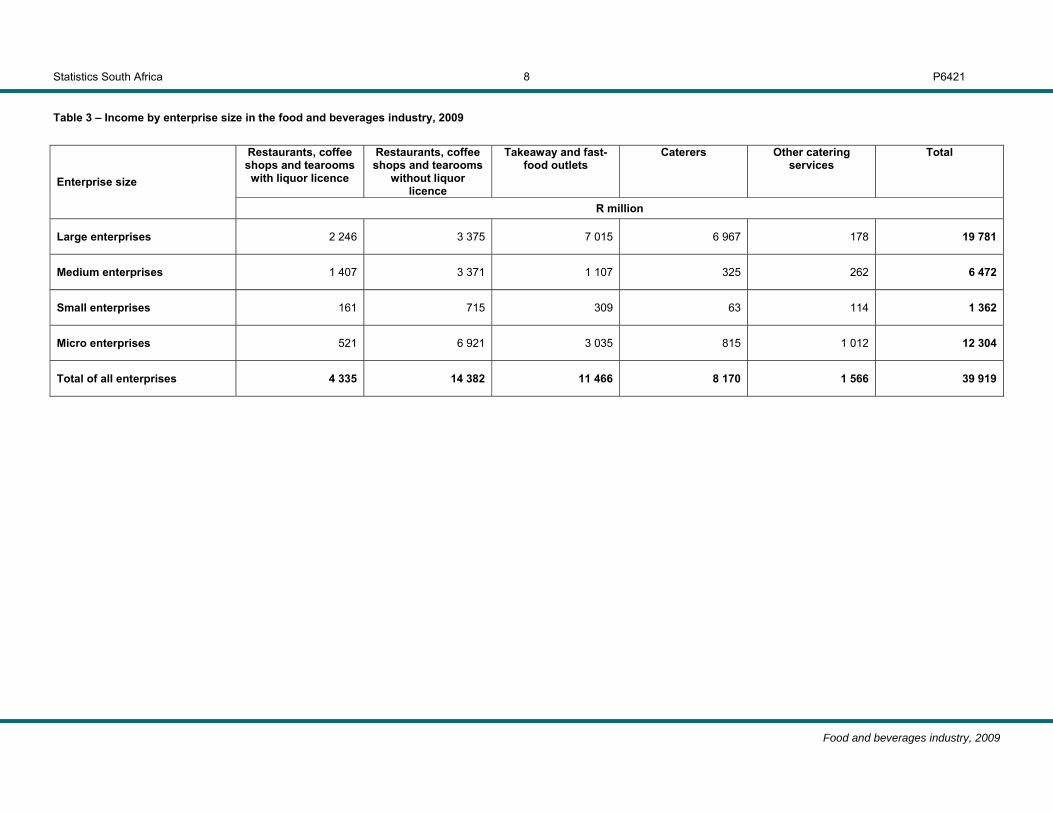
Large enterprises (those with turnover equal to or greater than R13 million) generated 50% or R19 781 million of the total income of the food and beverages industry in 2009 (Figure 2 and Table 3, page 8).

Statistics South Africa P6421
Food and beverages industry, 2009
3
Figure 3 − Composition of expenditure in the food and beverages industry, 2009
Figure 4 − Profit margin in the food and beverages industry, 2009
Sum of all other expenditure of food
and beverages industry
R7 574m (19%)
DepreciationR1 125m (3%)
RoyaltiesR1 249m (3%)
Rental of landR1 869m (5%)
Salaries and wages R7 133m (18%)
PurchasesR20 397m (52%)
c
1,7%
1,6%
1,4%
1,0%
0,8%
-1,6%
-2.0% -1.5% -1.0% -0.5% 0.0% 0.5% 1.0% 1.5% 2.0%
Restaurants, coffee shopsand tearooms with liquor
licence
Takeaway and fast-foodoutlets
Other catering services
Restaurants, coffee shopsand tearooms without liquor
licence
Total
Caterers
Expenditure in the food and beverages industry in 2009 amounted to R39 347 million. The expenditure consisted primarily of purchases (R20 397 million or 52%), followed by salaries and wages (R7 133 million or 18%), rental of land (R1 869 million or 5%), royalties (R1 249 million or 3%) and depreciation (R1 125 million or 3%) (Figure 3 and Table 4, pages 9).
The profit margin for the food and beverages industry was 0,8% in 2009.Restaurants, coffee shops and tearooms with liquor licence had the highest profitmargin at 1,7%, followed by takeaway and fast-food outlets at 1,6% and other catering services at 1,4% (Figure 4 and Table 1, page 6).

Statistics South Africa P6421
Food and beverages industry, 2009
4
Figure 5 − Capital expenditure on new assets in the food and beverages industry, 2009
Figure 6 − Employment in the food and beverages industry, 2009
Computer equipment and
softwareR68m (4%)Vehicles
R125m (8%)
Other capital expenditure
R277m (18%)
Land, buildings and construction
R309m (20%)
Plant, machinery and other office
equipmentR747m (50%)
Restaurants, coffee shops and tearooms
with liquor licence22 423 (11%)
Other catering services
5 951 (3%)
Caterers 40 720 (21%)
Takeaway and fast-food outlets
46 436 (24%)
Restaurants, coffee shops and tearooms without liquor licence
79 805 (41%)
The total capital expenditure on new assets in the food and beverages industry in 2009 was R1 526 million. The largest category of capital expenditure was plant, machinery and other office equipment (R747 million or 50%), followed by land, buildings and construction (R309 million or 20%), other capital expenditure (R277 million or 18%), vehicles (R125 million or 8%) and computer equipment and software (R68 million or 4%) (Figure 5 and Table 8, page 14).
The total number of persons employed in the food and beverages industry at theend of June 2009 was 195 335. Restaurants, coffee shops and tearooms without liquor licence had the largest number of employees (79 805 or 41%), followed by takeaway and fast-food outlets (46 436 or 24%), caterers (40 720 or 21%), restaurants, coffee shops and tearooms with liquor licence (22 423 or 11%) and other catering services (5 951 or 3%) (Figure 6 and Table 9, page 15).

Statistics South Africa P6421
Food and beverages industry, 2009
5
Figure 7 − Employment by enterprise size in the food and beverages industry, 2009
Figure 8 − Gender ratios in the food and beverages industry, 2009
Small enterprises 6 865 (4%)
Medium enterprises34 596 (18%)
Micro enterprises 69 482 (36%)
Large enterprises 84 392 (42%)
0% 10% 20% 30% 40% 50% 60% 70% 80% 90% 100%
Total
Other catering services
Caterers
Takeaway and fast-foodoutlets
Restaurants, coffee shopsand tearooms without liquor
licence
Restaurants, coffee shopsand tearooms with liquor
licence
Male employees Female employees
Employment by enterprise size indicates that large enterprises (those with turnover greater than or equal to R13 million) had the highest number of employees (84 392 or 42%), followed by micro enterprises (69 482 or 36%) and medium enterprises (34 596 or 18%) (Figure 7 and Table 10, page 16).
The proportion of females out of the total persons employed was 63% and that of males was 37%. The industry with the highest proportion of females employed was takeaway and fast-food outlets (67%), whilst other catering services had equal proportions of males and females employed (Figure 7 and Table 9, page 15).
PJ Lehohla
Statistician-General
Statistics South Africa P6421
Food and beverages industry, 2009
6
2. Tables
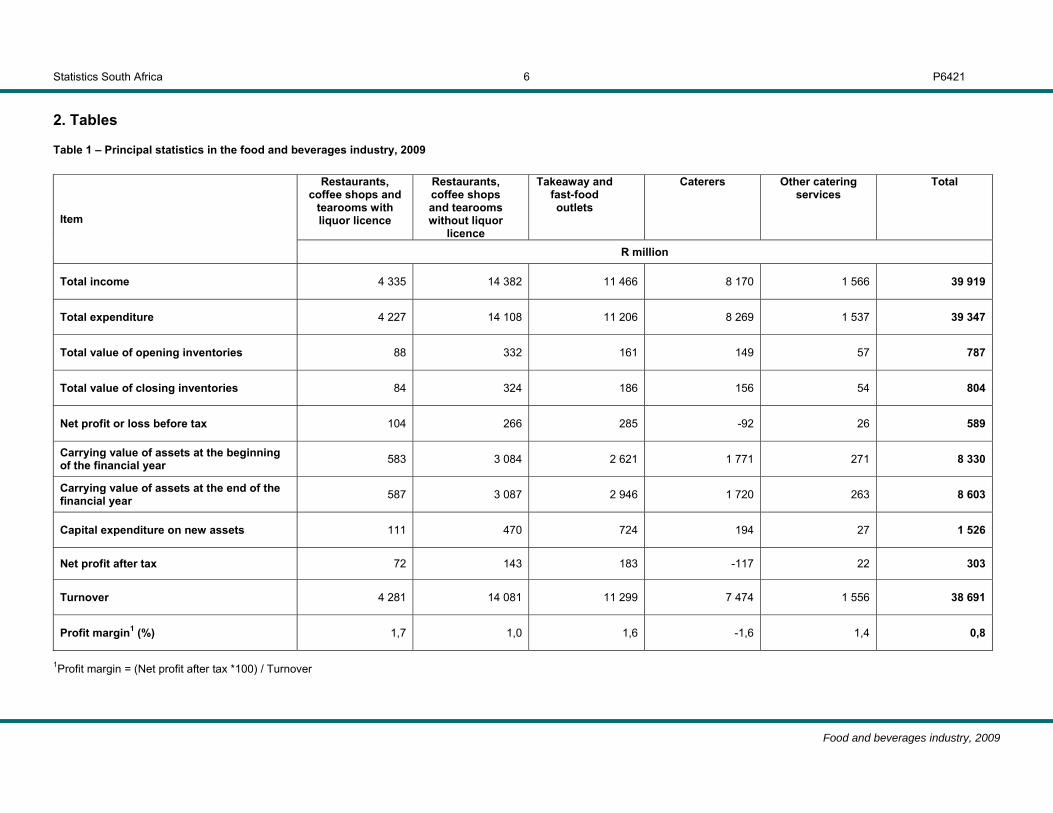
Table 1 – Principal statistics in the food and beverages industry, 2009
Restaurants, coffee shops and
tearooms with liquor licence
Restaurants, coffee shops and tearooms without liquor
licence
Takeaway and fast-food outlets
Caterers Other catering services
Total
Item
R million
Total income 4 335 14 382 11 466 8 170 1 566 39 919
Total expenditure 4 227 14 108 11 206 8 269 1 537 39 347
Total value of opening inventories 88 332 161 149 57 787
Total value of closing inventories 84 324 186 156 54 804
Net profit or loss before tax 104 266 285 -92 26 589
Carrying value of assets at the beginning of the financial year 583 3 084 2 621 1 771 271 8 330
Carrying value of assets at the end of the financial year 587 3 087 2 946 1 720 263 8 603
Capital expenditure on new assets 111 470 724 194 27 1 526
Net profit after tax 72 143 183 -117 22 303
Turnover 4 281 14 081 11 299 7 474 1 556 38 691
Profit margin1 (%) 1,7 1,0 1,6 -1,6 1,4 0,8
1Profit margin = (Net profit after tax *100) / Turnover

Statistics South Africa P6421
Food and beverages industry, 2009
7
Table 2 – Income in the food and beverages industry, 2009
Restaurants, coffee shops and tearooms with liquor licence
Restaurants, coffee shops and tearooms
without liquor licence
Takeaway and fast-food outlets
Caterers Other catering services
Total
Item
R million
Sales 4 208 13 731 11 160 7 053 1 498 37 650
Services 64 296 12 403 50 825
Lease income 9 54 127 18 8 216
Interest 19 52 46 25 1 143
Other income 35 249 121 671 9 1 085
Total income 4 335 14 382 11 466 8 170 1 566 39 919
Statistics South Africa P6421
Food and beverages industry, 2009
8
Table 3 – Income by enterprise size in the food and beverages industry, 2009
Restaurants, coffee shops and tearooms with liquor licence
Restaurants, coffee shops and tearooms
without liquor licence
Takeaway and fast-food outlets
Caterers Other catering services
Total
Enterprise size
R million
Large enterprises 2 246 3 375 7 015 6 967 178 19 781
Medium enterprises 1 407 3 371 1 107 325 262 6 472
Small enterprises 161 715 309 63 114 1 362
Micro enterprises 521 6 921 3 035 815 1 012 12 304
Total of all enterprises 4 335 14 382 11 466 8 170 1 566 39 919

Statistics South Africa P6421
Food and beverages industry, 2009
9
Table 4 – Expenditure in the food and beverages industry, 2009
Restaurants, coffee shops and
tearooms with liquor licence
Restaurants, coffee shops and tearooms without
liquor licence
Takeaway and fast-food outlets
Caterers Other catering services
Total
Item
R million
Purchases 1 892 6 905 5 947 4 667 986 20 397
Salaries and wages 916 2 646 1 604 1 761 206 7 133
Rental of land 342 893 481 83 70 1 869
Royalties 139 488 607 4 11 1 249
Depreciation 131 429 397 131 37 1 125
Advertising 111 283 419 21 9 843
Interest 72 166 230 184 9 661
Operational leasing and hiring of plant, machinery and equipment 47 216 149 110 17 539
Water and electricity 66 233 180 35 20 534
Labour/employment brokers 25 62 7 602 19 715
Motor vehicle running expenditure 13 71 48 61 11 204
Bank charges 41 144 82 12 14 293

Statistics South Africa P6421
Food and beverages industry, 2009
10
Table 4 – Expenditure in the food and beverages industry, 2009 (concluded)
Restaurants,
coffee shops and tearooms with liquor licence
Restaurants, coffee shops and tearooms without
liquor licence
Takeaway and fast-food outlets
Caterers Other catering services
Total
Item
R million
Total telecommunication services 22 91 52 44 12 221
Repair and maintenance 57 212 142 50 18 479
Insurance 25 92 47 27 10 201
Containers and packaging materials 28 55 74 3 2 162
Other expenditure 300 1 122 740 474 86 2 722
Total expenditure 4 227 14 108 11 206 8 269 1 537 39 347

Statistics South Africa P6421
Food and beverages industry, 2009
11
Table 5 – Carrying value of assets at the end of the financial year in the food and beverages industry, 2009
Restaurants,
coffee shops and tearooms with liquor licence
Restaurants, coffee shops and tearooms without
liquor licence
Takeaway and fast-food outlets
Caterers Other catering services
Total
Item
R million
Land, buildings and construction 92 513 793 145 66 1 609
Computers and other IT equipment 29 69 68 24 3 193
Motor vehicles 45 207 141 128 47 568
Plant, machinery and other office equipment 239 1 237 996 162 78 2 712
Intangible assets 152 898 832 1 207 48 3 137
Other assets 30 163 116 54 21 384
Total carrying value 587 3 087 2 946 1 720 263 8 603
Statistics South Africa P6421
Food and beverages industry, 2009
12
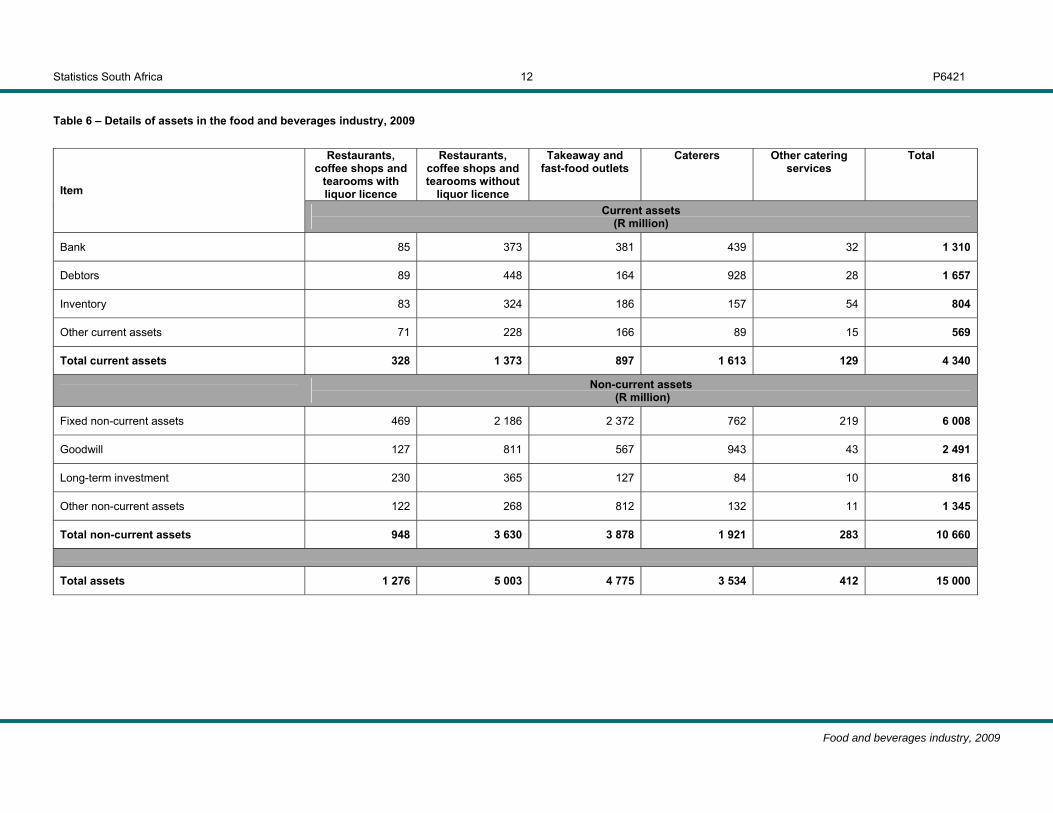
Table 6 – Details of assets in the food and beverages industry, 2009
Restaurants,
coffee shops and tearooms with liquor licence
Restaurants, coffee shops and tearooms without
liquor licence
Takeaway and fast-food outlets
Caterers Other catering services
Total
Item
Current assets (R million)
Bank 85 373 381 439 32 1 310
Debtors 89 448 164 928 28 1 657
Inventory 83 324 186 157 54 804
Other current assets 71 228 166 89 15 569
Total current assets 328 1 373 897 1 613 129 4 340
Non-current assets (R million)
Fixed non-current assets 469 2 186 2 372 762 219 6 008
Goodwill 127 811 567 943 43 2 491
Long-term investment 230 365 127 84 10 816
Other non-current assets 122 268 812 132 11 1 345
Total non-current assets 948 3 630 3 878 1 921 283 10 660
Total assets 1 276 5 003 4 775 3 534 412 15 000
Statistics South Africa P6421
Food and beverages industry, 2009
13
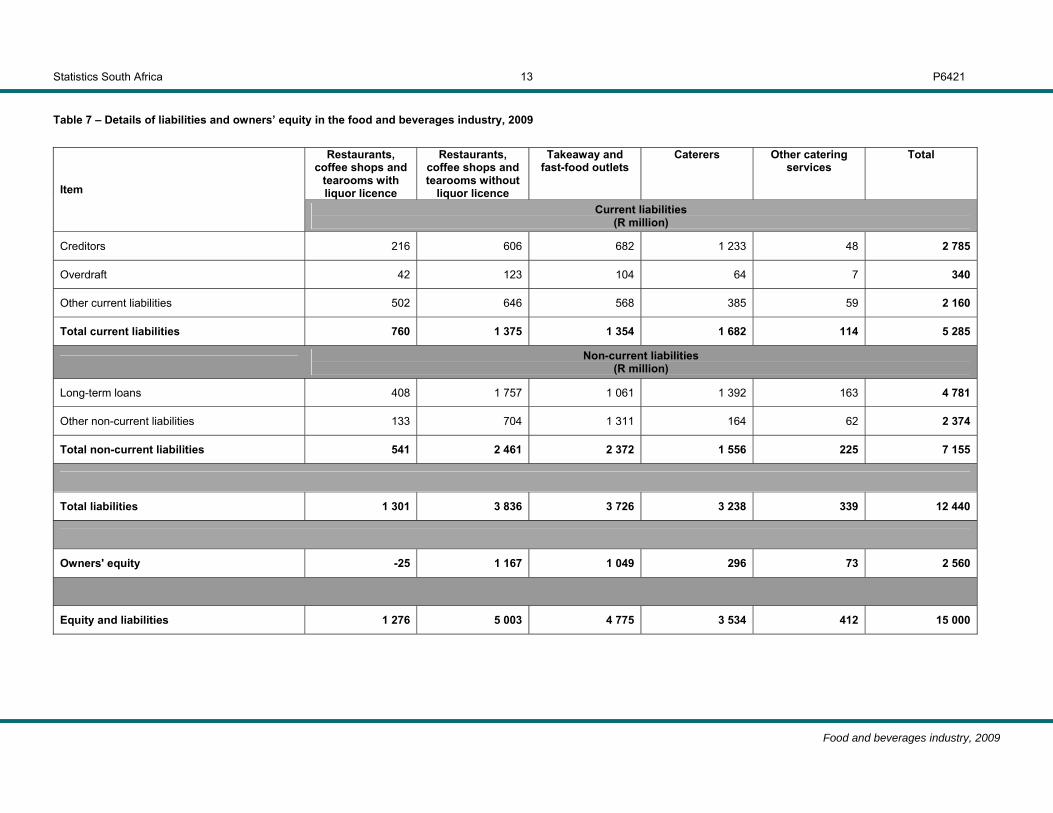
Table 7 – Details of liabilities and owners’ equity in the food and beverages industry, 2009
Restaurants,
coffee shops and tearooms with liquor licence
Restaurants, coffee shops and tearooms without
liquor licence
Takeaway and fast-food outlets
Caterers Other catering services
Total
Item
Current liabilities (R million)
Creditors 216 606 682 1 233 48 2 785
Overdraft 42 123 104 64 7 340
Other current liabilities 502 646 568 385 59 2 160
Total current liabilities 760 1 375 1 354 1 682 114 5 285
Non-current liabilities (R million)
Long-term loans 408 1 757 1 061 1 392 163 4 781
Other non-current liabilities 133 704 1 311 164 62 2 374
Total non-current liabilities 541 2 461 2 372 1 556 225 7 155
Total liabilities 1 301 3 836 3 726 3 238 339 12 440
Owners' equity -25 1 167 1 049 296 73 2 560
Equity and liabilities 1 276 5 003 4 775 3 534 412 15 000

Statistics South Africa P6421
Food and beverages industry, 2009
14
Table 8 – Capital expenditure on new assets in the food and beverages industry, 2009
Restaurants,
coffee shops and tearooms with liquor licence
Restaurants, coffee shops and tearooms without
liquor licence
Takeaway and fast-food outlets
Caterers Other catering services
Total
Item
R million
Land, buildings and construction 9 72 170 58 0 309
Computer equipment and software 4 21 33 10 0 68
Vehicles 6 49 42 14 14 125
Plant, machinery and equipment 64 233 372 69 9 747
Other capital expenditure 28 95 107 43 4 277
Total capital expenditure on new assets 111 470 724 194 27 1 526

Statistics South Africa P6421
Food and beverages industry, 2009
15
Table 9 – Employment in the food and beverages industry as at the end of June 2009
Restaurants, coffee shops and tearooms with liquor licence
Restaurants, coffee shops and tearooms
without liquor licence
Takeaway and fast-food outlets
Caterers Other catering services
Total
Employment type
Number of employees
Male 7 676 23 586 14 090 12 386 2 331 60 069
Female 10 319 42 405 28 346 20 155 2 352 103 577 Permanent
Total 17 995 65 991 42 436 32 541 4 683 163 646
Male 646 1 489 326 2 269 109 4 839
Female 1 089 2 850 782 3 254 168 8 143 Temporary
Total 1 735 4 339 1 108 5 523 277 12 982
Male 1 325 4 072 1 017 1 174 554 8 142
Female 1 368 5 403 1 875 1 482 437 10 565 Casual
Total 2 693 9 475 2 892 2 656 991 18 707
Male 9 647 29 147 15 433 15 829 2 994 73 050
Female 12 776 50 658 31 003 24 891 2 957 122 285 Total
Total 22 423 79 805 46 436 40 720 5 951 195 335

Statistics South Africa P6421
Food and beverages industry, 2009
16
Table 10 – Employment by enterprise size in the food and beverages industry as at the end of June 2009
Restaurants, coffee shops and tearooms with liquor licence
Restaurants, coffee shops and tearooms
without liquor licence
Takeaway and fast-food outlets
Caterers Other catering services
Total
Enterprise size
Number of employees
Large enterprises 10 453 14 157 25 031 34 686 65 84 392
Medium enterprises 8 174 20 426 4 179 1 183 634 34 596
Small enterprises 613 4 044 1 292 429 487 6 865
Micro enterprises 3 183 41 178 15 934 4 422 4 765 69 482
Total of all enterprises 22 423 79 805 46 436 40 720 5 951 195 335

Statistics South Africa P6421
Food and beverages industry, 2009
17
Explanatory notes Background The results presented in this publication have been derived from the 2009 Food and beverages large sample survey. This is a periodic survey,
which measures economic activity in the food and beverages industry of the South African economy. This survey is based on a sample of private and public enterprises operating in the food and beverages industry. The sample was drawn from Stats SA’s business register. Stats SA continuously upgrades its business register, based on units registered for value added tax (VAT) and income tax (IT) at the South African Revenue Service (SARS). All figures exclude value added tax (VAT).
Reference period The information was collected from enterprises for their financial year, which ended on any date between 1 July 2008 and 30 June 2009. Purpose of the survey Results of the survey are used within Stats SA for compiling South Africa’s national accounts, e.g. the gross domestic product (GDP) and
gross fixed capital formation. These statistics are also used by the private sector in analyses of comparative business and industry performance.
Scope and coverage
This survey covers the following income tax-registered private and public enterprises that are mainly engaged in the food and beverages industry: i. Restaurants, coffee shops or tearooms, with liquor licence (SIC 64201). ii. Restaurants, coffee shops or tearooms, without liquor licence (SIC 64202). iii. Takeaway and fast-food outlets (SIC 64203). iv. Caterers (SIC 64204). v. Other catering services (64209).
Classification by industry
The 1993 edition of the Standard Industrial Classification of all Economic Activities (SIC), Fifth Edition, Report No. 09-09-02, was used to classify the statistical units in the survey. The SIC is based on the 1990 International Standard Industrial Classification of all Economic Activities (ISIC) with suitable adaptations for local conditions. Statistics in this publication are presented at 5-digit SIC level (subgroup). Each enterprise is classified to an industry which reflects its predominant activity.
Statistical unit The statistical unit for the collection of the information is an enterprise. An enterprise is a legal unit (or a combination of legal units) that includes and directly controls all functions necessary to carry out its activities.

Statistics South Africa P6421
Food and beverages industry, 2009
18
Size groups The enterprises are divided into four size groups according to the value of their business register turnover. Large enterprises are enterprises
with an annual turnover of R13 million and more. Table A presents the size groups defined using the Department of Trade and Industry (DTI) cut-off points. Table A – Size groups for the food and beverages industry Size group TurnoverLarge ≥ R13 000 000 Medium R6 000 000 ≤ VAT turnover < R13 000 000 Small R5 100 000 ≤ VAT turnover < R6 000 000
Micro < R5 100 000
Survey methodology and design
The survey was conducted by post, email, fax, telephone and personal visits. A sample of approximately 2 000 enterprises was drawn using stratified simple random sampling. The enterprises were first stratified at 5-digit level according to the SIC and then by size of enterprise. All large enterprises were completely enumerated. Business register turnover was used as the measure of size for stratification.
Weighting methodology
For those strata not completely enumerated, the weights to produce estimates are the inverse ratio of the sampling fraction, modified to take account of non-response in the survey. Stratum estimates were calculated and then aggregated with the completely enumerated stratum to form group estimates. These procedures, which are in line with international best practice, are described in more detail on the Stats SA website at www.statssa.gov.za/publications/publicationsearch.asp.
Relative standard error Data presented in this publication are based on information obtained from a sample and are, therefore, subject to sampling variability; that is they may differ from the figures that would have been produced if the data had been obtained from all enterprises in the food and beverages industry in South Africa. One measure of the likely difference is given by the standard error (SE), which indicates the extent to which an estimate might have varied by chance because only a sample of enterprises was used. The relative standard error (RSE) provides an immediate indication of the percentage errors likely to have accrued due to sampling. Table B – Income in the Food and beverages industry within 95% confidence limit: 2009
Lower limit Total income Upper limit Relative standard error
(RSE) Type of service
R million % Restaurants, coffee shops and tearooms with liquor licence 4 012 4 335 4 658 3,8 Restaurants, coffee shops and tearooms without liquor licence 13 114 14 382 15 650 4,5 Takeaway and fast-food outlets 10 792 11 466 12 140 3,0 Caterers 7 385 8 170 8 955 4,9 Other catering services 1 388 1 566 1 744 5,8 All services 38 276 39 919 41 562 2,1

Statistics South Africa P6421
Food and beverages industry, 2009
19
Non-sampling errors Inaccuracies may occur because of imperfections in reporting by enterprises and errors made in the collection and processing of the data.
Inaccuracies of this kind are referred to as non-sampling errors. Every effort is made to minimize non-sampling errors by careful design of questionnaires, testing them in pilot studies, editing reported data and implementing efficient operating procedures. Non-sampling errors occur in both sample surveys and censuses.
Rounding-off of figures The figures in the tables have, where necessary, been rounded off to the nearest final digit shown. There may therefore be slight
discrepancies between the sums of the constituent items and the totals shown. Symbols and abbreviations
DTI Department of Trade and Industry
GDP Gross domestic product
ISIC International Standard Industrial Classification of all Economic Activities
IT Income tax
RSE Relative standard error
SARS South African Revenue Service
SE Standard error
SIC Standard Industrial Classification of all Economic Activities
SNA System of National Accounts
Stats SA Statistics South Africa
VAT Value added tax
0 Nil or less than half the final digit shown

Statistics South Africa P6421
Food and beverages industry, 2009
20
Glossary Current assets
Assets on the balance sheet which are expected to be sold or otherwise used up in the near future, usually within one year. They include:
• trade and other receivables; • cash and bank; • inventories; and • other current assets.
Current liabilities Current liabilities are debts or obligations that are due within one year. They include:
• trade and other payables; • bank overdraft; and • other current liabilities.
Employees Employees are those people employed by the business or organisation who received payment (in salaries, wages, commission, piece rates
or payments in kind) for the last pay period ended on or before 30 June 2009. Permanent employees Employees appointed on an open-ended contract with stipulated termination date or a fixed-term contract for periods of more than one year.
Temporary employees Employees appointed on a short-term contract basis with a stipulated termination date for periods not exceeding one year.
Casual employees
Employees who fall neither within the ‘permanent employees’ category nor the ‘temporary employees’ category. Such employees are typically working daily or hourly.
Labour brokers Agents who recruit and administer workers on behalf of the enterprise. They do not provide any other service. Enterprise The enterprise is a legal entity or a combination of legal units that includes and directly controls all functions necessary to carry out its
activities. Industry An industry consists of a group of enterprises engaged in the same or similar kinds of economic activity. Industries are defined in the
System of National Accounts (SNA) in the same way as in the Standard Industrial Classification of all Economic Activities, Fifth Edition, Report No. 09-90-02 of January 1993 (SIC).

Statistics South Africa P6421
Food and beverages industry, 2009
21
Net profit or loss after tax
Net profit or loss after tax is derived as: Total income plus closing value of inventories minus total expenditure minus opening value of inventories minus company tax
Net profit or loss before tax
Net profit or loss before tax is derived as: Total income plus closing value of inventories minus total expenditure minus opening value of inventories
Non-current assets Non-current assets are assets which are not easily convertible to cash or not expected to become cash within the next year. They include:
• property, plant and equipment and intangible assets; • long-term investments; and • other non-current assets.
Non-current liabilities Non-current liabilities are liabilities not due to be paid within one year during the normal course of business. They include:
• long-term loans; and • other non-current liabilities.

Statistics South Africa P6421
Food and beverages industry, 2009
22
Other expenditure Other expenditure includes:
• bursaries; • excise and custom duty; • losses on financial and other liabilities: redemption, liquidation or revaluation; • mineral rights leases; • research and development; • severance, termination and redundancy; • security services (including IT security services); • aromatisation; • paper, printing and stationery; • computers; • travelling; • losses on assets; • entertainment; • railage and transport-out; • subscriptions; • provisions; • accommodation; • staff training; • postal and courier services; • Skills development levy • losses on foreign exchange; • donations; • property taxes; and • other.

Statistics South Africa P6421
Food and beverages industry, 2009
23
Other income Other income includes:
• government subsidies and incentives received from the South African government; • profit on financial and other liabilities: redemption, liquidation and revaluation and other liabilities; • provision; • mineral rights leases; • profit on foreign loans as a result of variations in foreign exchange rates or transactions; • royalties; • profit on financial and other assets; • dividends; and • other.
Owners’ equity Owners’ equity is the residual interest in the entity’s assets after deducting its liabilities. Profit margin Profit margin is derived as:
Net profit after tax divided by turnover multiplied by 100
Statistical unit A statistical unit is a unit about which statistics are tabulated, compiled or published. The statistical units are derived from and linked to the
South African Revenue Service (SARS) administrative data. Stratum A stratum is constructed by concatenating the SIC classification and size group variables. Turnover Turnover includes:
• value of sales of goods; • amount received for services rendered; • rent and lease payments received for land and buildings; and • rent, leasing and hiring received for machinery, vehicles and other equipment.

Statistics South Africa P6421
Food and beverages industry, 2009
24
General information Stats SA publishes approximately 300 different statistical releases each year. It is not economically viable to produce them in more than one of South Africa's eleven official languages. Since the releases are used extensively, not only locally but also by international economic and social-scientific communities, Stats SA releases are published in English only.
Stats SA has copyright on this publication. Users may apply the information as they wish, provided that they acknowledge Stats SA as the source of the basic data wherever they process, apply, utilise, publish or distribute the data; and also that they specify that the relevant application and analysis (where applicable) result from their own processing of the data.
Stats SA products
A complete set of Stats SA publications is available at the Stats SA Library and the following libraries: National Library of South Africa, Pretoria Division Eastern Cape Library Services, King William’s Town National Library of South Africa, Cape Town Division Central Regional Library, Polokwane Natal Society Library, Pietermaritzburg Central Reference Library, Nelspruit Library of Parliament, Cape Town Central Reference Collection, Kimberley Bloemfontein Public Library Central Reference Library, Mmabatho Johannesburg Public Library
Stats SA also provides a subscription service.
Electronic services
A large range of data is available via on-line services, diskette and computer printouts. For more details about our electronic data services, contact (012) 310 8600/ 8390/ 8351/ 4892/ 8496/ 8095. You can visit us on the Internet at: www.statssa.gov.za
Enquiries
Telephone number: (012) 310 8600/ 8390/ 8351/ 4892/ 8496/ 8095 (user information services) (012) 310 8644/ 310 8191 (technical enquiries) (012) 310 8358 (orders) (012) 310 8490 (library) Fax number: (012) 310 8623 (technical enquiries) Email address: [email protected] (technical enquiries) [email protected] (technical enquiries) [email protected] (user information services) [email protected] (orders) Postal address: Private Bag X44, Pretoria, 0001
Produced by Stats SA