bell ringer 3-21-11 four figures have the following dimensions: rectangular prism: l=2 in; w=4 in;...
TRANSCRIPT

Bell Ringer3-21-11
Four figures have the following dimensions:
Rectangular prism: l=2 in; w=4 in; h=7 inCylinder: r=4 in; h=6 inCone: r=4 in; h=6 inRectangular pyramid: l=2 in; w=4 in; h=7
in1. What is the probability that a figure chosen
at random will have a volume greater than 150 cubic inches?
2. Two figures are pulled one at a time. After you pull the first time, you do not replace. What is the probability both figures will have a volume less than 125 cubic inches?
3. Calculate the mean.

Rectangular prism: l=2 in; w=4 in; h=7 inCylinder: r=4 in; h=6 inCone: r=4 in; h=6 inRectangular pyramid: l=2 in; w=4 in; h=7 in
356
)7)(4)(2(
:rPrismRectangula
inV
V
lwhV
3
2
44.301
)6)(16)(14.3(
:Cylinder
inV
V
hrV
3
3
218
)7)(4)(2(3
13
1
:rPyramidRectangula
inV
V
lwhV
3
2
48.100
)6)(16)(14.3(3
13
1
:Cone
inV
V
hrV

Rectangular prism: l=2 in; w=4 in; h=7 in V=56in3
Cylinder: r=4 in; h=6 in V=301.44in3
Cone: r=4 in; h=6 in V=18.67in3
Rectangular pyramid: l=2 in; w=4 in; h=7 in V=100.48in3
1. What is the probability that a figure chosen at random will have a volume greater than 150 cubic inches?
2. Two figures are pulled one at a time. After you pull the first time, you do not replace. What is the probability both figures will have a volume less than 125 cubic inches?
%254
1)150( orP
2
1
12
6
3
2
4
3)1252( P

Rectangular prism: l=2 in; w=4 in; h=7 in V=56in3
Cylinder: r=4 in; h=6 in V=301.64in3
Cone: r=4 in; h=6 in V=18.67in3
Rectangular pyramid: l=2 in; w=4 in; h=7 in V=100.48in3
3. Calculate the mean.4
)48.10067.1864.30156(
320.1194
79.476in

Quiz3-21-11
Roderick is building a model of an actual airplane with a length of 20 feet. What other information is necessary in order to find x, the length of the model airplane?
F The ratio of the length of the model airplane’s tail to the length of its wingG The speed of the model airplaneH The scale factor usedJ The model airplane’s wingspan

What information is needed to find x?
Anything involving dilations must have a scale factor. If one dimension is known, the dimension of the similar figure can be found by multiplying by the scale factor.
Roderick is building a model of an actual airplane with a length of 20 feet. What other information is necessary in order to find x, the length of the model airplane?
The scale factor is needed to find x.
Actual length = 20 feetx = model lengthDilation
Reductionsor tsEnlargemen
:Dilations
factor scale by theMultiply
factor. scale by the gmultiplyin
by found becan length model the
known, islength actual theSince:H

Speed Test1. Get out a dry erase marker.2. You have 1 minute to complete as many problems as you can.3.We will grade in 1 minute.4. Graph your results. Keep the graph in your notebook.5. We will do this every day.

Problem of the Week & Word Problem
#5-21. You have 5 minutes to work on the
problem of the week and word problem.
2. The problem of the week must follow the Read, Think, Solve, Justify format.
3. When you are finished, turn them in.4. They are due Friday.

Reach for the StarsMonday
The Childress family went on a camping trip. They paid $28.00 for a 2-night stay at a campground that allows a maximum stay of 30 nights. Which equation can they use to find c, the cost of camping at this campground for the maximum number of nights?
A c = 60 · 56B c = 30 · 28C c = 28 · 28D c = 30 · 14

Reach for the StarsMonday
The sun’s core temperature reaches close to 2.7 × 10 7 degrees Fahrenheit. Which of the following represents this temperature in standard notation?
A 270,000°FB 2,700,000°FC 27,000,000°FD 270,000,000°F

Reach for the StarsMonday
Raymond packs boxes for an appliance company. He can pack a large box in 10 minutes and a small box in 4 minutes. He
needs to pack 10 large boxes and 20 small boxes. If 2.5 hours remain before closing time, will Raymond have time to finish the work before closing time if he works without stopping?
A. Yes, Raymond will finish the work in 1.8 hours.B. No, it will take him 4 hours to finish.C. Yes, Raymond will finish the work in 0.5 hour.D. No, it will take him 3 hours to finish.

Reach for the StarsMonday
You have a sheet protector with two graphs.
We will go over both of these problems. You can use your marker to write on the
graph in the sheet protector.1.Grade distribution2.Pizza sizes

Class Work: Creating and Analyzing Graphs
I am providing you the notes for this activity.
Create the graphs and answer the questions for each situation.
Remember to include title and labels/legends.

Bar Graph
A survey of an 8th grade class reveals that 12 people like football,
14 like baseball and 9 like basketball. Create a bar graph,
illustrating the results.
1. Interpret the graph.2. Calculate the mode.


Favorite Sports of 8th Grade Students
02468
10121416
football baseball basketball
Sport
Nu
mb
er
of
Stu
de
nts

HistogramThe table displays the results of the last math test. Create a histogram,
illustrating the results.
1. Explain the difference between a bar graph and histogram.2. Calculate the median.
100 - 90
89 - 80
79 - 70
69 - 0


Results of Math Test
0
1
2
3
4
5
6
100-90 89-80 79-70 69-0
Grade Category
Nu
mb
er
of
Stu
de
nts

Circle Graph
Out of 100 people surveyed, 20 like vanilla ice cream, 15 like strawberry, 40 people like
chocolate, and the rest like rocky road. Create a circle graph,
illustrating the results.
1. Calculate the percent of people that like rocky road.
2. Calculate the range.


Favorite Ice Cream
vanilla
strawberry
chocolate
rocky road

Line GraphThe table displays the cost for a gallon of gas for the last 5 years.
Create a line graph, illustrating the results.
1. Calculate the mean.
2009 $1.82
2008 $3.05
2007 $2.85
2006 $2.30
2005 $2.10


Cost for Gallon of Gas over Last 5 Years
$0.00
$0.75
$1.50
$2.25
$3.00
$3.75
2005 2006 2007 2008 2009
Year
Co
st
(in
do
llars
)

ScatterplotThe table displays the minutes spent
studying for a test and the grade received. Create a scatterplot, illustrating the results.
1. Calculate the four measures of central tendency.
120 95, 90 80 75
110 90 75 70, 75
100 90, 65 60 65, 70
90 85, 80 50 55, 50
85 85, 75 30 20
min mingrade grade

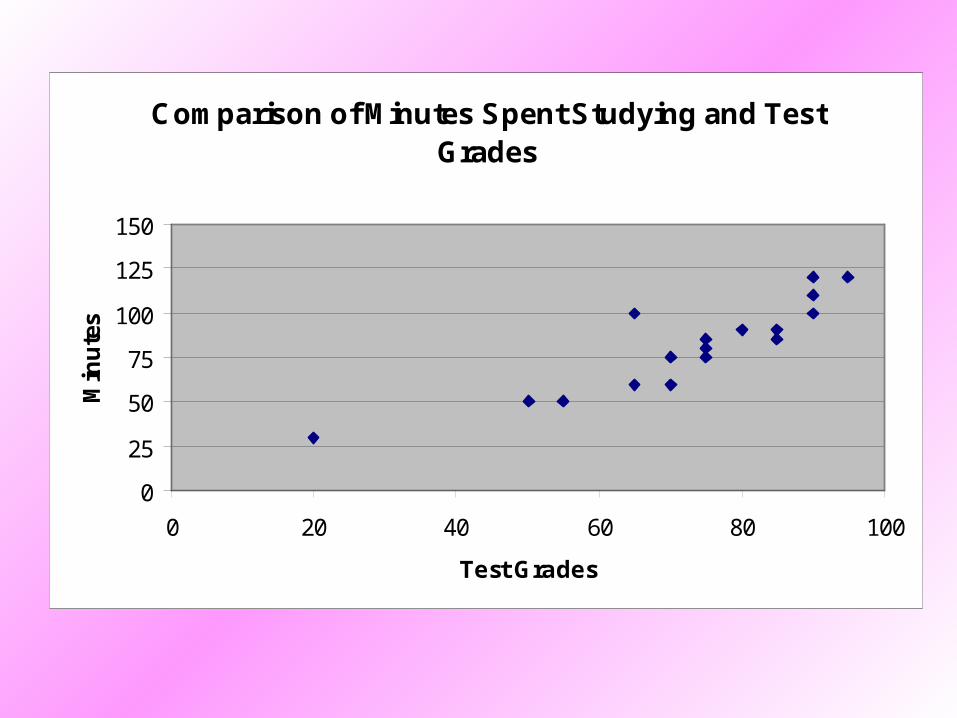
Comparison of Minutes Spent Studying and Test Grades
0
25
50
75
100
125
150
0 20 40 60 80 100
Test Grades
Min
ute
s

Venn DiagramA veterinarian surveys 26 of his
patrons. He discovers that 7 have dogs, 5 have cats, and 1 has a fish.
Four have dogs and cats, 3 have dogs and fish, and one has a cat and fish.
No one has all three kinds of pets, and 5 people have none of these
pets. Create a Venn diagram, illustrating these results.
1. Interpret the diagram.


Survey of Type of Animals People Have
Dog Cat
Fish
7 5
1
4
3 10
5

Finish
Continue working on the Smarties activity we started before Spring Break.