backfi ll production line 2012 - etusivu - posiva · hassan, xavier pintado and jorma autio...
TRANSCRIPT
POSIVA 2012-18
June 2013
POSIVA OY
Olki luoto
FI-27160 EURAJOKI, F INLAND
Phone (02) 8372 31 (nat. ) , (+358-2-) 8372 31 ( int. )
Fax (02) 8372 3809 (nat. ) , (+358-2-) 8372 3809 ( int. )
Paula Keto (ed.)
Md. Mamunul Hassan, Petr i ikka Karttunen,
Leena Kiviranta, Sirpa Kumpulainen
B+Tech Oy
Leena Korkiala-Tanttu
Aalto University
Vil le Koskinen
Fortum Oyj
Ti ina Jalonen, Petr i Koho
Posiva Oy
Ursula Sievänen
Saanio & Riekkola Oy
Backfi ll Production Line 2012Design, Production and Initial State
of the Deposition Tunnel Backfi ll and Plug

ISBN 978-951-652-199-5ISSN 1239-3096
Tekijä(t) – Author(s)
Paula Keto (ed.) Md. Mamunul Hassan, Petriikka Karttunen, Leena Kiviranta, Sirpa Kumpulainen, B+Tech Oy Leena Korkiala-Tanttu, Aalto University Ville Koskinen, Fortum Oyj Tiina Jalonen, Petri Koho, Posiva Oy Ursula Sievänen, Saanio & Riekkola Oy
Toimeksiantaja(t) – Commissioned by
Posiva Oy
Nimeke – Title
BACKFILL PRODUCTION LINE 2012. DESIGN, PRODUCTION AND INITIAL STATE OF THE DEPOSITION TUNNEL BACKFILL AND PLUG Tiivistelmä – Abstract
Posiva's spent nuclear fuel disposal is based on the KBS-3V concept and on the characteristics of the Olkiluoto site. The deposition tunnels in the repository for spent nuclear fuel are backfilled with different clay based components and closed by a concrete plug constructed at the mouth of the deposition tunnels. The performance targets for the backfill are to limit advective flow along the deposition tunnels, keep the buffer and canister in place and contribute to the mechanical stability of the deposition tunnels. The performance targets of the plug are to isolate the deposition tunnels hydraulically during the operation phase of the repository and to keep the backfill in place. In addition, the chemical composition of both backfill and plug shall not jeopardise the performance of the buffer, canister or bedrock.
The backfill consists of three different main components: foundation layer installed at site, pre-compacted backfill blocks and bentonite pellets. The backfill blocks consist of Friedland clay with smectite content between 30-38% and the other components consist of bentonite clay with smectite content of 75-90%. The plug is a multi-component structure consisting of a cast in place concrete dome, a filter layer consisting of crushed rock and a sealing layer consisting of pre-compacted bentonite blocks and pellets.
The production chain for the backfill consists of excavation and processing, delivery, acceptance of the material batch to production, transport, handling and storage of raw materials and components in different phases and manufacturing and installation of backfill components. Quality control is included in all phases of the production chain. The concrete dome is cast on site and production of the dome follows the norms and standards concerning concrete construction. The production of the sealing layer for the plug follows the same principles that are used in the production of backfill blocks.
The initial state of the backfill and the deposition tunnel plug describes the material properties of the components and the average properties of the backfill and plug right after installation. It can be stated that in its initial state, current backfill design fulfills the design requirements and design specifications set for backfill. The long-term evolution of backfill properties and the fulfillment of the performance targets are discussed separately in the Performance Assessment report. Avainsanat - Keywords
Deposition tunnels, backfill, plug, design, production, quality, initial state and performance.
ISBN
ISBN 978-951-652-199-5 ISSN
ISSN 1239-3096 Sivumäärä – Number of pages
164 Kieli – Language
English
Posiva-raportti – Posiva Report Posiva Oy Olkiluoto FI-27160 EURAJOKI, FINLAND Puh. 02-8372 (31) – Int. Tel. +358 2 8372 (31)
Raportin tunnus – Report code
POSIVA 2012-18
Julkaisuaika – Date
June 2013


Tekijä(t) – Author(s)
Paula Keto (ed.) Md. Mamunul Hassan, Petriikka Karttunen, Leena Kiviranta, Sirpa Kumpulainen, B+Tech Oy Leena Korkiala-Tanttu, Aalto University Ville Koskinen, Fortum Oyj Tiina Jalonen, Petri Koho, Posiva Oy Ursula Sievänen, Saanio & Riekkola Oy
Toimeksiantaja(t) – Commissioned by
Posiva Oy
Nimeke – Title
TÄYTÖN TUOTANTOLINJA 2012. LOPPUSIJOITUSTUNNELIN TÄYTÖN JA PÄÄTYTULPAN SUUNNITELMA, TUOTANTO JA ALKUTILA.
Tiivistelmä – Abstract
Posivan käytetyn ydinpolttoaineen loppusijoitus perustuu KBS-3V konseptiin ja Olkiluodon loppusijoituspaikan ominaisuuksiin. Loppusijoitustilan sijoitustunnelit täytetään erilaisilla savipohjaisilla täyttökomponenteilla ja tunnelin suulle rakennetaan betoninen päätytulppa. Täytön toimintakykyvaatimuksina on rajoittaa sijoitustunnelin suuntaista advektiivista virtausta, pitää puskuri ja kapseli paikallaan ja myötävaikuttaa kallion mekaaniseen stabiiliuteen. Loppusijoitustunnelin päätytulpan toimintakykyvaatimuksena on eristää sijoitustunneli hydraulisesti loppusijoitustilan käyttötoiminnan aikana ja pitää täyttö paikallaan. Näiden lisäksi, täytön ja päätytulpan kemiallinen koostumus ei saa vaarantaa puskurin, kapselin tai kallioperän toimintakykyä.
Täyttö koostuu kolmesta eri pääkomponentista: paikalleen asennetusta lattian tasausmateriaalista, esipuristetuista täyteainelohkoista ja bentoniittipelleteistä. Täyttölohkot koostuvat Friedland-savesta, jonka smektiittipitoisuus on 30-38%. Muut komponentit ovat bentoniittia, jonka smektiittipitoisuus on 75-90%. Päätytulppa on yhdistelmärakenne, joka koostuu paikalleen valetusta betoniosasta, murskesuodatinkerroksesta ja bentoniittilohkoista ja -pelleteistä koostuvasta tiivisterakenteesta.
Täytön tuotantoketju koostuu raaka-aineen louhinnasta ja prosessoinnista, toimituserän hyväksy-misprosessista ja toimittamisesta, raaka-aineen ja valmiiden komponenttien kuljetuksesta ja varastoinnista eri vaiheissa ja komponenttien valmistuksesta ja asentamisesta. Laadunvalvonta on osa ketjun jokaista vaihetta. Päätytulpan betoniosa valetaan paikan päällä ja sen tuotanto noudattaa betonirakentamisen normeja ja standardeja. Päätytulpan tiivistyskerroksen tuotanto noudattaa samoja periaatteita kuin täyttölohkojen tuotanto.
Täytön ja loppusijoitustunnelin päätytulpan alkutila kuvaa täytön ja päätytulpan keskimääräisiä ominaisuuksia heti asentamisen jälkeen. Alkutilassa täytön nykysuunnitelma täyttää sille asetetut suunnitteluvaatimukset ja -arvot. Täytön ominaisuuksien evoluutio ja toimintakykyvaatimusten täyttyminen pitkällä aikavälillä käsitellään erikseen toimintakyvyn arviointiraportissa.
Avainsanat - Keywords
Sijoitustunnelit, täyttö, päätytulppa, suunnitelma, tuotanto, laatu, alkutila ja toimintakyky. ISBN
ISBN 978-951-652-199-5 ISSN
ISSN 1239-3096 Sivumäärä – Number of pages
164 Kieli – Language
Englanti
Posiva-raportti – Posiva Report Posiva Oy Olkiluoto FI-27160 EURAJOKI, FINLAND Puh. 02-8372 (31) – Int. Tel. +358 2 8372 (31)
Raportin tunnus – Report code
POSIVA 2012-18
Julkaisuaika – Date
Kesäkuu 2013


FOREWORD This report is part of Posiva’s production line report series. The work for this report has been ordered by Petri Koho of Posiva Oy, who has also taken part in the coordination, follow-up and review of the report as well producing some of the information concerning the block installation method. The scientific editor of the report is Paula Keto (B+Tech Oy), who has been responsible for coordinating the writing work and the main author of sections concerning design basis, initial state, conformity of the reference backfill to design basis and discussion and conclusions and co-author in many other chapters. Sirpa Kumpulainen and Leena Kiviranta (B+Tech Oy) have been responsible for chapters concerning materials, handling and transportations and quality assurance. Ville Koskinen (Fortum Oyj) has been responsible for the section concerning manufacturing of backfill blocks and Leena Korkiala-Tanttu (Aalto University) for chapter concerning block and pellet installation. Petriikka Karttunen (B+Tech Oy) has been the technical editor of the report as well as responsible for some of the chapters concerning pellet manufacturing and installation of the foundation layer. Md. Manunul Hassan, Xavier Pintado and Jorma Autio (B+Tech Oy) have been responsible for the information in the backfill design section. Ursula Sievänen (Saanio & Riekkola Oy) has been responsible for the chapters concerning production and initial state of the deposition tunnel end plug. The deposition tunnel end plug was designed by Finnmap Consulting Oy based on the original design by SKB. Tiina Jalonen (Posiva Oy) has written the introduction chapter of the report. The report has been externally reviewed by David Dixon (AECL), Margit Snellman (Saanio & Riekkola Oy), Jarkko Kyllönen (Fortum Oyj) and Erika Holt (VTT). Internal reviewers have been Tiina Jalonen (Posiva Oy), Jorma Autio (B+Tech Oy), Petri Koho (Posiva Oy) and Keijo Haapala (Posiva Oy). In addition, special thanks go for the discussions with and comments from Pirjo Hellä (Saanio & Riekkola Oy), Aimo Hautojärvi (Posiva Oy), Markku Juvankoski (VTT), Liisa Salparanta (VTT), Markku Siivonen (SFK Sertification), Timo Kirkkomäki (Fortum Oyj), Keijo Haapala (Posiva Oy), Jukka-Pekka Salo (Posiva Oy), Johanna Hansen (Posiva Oy), Timo Äikäs (Posiva Oy), Juhani Vira (Posiva Oy), Lennart Börgesson (Clay Technology AB), Pär Grahm (SKB), Richard Malm (Vattenfall Power Consultant AB), Rainer Laaksonen (VTT/STUK), Rainer Dallwig (Friedland Industrial Minerals GmbH), Peter Esko (Minelco AB), Dr. Dietrich Koch (S&B Industrial Minerals GmbH), Nina Piippo (Sibelco Nordic Oy Ab) and many others during 2011 and 2012.


DEFINITIONS AND ABBREVIATIONS ABM Alternative buffer material in situ test in Äspö HRL
coordinated by SKB for studying buffer and backfill materials.
AC-200 Powdered bentonite product form Milos, Greece
sold by Sibelco Nordic Oy. Backfill Backfill is the material or materials that is/are used
for backfilling of deposition tunnels. Buffer Compacted bentonite blocks and pellets surrounding
the copper canister in the deposition hole. Cebo Holland Supplier of Cebogel QSE pellets. Cebogel QSE Cylindrical bentonite rods/pellets made from 100 %
activated sodium bentonite by Cebo Holland. CEC Cation exchange capacity (eq/kg) reflecting the
montmorillonite content of a material. Degree of water saturation, Sr (%) The degree of water saturation is the ratio between
the volume of the pore water and the pore volume.
P
wr V
VS 100
Density of solid particles / Specific grain density, s [kg/m3] The density of solid particles is defined as the ratio
of the mass to the true volume of the solid matter in
a given amount of soil. s
ss V
m
Deposition hole The vertical hole where the disposal canister and the
surrounding buffer are emplaced in the KBS-3V concept.
Deposition tunnel The tunnel, where deposition holes are located in the
KBS-3V concept. Design requirement The technical design requirements of the repository
system are expressions of performance targets and target properties in a form that can be tested or otherwise proven at the stage of implementation through observations and measurements.

Design specification Design specifications are the detailed specifications to be used in the design, construction and manufacturing that have been derived from the more general design requirements. Design specifications are defined such that the fulfillment of these requirements can be verified at implementation.
DFN Discrete fracture network (model). Disposal facility All underground tunnels, shafts and holes (including
the repository) and related above ground buildings (excluding encapsulation plant).
Dry density The dry density is the ratio of the solid mass to the
bulk volume of a given amount of soil. V
msd
EBS Engineered Barrier System refers to the barrier
system including canister, buffer, backfill and closure.
EDZ Excavation Damaged Zone and/or Excavation
Disturbed Zone. The original state or properties of the bedrock have changed permanently in the zone, and the zone may affect the safety of disposal.
EMDD Effective Montmorillonite Dry Density (kg/m3). EYT EYT means that the system (in this case the
deposition tunnel backfill or the deposition tunnel plug) is classified as non-nuclear. This class is defined by STUK in the YVL guide 2.1.
FIM Friedland Industrial Minerals GmbH The company that quarries and produces Friedland
clay. Foundation bed/layer Layer of backfill material used for leveling the
tunnel floor. Friedland clay Clay product quarried by FIM Friedland Industrial
Minerals GmbH. Friedland clay is a smectite-containing clay from North-East Germany.
GD Government decree for the safety of nuclear waste
disposal.

Grain density Density of solid particles (kg/m3) defined as the relationship between weight of solids (Ws) and volume of solids (Vs).
HRL Hard Rock Laboratory. IBECO RWC BF Calcium bentonite from Milos (Greece) with a
medium montmorillonite content produced for nuclear waste disposal application (Radioactive Waste Clay BackFill) by IBECO.
Initial state Initial state is the state in which a given component
has been emplaced according to its design and remains after intentional engineering measures and executed controls have been completed.
KBS (Kärnbränslesäkerhet). The method for implemen-
ting the spent nuclear fuel disposal concept based on multiple barriers.
KBS-3V (Kärnbränslesäkerhet 3-Vertikal). The reference design alternative of the KBS-3 method in which the spent nuclear fuel canisters are emplaced in individual vertical deposition holes.
Liquid limit The liquid limit is the water content (%) at which a
soil changes from plastic to liquid behaviour. LO1, LO2 Loviisa reactors 1 and 2. Type VVER 440. Minelco Granules Bentonite raw material excavated by S&B Industrial
Minerals SA and processed by Minelco. Consists of high grade Na-activated Ca-bentonite from Milos (Greece).
MX-80 bentonite High grade sodium bentonite, known by the
commercial name MX-80, produced by American Colloid Company in Wyoming, USA and distributed by Askania. MX-80 is a blend of several natural sodium-dominated bentonite horizons, dried and milled to millimetre-sized grains (Karnland et al. 2006). The reference buffer material for Posiva Oy.
ONKALO The Olkiluoto Underground Rock Characterisation
Facility ONKALO demonstration (DEMO) tunnel Demonstration tunnel in the ONKALO at the depth
of 420 m.

OL1-4 Olkiluoto reactor units 1 - 4. OL1 and OL2 are BWR-reactors in operation, OL3 is EPR-type (in construction) and OL4 is so far only a decision-in-principle.
Performance target Safety functions are the main roles for each barrier in
establishing the long-term safety of the repository system, from which performance targets for the engineered barriers (canister, buffer, backfill, closure) and target properties for the host rock are defined considering their respective safety functions.
PLR Production Line reports Porosity Porosity is the ratio between the pore volume and
the bulk volume of the soil.
V
Vn p also
e
en
1
QA, QC Quality assurance, Quality control Repository Part of the disposal facility consisting of deposition
tunnels and holes. RH (%) Relative humidity percentage. Relative humidity
describes the amount of water vapour in a mixture of air and water vapour.
RSC Rock Suitability Classification Criteria. The aim of
the RSC is to define suitable rock volumes for the repository, deposition tunnels and deposition holes.
Safety functions Safety functions are the main roles for the barriers in
establishing the required long-term safety of the repository system.
STUK Radiation and Nuclear Safety Authority Finland. Swelling index Standard free swelling index tests where the free
swelling index is reported as a ratio of swelled material volume to initial material mass (ml/g).
T400, T300 Excavation tolerance of 400 mm and 300 mm. TDS Total dissolved solids (g/L).
TURVA-2012 Safety case portfolio
TURVA-2012 is Posiva’s safety case in support of the Preliminary Safety Analysis Report (PSAR) and application for a construction licence for a repository for disposal of spent nuclear fuel at the Olkiluoto site. The TURVA-2012 safety case for the disposal of spent nuclear fuel at Olkiluoto is compiled in a portfolio of main reports with supporting documents
VAHA Posiva’s requirement management system (in
Finnish “Vaatimusten hallintajärjestelmä”). Void ratio The void ratio is the ratio between the pore volume
and the volume of solids. s
p
V
Ve
Water content Water content gives the ratio between the mass of the pore water and the mass of the solid substance.
s
w
m
mw 100
XRD X-ray diffraction, an analytical method used to
identify minerals in a rock. XRF X-ray fluorescence, an analytical method used to
determine the chemical composition of the material. YJH-2012 programme YJH refers to the Finnish word “ydinjätehuolto”
meaning nuclear waste management. The YJH-2012 programme describes Posiva’s plans for further research, development and design during 2013-2018.
YVL Finnish nuclear regulatory guide(s). YVL refers to
the Finnish word “ydinvoimalaitos”. Äspö HRL Hard Rock Laboratory in Äspö, Sweden.


1
TABLE OF CONTENTS ABSTRACT TIIVISTELMÄ FOREWORD DEFINITIONS AND ABBREVIATIONS
1 INTRODUCTION ................................................................................................... 5 1.1 Structure and content ..................................................................................... 5 1.2 Purpose and objectives .................................................................................. 6 1.3 Limitations ...................................................................................................... 7 1.4 Interaction with other production line reports .................................................. 8
2 DESIGN BASIS FOR DEPOSITION TUNNEL BACKFILL AND PLUG ................. 9 2.1 Design basis related to the safety functions in the KBS-3 repository ............. 9
2.1.1 Safety functions, performance targets and design requirements ........ 9 2.1.2 Design specifications derived from the safety functions, performance targets and design requirements .................................................................. 13
2.2 Design basis related to the production and operation .................................. 15 2.3 Boundary conditions and interface to other barriers ..................................... 15
2.3.1 Inflow conditions ............................................................................... 15 2.3.2 Groundwater salinity ......................................................................... 17 2.3.3 Tunnel dimensions and volumes ...................................................... 18 2.3.4 Interface with the buffer and the deposition hole .............................. 20
3 REFERENCE DESIGN OF THE BACKFILL ....................................................... 25 3.1 General design ............................................................................................. 25 3.2 Backfill materials ........................................................................................... 26
3.2.1 Foundation layer ............................................................................... 26 3.2.2 Backfill blocks ................................................................................... 29 3.2.3 Pellets ............................................................................................... 30
3.3 Design of different backfill components ........................................................ 31 3.3.1 Foundation layer ............................................................................... 31 3.3.2 Backfill blocks ................................................................................... 32 3.3.3 Pellets ............................................................................................... 33
3.4 Design of backfill block assemblage ............................................................. 34 3.5 Volumes and masses ................................................................................... 36
4 PRODUCTION OF THE BACKFILL .................................................................... 39 4.1 Overview of the production line for the backfill ............................................. 39 4.2 Principles of quality assurance over the whole production chain ................. 39
4.2.1 Responsibilities in the production line for the backfill ........................ 39 4.2.2 Backfill material aqcuisition ............................................................... 39 4.2.3 Quality assurance of the production line ............................................. 41
4.3 Excavation and processing........................................................................... 50 4.3.1 Excavation at the mining site ............................................................ 50 4.3.2 Processing at the mining site ............................................................ 50 4.3.3 Quality control and inspection methods ............................................ 52 4.3.4 Acceptance for shipping .................................................................... 54

2
4.4 Delivery and acceptance of the delivered material batch ............................. 54 4.4.1 Shipment ........................................................................................... 54 4.4.2 Unloading and transportation to intermediate storage ...................... 55 4.4.3 Intermediate storage ......................................................................... 55 4.4.4 Quality control and inspection methods ............................................ 57 4.4.5 Preliminary acceptance of the delivered material batch ................... 57
4.5 Transport and storage at the production plant .............................................. 57 4.5.1 Transport........................................................................................... 57 4.5.2 Storage ............................................................................................. 58 4.5.3 Quality control, inspection methods and final acceptance of the delivered material batch for backfill production ............................................ 58
4.6 Manufacturing of blocks ................................................................................ 58 4.6.1 Overview of the process ................................................................... 58 4.6.2 Processing of the raw material for block pressing ............................ 59 4.6.3 Compacting method .......................................................................... 61 4.6.4 Quality control and inspection methods ............................................ 63 4.6.5 Experiences from block production ................................................... 63
4.7 Manufacturing of pellets ............................................................................... 64 4.7.1 Overview of the process ................................................................... 64 4.7.2 Processing of the raw material for pellet production ......................... 64 4.7.3 Manufacturing method ...................................................................... 65 4.7.4 Quality control and inspection methods ............................................ 67 4.7.5 Experiences from pellet production ................................................... 68
4.8 Preparation of the material for the foundation layer ..................................... 68 4.8.1 Processing of the raw material for the foundation layer .................... 68 4.8.2 Quality control and inspection methods ............................................ 68 4.8.3 Experiences from the field tests for conditioning the material ........... 68
4.9 Handling and transportation ......................................................................... 69 4.9.1 Intermediate storages ....................................................................... 69 4.9.2 Transportation to the repository level ................................................ 70 4.9.3 Quality control and inspection methods ............................................ 70
4.10 Preparation of deposition tunnel for backfill operations .......................... 70 4.10.1 Dismantling of the tunnel infrastructure ............................................ 70 4.10.2 Scanning of tunnel dimensions ......................................................... 70
4.11 Installation of the foundation layer .......................................................... 72 4.11.1 Installation method ............................................................................ 72 4.11.2 Quality control and inspection methods ............................................ 72 4.11.3 Experiences from in situ compaction field tests ................................ 73
4.12 Installation of backfill blocks .................................................................... 74 4.12.1 Installation method ............................................................................ 74 4.12.2 Quality control and inspection methods ............................................ 74 4.12.3 Experiences from the field tests ........................................................ 75
4.13 Installation of pellets ................................................................................ 75 4.13.1 Installation method ............................................................................ 75 4.13.2 Quality control and inspection methods ............................................ 75 4.13.3 Experiences from field tests .............................................................. 76
4.14 Backfill sequences and timing of operations ........................................... 77 4.15 Handling of backfill waste and rejected backfill materials ....................... 78
5 INITIAL STATE OF THE BACKFILL.................................................................... 79 5.1 Initial properties of backfill components ........................................................ 79 5.2 Variations in the backfill geometry ................................................................ 81 5.3 Variations in average dry density and EMDD ............................................... 81

3
5.4 Other properties ............................................................................................ 84 5.5 Total amount of backfill mass in a deposition tunnel .................................... 85 5.6 Uncertainties................................................................................................. 85
6 CONFORMITY OF THE REFERENCE BACKFILL TO DESIGN BASIS ............. 87 6.1 Density.......................................................................................................... 87 6.2 Hydraulic properties ...................................................................................... 87 6.3 Swelling properties ....................................................................................... 89 6.4 Chemical properties ...................................................................................... 94 6.5 Mechanical properties .................................................................................. 94 6.6 Uncertainties................................................................................................. 95
7 REFERENCE DESIGN FOR THE DEPOSITION TUNNEL PLUG ..................... 97 7.1 General ......................................................................................................... 97 7.2 Layout of the deposition tunnel plug, its components and their functions .... 97 7.3 Materials of the deposition tunnel plug ......................................................... 97
7.3.1 Concrete dome, beams and shotcrete .............................................. 97 7.3.2 Watertight seal ................................................................................ 100 7.3.3 Filter ................................................................................................ 100 7.3.4 Other components .......................................................................... 100
8 PRODUCTION OF THE DEPOSITION TUNNEL PLUG ................................... 101 8.1 Overview on the production line for the deposition tunnel plug .................. 101 8.2 Ordering, delivery and storage of the plug materials .................................. 101 8.3 Manufacturing the components of the deposition tunnel plug .................... 102 8.4 Installation of the deposition tunnel plug .................................................... 102 8.5 Principles of quality assurance for deposition tunnel plug production ........ 103
9 INITIAL STATE OF THE DEPOSITION TUNNEL PLUG .................................. 105
10 CONFORMITY OF THE DEPOSITION TUNNEL PLUG TO THE DESIGN BASIS ............................................................................................................. 107
11 SUMMARY AND CONCLUSIONS .................................................................... 109
REFERENCES ........................................................................................................... 111
LIST OF APPENDICES .............................................................................................. 117
APPENDIX 1: YVL Guidelines .................................................................................... 119
APPENDIX 2: Linkage between performance targets, design requirements and design specifications ....................................................................................... 121
APPENDIX 3: Environmental protection legislation .................................................... 123
APPENDIX 4: Inflow to deposition holes and deposition tunnels ............................... 125
APPENDIX 5: FIM Friedland Industrial Minerals GmbH product information of Friedland bentonit (comparable to Friedland clay) .............................................. 145
APPENDIX 6: Fimonit Seal product information (comparable to Minelco Granules) .. 147

4
APPENDIX 7: Rotek A/S product information of Bentonite QSE (comparable to Cebogel QSE) ..................................................................................... 149
APPENDIX 8: EMDD calculations for the OL1-3 case ............................................... 151
APPENDIX 9: EMDD calculations for the Lo1-2 case ................................................ 153
APPENDIX 10: Hydraulic conductivity and swelling pressure data for Friedland clay 155
APPENDIX 11: Minimum and maximum swelling pressures of Friedland clay .......... 157
APPENDIX 12: Measured swelling pressure data for Friedland clay/data used in Fig. 6-4 ................................................................................................................................................... 163
5
1 INTRODUCTION Posiva's spent nuclear fuel disposal is based on the KBS-3V concept and on the characteristics of the Olkiluoto site. As described in the KBS-3V concept, the spent nuclear fuel elements are disposed in copper-iron canisters, surrounded by bentonite buffer in the deposition hole. There are several deposition holes in one deposition tunnel. After all canisters have been disposed in a disposal tunnel, the deposition tunnel will be filled with backfilling material and the deposition tunnel will be closed with a plug. The disposal operation is planned to take place in a speed that one or two deposition tunnels will be needed in a year. After all deposition tunnels in a deposition panel are backfilled and plugged, the central tunnels and other openings in the panel will be backfilled and plugged, i.e. closed. The whole KBS-3V disposal system and its subsystems include safety functions determined by taking into account the regulatory requirements, operational safety and efficiency, environmental aspects and quality assurance. From the safety functions, performance requirements for each subsystem have been defined. These form the design basis of each subsystem. The performance requirements and design requirements derived from them have been compiled in the Design Basis report. This report belongs to a series of production line reports. The production line reports describe the design, production and initial state of each subsystem of the disposal system - the underground openings and the engineered barriers, i.e. the disposal canister, the buffer, the backfill and plug of the deposition tunnels and the closure of other underground openings. The design specifications of each subsystem and for its various phases of the production are presented in the production line report. The production line report addresses how the subsystem has been designed to meet the design requirements. The production of the subsystem comprises the purchase and handling of the raw material, the manufacturing of the subsystem components, the transportation and storing of the components prior to the installation, the installation and the quality assurance measures all through the production process. As a final outcome of the design and production, the initial state of the emplaced subsystem is described. The initial state of each subsystem serves as input information for the performance assessment of the subsystem and for the safety assessment of the whole disposal system. The design of the subsystem and the production phases, that are performed in the disposal facility or at the disposal site act as input information for Posiva's facility design. 1.1 Structure and content This report summarises the design basis, reference design, manufacturing and assembly of the deposition tunnel backfill and plug. In addition, quality management of the backfilling and several quality control measures in each phase of the backfilling process, are described. As a summary of the design and implementation, the initial state of the backfill and plug are determined as well as conformity to the design basis. However, the long-term evolution of the backfill and plug and the fulfilment of the performance targets are described in the Performance Assessment report. Recent research, development and design work done since 2009 (Posiva 2009a) has been taken into account in this report.

6
The design basis regarding performance targets and design requirements presented in this report are described and rationalised in the Design Basis report. The design specifications are presented in this report. The reference design of the backfill is presented in detail in Autio et al. (2012) and summarised in this report (Chapter 3). The backfill design is presented for deposition tunnels for the repository for the spent nuclear fuel from Olkiluoto reactors 1-4 (OL1-4) and from Loviisa reactors 1-2 (LO1-2). The reference design of the deposition tunnel end plug has been modified from a plug design presented in SKB’s Backfill Production Line report (SKB 2010) and summarised in this report (Chapter 7). The SKB's plug design has been applied to Posiva's deposition tunnels for for the repository for the spent nuclear fuel from both Olkiluoto and Loviisa. The purchase of backfill raw materials, principles of quality assurance and control as well as handling and storage of the raw materials are described in this report. Manufacturing of backfill components are described in this report, in Koskinen (2012) and in Hansen et al. (2010). Figure 1-1 describes the connections between the reports mentioned above. 1.2 Purpose and objectives The purpose of this report is to present performance targets, design requirements and specifications, design, the whole production chain, quality control and quality assurance measures in each step of production, initial state and fulfillment of requirements both for backfill and plug. The performance targets and design requirements have been derived from design basis presented in the Design Basis report. The objectives of the report are to:
- Describe design basis (performance targets, design requirements and specifications) used as basis of the backfill and plug design.
- Present the design of the backfill including detailed design of backfill materials and components (foundation layer, block assemblage and pellet fill).
- Present the design for the plug including detailed design of plug materials, concrete dome and other plug components.
- Describe the whole production chain, together with quality assurance and quality control measures in each step of the backfilling process
- Describe the initial state of the backfill/plug right after its installation. The description of the initial state includes variations in the properties of the backfill/plug and the information is used to evaluate the fulfillment of the design requirements and specifications in the initial state.

7
*The complete TURVA 2012 safety case portfolio reporting is described in Posiva (2012b). Figure 1-1. Connection between this report (referred as production line report), research, development and design work (RD&D) done during 2009-2012 and reports in the Turva 2012 portfolio and PSAR (preliminary safety assessment) topical reports. QA & QC refer to quality assurance and control. PLR refers to production line report.
1.3 Limitations The requirements that are described in this report are mainly limited to the system and design requirements established for long-term safety. Operational requirements presented in this report are preliminary and subject to changes. The description of the backfilling process concerns the operational phase of the disposal facility. In the development phase, the specifications and guides for various processes are developed and experience on them is collected from various tests. The final specifications and guides are reported in the operation licence application (phase). The report describes the design and implementation in the way it is planned today. The design and various phases of implementation are still under development and they may
8
change prior to the application for an operation licence. The future plans and planned development and testing work will be described in the YJH-2012 programme for nuclear waste management. The amount of spent nuclear fuel taken into account as the reference case in the planning of the repository and in the safety case is 9000 tU and the number of canisters is 4500 (Kirkkomäki 2012). This amount includes spent nuclear fuel from reactors Olkiluoto 1-3 (OL1-3) and Loviisa 1-2 (LO1-2) located at the community of Loviisa. In addition, the spent nuclear fuel from the reactor Olkiluoto 4 (OL4) currently being planned for the Eurajoki facility is included in this spent nuclear fuel amount. In this report, the backfill design for OL1-3 tunnels is applied also for OL4 tunnels. The plug design presented in this report has been designed for OL1-3 deposition tunnels. The plug design for LO-1-2 tunnels will be adapted from the plug design for OL1-3 tunnels in a later planning phase. The principles of the design can be applied also for LO1-2 deposition tunnels. The boundary between the buffer and the backfill has been determined for this report to be such that buffer is limited to -400 mm from the theoretical tunnel floor surface (see Figure 2-6). All filling above this limit belongs to the backfill by definition regardless of the design of the filling. The filling of rejected deposition holes is described shortly in the Buffer Production Line report. 1.4 Interaction with other production line reports This report has been compiled in close co-operation with the site, underground openings, closure and buffer line research and development groups. The filling of rejected deposition holes is discussed in the Buffer Production Line report, which also describes buffer-type filling components installed in certain cases between the buffer and the rock surface and in chamfers of the deposition holes (see Figure 2-6). The layout for the deposition hole buffer and overlying backfill materials are described in more detail in sections 2.3.3 and 2.3.4. The delivery chain for the material for backfill blocks is described in chapter 4 of this report. It is assumed that the delivery chain for foundation layer and pellet materials consisting of high-grade bentonite is similar to the delivery chain described for buffer materials described in Buffer production line report.

9
2 DESIGN BASIS FOR DEPOSITION TUNNEL BACKFILL AND PLUG 2.1 Design basis related to the safety functions in the KBS-3 repository 2.1.1 Safety functions, performance targets and design requirements The long-term safety principles set out for the KBS-3 method are based on the use of a multi-barrier disposal system consisting of engineered barriers and host rock. The engineered barrier system consists of the canister, buffer, backfill of the deposition tunnel and closure, The role of the engineered barriers is to provide the primary containment against the release of radionuclides. The host rock should provide favourable conditions for the long-term performance of the engineered barriers, but also limit or retard the transport of radionuclides. The multi-barrier system as a whole should be able to protect the living environment even if one of the barriers turns out to be deficient. The closing structures of the deposition tunnels consist of backfill and end plugs. The backfill considered in this report is the material or materials that is/are used for backfilling the deposition tunnels. Plugs will be placed at the mouth of the deposition tunnels. Any backfill materials or plugs used in parts of the repository other than the deposition tunnels are discussed in the Closure Production Line report. The principles and reasoning behind the long-term safety related requirements are based on STUK’s YVL guides (see Appendix 1 for backfill specific YVL guidelines) and other stakeholder requirements, including Finnish laws. These are described in detail in the Design Basis report and are being considered in Posiva’s safety concept and in the compilation of the TURVA-2012 safety case. The safety concept is a conceptual description of how safe disposal of spent nuclear fuel is achieved using the KBS-3 method, taking into account the characteristics of the Olkiluoto site. Based on this concept, safe disposal is achieved by long-term isolation and containment. Another key element is the multibarrier principle that has been defined in the Government Decree GD 736/2008:“The long term safety of disposal shall be based on redundant barriers so that deficiency in one of the barriers or a predictable geological change does not jeopardise long-term safety.” The roles of the barriers in establishing the required long-term safety of the repository constitute the safety functions of the barriers. The role of backfill materials and sealing structures according to STUK-YVL Guide D.5 Section 4.5 is to “limit transport of radioactive substances through excavated rooms”. According to Posiva (Design Basis report), the deposition tunnel backfill and the plug have the following safety functions: - Contribute to favourable and predictable mechanical, geochemical and
hydrogeological conditions for the buffer and canisters, - Limit and retard radionuclide releases in the possible event of canister failure, and - Contribute to the mechanical stability of the rock adjacent to the deposition tunnels.
10
According to Government Decree 736/2008: “the safety functions shall effectively prevent releases of radioactive substances at least several thousand years” and further based on YVL Guide D.5, the time-scale is further defined to be at least 10,000 years. The safety functions described above are implemented in the proposed design through a set of technical design requirements, based on performance objectives that are defined for each barrier of the repository system. The performance objectives are expressed as performance targets (engineered barriers) and target properties (natural barriers) that the system should meet in the long-term to provide the safety level needed. The technical design requirements of the repository system are expressions of these performance targets and target properties in a form that can be tested or otherwise proven at the stage of implementation through observations and measurements. Performance targets have been defined for each engineered barrier, i.e. for the canister, buffer, deposition tunnel backfill and end plug, and for closure backfill materials and sealing structures placed in other parts of the repository. The performance targets and design requirements set for the deposition tunnel backfill and plugs are presented in Tables 2-1 and 2-2. The rationales behind these are discussed in the Design Basis report. The deposition tunnel backfill is classified to safety class EYT meaning that the backfill is classified as non-nuclear. The deposition tunnel plug is classified to safety class EYT with the exception that the concrete dome is classified to safety class 3. The safety classification is described in YVL Guide B.2.

11
Tab
le 2
-1. P
erfo
rman
ce ta
rget
s an
d de
sign
req
uire
men
ts d
efin
ed fo
r th
e ba
ckfi
ll.
Per
form
ance
tar
get
s D
esig
n r
equ
irem
ents
D
efin
itio
n
The
sea
ling
stru
ctur
es o
f th
e de
posi
tion
tunn
els
cons
ist
of b
ackf
ill a
nd
plug
s. B
ackf
ill is
the
mat
eria
l or
mat
eria
ls th
at is
/are
use
d fo
r ba
ckfil
ling
the
depo
sitio
n tu
nnel
s.
Plu
gs w
ill
be
plac
ed
at
the
mou
ths
of
the
depo
sitio
n tu
nnel
s. T
he p
urpo
se o
f th
e ba
ckfil
l is
to
keep
the
buf
fer
in
plac
e, m
aint
ain
favo
urab
le a
nd p
redi
ctab
le c
ondi
tions
for
the
buf
fer
and
the
cani
ster
, an
d al
so f
avou
rabl
e ro
ck m
echa
nica
l, hy
drol
ogic
al
and
geoc
hem
ical
con
ditio
ns in
the
near
-fie
ld a
nd to
ret
ard
the
tran
spor
t of
rad
ionu
clid
es if
the
cani
ster
sta
rts
leak
ing.
The
mai
n co
mpo
nent
of t
he b
ackf
ill m
ater
ial s
hall
cons
ist o
f nat
ural
sw
ellin
g cl
ays.
Per
form
ance
Unl
ess
othe
rwis
e st
ated
, the
bac
kfill
and
plu
gs s
hall
fulfi
ll th
e pe
rfor
man
ce ta
rget
s lis
ted
belo
w o
ver
hund
reds
of t
hous
ands
of y
ears
in
the
expe
cted
rep
osito
ry c
ondi
tions
exc
ept f
or in
cide
ntal
dev
iatio
ns.
The
bac
kfill
sha
ll be
des
igne
d to
be
self-
seal
ing
afte
r in
itial
inst
alla
tion
and
self-
heal
ing
afte
r an
y hy
drau
lic o
r m
echa
nica
l dis
turb
ance
s.
Hyd
rau
lic a
nd
tra
nsp
ort
pro
per
ties
T
he b
ackf
ill s
hall
limit
adve
ctiv
e flo
w a
long
the
depo
sitio
n tu
nnel
s.
The
bac
kfill
sha
ll be
so
desi
gned
that
its
hydr
aulic
con
duct
ivity
ove
r th
e w
hole
cr
oss-
sect
ion
of th
e ba
ckfil
led
tunn
el w
ill b
e <
1x10
-10 m
/s a
fter
full
satu
ratio
n C
hem
ical
pro
per
ties
The
che
mic
al c
ompo
sitio
n of
the
back
fill a
nd p
lugs
sha
ll no
t jeo
pard
ise
the
perf
orm
ance
of t
he b
uffe
r, c
anis
ter
or b
edro
ck.
Bac
kfill
mat
eria
ls s
hall
be s
elec
ted
so a
s to
lim
it th
e co
nten
ts o
f har
mfu
l su
bsta
nces
(or
gani
cs, o
xidi
sing
com
poun
ds, s
ulph
ur a
nd n
itrog
en c
ompo
unds
) an
d m
icro
bial
act
ivity
. S
up
po
rt o
f o
ther
co
mp
on
ents
of
the
dis
po
sal s
yste
m /
mec
han
ical
pro
per
ties
T
he b
ackf
ill s
hall
keep
the
buffe
r in
pla
ce.
To
keep
the
buf
fer
in p
lace
, th
e de
sign
of
the
back
fill h
as t
o ta
ke in
to a
ccou
nt,
on
the
one
hand
, th
e co
mpr
essi
bilit
y an
d st
ruct
ural
stif
fnes
s of
the
bac
kfill
, an
d, o
n th
e ot
her
hand
, th
e bu
ffer
swel
ling
pres
sure
and
the
fric
tion
of b
uffe
r ag
ains
t th
e de
posi
tion
hole
wal
ls.
The
bac
kfill
sha
ll co
ntrib
ute
to p
reve
nt u
plift
ing
of t
he c
anis
ter
in t
he
depo
sitio
n ho
le.
(sam
e as
abo
ve)
The
ba
ckfil
l sh
all
cont
ribut
e to
th
e m
echa
nica
l st
abili
ty
of
the
depo
sitio
n tu
nnel
s.
In th
e in
itial
sta
te th
e ba
ckfil
l sha
ll ha
ve a
con
tact
with
the
host
roc
k.
11

12
Tab
le 2
-2. P
erfo
rman
ce ta
rget
s an
d de
sign
req
uire
men
ts d
efin
ed fo
r th
e en
d pl
ug.
Per
form
ance
tar
get
s D
esig
n r
equ
irem
ents
D
efin
itio
n
Clo
sing
st
ruct
ures
of
th
e de
posi
tion
tunn
els
cons
ist
of
back
fill
and
plug
s. P
lugs
will
be
plac
ed a
t th
e m
outh
of
the
depo
sitio
n tu
nnel
s.
The
plu
gs s
hall
cons
ist
of m
ater
ials
whi
ch h
ave
a go
od h
ydra
ulic
isol
atio
n ca
paci
ty a
nd w
hich
w
ill n
ot u
nder
go la
rge
volu
me
chan
ges
in th
e lo
ng te
rm.
Per
form
ance
U
nles
s ot
herw
ise
stat
ed,
the
back
fill
and
plug
s sh
all
fulfi
ll th
e re
quire
men
ts
liste
d in
V
AH
A
over
hu
ndre
ds
of
thou
sand
s of
yea
rs i
n th
e ex
pect
ed r
epos
itory
con
ditio
ns
exce
pt fo
r in
cide
ntal
dev
iatio
ns.
Hyd
rau
lic a
nd
tra
nsp
ort
pro
per
ties
T
he p
lugs
sha
ll is
olat
e th
e de
posi
tion
tunn
els
hydr
aulic
ally
du
ring
the
oper
atio
nal p
hase
of t
he r
epos
itory
. T
he p
lugs
sha
ll be
des
igne
d to
hav
e th
eir
hydr
aulic
isol
atio
n ca
paci
ty a
t le
ast
as l
ong
as t
he
cent
ral t
unne
ls a
re o
pen.
C
hem
ical
pro
per
ties
T
he c
hem
ical
com
posi
tion
of t
he b
ackf
ill a
nd p
lugs
sha
ll no
t je
opar
dise
th
e pe
rfor
man
ce
of
the
buffe
r,
cani
ster
or
be
droc
k.
Plu
g m
ater
ials
sha
ll be
sel
ecte
d so
as
to l
imit
the
cont
ents
of
harm
ful
subs
tanc
es (
orga
nics
, ox
idis
ing
com
poun
ds, s
ulph
ur a
nd n
itro
gen
com
poun
ds)
and
mic
robi
al a
ctiv
ity.
Su
pp
ort
of
oth
er c
om
po
nen
ts o
f th
e d
isp
osa
l sys
tem
/ m
ech
anic
al p
rop
erti
esT
he
plug
s sh
all
keep
th
e ba
ckfil
l in
pl
ace
durin
g th
e op
erat
iona
l pha
se.
The
plu
g sh
all
be d
esig
ned
to w
ithst
and
the
sum
of
the
swel
ling
pres
sure
of
the
back
fill
and
the
hydr
osta
tic p
ress
ure
of th
e gr
ound
wat
er a
t the
rep
osito
ry d
epth
. T
he p
lugs
mus
t be
des
igne
d to
mai
ntai
n a
back
fillin
g fu
nctio
n ev
en a
fter
thei
r hy
drau
lic
isol
atio
n ca
paci
ty h
as b
een
lost
.
12

13
2.1.2 Design specifications derived from the safety functions, performance targets and design requirements
The design specifications for the backfill and plug are presented in Table 2-3. Design specifications are detailed specifications determined for the design based on the performance targets and design requirements. The linkage between the performance targets, design requirements and design specifications is presented in Appendix 2. The reasoning behind the design specifications is given below. The reasoning behind the limits for the montmorillonite content and the dry density of backfill materials presented in Table 2-3 is based on the idea that sufficient mass (kg) of swelling minerals should be present in a unit volume of backfill (1 m3) in order for the system to be able to homogenize, self-heal and provide a hydraulic conductivity <1x10-
10 m/s. Another expression for this is the effective montmorillonite dry density (EMDD) discussed later in more detail in Chapter 5 (Initial state of backfill). Desired properties can be achieved in the design by determining the right combination of smectite content and dry density for the backfill components. For this the natural range of smectite content needs to be known as well as to what dry density the components can be manufactured and installed. For example, based on block manufacturing tests described later in Section 4.6 (Manufacturing of blocks) for Friedland clay, fairly high dry densities (>2000 kg/m3) have been gained for this particular material. Therefore, the material can be used in this application, although the montmorillonite content is fairly low (30-38%, see Chapter 5, Initial state of backfill). Batches having smectite content less than the specified lower limit will not be accepted for the backfill production. This will be ensured with quality assurance and control measures described in Section 4.2 (Principles of quality assurance over the whole production chain). The reasoning behind the specifications given for the backfill geometry is that the proportion of backfill components in the tunnel cross-section shall be suitable to provide sufficient homogenization and hydraulic properties. In addition, the backfill as a structure should provide sufficient structural stiffness to prevent buffer heave also when the backfill is in unsaturated state. Other things to consider in the geometry are for example installation tolerances of the pellets and the ability of the pellets to store water and protect the blocks from erosion. In addition, the tunnel geometry and especially excavation tolerances affect the maximum thickness of the foundation layer and the pellet filling. The reference design is presented in Chapter 3 (Reference design). The limits for the chemical properties of backfill concern the organics, sulphur and sulphide contents of the materials. The limits were set for these specific chemical components because they may affect canister corrosion. The limits have not yet been determined for the backfill and therefore they are the same as for buffer material. The design specifications for buffer have been presented in Buffer Production Line report. The design specifications for the deposition tunnel plug partly reflect the design of the plug (Chapter 7) and partly the requirements set for the plug design. The plug design aims to provide sufficient structural stiffness and water tightness to ensure the system performs as intended. The water tightness is based on low hydraulic conductivity of the concrete plug together with the sealing ability of the bentonite seal. The limits for organics, sulphur and sulphide contents are the same as for buffer. The reasoning behind

14
the calcium and silica mass ratio is that a high pH increases the risk of montmorillonite dissolution. The design life-time of the plug is at least 100 years, which is when the central tunnels are to be closed. Table 2-3. Design specifications for backfill and deposition tunnel end plug.
1 PERFORMANCE 1.1 BACKFILL Montmorillonite content: The montmorillonite content of Friedland clay blocks shall be 30-38%. The foundation layer and pellets shall consist of bentonite with montmorillonite content between 75-90% Dry density: The dry density of Friedland clay blocks shall be within the range of 1990-2070 kg/m3. The dry density of the foundation layer shall be within the range of 1150-1350 kg/m3. The dry density of the pellet fill shall be within the range of 900-1100 kg/m3 Geometry: The backfill blocks shall have following dimensions: 550 x 470 x 330 mm. The manufacturing tolerance shall be -1 mm / +2 mm. The block filling degree (from the theoretical/nominal cross-section) shall be >80%. The gap width between the blocks and the theoretical tunnel wall/roof shall be 100 mm. The pellet fill shall fill the remaining open gap between the blocks and rock. The thickness of the foundation bed shall be maximum +150 mm above the theoretical floor layer. Considering excavation tolerance of +400 mm, the maximum thickness of the foundation layer is 550 mm. 1.2 PLUG The plug shall consist of a concrete dome, bentonite seal and a filter layer. The thickness of the sealing and filter layers is 750 mm. The thickness of the concrete dome is 1500 mm measured from the centre of the plug. The concrete shall be watertight after installation. The hydraulic conductivity of the concrete mass shall be <1x10-11 m/s. The bentonite seal shall consist of bentonite with montmorillonite content of 75-90%. In order to ensure sufficient sealing capacity the dry density shall be >1400 kg/m3. The sealing layer shall be pre-saturated to ensure water tightness after installation of the plug. The filter layer shall consist of sand or crushed rock with grain size distribution optimised for filtering. The plug shall maintain its hydraulic isolation capacity for at least 100 years. 2 CHEMICAL PROPERTIES 2.1 BACKFILL The organics content in the backfill shall be lower than 1 wt-%. The total sulphur content in the backfill shall be less than 1 wt-%, with sulphides making, at most, half of this. 2.2 PLUG The cementitious materials that are used in plugs shall have a calcium to silica mass ratio less than 1:6. The organics content in the plug shall be lower than 1 wt-%. The total sulphur content in the plug shall be less than 1 wt-%, with sulphides making, at most, half of this. 3 SUPPORT OF OTHER COMPONENTS OF THE DISPOSAL SYSTEM/MECHANICAL PROPERTIES 3.1 PLUG The mechanical strength of the plugs shall correspond to a pressure load of at least 7.5 MPa including the ambient hydrostatic pressure. The main material component in the plug shall be quartz sand or crushed rock.

15
2.2 Design basis related to the production and operation From the production point of view, the backfill materials shall be excavated, manufactured, transported and installed in a way that they do not contradict any Finnish legislation concerning for example occupational safety or environmental protection (see Appendix 3). During the production of the backfill and plug, it is probable that the environment is somewhat affected by dust and noise, therefore the environmental impact of the operations needs to be assessed before the operations begin. One principle to be taken into account in the backfill production is the efficiency of the processes regarding energy and raw material consumption. From the occupational safety point of view it is important that safety precautions are taken into account in all stages of the backfill and plug production. 2.3 Boundary conditions and interface to other barriers 2.3.1 Inflow conditions The expected groundwater inflow conditions to open repository tunnels and deposition holes are described in detail in Appendix 4. The expected groundwater conditions are based on inflow estimates from a hydrogeological DFN model 2008 presented in Hartley et al. (2010). Recently, the hydrogeological DFN model has been revised (Hartley et al. 2012) and an updated estimate on the inflow to deposition holes and tunnels is being produced. However, the inflow conditions depend also on the results of grouting and the rock suitability classification (RSC) criteria applied to deposition tunnels. According to the RSC (McEwen et al. 2012), the maximum local (fracture related) inflow to a deposition tunnel is 0.25L/min. No total inflow limitation has been determined for the whole tunnel. Grouting criteria is 0.2 L/min, so whenever higher leakages are observed in a probe hole, pre-grouting before excavation of that section will be performed. If necessary, post-grouting after excavation can also be performed. If the inflow from a single fracture is still >0.25L/min after grouting, the RSC-criterion is not fulfilled and the use of the deposition tunnel or that section in the tunnel will be evaluated. The maximum inflow allowed into a deposition hole is 0.1 L/min. No grouting is allowed in deposition holes and if grouting material is observed in a deposition hole it will be rejected. Based on the natural groundwater conditions and the information presented above, four different inflow cases have been defined for backfill design purposes (see Figure 2-1): - Wet tunnel case 1: Natural groundwater inflow to the whole tunnel is 5 L/min. In
this case,most of the inflow (>1 L/min) comes from one fracture accompanied by fractures with smaller inflows (0.1 L/min or less) in a tunnel section with length of 20-30 m. The probability that the inflow to the tunnel is higher than 5 L/min is ~20 %.
- Wet tunnel case 2: Same as case 1, but the inflowing fracture has been grouted limiting the total inflow to the tunnel to ~1 L/min.
- Typical tunnel case: Natural groundwater inflow to the whole tunnel is 0.5 L/min. The inflow comes from a group of fractures with an inflow of 0.1 L/min or less. The probability that the inflow to the tunnel is higher than 0.5 L/min is ~50 %.

16
- Dry tunnel case: Natural groundwater inflow to the whole tunnel is <0.01 L/min. The probability that the flow is equal to 0.01 L/min or lower than this is ~22 %.
Taking into account the possibility that a significant number of inflowing fractures are located near each other, a case where the majority of the total inflow to the open backfill front comes through a single flow path in the backfill can be considered as the worst case for the installation of backfill. This case can be justified by the fact that the merging of originally separate inflow paths has been seen in tests performed for the backfill at Äspö and Riihimäki (see e.g. Dixon et al. 2011b) and therefore cannot be ruled out. For example, if the inflows from one 20-30 m long tunnel section were combined into one pathway, it would be possible that the inflow through this pathway would be ~0.5 L/min. This amount of water is sufficient to disturb the installation of backfill and should be handled with some technical solution.
Figure 2-1. The inflow cases taken into account in the backfill design are: 1) Wet tunnel case 1 with total inflow of 5 L/min before grouting. 2) Wet tunnel case 2 representing the same case as wet tunnel case 1, but after grouting having total inflow of 1 L/min. 3) Typical tunnel case with total inflow of 0.5 L/min. 4) Dry tunnel case with total inflow of 0.01 L/min.

17
2.3.2 Groundwater salinity
Based on Löfman et al. (2010), the initial salinity of groundwater at repository level is 12 g/L (TDS) on average. The evolution of salinity has been studied by Löfman & Poteri (2008) and Löfman & Karvonen (2012). It is shown that the maximum salinity increases until the end of the operational period, after which it starts to decrease (see Figure 2-2). Based on the updated model (Löfman & Karvonen 2012), the maximum salinity at the repository level will be 25-30 g/L (TDS). The average salinity is ~10 g/L (TDS). The lowest salinity at the repository level is >1 g/L (TDS). The maximum salinity in the reference volume (repository level and ±50 m from the repository level) is 33-44 g/L (TDS) depending on the model variant (see Figure 2-2). Even under the most pessimistic assumptions of the parameters affecting salt transport, the salinities will remain below 60 g/L (TDS). The minimum value for the reference volume is >0.3-0.5 g/L (TDS) (Löfman & Karvonen 2012). The requirement concerning salinity of the groundwater in the host rock is as follows (Design Basis report): “Groundwater at the repository level shall have limited salinity so that the buffer and backfill will maintain a high enough swelling pressure. Therefore the groundwater salinity (TDS, total dissolved solids) at the repository level shall, in general be below 35 g/L but local or temporal variations up to 70 g/L can be allowed.” Based on this requirement and the natural variation of groundwater salinities presented above, the salinities against which the properties of the backfill are evaluated are tap water, 10 g/L, 35 g/L and 70 g/L (TDS). In addition, studies have been made in dilute water conditions to study the chemical erosion of the material.
Figure 2-2. Salinity evolution during the excavation and operation period, and after closure until 50,000 years after starting of ONKALO construction. The maximum, minimum and average salinity in the reference volume for different model variants (Löfman & Karvonen 2012).

18
2.3.3 Tunnel dimensions and volumes The cross-sections of the deposition tunnels for spent nuclear fuel from Olkiluto (OL) and Loviisa (LO) are presented in Figure 2-3. The theoretical cross-section of the deposition tunnels for Olkiluoto 1, 2 and 3 canisters is 14.00 m2 and for Loviisa canisters 12.61 m2 (Saanio et al. 2010). The width of the tunnel is 3500 mm for both tunnel types, but the height is 4400 mm for Olkiluoto tunnel type and 4000 mm for LO1-2 tunnel. There are variations in the tunnel cross-section due to technical limitations of the drill and blast excavation method. The blasting holes are always drilled with a small inclination outwards (look out angle) from the theoretical profile. In practice it means that the volume of the tunnel is always smaller in the location where the drilling has started compared to the location where the drill holes ends (see Figure 2-4). The maximum tolerances to be taken into account in the backfill design are the ones determined for the ONKALO demonstration tunnel, i.e. 400 mm (T400) for the floor and 300 mm (T300) for the walls/arch (see Figure 2-5) (Underground Openings Production Line report). Taking into account the maximum possible tunnel volume (+36 % from the theoretical volume), the maximum cross-section (or unit volume) for OL1-3 tunnels is 19.04 m2 and for LO1-2 tunnels 17.14 m2. The maximum length of deposition tunnels is set to 350 m (Kirkkomäki 2012). The total number of deposition tunnels in the repository is 197 and the total length is 58,400 m, leading to an average length of 296-297 m (Kirkkomäki 2012). Based on Kirkkomäki (2012), the theoretical total volume of deposition tunnels (excluding deposition holes) is roughly 874,000 m3. The total theoretical volume to be backfilled (total theoretical volume of deposition tunnels excluding volume of plugs and volume between the plug and central tunnel) is ~735,000 m3. Taking into account the average tunnel volume (+18 % from the theoretical volume), the total volume to be backfilled is 860 000-870 000 m3. Deposition holes are drilled into the floor of the deposition tunnel. The diameter of the hole is 1750 mm and the depth varies for different canister types and is 6.6 m for LO1-2 canisters, 7.8 m for OL1-2 canisters and 8.25 m for OL3 canisters (Saanio et al. 2010). The distance between the holes is 7.3 m (LO1-2), 9.1 m (OL1-2) and 10.8 m (OL3) assuming a tunnel spacing of 25 m (Ikonen 2009). The average distance between deposition holes is ~10 m. The maximum number of deposition holes is 33-48 per tunnel. The number of rejected canister positions is estimated to be ~20 % (Kirkkomäki 2012). The filling of rejected deposition holes is described in the Buffer production line report.

19
Figure 2-3 Theoretical cross-sections for Olkiluoto and Loviisa deposition tunnels (Saanio et al. 2012).
Figure 2-4. Schematic illustration showing the effect of the drill and blast technique on the tunnel geometry.

20
Figure 2-5. The solid black line presents the theoretical cross-section and the dotted green line the cross-section based on maximum tolerances for the OL1-3 deposition tunnels. 2.3.4 Interface with the buffer and the deposition hole The backfill is in contact with the buffer and the walls of the deposition hole. The buffer consists of bentonite with the montmorillonite content between 75-90 %. The reference bentonite is MX-80 Na-bentonite from Wyoming, USA, but other bentonites have also been considered as alternatives (Juvankoski 2010). The dry density of the homogenised buffer (i.e. density taking into account the gaps between the buffer and rock and between buffer and the canister) varies between 1591-1595 kg/m3 and the saturated density 2012-2015 kg/m3 (Buffer Production Line report). Initially the dry density of ring shaped buffer blocks is 1752 kg/m3 and disk blocks 1701 kg/m3 (Buffer Production Line report). The initial gravimetric water content of the buffer blocks is 17 % and when saturated 26-27 %. Taking into account that the saturated density of the buffer is <2050 kg/m3 and montmorillonite content of max 90 %, the swelling pressure from the buffer is in the base case <15 MPa (Buffer Production Line report). The design boundary between buffer and backfill is presented in Figure 2-6. The buffer is limited to -400 mm from the theoretical excavation surface at the tunnel floor and buffer thickness is 2500 mm above the canister (Buffer Production Line report). Depending on the position of the rock surface between the theoretical excavation line and the -400 mm line representing the maximum excavation tolerance, there will be in some cases a need to fill the upper part of the deposition hole with buffer type of

21
material. This volume is filled up to the rock surface with filling components having the same material composition and density as the buffer blocks. In addition, the installation production and quality control of these components follow the production line of buffer components (presented in Buffer Production Line report). The upper part of the deposition hole for OL1, OL2 and OL3 canisters is notched with a chamfer to facilitate the emplacement of canisters (Juvankoski 2010, Buffer Production Line report), see Figure 2-7 for dimensions. In case of OL3 chamfer, the lower part of the chamfer (below -400 mm level) belongs to buffer and the upper part (above -400 mm level up to the rock surface) to backfill. The chamfer for OL1-2 is completely above the -400 mm level and belongs to backfill. However, the chamfers are filled up to the rock surface with a buffer-type material (see Buffer Production Line report). In addition, the production, installation and quality control of the chamfer components follow the production line of buffer components (Buffer Production Line report).

22
Figure 2-6. Design boundary between the buffer and the backfill for the LO1-2 spent nuclear fuel canisters (upper figure) and for the OL1-3 spent nuclear fuel canisters (lower figure). The buffer design is presented in the Buffer Production Line report.

23
Figure 2-7. Cylindrical shaped chamfers for OL1-2 (right) and OL3 (left) deposition holes (Buffer Production Line report). In the OL3 case the depth of the chamfer (h) from the surface of the foundation bed layer is 0.900 m and radius (r) is 0.825 m. The height of the buffer block (t) in the chamfer for OL3 is 0.350 m. In the OL1-2 case the depth of the chamfer from the surface of the foundation bed layer (h) is 0.520 m and radius (r) is 0.825 m. For other dimensions see the Buffer Production Line report.

24

25
3 REFERENCE DESIGN OF THE BACKFILL 3.1 General design The backfill design presented in this report is described in detail in Autio et al. (2012). The main body of backfill consists of three main components as shown in Figure 3-1: - Pre-compacted backfill blocks, - Foundation layer providing a stable foundation for the block assemblage, and - Pellets used for backfilling the remaining empty space between the blocks and the
rock. These components are described in detail in Sections 3.3.1 (Foundation layer), 3.3.2 (Backfill blocks) and 3.3.3 (Pellets). The backfill materials are described in Section 3.2 (Backfill materials).
Figure 3-1. A schematic figure showing the main backfill components: foundation layer, backfill blocks and pellets. The tunnel size is for spent nuclear fuel from Olkiluoto. The inner black dotted line is showing the theoretical excavation profile and the outer, the maximum possible cross-section of the tunnel assuming tolerances of 400 mm for the floor and 300 mm for the walls/roof. In reality the rock surface will be located between these two lines (an example is illustrated in this figure).

26
Figure 3-2. A schematic figure showing the main components of the backfill and the location of the deposition tunnel plug. 3.2 Backfill materials 3.2.1 Foundation layer The foundation layer consists of raw bentonite with a smectite content between 75-90%. An example of a suitable product is Minelco granules produced by Minelco AB (Figure 3-3, Appendix 5). This product was used in foundation layer field tests by Wimelius & Pusch (2008). The raw material of Minelco granules originates from Milos, Greece. The Tertiary Ca-rich bentonite deposits in Greece are mainly located in the eastern part of the island of Milos. They are thought to have formed through hydrothermal alteration of pyroclastic tuffs and lavas of andesitic and rhyolitic composition, but their origin is still under debate (e.g. Christidis et al. 1995). Bentonite deposits are occasionally more than 30 m thick and form irregular bodies in pyroclastics (Christidis & Dunham 1993). The raw material for Minelco granules is excavated by S&B Industrial Minerals SA, the largest producer of Milos bentonite, and processed, pelletised, and sold by Minelco, a subsidiary of Swedish iron ore and industrial minerals producing LKAB. Minelco granules consist of high grade Na-activated Ca-bentonite. A similar type of material, but in powder form, is sold in Finland under the product name AC-200 by Sibelco Nordic Oy Ab. The average swelling index of Minelco granules is 25 ml/2g, and the average liquid limit 438 % (based on data of Ahonen et al. 2008, Dixon et al. 2008a, Kiviranta & Kumpulainen 2011). The grain density of Minelco granules is 2.80 g/cm3 (Kiviranta & Kumpulainen 2011). The granule size distribution of Minelco granules is: 1 % <0.063 mm, 2 % 0.063-0.125 mm, 4 % 0.125-0.25 mm, 10 % 0.25-0.5 mm, 20 % 0.5-1.0 mm, 27 % 1-2 mm, 19 % 2-4 mm, 9 % 4-8 mm and 10 % >8 mm (Kiviranta & Kumpulainen 2011), and it is shown in Figure 3-4.

27
Figure 3-3. Minelco granules, Friedland clay and Cebogel QSE pellets from left to right.
Figure 3-4. Granule size distribution for Minelco granules and Friedland clay. Based on studies of Ahonen et al. (2008), Laaksonen (2010c), Kumpulainen & Kiviranta (2010) and Kiviranta & Kumpulainen (2011), Minelco granules and similar type of powdered material (AC-200) contains, on average, 52.8 % SiO2, 16.5 % Al2O3,

28
5.4 % Fe2O3, 0.7 % TiO2, 4.0 % MgO, 6.1 % CaO, 2.6 % Na2O, 0.8 % K2O, 1.7 % total C (from which 0 % is organic), and 0.4% total S (from which 0.3 % is sulphidic). The sulphidic sulphur content varied in the referred studies between 0.3 and 0.4 wt-% (corresponding to 0.5-0.7 wt-% of sulphides (as FeS2)), and the total sulphur content between 0.3 and 0.5 wt-% (Table 3-1). The exchangeable cation sites of Minelco granules and similar type of powdered material (AC-200) are occupied, on average, 0.09 eq/kg by Ca, 0.02 eq/kg by K, 0.10 eq/kg by Mg and 0.74 eq/kg by Na, and they have, on average (Table 3-2), cation exchange capacity of 0.89 eq/kg (based on data from Ahonen et al. (2008), Kumpulainen & Kiviranta (2010), and Kiviranta & Kumpulainen (2011)). Table 3-1. Material properties, composition and variability for Minelco granules and similar type material (AC-200).
Min Average Max Number of samples
References
Clay minerals (wt-%)
73 82 94 5 Kumpulainen & Kiviranta (2010), Ahonen et al. (2008), Kiviranta & Kumpulainen (2011)
Smectite (wt-%) 67 80 94 5 Kumpulainen & Kiviranta (2010), Ahonen et al. (2008), Kiviranta & Kumpulainen (2011)
S (total) (wt-%) 0.27 0.36 0.46 4 Laaksonen 2010c, Kumpulainen & Kiviranta (2010), Ahonen et al. (2008), Kiviranta & Kumpulainen (2011)
S (sulphidic) (wt-%) 0.29 0.34 0.39 2 Kumpulainen & Kiviranta (2010), Kiviranta & Kumpulainen (2011)
C (organic) (wt-%) 0.00 0.02 0.03 2 Kumpulainen & Kiviranta (2010), Kiviranta & Kumpulainen (2011)
CEC (eq/kg) 0.78 0.89 0.99 4 Kumpulainen & Kiviranta (2010), Ahonen et al. (2008), Kiviranta & Kumpulainen (2011)
Based on a comparison of mineralogical analyses from various sources (Ahonen et al. 2008, Kumpulainen & Kiviranta 2010, and Kiviranta & Kumpulainen 2011), Minelco granules and a similar type of powdered material (AC-200) contain approximately 82 % clay minerals. On average, Minelco granules and AC-200 contain 80 % smectite and 6.1 % illite, 10 % carbonate, 1.8 % quartz, 4.2% feldspar, 2.4 % pyrite, 0.4 % titanium oxides, and 1.2 % iron oxides. The precision in the mineralogical analysis using the Rietveld refinement is approximately ±2% when the mineral content is approximately 80 wt-% as it is for smectite (Kiviranta & Kumpulainen 2011), but uncertainty is much higher for accessory or trace amounts of mineral phases such as sulphides. Consequently, the chemical analysis gives more reliable answer to the amount of sulphides that are present only as traces (<1 wt-%) than mineralogical analysis (Kiviranta & Kumpulainen 2011). The smectite content varied in the referred studies between 67 and 94 wt-% (Table 3-1).

29
3.2.2 Backfill blocks The reference material for backfill blocks is Friedland clay (Figure 3-3, Appendix 6). This material was selected as the reference material based on previous studies performed in the Baclo programme (summarised in Keto et al. 2009) and Posiva’s own backfill studies presented e.g. in Hansen et al. (2010) and Schatz & Martikainen (2012). Friedland clay is smectite rich clay from North-East Germany, Neubrandenburg, and quarried currently by FIM Friedland Industrial Minerals GmbH. The clay was formed during Tertiary, more precisely the Eocene epoch approximately 35-57 million years ago, by sedimentation of detrital weathering products and volcanic ash in a marine basin (Henning & Kashbom 1998). The Friedland area has overall clay deposits of 400 Mt, with the largest single deposit being 100 Mt (Roskill 2008). The average swelling index for two batches of Friedland clay (Kiviranta & Kumpulainen 2011) is 4 ml/2g, and the average liquid limit 81 %. Grain density of Friedland clay is 2.83 g/cm3 (Kumpulainen & Kiviranta 2011, Kiviranta & Kumpulainen 2011). The average granule size distribution of two batches of Friedland clay that have been used for compression of blocks with success by Koskinen (2012) is: 8 % <0.063 mm, 13 % 0.063-0.125 mm, 75 % 0.125-1.0 mm, 5 % 1-2 mm, and 0.5 % >2 mm (data from Kiviranta & Kumpulainen 2011), and shown in Figure 3-3. Based on FIM Friedland Industrial Minerals GmbH (2011a, 2011b), Pusch (1998), Carlson (2004), Karnland et al. (2006), and Kumpulainen & Kiviranta (2010), Friedland clay contains on average 59 % SiO2, 17 % Al2O3, 6.8 % Fe2O3, 0.9 % TiO2, 2.0 % MgO, 0.4 % CaO, 1.0 % Na2O, 2.5 % K2O, 0.8 % total C (0.3 % organic C), and 0.6 % total S (0.4 % sulphidic). The sulphidic sulphur content varied in the referred studies between 0.4 and 0.5 wt-% (corresponding to 0.7-0.9 wt-% of sulphides (as FeS2)), the total sulphur content between 0.5 and 0.7 wt-%, and the organic carbon content between 0 and 0.6 wt-% (Table 3-2). Friedland clay’s exchangeable cation sites are occupied, on average, 0.02 eq/kg by Ca, 0.03 eq/kg by K, 0.04 eq/kg by Mg and 0.28 eq/kg by Na, and it has, on average (Table 3-2), a cation exchange capacity of 0.33 eq/kg (based on data from FIM Friedland Industrial Minerals GmbH (2011b), Carlson (2004), Karnland et al. (2006), Kumpulainen & Kiviranta (2010), and Kiviranta & Kumpulainen (2011)). Comparison of mineralogical composition from various sources (FIM Friedland Industrial Minerals GmbH (2011a, 2011b), Pusch (1998), Karnland et al. (2006), Kumpulainen & Kiviranta (2010), and Kiviranta & Kumpulainen (2011)) showed that Friedland clay contains on average 72 % clay minerals. Friedland clay contains, on average, 33 % smectites, 25 % illite, 9 % mica (muscovite) and 10 % kaolinite. The smectite and illite occur together forming a mixed-layered structure. Additionally, Friedland clay contains, on average, 22 % quartz, 3.4% feldspar, 1.1 % pyrite, 1.3 % gypsum, and 1.9 % carbonate. The smectite content reported ranged between 30 and 38 wt-% (Table 3-2).

30
Table 3-2. Material properties, composition and variability for Friedland clay. Min Average Max Number
of samples References
Clay minerals (wt-%)
66 72 78 8 FIM Friedland Industrial Minerals GmbH (2011a, 2011b), Pusch (1998), Karnland et al. (2006), Kumpulainen & Kiviranta (2010), Kiviranta & Kumpulainen (2011)
Smectite (wt-%) 30 33 38 5 Karnland et al. (2006), Kumpulainen & Kiviranta (2010), Kiviranta & Kumpulainen (2011)
S (total) (wt-%) 0.51 0.58 0.70 4 Carlson (2004), Karnland et al. (2006), Kumpulainen & Kiviranta (2010)
S (sulphidic) (wt-%) 0.37 0.41 0.47 3 Karnland et al. (2006), Kumpulainen & Kiviranta (2010)
C (organic) (wt-%) 0.02 0.30 0.60 4 Carlson (2004), Karnland et al. (2006), Kumpulainen & Kiviranta (2010)
CEC (eq/kg) 0.21 0.33 0.60 7 FIM Friedland Industrial Minerals GmbH (2011a, 2011b) Pusch (1998), Carlson (2004), Karnland et al. (2006), Kumpulainen & Kiviranta (2010)
3.2.3 Pellets The pellets material consists of bentonite with smectite content between 75-90 %. An example of suitable material is Cebogel QSE pellets (Figure 3-3, Appendix 7) used in various backfill field and laboratory test (see e.g. Keto et al. 2009). The raw material of Cebogel QSE pellets originates from Milos, Greece, excavated by S&B Industrial Minerals SA, and further processed and compressed in Netherlands by Cebo Holland BV, a subsidiary of S&B Industrial Minerals SA. Pellets consist of high grade Na-activated Ca-bentonite. Similar type of material that is powdered is sold under the product name AC-200 by Sibelco, a company that is one of the stakeholders of S&B Industrial Minerals SA. Cebogel QSE pellets have been manufactured by extrusion technique (pushing material through a die with holes) and they have a diameter of 6.5 mm and a length of 5-20 mm (Keto et al. 2009). According to the manufacturer Cebo Holland BV the dry density of an individual pellet is 2.10 g/cm3. The average swelling index for three batches of Cebogel QSE pellets (data from Ahonen et al. 2008, Dixon et al. 2008a, Kiviranta & Kumpulainen 2011) is 25 ml/2g, and average liquid limit 570 %. The grain density of Cebogel pellets is 2.84 g/cm3 (Kiviranta & Kumpulainen 2011). The average bulk density of individual pellets is 2.07 g/cm3. Based on Ahonen et al. (2008), Laaksonen (2010c), Rotek A/S (2011), Kumpulainen & Kiviranta (2010) and Kiviranta & Kumpulainen (2011), Cebogel pellets and similar type of powdered material (AC-200) contains, on average, 54.5 % SiO2, 17.1 % Al2O3, 5.0 % Fe2O3, 0.8 % TiO2, 3.4 % MgO, 5.8 % CaO, 3.1 % Na2O, 0.9 % K2O, 1.6 % total C

31
(from which 0.02 % is organic), and 0.5 % total S (from which 0.5 % is sulphidic). The sulphidic sulphur content reported varied between 0.4 and 0.5 wt-% (corresponding to 0.7-1.0 wt-% of sulphides (as FeS2)), and the total sulphur content was between 0.5 and 0.7 wt-% (Table 3-3). It can therefore be stated that this material fulfills the requirements concerning chemical composition. Cebogel QSE pellets and a similar type of powdered material (AC-200) exchangeable cation sites are occupied, on average, 0.08 eq/kg by Ca, 0.02 eq/kg by K, 0.07 eq/kg by Mg and 0.87 eq/kg by Na, and it has, on average a cation exchange capacity of 0.96 eq/kg (Table 3-3, based on data from Laaksonen (2010c), Ahonen et al. (2008), Kumpulainen & Kiviranta (2010) and Kiviranta & Kumpulainen (2011)). Based on comparison of various sources (Ahonen et al. 2008, Hansen et al. 2010, Kumpulainen & Kiviranta (2010) and Kiviranta & Kumpulainen 2011), Cebogel pellets and the similar powdered material AC-200 contain, on average, 82 % clay minerals. The material contains 80% smectite and 5.2 % illite. Additionally, Cebogel pellets and AC-200 contain, on average, 8.1 % carbonate, 1.7 % quartz, 3.1 % plagioclase, 2.6 % pyrite, 0.3 % titanium oxides, 1.4 % amorphous silica and 1.2 % iron oxides. The smectite content reported in the referenced studies ranged between 69 and 94 wt-% (Table 3-3). Table 3-3. Material properties, composition and variability for Cebogel pellets and similar type material (AC-200). Min Average Max Number
of samples References
Clay minerals (wt-%)
73 82 94 6 Ahonen et al. (2008); Hansen et al. (2010), Kumpulainen & Kiviranta (2010), Kiviranta & Kumpulainen (2011)
Smectite (wt-%) 69 80 94 6 Ahonen et al. (2008), Hansen et al. (2010), Kumpulainen & Kiviranta (2010), Kiviranta & Kumpulainen (2011)
S (total) (wt-%) 0.46 0.52 0.65 3 Ahonen et al. (2008), Kumpulainen & Kiviranta (2010), Kiviranta & Kumpulainen (2011)
S (sulphidic) (wt-%)
0.39 0.46 0.53 2 Kumpulainen & Kiviranta (2010), Kiviranta & Kumpulainen (2011)
C (organic) (wt-%)
0 0.02 0.03 2 Kumpulainen & Kiviranta (2010), Kiviranta & Kumpulainen (2011)
CEC (eq/kg) 0.89 0.96 0.99 4 Ahonen et al. (2008), Kumpulainen & Kiviranta (2010), Kiviranta & Kumpulainen (2011)
3.3 Design of different backfill components 3.3.1 Foundation layer The thickness of the foundation layer above the theoretical excavation line is +150 mm. The total local thickness of the foundation layer depends on the excavation tolerance

32
that can at maximum be +400 mm from the theoretical excavation line (see Figure 3-5). This means that the thickness of the foundation layer varies between 150 and 550 mm, the average being 350 mm. The average dry density of the foundation layer is 1250 kg/m3 (±100 kg/m3), based on field tests with the material performed in the Äspö bentonite laboratory (Wimelius & Pusch 2008).
Figure 3-5. Basic dimensions of the foundation layer assuming a maximum excavation tolerance of 400 mm. The thickness of the layer varies between 150 mm and 550 mm. 3.3.2 Backfill blocks The dimensions of the backfill blocks are based on the geometric needs of the deposition tunnel. The width of the blocks was designed to fit inside the 3500 mm wide tunnel leaving 100 mm gaps between the blocks and the theoretical excavation line. The height of the blocks was designed to increase the block filling degree in the roof section of the tunnel from the previous design presented in Hansen et al. (2010). The dimensions of the resulting backfill blocks are 550 x 470 x 330 mm as shown in Figure 3-6. It is assumed that the manufacturing tolerance of these blocks will be within -1 to +2 mm. This can be considered as a conservative assumption since smaller tolerances have been gained in the previous block compaction tests (see Section 4.6 Manufacturing of blocks). However, the block sizes in these tests were smaller than in the current design. Based on previous block production tests reported in Hansen et al. (2010), the estimated average dry density for the backfill blocks is 2030 kg/m3. The range is estimated to be ±40 kg/m3, which can be considered as conservative since in previous tests the range has been ±25-30 kg/m3 (see Section 4.6 Manufacturing of blocks). The gravimetric water content of the blocks is 9 % (±0.5 %). The other basic block properties are summarised in Table 3-4.
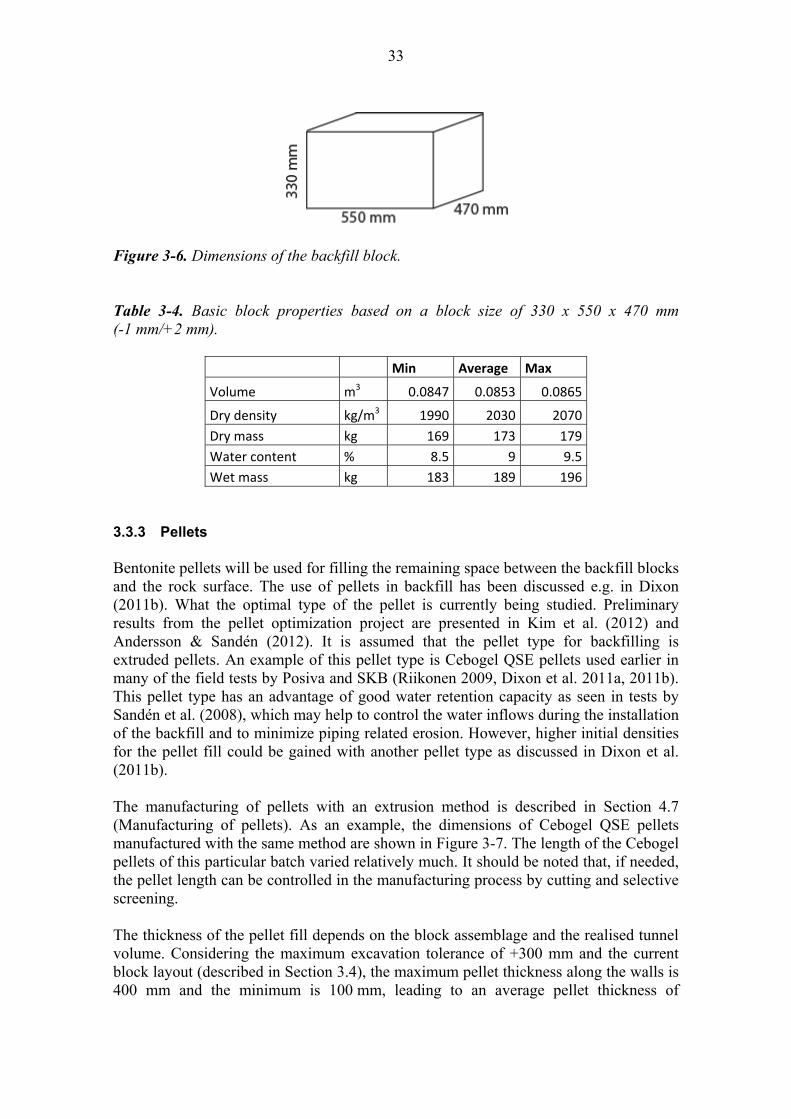
33
Figure 3-6. Dimensions of the backfill block. Table 3-4. Basic block properties based on a block size of 330 x 550 x 470 mm (-1 mm/+2 mm).
Min Average Max
Volume m3 0.0847 0.0853 0.0865
Dry density kg/m3 1990 2030 2070
Dry mass kg 169 173 179
Water content % 8.5 9 9.5
Wet mass kg 183 189 196
3.3.3 Pellets Bentonite pellets will be used for filling the remaining space between the backfill blocks and the rock surface. The use of pellets in backfill has been discussed e.g. in Dixon (2011b). What the optimal type of the pellet is currently being studied. Preliminary results from the pellet optimization project are presented in Kim et al. (2012) and Andersson & Sandén (2012). It is assumed that the pellet type for backfilling is extruded pellets. An example of this pellet type is Cebogel QSE pellets used earlier in many of the field tests by Posiva and SKB (Riikonen 2009, Dixon et al. 2011a, 2011b). This pellet type has an advantage of good water retention capacity as seen in tests by Sandén et al. (2008), which may help to control the water inflows during the installation of the backfill and to minimize piping related erosion. However, higher initial densities for the pellet fill could be gained with another pellet type as discussed in Dixon et al. (2011b). The manufacturing of pellets with an extrusion method is described in Section 4.7 (Manufacturing of pellets). As an example, the dimensions of Cebogel QSE pellets manufactured with the same method are shown in Figure 3-7. The length of the Cebogel pellets of this particular batch varied relatively much. It should be noted that, if needed, the pellet length can be controlled in the manufacturing process by cutting and selective screening. The thickness of the pellet fill depends on the block assemblage and the realised tunnel volume. Considering the maximum excavation tolerance of +300 mm and the current block layout (described in Section 3.4), the maximum pellet thickness along the walls is 400 mm and the minimum is 100 mm, leading to an average pellet thickness of

34
250 mm. In the roof section the maximum pellet thickness varies as presented in Figure 3-9 and is at maximum 635 mm. In the upper corners of the block assemblage, the pellet thickness can be locally <100 mm. In general, the thickness of the pellet fill affects two processes that are important for performance of backfill: a) homogenization of the block and pellet system and b) water uptake, piping and erosion. For the first process, the thinner the pellet fill the better the homogenization. However, for the latter process, it is recommended that the minimum thickness it at least 100 mm, but preferably the layer should be somewhat thicker. With the current design, it is assumed that sufficient pellet thickness is reached with the design and local thicknesses <100 mm do not affect the system performance. Based on the previous field tests (see Section 4.13 Installation of pellets), the expected dry density range of the pellet fill after installation will be between 900-1100 kg/m3. Water is added to the pellet fill at installation (from a separate pipe), and based on previous experience from field test results presented in Keski-Kuha et al. (2012), the initial water content of the pellet fill right after installation is expected to be on average 27.5 % (±10 %). 3.4 Design of backfill block assemblage The backfill block assemblage is presented Figure 3-8 for deposition tunnels for the repository for the spent nuclear fuel from OL1-3 and LO1-2. The detailed design is presented in Autio et al. (2012). The layout system is built from blocks with size of 550 x 470 x 330 mm. The overlapping between blocks is gained by placing blocks into two different orientations (system A and system B showing in Figure 3-8). In practice, this means that the blocks are overlapping both in transversal and in longitudinal direction. The height of the block layer always remains the same, 330 mm. The relatively low height of the blocks allows higher block filling degree in the roof section than the one presented in Hansen et al. (2010). The block filling degree from the theoretical (nominal) cross section is 85.9 % for the OL1-3 tunnels and 86.2 % for the LO1-2 tunnels. Considering an average tunnel volume (+18 % from the theoretical volume for the OL1-3 tunnels and +19 % for the LO1-2 tunnels), the block filling degree is 72.8 % for OL1-3 case and 72.5 % for the LO1-2 case. It should be noted that in Autio et al. (2012) it was assumed that the theoretical tunnel volume is 14.1 m2 instead of 14 m2 presented in Saanio et al. (2010). The difference comes from the small chamfers in the lower corners of the theoretical tunnel cross section (marked with a dashed line in Figure 3-8). Since these chamfers were excluded from the ONKALO demonstration tunnel profiles, they were also excluded in the block layout design. Considering that the chamfers would exist, the block corners in the bottom layer would not fit in the tunnel. However, the overlapping would be only local and the rock can be removed from these sections to enable the block installation.
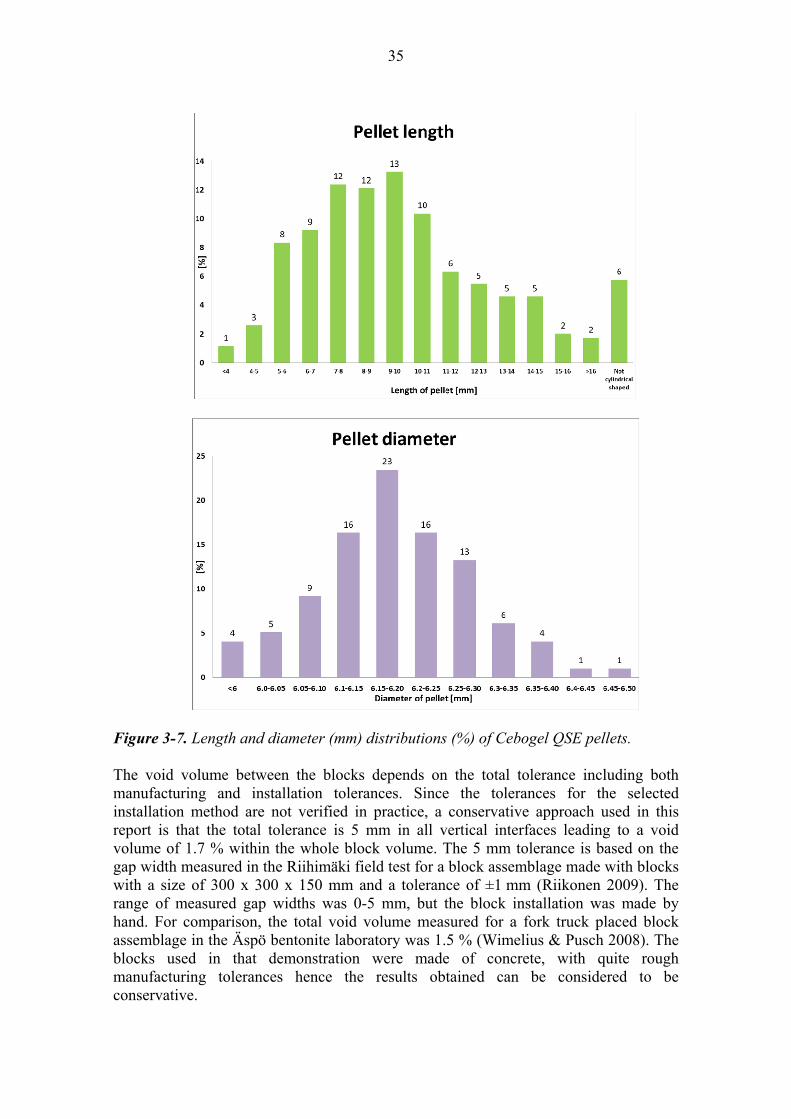
35
Figure 3-7. Length and diameter (mm) distributions (%) of Cebogel QSE pellets. The void volume between the blocks depends on the total tolerance including both manufacturing and installation tolerances. Since the tolerances for the selected installation method are not verified in practice, a conservative approach used in this report is that the total tolerance is 5 mm in all vertical interfaces leading to a void volume of 1.7 % within the whole block volume. The 5 mm tolerance is based on the gap width measured in the Riihimäki field test for a block assemblage made with blocks with a size of 300 x 300 x 150 mm and a tolerance of ±1 mm (Riikonen 2009). The range of measured gap widths was 0-5 mm, but the block installation was made by hand. For comparison, the total void volume measured for a fork truck placed block assemblage in the Äspö bentonite laboratory was 1.5 % (Wimelius & Pusch 2008). The blocks used in that demonstration were made of concrete, with quite rough manufacturing tolerances hence the results obtained can be considered to be conservative.
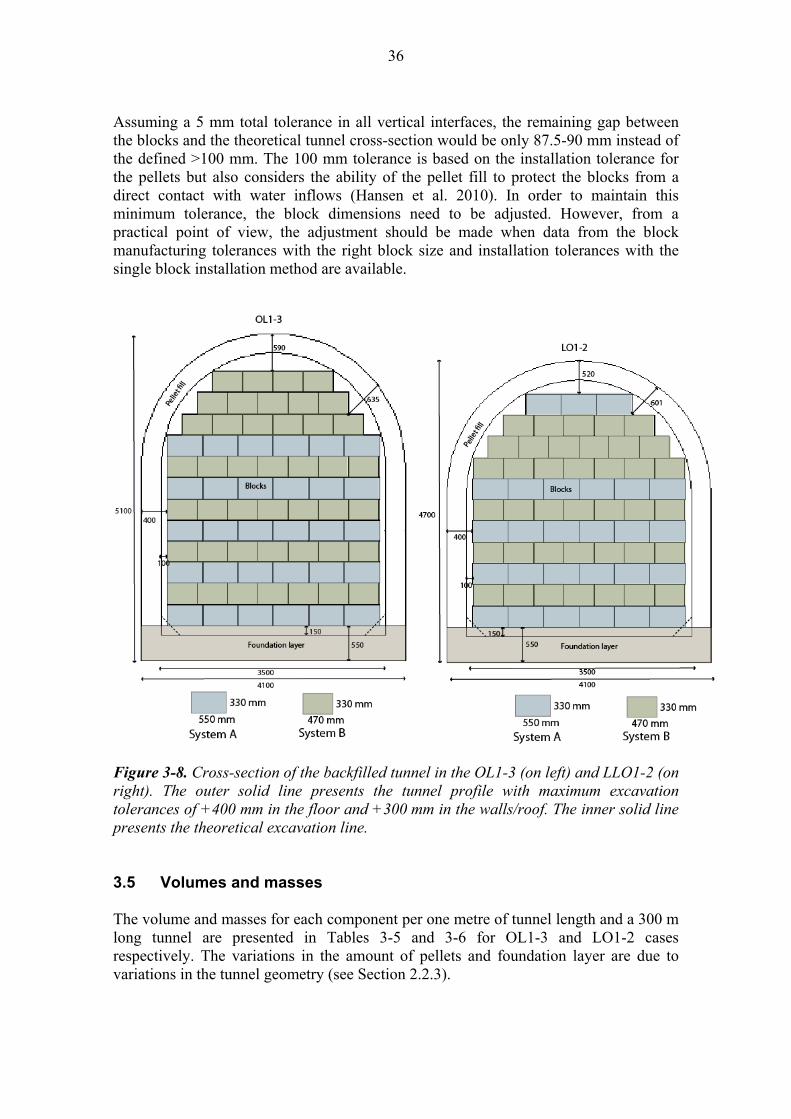
36
Assuming a 5 mm total tolerance in all vertical interfaces, the remaining gap between the blocks and the theoretical tunnel cross-section would be only 87.5-90 mm instead of the defined >100 mm. The 100 mm tolerance is based on the installation tolerance for the pellets but also considers the ability of the pellet fill to protect the blocks from a direct contact with water inflows (Hansen et al. 2010). In order to maintain this minimum tolerance, the block dimensions need to be adjusted. However, from a practical point of view, the adjustment should be made when data from the block manufacturing tolerances with the right block size and installation tolerances with the single block installation method are available.
Figure 3-8. Cross-section of the backfilled tunnel in the OL1-3 (on left) and LLO1-2 (on right). The outer solid line presents the tunnel profile with maximum excavation tolerances of +400 mm in the floor and +300 mm in the walls/roof. The inner solid line presents the theoretical excavation line. 3.5 Volumes and masses The volume and masses for each component per one metre of tunnel length and a 300 m long tunnel are presented in Tables 3-5 and 3-6 for OL1-3 and LO1-2 cases respectively. The variations in the amount of pellets and foundation layer are due to variations in the tunnel geometry (see Section 2.2.3).

37
Table 3-5. Volumes and masses of backfill component for one tunnel metre and for a 300-m long tunnel for the OL1-3 canisters (Autio et al. 2012). The max case refers to a case with maximum possible tunnel volume and the min case to a case with theoretical tunnel volume. Excavation tolerances Max Average Min
Roof and walls mm 300 150 0
Floor mm 400 200 0
Cross‐section areas from the design
Theoretical tunnel cross-section* m2 14.10 14.10 14.10
Realised cross-section with tolerances m2 19.18 16.64 14.10
Extra volume in % from the theoretical tunnel volume % 36.00 18.00 0.00
Volumes per one tunnel metre
Blocks (with gaps) m3 12.32 12.32 12.32
Blocks (without gaps) m3 12.11 12.11 12.11Gaps between the blocks (1.7% of the total block volume) m3 0.21 0.21 0.21
Foundation bed m3 2.26 1.39 0.53
Pellets m3 4.60 2.93 1.26
Total volume of all backfill components m3 19.18 16.64 14.10
Block filling degrees Block filling degree from theoretical/nominal tunnel volume % 85.89
Block filling degree from realised tunnel volume % 63.15 72.79 85.89
Initial dry densities
Blocks kg/m3 2030 2030 2030
Pellets kg/m3 1000 1000 1000
Foundation Layer kg/m3 1250 1250 1250
Total masses per 1 m
Blocks kg 24,584 24,584 24,584
Pellets kg 4596 2926 1255
Foundation Layer kg 2825 1741 656
Total mass of all backfill components kg 32,005 29,251 26,496
Total masses per 300 m
Blocks tons 7375 7375 7375
Pellets tons 1379 878 377
Foundation Layer tons 848 522 197
Total masses of all components tons 9602 8775 7949Average dry density after saturation and homogenisation kg/m3 1669 1758 1879
*Theoretical tunnel profile as presented in Autio et al. (2012).

38
Table 3-6. Volumes and masses of backfill component for one tunnel metre and for a 300-m long tunnel for the LO1-2 case (Autio et al. 2012). The max case refers to a case with maximum possible tunnel volume and the min case to a case with theoretical tunnel volume. Excavation tolerances Max Average Min
Roof and walls mm 300 150 0
Floor mm 400 200 0
Cross‐section areas from the design
Theoretical tunnel cross-section* m2 12.70 12.70 12.70
Realised cross-section with tolerances m2 17.53 15.11 12.70Extra volume in % from the theoretical tunnel volume % 38.00 19.00 0.00
Volumes per one tunnel metre
Blocks (with gaps) m3 11.14 11.14 11.14
Blocks (without gaps) m3 10.95 10.95 10.95Gaps between the blocks (1.7% of the total block volume) m3 0.19 0.19 0.19
Foundation layer m3 2.26 1.39 0.53
Pellets m3 4.13 2.58 1.04
Total volume of all backfill components m3 17.53 15.11 12.70
Block filling degrees Block filling degree from theoretical/nominal tunnel volume % 86.23
Block filling degree from realised tunnel volume % 62.48 72.46 86.23
Initial dry densities
Blocks kg/m3 2030 2030 2030
Pellets kg/m3 1000 1000 1000
Foundation layer kg/m3 1250 1250 1250
Total masses per 1 m
Blocks kg 22,230 22,230 22,230
Pellets kg 4126 2581 1035
Foundation layer kg 2825 1741 656
Total mass of all backfill components kg 29,181 26,551 23,921
Total masses per 300 m
Blocks tons 6669 6669 6669
Pellets tons 1238 774 311
Foundation layer tons 848 522 197
Total masses of all components tons 8754 7965 7176Average dry density after saturation and homogenisation kg/m3 1665 1757 1884
*Theoretical tunnel profile as presented in Autio et al. (2012).

39
4 PRODUCTION OF THE BACKFILL
4.1 Overview of the production line for the backfill An overview of the whole production line for backfill of deposition tunnels is presented in Figure 4-1. The production begins with excavation, processing and delivery of raw materials. The next two main phases are the manufacturing and installation of backfill components. During the process, backfill materials and components are stored, transferred and handled in a way that the quality of the materials and components is not changed unintentionally. 4.2 Principles of quality assurance over the whole production chain 4.2.1 Responsibilities in the production line for the backfill Posiva will determine requirements and specifications for raw material, backfill components and processes based on which the procurement of materials, handling, transportation, storage, manufacturing and installation will be made. The producer of the raw material is responsible for delivering a product to Finland that fulfills Posiva’s quality requirements and specifications. In this report it is assumed that from the point that the material is delivered to Finland, Posiva takes responsibility of transport, storage and handling of materials as well as manufacturing and installation of components and quality control (QC) in each step, although no such decisions have been made yet. For example, the responsibility for manufacturing can eventually be given to a third party supervised by Posiva. The responsibilities during repository operations will be determined according to Posiva’s organisation of that time. 4.2.2 Backfill material acquisition Selection of suppliers and materials Material suppliers are selected and approved according to Posiva’s approval protocol in order to ensure that the supplier is capable of delivering the right amount of material with required quality at the right time. Before material can be accepted, also the supplier needs to be accepted. Backfill materials will be selected based on their performance (the design requirements and specifications for backfill material are listed in Chapter 2). Posiva will make an inquiry regarding available and suitable products in the marketplace and select the most suitable materials. In this report, the acquisition chain is based on the assumption that the material is purchased from Friedland, Germany although this may not be the vender ultimately selected. Factors that affect the decision on where and how the raw material is acquired are: - Availability and sufficiency of materials. Existence of resources and production
capacity. - Quality of the material and reliability of the producer/supplier. - Cost of the raw material, processing, transportation and insurances. - Risk assessment. Effects of risks on reliability of delivery.

40
F
igu
re 4
-1. O
verv
iew
of t
he p
rodu
ctio
n li
ne fo
r ba
ckfi
llin
g of
dep
osit
ion
tunn
els.
40

41
Ordering the material The purchasing process and purchase instructions are presented in more detail in Laaksonen (2010b). The most important aspects in purchasing are to: - Define the required material properties and required testing methods, - Establish the tests to be performed on the material by the supplier and their
regularity, - Set the sampling procedure for testing of material by Posiva before sending the
delivery permission to the supplier, - Define the suitable handling procedures (cleanliness, temperature, relative humidity
(RH%), etc.), - Set the procedure to be used in non-conforming situations with the supplier (e.g. if
supplier and Posiva get different test results for some material properties or if supplier’s production ends suddenly) and
- Agree on the responsibility and destination for rejected material with the supplier. 4.2.3 Quality assurance of the production line In order to assure the quality of backfill, each step in the production line needs to be precisely defined. The steps in excavation, processing on site and transport of raw material to a production facility are presented schematically in Figure 4-2. The steps in manufacturing of blocks, pellets and foundation layer material are shown in Figure 4-3, and the steps involved in compaction of the foundation layer and installation of pellets and blocks are provided in Figure 4-4. After defining the steps, logistical and technical control points need to be set to the production line. Logistical control points are steps in a production line where the necessary amount of material or equipment is verified in order to ensure the continuous backfill production. Technical control points are steps in the line where the quality of the process is ensured by measuring either material properties or environmental conditions. Risk analysis can be used to optimize the logistical and technical control points and the needed quality control measurements in the different steps of the production line. Preliminary logistical and technical control points of the backfill production line are presented in Table 4-1a,b,c. In addition, the preliminary parameters to be monitored in different technical control points for backfill acquisition, block manufacture and backfill placement are also presented in Table 4-1a,b,c respectively.

42
Figure 4-2. Schematic diagram of excavation, processing on the mining site and transport of raw material to production facility. For simplicity, the diagram shows the chain, where the material is accepted in each inspection phase. Explanation of colours: green – (quality control) operations by Posiva, yellow – operations on clay, blue – storage, red – transport.
ExcavationStockpiling and visual inspection
StorageSamples and data are sent for Posiva
Bagging
Loading bags to
containers
Storage of containers
Transport to dock
Storage at dock
Loading to ship
Transport by ship
Unloading from ship to
dock
Storage at dock
Transport to intermediate storage at production facility
Inspections
Inspections & Sampling for
quality control
Intermediate storage at
production facility
Transport to indoor
storage
Processing by producer (drying, crushing, grinding, etc.)
Testing of the material/checking of
data by Posiva
Posiva sends a delivery
permission
Posiva sends an order of needed
product
Indoor storage
Posiva Selects the material
Acceptance of the material for
transport

43
Figure 4-3. Schematic diagram of manufacturing of backfill blocks, pellets and foundation layer material. For simplicity, the diagram shows the chain, where the material is accepted in each inspection phase. Explanation of colours: green – (quality control) operations by Posiva, yellow – operations on clay, blue – storage, red – transport.

44
Figure 4-4. Schematic diagram of the compaction of the foundation layer and the installation of pellets and blocks. For simplicity, the diagram shows the chain, where the material is accepted in each inspection phase. Explanation of colours: green – (quality control) operations by Posiva, yellow – operations on clay, blue – storage, red – transport.

45
Tab
le 4
-1a.
Pre
lim
inar
y pa
ram
eter
s co
ntro
lled
in th
e ba
ckfi
ll a
cqui
siti
on c
hain
.
Exc
avat
ion
& t
ran
spor
t to
sit
e (f
or B
LO
CK
MA
TE
RIA
L
(Fri
edla
nd
cla
y), f
or o
ther
mat
eria
ls t
he
pro
cess
mig
ht
vary
) R
esp
onsi
bili
ty
Con
trol
p
oin
t C
ontr
olle
d p
aram
eter
s
Pos
iva
sele
cts
the
mat
eria
l (i
nclu
des
stud
ies
of a
vaila
bili
ty a
nd q
uali
ty o
f th
e
mat
eria
l)
Pos
iva
Tec
hnic
al
Gra
nule
si
ze
dist
ribu
tion
, w
ater
co
nten
t, sw
elli
ng
inde
x,
CE
C,
min
eral
ogic
al
com
posi
tion
, ch
emic
al
com
posi
tion
, ex
chan
geab
le
cati
ons,
sw
elli
ng
pres
sure
, hy
drau
lic
cond
ucti
vity
, com
pact
ion
prop
erti
es.
Pos
iva
send
s an
ord
er o
f ne
eded
pro
duct
P
osiv
a
Exc
avat
ion
of c
lay
Mat
eria
l sup
plie
r
Sto
ckpi
ling
and
vis
ual
insp
ecti
on (
incl
udes
tra
nspo
rt, s
tock
pili
ng a
nd s
tora
ge i
n th
e
pile
)
Mat
eria
l sup
plie
r T
echn
ical
A
ppro
pria
tene
ss o
f st
ockp
ilin
g co
nditi
ons
(cle
anli
ness
)
Pro
cess
ing
of th
e cl
ay (
dryi
ng, c
rush
ing,
gri
ndin
g, p
ossi
bly
acti
vati
ng e
tc.)
M
ater
ial s
uppl
ier
Tec
hnic
al
App
ropr
iate
ness
of
equi
pmen
t (cl
eanl
ines
s, tr
ustw
orth
ines
s)
Bag
ging
of
clay
(10
00 k
g ba
gs)
Mat
eria
l sup
plie
r T
echn
ical
A
ppro
pria
tene
ss o
f ba
gs (
wat
erpr
oof)
, wat
er c
onte
nt is
che
cked
bef
ore
bagg
ing
Sto
rage
of
clay
bag
s M
ater
ial s
uppl
ier
Log
isti
cal
and
tech
nica
l A
ppro
pria
tene
ss o
f st
orag
e sp
ace
(tem
pera
ture
, rel
ativ
e hu
mid
ity
(RH
%),
cle
anli
ness
)
Sam
plin
g M
ater
ial s
uppl
ier
Tec
hnic
al
Sam
ples
and
dat
a ar
e se
nt f
or P
osiv
a by
sup
plie
r M
ater
ial s
uppl
ier
Qua
lity
of
sam
ples
and
dat
a ar
e ch
ecke
d by
Pos
iva
befo
re d
eliv
ery
perm
issi
on i
s
sent
Pos
iva
Tec
hnic
al
Gra
nule
si
ze
dist
ribu
tion
, w
ater
co
nten
t, sw
elli
ng
inde
x,
CE
C,
min
eral
ogic
al
com
posi
tion
, ch
emic
al
com
posi
tion
, ex
chan
geab
le
cati
ons,
sw
elli
ng
pres
sure
, hy
drau
lic
cond
ucti
vity
, com
pact
ion
prop
erti
es.
Pos
iva
gran
ts a
del
iver
y pe
rmis
sion
for
the
supp
lier
P
osiv
a
Loa
ding
the
cla
y ba
gs i
nto
cont
aine
rs, w
hich
hav
e di
men
sion
s of
6.0
5 m
x 2
.5 m
x
2.6
m, v
olum
e of
32.
5 m
3 and
load
cap
acit
y of
20
t. (2
0 ba
gs p
er c
onta
iner
) M
ater
ial s
uppl
ier
Log
isti
cal
and
tech
nica
l A
ppro
pria
tene
ss o
f co
ntai
ners
(w
ater
proo
f, v
enti
late
d an
d in
sula
ted)
, w
eigh
t of
the
m
ater
ial
Sto
rage
of
the
cont
aine
rs a
t pro
cess
ing
faci
lity
M
ater
ial s
uppl
ier
Tec
hnic
al
Tem
pera
ture
of
the
clay
is n
ot a
llow
ed to
dec
reas
e be
low
0°C
Tra
nspo
rt o
f th
e co
ntai
ners
to th
e do
ck b
y tr
uck
or tr
ain
Tra
nspo
rtat
ion
com
pany
of
supp
lier
Tec
hnic
al
Tem
pera
ture
of
the
clay
is n
ot a
llow
ed to
dec
reas
e be
low
0°C
Sto
rage
of
the
cont
aine
rs a
t the
doc
k T
rans
port
atio
n
com
pany
of
supp
lier
Log
isti
cal
Tem
pera
ture
of
the
clay
is n
ot a
llow
ed to
dec
reas
e be
low
0°C
Loa
ding
the
cont
aine
rs to
a s
hip
(max
150
0 co
ntai
ners
per
shi
p)
Tra
nspo
rtat
ion
com
pany
of
supp
lier
Tec
hnic
al
Am
ount
of
cont
aine
rs, t
empe
ratu
re o
f th
e cl
ay is
not
all
owed
to d
ecre
ase
belo
w 0
°C.
Tra
nspo
rt o
f th
e co
ntai
ners
by
ship
T
rans
port
atio
n
com
pany
of
supp
lier
Log
isti
cal
Tem
pera
ture
of
the
clay
is n
ot a
llow
ed to
dec
reas
e be
low
0°C
Unl
oadi
ng th
e co
ntai
ners
fro
m s
hip
to d
ock.
P
osiv
a T
echn
ical
V
isua
l in
spec
tion
of
th
e co
ndit
ion
of
the
cont
aine
rs,
amou
nt
of
cont
aine
rs
and
insp
ecti
on o
f in
form
atio
n re
quir
ed f
rom
the
supp
lier
.
45

46
Exc
avat
ion
& t
ran
spor
t to
sit
e (f
or B
LO
CK
MA
TE
RIA
L
(Fri
edla
nd
cla
y), f
or o
ther
mat
eria
ls t
he
pro
cess
mig
ht
vary
) R
esp
onsi
bili
ty
Con
trol
p
oin
t C
ontr
olle
d p
aram
eter
s
Sam
plin
g an
d qu
alit
y co
ntro
l mea
sure
men
ts f
rom
1 b
ag p
er c
onta
iner
P
osiv
a T
echn
ical
C
lean
line
ss o
f th
e sa
mpl
ing
equi
pmen
t, in
tact
ness
of
bags
, to
tal
wei
ght
and
wat
er
cont
ent.
Sto
rage
of
th
e co
ntai
ners
at
th
e do
ck
unti
l qu
ality
co
ntro
l m
easu
rem
ents
ar
e
perf
orm
ed a
nd d
eliv
ered
mat
eria
l is
acc
epte
d to
be
tran
spor
ted
to t
he i
nter
med
iate
stor
age
at p
rodu
ctio
n fa
cili
ty.
Pos
iva
T
he te
mpe
ratu
re o
f th
e cl
ay is
not
all
owed
to d
ecre
ase
belo
w 0
°C.
Tra
nspo
rt o
f co
ntai
ners
to th
e in
term
edia
te s
tora
ge a
t pro
duct
ion
faci
lity
by
truc
k P
osiv
a T
echn
ical
T
he t
empe
ratu
re i
s no
t al
low
ed t
o de
crea
se b
elow
0°C
, co
ndit
ion
of t
he c
onta
iner
s af
ter
tran
spor
t (vi
sual
insp
ecti
on)
Sto
rage
of
the
cont
aine
rs a
t in
term
edia
te s
tora
ge a
t th
e pr
oduc
tion
fac
ilit
y (m
ater
ial
for
max
2 tu
nnel
s in
the
stor
age)
Pos
iva
Log
isti
cal
and
tech
nica
l T
he te
mpe
ratu
re is
not
all
owed
to d
ecre
ase
belo
w 0
°C.
Tra
nspo
rt o
f co
ntai
ners
to in
door
sto
rage
by
truc
k P
osiv
a T
echn
ical
T
empe
ratu
re o
f th
e cl
ay is
not
all
owed
to d
ecre
ase
belo
w 0
°C
Sto
rage
of
the
cont
aine
rs a
t the
indo
or s
tora
ge (
equi
libr
atio
n w
ith
surr
ound
ings
for
a
whi
le b
efor
e op
enin
g) a
nd u
nloa
ding
of
the
big
bags
fro
m th
e co
ntai
ner.
P
osiv
a T
echn
ical
A
ppro
pria
tene
ss (
tem
pera
ture
, rel
ativ
e hu
mid
ity
(RH
%),
cle
anli
ness
) of
sto
rage
spa
ce
and
inta
ctne
ss o
f ba
gs.
46
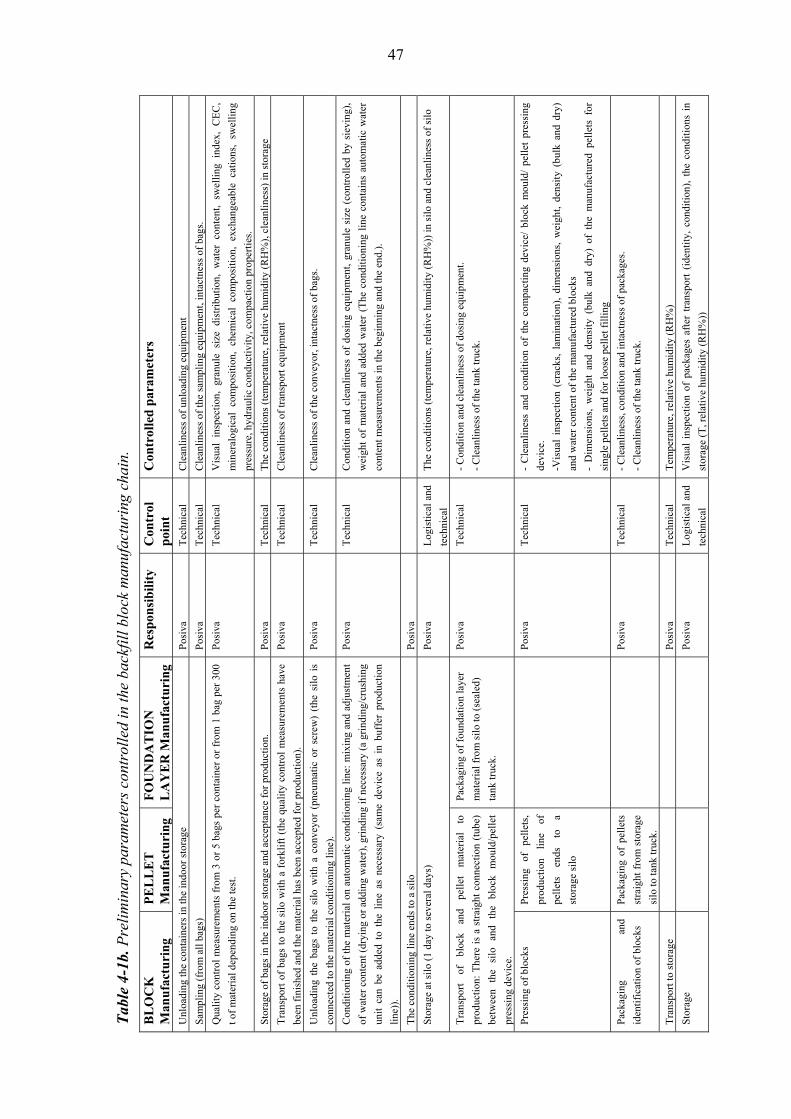
47
Tab
le 4
-1b.
Pre
lim
inar
y pa
ram
eter
s co
ntro
lled
in th
e ba
ckfi
ll b
lock
man
ufac
turi
ng c
hain
.
BL
OC
K
Man
ufa
ctu
ring
P
EL
LE
T
Man
ufa
ctu
ring
F
OU
ND
AT
ION
L
AY
ER
Man
ufa
ctu
ring
R
esp
onsi
bili
ty
Con
trol
p
oin
t C
ontr
olle
d p
aram
eter
s
Unl
oadi
ng th
e co
ntai
ners
in th
e in
door
sto
rage
P
osiv
a T
echn
ical
C
lean
line
ss o
f un
load
ing
equi
pmen
t
Sam
plin
g (f
rom
all
bag
s)
Pos
iva
Tec
hnic
al
Cle
anli
ness
of
the
sam
plin
g eq
uipm
ent,
inta
ctne
ss o
f ba
gs.
Qua
lity
con
trol
mea
sure
men
ts f
rom
3 o
r 5
bags
per
con
tain
er o
r fr
om 1
bag
per
300
t of
mat
eria
l dep
endi
ng o
n th
e te
st.
Pos
iva
Tec
hnic
al
Vis
ual
insp
ecti
on,
gran
ule
size
dis
trib
utio
n, w
ater
con
tent
, sw
elli
ng i
ndex
, C
EC
,
min
eral
ogic
al c
ompo
siti
on,
chem
ical
com
posi
tion
, ex
chan
geab
le c
atio
ns,
swel
ling
pres
sure
, hyd
raul
ic c
ondu
ctiv
ity,
com
pact
ion
prop
erti
es.
Sto
rage
of
bags
in th
e in
door
sto
rage
and
acc
epta
nce
for
prod
ucti
on.
Pos
iva
Tec
hnic
al
The
con
diti
ons
(tem
pera
ture
, rel
ativ
e hu
mid
ity
(RH
%),
cle
anli
ness
) in
sto
rage
Tra
nspo
rt o
f ba
gs t
o th
e si
lo w
ith
a fo
rkli
ft (
the
qual
ity
cont
rol
mea
sure
men
ts h
ave
been
fin
ishe
d an
d th
e m
ater
ial h
as b
een
acce
pted
for
pro
duct
ion)
.
Pos
iva
Tec
hnic
al
Cle
anli
ness
of
tran
spor
t equ
ipm
ent
Unl
oadi
ng t
he b
ags
to t
he s
ilo w
ith
a co
nvey
or (
pneu
mat
ic o
r sc
rew
) (t
he s
ilo
is
conn
ecte
d to
the
mat
eria
l con
diti
onin
g li
ne).
Pos
iva
Tec
hnic
al
Cle
anli
ness
of
the
conv
eyor
, int
actn
ess
of b
ags.
Con
diti
onin
g of
the
mat
eria
l on
aut
omat
ic c
ondi
tion
ing
line
: m
ixin
g an
d ad
just
men
t
of w
ater
con
tent
(dr
ying
or
addi
ng w
ater
), g
rind
ing
if n
eces
sary
(a
grin
ding
/cru
shin
g
unit
can
be
adde
d to
the
lin
e as
nec
essa
ry (
sam
e de
vice
as
in b
uffe
r pr
oduc
tion
line
)).
Pos
iva
Tec
hnic
al
Con
diti
on a
nd c
lean
line
ss o
f do
sing
equ
ipm
ent,
gran
ule
size
(co
ntro
lled
by
siev
ing)
,
wei
ght
of m
ater
ial
and
adde
d w
ater
(T
he c
ondi
tion
ing
line
con
tain
s au
tom
atic
wat
er
cont
ent m
easu
rem
ents
in th
e be
ginn
ing
and
the
end.
).
The
con
diti
onin
g lin
e en
ds to
a s
ilo
Pos
iva
Sto
rage
at s
ilo
(1 d
ay to
sev
eral
day
s)
Pos
iva
Log
isti
cal
and
tech
nica
l
The
con
diti
ons
(tem
pera
ture
, rel
ativ
e hu
mid
ity
(RH
%))
in s
ilo
and
clea
nlin
ess
of s
ilo
Tra
nspo
rt
of
bloc
k an
d pe
llet
m
ater
ial
to
prod
ucti
on:
The
re i
s a
stra
ight
con
nect
ion
(tub
e)
betw
een
the
silo
an
d th
e bl
ock
mou
ld/p
elle
t
pres
sing
dev
ice.
Pac
kagi
ng o
f fo
unda
tion
laye
r
mat
eria
l fro
m s
ilo
to (
seal
ed)
tank
truc
k.
Pos
iva
Tec
hnic
al
- C
ondi
tion
and
cle
anli
ness
of
dosi
ng e
quip
men
t.
- C
lean
line
ss o
f th
e ta
nk tr
uck.
Pre
ssin
g of
blo
cks
Pre
ssin
g of
pe
llet
s,
prod
ucti
on
line
of
pell
ets
ends
to
a
stor
age
silo
P
osiv
a T
echn
ical
-
Cle
anli
ness
and
con
diti
on o
f th
e co
mpa
ctin
g de
vice
/ bl
ock
mou
ld/
pell
et p
ress
ing
devi
ce.
-Vis
ual
insp
ecti
on (
crac
ks,
lam
inat
ion)
, di
men
sion
s, w
eigh
t, de
nsit
y (b
ulk
and
dry)
and
wat
er c
onte
nt o
f th
e m
anuf
actu
red
bloc
ks
- D
imen
sion
s, w
eigh
t an
d de
nsit
y (b
ulk
and
dry)
of
the
man
ufac
ture
d pe
llet
s fo
r
sing
le p
elle
ts a
nd f
or lo
ose
pell
et f
illi
ng
Pac
kagi
ng
and
iden
tifi
cati
on o
f bl
ocks
Pac
kagi
ng o
f pe
llet
s
stra
ight
fro
m s
tora
ge
silo
to ta
nk tr
uck.
P
osiv
a T
echn
ical
-
Cle
anli
ness
, con
diti
on a
nd in
tact
ness
of
pack
ages
.
- C
lean
line
ss o
f th
e ta
nk tr
uck.
Tra
nspo
rt to
sto
rage
P
osiv
a T
echn
ical
T
empe
ratu
re, r
elat
ive
hum
idit
y (R
H%
)
Sto
rage
P
osiv
a L
ogis
tica
l an
d
tech
nica
l
Vis
ual
insp
ecti
on o
f pa
ckag
es a
fter
tra
nspo
rt (
iden
tity
, co
ndit
ion)
, th
e co
ndit
ions
in
stor
age
(T, r
elat
ive
hum
idit
y (R
H%
))
47

48
Tab
le 4
-1c.
Pre
lim
inar
y pa
ram
eter
s co
ntro
lled
in th
e ba
ckfi
ll in
stal
lati
on a
ctiv
ity
chai
n.
BL
OC
K
Inst
alla
tion
P
EL
LE
T
Inst
alla
tion
F
OU
ND
AT
ION
L
AY
ER
Ins
tall
atio
n R
esp
onsi
bili
ty
Con
trol
p
oin
t C
ontr
olle
d p
aram
eter
s
Tra
nspo
rt to
tunn
el w
ith
a tr
uck/
tank
truc
k.
Pos
iva
Log
isti
cal
and
tech
nica
l
Sho
rt-t
ime
stor
age
of b
lock
s an
d pe
llet
s at
the
tunn
el (
pell
ets
poss
ibly
in s
ilo)
.
Dis
char
ge o
f fo
unda
tion
laye
r
mat
eria
l str
aigh
t fro
m th
e ta
nk
truc
k to
a p
repa
red
depo
siti
on
tunn
el f
or le
vell
ing
and
com
pact
ion
(wit
h ro
ller
com
pact
or)
Pos
iva
Log
isti
cal
and
tech
nica
l
- V
isua
l ins
pect
ion
of p
acka
ges
afte
r tr
ansp
ort (
iden
tity
, con
diti
on)
- T
he c
ondi
tion
s in
the
stor
age
(no
wat
er le
akag
es a
llow
ed in
the
stor
age
area
).
- B
efor
e in
stal
lati
on o
f th
e fo
unda
tion
laye
r th
e vo
lum
e of
the
tun
nel
is c
alcu
late
d
(fro
m s
urfa
ce s
cans
) an
d du
ring
ins
tall
atio
n th
e w
eigh
t of
ins
tall
ed f
ound
atio
n la
yer
mat
eria
l (w
ith
know
n w
ater
con
tent
) is
rec
orde
d. H
ence
, the
bul
k an
d dr
y de
nsit
ies
of
inst
alle
d fo
unda
tion
laye
r ca
n be
cal
cula
ted.
The
incl
inat
ion
and
even
ness
of
the
laye
r
are
insp
ecte
d af
ter
inst
alla
tion
wit
h su
rfac
e sc
anni
ng. S
pot c
heck
s af
ter
inst
alla
tion
for
wat
er c
onte
nt a
nd d
ensi
ty. T
he r
olle
r co
mpa
ctor
has
on-
line
sys
tem
for
con
trol
ling
the
com
pact
ion
resu
lt.
Tra
nspo
rt o
f bl
ocks
to
inst
alla
tion
Pos
iva
Log
isti
cal
and
tech
nica
l
Vis
ual i
nspe
ctio
n of
the
pack
ages
bef
ore
and
afte
r th
e tr
ansp
ort.
Rem
oval
of
the
pack
age
Pos
iva
Tec
hnic
al
Insp
ecti
on
of
the
indi
vidu
al
bloc
ks
befo
re
inst
alla
tion
(e
.g.
wit
h sc
anni
ng
and
wei
ghin
g), i
f w
ater
con
tent
can
be
mea
sure
d w
itho
ut b
reak
ing
the
bloc
k, i
t sh
ould
be
done
.
Inst
alla
tion
of
bloc
ks (
2
inst
alla
tion
dev
ices
are
avai
labl
e)
Pos
iva
Tec
hnic
al
Insp
ecti
on a
fter
ins
tall
atio
n of
eac
h bl
ock
(cam
era,
pla
cem
ent
chec
k).
Insp
ecti
on o
f
each
ins
tall
ed f
oref
ront
/lay
er o
f bl
ocks
(ev
enne
ss,
visu
al &
sca
nnin
g ch
ecks
) an
d th
e
dist
ance
bet
wee
n bl
ocks
and
roc
k w
alls
. The
num
ber
of b
lock
s in
tunn
el c
ross
-sec
tion
is c
heck
ed (
tota
l vol
ume
com
pare
d to
the
tunn
el v
olum
e). F
inal
insp
ecti
on o
f in
stal
led
bloc
ks (
visu
al, c
amer
a &
sca
nnin
g) (
re-i
nsta
llat
ion
if n
eede
d).
T
rans
port
of
pell
ets
to th
e in
stal
lati
on
P
osiv
a L
ogis
tica
l an
d
tech
nica
l
In
stal
lati
on o
f
pell
ets
by
shot
cret
ing
P
osiv
a T
echn
ical
-
Inst
alle
d w
eigh
t of
pell
ets
and
amou
nt o
f w
ater
add
ed d
urin
g in
stal
lati
on (
to p
reve
nt
dust
) ar
e re
cord
ed. A
fter
inst
alla
tion
spo
t che
cks
are
done
for
wat
er c
onte
nt a
nd
dens
ity.
- T
he f
illi
ng d
egre
e is
vis
uall
y in
spec
ted
wit
h a
cam
era
mou
nted
at
the
fron
t of
the
inst
alla
tion
dev
ice.
- T
he i
nsta
lled
den
sity
in
the
tunn
el i
s ca
lcul
ated
at
the
end
(fro
m w
ater
con
tent
s,
wei
ghts
, tun
nel s
cans
etc
. val
ues
reco
rded
dur
ing
prod
ucti
on a
nd in
stal
lati
on).
48

49
Quality control measures The methods to be used in the quality assurance in the technical control points are defined (by Posiva). A standard operating procedure, which will include work instructions, maintenance, monitoring, testing and calibration of the devices used in the work and reporting, is written for each method (by Posiva). The amount of quality assurance testing and sampling protocols in different parts of the backfill production line are also defined (by Posiva). For example, material properties are tested by Posiva in several stages of the backfill production line: 1) During material selection (this is done in order to check the quality and suitability
of the products for backfill), 2) Before granting the delivery permission for the material to the supplier (Includes
also checking of measurement data produced by the supplier (not shown in Table 4-2). This is done in order to check that the products ready for transport fulfil the material quality requirements of Posiva),
3) After material is delivered to the dock in Finland (this is done in order to check that the amount or quality of the delivered material has not changed during transport),
4) After transportation in different steps of the process, 5) During and after manufacturing, and 6) After installation (this is done in order to check that the final product fulfills the
designed requirements). A preliminary proposal for different tests and for the amount of testing in the first stages of the production line is presented in Table 4-2 based on discussions in Keto & Rönnqvist (2007), Ahonen et al. (2008), Laaksonen (2010b) and Kiviranta & Kumpulainen (2011). In addition to these, samples are taken during and after manufacturing and after installation of the backfill to check the water content and dry density of the foundation layer and pellets. Table 4-2. Proposed testing scheme for backfill material properties (tests performed by Posiva).
Stage Amount of preliminary tests1
Amount of basic tests2 Amount of comprehensive tests3
1. Material selection - 1 1 2. Before sending the delivery permission
- 1 1
3. In the dock 1 bag per container - - 4. In indoor storage - 3 bags per container, except
water content from 5 bags 1 bag per 300 t
1Preliminary tests include water content and total weight. 2 Basic tests include water content, swelling index, granule size distribution, mineralogical composition (at least smectite content) and chemical composition (at least contents of organic carbon, total sulphur and sulphidic sulphur). 3 Comprehensive tests include water content, mineralogical composition, chemical composition, cation exchange capacity (CEC), original exchangeable cation composition, swelling pressure, hydraulic conductivity and compaction properties.

50
The quality control measures that are presented in this report are preliminary and maybe subject to changes in the future. Continuous improvement of the backfill production line Data from e.g. non-conformities, audits, risk analyses and assessments of selected suppliers is collected and analysed regularly and used to continuously improve and enhance the backfill process. 4.3 Excavation and processing 4.3.1 Excavation at the mining site The material is ordered by Posiva, possibly before excavation in order to customise the excavation and processing processes to meet Posiva’s material requirements. Typically, bentonite and other smectite-rich clays are mined using an open pit mining method (Figure 4-5). Excavation proceeds as follows: overburden is stripped to expose clay, and clay is excavated and then left to dry in the open. In locations, where climate does not allow drying of material outdoors, such as in the Friedland clay quarry in Northern Germany, the excavation is done during summer months but the material is dried in a rotary kiln drier. In general, scrapers, front-end loaders, or excavators are used to extract the clay from the deposit. The exact excavation procedure depends on the deposit and the operator. 4.3.2 Processing at the mining site Extracted clay is stockpiled at the mining site allowing it to dry, and in order to sort material into different grades. In this phase, processing of the material is started. In case of Ca-dominated clay, soda (Na2CO3) may be added to stockpiles in order to replace the exchangeable cations present in the smectite from calcium to sodium. Stockpiled bentonite may be blended with bentonites of different compositions/grades. In this phase, the stockpiles are also visually inspected by the supplier. After drying (Figure 4-6), the clay is transported to a processing facility with trucks and dried with rotary driers. After drying, clay is crushed with roller crushers, screened, and when necessary, further ground with roller mills (Figure 4-7). The exact processing procedure depends on the deposit and the operator, and will be designed together with the producer in order to meet Posiva’s material requirements (activation, product humidity, product granule size distribution etc.).

51
Figure 4-5. Open mining pit at Friedland, Germany. Courtesy of FIM Friedland Industrial Minerals GmbH.
Figure 4-6. Stockpiling and air-drying of clay at Friedland, Germany. Courtesy of FIM Friedland Industrial Minerals GmbH.

52
Figure 4-7. Processing and conditioning of clay at Friedland, Germany. Courtesy of FIM Friedland Industrial Minerals GmbH. Conditioned material is stored in silos, or bagged directly into waterproof 1 m3 plastic bulk bags (Figures 4-8 and 4-9). The bags are stored in a clean, temperature and relative humidity (RH%) controlled storage. Samples are taken from big bags and sent to Posiva in order to check the quality of the material. 4.3.3 Quality control and inspection methods During excavation, stockpiling and processing of the material (by supplier), ore evaluation and other testing of the material to assure that the quality of the material segregated from different parts of the quarry is known is done by the supplier. The supplier also has the responsibility to ensure that the processing equipment, big bags, loading/unloading equipment, transport equipment, storages etc. are appropriate and in accordance with the order made by Posiva.

53
Figure 4-8. Processing plant with storage silos at Friedland, Germany. Courtesy of FIM Friedland Industrial Minerals GmbH.
Figure 4-9. Big bags at storage at Friedland, Germany. Courtesy of FIM Friedland Industrial Minerals GmbH.

54
4.3.4 Acceptance for shipping Before each delivery to Finland the bentonite or clay materials purchased for use in backfill manufacture is inspected by the supplier. The test methods and the number of tests to be performed by the supplier are defined before ordering the material. These tests should include at least water content and total weight of the material. Some inspections commonly performed by suppliers are presented in Laaksonen (2010b). The supplier sends the data and samples of the material it proposes to ship to Posiva (Laaksonen 2010b) and after Posiva has inspected the data and samples, it grants delivery permission if it meets the requirements set by Posiva. The purchasing process is presented in more detail in Laaksonen (2010b). The tests performed by Posiva should at this stage include water content, swelling index, granule size distribution, cation exchange capacity (CEC), original exchangeable cation composition, determination of mineralogical and chemical composition, swelling pressure, hydraulic conductivity and compaction properties (Ahonen et al. 2008, Laaksonen 2010b, Kiviranta & Kumpulainen 2011). See also Table 4-1. Method descriptions for most of the above-mentioned tests can be found in Kiviranta & Kumpulainen (2011). 4.4 Delivery and acceptance of the delivered material batch The foundation layer and pellet materials are high grade bentonite similar to what is used for the buffer, and their handling is treated in the Buffer production line report. Thus, Chapters 4.4 and 4.5 in this report focus on the delivery chain, transport and storage of block material, but the principles presented in these chapters can also be applied for pellet and foundation layer material. 4.4.1 Shipment Bulk bags are loaded into waterproof and insulated containers (dimensions of 6.05 x 2.5 x 2.6 m, volume of 32.5 m3 and load capacity of 20 t), which are sealed and stored at the processing facility until transported by train or truck to a dock. Sealed containers are then stored at the dock until counted and loaded to a ship (Figure 4-10). Containers are transported by ship to a harbour close to the repository (Port of Olkiluoto or Rauma) (Figure 4-11). The transport route and detailed shipment procedure depends on the supplier and the size and draught of the ship compared to the draught of the port, dimensions of the dock and available handling systems. For this report it is assumed that the material is shipped to Rauma Port. The number of containers needed to supply material for one tunnel is ~400. The maximum number of containers transported to Finland is 1500 per ship (Hämäläinen 2011). This means that one year’s consumption of backfill material (1-2 tunnels per year) can be shipped at a time, if needed. Another alternative would be to use a bulk vessel and either ship the material as bulk material or packed in big bags. However, in this report it is assumed that the shipment is done in containers which provide good traceability and low risk of contamination.
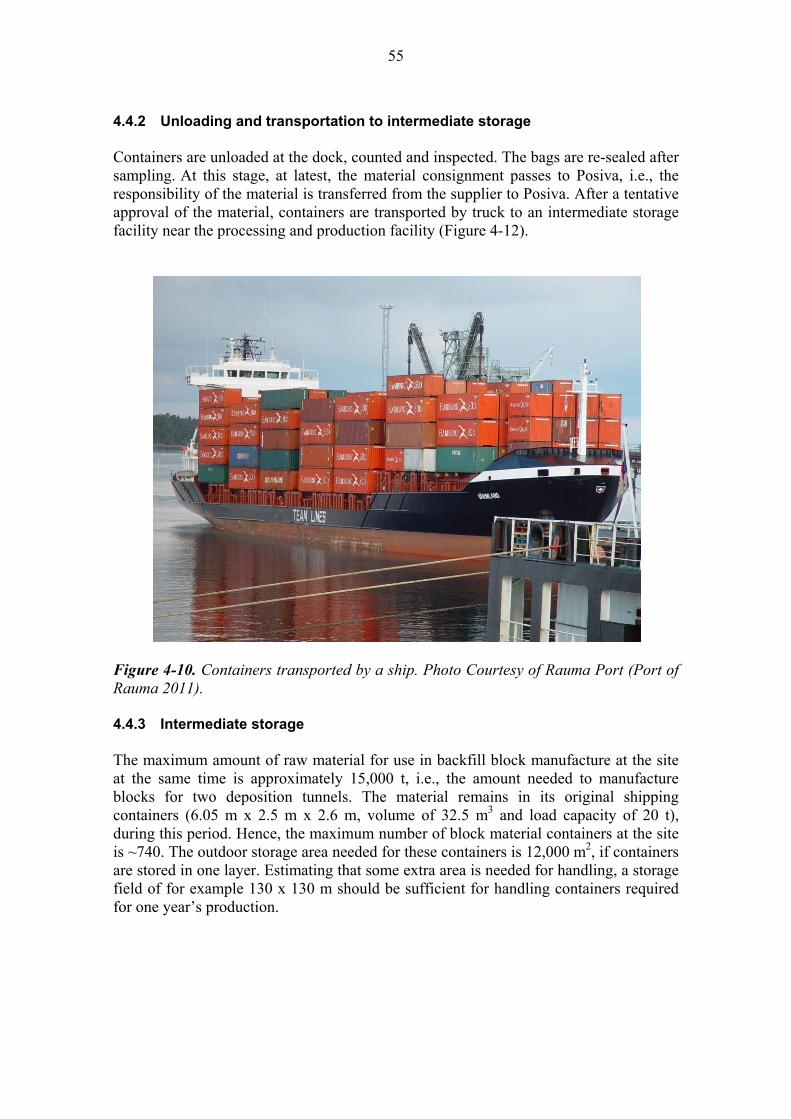
55
4.4.2 Unloading and transportation to intermediate storage Containers are unloaded at the dock, counted and inspected. The bags are re-sealed after sampling. At this stage, at latest, the material consignment passes to Posiva, i.e., the responsibility of the material is transferred from the supplier to Posiva. After a tentative approval of the material, containers are transported by truck to an intermediate storage facility near the processing and production facility (Figure 4-12).
Figure 4-10. Containers transported by a ship. Photo Courtesy of Rauma Port (Port of Rauma 2011). 4.4.3 Intermediate storage The maximum amount of raw material for use in backfill block manufacture at the site at the same time is approximately 15,000 t, i.e., the amount needed to manufacture blocks for two deposition tunnels. The material remains in its original shipping containers (6.05 m x 2.5 m x 2.6 m, volume of 32.5 m3 and load capacity of 20 t), during this period. Hence, the maximum number of block material containers at the site is ~740. The outdoor storage area needed for these containers is 12,000 m2, if containers are stored in one layer. Estimating that some extra area is needed for handling, a storage field of for example 130 x 130 m should be sufficient for handling containers required for one year’s production.
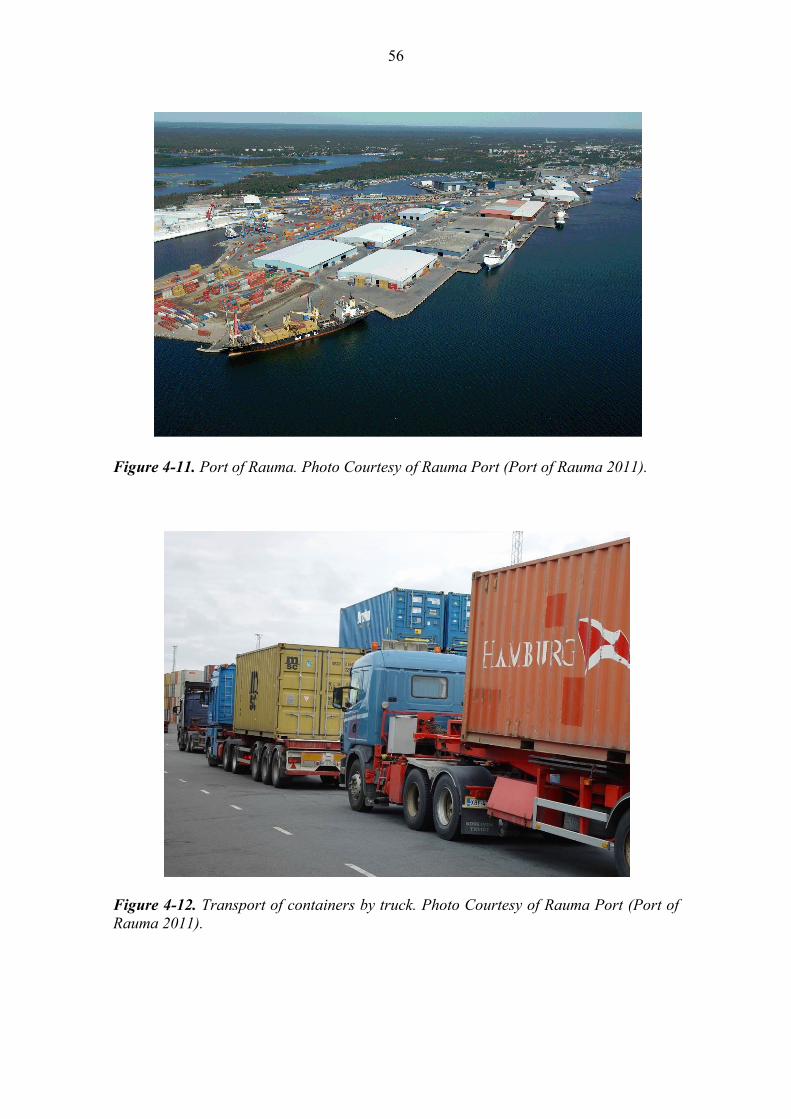
56
Figure 4-11. Port of Rauma. Photo Courtesy of Rauma Port (Port of Rauma 2011).
Figure 4-12. Transport of containers by truck. Photo Courtesy of Rauma Port (Port of Rauma 2011).

57
In the intermediate storage stage, the temperature of the material is not allowed to decrease below 0 °C and contact of the stored material with moist air is regulated in order to avoid condensation within the container. In practice, this is handled with sealed and insulated containers with ventilation systems. Preferably the shipments should be ordered for springtime or early summer leaving time for handling the containers during summer months and the material would then be transported from the intermediate storage location to inside storage before winter time. 4.4.4 Quality control and inspection methods During transportation and storage, the material is not allowed to be in contact with additional water (vapour or liquid), other liquids or chemicals and it is also not allowed to freeze. The supplier has the responsibility to ensure that the containers, loading equipment, transport equipment, storages etc. are appropriate and in accordance with the order made by Posiva until the material is handed over to Posiva at the dock. When the material is unloaded from the ship to the dock, the containers are visually inspected, container information and seals are checked, the information of the delivered batch provided by the supplier is checked and samples are taken from e.g. 1 bag per container in order to check the quality of the material. In addition, the total amount of delivered material is measured in order to determine the dry mass of the delivered material. A possible method for sampling from big bags is presented in Ahonen et al. (2008). The bags and shipping/storage containers are re-sealed after sampling. Also, after transport from the dock to the intermediate storage, the condition of the containers is inspected visually. The temperature and relative humidity (RH%) inside the containers are monitored and controlled. Every material batch delivered to Finland is kept track of, in order to be able to trace which material bags were used in the backfilled tunnels. 4.4.5 Preliminary acceptance of the delivered material batch The samples taken after unloading the ship at the dock are studied (water content and total amount (Ahonen et al. 2008)). At this point the amount of sampling and hence the number of measurements is low (e.g. 1 bag per container). After the material batch is tentatively accepted for use, the material is transported from the dock to the intermediate storage located near the production plant. 4.5 Transport and storage at the production plant
4.5.1 Transport
The containers containing the raw material for use in backfill block manufacture are transported by truck from the intermediate storage to the indoor storage facility. In the indoor storage facility the 1000 kg bags are unloaded from the containers, likely using a forklift and sampled as necessary to ensure the suitability of their contents. After quality checking and acceptance for production, the bags are transported to a silo with a conveyor (pneumatic or screw) (Laaksonen 2010a). The silo is connected to the

58
conditioning line, i.e., the material can be automatically directed to block material conditioning line from the silo using a screw conveyor (Laaksonen 2010a). 4.5.2 Storage
The storage capacity needed for the backfill blocks is quite high, 8000-15,000 big bags considering that 1-2 tunnels are backfilled per year, requiring a sophisticated storage system to be able to control the material flows. The bags are kept at the storage facility until the material has been accepted for use in backfill production. In the indoor storage, the temperature is kept stable and above 0 °C and the relative humidity (RH%) regulated so condensation is avoided. The containers holding the bags are allowed to equilibrate with their surroundings for a while before opening in the indoor storage facility. After equilibrating, the 1000 kg bags are unloaded from containers. After the material is accepted for use in backfill production, it is transported to the silo as it is needed. In the silo, the temperature is kept stable and above 0 °C. The silo is also sealed and the relative humidity (RH%) regulated, so condensation is avoided. 4.5.3 Quality control, inspection methods and final acceptance of the delivered
material batch for backfill production
During transportation and storage, the material is not allowed to be in contact with water (vapour or liquid), other liquids or chemicals and it is also not allowed to freeze. The temperature, relative humidity (RH%) and cleanliness during the transport from intermediate storage to inside storage, in the inside storage and in the silo are monitored and controlled. The sampling from all bags, testing and the final acceptance of delivered material are done after the containers are unloaded in the inside storage. All 1000 kg bags are visually inspected and samples are taken from each bag. A small amount of material is stored in archives for possible re-measurements. One possible sampling method from big bags is presented in Ahonen et al. (2008). The big bags are re-sealed after sampling. Water content, granule size distribution, swelling index, mineralogical composition (at least smectite content) and chemical composition (at least organic carbon, total sulphur and sulphidic sulphur) are measured (Ahonen et al. 2008, Laaksonen 2010b) from selected samples (e.g. 3 bags per container, except water content from 5 bags per container). For selected samples (e.g. 1 per 300 t), comprehensive chemical and mineralogical compositions, CEC, original exchangeable cation composition, swelling pressure, hydraulic conductivity and compaction properties are measured (Keto & Rönnqvist 2007, Ahonen et al. 2008, Kiviranta & Kumpulainen 2011). 4.6 Manufacturing of blocks 4.6.1 Overview of the process Normally the clay material is mixed, and the water content is adjusted to the desired range during mixing. The mixed material is cured in diffusion sealed silos (diffusion

59
sealed meaning here any silo type ensuring water tightness) for some time to guarantee stable material parameters for the compaction. The optimal curing time will be determined in future studies, but it can be from one day up to several days. The cured material is compacted by uniaxial pressing at a pressure of 25-50 MPa, in order to achieve the desired dry density. The final dimensions of the blocks are also determined in the compaction phase. The compacted blocks are inspected as part of quality control and then packed into water-tight storage packages. If the water content of an individual clay batch is too high, a portion of a delivery batch material can be dried to bring the batch into compliance with the target value. However, the dryer's capacity is not designed to handle the entire material flow. A portion of a delivery batch can also be crushed if necessary, but the crushing capacity is designed to facilitate reuse the discarded blocks. An overview of the process is described in Table 4-3 and in Figure 4-13. 4.6.2 Processing of the raw material for block pressing After the acceptance of the delivered material batch, the water content will be adjusted, and the grain size distribution may be adjusted if necessary. The grinding and sieving machine which is used to recycle discarded blocks and avoid material waste can also be used to grind small portions of a delivery batch, should it be too coarse for use. During compaction tests done as part of backfill development work, there has been no need to dry the Friedland clay, however it is likely that in the long run some batches may have too high a water content and need to be dried (Koskinen 2012). Therefore a large capacity drier must be available in the plant. Drying would be done in cases when the water content is only 2-3% above the target. If the difference is greater, the drying time is impractically long and other use or means of drying needs to be found for the batch. The water content adjusting is done in an intensive mixer. The mixer must have an inbuilt water injection system. The water injection will be done in the form of mist in order to guarantee an even water distribution (Koskinen 2012). One example of such a mixer is an Eirich RV24 mixer with a batching capacity of 3-4 tons. The process that would be used in material batching completed prior to block manufacture is as follows:
- The mixer is loaded to its optimal filling amount. The water content of the fed material must be known. In order to accomplish that, an adequate amount of samples has to be taken or some continuously working water content measurement needs to be installed to the feeding system. There are two types of technology for the continuous measurement: microwave based or capacitive measurement. Both of these methods have been developed for measuring the water content of sand streams, but they have not been tested for smectite rich materials.

60
Table 4-3. The overview of the block manufacturing process.
Process phase Object of the phase
What is included into the phase
Duration of the phase
Final acceptance for backfill production
Section 4.5.3 Section 4.5.3 Section 4.5.3
Processing of the raw material for block pressing
Prepare the material to the desired state for the block compaction
Drying, if necessary Drying, time is dependent on the drying machine and the water content of the raw material
Mixing, to desired water content
Mixing, 10-15 minutes per batch
Crushing, mainly to reuse the discarded blocks
Crushing, time is dependent on the crushing machine
Curing of the material
Let the water distri-bute more evenly
Holding in the mixed mate-rial in diffusion sealed silos
at least 1 day, remains to be optimised
Pressing Pressing of the backfill blocks
Uniaxial compacting Under a minute per block
Quality control of blocks
To guarantee the constant quality for the blocks
Determining the dimen-sions, density and weight Visual inspection
Packing and storage of blocks
Packing of the compacted and inspected blocks
Packing the blocks into packages
Packed immediately Transportation of the compacted blocks to the storage
Transporting and storing in Section 4.9
Figure 4-13. The backfill block manufacturing process.

61
- The materials in the mixer are then moisture conditioned based on the determined quantity of water needed to reach the target water content. The required amount of water is fed into the running mixer. The acceptable tolerance for the water content has been considered to be ±0.5 % (Koskinen 2012). Larger variance causes difficulties to the compacting.
- After the water injection is finished, the mixer shall run 2-4 minutes to ensure a homogenous result.
- On completion of quality checks, the mixed batches are transferred into production silos with a screw conveyer to avoid unnecessary exposure to humidity. The production silos should be as tight as practical, to prevent moisture from evaporating during the storage. The production silos shall have enough capacity to cure the material before block pressing. The optimal curing time will be determined in future studies, but it can be from one day up to several days. The size of the curing silo will be dimensioned based on the optimal curing time. After the curing, the material is ready to press.
- After blending is completed, the mixed material is run through a screen to ensure that the grain size is suitable for compacting.
4.6.3 Compacting method After curing, the material is fed into the storage silo of the compaction press and then is loaded into the press. The material loading will depend on the requirements of the type of press actually used. One of the biggest press manufacturers is Sacmi, which uses a loading box where the material amount is determined by drag of the mixer. Another method to determine the material amount in the loading box is weighting. The accuracy of the material amount measurement is similar with both methods. The loading systems usually also have some kind of sieve to remove too large granules (Koskinen 2012). The backfill blocks are pressed using uniaxial compaction method. The grain size distribution and the water content of the material affect the required compaction pressure. The compaction pressure is usually predetermined to be in a certain range, and the exact pressure is determined to achieve the desired block height. The automation will control the process based on the previous blocks, so that the end result is as close as possible to the desired properties (height, weight) (Koskinen 2012). The compaction force is applied by moving the upper die against the stationary lower die. The mould can be moved independently from the dies. The independent movement of the mould reduces the friction between the material and mould wall, providing a more even density distribution over the block. This movement is especially vital in the larger block sizes (height over 200 mm). A picture of such a press can be seen in Figure 4-14. The use of accurate measuring tools and ensuring material homogeneity assures high reproducibility of the pressing cycle, and consistent dimensions of the blocks. The same pressing machine can also be used to compact smaller block sizes if necessary. It should be also noted, that no lubricant is used on the backfill moulds. The press should be equipped with a vacuum-type deaerator. The purpose of this is to avoid air entrapment or layering during compaction, thereby producing more homogenous blocks. The vacuum may also increase the compaction speed, which otherwise needs to be kept low to allow air to escape from the block. Lower trapped air pressure within the blocks should also increase the mechanical stability of the blocks

62
since there will be a lower internal air pressure seeking to escape, a potential source of mechanical damage to the blocks. The compacted blocks are lifted from the mould and handled robotically. The block weight is about 190 kg, and mishandling can cause problems such as occupational hazards, slow production rate or block breakage. The production speed is mainly dependent on the mould loading speed and block removing, inspecting and packing speed. When the whole process runs smoothly the production rate can be estimated to be 12 ton/h (i.e. one block per minute) for an individual machine. This leads to a capacity of 480 blocks per one 8 hour long working shift. For backfilling a tunnel section with a length of 5 m, the need of blocks is ~720 blocks. Since blocks are manufactured throughout the year, the production capacity is sufficient for producing the required amounts of blocks needed yearly. However, the production facility needs to have sufficient storage capacity in order to ensure continuous backfill installation process and the storage needs to be done in such a manner that the blocks do not degrade during storage (e.g. shrink, crack, chip).
Figure 4-14. The press in Höganäs Bjuf factory, used in block compaction test. Photo by Ville Koskinen.

63
4.6.4 Quality control and inspection methods After the block compaction, the handling robot will measure the dimensions and weight the block. Simultaneously the machine operator gives the block a visual inspection. The purpose of the visual inspection is to spot any cracks or lamination. The quality control process for block manufacture is based on controlling of the material stream and the compaction process. The inspection of compacted blocks is therefore directly related to monitoring machine condition, when the mould is worn, the block quality is poor, resulting in cracks and lamination (Koskinen 2012). The wear cannot always be seen when visually inspecting the mould so monitoring of the blocks is key to early identification of equipment maintenance requirement. The service time of a mould is currently unknown, but it can be estimated that at least 1200 tons can be pressed before the surfaces of the mould need to be polished. After quality control, the blocks are packed into water-tight storage packages. Each package is marked with a unique identification code/number. The integrity of the packages is checked during packaging and after transferring the packages to their storage location. The block storage will be an indoor storage with a controlled and stable temperature (~10 °C) and relative humidity (RH%). For buffer blocks, the suitable RH% is ~65 % (Buffer Production Line report). The suitable RH% for backfill blocks will be determined later, but it can be estimated to be quite close to the value determined for buffer blocks. The storage shall have sophisticated handling systems (e.g. a storage robot) in order to handle the large amount of packages with care and precision. 4.6.5 Experiences from block production The backfill blocks compacted so far have been smaller (75 x 150 x 300 mm and 300 x 300 x 150 mm) than the design size and the loading method has been different in different factories. The closest process to the real compaction process has been in Bjuv, Sweden where Posiva has compacted around 100 tons of blocks (75 x 150 x 300 mm) (Koskinen 2012). Roughly 100 tons of larger (300 x 300 x 150 mm) blocks were also manufactured in Aachen, Germany during 2008 (Hansen et al. 2010) using manually-controlled pressing, which is a non-optimised production process. The moisture variation of the material used in block manufacturing trials was ±0.5%, as the block manufacturing factory had suggested. The material was mixed prior to the tests and the moisture remained within the required limits and based on this, the ±0.5% was accepted to be the maximum tolerance (Koskinen 2012). The density tolerance and height tolerance are directly dependant on the moisture tolerance. However, the zero tolerance in density and height is not possible due to the other variations in the material properties (e.g. small differences in the grain size). The height tolerance achieved in the industrial manufacturing trials has been quite small. Approximately 80 % of the blocks (75 mm height) manufactured were within 0.1 mm of the target. The maximum tolerance accepted for those blocks was 0.5 mm, about 1 % of the blocks manufactured were out of the 0.5 mm tolerance (Koskinen 2012). In

64
comparison, the Aachen manufacturing tests (150 mm block height) had a height variance set at ±1 mm, and around 90% of the blocks were within the tolerance. The tests are not directly comparable because the loading was done differently (Hansen et al. 2010). Based on these tests the height tolerance of the 330 mm high blocks can be estimated to be less than ±1 mm. The variation of the width and length of the blocks has been very small since the molds did not allow these dimensions to change, so it can be stated that in practice the height is the only varying measure in the backfill blocks. The density variance measured was similar in both of the block manufacturing tests. In the Aachen tests (150 mm block height), the dry density average was 2028 kg/m3 with a variance of ±28 kg/m3 (Hansen et al. 2010). In the Bjuv production tests (75 mm block height), the dry density average was 1980 kg/m3, which is lower than in Aachen but the density variance was also smaller (±25 kg/m3) (Koskinen 2012). Both of the tests used an average compaction pressure of 25 MPa. The water contents were different in the tests, but the major cause for the lower density in smaller blocks is the mould geometry. Based on these tests, the dry density achieved for 550 x 470 x 330 mm blocks can be conservatively estimated to be approximately 2030 ±40 kg/m3. 4.7 Manufacturing of pellets Pellets are designed to be used as a part of the deposition tunnel backfill (see Section 3.4). In this report it is assumed that they will be manufactured by Posiva Oy. Posiva will order the raw material from the supplier and it will be delivered and transported to the production plant as described in Sections 4.4 and 4.5. The storing of raw material in the production plant before manufacturing is described in Section 4.5. In this section, the manufacturing process of pellets is described. The intermediate storage, transport to repository level and quality control methods of the manufactured product are described in Section 4.9. The installation of pellets is described in Section 4.13. 4.7.1 Overview of the process The production of different types of pellets has been described earlier by Dixon et al. (2011a). In this report it is assumed that pellets will be manufactured by the extrusion method in the backfill production plant. The pellet manufacturing process consists of the main steps given in Table 4-4. 4.7.2 Processing of the raw material for pellet production The raw material will go to through quality assurance screening testing as a first step. If the quality (montmorillonite content, chemistry, grain size distribution, water content etc.) is within the specified limits, the material will be discharged from the big bags to a silo and then into the mixer for water content adjustment and homogenisation. In the normal case, drying or crushing of the material beyond what was done by the supplier is not needed, but there is equipment available for this function if needed for a portion of the ordered materials. After conditioning, the raw material will be cured in a silo. Curing period is the time needed for humidity to distribute evenly in raw material. Curing silos must be as moisture tight as possible to prevent changes during the curing

65
period. The curing time remains to be optimized, but it may be from 1 day up to several days. The size of the curing silo will be dimensioned based on the curing time and the maximum size of the silo to avoid self-compaction and difficulties in discharging the material from the silo. After curing, the raw material is ready for extrusion. 4.7.3 Manufacturing method In this report it is assumed that the extrusion pelletising method will be used as the manufacturing method of bentonite pellets. There is also another method for manufacturing of pellets (roller compaction method), but this technique is not discussed in this report. The pellet mill is a machine that compresses and extrudes the raw material as cylindrical, rod-shaped pellets. The size and capacity of pellet mills varies, the required quantity of pellet material for use in a 5 meter long tunnel section is ~14-15 tons. This quantity can be produced during a one 8-hour working shift using an extrusion mill. There are two types of extrusion pellet mills: flat plate and ring die pellet mills shown in Figures 4-15 and 4-16. The mill type has not been specified yet. Short descriptions on the possible mill types are given below. This ring die mill has been commonly used in industry and one well-known application is manufacturing of feed-pellets for animals. The method is normally used in applications where achieving high density is not necessary. The ring die mill method is based on a perforated die through which the raw material is pushed. Feed material is compacted into cylindrical bentonite rods with defined diameter. The diameter of the rods can be varied by changing the size of the openings (Dixon et al. 2011a). In a flat plate die mill, the raw material is extruded through a flat die. There are two alternative operating principles (Alaska Pellet Mill 2011): a) die is turned by a ring and pinion, and rollers are stationary or b) die is stationary and rollers are driven. In the plate die mill the die holes can be any size is desired through manufacture of plates with a predefined diameter. As well as in the ring die mill type, the equipment requires maintenance and the dies and rollers need to be changed regularly, but more often than for the ring die mill (Alaska Pellet Mill 2011). The pellet mill can be combined with several devices, for example a hammer mill, a mixer, a selective screening equipment and a packing device to produce the desired pellet product. The pelletising rate and pellet properties can be optimised for the material by changing the compressive load, humidity and grain size of the raw material (Alaska Pellet Mill 2011). The extrusion method has some weaknesses: produced pellets have non-uniform dimensions, particularly their length (see Sections 3.2.3 and 3.3.3 and Figure 3-7) and according to Dixon et al. (2011a), the method also has limitations regarding the density to which the pellets can be compacted and the durability of pellets also varies. Nevertheless, it has been mentioned that extrusion-made pellets are durable enough to be installed by shotcreting equipment (Dixon et al. 2008a, Dixon et al. 2008b, Keto et al. 2009 and Riikonen 2009).

66
Table 4-4. The overview of the pellet manufacturing process. Process phase Object of the phase What is included into
the phase Duration of the phase
Final acceptance for backfill production
Section 4.5.3 Section 4.5.3 Section 4.5.3
Processing of the raw material for pellet
extrusion
Preparing of the raw material to the desired
state for the pellet extrusion
Adjustment of water content by mixing
10-15 min per batch
Drying, if necessary
Drying, time is dependent to the drying machine and the water
content of the raw material
Crushing, if necessary Crushing, time is dependent on the crushing machine
Curing of the raw material
Let the water distribute more evenly
Holding the mixed material in diffusion
sealed silos
at least 1 day, remains to be optimized
Extrusion of pellets Extrusion of the pellets Extrusion 15-20 t / 8 h
Quality control of pellets
To guarantee the constant quality for the
pellets
Density
Dimensions
Weight
Water content
Packing and storage of pellets
Packing of the extruded and inspected pellets
Storage in silo / packing the pellets into big bags
Transportation of the big bags to the storage
Transporting and storing
Storage After manufacturing, the pellets will be conveyed into a silo, from which the material is fed to a tanker truck for transportation to the repository level. The silo and the tank truck shall be designed so that the water content of the pellets is not changed during the storage or transportation. In addition to the storage in silo, the pellets can be packaged in big bags and transported to an inside storage facility.
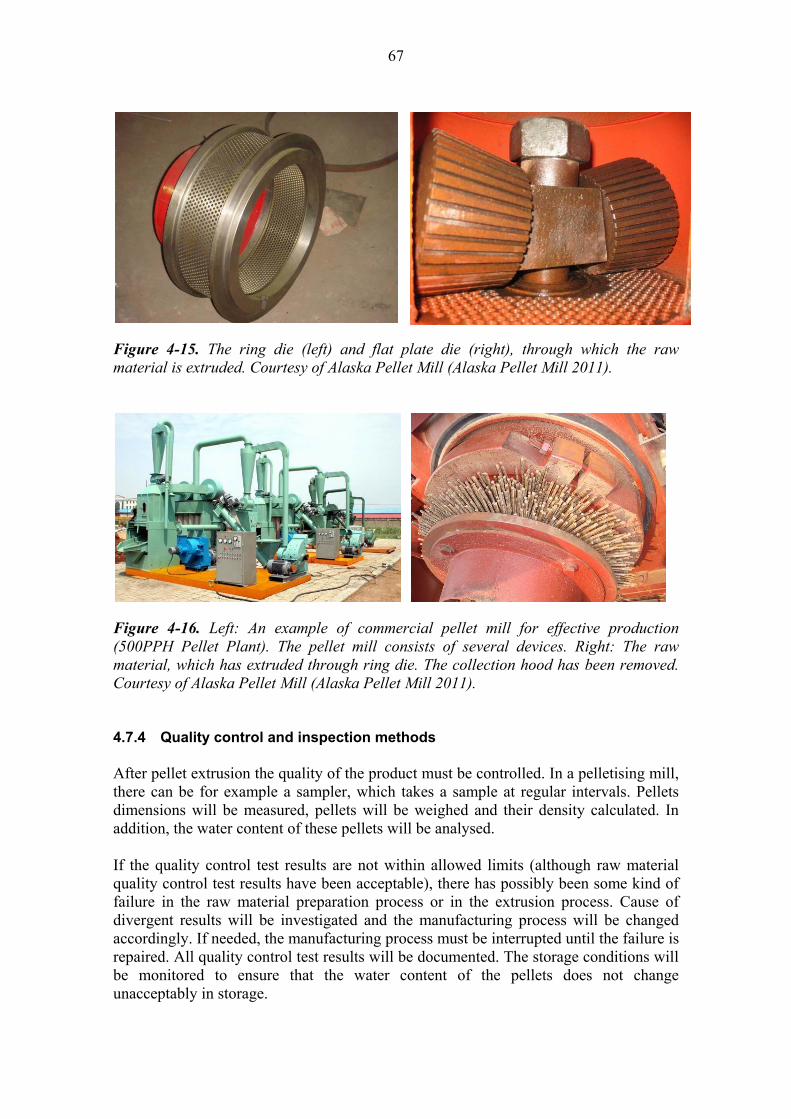
67
Figure 4-15. The ring die (left) and flat plate die (right), through which the raw material is extruded. Courtesy of Alaska Pellet Mill (Alaska Pellet Mill 2011).
Figure 4-16. Left: An example of commercial pellet mill for effective production (500PPH Pellet Plant). The pellet mill consists of several devices. Right: The raw material, which has extruded through ring die. The collection hood has been removed. Courtesy of Alaska Pellet Mill (Alaska Pellet Mill 2011). 4.7.4 Quality control and inspection methods After pellet extrusion the quality of the product must be controlled. In a pelletising mill, there can be for example a sampler, which takes a sample at regular intervals. Pellets dimensions will be measured, pellets will be weighed and their density calculated. In addition, the water content of these pellets will be analysed. If the quality control test results are not within allowed limits (although raw material quality control test results have been acceptable), there has possibly been some kind of failure in the raw material preparation process or in the extrusion process. Cause of divergent results will be investigated and the manufacturing process will be changed accordingly. If needed, the manufacturing process must be interrupted until the failure is repaired. All quality control test results will be documented. The storage conditions will be monitored to ensure that the water content of the pellets does not change unacceptably in storage.

68
4.7.5 Experiences from pellet production There is currently an SKB-Posiva Project ongoing for optimising the pellet fill where also the production of pellets is being tested both with extrusion and compaction methods. Experiences from this project will be used in optimising the properties of the pellet fill including water content and grain size distribution. Preliminary results from the pellet optimization project are presented in Kim et al. (2012) and Andersson & Sandén (2012). 4.8 Preparation of the material for the foundation layer 4.8.1 Processing of the raw material for the foundation layer
In order to achieve as high a density as possible for the in situ compacted foundation layer, the optimum water content needs to be defined for the material. This is usually done with Proctor compaction tests. The optimum water content determined for Minelco granules with Standard Proctor Compaction tests is presented in Figure 4-17. Based on this curve, the optimum water content for the Minelco granules is ~19.5% (+/-1.5%). Typical for smectitic clay materials, the curve is relatively flat and the compactibility is not as sensitive for changes in water content as for coarser materials. For example, in earlier field tests by Wimelius & Pusch (2008), no extra water was added to dry Minelco granules prior to compacting, but still the target dry density (1250 kg/m3) was achieved for the material. It should be also noted, that in addition to laboratory tests, the water content needs to be optimised for the actual compaction method based on field testing. For example, in field tests described in Autio et al. (2012) even higher water content than 19.5% was used in the tests to avoid dust generation and to be able to compact the material with a heavy roller. After mixing, the material is stored in water tight silo for a short time to enable unloading of the material to the transportation vehicle. No actual curing time is needed for this application that is not that sensitive to small variations in water content as for example block compaction. The need for foundation layer material is ~9 tons for a 5 meter long tunnel section. This amount can be easily mixed with the same mixer that is used for mixing the material for backfill blocks (mixing capacity 3-4 tons per batch). However, the mixer always needs to be cleaned before changing the material to be mixed to avoid contamination. 4.8.2 Quality control and inspection methods The water content of the foundation layer material will be controlled by taking samples from the material and determining the water content with standard methods. 4.8.3 Experiences from the field tests for conditioning the material Based on previous field tests with mixture of bentonite and ballast and with Friedland clay (see e.g. Korkiala-Tanttu et al. 2007), the best result is gained when the material is close to its optimum water content determined for the specific compaction method and tools. Too dry a material does not compact well and too wet easily sticks to the compaction tools making placement problematic.

69
Figure 4-17. Example on a standard Proctor compaction test result for Minelco granules (Autio et al. 2012). Based on this test, the maximum Proctor dry density is ~1450 kg/m3 and the optimum water content of ~19.5 %. The relativley flat shape of the curve is due to the high smectite content of the material. The yellow dashed line is the zero air void line showing the water content at full saturation. The compaction of Minelco granules with a vibratory plate have been tested by Wimelius & Pusch (2008). However, no water was added to the material prior to compaction. Based on field test with Minelco granules (Autio et al. 2012) some extra water needed to be added to the Minelco granules due to dust generation and to be able to compact the material to the desired density with a roller compactor. The experience concerning the compaction result is discussed in Section 4.11.3 (Experience from the field tests). 4.9 Handling and transportation 4.9.1 Intermediate storages The water sealed storage packages are kept in stable temperature (~10 °C) and regulated relative humidity (RH%) conditions to avoid condensation. From the storage location, the packages are transported to the tunnel as needed. Even a long storage time seems not to affect the block quality substantially as long as they are kept covered in a suitably climate-controlled environment (Hansen et al. 2010). There is also an intermediate storage period in the tunnel, possibly in the neighbouring tunnel to the one being backfilled, where the packages can be stored for a short time just before they are transported into the backfilled tunnel. The packages should be sheltered from water inflows or dripping water at this location.
1300
1350
1400
1450
1500
1550
15% 17% 19% 21% 23% 25% 27% 29% 31% 33% 35% 37% 39%
Dry
den
sity
( k
g/m
3 )
water content (%)

70
4.9.2 Transportation to the repository level The water-tight block packages are transported to the tunnel by a truck. Pellets and foundation layer material are transported to the backfilled tunnel with a tanker truck to avoid changes in the water content of the material. From the intermediate storage in the tunnel, the packages are transported to the deposition tunnel under operation. The exact transportation method for this purpose has not been specified yet, but it may be wheel-based or a conveyor belt. After unloading of the blocks from their transportation/storage packages, the empty packaging components are transported back to the packaging facility, cleaned and reused (Hansen et al. 2010). 4.9.3 Quality control and inspection methods During transportation and storage the materials are not allowed to be in contact with water (vapour or liquid), other liquids or chemicals and they are not allowed to freeze. The temperature, humidity and cleanliness during the transport and storage are monitored and controlled. After each transport and storage period, the blocks and covers are inspected in order to detect any broken covers or blocks. The blocks that are not accepted for use are returned to the block pressing plant, where they are crushed, dried and the material is re-used for block manufacturing assuming that material has remained uncontaminated (see Fig. 4-13). Contaminated material cannot be used in block manufacturing or in pellet fill or foundation layer material. 4.10 Preparation of deposition tunnel for backfill operations 4.10.1 Dismantling of the tunnel infrastructure The tunnel infrastructure and all the equipment previously employed in the tunnel will be removed before backfilling of the deposition tunnel (Hansen et al. 2010). Temporary deposition tunnel infrastructure consists, for instance, of ventilation channels and temporary water pipe lines used for the boring of deposition holes (Saanio et al. 2007). In addition, other possible temporary infrastructure containing drains, concrete plate pavement, electricity lines, alarm system and lighting (Saanio et al. 2003, Kukkola 2004, Saanio et al. 2007) must be removed from the deposition tunnel before backfilling. In addition, any concrete structures needed for the installation of the buffer/canister and crushed rock from the tunnel floor will be cleared from the tunnel. For operational safety reasons, some of the rock reinforcements (e.g. rock bolts) will be left in the tunnel (Saanio et al. 2007). It can be estimated that for a 40 m long section, the dismantling of the infrastructure takes approximately 1-2 working days. 4.10.2 Scanning of tunnel dimensions As the tunnel infrastructure is removed, the tunnel cleared and loose rocks removed from the rock surfaces, the exact tunnel dimensions will be defined. The knowledge of exact tunnel dimensions is essential to enable successful implementation of backfilling and to be able to calculate the average backfill density for each tunnel metre. The

71
scanning technique is not yet decided on, but one method is laser scanning (Lidar method) (Hansen et al. 2010), the method by which the dimensions of ONKALO have been measured during construction. The scanning of tunnel dimensions can be done directly after the excavation of the tunnel as well as mapping of water conducting fractures etc. The laser scanning survey yields a point cloud in which every point has 3D coordinates and reflection intensity value (Slob & Hack 2004, Fekete et al. 2010). The method has very high point density varying from 5 mm to 10 mm (Slob & Hack 2004) generating high resolution 3D dataset (Figure 4-18) (Fekete et al. 2010).
Figure 4-18. Result of laser scanning in Sandvika tunnel in Norway (a) raw point cloud, (b) triangular mesh, and (c) meshed tunnel model. In figure (d) the radial difference map showing final shotcrete profile compared to a cylindrical design profile (contoured on the rock–shotcrete model or on the cylinder as desired). Fekete et al. (2010).

72
4.11 Installation of the foundation layer 4.11.1 Installation method The water content of the foundation layer material will be optimised for the compaction method based on Standard Proctor compaction test and field tests. As seen in Figure 4-17, based on Standard Proctor compaction test, the compaction properties of the foundation layer material seems not to be very sensitive to the change in water content. However, in practice, the water content needs to be optimised for the actual compaction method. Before installation, the mass of foundation layer material is calculated for each tunnel section based on volume information from tunnel scanning. In the tunnel, the material is discharged from the tank truck and leveled on the rock surface. The optimum layer thickness to be compacted at one time is approximately 150 mm. The amount of layers to be compacted depends on the excavation tolerance at the location. The maximum layer thickness is 550 mm and the average is 350 mm. The compaction of the main body of the foundation layer can be done with a roller compactor. However, areas close to the block front and tunnel walls need to be compacted with a vibratory plate. The number of passes that the compactor makes over the layer to be compacted and other practicalities will be optimised based on field tests. The target dry density of the foundation layer is ~1250 kg/m3 ±100 kg/m3. Based on the Standard Proctor compaction tests performed for the material (see Figure 4-18 from Section 4.8.1 Processing of the raw material for the foundation layer), the maximum Proctor dry density is ~1450 kg/m3. The target dry density of 1250 kg/m3 corresponds to 86% of maximum Proctor dry density. The installation of the filling components to the upper part of the deposition holes and chamfers are described in Buffer production line report as well as filling of rejected deposition holes. 4.11.2 Quality control and inspection methods The mass of foundation layer material used for each tunnel section is recorded and the corresponding dry density is calculated for the section based on the tunnel volume data. During the compacting, the roller compactor has an automatic system that logs the compaction result. There are different continuous compaction control systems available for rollers depending on the producer of the compactor. Other methods to control the compaction result is to use Troxler or similar equipment for measuring the dry density and use falling weight deflectometer or a plate loading tests to study the compaction degree exist but need to be evaluated for applicability to this geometry (Hansen et al. 2010). In addition, the dry density and water content of the layer needs to be checked at regular intervals by sampling. The dry density and water content of the samples is then compared to the calculated ones and used for calibrating the control equipments. The thickness of foundation layer will be controlled for instance by scanning. The evenness and inclination of the surface can be controlled by the same method or for example by using a tachymeter. Depending on the equipment used, they may have also integrated tachymeter that can be used for automised quality control. If the foundation layer does not fulfill the specifications set for the layer concerning dry density, thickness or evenness, the layer will be removed and re-installed. It is likely that the

73
material cannot be recycled for this particular purpose due to high risk of contamination and may need to be handled as waste if no application is found for the material, e.g. as closure material. However, the amount of foundation layer material to be discarded is likely to be relatively small compared to the amount of block material. 4.11.3 Experiences from in situ compaction field tests Previously, experiences from compaction of foundation layer have been gained for mixture of bentonite and ballast (30:70) and Friedland clay (Korkiala-Tanttu et al. 2007) and for Minelco granules and Cebogel pellets (Wimelius & Pusch 2008). The compaction of Minelco granules was tested with vibrating plate compactors with weight of 50, 70, 150 and 350 kg. The granule size distribution of the material used in the tests varied, but was in all tests between 0.1 and 11 mm. No water was added to the material prior to compaction. The achieved dry density for the foundation layer was ~1250 kg/m3. The layer thickness was 2 x 150 mm. After compaction of the layer, full-size concrete blocks were placed on the layer and based on this test, the layer was found to be a stable foundation for block assemblage even after adding some water to the layer (Wimelius & Pusch 2008). A new set of field tests with Minelco granules are described in Autio et al. (2012). The compaction methods tested were compaction with a vibratory roller compactor and with a vibratory plate (see Figure 4-19). The total layer thickness was up to 550 mm. Based on preliminary tests results, the target densities were reached for the tested materials. However, further development is needed to optimize the compaction process and the equipment. For example, the contact between adjacent layers may need to be roughened to gain better interlocking between separate layers (2012).
Figure 4-19. Field test with Minelco granules (Autio et al. 2012). Vibratory roller compactors and a vibratory plate used in compaction of foundation layer. Photos by Olli Salo.

74
4.12 Installation of backfill blocks 4.12.1 Installation method The installation of backfill blocks onto the foundation layer is performed using an automated device equipped with an installation tool and mounted on an installation vehicle. The blocks are brought to the installation vehicle in larger batches and placed into their designed position in the tunnel with the automated installation device. The installation of each row is done in horizontal layers. The installation proceeds from one layer to another. Layers overlap the layer below to achieve a stable assembly. The installation is done carefully to fulfill the strict installation tolerances. It is assumed that the total tolerance (sum of installation and manufacturing tolerances) in the vertical block interfaces is ≤5 mm. In horizontal interfaces, the installation tolerance is assumed to be close to 0 mm, but the total installed tolerance depends on the manufacturing tolerance of the blocks. The installation rate is estimated to be ~40-50 seconds per block. Assuming a backfilling rate of 5 m/day, the required amount of blocks to be installed daily is ~720 blocks leading to total block installation duration of 8-10 h. The automated installation device is illustrated in Figure 4-20.
Figure 4-20. Installation of backfill blocks with an automated installation device.
4.12.2 Quality control and inspection methods Before the installation of the blocks, the quality and evenness of the foundation layer must be checked to ensure a stable block assemblage is achieved. The weight of each block is measured before installation. The weight measurements including the position information of the block are documented. Furthermore, after the installation of each cross section of blocks, the facial evenness of the layer is inspected by scanning and compared to the assembly tolerances. Also, the distance between the blocks and rock walls is checked.

75
4.12.3 Experiences from the field tests Stacking tests of blocks have been performed at the Äspö HRL (Wimelius & Pusch 2008). They have provided a lot of useful information on the capacity, stability and need for technology to conform to the required accuracy during installation. The large scale tests with full-size concrete blocks simulating backfill blocks showed that the blocks can be placed at a rate of one block per minute with acceptable accuracy, i.e. with a volume of unfilled voids of about 1.5% of the total block volume. In the test presented in Riikonen (2009), the installation tolerance of blocks with size of 300x300x150 mm varied from 1-5 mm. In further installation tests presented in Keski-Kuha et al. (2012), the installation of blocks with size of 300x150x75 mm was made by hand. The measured installation tolerances in these tests were smaller than in the previous tests with slightly bigger block size. Since both of these installations were made by hand, it is difficult to say to what tolerance can be reached with an automated device without tests with the device. 4.13 Installation of pellets 4.13.1 Installation method
The pellets are installed by using the wet spraying method. The wet spraying method enables a nearly vertical pellet front to be installed. The spraying is done in 3-5 metres long sequences. Water is added to the pellet spray in the nozzle to avoid dust generation and to enable installation of a steep pellet front. The amount of water added is around 10% (Hansen et al. 2010). Based on field tests presented in (Keski-Kuha et al. (2012) the water content of the pellet fill after installation is from 25% to 30%. The pellet spraying equipment is joined to the same automated installation device that is used for the block installation. The spraying tool consists of a nozzle with a tube. The dimension of the nozzle is chosen to reach into the narrow space between the blocks and the rock and to have the capacity to yield the prescribed installation rate. The device can change between the block installation tool and the pellet spraying tool when the installation of pellets begins after the block installation. The spraying tool can also be a part of the block installation tool to achieve as efficient installation as possible. The spraying process is visually monitored with a camera mounted on the device. The device is also equipped with high capacity lighting for the illumination of the installation area. Pellet spraying equipment is illustrated in Figure 4-21. 4.13.2 Quality control and inspection methods The volume and weight of the pellet material and water are documented for each spraying sequence. In addition, samples are taken in regular intervals to check the dry density and water content of the installed pellet mass. The average dry density of the pellet fill is calculated based on tunnel volume data and mass of pellets installed on that specific tunnel volume. The accuracy of the density calculations depends on the accuracy of the recorded masses and volumes. If the installed material does not fulfill the specifications, the material needs to be removed and new material need to be installed on this section. It is likely that the discarded pellet material cannot be recycled for this particular purpose due to high risk of contamination and may need to be handled

76
as waste if no application is found for the material, e.g. as closure material. However, the amount of pellet material to be discarded is likely to be relatively small compared to the amount of block material. 4.13.3 Experiences from field tests A large number of full scale tests to install pellets have been performed in the Bentonite Laboratory at Äspö (Wimelius & Pusch 2008). The tests showed that the spraying method is feasible for pellet installation. The installation capacity according to the tests is approximately 5 m³/h, but can probably be improved. The pellet material needed to fill a 5 meter long tunnel section is ~14-15 tons (also 14-15 m3 assuming a dry density of 1000 kg/m3) meaning that the installation of pellets to this section takes approximately 3-4 hours assuming the same capacity as in Äspö tests.
Figure 4-21. Installation of backfill pellets. The target dry density of a pellet fill in tests presented in Wimelius & Pusch (2008) was 1000 kg/m³ (Cebogel pellets with 16 % water content). However, the dry density of the installed pellet fill was found to be only 907 kg/m³. This may partly be explained by the fact that the space immediately below some of the artificial rock features limiting the installation was not filled. In tests done at ½-tunnel scale pellets were successfully installed into a ~150 mm wide gap to a dry density of 950-1080 kg/m3 but there were no irregularities in the gap, which simplified the process (Dixon et al. 2008b). The higher density achieved in these tests indicates that there is room for improving the achieved dry density of the pellets installed in a repository environment. In the ¼-scale tunnel tests presented in Keski-Kuha et al. (2012), the spraying method was used as the pellet installation method for over ten test structures. The width of the pellet filling was roughly 200 mm in all tests. Also these tests proved that the spraying method is feasible. The achieved dry densities for pellets varied from 805 to 978 kg/m3 and the average value was 891 kg/m3. The achieved pellet density depended clearly on the experience of the person doing the spraying and the used spraying pressure. The spraying pressure varied from 120 to 230 kPa (Keski-Kuha et al. 2012).

77
To consistently achieve the required density for pellets more tests are needed to further develop the spraying method and to optimise the spraying pressure, water content, pellet material, and pellet size. An example on the installation of pellets by spraying is shown in Figure 4-22.
Figure 4-22. Pellet spraying in ¼-scale tunnel tests (Keski-Kuha et al. 2012). 4.14 Backfill sequences and timing of operations
The assumed backfilling rate is roughly 5 m in 24 hours, consisting of following activities: - Installation of the foundation layer (~1 working shift per 5 m), - Installation of blocks (8-10 hours) and - Installation of pellets (3-4 hours per 5 m).
The basic assumption for the backfilling sequence is that the backfilling will be made in 40-metre long sections. If no other operations in the tunnel were taken into account, the backfilling of a 40-metre long section would take 8 days and of a 300 metre long tunnel 60 days (3 shifts per day, continuous operation). However, the total duration depends on the duration of the buffer/canister related operations and preparations taking place in the tunnel (for example clearing of temporary infrastructure etc.). For a 40-metre long section, the preparations prior to backfilling can be estimated to take 48 hours. Considering that the installation of canister and buffer for four deposition holes would take four days (Tanskanen 2009), the total duration of operations for a 40 metre long section would be 14 days (see Figure 4-23) and approximately 100 days for a 300-metre long tunnel with 26 deposition holes. Considering continuous campaign (3 shifts per day, working on weekends), the tunnel would be backfilled within 3-4 months.

78
Figure 4-23. Estimated duration of buffer and backfill related operations for a 40-m long tunnel section.
4.15 Handling of backfill waste and rejected backfill materials Approximately 80 % of all backfill materials used in backfilling of deposition tunnels consists of Friedland clay blocks. In case of a broken or otherwise rejected block due to deviation from the accepted range of water content, dry density or dimensions, there is a possibility to re-cycle the block material. The precondition for recycling is however, that the block material has not been contaminated with any other material during the process, i.e. the blocks need to be clean and appropriately stored. After acceptance to recycling the blocks are crushed and dried, if needed (see Fig. 4-13). After this, the material is again conditioned to the right water content for block pressing. The situation for recycling pellet and foundation layer material is more complex. There is a risk that the material is contaminated during the installation process, although the tunnels are cleaned before installation. Therefore it is not certain, that the material can be re-cycled for its original purpose. The material could perhaps be reused as a closure material or in some other civil engineering application, but if this is not possible, the material will be handled as waste. It can be estimated that a small percentage (<5 %) of all backfill materials is lost during handling and processing of the material. This material can be lost e.g. due to dusting and is handled as waste. The processes should be developed so that dusting is as minimal as possible. Since the materials are not in contact with nuclear waste and the radiation does not affect materials placed in the deposition tunnels (the buffer attenuates the radiation), the waste shall be handled as normal waste.

79
5 INITIAL STATE OF THE BACKFILL 5.1 Initial properties of backfill components The initial properties of the backfill components are presented in Tables 5-1 and 5-2. The initial dry density range for backfill blocks based on block compaction tests are reported in Riikonen (2009), Hansen et al. (2010) and Koskinen (2012). The dry density range for the foundation bed and pellets are based on field tests described in Wimelius & Pusch (2008), Dixon et al. (2011a), Riikonen (2009) and Autio et al. (2012). The montmorillonite content of the different components is based on determinations by Karnland et al. (2006) and Kumpulainen & Kiviranta (2010). For a more detailed mineralogical and chemical description of the materials, see Sections 3.2.1, 3.2.2 and 3.2.3. Table 5-2 presents the masses, volumes and degree of saturation of each component normalised for a volume of 1 m3. Table 5-1. Initial state of backfill components. Components Materials Remarks
Backfill blocks Friedland clay, Germany See Section 3.2.2
Foundation layer Bentonite granules from Milos, Greece See Section 3.2.1
Pellets Bentonite pellets from Milos, Greece See Section 3.2.3
Dry density of components Min Average Max Notes
Backfill blocks kg/m3 1990 2030 2070 (±40 kg/m3)
Foundation layer kg/m3 1150 1250 1350 (±100 kg/m3)
Pellets kg/m3 900 1000 1100 (±100 kg/m3)
Water content Min Average Max Notes
Backfill blocks % 8.5 9.0 9.5 (±0.5%)
Foundation layer % 18.0 19.5.0 21.0 (±1.5%)
Pellets % 17.5 27.5 37.5 (±10%)
Montmorillonite content Min Average Max Notes
Backfill blocks % 30 34 38Margin of error ±2 %, possible variance 28-40%
Foundation layer % 75 80 90 Includes margin of error
Pellets % 75 80 90 Includes margin of error
EMDD
Backfill blocks* kg/m3 1150 1332 1497
Foundation layer kg/m3 962 1099 1227
Pellets kg/m3 734 862 1031
*The range of EMDD (effective montmorillonite dry density) for blocks has been calculated using montmorillonite content between 28-40% and grain density of 2 780 kg/m3 and masses and volumes presented in Table 5-2. Note that this is initial component EMDD before any swelling or homogenisation of the backfill system.

80
Table 5-2. Initial masses (kg), volumes (m3) and degree of saturation (%) determined for the different backfill components. The Min case describes the combination of minimum component density and minimum amount of swelling minerals. The Average case describes the combination of average component density and average smectite content. The Max case describes the combination of maximum component density and maximum amount of swelling minerals. Note that the masses and volumes are calculated for 1 m3 of each component. Mass of swelling minerals per 1m3 Min Average Max
Backfill blocks kg 557 690 828
Foundation layer kg 863 1000 1170
Pellets kg 675 800 990
Mass of non-swelling minerals per 1 m3 Min Average Max
Backfill blocks kg 1433 1340 1242
Foundation layer kg 288 250 130
Pellets kg 225 200 110
Mass of water per 1 m3 Min Average Max
Backfill blocks kg 169 183 197
Foundation layer kg 207 244 273
Pellets kg 158 275 413
Volume of swelling minerals per 1 m3 Min Average Max
Backfill blocks m3 0.20 0.25 0.30
Foundation layer m3 0.31 0.36 0.42
Pellets m3 0.24 0.29 0.36
Volume of non-swelling minerals per 1 m3 Min Average Max
Backfill blocks m3 0.52 0.48 0.45
Foundation layer m3 0.10 0.09 0.05
Pellets m3 0.08 0.07 0.04
Volume of water per 1 m3 Min Average Max
Backfill blocks m3 0.17 0.18 0.20
Foundation layer m3 0.21 0.24 0.27
Pellets m3 0.16 0.28 0.41
Pore volume per 1 m3 Min Average Max
Backfill blocks m3 0.28 0.27 0.26
Foundation layer m3 0.59 0.55 0.53
Pellets m3 0.68 0.64 0.60
Air volume per 1 m3 Min Average Max
Backfill blocks m3 0.12 0.09 0.06
Foundation layer m3 0.38 0.31 0.26
Pellets m3 0.52 0.37 0.19
Degree of saturation Min Average Max
Backfill blocks % 60 68 77
Foundation layer % 35 44 51
Pellets % 23 43 68

81
5.2 Variations in the backfill geometry The backfill layout is presented in Figure 3-8 (see Section 3.4 Design of backfill block assemblage). The variations in the backfill geometry are mainly due to variations in the tunnel geometry (see Section 2.3.3 Tunnel dimensions and volumes). This means that the total thickness of the foundation layer can vary between 150 mm and 550 mm, the average being 350 mm. The thickness of the pellet layer at the walls can vary between 100 and 400 mm (<100 mm locally in the upper corners of the block assemblage), the average being 250 mm. At the roof section the thickness varies from 400 mm to 635 mm. The manufacturing tolerance for the backfill blocks is -1 mm to +2 mm. 5.3 Variations in average dry density and EMDD The average dry density is calculated from the total mass of backfill materials and the total volume of the tunnel. Assuming the initial range of component dry densities presented in Table 5-1 and the excavation tolerances of 0-400 mm on the floor and 0-300 mm on the tunnel walls/roof, the dry density for the OL1-3 cases can vary between 1608 and 1 924 kg/m3, the average being 1758 kg/m3 (see Figure 5-1 and calculations in Appendix 8). The corresponding values for the LO1-2 tunnels are 1603-1928 kg/m3 with an average of 1757 kg/m3 (see Figure 5-2 and Appendix 9). The large range is mostly due to large variations in the tunnel geometry. The effect of variance in the initial backfill dry densities is only ±60 kg/m3. Therefore, if a smaller range in achieved density is desired, the best option would be to optimise tunnel excavation techniques. The effective montmorillonite dry density (EMDD) is defined as follows (Equation 5-1) (Dixon et al. 2002): EMDD = mmont / (Vvoids + Vmont) (Eq. 5-1) Where mmont represents the mass of montmorillonite, Vmont the volume of montmorillonite and Vvoids the volume of voids in the material. The EMDD calculations for the saturated and homogenised backfill are presented in Appendices 8 and 9.

82
Figure 5-1. Average dry density range taking into account variations in the initial component dry densities and tunnel volume (OL1-3 cases).
Figure 5-2. Average dry density range taking into account variations in the initial component dry densities and tunnel volume (LO1-2case).
1724
1669
1608
1809
1758
1703
1924
1879
1832
1500
1550
1600
1650
1700
1750
1800
1850
1900
1950
Max Aver. Min
Dry density (kg/m
3)
Dry density of components
Dry density range for OL1‐3 tunnels
Max tunnel volume
Average tunnel volume
Min tunnel volume
1720
1665
1603
1807
1757
1701
1928
1883
1836
1500
1550
1600
1650
1700
1750
1800
1850
1900
1950
Max Aver. Min
Dry density (kg/m
3)
Dry density of backfill components
Dry density range for LO1‐2 tunnels
Max tunnel volume
Average tunnel volume
Minimum tunnel volume

83
The effective montmorillonite dry density (EMDD) for the deposition tunnel backfill is calculated taking into account the total mass of swelling minerals per 1 tunnel metre and the cross-section (volume) of this tunnel at this section. The EMDD depends on the range of swelling minerals and dry densities in the different backfill components as well as on the excavation tolerance in this particular tunnel section. Figures 5-3 and 5-4 show the variation of average EMDDs for OL1-3 and LO1-2 tunnels. The extreme cases are the ones assuming minimum/maximum montmorillonite contents and component dry densities presented in Table 5-1, as well as that the excavation tolerances would be either 0 % or the maximum 36 %. Therefore it can be stated that these cases have extremely low probability, but they are in theory possible. However, considering the nature of drill and blast excavation, these sections would be very local and the sections with highest density would be right next to those with lowest density. Since homogenisation will take place also in the axial direction, the maximum and minimum densities will even out towards the average values. Therefore it can be estimated that after saturation and homogenisation of the backfill, the EMDDs will vary between 1000 and 1300 kg/m3. However, tests and numerical modelling on homogenisation of the backfill are needed to verify that this occurs or to what degree it can be relied on. As stated already earlier in this section, the major part of this variation comes from the varying tunnel profile. If a smaller EMDD range is desired, the tunnel excavation techniques need to be optimised to gain smaller tolerances.
Figure 5-3. Average effective montmorillonite dry density (EMDD) for the OL1-3 case taking into account the montmorillonite content in all backfill components.

84
Figure 5-4. Average effective montmorillonite dry density (EMDD) for the LO1-2 case taking into account the montmorillonite content in all backfill components. 5.4 Other properties The range of other material properties defined for the initial state, taking into account all components in the tunnel cross-section are presented in Appendices 8 and 9. Assuming average component dry densities and an average tunnel cross-section, the average porosity (Equation 5-2) and void ratio (Equation 5-3) are defined as follows: The porosity (n) is defined as: n = Vvoid / Vtotal (Eq. 5-2) Where the Vvoid is the void volume and Vtotal is the total volume of the sample. The average porosity for the backfill is 36.8%. The void ratio (e) is defined as: e = Vvoid / V solids (Eq. 5-3) Where the Vvoid is the void volume and V solids the volume of solid particles. The average void ratio (e) for backfill is 0.6 (dimensionless).
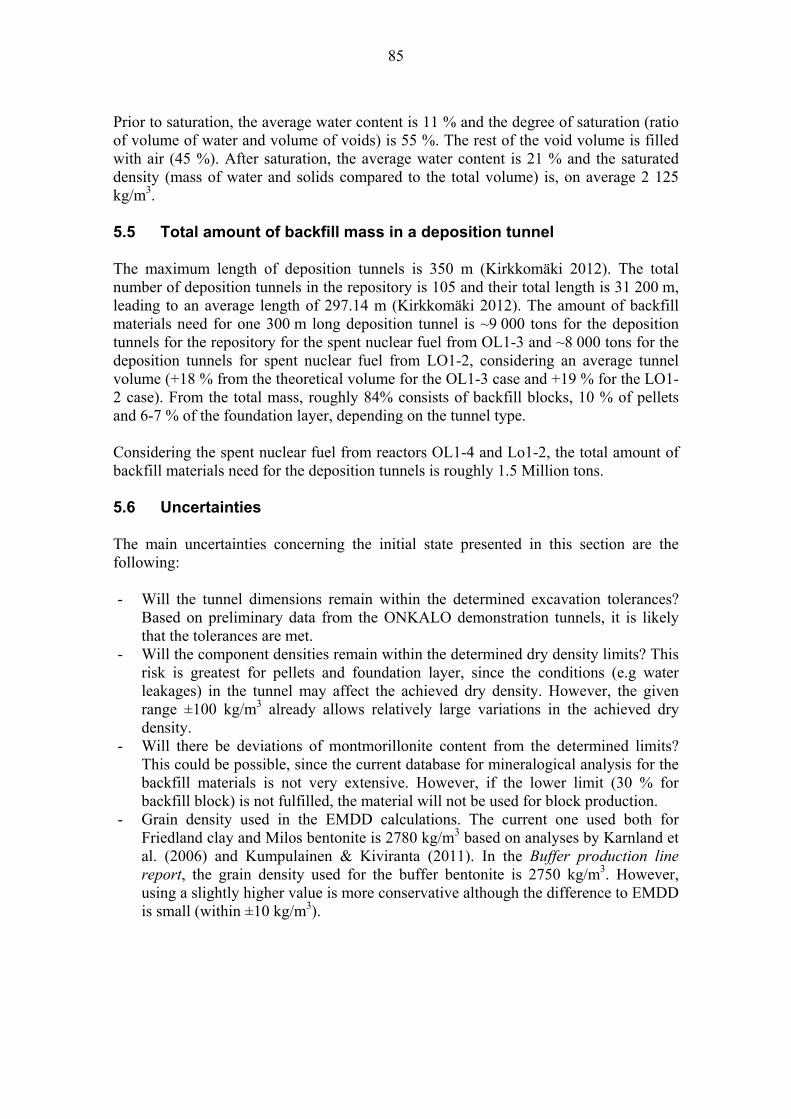
85
Prior to saturation, the average water content is 11 % and the degree of saturation (ratio of volume of water and volume of voids) is 55 %. The rest of the void volume is filled with air (45 %). After saturation, the average water content is 21 % and the saturated density (mass of water and solids compared to the total volume) is, on average 2 125 kg/m3. 5.5 Total amount of backfill mass in a deposition tunnel The maximum length of deposition tunnels is 350 m (Kirkkomäki 2012). The total number of deposition tunnels in the repository is 105 and their total length is 31 200 m, leading to an average length of 297.14 m (Kirkkomäki 2012). The amount of backfill materials need for one 300 m long deposition tunnel is ~9 000 tons for the deposition tunnels for the repository for the spent nuclear fuel from OL1-3 and ~8 000 tons for the deposition tunnels for spent nuclear fuel from LO1-2, considering an average tunnel volume (+18 % from the theoretical volume for the OL1-3 case and +19 % for the LO1-2 case). From the total mass, roughly 84% consists of backfill blocks, 10 % of pellets and 6-7 % of the foundation layer, depending on the tunnel type.
Considering the spent nuclear fuel from reactors OL1-4 and Lo1-2, the total amount of backfill materials need for the deposition tunnels is roughly 1.5 Million tons. 5.6 Uncertainties The main uncertainties concerning the initial state presented in this section are the following: - Will the tunnel dimensions remain within the determined excavation tolerances?
Based on preliminary data from the ONKALO demonstration tunnels, it is likely that the tolerances are met.
- Will the component densities remain within the determined dry density limits? This risk is greatest for pellets and foundation layer, since the conditions (e.g water leakages) in the tunnel may affect the achieved dry density. However, the given range ±100 kg/m3 already allows relatively large variations in the achieved dry density.
- Will there be deviations of montmorillonite content from the determined limits? This could be possible, since the current database for mineralogical analysis for the backfill materials is not very extensive. However, if the lower limit (30 % for backfill block) is not fulfilled, the material will not be used for block production.
- Grain density used in the EMDD calculations. The current one used both for Friedland clay and Milos bentonite is 2780 kg/m3 based on analyses by Karnland et al. (2006) and Kumpulainen & Kiviranta (2011). In the Buffer production line report, the grain density used for the buffer bentonite is 2750 kg/m3. However, using a slightly higher value is more conservative although the difference to EMDD is small (within ±10 kg/m3).

86

87
6 CONFORMITY OF THE REFERENCE BACKFILL TO DESIGN BASIS The conformity of the reference backfill design to the design requirements and specifications (presented in Chapter 2) is discussed in this section based on the backfill performance in its initial state (see Chapter 5, Initial state). The long-term evolution of the backfill performance is excluded from this report and will be discussed in the Performance Assessment report. 6.1 Density The initial dry density of the backfill components is presented in Table 5-1 After saturation and homogenisation of the backfill, the average dry density for the backfill will be 1758 kg/m3 for the OL1-3 case and 1757 kg/m3 for the LO1-2 case. The range is from 1608 to 1924 kg/m3 for Olkiluoto and from 1603 to 1928 kg/m3 for the LO1-2 case. The range of EMDDs is from 960 kg/m3 up to 1380 kg/m3 (see Section 6.3 for details). However, taking into account homogenisation in axial direction, the range is likely to be between 1000 and 1300 kg/m3. The dependence of density and hydraulic conductivity (design requirement 1x10⁻¹⁰ m/s) is discussed in Section 6.2. 6.2 Hydraulic properties According to performance targets set for the deposition tunnel backfill (see Section 2.1), the hydraulic conductivity of the backfill shall be <1x10⁻¹⁰ m/s. Based on measured hydraulic conductivity results for Friedland clay in the achieved dry density, the hydraulic conductivity will be between 1x10-11 and 1x10-12 m/s (see Figure 6-1) in a variety of groundwater salinities (up to 70 g/L). Although the pellets have initially a low density state, based on laboratory tests by Schatz & Martikainen (2011) the hydraulic conductivity of Cebogel pellets will be <1x10⁻¹⁰ m/s in the expected dry density state after homogenisation (1200 kg/m3). The studies to measure hydraulic conductivity of Minelco granules in the density state achieved in the tests described in Autio et al. (2012), but based on older data for Milos bentonites (Johannesson & Nilsson 2006), the hydraulic conductivity will be <1x10⁻¹⁰ m/s even for the lowest expected initial dry density of 1150 kg/m3. Looking at average dry densities and data for Friedland clay comprising the main body of the backfill, even in the lowest possible dry density case, the expected hydraulic conductivity will be <1x10⁻¹⁰ m/s. This conclusion is valid also based on the EMDD range of 960-1380 kg/m3 (presented in Appendices 8 and 9 and in Figures 5-3 and 5-4) that take into account the smectite content of all components within the tunnel cross-section and hydraulic conductivity data by Dixon et al. (2011a), see Figure 6-2. It can be stated that the safety margin for fulfilling the hydraulic conductivity for this design is sufficient. Considering that the EMDD needed to achieve this hydraulic conductivity in salinity up to 70 g/L (TDS) is 900 kg/m3, there is always at minimum 60 kg extra material per each 1 m3 of backfill material in the current backfill design. In conditions having lower groundwater salinity than 70 g/L, the density limit needed to ensure this hydraulic conductivity is even lower than 900 kg/m3, making this value additionally conservative.

88
Figure 6-1. Hydraulic conductivity of Friedland clay in varying salinities (0, 10, 35 and 70 g/L). The data used in plots are presented in Appendix 10. Note: 0 g/L in this and other similar figures in this chapter means tap water or deionized water of almost zero ionic strength.
Figure 6-2. Effects of EMDD and groundwater salinity on the hydraulic conductivity of variety of buffer and backfill materials (Dixon et al. 2011a).

89
6.3 Swelling properties Swelling pressure Based on the design requirements, the backfill “shall be designed to be self-sealing after initial installation and self-healing after any hydraulic or mechanical disturbances” (see Section 2.1). In addition, the material shall have contact with the host rock. In practice this means that material shall have sufficient swelling capacity (in volume) and swelling pressure. Currently, there is no exact swelling pressure limit set for the backfill. In earlier design phases (Hansen et al. 2010), the limit was >200 kPa. Considering the swelling capacity in volume, the clay blocks should swell on average 6 % (2.4-9.5 %), in order to compress pellets from their initial dry density of 900 kg/m3 up to a dry density of 1200 kg/m3 (corresponding to EMDD of 1000 kg/m3 assuming montmorillonite content of 75 % and grain density 2750 kg/m3). The measured swelling pressures for Friedland clay are presented in Figure 6-3. Based on data presented in Figure 6-3 and Appendix 10, the minimum possible swelling pressure will be >200 kPa even in a salinity of 70 g/L. The average dry density (1758 kg/m3) yields a swelling pressure between 1-2 MPa in saline groundwater conditions and 2-3 MPa in fresh water conditions. Based on the measurements for a sample with a dry density of 1910 kg/m3 in a water salinity of 10 g/L, the maximum possible swelling pressure is estimated to remain <6.5 MPa (see Appendix 11). After homogenisation, the swelling pressure of pellets will be roughly 300 kPa based on tests by Schatz & Martikainen (2012) with Cebogel pellets and tests by Johannesson & Nilsson (2006) for Milos bentonite in a dry density state of 1200 kg/m3. The swelling pressure measurements for Minelco granules in the density state gained in the field tests are presented in Autio et al. (2012). Based on the results by Johannesson & Nilsson (2006) for Milos bentonite, the swelling pressure will vary between 200 and 400 kPa depending on the density state and salinity of the percolating water. Since Friedland clay is Na-dominant clay, its swelling pressure may be affected in the long-term by the cation exchange with groundwater. However, no such effect has been seen when testing with groundwater with a salinity of 70 g/L containing 2/3 of Ca2+ and 1/3 of Na+. The only longer term test where Friedland clay has interacted with the Ca-rich groundwater has been the ABM test, where the material reacted with Ca-rich Äspö groundwater for 30 months (Kumpulainen & Kiviranta 2011). The effect on hydraulic conductivity and swelling pressure has been studied by Kumpulainen & Kiviranta (2011). Although the amount of exchangeable Na+ decreased from 76 % to 45-50 % during the test, there was no effect on the hydraulic conductivity of the sample. A small decrease was detected in the swelling pressure of the clay (as for other clay materials studied in the test), but after grinding and re-compacting the sample, the effect of cation exchange on the swelling pressure of Friedland clay was found to be insignificant. Based on swelling pressure measurements made for this report (Appendix 12), the cation composition of Friedland clay changes already during normal swelling pressure tests to the same extent that was changed during 30 months in the ABM tests. This result implies that no additional decrease in swelling pressures is expected in the long term due to cation exchange. Another observation was that grinding of the sample

90
during the cation conversion process possibly increases the swelling pressure observed for a particular clay (this can be seen from the results plotted in Figure 6-3 for Ca-converted samples). This will be taken into account in further testing and may explain some of the scatter observed in the data compiled for different bentonites that is discussed below (see Fig. 6-5). The swelling pressure can also be predicted based on the approach presented by Karnland (2010). This approach is similar to the one presented earlier by Baumgartner and Snider (2002). In order to do the predictions, a swelling pressure database for material with known montmorillonite content is needed (example in Appendix 12). Using the data from the database, the montmorillonite content (Xmont) can be expressed as a ratio of mass of montmorillonite (mmont) and mass of solids (msolids) (Equation 6-1): Xmont = (mmont/msolids) (Eq. 6-1) According to Karnland (2010), the resulting swelling pressure is depending on Xmont and water content at full saturation (wsat) according to following equation: Ps = B x (Xmont/[wsat]
2)a. (Eq. 6-3)
Figure 6-3. Swelling pressure of Friedland clay in varying salinities (0, 10, 35 and 70 g/L). The data used in the figure are presented in Appendices 10 and 11. The scatter in the results is due to different smectite contents of the samples and differences between determination methods.

91
Parameters B and a in Equation 6-3 can be determined by plotting the measured swelling pressures for Friedland clay against the parameter Xmont/[wsat]
2 (see Figure 6-5); B is the y-value in the plot presented in Figure 6-4 and a is the inclination of the slope (in this case B is 41.78 and a is 1.79). Applying this approach using data measured in salinities of 10, 30 and 70 g/L, the predicted swelling for the backfill design is 2020 kPa for a case with maximum montmorillonite content in all components and average component dry densities and tunnel volume (see Appendix 8). The predicted maximum value is 6822 kPa considering maximum montmorillonite contents in all components, assuming maximum component dry densities and theoretical tunnel volume with 0 mm excavation tolerance). Based on swelling pressure measurements at a density state close to the maximum possible dry density (1924 kg/m3), the prediction is relatively close to the measured one (6330 kPa in dry density of 1910 kg/m3, see Appendix 11). The minimum predicted swelling pressure is 910 kPa considering minimum component dry densities, montmorillonite content of 28 % and maximum tunnel volume. Compared to swelling pressure measurements, the predicted value is higher compared to the measured value (Appendix 10). This seems to be in accordance with the conclusion in Karnland (2010) that the predictions fit best in higher density states. The uncertainties concerning these predictions are due to the limited amount of experimental data used in defining the parameters (a total of 19 determinations), difference between the determination methods used for assessing the swelling pressure and the mineralogy of the samples. To summarise, Friedland clay dominant backfill at full saturation will have a swelling pressure ranging from few hundred kPa up to 6-7 MPa. However, after homogenisation of the backfill the range is expected to be from 1 to 3 MPa. Also considering the estimated EMDD between 1000 kg/m3 and 1300 kg/m3 after homogenisation, these values are fairly well in accordance with the generic EMDD versus swelling pressure data presented in Figure 6-5.
Figure 6-4. The swelling pressure of Friedland clay plotted against Xmont/wsat2. The data
used in the plot are presented in Appendix 12.
y = 41,777x1,7949
R² = 0,9592
10
100
1000
10000
1,000 10,000 100,000
Swelling pressure (kPa)
Xmont/wsat2

92
Figure 6-5. Generic swelling pressure behaviour predicted using EMDD parameter showing effects of clay type and groundwater salinity (Dixon et al. 2011a).
Self-sealing, homogenisation and swelling capacity in volume A set of self-sealing tests have been performed on Friedland clay by Sandén et al. (2008) and by Schatz & Martikainen (2012). In these tests a hole of 5 mm is drilled in a pre-saturated sample. The hydraulic conductivity of the sample is measured both before and after drilling of the hole. This test is an indicative test that shows if the material has self-sealing ability within this specific test conditions and duration (full saturation is not reached within this test period). Based on the tests results by Schatz & Martikainen (2012), it is confirmed that Friedland clay has self-sealing ability. The process itself will be studied further in a more consistent manner to be able to combine the results with numerical modelling of the process and to be able to up-scale the results to full-scale. Simple homogenisation tests have been performed by Sandén et al. (2008) and Schatz & Martikainen (2012). In these tests a certain proportion of block material and pellet materials was placed in a test cylinder. The sample was allowed to saturate for a certain period of time (~60 days) with saline water (3.5%) and the dry density and water content distribution in the sample was measured after the tests. Due to the limited duration of the tests, it can be stated that the test describes only the very early evolution of the homogenisation process. However, based on the results for Friedland clay (Figure 6-6), the block material was able to compress the pellet material from 1100 kg/m3 to >1200 kg/m3 during the relatively short duration of the test. It can be stated that this test method is suitable for comparing different materials and to study the very early

93
evolution of the homogenisation process. However, the homogenisation process of backfill (also after a piping/erosion scenario, see Features, Events and Processes report) will be further studied, focusing more consistently on the homogenisation process itself and the results will be used in numerical modelling of the process. A set of volume change tests has been performed for Friedland clay and a mixture of ballast and bentonite 60:40 (Schatz & Martikainen 2012). In these tests a dry sample was placed in an oedoemeter cell under a small load of ~200 kPa and the volume increase of the material was recorded during the saturation of the sample with a piston. The blocks should swell up to 10 % (in average 6 % in average tunnel volume) in order to be able to compress the pellets so that their dry density increases from 900 kg/m3 to 1200 kg/m3. In a test reported in Schatz & Martikainen (2012), the volume swelling of Friedland clay blocks with initial dry density of 1750 kg/m3 is already sufficient to fulfill design specification presented in Table 2-3 (see Figure 6-7) with a large safety margin.
Figure 6-6. Dry density distribution of a Friedland clay block – Cebogel pellet system after saturation period of ~60 days. The dotted lines show the initial dry densities used in this tests. The tested block filling degrees (i.e. block volume versus the total volume) were 60 and 70 % (Schatz & Martikainen 2012).

94
Figure 6-7. Self-sealing result for a Friedland clay sample with an initial dry density of 1750 kg/m3 in a salinity of 7 % (Schatz & Martikainen 2012).
6.4 Chemical properties Concerning chemical properties, the composition of the backfill shall not jeopardise the performance of the buffer, canister or bedrock. This performance target is mainly linked to canister corrosion. It is further defined in design requirements and design specifications that the content of organics shall be low (<1 %) in order to limit microbial activity in the near field of buffer and canister. In addition, the total sulphur content shall be less than 1 wt-% with sulphides making, at most, half of this amount (see Chapter 2). Based on the mineralogical and chemical data presented in Section 3.2, it can be stated that the current backfill design fulfills the requirements set for chemical properties. 6.5 Mechanical properties The backfill shall keep the buffer in place, contribute to keeping the canister in place and shall contribute to the mechanical stability of the deposition tunnels (see Table 2-1). Based on modelling presented by Leoni (2012) and an analysis presented in SR-site (SKB 2011), the requirement of keeping the buffer in place is fulfilled. However, there are some uncertainties concerning the used material parameters and limitations of the tools used for modelling. This issue is further discussed in the Performance Assessment report. However, from a practical point of view, the risk of buffer heave could be minimised by decreasing the excavation tolerances at the floor section by optimising the excavation methods or by finishing the floor with wire-sawing/grinding. In this way, the thickness of the foundation layer could be minimised. This would be preferable, since
Volume change tests
0123456789
10111213141516171819202122232425262728
0 20 40 60 80 100 120 140 160
Time (days)
Volu
me c
hange (%
)
Bentonite ballast mix 40/60 (16 mm) 1.750 g/cm3
Bentonite ballast mix 40/60 (8 mm) 1.750 g/cm3
Bentonite ballast mix 40/60 (8 mm) 1.850 g/cm3
Friedland clay

95
based on Leoni (2012) the largest deformations are expected in the foundation layer that is in situ compacted and has thus a low rigidity compared to backfill blocks. It is also stated in the performance targets (Table 2-1) that the backfill is to contribute to the mechanical stability of the deposition tunnels. This effect comes from the swelling of the materials at the rock-backfill contact providing confinement to the surrounding rock. Although the backfill materials are not initially in a saturated state, water is added to the pellet fill at installation, so that its initial degree of saturation is on average 43%. This means that the material will have a small swelling pressure to begin with. In addition, the material is installed so that it will initially have a contact with the rock as required in the design requirements (Table 2-1). 6.6 Uncertainties The uncertainties linked to the performance of the backfill are linked to: - Effect of cation exchange on the hydraulic and swelling properties in the long term,
although the current experimental data imply that the effect is not significant. - Homogenisation process. Experimental tests indicate that homogenisation takes
place in the backfill, but supporting numerical modelling and large scale tests to obtain data are being planned.
- Effect of material parameters on the heave of buffer into the deposition tunnel. Field tests are ongoing to gain data for the current foundation layer material.

96

97
7 REFERENCE DESIGN FOR THE DEPOSITION TUNNEL PLUG 7.1 General The deposition tunnel plug finalises the backfill of a deposition tunnel. Its role is to hydraulically isolate the deposition tunnel and keep the backfill in place until the central tunnels are closed (Table 2-2, see also Design Basis report). The reference design of the deposition tunnel plug is based on the plug solution developed by SKB (SKB 2010). Plug design development is continuing and both the structure and materials will be developed jointly by Posiva and SKB. 7.2 Layout of the deposition tunnel plug, its components and their
functions The deposition tunnel plug is a multi-component structure. Its role is to: - Seal the deposition tunnel and limit the flow of water from the deposition tunnel
until the adjacent central tunnel is closed and - Keep the deposition tunnel backfill in place and prevent it from swelling and
expanding out from the deposition tunnel during the operational time of the repository.
The service life of the deposition tunnel plug covers the time the adjacent central tunnel is open, i.e. at maximum 100 years (see Table 2-3). The illustration of the deposition tunnel plug is presented in Figure 7-1. The reference design for a deposition tunnel plug consists of the components presented in Table 7-1. A more detailed description of the components is given in SKB report “Design, production and initial state of the backfill and plug in deposition tunnels” (SKB 2010). 7.3 Materials of the deposition tunnel plug Materials to be used for each component are presented in Table 7-1. The design for the concrete components in the plug is steered by the requirement of using low pH cementitious materials in deep bedrock. The other requirements taken into account in the selection of materials for the plug is the hydraulic isolation capacity that shall be preserved at least as long as the central tunnels are open, requirements concerning the chemical composition of the materials and mechanical loads from the backfill and the groundwater pressure. 7.3.1 Concrete dome, beams and shotcrete The concrete dome is about 1500 mm thick at the thinnest point. Concrete beams will be about 300 mm thick. In order to limit harmful substances, any leachates from the plug shall have a low pH (Section 2.1.2). This requirement concerns the concrete and shotcrete components of the deposition tunnel plug.

98
Figure 7-1. Illustration of the reference design of the deposition tunnel plug for OL1-3 size tunnel. Top view (up), side view (middle) and front view (down). The concrete dome is marked with dotted texture.
Swelling pressure
Concrete beams Filter layer Watertight seal
Swelling pressure
Concrete beams
Filter layer Watertight seal
4400
Deposition tunnel Central tunnel
Central tunnel Deposition tunnel

99
The reference recipe for the low pH concrete is given in Table 7-2. The recipe is developed and tested by Vogt et al. (2009), and changes may be done for Posiva’s purpose in later design stages. For the presented recipe the water to cement ratio is 1.375 (kg/kg), water to binder ratio is 0.825 (kg/kg) and water to dry material ratio is 0.29 (kg/kg). Currently the filler material used for concrete is limestone, but the use of other filler materials (quartz or granite) may be considered in the later design stages. The specific grain size distributions for the filler materials will be identified at a later date when more details are known about the exact concrete recipe. Also the type of the silica fume will be defined later. Table 7-1. Components of the deposition tunnel end plug, their materials and roles. A more detailed description of the components is described in SKB (2010). Component Material Function Concrete dome Low pH concrete reinforced
with steel Tubes/pipes for ventilation, cooling, heating, airbleed, casting etc.
Resist deformation, keep the backfill and other plug components in place and prevent backfill from expanding out from the deposition tunnel.
Watertight seal Bentonite blocks and pellets Seal the possible leakage through concrete (cracks) or interface of concrete and rock, and control the water pressure gradient.
Filter Sand or gravel Collect the water from backfill and drain it to the drainage pipes until concrete plug is cured. Can also serve as artificial watering of watertight seal.
Concrete beams (elements) and in situ cast basement under the beams
Reinforced low pH concrete Facilitate the construction works (keep the backfill, filter and bentonite blocks in place).
Drainage pipes Steel or titanium One of the functions of the drainage pipes is to drain out the water collected by filter until the concrete plug has cured. In general, the drainage pipes will make it possible to control the filter pressure from outside the plug. Depending on the natural ground water inflow to the deposition tunnel, artificial wetting via the filter can be helpful to reach a better/faster sealing function of the plug.
Grouting pipes To be determined later Enable the grouting of the interface of the concrete plug and rock.

100
7.3.2 Watertight seal The watertight seal is a 750 mm thick layer behind the concrete dome. The material for the watertight seal is MX-80 type, good quality bentonite blocks and bentonite pellets with a montmorillonite content of 75-90 % (Kumpulainen & Kiviranta 2010). The dry density of this layer shall be ~1400 kg/m3 in order to provide sufficient sealing ability, but so that the swelling pressure is limited to 3 MPa. More detailed description of the material is presented in the Buffer production line report. 7.3.3 Filter The filter layer is a 750 mm thick layer behind the watertight seal. The filter layer consists of sand and/or gravel with an installed density of at least 1900 kg/m3. The filter materials (grain size distribution) must fulfill predetermined filter criteria. In general, the particle size of the filter shall be small enough for preventing particles from being carried away with water from the adjacent soil (in this case from the backfill) (Craig 2004). In addition, the permeability shall be high enough to ensure the free drainage of the water entering the filter. The grain size of the filter will be determined based on the grain size distribution of the material to be filtered. The filter material can either be uniform grading or the filter can consist of two or more layers with different particle gradations (Craig 2004). 7.3.4 Other components The steel quality for the reinforcement of concrete will be selected according to norms and standards and prevailing groundwater chemical conditions. The dimensioning of the reinforcement will be according to the reinforcement drawing, which will be designed in a later stage of development. Tubes and pipes (see Table 7-1) will be steel (or titanium) according to norms and standards and prevailing groundwater chemical conditions. The dimensioning of these components will be according to the drawing, which will be designed in a later stage of development. Table 7-2. Reference recipe for low pH concrete components (kg/m3) (Vogt et al. 2009, SKB 2010). Design parameter Material Composition (kg/m3) Binder Cement CEM I 42.5 MH/LA/SR 120
Densified Silica fume 80 Water Tap water 165 Filler Limestone filler L25 369
Sand 0-8 mm 1037 Gravel 8-16 mm 558
Admixture Superplasticiser Glenium 51 6.38

101
8 PRODUCTION OF THE DEPOSITION TUNNEL PLUG 8.1 Overview on the production line for the deposition tunnel plug The production line for the deposition tunnel plug consists of several stages: - Ordering, delivery and storage of the raw material, - Manufacturing, preparation and storage of the components, - Installation of the components except the concrete dome and - Casting of the concrete dome.
8.2 Ordering, delivery and storage of the plug materials Raw materials and components needed for a deposition tunnel plug and their production are presented in Table 8-1. For the plug components that will be manufactured on site the raw materials are to be ordered and delivered in big bags to dry and warm storage facility at the repository site. The instructions for material delivery and storage are followed in order to maintain the desired properties of plug components. Dry storage is necessary for silica fume and for cement to avoid its hydration and premature setting. Table 8-1. Raw materials and production of components.
Plug component Raw material / ingredients
Manufacturing of the structure/component at site
Purchase as prefabricated component
Concrete in plug CementSilica fume Water Limestone filler Sand and gravel Admixture
X
Concrete beams, elements and in situ cast basement
CementSilica fume Water Limestone filler Sand and gravel Admixture
X
Watertight seal MX-80 type bentonite blocks and pellets
X
Filter layer Sand / gravel or aggregate
X
Steel components (e.g. reinforcement and draining pipes)
Steel (reinforcement), steel/titanium (draining pipes)
X

102
8.3 Manufacturing the components of the deposition tunnel plug Concrete in concrete dome Concrete is mixed at site in the vicinity of the deposition tunnel where the plug is to be installed. Mixing is to be done exactly as specified in the mixing order and times expressed in the detailed design documents. The storage for cement and silica fume prior to the mixing needs to be dry. The concrete mixing plant will be designed at a later phase. In general, the mixing plant will be an automatized system consisting of material weighing, handling and storage systems, control systems, batching unit, aggregate conveying unit, water supplying and additive agent supplying system and a rotary mixing unit. After mixing, the concrete is transferred to a concrete truck with a pneumatic system. Watertight seal According to the current reference, clay blocks are pressed at the site as well as the bentonite pellets. The methods for preparation are the same as for the backfill blocks and pellets in the deposition tunnel (see Sections 4.6 and 4.7). The storage for blocks and pellets will be an indoor storage with a controlled and stable temperature (~10 °C) and relative humidity (RH%). The suitable RH% for backfill blocks will be determined later, but it can be estimated to be quite close to the value determined for buffer blocks (RH % ~65 %). Filter layer Filter layers associated with plugs consist of sand/gravel or aggregate. The source material for aggregate component is the excavated rock from the tunnels which is stored at the repository site and is later crushed,washed and sieved to achieve the required grain size distribution. Sand/gravel may be acquired elsewhere and prepared to desired grain size distribution. In order to protect from mixing of the backfill and sealing layer, the filter materials (grain size distribution) must fulfill the filter criteria. Other components Steel/titanium components for reinforcements and pipes are commercial components not manufactured at the site. Concrete beams are manufactured at the site. In addition there will be other components used temporarily e.g. moulds for making the concrete beams and frontside formwork for casting the concrete. Their composition will be defined in later planning phase. 8.4 Installation of the deposition tunnel plug Based on the Underground Openings Production Line report, the slot for the concrete dome is produced by wire-sawing method. The selection of the dome location (and the slot) is based on detailed geological mapping of the mouth of the deposition tunnel. The first concrete beam layer is installed at the same time as the last backfill blocks and pellets are installed. A temporary support may be needed in case the concrete beams are

103
not bound together by mortar. Before the installation of the uppermost layers of concrete beams, the empty spaces between the deposition tunnel backfill, the concrete beams and rock should be filled with bentonite pellets. The installation of the pellets can be done also via pipes through the concrete beams. The second concrete beam layer is installed simultaneously with the filter layer. The sand/gravel or aggregate of the filter layer is compacted as it is installed. A temporary support may be needed in case the concrete beams are not bound by mortar or shotcrete. The drainage pipes are installed through the second concrete beam layer when it is installed. The installation of the filter material in the uppermost part of the layer is done via pipes through the concrete beams. The third concrete beam layer is installed simultaneously as the clay blocks and the pellets of the watertight seal are set up. A temporary support may be needed in case the concrete beams are not bound by mortar or shotcrete. The installation of the pellets in the uppermost part of the layer could be done via pipes through the concrete beams. The third concrete beam layer is the rear formwork for casting the concrete plug. The reinforcement, tubes, pipes and other instrumentation is installed and then the front side formwork is constructed, and low pH concrete is cast into the formwork. As the required strength is obtained, the front formwork is dismantled and the drainage pipes are plugged by grouting. 8.5 Principles of quality assurance for deposition tunnel plug
production This section describes only the principles of the quality control for the deposition tunnel plug production and the quality control measures will be determined later in more detailed level. In general, all material suppliers have to be accepted by Posiva with regard to the quality assurance system. Material is inspected as the transportation to the site is done and only materials that fulfill the set criteria are accepted. Concerning the raw materials used for concrete components, the material inspections shall follow the prevailing norms and standards, and inspections shall include, for example, spot checks of the quality of the dry materials (e.g. chemical and mineralogical studies, grain size distribution). The conditions set for storage of raw materials and prefabricated components (e.g. relative humidity (RH%) and temperature) have to be carefully followed. In case a concrete component is manufactured elsewhere, it will be ordered and delivered to the storage at the site. The manufactured components shall also be inspected when delivered to the site. The inspection shall include for example spot checks of the dimensions, weight, density and strength of the manufactured component. In addition, the conditions set for storage (e.g. relative humidity (RH%) and temperature) by the manufacturer and Posiva have to be carefully followed. Posiva follows its material suppliers according to normal audit procedures.

104
The quality of the clay components is to be inspected in the same manner as for deposition tunnel backfill, see Sections 4.6.4 and 4.7.4. The material for filter layer is inspected for its water content, grain size distribution and cleanliness from contaminants. Both the grain size distribution and water content shall be within the limits specified optimal for the material performance as a filer and also concerning its installation technique. After installation, the density of the filter layer is inspected with similar methods that are used for checking the density of the foundation layer (see section 4.11.2). The density shall be within the density limits specified for the material. All materials are delivered down to the tunnel when they are needed for the construction of the deposition tunnel plug. Material transportation shall be designed so that required conditions (e.g. relative humidity (RH%) and temperature) are prevailed. In addition, temporary storage with required conditions shall be available. In order to inspect the quality of the concrete mix and concrete components during installation, following measures are to be taken: - The amounts of materials used in construction will be measured and recorded. - Systematic checks of the materials delivered to the construction site will be done.
They include tests on raw material quality, inspection of packaging and its markings.
- Test castings of the concrete and measurement of its properties according to the prevailing norms and standards will be done.
- Monitoring of the temperature and other properties during the casting of concrete will be done.
- Inspections on the uniformity of the cast structures and free surfaces will be performed with methods specified in the prevailing norms and standards.
During installation of filter and sealing materials, the amount of masses placed in the filter and sealing layers is recorded as well as the density of the emplaced materials with a non-destructive method and spot wisely by sampling. Follow up of the plug during the operation of the deep repository includes measurement of the leakage water through and pass the plug and visual observation of the concrete surface (fissures). The concrete dome is repaired in cases where detrimental fissuring has occurred. The repairing will be performed with material and methods specified case by case.

105
9 INITIAL STATE OF THE DEPOSITION TUNNEL PLUG The initial state of the deposition tunnel plug is the state when the outermost component of the plug has been installed and the concrete has cured to its design strength. The concrete components (concrete plug and beams) in the deposition tunnel plug are made of low pH concrete, such as presented in Table 7-2. For the presented recipe, the water to cement ratio is 1.375 (kg/kg), water to binder ratio is 0.825 (kg/kg) and water to dry material ratio is 0.29 (kg/kg). The calculated hydraulic conductivity of the hardened concrete is 3.9 x 10⁻¹⁴ m/s (Vogt et al. 2009). The bentonite blocks and pellets in the watertight seal are made of MX-80 type bentonite with smectite content of 75-90 %. The size of one block is 330 x 550 x 470 mm (-1 mm/+2 mm). The estimated dry density for the blocks will be ~1400 kg/m3 and the dry density of pellets varies between 900-1 100 kg/m3 after installation. The sand / gravel or aggregate in the filter layer consists of typical rock types and minerals in the Olkiluoto area (Posiva 2009). The material and its target density and installation methods will be defined later design phase.

106

107
10 CONFORMITY OF THE DEPOSITION TUNNEL PLUG TO THE DESIGN BASIS
This Chapter discusses the conformity of the plug to the design basis – i.e each design requirement (Tables 2-2 and 2-3) is commented on from the design solution point of view. The calculated hydraulic conductivity of the cast concrete dome is extremely low, 4 × 10-14 m/s. The interface between the concrete and rock will be sealed by grouting. The watertight seal behind the concrete dome is intended to swell and work in general as a sealing structure and to seal possible fissures in the concrete and in the interface between rock and concrete. The service life of the deposition tunnel plug is 100 years, which is in line with conventional service lives of concrete structures. The amount of sulphur and sulphide are minimised by selecting Portland Cement (PC) instead of blast furnace slag cement. As well, the amount of organics is minimised by the use of steel/titanium instead of plastics in tubes, pipes, grouting pipes etc. Low pH is reached with high silica content in the concrete. Rock materials have similar mineralogical composition with the bedrock in Olkiluoto area. The plug can be constructed so that it can carry the expected loads and durability of 100 years can be reached. This is doable by using high strength concrete and/or having a structure thick enough to survive for this period of time. The shape, thickness and concrete recipe will be optimised in later design stages. The evolution and behaviour of the deposition tunnel plug has been addressed in the Performance Assessment report. Taking into account the repository conditions and performance requirements, the concrete mix is appropriate from its chemistry and expected evolution point of view. Interaction between bentonite and leachates from concrete may in over the long-term effect the performance of the bentonite in the sealing layer, but not within the first 100 years. Concerning the issue that cement will eventually be leached away from the concrete dome and the other concrete structures, the long term filling ability is gained in the current design by using long-term durable material (insoluble sand/gravel) as filler material in the concrete mix. Therefore it can be stated that the plug will maintain a backfilling function even after its hydraulic isolation capacity has been lost. In general, it can be stated that the plug is able to fulfil the requirements set for its performance. However, the plug design is still at a conceptual level and further studies, tests and demonstrations will help to develop the plug design and verify its performance in ONKALO conditions.

108

109
11 SUMMARY AND CONCLUSIONS The purpose of the backfill is to keep the buffer in place, maintain favourable and predictable conditions for the buffer and the canister, and also favourable rock mechanical, hydrological and geochemical conditions in the near-field and to limit and retard the transport of radionuclides if the canister starts leaking. In practice this means that the backfill shall consist of material with swelling ability and good long-term stability in the expected repository conditions. The deposition tunnel plug is made of concrete and it has an operational lifetime requirement that extends until the central tunnel is backfilled. The main functions of the plug are to keep the backfill in place and to isolate the deposition tunnels hydraulically from the central tunnels while the central tunnels are still open. The current backfill design consists of three main components: backfill blocks, foundation layer and pellets filling the remaining space between the blocks and the rock. The main backfill material is Friedland clay with a montmorillonite content between 30-38%. The foundation layer and the pellet fill consist of bentonite with an average montmorillonite content of 80%. The backfill blocks are produced with the uniaxial compaction method and pellets with the extrusion method. The foundation layer is compacted in situ. The production chain starts with the excavation of materials from the clay outcrops and ends with the installation and inspection of the installed components. There are many steps in the chain and quality control will be a part of every step. A big challenge comes from handling the large quantities of material so that the quality is not compromised in any step of the process. In future years, before the actual production can begin, both the quality assurance system and the whole production process need further development and testing. In addition, alternative backfill materials shall be studied with the aim to have a variety of accepted products for backfill production in order to ensure reliability of delivery for the whole operation life-time. The description of the initial state includes a range of densities and other properties both for backfill components and backfill as a whole. Based on the initial state conditions provided by the current design, it can be stated that the backfill fulfills the performance requirements set for it. However, some uncertainties still remain, mainly concerning the long-term evolution of the backfill, for example homogenisation of the system and interaction with the buffer. In order to minimise the risk of buffer heave, the thickness of the foundation layer should preferably be smaller than in the current design. However, this calls for changes in the tunnel excavation design and method. The current tunnel plug design consists of a concrete dome, a watertight seal and a filter layer. The combination structure ensures that the plug has sufficient hydraulic isolation capacity as well as structural strength. It can be stated that the plug fulfills its performance targets. However, the plug design is still at a conceptual level and tests will be done to verify its hydraulic isolation capacity. In addition, the recipe of the concrete mix is under development and may change in the future.

110

111
REFERENCES Production line reports: Canister Production Line 2012 - Design, production and initial state of the canister. Posiva 2012-16 (ISBN 978-951-652-197-1). Buffer Production Line 2012 - Design, production and initial state of the buffer. Posiva 2012-17 (ISBN 978-951-652-198-8). Backfill Production Line 2012 - Design, production and initial state of the deposition tunnel backfill and plug. Posiva 2012-18 (ISBN 978-951-652-199-5). Closure Production Line 2012 - Design, production and initial state of underground disposal facility closure. Posiva 2012-19 (ISBN 978-951-652-200-8). Underground Openings Production Line 2012 - Design, production and initial state of the underground openings. Posiva 2012-22 (ISBN 978-951-652-203-9). Other references in alphabetical order: Andersson, L. & Sanden, T., 2012. Optimization of backfill pellet properties. Svensk Kärnbränslehantering AB, Stockholm, Sweden. SKB R-12-X. Publication pending. Autio, J., Hassan, Md. M., Pintado, X., Keto, P. & Karttunen, P. 2012. Backfill Design 2012. Posiva 2012-15.. Ahonen, L., Kivikoski, H., Korkeakoski, P., Laaksonen, R. & Tiljander, M. 2008. Quality assurance of the bentonite material. Posiva Oy, Olkiluoto, Finland. Working Report 2008-33. Alaska Pellet Mill. 2011. Plat plate pellet mills, ring die pellet mills, hammer mills & chippers and commercial pellet plants. Product brochure. Alaska Pellet Mill, Apted Technologies Inc, Anchorage, USA. Available: http://www.alaskapelletmill.com, referred 16.9.2011. Baumgartner, P. & Snider, G.R. 2002. Seal Evaluation and Assessment Study (SEAS): Light backfill placement trials. AECL TR-793, Atomic Energy of Canada Limited. Carlson, L. 2004. Bentonite mineralogy. Part 1: methods of investigation – a literature review. Part 2: mineralogicalresearch of selected bentonites. Posiva Oy, Olkiluoto, Finland. Working Report 2004-02. Christidis, G. & Dunham, A. 1993. Compositional variations in smectites: Part I. Alteration of intermediate volcanic rocks. A case study from Milos Island, Greece. Clay Minerals 28, 255-273.
112
Christidis, G., Scott, P. & Marcopoulos, T. 1995. Origin of the bentonite deposits of Eastern Milos, Aegea, Greece: Geological, mineralogical and geochemical evidence. Clays and Clay Minerals 43, 63-77. Craig, R. F. 2004. Soil Mechanics. 7th edition, reprinted in 2004. Spon Press, New York. ISBN 0-415-32702-2. Pages: 62-62 (Filter design). Dixon, D., Anttila, S., Viitanen, M. & Keto, P. 2008a. Tests to determine water uptake behavior of tunnel backfill (Backlo Tests at Äspö). Svensk Kärnbränslehantering AB, Stockholm, Sweden. SKB R-08-134. Dixon, D., Lundin, C., Örtendahl, E., Hedin, M. & Ramqvist, G. 2008b. Deep repository – Engineered Barrier System: Half-scale tests to examine water uptake by bentonite pellets in a block-pellet backfill system. Svensk Kärnbränslehantering AB, Stockholm, Sweden. SKB R-08-132. Dixon, D., Sandén, T., Jonsson, E. & Hansen, J. 2011a. Backfill of deposition tunnels: Use of bentonite pellets. Svensk Kärnbränslehantering AB, Stockholm, Sweden. P-11-44. Dixon, D., Jonsson, E., Hansen, J. Hedin, M., & Ramqvist, G. 2011b. Effect of Localized Water Uptake on Backfill Hydration and Water Movement in a Backfilled Tunnel: Half-Scale Tests at Äspö Bentonite Laboratory. Svensk Kärnbränslehantering AB, Stockholm, Sweden. SKB R-11-27. Fekete, S., Dieberichs, M. & Lato, M. 2010. Geotechnical and operational application for 3-dimensional laser scanning in drill and blast tunnels. Tunneling and Underground Space Technology 25, 614-628. FIM Friedland Industrial Minerals GmbH. 2011a. FIMONIT SEAL Bentonit-Zuschlagsstoff für gemischt körnige mineralische Dichtungen. FIM Friedland Industrial Minerals GmbH, Berlin, German. Available http://www.friemin.de/download/090525_fimonit_seal_d.pdf. Referred 10.10.2011. Appendix 6. FIM Friedland Industrial Minerals GmbH. 2011b. frieBOfast DG 8-16 für den Brunnenbau Dichtungsgranulat aus Friedland Bentonit. FIM Friedland Industrial Minerals GmbH, Werk Friedland, German. Available: http://www.friemin.de/download/friebofast_datenblatt.pdf. Referred 10.10.2011. Appendix 5. Hansen, J. Korkiala-Tanttu, L., Keski-Kuha, E. & Keto, P. 2010. Deposition tunnel backfill design for a KBS-3V repository. Posiva Oy, Olkiluoto, Finland. Working Report 2009-129. Hartley, L., Hoek, J., Swan, D. & Roberts, D. 2010. Hydrogeological Discrete Fracture Network Modelling of Groundwater Flow Under Open Repository Conditions. Posiva Oy, Eurajoki, Finland. Working Report 2010-51.
113
Hartley, L., Appleyard, P., Baxter, S., Hoek, J., Roberts, D., Swan D., Follin, S. 2012a, Development of a hydrogeological discrete fracture network model for the Olkiluoto Site: Descriptive model 2011. Eurajoki, Finland: Posiva Oy. Working Report 2012-32. Henning, K.-H. & Kasbohm, J. 1998. Mineralbestand und Genese feinkörniger quartärer und präquartärer Sedimente in Nordostdeutschland unter besonderer Berücksichtigung des „Friedländer Tones“. Jahrestagung der DTTG, 3-5 September 1998, Greifswald. Berichte der DTTG e.V. - Band 6, 147-167. Hämäläinen, T. 2011. Laatikkoleikki maailman merillä (in Finnish). Tekniikan Maailma 18/2011, pages 120-124. Ikonen, K. 2009. Thermal Dimensioning of Spent Fuel Repository. Posiva Oy, Olkiluoto, Finland. Working Report 2009-69. Johannesson, L-E. 2008. Backfilling and closure of the deep repository. Phase III – pilot tests to verify engineering feasibility. Geotechnical investigations made on unsaturated backfill materials. Svensk Kärnbränslehantering AB, Stockholm, Sweden. SKB R-08-131. Johannesson, L-E. & Nilsson, U. 2006. Deep repository – engineered barrier systems. Geotechnical behavior of candidate backfill materials. Laboratory tests and calculations for determining performance of the backfill. Svensk Kärnbränslehanterin AB, Stockholm, Sweden. SKB R-06-73. Juvankoski, M. 2010. Description of Basic Design for Buffer. Posiva Oy, Olkiluoto, Finland. Working Report 2009-131. Karnland, O. 2010. Chemical and mineralogical characterization of the bentonite buffer for teh acceptance control procedure in a KBS-3 repository. Svensk Kärnbränslehantering AB, Stockholm, Sweden. SKB TR-10-60. Karnland, O., Olsson, S. & Nilsson, U. 2006. Mineralogy and sealing properties of various bentonites and smectite-rich clay materials. Svensk Kärnbränlehantering AB, Stockholm, Sweden. SKB TR-06-30. Keski-Kuha, E., Nemlander, R. & Koho, P. 2012. BACEKO II, Flow-through, open-front and saturation tests of pre-compacted backfill blocks in a quarter-scale test tunnel. Posiva Oy, Olkiluoto, Finland. Working Report 2012-41. Keto, P., Dixon, D., Gunnarsson, D., Johnsson, E., Börgesson, L. & Hansen, J. 2009. Assessment of backfill design for KBS-3V repository. Posiva Oy, Olkiluoto, Finland. Working Report 2009-115. Keto, P. & Rönnqvist, P-E. 2007. Backfilling of deposition tunnels: Block alternative. Posiva Oy, Olkiluoto, Finland. Working Report 2006-89.

114
Kim, C-S., Man, A., Dixon, D., Holt, E. & Fritzell, A. Clay-Based Pellets for Use in Tunnel Backfill and as Gap Fill in Deep Geological Repository. Characterisation of Thermal-Mechanical Properties. NWMO Nuclear Waste Management Organization. Toronto, Canada. NWMO TR-2012-05. Kirkkomäki, T. 2009. Design and stepwise implementation of the final repository. Posiva Oy, Olkiluoto, Finland. Working Report 2009-51. Kirkkomäki, T. 2012. Design and stepwise implementation of the final repository 2012. Posiva oy, Finland. Publication pending. Kiviranta, L. & Kumpulainen, S. 2011. Quality control and characterization of bentonite materials. Posiva Oy, Olkiluoto, Finland. Working Report 2011-84. Korkiala-Tanttu, L., Keto, P., Kuula-Väisänen, P., Vuorimies, N. & Adam, D. 2007. Backfill-development of in situ compaction. Test report for field tests November 2005. Posiva Oy, Olkiluoto, Finland. Working Report 2007-75. Koskinen, V. 2011. Uniaxial backfill block compaction. Posiva Oy, Eurajoki, Finland. Working Report 2012-21. Kukkola, T. 2004. Operating description of Olkiluoto spent fuel repository. Posiva Oy, Olkiluoto, Finland. Working Report 2003-70. Kumpulainen, S. & Kiviranta, L. 2010. Mineralogical and chemical characterization of various bentonite and smectite-rich clay materials. Part A: comparison and development of mineralogical characterization methods. Part B: mineralogical and chemical characterization of clay materials. Posiva Oy, Olkiluoto, Finland. Working Report 2010-52. Kumpulainen, S. & Kiviranta L. 2011. Mineralogical, chemical and physical study of potential buffer and backfill materials from ABM test package 1. Posiva Oy, Olkiluoto, Finland. Working Report 2011-41. Laaksonen, R. 2010a. MANU – Handling of bentonite prior buffer block manufacturing. Posiva Oy, Olkiluoto, Finland. Working Report 2009-63. Laaksonen, R. 2010b. MANU – Purchase of bentonite – Process description. Posiva Oy, Olkiluoto, Finland. Working Report 2009-64. Laaksonen, R. 2010c. MANU. Isostatic compression of buffer blocks – Small scale. Posiva Oy, Olkiluoto, Finland. Working Report 2009-134. Leoni, M. 2012. 2D and 3D finite element analysis of buffer-backfill interaction. Posiva Working Report. Publication pending. Löfman, J. & Poteri, A. 2008. Groundwater Flow and Transport Simulations in Support of RNT-2008 Analysis. Posiva Oy, Olkiluoto, Finland. Working Report 2008-52.

115
Löfman, J. & Karvonen, T. 2012. Simulations of Hydrogeological Evolution at Olkiluoto. Eurajoki, Finland: Posiva Oy. Working Report 2012-35. Publication pending. Löfman, J., Mészáros, F., Keto, V., Pitkänen, P. & Ahokas, H. 2010. Modelling of Groundwater Flow and Solute Transport in Olkiluoto - Update 2008. Posiva Oy, Olkiluoto, Finland. Working Report 2009-78. McEwen, T. (ed), Aro, S., Hellä, P., Kosunen, P., Käpyaho, A., Mattila, J., Pere, T. & RSC working group, 2012. Rock Suitability Classification, RSC-2012. Eurajoki, Finland; Posiva Oy. POSIVA 2012- 24. (ISBN 978-951-652-205-3) Publication pending. Pusch, R. 1998. Backfilling with mixtures of bentonite/ballast materials or natural smectitic clay? Svensk Kärnbränlehantering AB, Stockholm, Sweden. SKB TR-98-16. Port of Rauma. 2011. Kuvia julkaistavaksi. Available: http://www.portofrauma.fi/?suomi/kuvat.html. Referred 11.10.2011. Posiva 2009a. TKS-2009 Nuclear Waste Management at Olkiluoto and Loviisa Power Plants – Review of Current Status and Future Plans for 2010-2012. Riikonen, E. 2009. Flow-through and wetting tests of pre-compacted backfill blocks in a quarter-scale test tunnel. Posiva Oy, Finland, Eurajoki. Working Report 2008-89. Roskill. 2008. The Economics of bentonite, 2008. 11th edition. Roskill Information Services Ltd. 281p. Rotek A/S. 2011. Product information, Bentonite QSE. Rotek A/S, Sdr. Felding, Denmark. Available: http://www.rotek.eu/e-catalogue/sealing-materials--filter-sand--and-drilling-fluid/sealing-materials.aspx. Referred 10.10.2011. Appendix 7. Saanio, T., Kirkkomäki, T., Sacklén, N., Autio, J., Kukkola, T. & Raiko, H. 2003. Käytetyn ydinpolttoaineen loppusijoitustilat Olkiluodossa, Esisuunnitelma, vaihe 1. Posiva Oy, Olkiluoto, Finland. Working Report 2003-74. Saanio, T., Kirkkomäki, T., Keto, P., Kukkola, T. & Raiko, H. 2007. Preliminary design of the repository, stage 2. Posiva Oy, Olkiluoto, Finland. Working Report 2006-94. Saanio, T., Ikonen, A., Keto, P. Kirkkomäki, T., Kukkola, T., Nieminen, J. Raiko, H. 2010. Outline design of the disposal facility 2009. Posiva Oy, Eurajoki, Finland. Working Report 2010-50. Saanio, T., Ikonen, A., Keto, P., Kirkkomäki, T., Kukkola, T., Nieminen, J. & Raiko, H. 2012. Design of the disposal facility 2012. (in Finnish). Posiva Oy, Eurajoki, Finland, Working Report 2012-50.

116
Safety case for the disposal of spent nuclear fuel at Olkiluoto - Design Basis 2012. Posiva 2012-03. (ISBN 978-951-652-184-1). Safety case for the disposal of spent nuclear fuel at Olkiluoto - Performance Assessment 2012. Posiva 2012-04. (ISBN 978-951-652-185-8). Sandén , T., Börgesson, L., Dueck, A., Goudrazi, R. & Lönnqvist, M. 2008. Deep repository – Engineered barrier system; Erosion and sealing processes in tunnel backfill materials investigated in laboratory. Svensk Kärnbränslehangering AB, Stockholm, Sweden. SKB R-08-153. Schatz, T. & Martikainen, J. 2012. Laboratory Tests and Analyses on Potential Olkiluoto Backfill Materials, Posiva Oy, Eurajoki, Finland. Working Report 2012-74. SFS-EN ISO 9001:2008, Quality management systems. Requirements. SKB 2010. Design, production and initial state of the backfill and plug in deposition tunnels. Svensk Kärnbränslehantering AB, Stockholm, Sweden. SKB TR-10-16. SKB. 2011. Long-term safety for the final repository for spent nuclear fuel at Forsmark. Svensk Kärnbränslehantering AB, Stockholm, Sweden. SKB TR-11-01. Slob, S. & Hack, R. 2004. 3D Terrestrial Laser Scanning as a New Field Measurement and Monitoring Technique. Engineering Geology for Infrastructure Planning in Europe Lecture Notes in Earth Sciences, 2004, Volume 104/2004, 179-189. Tanskanen, J. (ed.) 2009. Facility Description 2009 (in Finnish). Posiva Oy, Olkiluoto, Finland. Working Report 2009-123. Vogt, C., Lagerblad, B., Wallin, K., Baldy, F. & Johasson, J-E. 2009. Low pH self compacting concrete for deposition tunnel plugs. Svensk Kärnbränslehantering AB, Stockholm, Sweden. SKB R-09-07. Wimelius, H. & Pusch, R. 2008. Backfilling of KBS-3V Deposition Tunnels – Possibilities and Limitations. Svensk Kärnbränslehantering AB, Stockholm, Sweden. SKB R-08-59.

117
LIST OF APPENDICES APPENDIX 1: YVL Guidelines APPENDIX 2: Linkage between performance targets, design requirements and design
specifications APPENDIX 3: Environmental protection legislation APPENDIX 4: Inflow to deposition holes and deposition tunnels APPENDIX 5: FIM Friedland Industrial Minerals GmbH prod. information (Friedland clay) APPENDIX 6: Fimonit Seal product information (Minelco Granules) APPENDIX 7: Rotek A/S product information (Cebogel QSE) APPENDIX 8: EMDD calculations for the OL1-3 case APPENDIX 9: EMDD calculations for the LO1-2 case APPENDIX 10: Hydraulic conductivity and swelling pressure data for Friedland clay APPENDIX 11: Minimum and maximum swelling pressures of Friedland clay APPENDIX 12: Measured selling pressure values for Friedland clay / data used in Figure 6-4.

118

119
APPENDIX 1: YVL GUIDELINES Backfill specific YVL guidelines extracted from the draft version of YVL GUIDE D.5 (in Finnish). The long-term safety requirements for the disposal of spent nuclear fuel are based on following radiation dose constraints (YVL D.5, paragraph 306):
- “Disposal of nuclear waste shall be planned so that as a consequence of expected evolution scenarios 1) the annual dose to the most exposed people shall remains below the value of 0.1 mSv, 2) the average annual doses to other people shall remain insignificantly low. These constraints are applicable in an assessment period, during which the radiation exposure of humans can be assessed with sufficient reliability, and which shall extend at a minimum over several millennia (GD 736/2008)”.
They are also based on constraints for releases of radioactive substances (YVL D.5 311):
- “Disposal of nuclear waste shall be planned so that, as a consequence of expected evolution scenarios, the average quantities of radioactive substances over long time periods, released into the environment from disposed waste, shall remain below the constraints specified separately for each nuclide by the Radiation and Nuclear Safety Authority. The constraints shall be set so that: 1) at maximum, the radiation impacts arising from disposal can be equivalent to those arising from natural radioactive substances in earth’s crust, 2) on a large scale, the radiation impacts remain insignificantly low (GD 736/2008)”.
YVL D.5 also gives the following guidelines to planning of the disposal method:
- (YVL D.5 401) “Disposal shall be implemented in stages, with particular attention paid to aspects affecting long-term safety. The planning of the construction, operation and closure of a disposal facility shall take into account the reduction of the activity of nuclear waste through interim storage, the utilization of high-quality technology and scientific knowledge and the need to ensure long-term safety via investigations and monitoring. However, the implementation of the various stages of disposal must not be unnecessarily postponed (GD 736/2008)”.
- (YVL D.5 404) “The long term safety of disposal shall be based on safety functions
achieved through mutually complementary barriers so that the deficiency of and individual safety function or a predictable geological change will not jeopardize the long-term safety (GD 736/2008)”.
- (YVL D.5 408) “Performance targets for the safety functions of engineered barriers
shall be specified taking account of the activity level of waste and the half-lives of dominating radio-nuclides. The safety approach for disposal of spent fuel shall be that the safety functions provided by the engineered barriers will limit effectively the release of radioactive substances into bedrock for at least 10 000 years.”

120
- (YVL D.5 512) “The construction, operation and closure of the waste emplacement rooms and other underground opening shall aim at maintaining the rock characteristics important to long-term safety. For this purpose, particularly in case of the implementation of spent nuclear fuel disposal:
Such rock construction methods shall be used that limit the excavation
disturbances in rock around waste emplacement rooms Reinforcement and injection of host rock shall be done so that no
significant amounts of substances detrimental to the performance of the barriers enter the waste emplacement rooms
Introduction of organic and oxidizing substances to the waste emplacement rooms shall be minimized
Waste emplacement rooms shall be backfilled and closed as soon as expedient with regard to the disposal activities related monitoring activities.”
A new requirement is monitoring of the long-term performance of barriers. According to YVL D.5 (602), “the disposal facility shall have operating experience feedback program. Safety research shall also be followed continuously. On the basis of follow-up programs, possibilities for safety enhancement shall be considered and any improvements found justified shall be implemented”.
In addition, the compliance with the long-term radiation protection requirements, as well as the suitability of the disposal method and site, shall be demonstrated by means of a safety case (YVL D.5 704).

121
APPENDIX 2: LINKAGE BETWEEN PERFORMANCE TARGETS, DESIGN REQUIREMENTS AND DESIGN SPECIFICATIONS

122

123
APPENDIX 3: ENVIRONMENTAL PROTECTION LEGISLATION Name of the act, decree or directive Number/year Environmental protection act (86/2000) Environmental protection decree (169/2000) Water act (264/1961) Act on environmental impact assessment procedure (468/1994) Government decree on environmental impact assessment procedure (713/2006) Nature conservation act (1996/1096) Nature conservation decree (160/1997) Land use and building act (132/1999) Land use and building decree (895/1999) Government decree on environmental protection at rock-crushing plant, stone quarry and other quarry operations
(800/2010)
Noise abatement act (382/1987) Neighbourhood relations act (26/1920) Government decision on the noise levels guide values (993/1992) Government decree on noise emission levels from equipment for outdoor use
(621/2001)
Government decree on air quality (711/2001) Air quality directive (2008/50/EY) Governments decision on the air quality guide values and sulfur deposition target values
(480/1996)
Waste act (1072/1993) Occupational safety and health legislation Name of the act, decree or directive Number/year Occupational safety and health act (738/2002) Health protection act (763/1994) Government decree on the protection of workers against risks caused by noise
(85/2006)
Rescue act (463/2003) Government decision on the safety of machinery (765/2000) Government decision on the selection and use of personal protective equipment
(1407/1993)
Government decree on occupational safety and health requirements in workplace
(577/2003)
Mining act (503/1965) Government decision on safety of construction work (629/1994) Government decree on limiting idling of motor engined vehicles (1266/2002) Government decree on limiting exhaust and particulate emissions from internal combustion engines
(398/2005)
Act on the supervision of occupational safety and health (131/1973) Government decree on the supervision of occupational safety and health (954/1973) Health protection act (763/1994)

124
Health protection decree (1280/1994) Government decree on the safe use and inspection of work equipment (403/2008) Act on occupational safety and health enforcement and cooperation on occupational safety and health at workplaces
(44/2006)
Employment contracts act (55/2001) Working hours act (605/1996) Annual holidays act (162/2005) The decree of the ministry of social affairs and health on concentrations known to be hazardous
(557/2009)
Government decree on the preventing work-related cancer risk (716/2000) Government decree on prohibitions and restrictions on carcinogenic, mutagenic and reprotoxic substances
(610/2000)
Government decree on types of work which are particularly harmful and dangerous to young workers
(475/2006)
Nuclear energy and nuclear waste legislation Name of the act, decree or directive Number/year Government decree on safety of deposition of nuclear waste (736/2008) Government decree on the security in the use of nuclear energy (734/2008) Radiation act (592/1991) Radiation decree (1512/1991) Nuclear energy act (990/1987) Nuclear energy decree (161/1988)

125
APPENDIX 4: INFLOW TO DEPOSITION HOLES AND DEPOSITION TUNNELS
INFLOW TO DEPOSITION HOLES AND DEPOSITION TUNNELS 1 INTRODUCTION This memorandum discusses the expected groundwater inflow to the deposition holes and deposition tunnels from the fractures. intersecting the deposition holes and tunnels. The aim of this memorandum is to provide input data to be used in the development of the backfill for the deposition tunnels and its installation as well as in the performance assessment of the backfill and buffer. The aim has been to define three cases that represent from the flow conditions point of view a typical, a dry and a wet deposition tunnel. Also the spatial frequency of the flowing fractures is addressed. Posiva has developed the rock suitability criteria to select the location of the deposition holes. This criteria includes the following limitations concerning the inflow to the deposition holes and deposition tunnels (Käpyaho 2011):
Maximum local (fracture related) inflow to a deposition tunnel is 0.25 l/min at the time of backfill installation.
Maximum allowed inflow to a deposition hole is 0.1 l/min. Grouting material is not allowed in the deposition hole.
Further restrictions on the intersection of hydrogeological zones and their respect volumes apply. These criteria are set in order to ensure low groundwater flow rate in the vicinity of the repository thus contributing to the appropriate performance of the EBS in limiting the transport of radionuclides and other solutes. Rev. 1. Of the memorandum contains corrections in some of the data concerning inflow to the tunnel. The corrections have no impact on the selection of the inflow cases or the inflow values used in these cases. The changes are marked in red.

126
2 AVAILABLE INFORMATION
An extensive database of the hydraulic properties of fractures at Olkiluoto has been collected by systematic, detailed flow measurements (PFL) in the drillholes. This data set has served as a basis for the the hydrogeological modelling including a hydrogeological DFN model which has been used to assess the inflow to the excavated rooms and flow rates in the vicinity of the deposition tunnels and deposition holes under saturated conditions. 2.1 Available site data from ONKALO The most relevant site data regarding the inflow estimates to the deposition tunnels is obtained from the ONKALO tunnel. The available data includes - PFL-flow logging in the pilot holes (and drill holes) providing information on the transmissivity of the fractures and on fracture orientation and other properties when combined with geological data on fractures, - observation of flow in the probe holes, - observation of inflow to tunnel (mapping) and measurement of inflow along certain tunnel section in the excavated tunnel.
The datafrom these measuurements except the probe hole data is discussed below. 2.1.1 PFL-logging data A summary of the transmissivity distribution in the pilot holes ONK-PH10-17 and ONK-KR13 and the estimated inflow to the tunnel based on Thiem’s equation (Equation 1) is shown in Figure 1. These holes have total length of 1132 m. The pilot holes ONK-PH10-15 are located in the chainage 3459 – 4600, corresponding to appr. depth range of -325 m – -435 m ONK-PH16 and -PH17 are pilot holes for the demonstration tunnels drilled at depth of – 417 m and ONK-KR13 is a drillhole drilled from chainage 4219 and is located in appr. depth range -400 m – -420 m. These boreholes are thus in the depth range which gives applicable information also for the repository depth (420 m). Thiem’s equation gives a rough estimate of the inflow Q (m3/s) from a fracture with certain transmissivity T (m2/s) to the tunnel. Steady state radial flow with constant head h (m) has been assumed.
∆
⁄ Equation 1
In the Equation 1, r0 denotes the radius of influence assumed to be 15 m and rt is assumed to be 2.5 m (slightly higher than the radius of the circle with the same area as the deposition tunnel, 14 m2, se e.g. Saanio et al. 2010 to take into account that thefracture intersections with the tunnel are not all vertical.).
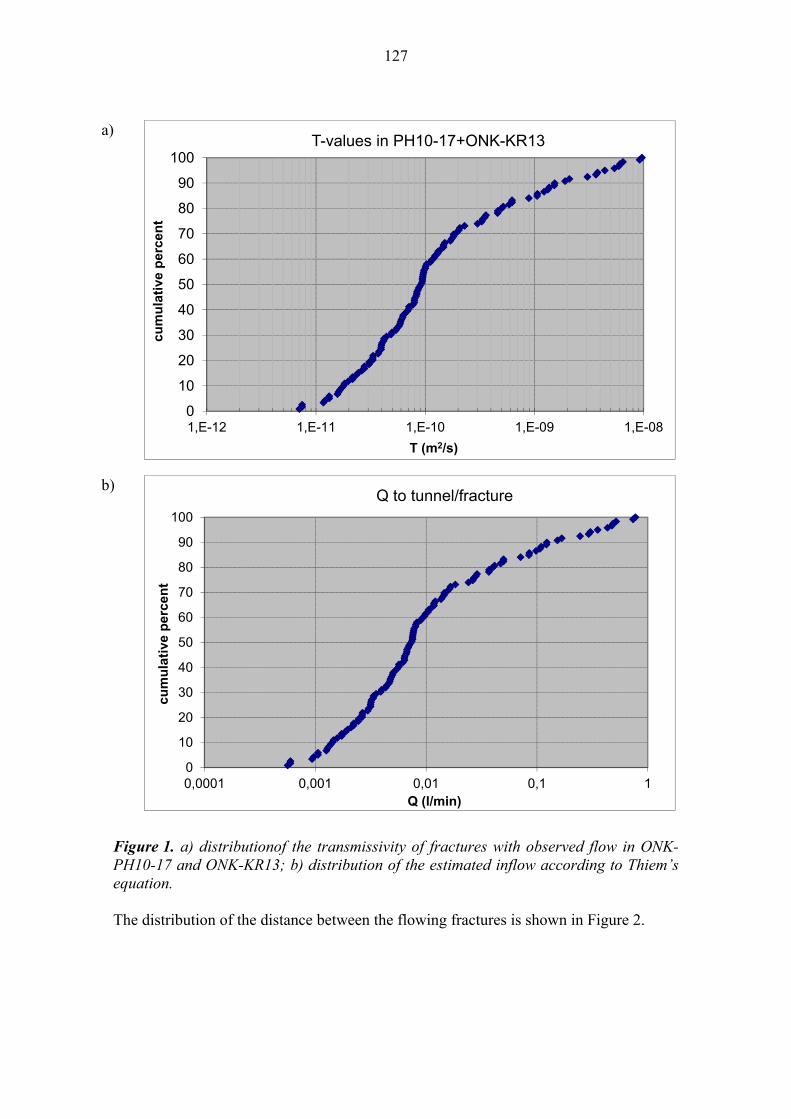
127
a)
b)
Figure 1. a) distributionof the transmissivity of fractures with observed flow in ONK-PH10-17 and ONK-KR13; b) distribution of the estimated inflow according to Thiem’s equation.
The distribution of the distance between the flowing fractures is shown in Figure 2.
0
10
20
30
40
50
60
70
80
90
100
1,E-12 1,E-11 1,E-10 1,E-09 1,E-08
cum
ula
tive
per
cen
t
T (m2/s)
T-values in PH10-17+ONK-KR13
0
10
20
30
40
50
60
70
80
90
100
0,0001 0,001 0,01 0,1 1
cum
ula
tive
per
cen
t
Q (l/min)
Q to tunnel/fracture

128
Figure 2. Distribution of the distances between flowing fractures with observed flow). The distance is measured along the pilot hole or drill hole. Data from ONK-PH10-17 and ONK-KR13.
2.1.2 Measurement and estimate of inflow to ONKALO Inflow to the ONKALO has been measured continuously since beginning of the ONKALO construction. The lastest results are reported by Lindgren 2011. Figure 3 shows the results of the inflow measurements as well as an estimate of the inflow. Grouting has been used to limit the inflow to ONKALO, especially in the tunnel in the upper part of the bedrock and at intersections of the fracture zones. The most relevant data for estimating the inflows to deposition tunnels is the data from ONKALO (chainage 3356 – 4225 m, 869 m). The total inflow in this depth range is 1.5 l/min. This tunnel section is not intersected by any site scale hydrogeological zones, although a local zone ONK-56 is met soon after chainage 4380. Grouting has been done only in three tunnel sections with the grouting holes (20-25 m) starting from chainages 3920, appr. 3980 and 4372. In the grouting from the chainage 4372 silica was used as grouting material but the grouting was not very successful. Based on the above ONKALO tunnel inflow data discussed above, the inflow estimate to a 250 m to 300 m long deposition tunnel would be approximately 0.5 l/min.
Two examples of the results of the mapping of the water leakages to ONKALO are shown in Figures 4a and 4b. As can be seen from the example figures and also other results, there are typically several leaking points along a 20 to 40 m long tunnel section. Between these sections with several leakages there are tunnel sections from few tens of meters up to over 200 m tunnel sections with sporadic, isolated leakages. This data thus suggests that the leakages are often concentrated and there are long sections with no leakages. Leakages are not continuous over the whole tunnel perimeter rather they seem to be pointwise.
0
10
20
30
40
50
60
70
80
90
100
0,01 0,1 1 10 100
cum
ula
tive
per
cen
t
distance (m)
distance (m) between flowing fractures
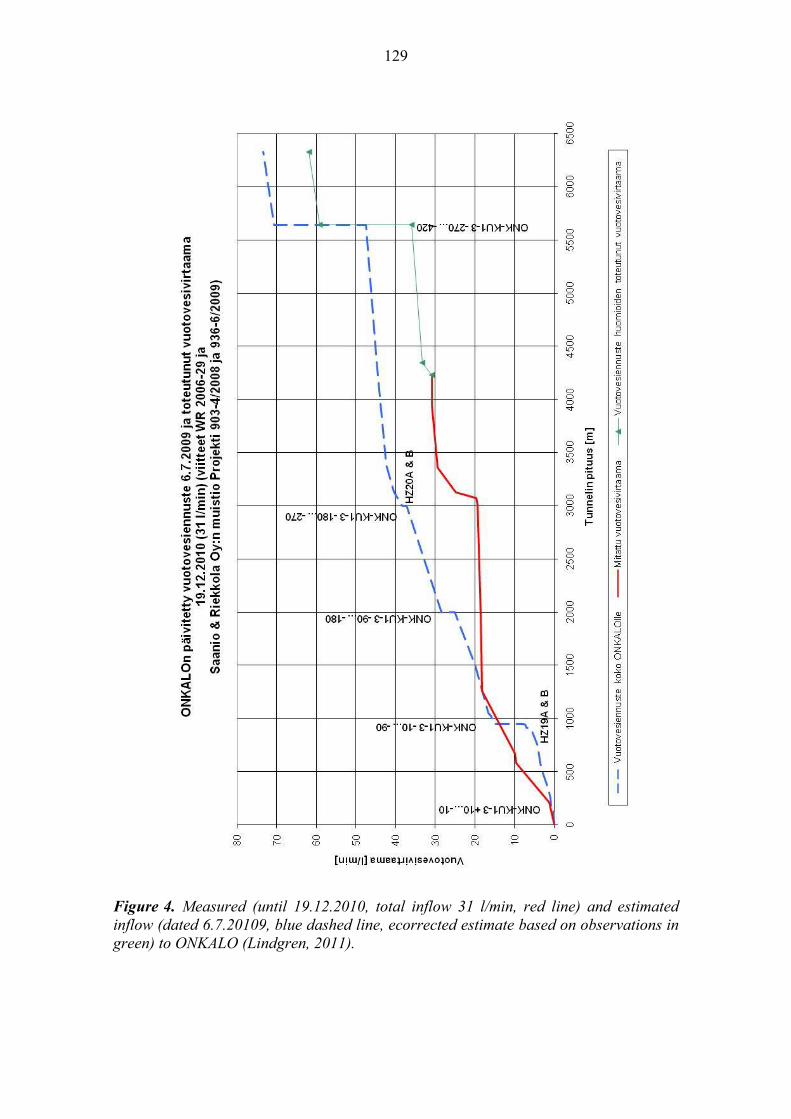
129
Figure 4. Measured (until 19.12.2010, total inflow 31 l/min, red line) and estimated inflow (dated 6.7.20109, blue dashed line, ecorrected estimate based on observations in green) to ONKALO (Lindgren, 2011).

130
a)
b)
Figure 4. Examples of the results of leakage mapping from chainage a) 4080 – 4340 and b) 4340 - 4555. The mapping was made in December 2010.Grouting was used at chainages 3920, appr. 3980 and 4372.

131
2.2 Hydrogeological DFN modelling Two versions of Olkiluoto hydrogeological DFN-model has been produced. The first one has been used to model groundwater flow under open repository conditions (Hartley & al. 2010, WR 2010-51). The results of the modelling include estimates of the inflow to deposition holes, deposition tunnels and tunnel sections. Correlation of the flow observations in the pilot holes, excavated tunnel and depostion holes was addressed. The sensitivity of the modelling results on different model variants, effect of the EDZ, criteria applied for exclusion of deposition holes as well as correlation of the flows under open conditions and in post closure conditions were studied.
Recently the hydro-DFN model has been updated based on additional data and to reflect also the changes in the geological DFN model and deterministic hydrogeological modelling (Hartley & al. 2011 in prep.). Although the new report mainly concentrates on the development of the DFN model, it also includes some flow calculations and discusses the differences to the previous hydrogeological DFN-model and some of the modelling results.
2.2.1 Inflow estimates based on Hydro DFN 2008 Distribution of the inflow to the deposition holes based on the results by Hartley & al. 2010 is shown in Figure 5 and inflow to tunnel in Figure 6. Figure 7 shows an example of the distribution of inflows to the 9 m deposition tunnel sections (corresponding to a typical distance between the canisters). Figure 8 shows the distances between the transmissive fractures. All these results are calculated without applying any exclusion criteria due to high inflows, neither grouting has been considered.
Figure 5. Complementary cumulative distribution of the inflow to the deposition holes (Figure 3-9 in Hartley et al. 2010).

132
a)
b)
Figure 6. Complementary cumulative distribution of a) the total inflow to the deposition tunnel (Figure 3-13 in Hartley et al. 2010) and b) the total inflow to each 9 m tunnel section (Figure 3-8 in Hartley et al. 2010).

133
Figure 7. Example of the inflow distribution in the deposition tunnels colored by the inflow to a 9m tunnel section (Figure 3-16 in Hartley et al. 2010).
Figure 8. cumulative distribution of distances between fractures with transmissivities above a a specified value (Figure 3-4 in Hartley et al. 2010).

134
Based on the modelling results shown in Figures 5-8 and the discussion presented in Hartley et al. 2010, the following conclusions can be made regarding the inflow to deposition hole:
Most of the deposition holes are dry, only 13 % of the deposition holes have some inflow.
The maximum inflow to deposition holes is 0.1 l/min as the deposition holes with higher inflow will be discarded according to the RSC. According to the modelling results only 3% of the deposition holes need to be discarded for this reason.
If more than one fracture intersects a deposition hole this may be a result of local clustering of small fractures around a large connected open fracture.
The presence of EDZ (assumed to have a thickness of 0.3 m below the deposition tunnel floor and to have an effective transmissivity of 10-8 m2/s) increases the number of deposition holes with inflow over the cut-off value) to 28 %. The presence of EDZ is not affecting the total inflow to the deposition hole when the inflow is higher than 0.1 l/min.
Further, the following conclusions can be made regarding the inflow to deposition tunnels:
89 % of the deposition tunnels have some inflow, 78 % of the deposition tunnels have inflow greater than 0.01 l/min, 66 % greater than 0.1 l/min and 41 % over 1 l/min and 18 % over 10 l/min (no grouting assumed).
Most of 9 m deposition tunnel sections are dry, only 18 % of the deposition holes have some inflow.
The maximum allowed inflow to tunnel from a single fracture is 0.25 l/min according to the RSC. According to the modelling results less than 5 % of the 9 m deposition tunnel sections have inflow higher than the limit (log Q > -0.5 l/min corresponding to 0.3 l/min and assuming no grouting). Such tunnel sections can be found in approximately 60 % of the tunnels (calculated based on Figure 5, for log Q > -1 L/min). In many cases the higher inflows seem to be connected to occurrence of larger conductive fractures and fractures around them.
The distances between the transmissive fractures and inflow points along the tunnel were also analysed. The results suggest a strong clustering of flow conductive fractures in case of fractures with transmissivities less than 10-8 m2/s. These clusters are generally swarms with widths estimated to be 10-20 m and the small fractures are carrying water from nearby large connected open fractures. The spacing between clusters may be large, only 1-2 clusters per tunnel are expected.
Similar to deposition holes, the presence of EDZ increases the number of tunnel sections having inflow (24 %), but its effects on the tunnel sections with inflow higher than 0.001 l/min are minor.
2.2.2 Update of the Hydrogeological DFN model 2010 Recently an update of the hydrogeological DFN model with new available data from the site has been made (Hartley et al. 2011). This report includes also an estimate of the inflows to ONKALO DEMO-tunnels. Two pilot holes (ONK-PH16 and ONK-PH17)

135
with length of 85 m has been already drilled at the site of these tunnels and the excavation of the tunnels has recently been started. The results of the inflow estimates to the deposition holes and the two tunnels are presented in Figure 9. Deposition hole BR4 is intersected by the zone ONK-56 and shows therefore higher inflow than the other deposition holes.
Figure 9. Simulated inflows to DEMO facility (10 realisations) and the analytical estimate based on the pilot hole data (Figure 9-4 in Hartley et al. 2011).
According to the results: Few percent (2-6 depending on the model) of the deposition holes could have
inflow up to 0.1 l/min. Analytical estimates give higher probability of inflows below 0.01 l/min or
lower. This reflects the fact that the analytical estimates take into account also the significant number of low transmissivity fractures observed in the pilot holes and not included in the model (Phase I, see below) used for the simulations.
The most likely total inflow to the tunnels is in the range of 0.01 l/min – 0.1 l/min, the geometric mean inflow being close to 0.1 l/min (Figure 9-5 in Hartley et al. 2011).
The inflow estimates for the DEMO facility based on simulations are considered to be consistent with the results presented in Hartley et al. 2010, based on the previous model version. Some of the differences between the updated and earlier model are discussed below.
Both model versions show a significant decrease in the intensity of the flowing fractures (PFL-fractures) and the effective hydraulic conductivity with depth. Therefore the DFN

136
model is divided to different depth zones (four in all). In the earlier model version, fixed depth zones were used, but in the new model version the depth zones are defined based on the borehole observations of the hydraulic and hydrogeochemical characteristics of the bedrock. The new model suggestes that volumes of low hydraulic conductivity may occur at shallower depth in the 2010 model than in the 2008 model. In both of the models the repository depth is located in the depth zone 4 (DZ 4).
The additional data available for the second model version brought new information mainly for the close to surface depth (above -150 m). In the new data set used for the 2010 model, the PFL intensities below –300 m are slightly lower, because more PFL measurements being associated with hydrozones for the updated hydro-structural model. Specifically, the update of the Hydro-DFN -model includes an elaborated HydroDFN model (Phase III) which has emphasised the PFL-data from the pilot holes. However this data was not used for the inflow estimates for the DEMO facilities. Compared to surface based drillholes, the detection limit for the PFL measurements is lower and thus the model can benefit of additional information of fractures with transmissivity in the range of 2·10-11 m2/s –10-9 m2/s. The latter value is an approximate lower limit of the PFL measurements in the surface based drillholes and thus in the data used for the previous model version. The PFL fracture intensity and hydraulic conductivity in 2008 and in the two version of the 2010 model (either without or with the enhaced PFL data) is shown in Figures 10 and 11. The following transport properties have been derived with the new model version (both Phase I model without emphasising the pilot hole data and Phase III model with emphasis on the pilot hole data) and the 2008 model:
- The average Darcy flow-rate per unit width, Qr, (m2/y) in the first fracture
the particle is released in adjacent to the deposition hole; - The cumulative advective travel times, tr, and flow related transport
resistance, Fr, until the particle exits the block; - The percentage of release points (i.e. deposition holes) connected to the
fracture network. The results have been derived using a generic block-scale model of 200m and the relevant hydraulic sub-domains for the repository are NHU and CHUW within Depth Zone 4. The method for releasing the particles have been different in the 2010 model (cylindrical) than in the 2008 (spherical) model. There is an increase in the number of particles (appr. 50 %) started using the spherical approach that can be attributed to the increase in volume from which the particles are released using the spherical approach (65 m3) compared to the current cylindrical approach (19 m3).

137
Figure 10. Comparison of Terzaghi corrected PFL fracture intensities outside hydrozones as calculated for the 2008 study (2008), 2010 data with no enhancement of PFL data and 2010 data with enhancement of PFL data.(Figure 4-27 in Hartley et al. 2011).
Figure 11. Comparison of hydraulic conductivities outside hydrozones as calculated for the 2008 study (2008), 2010 data with no enhancement of PFL data and 2010 data with enhancement of PFL data. (Figure 4-28 in Hartley et al. 2011) Figure 12 shows the result of comparison of the transport properties calculated based on different models for hydraulic fracture domain NHU, results for CHUW show similar trends. NHU and CHUW are the northern and central hydraulic fracture domains (for details see Hartley et al. 2011). Comparing the 2010 Phase I and Phase III results, it is seen that the percentage of deposition holes in contact with the connected network has increased from ~ 1 % to ~ 28%. This is due to the higher intensity of very low transmissivity fractures
PFL Intensity - All PFLs outside Hydrozones
0
0.1
0.2
0.3
0.4
0.5
0.6
0.7
0.8
50-0
0-50
50-
100
100-
150
150-
200
200-
250
250-
300
300-
350
350-
400
400-
450
450-
500
500-
550
550-
600
600-
650
650-
700
700-
750
750-
800
800-
850
850-
900
900-
950
950
-100
0
Elevation (m)
P10
,Co
rr (
m-1
)
2008 2010 (no PFL enhancement) 2010 (with PFL enhancement)
Hydraulic Conductivity outside Hydrozones
1.00E-11
1.00E-10
1.00E-09
1.00E-08
1.00E-07
1.00E-06
50-
0
0-5
0
50-
100
10
0-15
0
15
0-20
0
20
0-25
0
25
0-30
0
30
0-35
0
35
0-40
0
40
0-45
0
45
0-50
0
50
0-55
0
55
0-60
0
60
0-65
0
65
0-70
0
70
0-75
0
75
0-80
0
80
0-85
0
85
0-90
0
90
0-95
0
950
-100
0
Elevation (m)
∑ T
/ ∑
L (
m/s
)
2008 2010 (no PFL enhancement) 2010 (with PFL enhancement) +

138
introduced in Phase III to deal with the lower PFL detection limit in the pilot holes. Despite the increase in numbers of releases, the minimum Fr is higher for Phase III, and the maximum Qr is lower. The median values of Fr are more than an order of magnitude higher for Phase III. Since the Phase I Hydro-DFN only represents flowing fractures with transmissivity greater than c, 10-9 m2/s, then strictly the distributions for Phase I should be compared only with that portion of the Phase III distribution for about the lowest 5-percentile of Fr values through the fastest pathways. These are quite similar, apart from the lower minimum Fr for Phase I. Similar observations can be made for hydraulic domain CHUW, although the minimum Fr values are about the same for both model versions. The percentage of releases at deposition holes for the 2008 Hydro-DFN is just over 2%. The distribution of Fr and Qr covers a similar range to the 2010 updates, although the 2008 Hydro-DFN gave a long tail of low Fr values that is no longer present.
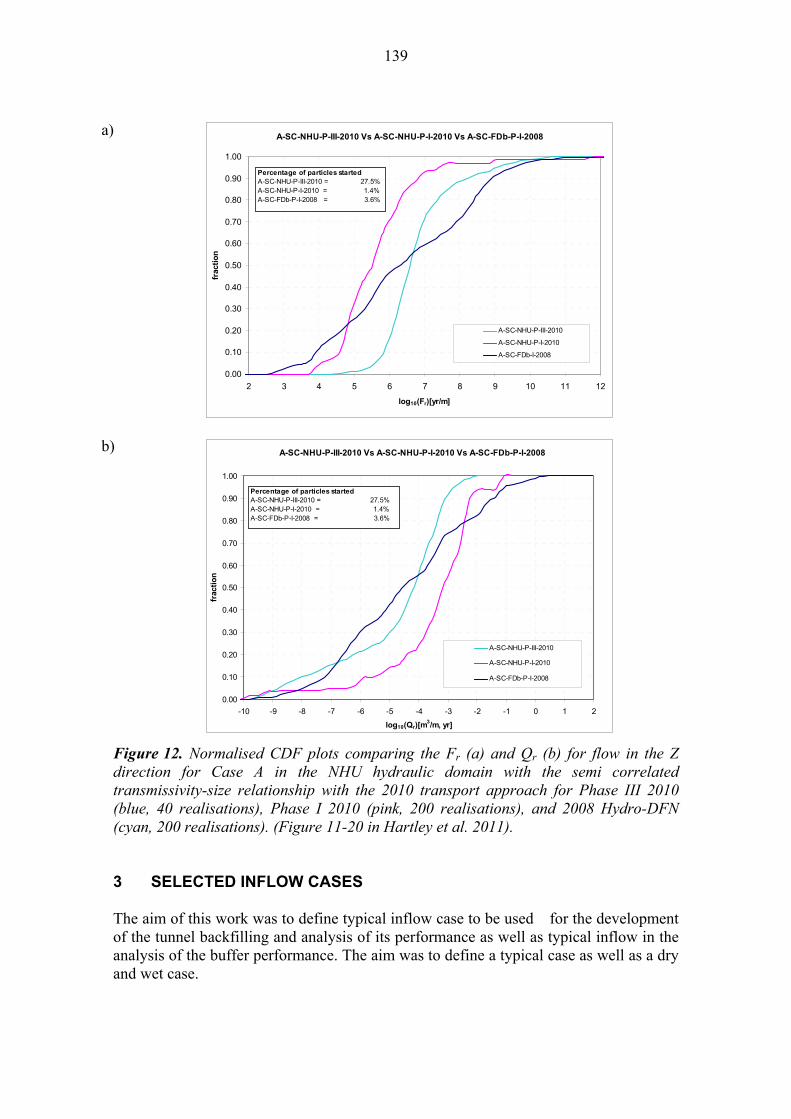
139
a)
b)
Figure 12. Normalised CDF plots comparing the Fr (a) and Qr (b) for flow in the Z direction for Case A in the NHU hydraulic domain with the semi correlated transmissivity-size relationship with the 2010 transport approach for Phase III 2010 (blue, 40 realisations), Phase I 2010 (pink, 200 realisations), and 2008 Hydro-DFN (cyan, 200 realisations). (Figure 11-20 in Hartley et al. 2011). 3 SELECTED INFLOW CASES The aim of this work was to define typical inflow case to be used for the development of the tunnel backfilling and analysis of its performance as well as typical inflow in the analysis of the buffer performance. The aim was to define a typical case as well as a dry and wet case.
A-SC-NHU-P-III-2010 Vs A-SC-NHU-P-I-2010 Vs A-SC-FDb-P-I-2008
0.00
0.10
0.20
0.30
0.40
0.50
0.60
0.70
0.80
0.90
1.00
2 3 4 5 6 7 8 9 10 11 12
log10(Fr)[yr/m]
frac
tio
n
A-SC-NHU-P-III-2010
A-SC-NHU-P-I-2010
A-SC-FDb-I-2008
Percentage of particles started A-SC-NHU-P-III-2010 = 27.5%A-SC-NHU-P-I-2010 = 1.4%A-SC-FDb-P-I-2008 = 3.6%
A-SC-NHU-P-III-2010 Vs A-SC-NHU-P-I-2010 Vs A-SC-FDb-P-I-2008
0.00
0.10
0.20
0.30
0.40
0.50
0.60
0.70
0.80
0.90
1.00
-10 -9 -8 -7 -6 -5 -4 -3 -2 -1 0 1 2
log10(Qr)[m3/m, yr]
frac
tio
n
A-SC-NHU-P-III-2010
A-SC-NHU-P-I-2010
A-SC-FDb-P-I-2008
Percentage of particles started A-SC-NHU-P-III-2010 = 27.5%A-SC-NHU-P-I-2010 = 1.4%A-SC-FDb-P-I-2008 = 3.6%

140
The following cases are suggested to be used for the design of the tunnel backfill and in the performance assessment of the tunnel backfill and buffer in the deposition holes. These are defined based mainly on the modelling results presented in Hartley & al 2010, but taking into account also the ONKALO data and the updated inflow estimates to DEMO tunnel (Hartley et al. 2011). 3.1 Tunnel Case 1, wet tunnel Total inflow to the tunnel is 5 l/min. It is possible that the deposition tunnel is intersected by a local, hydraulically conductive zone. According to Hartley et al. 2010 the probability of having total inflow above 1 l/min to the tunnel is significant (41%) and inflow over 10 l/min has also probability of 18%. However, such large inflows will be grouted (which is most likely allowed in the deposition tunnels) or can also be partly avoided by not extending the tunnels to such zones. Further, the experience from ONKALO shows than the leakage from the major hydrogeological zones HZ19 and HZ20 (such zones are not allowed to intersect deposition tunnels) is not exceeding 10 l/min after grouting. It can be assumed that the main part of the flow is coming from a fracture or few fractures related to a local hydraulically conductive zone. Lower inflows (0.01 l/min – 0.1 l/min) occur also adjacent to the highest inflow within approximately 10-20 m from the main inflow. These inflows are likely to be more or less pointwise. The tunnel may additionally have a few pointwise inflows up to 0.1 l/min. Case 2, typical tunnel Total inflow to the tunnel is 0.5 l/min. This value corresponds to median value of the inflow estimates according to Hartley et al. 2010. Approximately this inflow is obtained also if the inflow estimates for the DEMO tunnels in Hartely et al. 2011 and the observed inflow to ONKALO below HZ20 zones is scaled to 250-300 m long deposition tunnel. Tunnel contains one or two 10 - 20 m long sections with a few fractures having inflow in the order 0.1 l/min and additional pointwise inflows up to 0.01 l/min. The tunnel may additionally have a few pointwise inflows of 0.0001 l/min - 0.01 l/min. Case 3, an almost “dry” tunnel Inflow to tunnel is less than 0.01 l/min. According to Hartley et al. 2010 about 22 % of the tunnels could have inflow less than 0.01 l/min. According to the inflow estimates to the DEMO facility such low inflows to tunnel are, however, quite unlikely, although possible according to the analytical estimates based on pilot hole data. Tunnel contains few pointwise inflows of 0.0001 l/min - 0.01 l/min. 3.2 Tunnel sections Case 1, wet tunnel section The inflow to the tunnel section (9 m corresponding to an average distance between canister positions) is 1-2 l/min. According to Hartley et al. 2010 there is probability of

141
few percents to have inflow higher than 1 l/min (see also Tunnel Case 1). There is a notable probability of inflows higher than 0.1 l/min according to results for the DEMO facility (Hartley et al. 2011) and this is likely to originate from an intersection or connections to a single zone. Similar to the Tunnel case 1, it can be assumed that the main part of the flow is coming from a fracture or few fractures related to a local hydraulically conductive zone. Lower inflows (0.01 l/min – 0.1 l/min) occur also adjacent to the highest inflow. These inflows are likely to be more or less pointwise. Case 2, tunnel section with some inflow Inflow 0.001 l/min similar to the deposition hole case 2. According to Hartley et al. 2010 (Figures 3-8 and 3-9), the inflow distribution to a tunnel section and to a deposition hole are quite similar despite the larger diameter of the depositon tunnel. This is considered appropriate for the purpose of definition of illustrative cases. Also the distribution of the inflow can be considered similar to deposition hole case 2. Case 3, an almost “dry” tunnel section
Following similar argumentation as in case two, the Depostion hole Case 3 is suggested to be used also here.
3.3 Deposition holes Case 1, Wet hole Inflow 0.1 l/min, which presents the maximum allowed inflow to the deposition hole. Two subcases based on the distribution of the flow in the deposition hole is defined
A: the flow originates from a single fracture and the actual leakage is coming from a few spots located at the intersection of the fracture with the deposition hole and
B: the flow originates mainly from a single fracture, but the deposition hole may also include few other fractures contributing to the inflow, but inflow from (and transmissivity of) these fractures is one or two orders of magnitude lower than the fracture contributing mainly to the flow.
Case 2, deposition hole with some inflow Inflow 0.001 l/min, based on the simulations presented in Hartley et al. 2010 and 2011, less than 10 % of the deposition holes would have inflow higher than 0.001 l/m. However, according to analytical estimates based on pilot hole data considering also the presence of the low transmissivity fractures, the mean inflow is of this order. Similarly to case 1, two subcases based on the distribution of the flow in the deposition hole is defined
A: the flow originates from a single fracture and the actual leakage is coming from a few spots located at the intersection of the fracture with the deposition hole and
B: main part of the flow originates from a few fractures, but the deposition hole may also include few additional fractures contributing to the inflow,

142
but inflow from (and transmissivity of) these fractures is one or two orders of magnitude lower than the fracture contributing mainly to the flow.
Case 3, an almost dry deposition hole The inflow to deposition hole is less than 0.0001 l/min. According to Hartley et al. 2010 only 11 % of the deposition holes have higher inflow than 0.0001 l/min. The result according to simulations in Hartley et al. 2011 is similar, however according to the analytical estimates, nearly all the deposition holes do have inflow above 0.0001 l/min. 4 DISCUSSION Recently the hydro-DFN has been updated, but it is considered that the inflow estimates made in Hartley et al. 2010 are consistent with the new model as is also suggested by the inflow estimates for the demo facility presented in Hartley et al. 2011 (Phase 1 model has been used). Although no extensive inflow calculation have been done with the 2010 model, comparison of the transport resistance (F = 2WL/Q) and the average Darcy flow-rate per unit width, Qr, (m
2/y) between the 2008 model and the 2010 Phase1 and Phase II models and also with the inflow estimates based on analytical results indicate that
the number of deposition holes connected to flowing fracture network is likely higher than estimated by models based on the surface-based drillhole data. This applies most likely to the tunnel sections as well. The connections are created by the low conductivity fractures and their number is increased in the 2010 Phase III model due to the emphasis on the data on low conductivity fractures obtained in the ONKALO pilot holes.
The proportion of those deposition holes that are connected to flowing fracture network and have high Qr (higher 0.01 m3/m, year) is notably less in the updated models.
There is a positive, although not one to one, correlation of inflow to open repository conditions and the Darcy flow rate in saturated conditions as shown in Hartley et al. 2010, especially in case of higher inflows and flow rates. The net effect of the increased number of deposition holes and deposition tunnel section connected to flowing fracture network and the reduction in proportion of the high flow positions on the inflow remains to be studied by the forthcoming update of the inflow estimates. However, it is not expected that the maximum inflows will be increased, although the number of inflow points is expected to increase.
REFERENCES Hartley, L., Hoek, J., Swan, D. & Roberts, D. 2010. Hydrogeological Discrete Fracture Network Modelling of Groundwater Flow Under Open Repository Conditions. Eurajoki, Finland: Posiva Oy. Working Report 2010-51. Hartley, L., Appleyard, P., Baxter, S., Hoek, J., Roberts, D., Swan, D. & Follin, S. 2011. Development of a Hydrogeological Discrete Fracture Network Model for the Olkiluoto Site Descriptive Model 2010. Working Report in preparation (draft 19.4. 2011).

143
Käpyaho, A. 2011. Rock Suitability criteria, Version II v:0.5. Memorandum POS-010391 (draft 29.4.2011) Lindgren, S. 2011. ONKALOn vuotovesiennuste ja –mittaus 19-12-2010 v:1. Memorandum ONK-106956. Saanio, T., Ikonen, A., Keto, P., Kirkkomäki, T., Kukkola, T., Nieminen, J. & Raiko, H. 2010. Outline Design of the Disposal Facility 2009. Working Report 2010-50. Posiva Oy,

144

145
APPENDIX 5: FIM FRIEDLAND INDUSTRIAL MINERALS GMBH PRODUCT INFORMATION OF FRIEDLAND BENTONIT (COMPARABLE TO FRIEDLAND CLAY)

146

147
APPENDIX 6: FIMONIT SEAL PRODUCT INFORMATION (COMPARABLE TO MINELCO GRANULES)

148

149
APPENDIX 7: ROTEK A/S PRODUCT INFORMATION OF BENTONITE QSE (COMPARABLE TO CEBOGEL QSE)

150

151
APPENDIX 8: EMDD CALCULATIONS FOR THE OL1-3 CASE

152
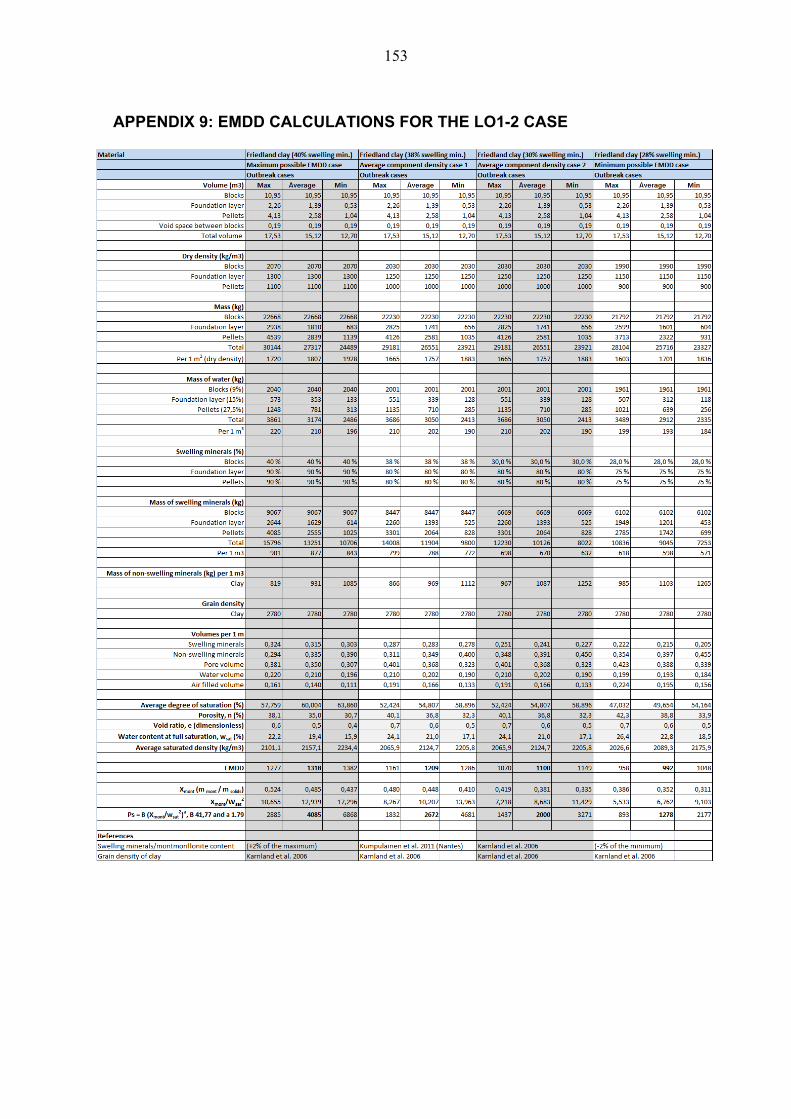
153
APPENDIX 9: EMDD CALCULATIONS FOR THE LO1-2 CASE

154

155
APPENDIX 10: HYDRAULIC CONDUCTIVITY AND SWELLING PRESSURE DATA FOR FRIEDLAND CLAY Data used in Figures 6-1 and 6-3.
ρd (kg/m3) Salinity ps (kPa) K (m/s) Reference
1634 TW 2110 Schatz & Martikainen (2012), publication pending
1706 TW 2560 Schatz & Martikainen (2012), publication pending
1780 TW 1,00E-12 Sandén et al. (2008), SKB-08-135
1503 DI 340 9,00E-12 Johannesson & Nilsson (2006), SKB R-06-73
816 DI 45 Karnland et al. (2006), TR-06-30
1174 DI 110 2,00E-11 Karnland et al. (2006), TR-06-30
1437 DI 400 5,00E-12 Karnland et al. (2006), TR-06-30
1576 DI 1400 1,00E-12 Karnland et al. (2006), TR-06-30
1780 10 g/l 1,20E-12 Sandén et al. (2008), SKB-08-135
1718 10 g/l 1000 Kumpulainen & Kiviranta (2011), Posiva WR 2011-41
1821 10 g/l 2660 8,74E-13 Kumpulainen & Kiviranta (2011), Posiva WR 2011-41
1837 10 g/l 3170 8,15E-13 Kumpulainen & Kiviranta (2011), Posiva WR 2011-41
1264 35 g/l 100 4,10E-10 Johannesson & Nilsson (2006), SKB R-06-73
1507 35 g/l 320 5,00E-11 Johannesson & Nilsson (2006), SKB R-06-73
1565 35 g/l 500 1,60E-11 Johannesson & Nilsson (2006), SKB R-06-73
1780 35 g/l 1500 2E-12 Johannesson (2008), SKB R-08-131
1680 35 g/l 3,2E-12 Sandén et al. (2008), SKB-08-135
1780 35 g/l 1,2E-12 Sandén et al. (2008), SKB-08-135
1532 35 g/l 910 Schatz & Martikainen (2012), publication pending
1680 35 g/l 1660 3,56E-12 Schatz & Martikainen (2012), publication pending
1750 35 g/l 1753 2,02E-12 Schatz & Martikainen (2012), publication pending
1812 35 g/l 2382 1,18E-12 Schatz & Martikainen (2012), publication pending
1377 70 g/l 116 3,4E-10 Johannesson & Nilsson (2006), SKB R-06-73
1492 70 g/l 290 8,3E-11 Johannesson & Nilsson (2006), SKB R-06-73
1595 70 g/l 520 3,9E-11 Johannesson & Nilsson (2006), SKB R-06-73
1780 70 g/l 1500 2E-12 Johannesson (2008), SKB R-08-131
1599 70 g/l 1180 Schatz & Martikainen (2012), publication pending
1732 70 g/l 1717 3,52E-12 Schatz & Martikainen (2012), publication pending
1662 70 g/l 1435 4,87E-12 Schatz & Martikainen (2012), publication pending
1855 70 g/l 3571 6,77E-13 Schatz & Martikainen (2012), publication pending

156
157
APPENDIX 11: MINIMUM AND MAXIMUM SWELLING PRESSURES OF FRIEDLAND CLAY
MEMO-47/2011-158 23.12.2011
Author Leena Kiviranta
Reviewed by
Paula Keto
Approved by Managing director
Jorma Autio
date
20.1.2012 date
8.3.2012 date
9.3.2012
TECHNICAL MEMO: Minimum and maximum swelling pressures of Friedland clay PROJECT: 158/ Backfill productionline work 2011 SUBPROJECT: Productionline reporting CLASS (in M-Files): Technical memo 1 INTRODUCTION It was noticed that enough data of minimum and maximum swelling pressures of Friedland clay at minimum and maximum densities didn’t exist for the purposes of the backfill production line report. The objective of this study was to produce the needed data by performing five swelling pressure measurements for Friedland clay. Based on earlier studies on MX-80 (Karnland et al., 2006) Ca-dominated clay is assumed to have lower swelling pressure at low densities than the Na-dominated clay. Thus, in order to get the minimum swelling pressure at minimum density, the Friedland clay material was exchanged to Ca-form before swelling pressure measurements. 2 EXPERIMENTAL 2.1 Maximum swelling pressure Three swelling pressure measurements were performed for Friedland clay (ABM reference material, other properties reported in Kumpulainen and Kiviranta, 2010 and Kumpulainen and Kiviranta, 2011) using target maximum dry density of 1924 kg/m3 (1900-1950 kg/m3). The measurements were performed as described in Kiviranta and Kumpulainen (2011) using 35 mm swelling pressure cells and saturation solution of 10 g/l (Posiva’s reference water). 2.2 Minimum swelling pressure Three swelling pressure measurements were performed for Friedland clay (ABM reference material, other properties reported in Kumpulainen and Kiviranta, 2010 and Kumpulainen and Kiviranta 2011) using target minimum dry density of 1608 kg/m3

158
(~1600 kg/m3). The measurements were performed as described in Kiviranta and Kumpulainen (2011) using 24 or 25 mm swelling pressure cells and saturation solution of 70 g/l (Posiva’s reference water). Before measurements the material was exchanged to Ca-form by treating it with 0.5 M CaCl2 solution. Two dialysis rounds were performed (one speeded round (3x CaCl2 and dialysis was replaced by washing with centrifuge) and one normal (3x CaCl2, washing with centrifuge and dialysis)). Two swelling pressure measurements were performed for Ca-exchanged material and one for as-received Friedland clay (reference). The exchangeable cation content of the material was checked after exchange to Ca-form and also after the swelling pressure measurements. After swelling pressure measurements, the excess salt was washed from the material before extracting the exchangeable cations. The exchangeable cations were extracted using NH4Cl in 80% ethanol and the cations were determined from the extracted solutions with ICP-AES at Labtium Oy. Exchangeable cation extraction procedure is described in detail in Kiviranta and Kumpulainen (2011). 3 RESULTS 3.1 Swelling pressure The swelling pressures, water ratios, dry and bulk densities of Friedland clay and Ca-exchanged materials are presented in Table 1 and Figure 1. Grain density of 2.793 g/cm3 was used for Friedland clay in the calculations (Kumpulainen and Kiviranta, 2011). Table 1. Swelling pressure (SP), water ratio (w), dry density (ρd) and bulk density (ρb) of samples. Sample Saturation
solution SP (MPa) w (%) Calculated from w Immersion method
ρd (g/cm3) ρb (g/cm3) ρd (g/cm3) ρb (g/cm3) Max1 10 g/l 3.77 17.6 1.87 2.20 1.84 2.16
Max2 10 g/l 3.09 18.6 1.84 2.18 1.81 2.14
Max3 10 g/l 6.33 15.2 1.96 2.26 1.91 2.20
Min-Ref 70 g/l 0.21 27.3 1.59 2.02 1.56 1.98
Min-Ca1 70 g/l 0.90 31.0 1.50 1.96 1.48 1.94
Min-Ca2 70 g/l 0.71 32.1 1.47 1.95 1.46 1.93

159
Figure 1. Swelling pressure of Friedland clay and Ca-exchanged Friedland clay samples (ρd calculated from w) (this study). As opposite to what was expected, the Ca-exchanged Friedland clay had larger swelling pressure than the as-received Friedland clay. One possible cause for this was considered to be dissolution of soluble minerals. However, more probable cause was considered to be the fact that the Ca-exchanged material had undergone vigorous mechanical agitation during Ca-exchange, and was ground into powder after Ca-exchange and drying, i.e., altering the microstructure and mechanical strength of the material. The swelling pressure data produced in this study and several other studies are compiled in Figure 2 (the dry density measured with immersion method (Table 1) was used in the Figure 2). The references for the data from other studies are presented in the Backfill Production line report. The large deviations in the results within similar salinity may be due to different testing methods or variations in the smectite content of the materials etc.
0,1
1
10
1,35 1,45 1,55 1,65 1,75 1,85 1,95 2,05
Swellin
g pressure (MPa)
Dry density (g/cm3)
Friedland clay (10 g/l) Ca‐Friedland clay (70 g/l) Friedland clay (70 g/l)

160
Figure 2. Compiled swelling pressure data for Friedland clay (from different studies of several different lots of Friedland clay) (references are presented in backfill production line report (Backfill Production Line report)). 3.2 Exchangeable cations The exchangeable cation content of the Ca-exchanged Friedland clay before (Ca-exchanged ABM Friedland) and after the swelling pressure measurements (Min-Ca1 and Min-Ca2) are presented in Table 2. Also the original exchangeable cation content of Friedland clay (ABM Friedland) and the contents after swelling pressure measurement (Min-Ref) are shown.
10
100
1000
10000
1100 1200 1300 1400 1500 1600 1700 1800 1900 2000
Swelling Pressure [kPa]
Dry density [kg/m3]
Tap water (or DI)
35 g/L
70 g/L
10 g/L
Ca‐converted, 70 g/L
Expon. (Tap water (or DI))
Expon. (35 g/L)
Expon. (70 g/L)
Expon. (10 g/L)

161
Table 2. Exchangeable cations (and CEC) of materials measured with NH4Cl- (and Cu(II)-triethylenetetramine)-methods (details are available in Kiviranta and Kumpulainen 2011).
Saturation of exchangeable
sites Exchangeable cations (in dry (105°C) weight) CEC
Material Ca [%]
K [%]
Mg [%]
Na [%]
Ca [eq/kg]
K [eq/kg]
Mg [eq/kg]
Na [eq/kg]
Sum [eq/kg]
Cu-trien
[eq/kg]
ABM Friedland*
4 6 13 76 0.01 0.02 0.04 0.24 0.31 0.26
Ca-exchanged ABM Friedland
89 4 5 2 0.22 0.01 0.01 0.00 0.25 -
Ca-exchanged ABM Friedland
89 4 5 2 0.23 0.01 0.01 0.00 0.25 -
Min-Ref** 84 5 6 5 0.21 0.01 0.02 0.01 0.25 -
Min-Ref** 83 5 6 5 0.21 0.01 0.02 0.01 0.25 -
Min-Ca1** 87 4 3 6 0.22 0.01 0.01 0.01 0.25 -
Min-Ca2** 87 4 3 6 0.22 0.01 0.01 0.01 0.25 -
* From Kumpulainen and Kiviranta (2010) ** After swelling pressure measurement The sum of exchangeable cations is the same in all samples of this study. The exchangeable cations are changed into Ca-dominated in all samples measured with Posiva’s 70 g/l reference solution, also in the samples, which were not treated with CaCl2-solution before the swelling pressure measurements. The measured CEC of the reference sample (ABM Friedland) was 0.05 eq/kg lower than the sum of exchangeable cations, but approximately the same as the sum of exchangeable cations in the samples of this study (Table 2). The controversy in the sum of exchangeable cations and CEC values is thought to arise from dissolution of soluble minerals or porewater in the reference sample during exchangeable cation extraction. The sum of exchangeable cations in all samples of this study was equal with the reference sample CEC (Table 2), indicating that the extra cations from porewater or dissolution of minerals were removed during Ca-exchange, swelling pressure measurements or washing before extraction of exchangeable cations. 4 CONCLUSIONS The results of this study indicate that the 70 g/l (Posiva reference solution) changes effectively the exchangeable cation content of the as-received material into Ca-dominated. The target densities of this study were not reached in all samples, but the Max3 sample was close to the maximum target density producing swelling pressure of 6.33 MPa. Also the Min-ref sample was relatively close to the minimum target density producing swelling pressure of only 0.21 MPa.

162
REFERENCES Karnland O., Olsson S., Nilsson U. 2006. Mineralogy and sealing properties of various bentonites and smectite-rich clay materials. SKB TR-06-30. Swedish Nuclear Fuel and Waste Management Company (SKB), Stockholm, Sweden. Posiva 2012. Design, production and initial state of the deposition tunnel backfill and plug. Posiva R 2012-18. Posiva Oy, Olkiluoto, Finland. Kiviranta L., Kumpulainen S. 2011. Quality control and characterization of bentonite materials. Posiva WR 2011-84. Posiva Oy, Olkiluoto, Finland. Kumpulainen S., Kiviranta L. 2010. Mineralogical and chemical characterization of various bentonite and smectite-rich clay materials. Posiva WR 2010-52. Posiva Oy, Olkiluoto, Finland. Kumpulainen S., Kiviranta L. 2011. Mineralogical, chemical and physical study of potential buffer and backfill materials from ABM test package 1. Posiva WR 2011-41. Posiva Oy, Olkiluoto, Finland.

163
AP
PE
ND
IX 1
2: M
EA
SU
RE
D S
WE
LL
ING
PR
ES
SU
RE
DA
TA
FO
R F
RIE
DL
AN
D C
LA
Y/D
AT
A U
SE
D IN
FIG
UR
E 6
-4.
ρ d (
kg/m
3 ) S
wm
in
Non
-sw
m
in
ρ sol
ids
m m
ont
m n
on-s
w m
in
V m
ont
V n
on-s
w
V v
oids
w
sat
X m
ont
Xm
ont/W
sat2
EM
DD
S
alin
ity
Sal
t ps
(k
Pa)
R
efer
ence
(m
easu
rem
ent)
(%
)
(kg/
m3 )
1718
38
0,62
27
80
653
1065
0,23
50,
383
0,38
20,
222
0,38
0
7,68
510
5810
g/l
NaC
l 10
00K
umpu
lain
en &
K
ivira
nta
(201
1)
1821
38
0,62
27
80
692
1129
0,24
90,
406
0,34
50,
189
0,38
0
10,5
8911
6510
g/l
NaC
l26
60K
umpu
lain
en &
K
ivira
nta
(201
1)
1837
38
0,62
27
80
698
1139
0,25
10,
410
0,33
90,
185
0,38
0
11,1
4511
8310
g/l
NaC
l31
70K
umpu
lain
en &
K
ivira
nta
(201
1)
1264
29
,5
(25-
34)
0,70
5
2780
37
389
10,
134
0,32
10,
545
0,43
10,
295
1,
585
549
35 g
/lN
aCl:C
aCl 2
1:1
100
Joha
nnes
son
&
Nils
son
(200
6)
1507
29
,5
(25-
34)
0,70
5
2780
44
510
620,
160
0,38
20,
458
0,30
40,
295
3,
195
720
35 g
/lN
aCl:C
aCl 2
1:1
320
Joha
nnes
son
&
Nils
son
(200
6)
1565
29
,5
(25-
34)
0,70
5
2780
46
211
030,
166
0,39
70,
437
0,27
90,
295
3,
783
765
35 g
/lN
aCl:C
aCl 2
1:1
500
Joha
nnes
son
&
Nils
son
(200
6)
1780
0,70
5
2780
52
512
550,
189
0,45
10,
360
0,20
20,
295
7,
224
957
35 g
/lN
aCl:C
aCl 2
1:1
1500
Joha
nnes
son
&
Nils
son
(200
6)
1532
38
0,62
27
80
582
950
0,20
90,
342
0,44
90,
293
0,38
0
4,42
588
435
g/l
NaC
l:CaC
l 21:
1 91
0S
chat
z &
Mar
tikai
nen
(201
2)
1680
38
0,62
27
80
638
1042
0,23
00,
375
0,39
60,
236
0,38
0
6,85
010
2135
g/l
NaC
l:CaC
l 21:
116
60S
chat
z &
Mar
tikai
nen
(201
2)
1750
38
0,62
27
80
665
1085
0,23
90,
390
0,37
10,
212
0,38
0
8,47
810
9135
g/l
NaC
l:CaC
l 21:
117
53S
chat
z &
Mar
tikai
nen
(201
2)
1812
38
0,62
27
80
689
1123
0,24
80,
404
0,34
80,
192
0,38
0
10,2
9111
5635
g/l
NaC
l:CaC
l 21:
123
82S
chat
z &
Mar
tikai
nen
(201
2)
1377
29
,5
(25-
34)
0,70
5
2780
40
697
10,
146
0,34
90,
505
0,36
70,
295
2,
196
624
70 g
/lN
aCl:C
aCl 2
1:1
116
Joha
nnes
son
&
Nils
son
(200
6)
1492
29
,5
(25-
34)
0,70
5
2780
44
010
520,
158
0,37
80,
463
0,31
10,
295
3,
059
708
70 g
/lN
aCl:C
aCl 2
1:1
290
Joha
nnes
son
&
Nils
son
(200
6)
1595
29
,5
(25-
34)
0,70
5
2780
47
111
240,
169
0,40
40,
426
0,26
70,
295
4,
130
790
70 g
/lN
aCl:C
aCl 2
1:1
520
Joha
nnes
son
&
Nils
son
(200
6)
1780
29
,5
(25-
34)
0,70
5
2780
52
512
550,
189
0,45
10,
360
0,20
20,
295
7,
224
957
70 g
/lN
aCl:C
aCl 2
1:1
1500
Joha
nnes
son
&
Nils
son
(200
6)
1599
38
0,62
27
80
608
991
0,21
90,
357
0,42
50,
266
0,38
0
5,38
494
470
g/l
Ca:
Na,
3:
2 11
80S
chat
z &
Mar
tikai
nen
(201
2)
1732
38
0,62
27
80
658
1074
0,23
70,
386
0,37
70,
218
0,38
0
8,02
110
7270
g/l
Ca:
Na,
3:2
1717
Sch
atz
& M
artik
aine
n (2
012)
1662
38
0,62
27
80
632
1030
0,22
70,
371
0,40
20,
242
0,38
0
6,49
010
0470
g/l
Ca:
Na,
3:2
1435
Sch
atz
& M
artik
aine
n (2
012)
1855
38
0,62
27
80
705
1150
0,25
40,
414
0,33
30,
179
0,38
0
11,8
1112
0270
g/l
Ca:
Na,
3:2
3571
Sch
atz
& M
artik
aine
n (2
012)
The
min
eral
ogy
is ta
ken
from
Kar
nlan
d et
al.
(200
6) fo
r sa
mpl
es m
arke
d w
ith
grey
bac
kgro
und
and
from
Kum
pula
inen
& K
ivir
anta
(20
10)
for
sam
ples
mar
ked
wit
h w
hite
bac
kgro
und.
163

164
164

LIST OF REPORTS
POSIVA-REPORTS 2012
_______________________________________________________________________________________
POSIVA 2012-01 Monitoring at Olkiluoto – a Programme for the Period Before Repository Operation Posiva Oy ISBN 978-951-652-182-7 POSIVA 2012-02 Microstructure, Porosity and Mineralogy Around Fractures in Olkiluoto
Bedrock Jukka Kuva (ed.), Markko Myllys, Jussi Timonen, University of Jyväskylä Maarit Kelokaski, Marja Siitari-Kauppi, Jussi Ikonen, University of Helsinki Antero Lindberg, Geological Survey of Finland Ismo Aaltonen, Posiva Oy ISBN 978-951-652-183-4
POSIVA 2012-03 Safety Case for the Disposal of Spent Nuclear Fuel at Olkiluoto - Design Basis 2012 Posiva Oy ISBN 978-951-652-184-1 POSIVA 2012-04 Safety Case for the Disposal of Spent Nuclear Fuel at Olkiluoto - Performance Assessment 2012 Posiva Oy ISBN 978-951-652-185-8 POSIVA 2012-05 Safety Case for the Disposal of Spent Nuclear Fuel at Olkiluoto - Description of the Disposal System 2012 Posiva Oy ISBN 978-951-652-186-5 POSIVA 2012-06 Olkiluoto Biosphere Description 2012 Posiva Oy ISBN 978-951-652-187-2 POSIVA 2012-07 Safety Case for the Disposal of Spent Nuclear Fuel at Olkiluoto - Features, Events and Processes 2012 Posiva Oy ISBN 978-951-652-188-9 POSIVA 2012-08 Safety Case for the Disposal of Spent Nuclear Fuel at Olkiluoto - Formulation of Radionuclide Release Scenarios 2012 Posiva Oy ISBN 978-951-652-189-6

POSIVA 2012-09 Safety Case for the Disposal of Spent Nuclear Fuel at Olkiluoto - Assessment of Radionuclide Release Scenarios for the Repository System 2012 Posiva Oy ISBN 978-951-652-190-2 POSIVA 2012-10 Safety case for the Spent Nuclear Fuel Disposal at Olkiluoto - Biosphere Assessment BSA-2012 Posiva Oy ISBN 978-951-652-191-9 POSIVA 2012-11 Safety Case for the Disposal of Spent Nuclear Fuel at Olkiluoto - Complementary Considerations 2012 Posiva Oy ISBN 978-951-652-192-6 POSIVA 2012-12 Safety Case for the Disposal of Spent Nuclear Fuel at Olkiluoto - Synthesis 2012 Posiva Oy ISBN 978-951-652-193-3 POSIVA 2012-13 Canister Design 2012 Heikki Raiko, VTT ISBN 978-951-652-194-0 POSIVA 2012-14 Buffer Design 2012 Markku Juvankoski, VTT ISBN 978-951-652-195-7 POSIVA 2012-15 Backfill Design 2012 Posiva Oy ISBN 978-951-652-196-4 POSIVA 2012-16 Canister Production Line 2012 – Design, Production and Initial State of the Canister Heikki Raiko (ed.), VTT Barbara Pastina, Saanio & Riekkola Oy Tiina Jalonen, Leena Nolvi, Jorma Pitkänen & Timo Salonen, Posiva Oy ISBN 978-951-652-197-1 POSIVA 2012-17 Buffer Production Line 2012 – Design, Production, and Initial State of the Buffer Markku Juvankoski, Kari Ikonen, VTT Tiina Jalonen, Posiva Oy ISBN 978-951-652-198-8

POSIVA 2012-18 Backfill Production Line 2012 - Design, Production and Initial State of the Deposition Tunnel Backfill and Plug Paula Keto (ed.), Md. Mamunul Hassan, Petriikka Karttunen, Leena Kiviranta, Sirpa Kumpulainen, B+Tech Oy Leena Korkiala-Tanttu, Aalto University Ville Koskinen, Fortum Oyj Tiina Jalonen, Petri Koho, Posiva Oy Ursula Sievänen, Saanio & Riekkola Oy ISBN 978-951-652-199-5