back analysis of banqiao clay core dam breaching
TRANSCRIPT

Long-Term Behaviour and Environmentally Friendly Rehabilitation Technologies of Dams (LTBD 2017) DOI103217978-3-85125-564-5-007
50
Back Analysis of Banqiao Clay Core Dam Breaching
Qiming Zhong1 Shengshui Chen2 Shiang Mei3
1- Nanjing Hydraulic Research Institute Key Laboratory of Failure Mechanism and Safety Control
Techniques of Earth-rock Dam of the Ministry of Water Resources Nanjing 210029 China
2- Nanjing Hydraulic Research Institute Key Laboratory of Failure Mechanism and Safety Control
Techniques of Earth-rock Dam of the Ministry of Water Resources Nanjing 210029 China
3- Nanjing Hydraulic Research Institute Nanjing 210029 China
E-mail qmzhongnhricn
Abstract
In this study a numerical model is put forward to simulate the Banqiao reservoir dam breaching Based on the
breaching process records a numerical model is put forward In this model two different erosion formulas are
utilized to simulate the erosion process of dam shell and core materials respectively a mechanical equilibrium
equation is adopted to simulate the shear failure of clay core meanwhile broad-crested weir formula is adopted
to calculate breach flow discharge the limit equilibrium method is utilized to analyze the stability of breach
slope as well In addition according to the real situation the model considers dam base erosion Based on the
surveyed records the calculated results of the proposed model are in accordance with the measured data
Keywords Banqiao reservoir overtopping clay core dam numerical model
1 INTRODUCTION
Based on the Bulletin of First National Census for Water [1] by the end of 2011 there is 98002 reservoir
dams in China on the contrast according to the statistical data of Dam Safety Management Center of the Ministry
of Water Resources P R China [2] from 1954 to 2014 there have been 3530 dam breach accidents happened in
China According to the statistics the dam breach accidents of overtopping failure occupy over 50 of the total
number In August 1975 the clay core dam with a height of 245 m of Banqiao reservoir was failed due to
overtopping flow the dam breached resulting in catastrophic downstream flooding and over 26000 fatalities [3]
In order to evaluate the consequence of the core dam breaching the mechanism of clay core dam breach due to
overtopping failure requires in-depth research as well as the mathematical model which can reasonably simulate
the breach process
As we know for the homogeneous dam overtopping failure numerous tests of different scales are carried
out an array of numerical models are put forward [4] When it comes to core dam overtopping failure owing to
the complexity of the model test only the IMPACT Project [5] and NHRI [6] held a large scale model test of
moraine core rockfill dam with a height of 60 m and centrifugal model tests of clay core rockfill dam with a
height of 160 m respectively (see Figures 1 and 2)
Figure 1 Large scale model test of moraine core rockfill dam due to overtopping failure
Figure 2 Centrifugal model test of clay core rockfill dam due to overtopping failure
Long-Term Behaviour and Environmentally Friendly Rehabilitation Technologies of Dams (LTBD 2017) DOI103217978-3-85125-564-5-007
51
The model tests show that the overtopping flow first erodes the downstream dam shell With the
increasing erosion of the downstream dam shell the downstream side of the core is gradually exposed and hollow
Under the co-action of the upstream water and soil pressures shear failure occurs in the core With the decrease
of water head the discharge through the breach gradually fall to zero
Since 1980s according to the soil erosion tests some mathematical model for core dam breaching are
put forward Among these models NWS BREACH model [7] HR BREACH model [8 9] DLBreach model [10]
and NHRI-CCOB model [6] are the representatives
It is worth mentioning that the subbase erosion of the dam is not considered in the core dam breaching
model tests at home and abroad Figure 3 shows the final breach of the Banqiao reservoir dam owing to the
erodible base and large reservoir storage and relative small dam height the base erosion depth is 504 m (see
Figure 4(a)) Meanwhile a scour hole which has a depth of 110 m is formed downstream then the hole is filled
with reservoir deposit (see Figure 4(b)) In order to simulate the clay core dam breaching process of Banqiao
reservoir a mathematical model is put forward the technical details are described in the following sections
Figure 3 Final breach of Banqiao reservoir dam
(a) vertical section (b) cross section
Figure 4 Breach sections of Banqiao reservoir
2 BREACHING PROCESS OF BANQIAO CLAY CORE DAM
Banqiao reservoir has a maximum storage of 492times108 m3 and a maximum dam height of 245 m as well
The length of the dam is 2020 m and the crest width is 6 m The dam crest and the wave wall elevations are
11634 m and 11764 m respectively
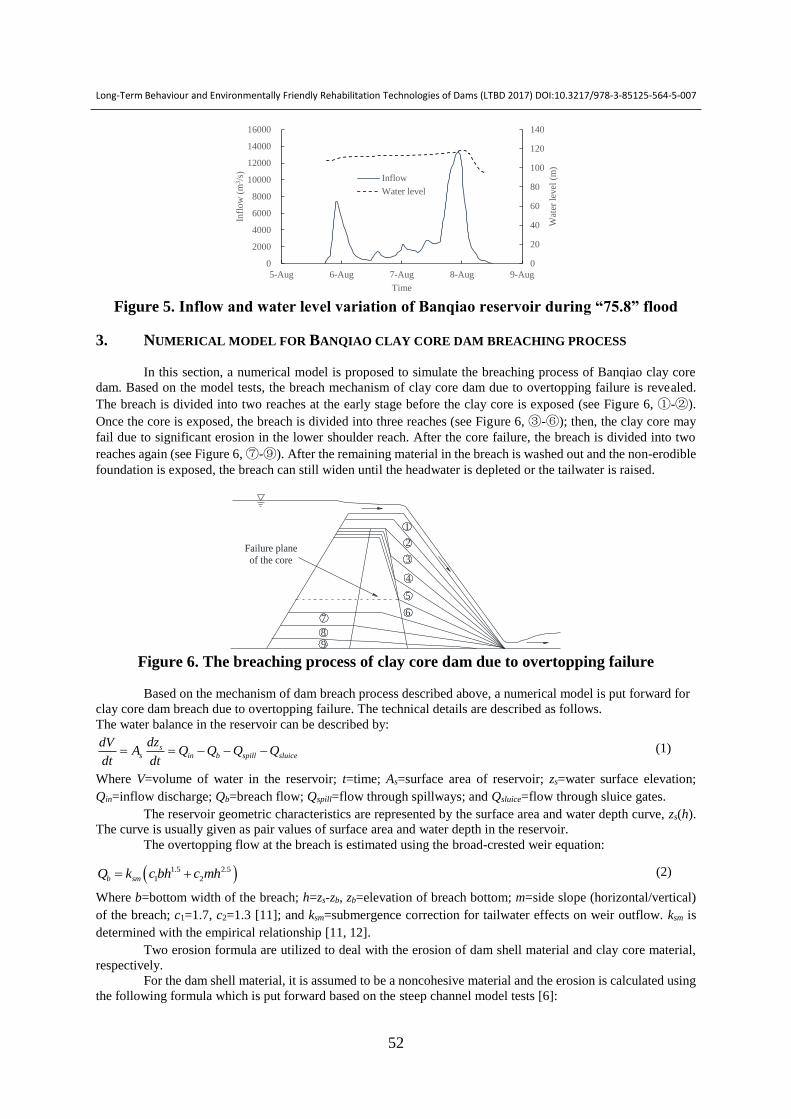
In August 1975 a heavy storm occurs in Henan When it comes to Banqiao reservoir there are two
inflow process the first inflow occurs during 1400 August 5th to 200 August 6th and the peak inflow is 7500
m3s the second inflow occurs during 1200 August 7th to 800 August 8th and the peak inflow is 13000 m3s
(see Figure 5)
maximum water level 11794 m
dam crest elevation 11634 m
Ele
vati
on (
m)
Distance (m)
90
0
100
110
120
100 200 300 400 -200 -100 0 100 200 300 400 500 600
80
90
Distance (m)
Ele
vat
ion (
m)
water level
mud surface
sand gravel surface
bed rock surface
Long-Term Behaviour and Environmentally Friendly Rehabilitation Technologies of Dams (LTBD 2017) DOI103217978-3-85125-564-5-007
52
Figure 5 Inflow and water level variation of Banqiao reservoir during ldquo758rdquo flood
3 NUMERICAL MODEL FOR BANQIAO CLAY CORE DAM BREACHING PROCESS
In this section a numerical model is proposed to simulate the breaching process of Banqiao clay core
dam Based on the model tests the breach mechanism of clay core dam due to overtopping failure is revealed
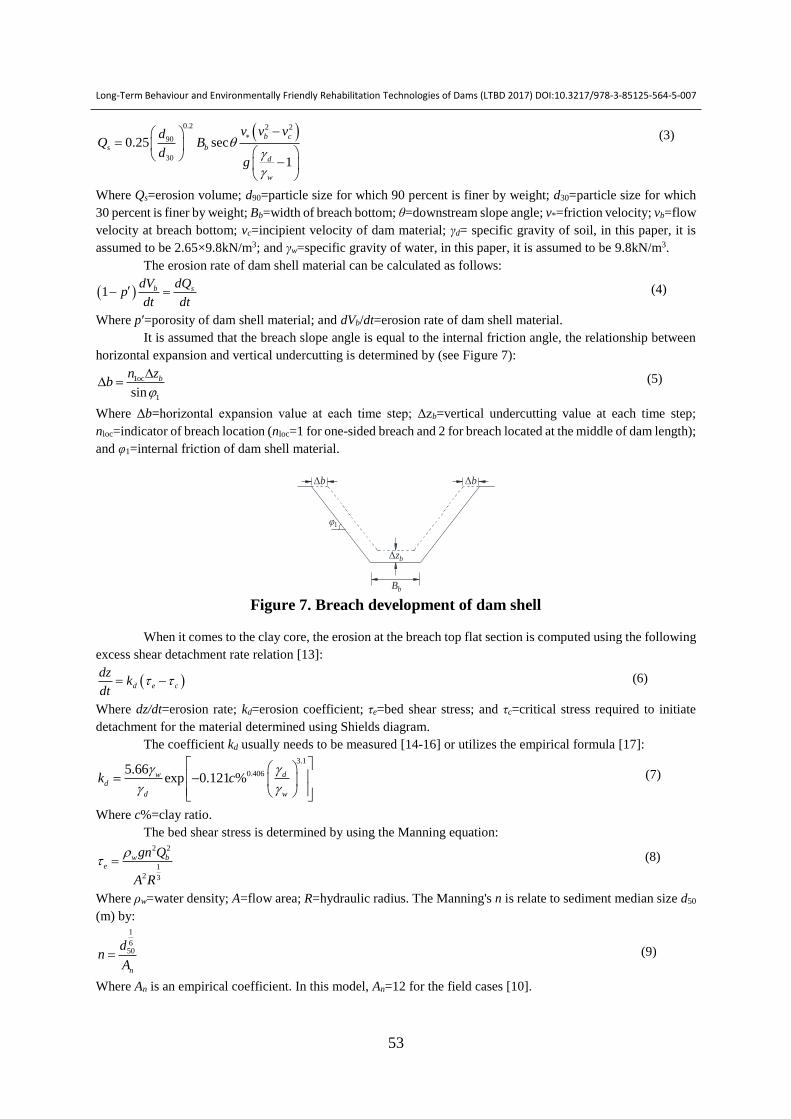
The breach is divided into two reaches at the early stage before the clay core is exposed (see Figure 6 ①-②)
Once the core is exposed the breach is divided into three reaches (see Figure 6 ③-⑥) then the clay core may
fail due to significant erosion in the lower shoulder reach After the core failure the breach is divided into two
reaches again (see Figure 6 ⑦-⑨) After the remaining material in the breach is washed out and the non-erodible
foundation is exposed the breach can still widen until the headwater is depleted or the tailwater is raised
Figure 6 The breaching process of clay core dam due to overtopping failure
Based on the mechanism of dam breach process described above a numerical model is put forward for
clay core dam breach due to overtopping failure The technical details are described as follows
The water balance in the reservoir can be described by
ss in b spill sluice
dzdVA Q Q Q Q
dt dt (1)
Where V=volume of water in the reservoir t=time As=surface area of reservoir zs=water surface elevation
Qin=inflow discharge Qb=breach flow Qspill=flow through spillways and Qsluice=flow through sluice gates
The reservoir geometric characteristics are represented by the surface area and water depth curve zs(h)
The curve is usually given as pair values of surface area and water depth in the reservoir
The overtopping flow at the breach is estimated using the broad-crested weir equation
15 25
1 2b smQ k c bh c mh (2)
Where b=bottom width of the breach h=zs-zb zb=elevation of breach bottom m=side slope (horizontalvertical)
of the breach c1=17 c2=13 [11] and ksm=submergence correction for tailwater effects on weir outflow ksm is
determined with the empirical relationship [11 12]
Two erosion formula are utilized to deal with the erosion of dam shell material and clay core material
respectively
For the dam shell material it is assumed to be a noncohesive material and the erosion is calculated using
the following formula which is put forward based on the steep channel model tests [6]
0
20
40
60
80
100
120
140
0
2000
4000
6000
8000
10000
12000
14000
16000
5-Aug 6-Aug 7-Aug 8-Aug 9-Aug
Wat
er l
evel
(m
)
Infl
ow
(m
3s
)
Time
Inflow
Water level
Failure plane
of the core
1
2
3
4
5
67
8
9
Long-Term Behaviour and Environmentally Friendly Rehabilitation Technologies of Dams (LTBD 2017) DOI103217978-3-85125-564-5-007
53
02 2 2
90
30
025 sec
1
b c
s b
d
w
v v vdQ B
dg
(3)
Where Qs=erosion volume d90=particle size for which 90 percent is finer by weight d30=particle size for which
30 percent is finer by weight Bb=width of breach bottom θ=downstream slope angle v=friction velocity vb=flow
velocity at breach bottom vc=incipient velocity of dam material γd= specific gravity of soil in this paper it is
assumed to be 265times98kNm3 and γw=specific gravity of water in this paper it is assumed to be 98kNm3
The erosion rate of dam shell material can be calculated as follows
1 b sdV dQp
dt dt (4)
Where pʹ=porosity of dam shell material and dVbdt=erosion rate of dam shell material
It is assumed that the breach slope angle is equal to the internal friction angle the relationship between
horizontal expansion and vertical undercutting is determined by (see Figure 7)
1oc
1sin
bn zb
(5)
Where Δb=horizontal expansion value at each time step Δzb=vertical undercutting value at each time step
nloc=indicator of breach location (nloc=1 for one-sided breach and 2 for breach located at the middle of dam length)
and φ1=internal friction of dam shell material
Figure 7 Breach development of dam shell
When it comes to the clay core the erosion at the breach top flat section is computed using the following
excess shear detachment rate relation [13]
d e c
dzk
dt (6)
Where dzdt=erosion rate kd=erosion coefficient τe=bed shear stress and τc=critical stress required to initiate
detachment for the material determined using Shields diagram
The coefficient kd usually needs to be measured [14-16] or utilizes the empirical formula [17] 31
0406566exp 0121 w d
d
d w
k c
(7)
Where c=clay ratio
The bed shear stress is determined by using the Manning equation 2 2
1
2 3
w be
gn Q
A R
(8)
Where ρw=water density A=flow area R=hydraulic radius The Mannings n is relate to sediment median size d50
(m) by 1
650
n
dn
A (9)
Where An is an empirical coefficient In this model An=12 for the field cases [10]
Bb
Δzb
φ1
Δb Δb
Long-Term Behaviour and Environmentally Friendly Rehabilitation Technologies of Dams (LTBD 2017) DOI103217978-3-85125-564-5-007
54
The width change of the breach can be assumed as follows
1oc bb n z (10)
With the erosion of dam shell and clay core the downstream side of the core is gradually exposed and
hollow Under the co-action of the upstream water and soil pressures shear failure occurs in the core (see Figure
8(a)) The stress state of the failure clay core is shown in Figure 8(b)
Figure 8 Shear failure of clay core
As shown in Fig 9 the critical condition of clay core failure can be expressed as
a w sb ss cb csF F F F FF (11)
In which
2 1 11 105 tan 45 2 tan 45
2 2a b c cF B y y c
(12)
2
05w w b c dF B y h (13)
2tansb WF (14)
2
2 2 2tanss cF y KL (15)
2 2cb bF C B L (16)
2 1 2cs cF C y L L (17)
12 cotb t cB B y (18)
2
2
1 sin
1 sinK
(19)
2 1 2 cotcL L y (20)
2 1 205 b cW L L B y (21)
Where Fa=active earth pressure of the dam materials upstream the clay core Fw=water pressure
Fsb=friction along the bottom of failure plane Fss=friction along the two sides of failure plane Fcb=cohesion along
the bottom of failure plane Fcs=cohesion along the two sides of failure plane hd=the water head above the dam
crest yc=the height between dam crest to failure plane of clay core K=coefficient of static earth pressure Bt=
breach top width Bb=breach width at the failure plane L1=top width of clay core L2=width of failure palne
W=clay core weight above failure plane γ1=dry specific gravity of dam shell material γ2=dry specific gravity of
clay core material C1=cohesion of dam shell material C2=cohesion of clay core material α=slope angle of dam
upstream β=slope angle of clay core upstream φ1=internal friction angle of dam shell material φ2=internal
friction angle of clay core material
In the case of erodible foundation the model allows erosion into the foundation The breach is assumed
to have a flat horizontal bottom surface and can lower to a value predefined according to the foundation material
properties but the base erosion does not affect the upstream water volume and downstream channel flow The
breach flow discharge is determined using Eq (2) with submergence coefficient considered As erosion continues
into the foundation breach widens laterally until the breaching is finished
Failure body
(a) (b)
hd
yc
α β
L1
L2
Fw
Fa
W
Fss Fcs
Fsb Fcb
Long-Term Behaviour and Environmentally Friendly Rehabilitation Technologies of Dams (LTBD 2017) DOI103217978-3-85125-564-5-007
55
4 CALCULATE RESULTS ANALYSIS
The following section analyzes the results of the breaching process of Banqiao reservoir dam failure
using the model above-mentioned The dam configurations reservoir characteristics and soil properties are shown
in Table 2 The calculated results of peak breach flow (Qp) breach top width (Bt) breach bottom width (Bb) time
to peak discharge (Tp) failure time (Tf) and measured data (Xu and Zhang 2009 Ru and Niu 2001) are shown
respectively in Table 3 Figures 9 and 10 also show the calculated breach flow hydrograph and the breach
development of Banqiao reservoir dam
Table 2- Conditions of Banqiao reservoir dam failure case
Parameter Value
Dam height (m) 245
Dam length (m) 500
Crest width (m) 8
US slope (VH) 0384
DS slope (VH) 05
Reservoir storage (m3) 608times108
Reservoir surface area (m2) As-h
Initial reservoir level (m) 26
Inflow (m3s) Qin-t
Base erosion (m) -504
kd (cm3N-s) 18
τc (Pa) 05
Clay core
Height (m) 23a
Crest width (m) 3a
US slope (VH) 4a
DS slope (VH) 4a
d50 (mm) 003a
p΄ 03
C (kPa) 30a
φ (deg) 266a
Clay ratio 04a
d90d30 10a
Dam shell
d50 (mm) 02
p΄ 035
C (kPa) 0
φ (deg) 20a
d90d30 20a
Note US=upstream slope=verticalhorizontal DS=downstream slope=verticalhorizontal aAssumed value
Table 3- Results of Banqiao reservoir dam failure case
Calculated results Measured data
Qp (m3s) Bt (m) Bb (m) Tp (h) Tf (h) Qp (m3s) Bt (m) Bb (m) Tp (h) Tf (h)
770851 4324 2864 172 303 78100 372 210 - 55
Note The calculated failure time is defined as the time period from the beginning of dam breaching to the moment when
99 of the final breach width is reached
Long-Term Behaviour and Environmentally Friendly Rehabilitation Technologies of Dams (LTBD 2017) DOI103217978-3-85125-564-5-007
56
Figure 9 Calculated breach flow discharge Figure 10 Breach width development
Based on the contrast table and the figures some conclusions can be drawn According to Figures 9 and
10 owing to the collapse of wave wall the overflow water head is about 15 m above the dam crest the breach
flow discharge increases immediately at the initial breaching period as well as the top and bottom breach widths
after 172 h the peak discharge occurs then the breach flow decreases and the breach width increases relatively
small until the end of breaching According to Table 3 the calculated peak breach flow is 770851 m3s which is
13 smaller than the measured data To the breach widths we can see that the breach top width and breach
bottom width is 162 and 364 larger than the measured data respectively When it comes to the failure time
the calculated data is 449 smaller than the measured one Overall the calculated peak discharge is in accordance
with the measured data in contrast the calculated breach widths are larger than measured data especially the
bottom breach width the possible reason is the drainage of reservoir sediment affects the development of breach
owing to the lacking of measured time to peak the contrast of this parameter is ignored with regard to failure
time the definitions of calculated and measured data are different the documentary record is the duration of whole
breaching process which differs to the calculated failure time From the above the numerical model can meet the
demands in calculating of Banqiao reservoir dam breaching process
5 CONCLUSION
A numerical model is proposed to calculate the Banqiao reservoir breaching process in this study
considering the erosion of different dam materials and the failure of clay core Based on the calculated results
the following conclusions can be drawn The clay core dam can be assumed as a composite dam with noncohesive
and cohesive materials a shear failure formula is adopted to calculate the time and height of failure clay core for
the dam with relatively small dam height and large reservoir storage base erosion should be considered if the
foundation is erodible Based on the contrast of calculated and measured results the proposed model can
reproduce good results and can be utilized for the breaching process of clay core dam due to overtopping failure
6 ACKNOWLEDGMENT
This writers acknowledge the support from the Natural Science Foundation of China (Grant No
51379129 51539006) and the Natural Science Foundation of Jiangsu Province (Grant No BK20161121)
0
10000
20000
30000
40000
50000
60000
70000
80000
0 1 2 3 4 5 6 7 8 9
Bre
ach
flo
w d
isch
arge (
m3s
)
Elapsed time (h)
0
100
200
300
400
500
0 1 2 3 4 5 6 7 8 9
Bre
ach w
idth
(m)
Elapsed time (h)
Breach top width
Breach bottom width
Long-Term Behaviour and Environmentally Friendly Rehabilitation Technologies of Dams (LTBD 2017) DOI103217978-3-85125-564-5-007
57
7 REFERENCES
1 Ministry of Water Resources P R China National Bureau of Statistics P R China (2013) ldquoBulletin of first
national census for waterrdquo China Waterpower Press China (in Chinese)
2 Dam Safety Management Center of the Ministry of Water Resources (2015) ldquoDam breach register book of
the national reservoirsrdquo Dam Safety Management Center of the Ministry of Water Resources China (in
Chinese)
3 Ru N and Niu Y (2001) ldquoEmbankment dam incidents and safety of large damsrdquo China Waterpower Press
China (in Chinese)
4 Chen S (2012) ldquoBreach mechanism and simulation of breach process for earth-rock damsrdquo China
Waterpower Press China (in Chinese)
5 Morris M W (2008) ldquoIMPACT Project field tests data analysisrdquo FLOODsite Rep T04-08-04 HR
Wallingford UK
6 Chen S Zhong Q and Cao W (2011) ldquoCentrifugal model test and numerical simulation of the breaching
process of clay core dams due to overtoppingrdquo Advances in Water Science 22(5) pp 674-679 (in Chinese)
7 Fread D L (1988) ldquoBREACH An erosion model for earthen dam failurerdquo National Oceanic and Atmospheric
Administration National Weather Service Silver Spring USA
8 Mohamed A A A Samuels P G Morris M W and Ghataora G S (2002) ldquoImproving the accuracy of
prediction of breach formation through embankment dams and flood embankmentsrdquo Proc Int Conf on Fluvial
Hydraulics (River Flow 2002) Louvain-la-Neuve Belgium
9 Morris M W (2011) ldquoBreaching of earth embankments and damsrdquo PhD thesis the Open University UK
10 Wu W (2013) ldquoSimplified physically based model of earthen embankment breachingrdquo Journal of Hydraulic
Engineering 139(8) pp 837-851
11 Singh V P (1996) ldquoDam breach modeling technologyrdquo Kluwer Academic Publishes Netherlands
12 Fread D L (1984) ldquoDAMBREAK The NWS dam break flood forecasting modelrdquo National Oceanic and
Atmospheric Administration National Weather Service Silver Spring USA
13 US Dept of Agriculture Natural Resources Conservation Service (USDA-NRCS) (1997) ldquoChapter 51
Earth spillway erosion modelrdquo Part 628 Dams National Engineering Handbook USA
14 Briaud J L Ting F C K Chen H C Cao Y Han S W and Kwak K W (2001) ldquoErosion function
apparatus for scour rate predictionrdquo Journal of Geotechnical and Geoenvironmental Engineering 127(2) pp
105-113
15 Hanson G J and Cook K R (2004) ldquoDetermination of material rate parameters for headcut migration of
compacted earthen materialsrdquo Proceedings of Dam Safety 2004 Association of State Dam Safety Officials
(ASDSO) Inc C D ROM USA
16 Wan C F and Fell R (2004) ldquoInvestigation of rate of erosion of soils in embankment damsrdquo Journal of
Geotechnical and Geoenvironmental Engineering 130(4) pp 373-380
17 Temple D M and Hanson G J (1994) ldquoHeadcut development in vegetated earth spillwaysrdquo Applied
Engineering in Agriculture 10(5) pp 677-682

Long-Term Behaviour and Environmentally Friendly Rehabilitation Technologies of Dams (LTBD 2017) DOI103217978-3-85125-564-5-007
51
The model tests show that the overtopping flow first erodes the downstream dam shell With the
increasing erosion of the downstream dam shell the downstream side of the core is gradually exposed and hollow
Under the co-action of the upstream water and soil pressures shear failure occurs in the core With the decrease
of water head the discharge through the breach gradually fall to zero
Since 1980s according to the soil erosion tests some mathematical model for core dam breaching are
put forward Among these models NWS BREACH model [7] HR BREACH model [8 9] DLBreach model [10]
and NHRI-CCOB model [6] are the representatives
It is worth mentioning that the subbase erosion of the dam is not considered in the core dam breaching
model tests at home and abroad Figure 3 shows the final breach of the Banqiao reservoir dam owing to the
erodible base and large reservoir storage and relative small dam height the base erosion depth is 504 m (see
Figure 4(a)) Meanwhile a scour hole which has a depth of 110 m is formed downstream then the hole is filled
with reservoir deposit (see Figure 4(b)) In order to simulate the clay core dam breaching process of Banqiao
reservoir a mathematical model is put forward the technical details are described in the following sections
Figure 3 Final breach of Banqiao reservoir dam
(a) vertical section (b) cross section
Figure 4 Breach sections of Banqiao reservoir
2 BREACHING PROCESS OF BANQIAO CLAY CORE DAM
Banqiao reservoir has a maximum storage of 492times108 m3 and a maximum dam height of 245 m as well
The length of the dam is 2020 m and the crest width is 6 m The dam crest and the wave wall elevations are
11634 m and 11764 m respectively
In August 1975 a heavy storm occurs in Henan When it comes to Banqiao reservoir there are two
inflow process the first inflow occurs during 1400 August 5th to 200 August 6th and the peak inflow is 7500
m3s the second inflow occurs during 1200 August 7th to 800 August 8th and the peak inflow is 13000 m3s
(see Figure 5)
maximum water level 11794 m
dam crest elevation 11634 m
Ele
vati
on (
m)
Distance (m)
90
0
100
110
120
100 200 300 400 -200 -100 0 100 200 300 400 500 600
80
90
Distance (m)
Ele
vat
ion (
m)
water level
mud surface
sand gravel surface
bed rock surface
Long-Term Behaviour and Environmentally Friendly Rehabilitation Technologies of Dams (LTBD 2017) DOI103217978-3-85125-564-5-007
52
Figure 5 Inflow and water level variation of Banqiao reservoir during ldquo758rdquo flood
3 NUMERICAL MODEL FOR BANQIAO CLAY CORE DAM BREACHING PROCESS
In this section a numerical model is proposed to simulate the breaching process of Banqiao clay core
dam Based on the model tests the breach mechanism of clay core dam due to overtopping failure is revealed
The breach is divided into two reaches at the early stage before the clay core is exposed (see Figure 6 ①-②)
Once the core is exposed the breach is divided into three reaches (see Figure 6 ③-⑥) then the clay core may
fail due to significant erosion in the lower shoulder reach After the core failure the breach is divided into two
reaches again (see Figure 6 ⑦-⑨) After the remaining material in the breach is washed out and the non-erodible
foundation is exposed the breach can still widen until the headwater is depleted or the tailwater is raised
Figure 6 The breaching process of clay core dam due to overtopping failure
Based on the mechanism of dam breach process described above a numerical model is put forward for
clay core dam breach due to overtopping failure The technical details are described as follows
The water balance in the reservoir can be described by
ss in b spill sluice
dzdVA Q Q Q Q
dt dt (1)
Where V=volume of water in the reservoir t=time As=surface area of reservoir zs=water surface elevation
Qin=inflow discharge Qb=breach flow Qspill=flow through spillways and Qsluice=flow through sluice gates
The reservoir geometric characteristics are represented by the surface area and water depth curve zs(h)
The curve is usually given as pair values of surface area and water depth in the reservoir
The overtopping flow at the breach is estimated using the broad-crested weir equation
15 25
1 2b smQ k c bh c mh (2)
Where b=bottom width of the breach h=zs-zb zb=elevation of breach bottom m=side slope (horizontalvertical)
of the breach c1=17 c2=13 [11] and ksm=submergence correction for tailwater effects on weir outflow ksm is
determined with the empirical relationship [11 12]
Two erosion formula are utilized to deal with the erosion of dam shell material and clay core material
respectively
For the dam shell material it is assumed to be a noncohesive material and the erosion is calculated using
the following formula which is put forward based on the steep channel model tests [6]
0
20
40
60
80
100
120
140
0
2000
4000
6000
8000
10000
12000
14000
16000
5-Aug 6-Aug 7-Aug 8-Aug 9-Aug
Wat
er l
evel
(m
)
Infl
ow
(m
3s
)
Time
Inflow
Water level
Failure plane
of the core
1
2
3
4
5
67
8
9
Long-Term Behaviour and Environmentally Friendly Rehabilitation Technologies of Dams (LTBD 2017) DOI103217978-3-85125-564-5-007
53
02 2 2
90
30
025 sec
1
b c
s b
d
w
v v vdQ B
dg
(3)
Where Qs=erosion volume d90=particle size for which 90 percent is finer by weight d30=particle size for which
30 percent is finer by weight Bb=width of breach bottom θ=downstream slope angle v=friction velocity vb=flow
velocity at breach bottom vc=incipient velocity of dam material γd= specific gravity of soil in this paper it is
assumed to be 265times98kNm3 and γw=specific gravity of water in this paper it is assumed to be 98kNm3
The erosion rate of dam shell material can be calculated as follows
1 b sdV dQp
dt dt (4)
Where pʹ=porosity of dam shell material and dVbdt=erosion rate of dam shell material
It is assumed that the breach slope angle is equal to the internal friction angle the relationship between
horizontal expansion and vertical undercutting is determined by (see Figure 7)
1oc
1sin
bn zb
(5)
Where Δb=horizontal expansion value at each time step Δzb=vertical undercutting value at each time step
nloc=indicator of breach location (nloc=1 for one-sided breach and 2 for breach located at the middle of dam length)
and φ1=internal friction of dam shell material
Figure 7 Breach development of dam shell
When it comes to the clay core the erosion at the breach top flat section is computed using the following
excess shear detachment rate relation [13]
d e c
dzk
dt (6)
Where dzdt=erosion rate kd=erosion coefficient τe=bed shear stress and τc=critical stress required to initiate
detachment for the material determined using Shields diagram
The coefficient kd usually needs to be measured [14-16] or utilizes the empirical formula [17] 31
0406566exp 0121 w d
d
d w
k c
(7)
Where c=clay ratio
The bed shear stress is determined by using the Manning equation 2 2
1
2 3
w be
gn Q
A R
(8)
Where ρw=water density A=flow area R=hydraulic radius The Mannings n is relate to sediment median size d50
(m) by 1
650
n
dn
A (9)
Where An is an empirical coefficient In this model An=12 for the field cases [10]
Bb
Δzb
φ1
Δb Δb
Long-Term Behaviour and Environmentally Friendly Rehabilitation Technologies of Dams (LTBD 2017) DOI103217978-3-85125-564-5-007
54
The width change of the breach can be assumed as follows
1oc bb n z (10)
With the erosion of dam shell and clay core the downstream side of the core is gradually exposed and
hollow Under the co-action of the upstream water and soil pressures shear failure occurs in the core (see Figure
8(a)) The stress state of the failure clay core is shown in Figure 8(b)
Figure 8 Shear failure of clay core
As shown in Fig 9 the critical condition of clay core failure can be expressed as
a w sb ss cb csF F F F FF (11)
In which
2 1 11 105 tan 45 2 tan 45
2 2a b c cF B y y c
(12)
2
05w w b c dF B y h (13)
2tansb WF (14)
2
2 2 2tanss cF y KL (15)
2 2cb bF C B L (16)
2 1 2cs cF C y L L (17)
12 cotb t cB B y (18)
2
2
1 sin
1 sinK
(19)
2 1 2 cotcL L y (20)
2 1 205 b cW L L B y (21)
Where Fa=active earth pressure of the dam materials upstream the clay core Fw=water pressure
Fsb=friction along the bottom of failure plane Fss=friction along the two sides of failure plane Fcb=cohesion along
the bottom of failure plane Fcs=cohesion along the two sides of failure plane hd=the water head above the dam
crest yc=the height between dam crest to failure plane of clay core K=coefficient of static earth pressure Bt=
breach top width Bb=breach width at the failure plane L1=top width of clay core L2=width of failure palne
W=clay core weight above failure plane γ1=dry specific gravity of dam shell material γ2=dry specific gravity of
clay core material C1=cohesion of dam shell material C2=cohesion of clay core material α=slope angle of dam
upstream β=slope angle of clay core upstream φ1=internal friction angle of dam shell material φ2=internal
friction angle of clay core material
In the case of erodible foundation the model allows erosion into the foundation The breach is assumed
to have a flat horizontal bottom surface and can lower to a value predefined according to the foundation material
properties but the base erosion does not affect the upstream water volume and downstream channel flow The
breach flow discharge is determined using Eq (2) with submergence coefficient considered As erosion continues
into the foundation breach widens laterally until the breaching is finished
Failure body
(a) (b)
hd
yc
α β
L1
L2
Fw
Fa
W
Fss Fcs
Fsb Fcb
Long-Term Behaviour and Environmentally Friendly Rehabilitation Technologies of Dams (LTBD 2017) DOI103217978-3-85125-564-5-007
55
4 CALCULATE RESULTS ANALYSIS
The following section analyzes the results of the breaching process of Banqiao reservoir dam failure
using the model above-mentioned The dam configurations reservoir characteristics and soil properties are shown
in Table 2 The calculated results of peak breach flow (Qp) breach top width (Bt) breach bottom width (Bb) time
to peak discharge (Tp) failure time (Tf) and measured data (Xu and Zhang 2009 Ru and Niu 2001) are shown
respectively in Table 3 Figures 9 and 10 also show the calculated breach flow hydrograph and the breach
development of Banqiao reservoir dam
Table 2- Conditions of Banqiao reservoir dam failure case
Parameter Value
Dam height (m) 245
Dam length (m) 500
Crest width (m) 8
US slope (VH) 0384
DS slope (VH) 05
Reservoir storage (m3) 608times108
Reservoir surface area (m2) As-h
Initial reservoir level (m) 26
Inflow (m3s) Qin-t
Base erosion (m) -504
kd (cm3N-s) 18
τc (Pa) 05
Clay core
Height (m) 23a
Crest width (m) 3a
US slope (VH) 4a
DS slope (VH) 4a
d50 (mm) 003a
p΄ 03
C (kPa) 30a
φ (deg) 266a
Clay ratio 04a
d90d30 10a
Dam shell
d50 (mm) 02
p΄ 035
C (kPa) 0
φ (deg) 20a
d90d30 20a
Note US=upstream slope=verticalhorizontal DS=downstream slope=verticalhorizontal aAssumed value
Table 3- Results of Banqiao reservoir dam failure case
Calculated results Measured data
Qp (m3s) Bt (m) Bb (m) Tp (h) Tf (h) Qp (m3s) Bt (m) Bb (m) Tp (h) Tf (h)
770851 4324 2864 172 303 78100 372 210 - 55
Note The calculated failure time is defined as the time period from the beginning of dam breaching to the moment when
99 of the final breach width is reached
Long-Term Behaviour and Environmentally Friendly Rehabilitation Technologies of Dams (LTBD 2017) DOI103217978-3-85125-564-5-007
56
Figure 9 Calculated breach flow discharge Figure 10 Breach width development
Based on the contrast table and the figures some conclusions can be drawn According to Figures 9 and
10 owing to the collapse of wave wall the overflow water head is about 15 m above the dam crest the breach
flow discharge increases immediately at the initial breaching period as well as the top and bottom breach widths
after 172 h the peak discharge occurs then the breach flow decreases and the breach width increases relatively
small until the end of breaching According to Table 3 the calculated peak breach flow is 770851 m3s which is
13 smaller than the measured data To the breach widths we can see that the breach top width and breach
bottom width is 162 and 364 larger than the measured data respectively When it comes to the failure time
the calculated data is 449 smaller than the measured one Overall the calculated peak discharge is in accordance
with the measured data in contrast the calculated breach widths are larger than measured data especially the
bottom breach width the possible reason is the drainage of reservoir sediment affects the development of breach
owing to the lacking of measured time to peak the contrast of this parameter is ignored with regard to failure
time the definitions of calculated and measured data are different the documentary record is the duration of whole
breaching process which differs to the calculated failure time From the above the numerical model can meet the
demands in calculating of Banqiao reservoir dam breaching process
5 CONCLUSION
A numerical model is proposed to calculate the Banqiao reservoir breaching process in this study
considering the erosion of different dam materials and the failure of clay core Based on the calculated results
the following conclusions can be drawn The clay core dam can be assumed as a composite dam with noncohesive
and cohesive materials a shear failure formula is adopted to calculate the time and height of failure clay core for
the dam with relatively small dam height and large reservoir storage base erosion should be considered if the
foundation is erodible Based on the contrast of calculated and measured results the proposed model can
reproduce good results and can be utilized for the breaching process of clay core dam due to overtopping failure
6 ACKNOWLEDGMENT
This writers acknowledge the support from the Natural Science Foundation of China (Grant No
51379129 51539006) and the Natural Science Foundation of Jiangsu Province (Grant No BK20161121)
0
10000
20000
30000
40000
50000
60000
70000
80000
0 1 2 3 4 5 6 7 8 9
Bre
ach
flo
w d
isch
arge (
m3s
)
Elapsed time (h)
0
100
200
300
400
500
0 1 2 3 4 5 6 7 8 9
Bre
ach w
idth
(m)
Elapsed time (h)
Breach top width
Breach bottom width
Long-Term Behaviour and Environmentally Friendly Rehabilitation Technologies of Dams (LTBD 2017) DOI103217978-3-85125-564-5-007
57
7 REFERENCES
1 Ministry of Water Resources P R China National Bureau of Statistics P R China (2013) ldquoBulletin of first
national census for waterrdquo China Waterpower Press China (in Chinese)
2 Dam Safety Management Center of the Ministry of Water Resources (2015) ldquoDam breach register book of
the national reservoirsrdquo Dam Safety Management Center of the Ministry of Water Resources China (in
Chinese)
3 Ru N and Niu Y (2001) ldquoEmbankment dam incidents and safety of large damsrdquo China Waterpower Press
China (in Chinese)
4 Chen S (2012) ldquoBreach mechanism and simulation of breach process for earth-rock damsrdquo China
Waterpower Press China (in Chinese)
5 Morris M W (2008) ldquoIMPACT Project field tests data analysisrdquo FLOODsite Rep T04-08-04 HR
Wallingford UK
6 Chen S Zhong Q and Cao W (2011) ldquoCentrifugal model test and numerical simulation of the breaching
process of clay core dams due to overtoppingrdquo Advances in Water Science 22(5) pp 674-679 (in Chinese)
7 Fread D L (1988) ldquoBREACH An erosion model for earthen dam failurerdquo National Oceanic and Atmospheric
Administration National Weather Service Silver Spring USA
8 Mohamed A A A Samuels P G Morris M W and Ghataora G S (2002) ldquoImproving the accuracy of
prediction of breach formation through embankment dams and flood embankmentsrdquo Proc Int Conf on Fluvial
Hydraulics (River Flow 2002) Louvain-la-Neuve Belgium
9 Morris M W (2011) ldquoBreaching of earth embankments and damsrdquo PhD thesis the Open University UK
10 Wu W (2013) ldquoSimplified physically based model of earthen embankment breachingrdquo Journal of Hydraulic
Engineering 139(8) pp 837-851
11 Singh V P (1996) ldquoDam breach modeling technologyrdquo Kluwer Academic Publishes Netherlands
12 Fread D L (1984) ldquoDAMBREAK The NWS dam break flood forecasting modelrdquo National Oceanic and
Atmospheric Administration National Weather Service Silver Spring USA
13 US Dept of Agriculture Natural Resources Conservation Service (USDA-NRCS) (1997) ldquoChapter 51
Earth spillway erosion modelrdquo Part 628 Dams National Engineering Handbook USA
14 Briaud J L Ting F C K Chen H C Cao Y Han S W and Kwak K W (2001) ldquoErosion function
apparatus for scour rate predictionrdquo Journal of Geotechnical and Geoenvironmental Engineering 127(2) pp
105-113
15 Hanson G J and Cook K R (2004) ldquoDetermination of material rate parameters for headcut migration of
compacted earthen materialsrdquo Proceedings of Dam Safety 2004 Association of State Dam Safety Officials
(ASDSO) Inc C D ROM USA
16 Wan C F and Fell R (2004) ldquoInvestigation of rate of erosion of soils in embankment damsrdquo Journal of
Geotechnical and Geoenvironmental Engineering 130(4) pp 373-380
17 Temple D M and Hanson G J (1994) ldquoHeadcut development in vegetated earth spillwaysrdquo Applied
Engineering in Agriculture 10(5) pp 677-682
Long-Term Behaviour and Environmentally Friendly Rehabilitation Technologies of Dams (LTBD 2017) DOI103217978-3-85125-564-5-007
53
02 2 2
90
30
025 sec
1
b c
s b
d
w
v v vdQ B
dg
(3)
Where Qs=erosion volume d90=particle size for which 90 percent is finer by weight d30=particle size for which
30 percent is finer by weight Bb=width of breach bottom θ=downstream slope angle v=friction velocity vb=flow
velocity at breach bottom vc=incipient velocity of dam material γd= specific gravity of soil in this paper it is
assumed to be 265times98kNm3 and γw=specific gravity of water in this paper it is assumed to be 98kNm3
The erosion rate of dam shell material can be calculated as follows
1 b sdV dQp
dt dt (4)
Where pʹ=porosity of dam shell material and dVbdt=erosion rate of dam shell material
It is assumed that the breach slope angle is equal to the internal friction angle the relationship between
horizontal expansion and vertical undercutting is determined by (see Figure 7)
1oc
1sin
bn zb
(5)
Where Δb=horizontal expansion value at each time step Δzb=vertical undercutting value at each time step
nloc=indicator of breach location (nloc=1 for one-sided breach and 2 for breach located at the middle of dam length)
and φ1=internal friction of dam shell material
Figure 7 Breach development of dam shell
When it comes to the clay core the erosion at the breach top flat section is computed using the following
excess shear detachment rate relation [13]
d e c
dzk
dt (6)
Where dzdt=erosion rate kd=erosion coefficient τe=bed shear stress and τc=critical stress required to initiate
detachment for the material determined using Shields diagram
The coefficient kd usually needs to be measured [14-16] or utilizes the empirical formula [17] 31
0406566exp 0121 w d
d
d w
k c
(7)
Where c=clay ratio
The bed shear stress is determined by using the Manning equation 2 2
1
2 3
w be
gn Q
A R
(8)
Where ρw=water density A=flow area R=hydraulic radius The Mannings n is relate to sediment median size d50
(m) by 1
650
n
dn
A (9)
Where An is an empirical coefficient In this model An=12 for the field cases [10]
Bb
Δzb
φ1
Δb Δb
Long-Term Behaviour and Environmentally Friendly Rehabilitation Technologies of Dams (LTBD 2017) DOI103217978-3-85125-564-5-007
54
The width change of the breach can be assumed as follows
1oc bb n z (10)
With the erosion of dam shell and clay core the downstream side of the core is gradually exposed and
hollow Under the co-action of the upstream water and soil pressures shear failure occurs in the core (see Figure
8(a)) The stress state of the failure clay core is shown in Figure 8(b)
Figure 8 Shear failure of clay core
As shown in Fig 9 the critical condition of clay core failure can be expressed as
a w sb ss cb csF F F F FF (11)
In which
2 1 11 105 tan 45 2 tan 45
2 2a b c cF B y y c
(12)
2
05w w b c dF B y h (13)
2tansb WF (14)
2
2 2 2tanss cF y KL (15)
2 2cb bF C B L (16)
2 1 2cs cF C y L L (17)
12 cotb t cB B y (18)
2
2
1 sin
1 sinK
(19)
2 1 2 cotcL L y (20)
2 1 205 b cW L L B y (21)
Where Fa=active earth pressure of the dam materials upstream the clay core Fw=water pressure
Fsb=friction along the bottom of failure plane Fss=friction along the two sides of failure plane Fcb=cohesion along
the bottom of failure plane Fcs=cohesion along the two sides of failure plane hd=the water head above the dam
crest yc=the height between dam crest to failure plane of clay core K=coefficient of static earth pressure Bt=
breach top width Bb=breach width at the failure plane L1=top width of clay core L2=width of failure palne
W=clay core weight above failure plane γ1=dry specific gravity of dam shell material γ2=dry specific gravity of
clay core material C1=cohesion of dam shell material C2=cohesion of clay core material α=slope angle of dam
upstream β=slope angle of clay core upstream φ1=internal friction angle of dam shell material φ2=internal
friction angle of clay core material
In the case of erodible foundation the model allows erosion into the foundation The breach is assumed
to have a flat horizontal bottom surface and can lower to a value predefined according to the foundation material
properties but the base erosion does not affect the upstream water volume and downstream channel flow The
breach flow discharge is determined using Eq (2) with submergence coefficient considered As erosion continues
into the foundation breach widens laterally until the breaching is finished
Failure body
(a) (b)
hd
yc
α β
L1
L2
Fw
Fa
W
Fss Fcs
Fsb Fcb
Long-Term Behaviour and Environmentally Friendly Rehabilitation Technologies of Dams (LTBD 2017) DOI103217978-3-85125-564-5-007
55
4 CALCULATE RESULTS ANALYSIS
The following section analyzes the results of the breaching process of Banqiao reservoir dam failure
using the model above-mentioned The dam configurations reservoir characteristics and soil properties are shown
in Table 2 The calculated results of peak breach flow (Qp) breach top width (Bt) breach bottom width (Bb) time
to peak discharge (Tp) failure time (Tf) and measured data (Xu and Zhang 2009 Ru and Niu 2001) are shown
respectively in Table 3 Figures 9 and 10 also show the calculated breach flow hydrograph and the breach
development of Banqiao reservoir dam
Table 2- Conditions of Banqiao reservoir dam failure case
Parameter Value
Dam height (m) 245
Dam length (m) 500
Crest width (m) 8
US slope (VH) 0384
DS slope (VH) 05
Reservoir storage (m3) 608times108
Reservoir surface area (m2) As-h
Initial reservoir level (m) 26
Inflow (m3s) Qin-t
Base erosion (m) -504
kd (cm3N-s) 18
τc (Pa) 05
Clay core
Height (m) 23a
Crest width (m) 3a
US slope (VH) 4a
DS slope (VH) 4a
d50 (mm) 003a
p΄ 03
C (kPa) 30a
φ (deg) 266a
Clay ratio 04a
d90d30 10a
Dam shell
d50 (mm) 02
p΄ 035
C (kPa) 0
φ (deg) 20a
d90d30 20a
Note US=upstream slope=verticalhorizontal DS=downstream slope=verticalhorizontal aAssumed value
Table 3- Results of Banqiao reservoir dam failure case
Calculated results Measured data
Qp (m3s) Bt (m) Bb (m) Tp (h) Tf (h) Qp (m3s) Bt (m) Bb (m) Tp (h) Tf (h)
770851 4324 2864 172 303 78100 372 210 - 55
Note The calculated failure time is defined as the time period from the beginning of dam breaching to the moment when
99 of the final breach width is reached
Long-Term Behaviour and Environmentally Friendly Rehabilitation Technologies of Dams (LTBD 2017) DOI103217978-3-85125-564-5-007
56
Figure 9 Calculated breach flow discharge Figure 10 Breach width development
Based on the contrast table and the figures some conclusions can be drawn According to Figures 9 and
10 owing to the collapse of wave wall the overflow water head is about 15 m above the dam crest the breach
flow discharge increases immediately at the initial breaching period as well as the top and bottom breach widths
after 172 h the peak discharge occurs then the breach flow decreases and the breach width increases relatively
small until the end of breaching According to Table 3 the calculated peak breach flow is 770851 m3s which is
13 smaller than the measured data To the breach widths we can see that the breach top width and breach
bottom width is 162 and 364 larger than the measured data respectively When it comes to the failure time
the calculated data is 449 smaller than the measured one Overall the calculated peak discharge is in accordance
with the measured data in contrast the calculated breach widths are larger than measured data especially the
bottom breach width the possible reason is the drainage of reservoir sediment affects the development of breach
owing to the lacking of measured time to peak the contrast of this parameter is ignored with regard to failure
time the definitions of calculated and measured data are different the documentary record is the duration of whole
breaching process which differs to the calculated failure time From the above the numerical model can meet the
demands in calculating of Banqiao reservoir dam breaching process
5 CONCLUSION
A numerical model is proposed to calculate the Banqiao reservoir breaching process in this study
considering the erosion of different dam materials and the failure of clay core Based on the calculated results
the following conclusions can be drawn The clay core dam can be assumed as a composite dam with noncohesive
and cohesive materials a shear failure formula is adopted to calculate the time and height of failure clay core for
the dam with relatively small dam height and large reservoir storage base erosion should be considered if the
foundation is erodible Based on the contrast of calculated and measured results the proposed model can
reproduce good results and can be utilized for the breaching process of clay core dam due to overtopping failure
6 ACKNOWLEDGMENT
This writers acknowledge the support from the Natural Science Foundation of China (Grant No
51379129 51539006) and the Natural Science Foundation of Jiangsu Province (Grant No BK20161121)
0
10000
20000
30000
40000
50000
60000
70000
80000
0 1 2 3 4 5 6 7 8 9
Bre
ach
flo
w d
isch
arge (
m3s
)
Elapsed time (h)
0
100
200
300
400
500
0 1 2 3 4 5 6 7 8 9
Bre
ach w
idth
(m)
Elapsed time (h)
Breach top width
Breach bottom width
Long-Term Behaviour and Environmentally Friendly Rehabilitation Technologies of Dams (LTBD 2017) DOI103217978-3-85125-564-5-007
57
7 REFERENCES
1 Ministry of Water Resources P R China National Bureau of Statistics P R China (2013) ldquoBulletin of first
national census for waterrdquo China Waterpower Press China (in Chinese)
2 Dam Safety Management Center of the Ministry of Water Resources (2015) ldquoDam breach register book of
the national reservoirsrdquo Dam Safety Management Center of the Ministry of Water Resources China (in
Chinese)
3 Ru N and Niu Y (2001) ldquoEmbankment dam incidents and safety of large damsrdquo China Waterpower Press
China (in Chinese)
4 Chen S (2012) ldquoBreach mechanism and simulation of breach process for earth-rock damsrdquo China
Waterpower Press China (in Chinese)
5 Morris M W (2008) ldquoIMPACT Project field tests data analysisrdquo FLOODsite Rep T04-08-04 HR
Wallingford UK
6 Chen S Zhong Q and Cao W (2011) ldquoCentrifugal model test and numerical simulation of the breaching
process of clay core dams due to overtoppingrdquo Advances in Water Science 22(5) pp 674-679 (in Chinese)
7 Fread D L (1988) ldquoBREACH An erosion model for earthen dam failurerdquo National Oceanic and Atmospheric
Administration National Weather Service Silver Spring USA
8 Mohamed A A A Samuels P G Morris M W and Ghataora G S (2002) ldquoImproving the accuracy of
prediction of breach formation through embankment dams and flood embankmentsrdquo Proc Int Conf on Fluvial
Hydraulics (River Flow 2002) Louvain-la-Neuve Belgium
9 Morris M W (2011) ldquoBreaching of earth embankments and damsrdquo PhD thesis the Open University UK
10 Wu W (2013) ldquoSimplified physically based model of earthen embankment breachingrdquo Journal of Hydraulic
Engineering 139(8) pp 837-851
11 Singh V P (1996) ldquoDam breach modeling technologyrdquo Kluwer Academic Publishes Netherlands
12 Fread D L (1984) ldquoDAMBREAK The NWS dam break flood forecasting modelrdquo National Oceanic and
Atmospheric Administration National Weather Service Silver Spring USA
13 US Dept of Agriculture Natural Resources Conservation Service (USDA-NRCS) (1997) ldquoChapter 51
Earth spillway erosion modelrdquo Part 628 Dams National Engineering Handbook USA
14 Briaud J L Ting F C K Chen H C Cao Y Han S W and Kwak K W (2001) ldquoErosion function
apparatus for scour rate predictionrdquo Journal of Geotechnical and Geoenvironmental Engineering 127(2) pp
105-113
15 Hanson G J and Cook K R (2004) ldquoDetermination of material rate parameters for headcut migration of
compacted earthen materialsrdquo Proceedings of Dam Safety 2004 Association of State Dam Safety Officials
(ASDSO) Inc C D ROM USA
16 Wan C F and Fell R (2004) ldquoInvestigation of rate of erosion of soils in embankment damsrdquo Journal of
Geotechnical and Geoenvironmental Engineering 130(4) pp 373-380
17 Temple D M and Hanson G J (1994) ldquoHeadcut development in vegetated earth spillwaysrdquo Applied
Engineering in Agriculture 10(5) pp 677-682

Long-Term Behaviour and Environmentally Friendly Rehabilitation Technologies of Dams (LTBD 2017) DOI103217978-3-85125-564-5-007
54
The width change of the breach can be assumed as follows
1oc bb n z (10)
With the erosion of dam shell and clay core the downstream side of the core is gradually exposed and
hollow Under the co-action of the upstream water and soil pressures shear failure occurs in the core (see Figure
8(a)) The stress state of the failure clay core is shown in Figure 8(b)
Figure 8 Shear failure of clay core
As shown in Fig 9 the critical condition of clay core failure can be expressed as
a w sb ss cb csF F F F FF (11)
In which
2 1 11 105 tan 45 2 tan 45
2 2a b c cF B y y c
(12)
2
05w w b c dF B y h (13)
2tansb WF (14)
2
2 2 2tanss cF y KL (15)
2 2cb bF C B L (16)
2 1 2cs cF C y L L (17)
12 cotb t cB B y (18)
2
2
1 sin
1 sinK
(19)
2 1 2 cotcL L y (20)
2 1 205 b cW L L B y (21)
Where Fa=active earth pressure of the dam materials upstream the clay core Fw=water pressure
Fsb=friction along the bottom of failure plane Fss=friction along the two sides of failure plane Fcb=cohesion along
the bottom of failure plane Fcs=cohesion along the two sides of failure plane hd=the water head above the dam
crest yc=the height between dam crest to failure plane of clay core K=coefficient of static earth pressure Bt=
breach top width Bb=breach width at the failure plane L1=top width of clay core L2=width of failure palne
W=clay core weight above failure plane γ1=dry specific gravity of dam shell material γ2=dry specific gravity of
clay core material C1=cohesion of dam shell material C2=cohesion of clay core material α=slope angle of dam
upstream β=slope angle of clay core upstream φ1=internal friction angle of dam shell material φ2=internal
friction angle of clay core material
In the case of erodible foundation the model allows erosion into the foundation The breach is assumed
to have a flat horizontal bottom surface and can lower to a value predefined according to the foundation material
properties but the base erosion does not affect the upstream water volume and downstream channel flow The
breach flow discharge is determined using Eq (2) with submergence coefficient considered As erosion continues
into the foundation breach widens laterally until the breaching is finished
Failure body
(a) (b)
hd
yc
α β
L1
L2
Fw
Fa
W
Fss Fcs
Fsb Fcb
Long-Term Behaviour and Environmentally Friendly Rehabilitation Technologies of Dams (LTBD 2017) DOI103217978-3-85125-564-5-007
55
4 CALCULATE RESULTS ANALYSIS
The following section analyzes the results of the breaching process of Banqiao reservoir dam failure
using the model above-mentioned The dam configurations reservoir characteristics and soil properties are shown
in Table 2 The calculated results of peak breach flow (Qp) breach top width (Bt) breach bottom width (Bb) time
to peak discharge (Tp) failure time (Tf) and measured data (Xu and Zhang 2009 Ru and Niu 2001) are shown
respectively in Table 3 Figures 9 and 10 also show the calculated breach flow hydrograph and the breach
development of Banqiao reservoir dam
Table 2- Conditions of Banqiao reservoir dam failure case
Parameter Value
Dam height (m) 245
Dam length (m) 500
Crest width (m) 8
US slope (VH) 0384
DS slope (VH) 05
Reservoir storage (m3) 608times108
Reservoir surface area (m2) As-h
Initial reservoir level (m) 26
Inflow (m3s) Qin-t
Base erosion (m) -504
kd (cm3N-s) 18
τc (Pa) 05
Clay core
Height (m) 23a
Crest width (m) 3a
US slope (VH) 4a
DS slope (VH) 4a
d50 (mm) 003a
p΄ 03
C (kPa) 30a
φ (deg) 266a
Clay ratio 04a
d90d30 10a
Dam shell
d50 (mm) 02
p΄ 035
C (kPa) 0
φ (deg) 20a
d90d30 20a
Note US=upstream slope=verticalhorizontal DS=downstream slope=verticalhorizontal aAssumed value
Table 3- Results of Banqiao reservoir dam failure case
Calculated results Measured data
Qp (m3s) Bt (m) Bb (m) Tp (h) Tf (h) Qp (m3s) Bt (m) Bb (m) Tp (h) Tf (h)
770851 4324 2864 172 303 78100 372 210 - 55
Note The calculated failure time is defined as the time period from the beginning of dam breaching to the moment when
99 of the final breach width is reached
Long-Term Behaviour and Environmentally Friendly Rehabilitation Technologies of Dams (LTBD 2017) DOI103217978-3-85125-564-5-007
56
Figure 9 Calculated breach flow discharge Figure 10 Breach width development
Based on the contrast table and the figures some conclusions can be drawn According to Figures 9 and
10 owing to the collapse of wave wall the overflow water head is about 15 m above the dam crest the breach
flow discharge increases immediately at the initial breaching period as well as the top and bottom breach widths
after 172 h the peak discharge occurs then the breach flow decreases and the breach width increases relatively
small until the end of breaching According to Table 3 the calculated peak breach flow is 770851 m3s which is
13 smaller than the measured data To the breach widths we can see that the breach top width and breach
bottom width is 162 and 364 larger than the measured data respectively When it comes to the failure time
the calculated data is 449 smaller than the measured one Overall the calculated peak discharge is in accordance
with the measured data in contrast the calculated breach widths are larger than measured data especially the
bottom breach width the possible reason is the drainage of reservoir sediment affects the development of breach
owing to the lacking of measured time to peak the contrast of this parameter is ignored with regard to failure
time the definitions of calculated and measured data are different the documentary record is the duration of whole
breaching process which differs to the calculated failure time From the above the numerical model can meet the
demands in calculating of Banqiao reservoir dam breaching process
5 CONCLUSION
A numerical model is proposed to calculate the Banqiao reservoir breaching process in this study
considering the erosion of different dam materials and the failure of clay core Based on the calculated results
the following conclusions can be drawn The clay core dam can be assumed as a composite dam with noncohesive
and cohesive materials a shear failure formula is adopted to calculate the time and height of failure clay core for
the dam with relatively small dam height and large reservoir storage base erosion should be considered if the
foundation is erodible Based on the contrast of calculated and measured results the proposed model can
reproduce good results and can be utilized for the breaching process of clay core dam due to overtopping failure
6 ACKNOWLEDGMENT
This writers acknowledge the support from the Natural Science Foundation of China (Grant No
51379129 51539006) and the Natural Science Foundation of Jiangsu Province (Grant No BK20161121)
0
10000
20000
30000
40000
50000
60000
70000
80000
0 1 2 3 4 5 6 7 8 9
Bre
ach
flo
w d
isch
arge (
m3s
)
Elapsed time (h)
0
100
200
300
400
500
0 1 2 3 4 5 6 7 8 9
Bre
ach w
idth
(m)
Elapsed time (h)
Breach top width
Breach bottom width
Long-Term Behaviour and Environmentally Friendly Rehabilitation Technologies of Dams (LTBD 2017) DOI103217978-3-85125-564-5-007
57
7 REFERENCES
1 Ministry of Water Resources P R China National Bureau of Statistics P R China (2013) ldquoBulletin of first
national census for waterrdquo China Waterpower Press China (in Chinese)
2 Dam Safety Management Center of the Ministry of Water Resources (2015) ldquoDam breach register book of
the national reservoirsrdquo Dam Safety Management Center of the Ministry of Water Resources China (in
Chinese)
3 Ru N and Niu Y (2001) ldquoEmbankment dam incidents and safety of large damsrdquo China Waterpower Press
China (in Chinese)
4 Chen S (2012) ldquoBreach mechanism and simulation of breach process for earth-rock damsrdquo China
Waterpower Press China (in Chinese)
5 Morris M W (2008) ldquoIMPACT Project field tests data analysisrdquo FLOODsite Rep T04-08-04 HR
Wallingford UK
6 Chen S Zhong Q and Cao W (2011) ldquoCentrifugal model test and numerical simulation of the breaching
process of clay core dams due to overtoppingrdquo Advances in Water Science 22(5) pp 674-679 (in Chinese)
7 Fread D L (1988) ldquoBREACH An erosion model for earthen dam failurerdquo National Oceanic and Atmospheric
Administration National Weather Service Silver Spring USA
8 Mohamed A A A Samuels P G Morris M W and Ghataora G S (2002) ldquoImproving the accuracy of
prediction of breach formation through embankment dams and flood embankmentsrdquo Proc Int Conf on Fluvial
Hydraulics (River Flow 2002) Louvain-la-Neuve Belgium
9 Morris M W (2011) ldquoBreaching of earth embankments and damsrdquo PhD thesis the Open University UK
10 Wu W (2013) ldquoSimplified physically based model of earthen embankment breachingrdquo Journal of Hydraulic
Engineering 139(8) pp 837-851
11 Singh V P (1996) ldquoDam breach modeling technologyrdquo Kluwer Academic Publishes Netherlands
12 Fread D L (1984) ldquoDAMBREAK The NWS dam break flood forecasting modelrdquo National Oceanic and
Atmospheric Administration National Weather Service Silver Spring USA
13 US Dept of Agriculture Natural Resources Conservation Service (USDA-NRCS) (1997) ldquoChapter 51
Earth spillway erosion modelrdquo Part 628 Dams National Engineering Handbook USA
14 Briaud J L Ting F C K Chen H C Cao Y Han S W and Kwak K W (2001) ldquoErosion function
apparatus for scour rate predictionrdquo Journal of Geotechnical and Geoenvironmental Engineering 127(2) pp
105-113
15 Hanson G J and Cook K R (2004) ldquoDetermination of material rate parameters for headcut migration of
compacted earthen materialsrdquo Proceedings of Dam Safety 2004 Association of State Dam Safety Officials
(ASDSO) Inc C D ROM USA
16 Wan C F and Fell R (2004) ldquoInvestigation of rate of erosion of soils in embankment damsrdquo Journal of
Geotechnical and Geoenvironmental Engineering 130(4) pp 373-380
17 Temple D M and Hanson G J (1994) ldquoHeadcut development in vegetated earth spillwaysrdquo Applied
Engineering in Agriculture 10(5) pp 677-682
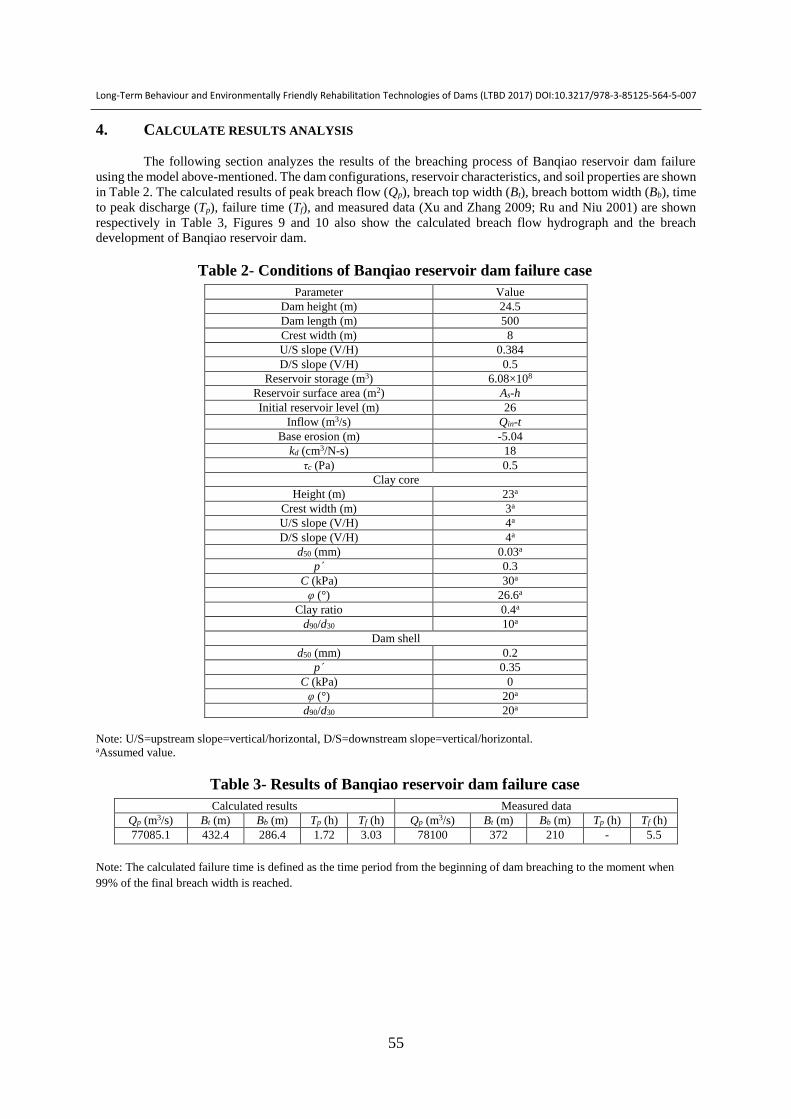
Long-Term Behaviour and Environmentally Friendly Rehabilitation Technologies of Dams (LTBD 2017) DOI103217978-3-85125-564-5-007
55
4 CALCULATE RESULTS ANALYSIS
The following section analyzes the results of the breaching process of Banqiao reservoir dam failure
using the model above-mentioned The dam configurations reservoir characteristics and soil properties are shown
in Table 2 The calculated results of peak breach flow (Qp) breach top width (Bt) breach bottom width (Bb) time
to peak discharge (Tp) failure time (Tf) and measured data (Xu and Zhang 2009 Ru and Niu 2001) are shown
respectively in Table 3 Figures 9 and 10 also show the calculated breach flow hydrograph and the breach
development of Banqiao reservoir dam
Table 2- Conditions of Banqiao reservoir dam failure case
Parameter Value
Dam height (m) 245
Dam length (m) 500
Crest width (m) 8
US slope (VH) 0384
DS slope (VH) 05
Reservoir storage (m3) 608times108
Reservoir surface area (m2) As-h
Initial reservoir level (m) 26
Inflow (m3s) Qin-t
Base erosion (m) -504
kd (cm3N-s) 18
τc (Pa) 05
Clay core
Height (m) 23a
Crest width (m) 3a
US slope (VH) 4a
DS slope (VH) 4a
d50 (mm) 003a
p΄ 03
C (kPa) 30a
φ (deg) 266a
Clay ratio 04a
d90d30 10a
Dam shell
d50 (mm) 02
p΄ 035
C (kPa) 0
φ (deg) 20a
d90d30 20a
Note US=upstream slope=verticalhorizontal DS=downstream slope=verticalhorizontal aAssumed value
Table 3- Results of Banqiao reservoir dam failure case
Calculated results Measured data
Qp (m3s) Bt (m) Bb (m) Tp (h) Tf (h) Qp (m3s) Bt (m) Bb (m) Tp (h) Tf (h)
770851 4324 2864 172 303 78100 372 210 - 55
Note The calculated failure time is defined as the time period from the beginning of dam breaching to the moment when
99 of the final breach width is reached
Long-Term Behaviour and Environmentally Friendly Rehabilitation Technologies of Dams (LTBD 2017) DOI103217978-3-85125-564-5-007
56
Figure 9 Calculated breach flow discharge Figure 10 Breach width development
Based on the contrast table and the figures some conclusions can be drawn According to Figures 9 and
10 owing to the collapse of wave wall the overflow water head is about 15 m above the dam crest the breach
flow discharge increases immediately at the initial breaching period as well as the top and bottom breach widths
after 172 h the peak discharge occurs then the breach flow decreases and the breach width increases relatively
small until the end of breaching According to Table 3 the calculated peak breach flow is 770851 m3s which is
13 smaller than the measured data To the breach widths we can see that the breach top width and breach
bottom width is 162 and 364 larger than the measured data respectively When it comes to the failure time
the calculated data is 449 smaller than the measured one Overall the calculated peak discharge is in accordance
with the measured data in contrast the calculated breach widths are larger than measured data especially the
bottom breach width the possible reason is the drainage of reservoir sediment affects the development of breach
owing to the lacking of measured time to peak the contrast of this parameter is ignored with regard to failure
time the definitions of calculated and measured data are different the documentary record is the duration of whole
breaching process which differs to the calculated failure time From the above the numerical model can meet the
demands in calculating of Banqiao reservoir dam breaching process
5 CONCLUSION
A numerical model is proposed to calculate the Banqiao reservoir breaching process in this study
considering the erosion of different dam materials and the failure of clay core Based on the calculated results
the following conclusions can be drawn The clay core dam can be assumed as a composite dam with noncohesive
and cohesive materials a shear failure formula is adopted to calculate the time and height of failure clay core for
the dam with relatively small dam height and large reservoir storage base erosion should be considered if the
foundation is erodible Based on the contrast of calculated and measured results the proposed model can
reproduce good results and can be utilized for the breaching process of clay core dam due to overtopping failure
6 ACKNOWLEDGMENT
This writers acknowledge the support from the Natural Science Foundation of China (Grant No
51379129 51539006) and the Natural Science Foundation of Jiangsu Province (Grant No BK20161121)
0
10000
20000
30000
40000
50000
60000
70000
80000
0 1 2 3 4 5 6 7 8 9
Bre
ach
flo
w d
isch
arge (
m3s
)
Elapsed time (h)
0
100
200
300
400
500
0 1 2 3 4 5 6 7 8 9
Bre
ach w
idth
(m)
Elapsed time (h)
Breach top width
Breach bottom width
Long-Term Behaviour and Environmentally Friendly Rehabilitation Technologies of Dams (LTBD 2017) DOI103217978-3-85125-564-5-007
57
7 REFERENCES
1 Ministry of Water Resources P R China National Bureau of Statistics P R China (2013) ldquoBulletin of first
national census for waterrdquo China Waterpower Press China (in Chinese)
2 Dam Safety Management Center of the Ministry of Water Resources (2015) ldquoDam breach register book of
the national reservoirsrdquo Dam Safety Management Center of the Ministry of Water Resources China (in
Chinese)
3 Ru N and Niu Y (2001) ldquoEmbankment dam incidents and safety of large damsrdquo China Waterpower Press
China (in Chinese)
4 Chen S (2012) ldquoBreach mechanism and simulation of breach process for earth-rock damsrdquo China
Waterpower Press China (in Chinese)
5 Morris M W (2008) ldquoIMPACT Project field tests data analysisrdquo FLOODsite Rep T04-08-04 HR
Wallingford UK
6 Chen S Zhong Q and Cao W (2011) ldquoCentrifugal model test and numerical simulation of the breaching
process of clay core dams due to overtoppingrdquo Advances in Water Science 22(5) pp 674-679 (in Chinese)
7 Fread D L (1988) ldquoBREACH An erosion model for earthen dam failurerdquo National Oceanic and Atmospheric
Administration National Weather Service Silver Spring USA
8 Mohamed A A A Samuels P G Morris M W and Ghataora G S (2002) ldquoImproving the accuracy of
prediction of breach formation through embankment dams and flood embankmentsrdquo Proc Int Conf on Fluvial
Hydraulics (River Flow 2002) Louvain-la-Neuve Belgium
9 Morris M W (2011) ldquoBreaching of earth embankments and damsrdquo PhD thesis the Open University UK
10 Wu W (2013) ldquoSimplified physically based model of earthen embankment breachingrdquo Journal of Hydraulic
Engineering 139(8) pp 837-851
11 Singh V P (1996) ldquoDam breach modeling technologyrdquo Kluwer Academic Publishes Netherlands
12 Fread D L (1984) ldquoDAMBREAK The NWS dam break flood forecasting modelrdquo National Oceanic and
Atmospheric Administration National Weather Service Silver Spring USA
13 US Dept of Agriculture Natural Resources Conservation Service (USDA-NRCS) (1997) ldquoChapter 51
Earth spillway erosion modelrdquo Part 628 Dams National Engineering Handbook USA
14 Briaud J L Ting F C K Chen H C Cao Y Han S W and Kwak K W (2001) ldquoErosion function
apparatus for scour rate predictionrdquo Journal of Geotechnical and Geoenvironmental Engineering 127(2) pp
105-113
15 Hanson G J and Cook K R (2004) ldquoDetermination of material rate parameters for headcut migration of
compacted earthen materialsrdquo Proceedings of Dam Safety 2004 Association of State Dam Safety Officials
(ASDSO) Inc C D ROM USA
16 Wan C F and Fell R (2004) ldquoInvestigation of rate of erosion of soils in embankment damsrdquo Journal of
Geotechnical and Geoenvironmental Engineering 130(4) pp 373-380
17 Temple D M and Hanson G J (1994) ldquoHeadcut development in vegetated earth spillwaysrdquo Applied
Engineering in Agriculture 10(5) pp 677-682
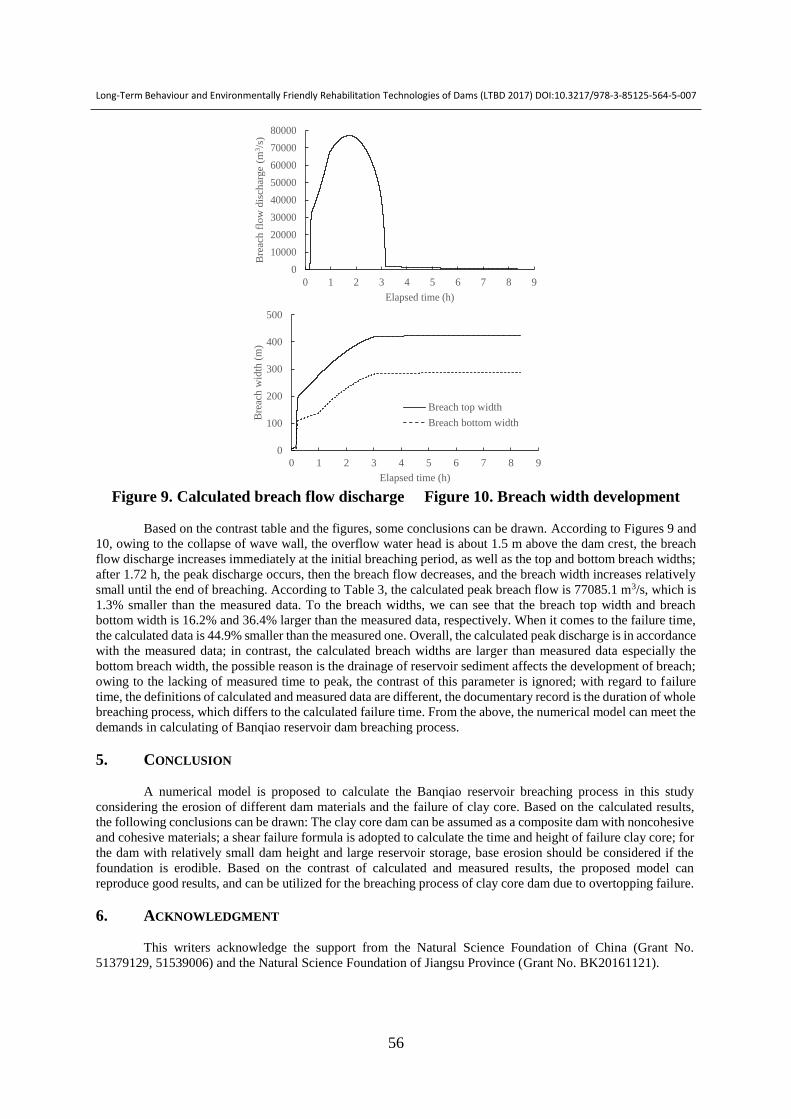
Long-Term Behaviour and Environmentally Friendly Rehabilitation Technologies of Dams (LTBD 2017) DOI103217978-3-85125-564-5-007
56
Figure 9 Calculated breach flow discharge Figure 10 Breach width development
Based on the contrast table and the figures some conclusions can be drawn According to Figures 9 and
10 owing to the collapse of wave wall the overflow water head is about 15 m above the dam crest the breach
flow discharge increases immediately at the initial breaching period as well as the top and bottom breach widths
after 172 h the peak discharge occurs then the breach flow decreases and the breach width increases relatively
small until the end of breaching According to Table 3 the calculated peak breach flow is 770851 m3s which is
13 smaller than the measured data To the breach widths we can see that the breach top width and breach
bottom width is 162 and 364 larger than the measured data respectively When it comes to the failure time
the calculated data is 449 smaller than the measured one Overall the calculated peak discharge is in accordance
with the measured data in contrast the calculated breach widths are larger than measured data especially the
bottom breach width the possible reason is the drainage of reservoir sediment affects the development of breach
owing to the lacking of measured time to peak the contrast of this parameter is ignored with regard to failure
time the definitions of calculated and measured data are different the documentary record is the duration of whole
breaching process which differs to the calculated failure time From the above the numerical model can meet the
demands in calculating of Banqiao reservoir dam breaching process
5 CONCLUSION
A numerical model is proposed to calculate the Banqiao reservoir breaching process in this study
considering the erosion of different dam materials and the failure of clay core Based on the calculated results
the following conclusions can be drawn The clay core dam can be assumed as a composite dam with noncohesive
and cohesive materials a shear failure formula is adopted to calculate the time and height of failure clay core for
the dam with relatively small dam height and large reservoir storage base erosion should be considered if the
foundation is erodible Based on the contrast of calculated and measured results the proposed model can
reproduce good results and can be utilized for the breaching process of clay core dam due to overtopping failure
6 ACKNOWLEDGMENT
This writers acknowledge the support from the Natural Science Foundation of China (Grant No
51379129 51539006) and the Natural Science Foundation of Jiangsu Province (Grant No BK20161121)
0
10000
20000
30000
40000
50000
60000
70000
80000
0 1 2 3 4 5 6 7 8 9
Bre
ach
flo
w d
isch
arge (
m3s
)
Elapsed time (h)
0
100
200
300
400
500
0 1 2 3 4 5 6 7 8 9
Bre
ach w
idth
(m)
Elapsed time (h)
Breach top width
Breach bottom width
Long-Term Behaviour and Environmentally Friendly Rehabilitation Technologies of Dams (LTBD 2017) DOI103217978-3-85125-564-5-007
57
7 REFERENCES
1 Ministry of Water Resources P R China National Bureau of Statistics P R China (2013) ldquoBulletin of first
national census for waterrdquo China Waterpower Press China (in Chinese)
2 Dam Safety Management Center of the Ministry of Water Resources (2015) ldquoDam breach register book of
the national reservoirsrdquo Dam Safety Management Center of the Ministry of Water Resources China (in
Chinese)
3 Ru N and Niu Y (2001) ldquoEmbankment dam incidents and safety of large damsrdquo China Waterpower Press
China (in Chinese)
4 Chen S (2012) ldquoBreach mechanism and simulation of breach process for earth-rock damsrdquo China
Waterpower Press China (in Chinese)
5 Morris M W (2008) ldquoIMPACT Project field tests data analysisrdquo FLOODsite Rep T04-08-04 HR
Wallingford UK
6 Chen S Zhong Q and Cao W (2011) ldquoCentrifugal model test and numerical simulation of the breaching
process of clay core dams due to overtoppingrdquo Advances in Water Science 22(5) pp 674-679 (in Chinese)
7 Fread D L (1988) ldquoBREACH An erosion model for earthen dam failurerdquo National Oceanic and Atmospheric
Administration National Weather Service Silver Spring USA
8 Mohamed A A A Samuels P G Morris M W and Ghataora G S (2002) ldquoImproving the accuracy of
prediction of breach formation through embankment dams and flood embankmentsrdquo Proc Int Conf on Fluvial
Hydraulics (River Flow 2002) Louvain-la-Neuve Belgium
9 Morris M W (2011) ldquoBreaching of earth embankments and damsrdquo PhD thesis the Open University UK
10 Wu W (2013) ldquoSimplified physically based model of earthen embankment breachingrdquo Journal of Hydraulic
Engineering 139(8) pp 837-851
11 Singh V P (1996) ldquoDam breach modeling technologyrdquo Kluwer Academic Publishes Netherlands
12 Fread D L (1984) ldquoDAMBREAK The NWS dam break flood forecasting modelrdquo National Oceanic and
Atmospheric Administration National Weather Service Silver Spring USA
13 US Dept of Agriculture Natural Resources Conservation Service (USDA-NRCS) (1997) ldquoChapter 51
Earth spillway erosion modelrdquo Part 628 Dams National Engineering Handbook USA
14 Briaud J L Ting F C K Chen H C Cao Y Han S W and Kwak K W (2001) ldquoErosion function
apparatus for scour rate predictionrdquo Journal of Geotechnical and Geoenvironmental Engineering 127(2) pp
105-113
15 Hanson G J and Cook K R (2004) ldquoDetermination of material rate parameters for headcut migration of
compacted earthen materialsrdquo Proceedings of Dam Safety 2004 Association of State Dam Safety Officials
(ASDSO) Inc C D ROM USA
16 Wan C F and Fell R (2004) ldquoInvestigation of rate of erosion of soils in embankment damsrdquo Journal of
Geotechnical and Geoenvironmental Engineering 130(4) pp 373-380
17 Temple D M and Hanson G J (1994) ldquoHeadcut development in vegetated earth spillwaysrdquo Applied
Engineering in Agriculture 10(5) pp 677-682